7,980 - business standardbsmedia.business-standard.com/_media/bs/data/market-reports/equity... ·...
TRANSCRIPT

Please refer to the disclaimer towards the end of the document.
Institutional Equities
Dai
ly M
orni
ng U
pdat
e
India Morning Roundup
NBIE Special Reports
Apar Industries - BUY- Initiating Coverage - A(bove) Par For The Course: Apar Industries (Apar) is one of the key beneficiaries of likely revival in the power transmission and distribution (T&D) capex in India. With a market leader status in two of its key product lines - conductors and transformer oil - Apar has the first-mover advantage in many specialised and highly technology-oriented products (HTLS and HeC conductors, 765KV and 1,200KV transformer oil, E-beam cables) which have strong future scalability. Further, having done a capex of Rs2.5bn over the past three years to develop such technologies and increase its manufacturing capacity, Apar is all set to reap the benefit of impending demand. We expect Apar to register a 31% earnings CAGR over FY14-FY16E driven by profitability revival following an improved product mix of high-technology products across its three business segments. We have assigned Buy rating to Apar with a target price of Rs521 based on a P/E of 11x September 2016 earnings estimate.
Valuation Of Companies In Our Coverage Universe
Corporate News
Bank credit growth falls below 10% after five years.
L&T to quit Hyderabad metro rail project if issues not resolved.
Jaypee Group plea for new tariff order to delay deal with Reliance Power.
RIL looks to reopen diesel retail outlets.
Cairn India discovers three new oil fields in Rajasthan block.
ArcelorMittal, NSSMC to invest US$46.7mn in Calvert Steel.
IISCo Burnpur to start production from new integrated 2.5mt steel plant next month.
Merck licenses experimental psoriasis drug to Sun Pharma.
Sistema Shyam in talks with developers of low-cost housings to grow data services.
Quikr raises Rs3.6bn, valued at Rs18bn.
IndiGo inks US$2.6bn pact with Chinese bank.
Global/Local Economic News
Government keen to cut diesel prices by Rs0.40-0.50/litre.
Linkage committee to meet next week to review the status of existing coal linkages.
DoT may soon order solar-powered tower deployments in North-East.
CCI rejects complaint against insurance regulator IRDA.
Fed renews zero interest rate pledge.
US consumer prices post first decline in ~18 months.
Source: Bloomberg, NSE, Nirmal Bang Institutional Equities Research
Local Indices
(Chg %) Close Daily YTD
BSE Sensex 26,631 0.5 25.8
NSE Nifty 7,976 0.5 26.5
CNX Mid-Cap 11,576 0.6 43.4
CNX Bank Nifty Index 15,839 (0.0) 39.1
World Indices
Dow Jones 17,157 0.1 3.5
S & P 500 2,002 0.1 8.3
FTSE 100 6,781 (0.2) 0.5
Nasdaq 4,562 0.2 9.2
Hang Seng 24,190 (0.8) 3.8
Shanghai Comp 2,311 0.1 9.2
Net Investment
(US$mn) 18-Sep 1M 3M
FIIs 79.6 193.8 (23.8)
MFs (14.5) 300.5 (61.7)
Volume
18-Sep US$bn Chg%
Cash (NSE + BSE) 1.2 1.7 26.9
F&O (net) 3.5 3.5 45.5
18-Sep 1 D 1 M 3M
Rs/US$ 60.9 61.1 60.8 60.0
Rs/EUR 78.9 79.0 81.3 81.5
Rs/GBP 99.4 98.8 101.7 101.9
10 yr G-Sec 8.5 8.5 8.5 8.7
Call Money 8.0 7.9 8.8 8.0
18-Sep 1 D 1 M 3 M
Gold (US$/ounce) 1,223 1,236 1,298 1,273
Brent Crude (US$/bbl) 98 99 102 112
Aluminimum (US$/mt) 1,999 2,026 2,000 1,852
Copper (US$/mt) 6,931 6,901 6,870 6,705
Nifty
Commodities & others
Forex/Money Markets
7,900
7,920
7,940
7,960
7,980
8,000
9 AM 10 AM 11 AM 12 PM 1 PM 2 PM 3 PM
18 September 2014
1

Please refer to the disclaimer towards the end of the document.
Institutional Equities
Initi
atin
g C
over
age
Reuters: APAR.BO; Bloomberg: APR IN
Apar Industries
A(bove) Par For The Course Apar Industries (Apar) is one of the key beneficiaries of likely revival in the power transmission and distribution (T&D) capex in India. With a market leader status in two of its key product lines - conductors and transformer oil - Apar has the first-mover advantage in many specialised and highly technology-oriented products (HTLS and HeC conductors, 765KV and 1,200KV transformer oil, E-beam cables) which have strong future scalability. Further, having done a capex of Rs2.5bn over the past three years to develop such technologies and increase its manufacturing capacity, Apar is all set to reap the benefit of impending demand. We expect Apar to register a 31% earnings CAGR over FY14-FY16E driven by profitability revival following an improved product mix of high-technology products across its three business segments. We have assigned Buy rating to Apar with a target price of Rs521 based on a P/E of 11x September 2016 earnings estimate. Conductor segment to post a healthy growth: Apar, the largest manufacturer and exporter of conductors in India with a 23% market share, is poised for a healthy growth driven by rising demand and increased contribution from high-technology and high-margin products. Having done a capex of Rs750mn over the past three years to augment manufacturing capacity and to develop high-efficiency conductors (manufactured by only two players in India and, hence, a high-margin product), Apar is well placed to benefit from strong order placement expected from Power Grid Corporation of India (PGCIL) in 2HFY15 amounting to 170,000MT, in addition to likely revival in T&D capex. Oil segment to scale up: Being the fourth-largest manufacturer in the world with a 45% domestic market share, the transformer oil business of Apar (50% of oil segment’s revenue) is a quasi play on improved demand for transformers in the 12th Five Year Plan period. Along with volume pick-up, profitability is likely to get a strong boost from rising contribution of 765KV transformer oil business (only two players in India including Apar have the capability to manufacture this) and rising penetration in automotive lubes segment, which enjoys the highest margin in the entire oil portfolio. Cable segment set for turnaround: The cable segment is on the verge of a turnaround after incurring operating losses over the past two years, with 5%/7% EBITDA margins likely in FY15E/FY16E, respectively, because of a change in the product mix. Apar is down-sizing its traditional HT/LT cable business, which suffers from an over-supply situation, while shifting its focus to three high-technology specialised cables - namely optic fibre cables, elastomeric cables and E-beam cables - which have limited competition and strong margins, after a Rs1.3bn capex over the past three years to set up its facility. Strong financial health to aid valuation: We expect Apar to register 9%/31% CAGR in revenue/earnings, respectively, over FY14-FY16E. Driven by improved profitability and completion of the capex programme, Apar is expected to generate healthy operating/free cash flow of Rs6bn/Rs2bn, respectively, over FY14-FY16E along with a healthy recovery in RoCE/RoE from 17.4%/13.6% in FY14 to 22.1%/18.4%, respectively, in FY16E, while also reducing its leverage from 1.6x in FY13 to 0.8x in FY16E. We have valued Apar at 11x September 2016 earnings estimate with a target price of Rs521.
BUY
Sector: Capital Goods
CMP: Rs390
Target Price: Rs521
Upside: 34%
Chirag Muchhala [email protected] +91-22-3926 8092
Key Data
Current Shares O/S (mn) 38.5
Mkt Cap (Rsbn/US$mn) 15.2/248.5
52 Wk H / L (Rs) 442/85
Daily Vol. (3M NSE Avg.) 267,552
Share holding (%) 3QFY14 4QFY14 1QFY15
Promoter 62.5 62.5 62.5
FII 5.4 5.4 4.7
DII 5.8 5.8 8.0
Corporate 16.2 16.0 15.2
General Public 10.2 10.3 9.6
One Year Indexed Stock Performance
80
120
160
200
240
280
320
360
400
440
480
520
Sep-13 Nov-13 Jan-14 Mar-14 May-14 Jul-14 Sep-14
APAR INDUSTRIES NSE CNX NIFTY INDEX
Price Performance (%)
1 M 6 M 1 Yr
Apar Industries 26.3 215.3 337.6
Nifty Index 2.2 22.5 36.2
Source: Bloomberg
Y/E March (Rsmn) FY13 FY14 FY15E FY16E FY17E
Net sales 46,507 46,329 49,520 55,035 60,455
EBITDA 3,113 2,974 2,963 3,768 4,588
Net profit 1,095 896 946 1,529 2,120
EPS (Rs) 28.5 23.3 24.6 39.7 55.1
EPS growth (%) 49.9 (18.1) 5.5 61.6 38.7
EBITDA margin (%) 6.7 6.4 6.0 6.8 7.6
PER (x) 13.7 16.7 15.9 9.8 7.1
P/BV (x) 2.4 2.2 2.0 1.7 1.4
EV/EBITDA (x) 4.6 6.9 6.5 4.9 3.8
Dividend yield (%) 1.3 1.3 1.4 1.5 1.8
RoCE (%) 18.3 17.4 17.6 22.1 25.6
RoE (%) 19.0 13.6 12.9 18.4 21.6
Source: Company, Nirmal Bang Institutional Equities Research
17 September 2014
2
Institutional Equities
Apar Industries
Financial overview
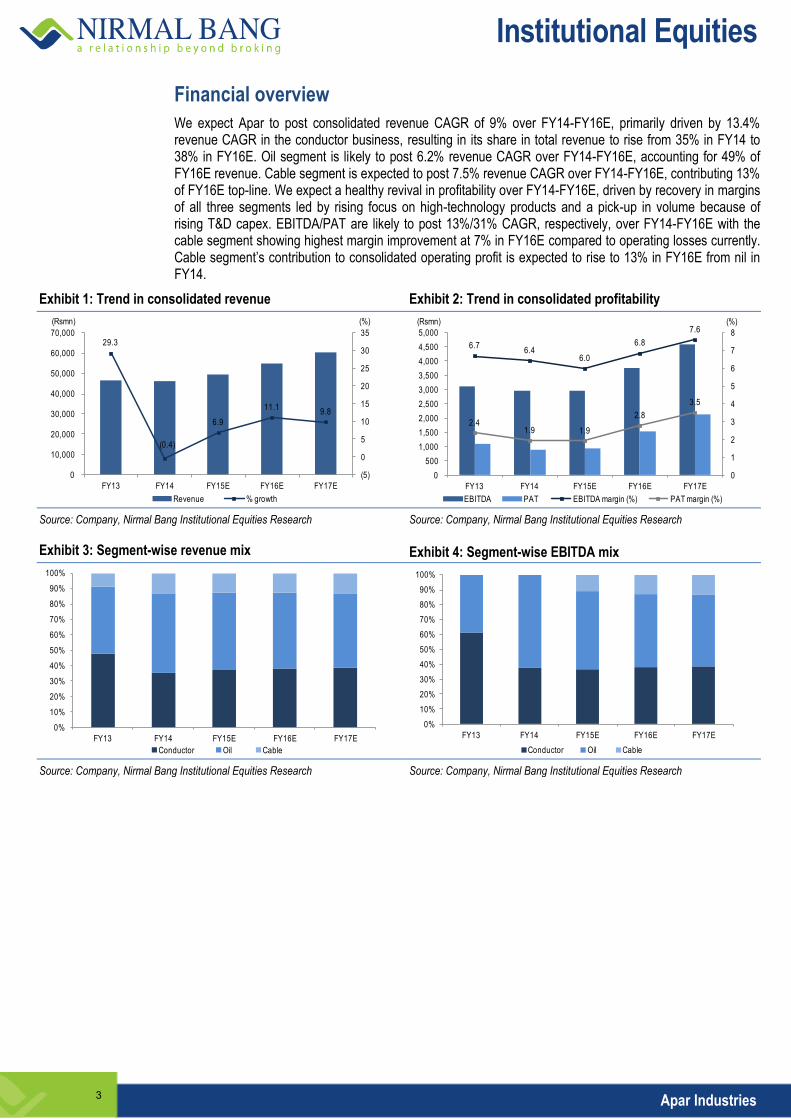
We expect Apar to post consolidated revenue CAGR of 9% over FY14-FY16E, primarily driven by 13.4% revenue CAGR in the conductor business, resulting in its share in total revenue to rise from 35% in FY14 to 38% in FY16E. Oil segment is likely to post 6.2% revenue CAGR over FY14-FY16E, accounting for 49% of FY16E revenue. Cable segment is expected to post 7.5% revenue CAGR over FY14-FY16E, contributing 13% of FY16E top-line. We expect a healthy revival in profitability over FY14-FY16E, driven by recovery in margins of all three segments led by rising focus on high-technology products and a pick-up in volume because of rising T&D capex. EBITDA/PAT are likely to post 13%/31% CAGR, respectively, over FY14-FY16E with the cable segment showing highest margin improvement at 7% in FY16E compared to operating losses currently. Cable segment’s contribution to consolidated operating profit is expected to rise to 13% in FY16E from nil in FY14.
Exhibit 1: Trend in consolidated revenue Exhibit 2: Trend in consolidated profitability
29.3
(0.4)
6.9
11.19.8
(5)
0
5
10
15
20
25
30
35
0
10,000
20,000
30,000
40,000
50,000
60,000
70,000
FY13 FY14 FY15E FY16E FY17E
Revenue % growth
(Rsmn) (%)
6.76.4
6.0
6.8
7.6
2.41.9 1.9
2.8
3.5
0
1
2
3
4
5
6
7
8
0
500
1,000
1,500
2,000
2,500
3,000
3,500
4,000
4,500
5,000
FY13 FY14 FY15E FY16E FY17E
EBITDA PAT EBITDA margin (%) PAT margin (%)
(Rsmn) (%)
Source: Company, Nirmal Bang Institutional Equities Research Source: Company, Nirmal Bang Institutional Equities Research
Exhibit 3: Segment-wise revenue mix Exhibit 4: Segment-wise EBITDA mix
0%
10%
20%
30%
40%
50%
60%
70%
80%
90%
100%
FY13 FY14 FY15E FY16E FY17E
Conductor Oil Cable
0%
10%
20%
30%
40%
50%
60%
70%
80%
90%
100%
FY13 FY14 FY15E FY16E FY17E
Conductor Oil Cable Source: Company, Nirmal Bang Institutional Equities Research Source: Company, Nirmal Bang Institutional Equities Research
3

Institutional Equities
Apar Industries
Robust operating/free cash flow generation over FY14-FY16E
After reporting negative operating cash flow in FY14 because of a rise in working capital requirement, Apar is likely to return back to posting strong operating cash flow from FY15 onwards driven by improved profitability, despite assuming an elevated working capital cycle. We expect Apar to register operating cash flow of Rs6.1bn over FY14-FY16E. Having completed its Rs2bn capex plan over the past two years, Apar will only need maintenance capex of Rs545mn over FY14-FY16E, leading to robust free cash flow. Compared to a negative cash flow of Rs7.1bn of FY14, we expect Apar to generate positive free cash flow of Rs2bn over FY14-FY16E. Through healthy cash flow generation, we expect Apar to repay Rs500mn of debt each in FY15E and FY16E, thereby reducing its debt-equity ratio to 0.8x in FY16E from 1.6x/1.1x in FY13/FY14, respectively.
Exhibit 5: Operating/free cash flow trend
(8,000)
(6,000)
(4,000)
(2,000)
0
2,000
4,000
6,000
8,000
FY13 FY14 FY15E FY16E FY17E
Operating cash flow Free cash flow
(Rsmn)
Source: Company, Nirmal Bang Institutional Equities Research
Exhibit 6: Debt-equity profile
1.6
1.1
1.0
0.8
0.6
0.0
0.2
0.4
0.6
0.8
1.0
1.2
1.4
1.6
1.8
0
2,000
4,000
6,000
8,000
10,000
12,000
FY13 FY14 FY15E FY16E FY17E
Debt Networth Debt:equity ratio (RHS)
(x)(Rsmn)
Source: Company, Nirmal Bang Institutional Equities Research
Healthy recovery in return ratios
Pressure on profitability in the past two years, primarily because of operating losses in the cable segment, increased short-term borrowing and heightened capex of Rs2bn led to a sharp decline in return ratios over FY12-FY14. We expect the return ratios to gradually rise from here on, aided by recovery in operating margin across all three business segments, completion of capex programme (with only maintenance capex required henceforth) and repayment of short-term loans worth Rs1bn over FY14-FY16E. We expect RoCE to rise from 17.4% in FY14 to 22.1%/25.6% in FY16E/FY17E, respectively, while RoE is likely to increase from 13.6% in FY14 to 18.4%/21.6% in FY16E/FY17E, respectively.
4

Institutional Equities
Apar Industries
Exhibit 7: Trend in return ratios
18.3
17.4 17.6
22.1
25.6
19.0
13.6 12.9
18.4
21.6
0
5
10
15
20
25
30
FY13 FY14 FY15E FY16E FY17E
RoCE RoE
(%)
Source: Company, Nirmal Bang Institutional Equities Research
Outlook and valuation
Apar stock trades at an average P/E of 8.7x one-year forward earnings over the past 10 years (see Exhibit 8). The company offers strong management pedigree, highly technology-oriented focus, market leader status in key products like conductors and transformer oils, and a first-mover advantage in many products which offer strong future scalability. Further, with a likely 31% earnings CAGR over FY14-FY16E along with strong operating/free cash flow generation, healthy revival in return ratios and declining leverage, Apar exhibits a sound financial position. Future value unlocking trigger also exists via demerger of business segments. We have valued the stock at a P/E of 11x September 2016 earnings estimate (lower than +1 standard deviation of 12x one-year forward P/E) to arrive at a target price of Rs521.
Exhibit 8: One year forward P/E chart
0
5
10
15
20
25
Ap
r-0
5
Au
g-0
5
Jan
-06
Jun
-06
No
v-0
6
Ap
r-0
7
Se
p-0
7
Fe
b-0
8
Jul-0
8
De
c-0
8
Ma
y-0
9
Oct
-09
Ma
r-1
0
Au
g-1
0
De
c-1
0
Ma
y-1
1
Oct
-11
Ma
r-1
2
Au
g-1
2
Jan
-13
Jun
-13
No
v-1
3
Ap
r-1
4
Se
p-1
4
P/E Average P/E Std Dev +1 Std Dev +2 Std Dev -1
(x)
0
100
200
300
400
500
600
700
Ap
r-0
5
Au
g-0
5
Ja
n-0
6
Ju
n-0
6
No
v-0
6
Ap
r-0
7
Se
p-0
7
Fe
b-0
8
Ju
l-0
8
De
c-0
8
Ma
y-0
9
Oct-
09
Ma
r-1
0
Au
g-1
0
De
c-1
0
Ma
y-1
1
Oct
-11
Ma
r-1
2
Au
g-1
2
Ja
n-1
3
Ju
n-1
3
No
v-1
3
Ap
r-1
4
Se
p-1
4
Stock price 3x 7x 11x 15x 19x
(Rs)
Source: BSE, Nirmal Bang Institutional Equities Research
5

Institutional Equities
Apar Industries
Investment Arguments
Conductor segment – demand revival and high-technology products to drive margins
Apar is the third largest conductor manufacturer globally with a fully vertically integrated business model and as a result, it is one of the world’s low-cost producer. Starting in 1958 as a basic conventional conductor manufacturer, Apar transformed itself into a technology-oriented high-efficiency conductor maker with a complete product range up to 1,200KV and is the first company to pass technical tender screening for high temperature low sag (HTLS) conductors and is among the only two vendors in the domestic market for HTLS technology. Apar has a 23% market share in the domestic conductor segment with a total installed capacity of 144,000MT per annum, while it produced conductors worth 106,500MT in FY14, thereby becoming the largest aluminum conductor maker in India surpassing Sterlite Technologies, which manufactured 96,000MT in FY14. Apar is also the largest exporter of aluminum conductors from India, supplying to 25 global turnkey operators. Export revenue posted a 27% CAGR over FY11-14, while overseas markets account for more than 50% of the conductor order book currently.
Exhibit 9: Conductor segment’s volume growth Exhibit 10: Conductor segment’s value growth
0
20
40
60
80
100
120
140
160
FY10 FY11 FY12 FY13 FY14
(MT)
0
5,000
10,000
15,000
20,000
25,000
FY10 FY11 FY12 FY13 FY14
(Rsmn)
Source: Company, Nirmal Bang Institutional Equities Research Source: Company, Nirmal Bang Institutional Equities Research
Rising opportunities in power T&D space
India has under-invested in its T&D network, resulting in high T&D losses and insufficient power evacuation infrastructure. To strengthen the T&D network, the country has lined up huge capex over the 12th Five Year Plan period (FY12-FY17) at Rs2.4trn, which will be done by PGCIL (Rs1.2trn), state electricity boards or SEBs (Rs1trn) and the private sector (Rs200bn). Further, large investments are planned in high-capacity transmission lines of 400KV and 765KV, which will result in good demand for high-efficiency conductors, Apar’s forte. Conductor demand is also likely to get a significant boost from upcoming PGCIL tenders in 3QFY15 amounting to 100,000MT and in 4QFY15 amounting to 70,000MT, after a tepid order placement activity last year. While PGCIL is the largest driver of T&D capex in India, Apar has gradually cut its dependence on PGCIL, with PGCIL accounting for only 17% of FY14 revenue versus 31% in FY10. Further, global electricity consumption is growing 2.4% and may touch 29,000TWh by 2030. India currently contributes only 1% to global exports of electrical equipment, leaving high scope for Apar to shore up its export business.
Exhibit 11: Transmission line capacity addition
0
5,000
10,000
15,000
20,000
25,000
30,000
35,000
40,000
765KV 400KV 220KV HVDC
11th Five-Year Plan addition 12th Five-Year Plan target
(ckm)
Source: Company, Nirmal Bang Institutional Equities Research
6

Institutional Equities
Apar Industries
Exhibit 12: Break-up of 12th Plan transmission capacity target Exhibit 13: Reducing dependence on PGCIL
765KV25%
400KV35%
220KV33%
HVDC7%
31.3
18.221.0
38.3
16.9
0
5
10
15
20
25
30
35
40
45
0
2,000
4,000
6,000
8,000
10,000
12,000
14,000
16,000
FY10 FY11 FY12 FY13 FY14
PGCIL revenue Non PGCIL revenue PGCIL revenue as a % of total (RHS)
(Rsmn) (%)
Source: Company, Nirmal Bang Institutional Equities Research Source: Company, Nirmal Bang Institutional Equities Research
High-technology conductors to aid margins
Apar primarily operates in power conductors - deriving 90% of its revenue – with better margins compared to distribution conductors which account for 10% of its revenue. Further, the focus of Apar has been on differentiated and technologically advanced products. It is a pioneer in alloy conductors (contains 100% aluminum) and HeC (High-efficiency Conductors) which are manufactured by only two players in India - Apar and Sterlite Technologies. Apar has done a capex of Rs750mn over the past three years in its conductor segment aimed at (a) Setting up a 36,000MT Athola plant to augment capacity, and (b) Developing the technology for manufacture of high temperature, high efficiency conductors at Silvasa plant. Apar expects the revenue contribution from HeC to grow from 4% in FY14 to 10% in three years, providing a healthy boost to margins. The demand for HeC has already been growing and is likely to continue to grow at a robust pace because of strong benefits of HeC conductor technology, which reduces T&D losses by 30%-40%, transmits 1.5x to 2x power than conventional conductors and requires lower right of way clearance. HeC conductor is a good solution for high T&D losses faced by many SEBs. Gujarat SEB has been using HeC in most of its new lines as well as in replacement orders. Other SEBs are also expected to follow suit. Apar has the first-mover advantage in HeC and its technology has been approved by PGCIL. The trend of HeC and HTLS conductor usage among private players in India, namely Reliance Power, Tata Power Company and Torrent Power has also been on the rise, while international demand for HeC is also rising because of increased transmission and load-carrying capacity along with lower T&D losses.
Rising export market penetration
Apar has achieved good success in export markets and has achieved a revenue CAGR of 27% over FY11-FY14, which has helped it to counter the relatively subdued domestic market. Apar has become the largest exporter of aluminum conductors from India, supplying to 25 global turnkey operators. The key international geographies for Apar include Africa, Latin America, Middle East, South East Asia and CIS countries. The margins in export markets are stable and on par with the domestic market. While exports accounted for 28% of FY14 conductor revenue, they accounted for more than 50% of the conductor order book because of large contracts. Consequently, exports are likely to account for 50% of FY15E conductor revenue. However, on a steady-state basis, the export market:domestic market ratio is likely to remain at 25:75 because of a likely pick up in domestic demand from FY15.
7
Institutional Equities
Apar Industries
Exhibit 14: Trend in conductor export revenue
0
1,000
2,000
3,000
4,000
5,000
6,000
7,000
FY11 FY12 FY13 FY14
(Rsmn)
Source: company, Nirmal Bang Institutional Equities Research
Exhibit 15: Conductor business - peer comparison
Particulars Apar Industries Sterlite Technologies
Revenue (Rsmn) 16,245 15,870
Volume 106,531MT 94,587MT
Market share (%) 23% 21%
Exports (Rsmn) 4,490 4,030
Exporting countries 43 75
Order book (Rsmn) 19,520 22,000
Four-year revenue CAGR (%) 13% 1%
EBITDA/MT (Rs) 11,640 8,940
RoCE (%) 38% 16%
Source: Company, Nirmal Bang Institutional Equities Research (FY14 data)
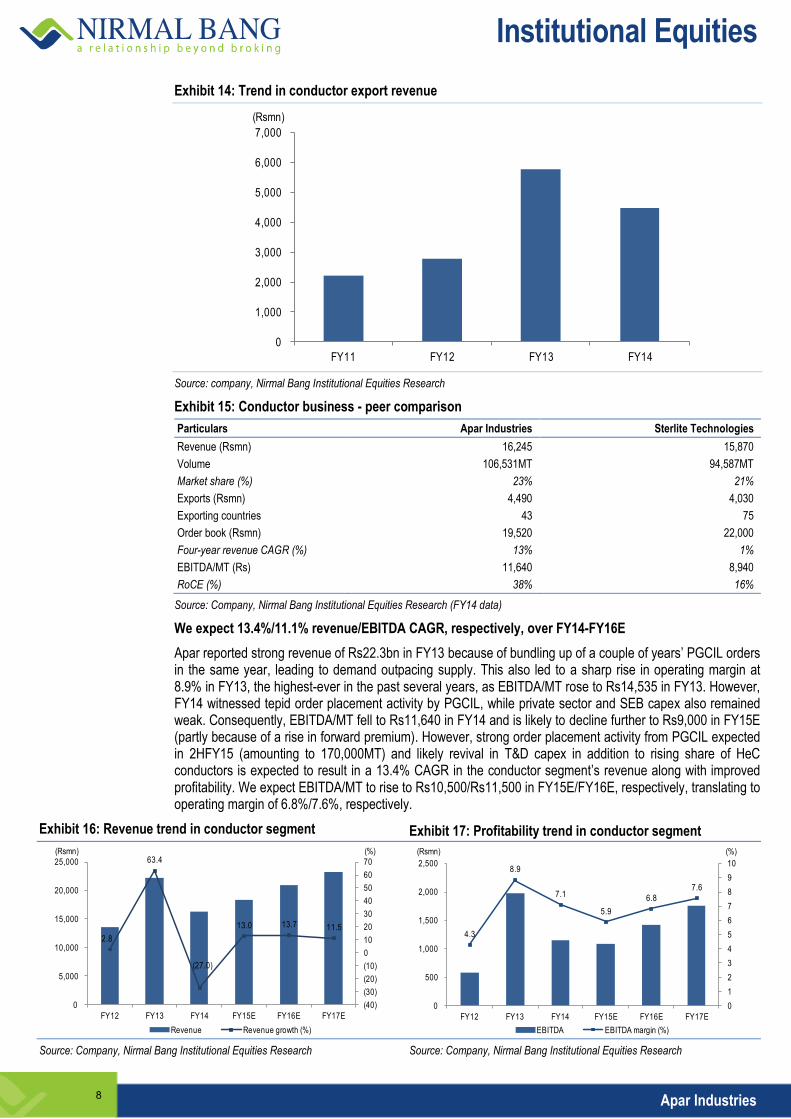
We expect 13.4%/11.1% revenue/EBITDA CAGR, respectively, over FY14-FY16E
Apar reported strong revenue of Rs22.3bn in FY13 because of bundling up of a couple of years’ PGCIL orders in the same year, leading to demand outpacing supply. This also led to a sharp rise in operating margin at 8.9% in FY13, the highest-ever in the past several years, as EBITDA/MT rose to Rs14,535 in FY13. However, FY14 witnessed tepid order placement activity by PGCIL, while private sector and SEB capex also remained weak. Consequently, EBITDA/MT fell to Rs11,640 in FY14 and is likely to decline further to Rs9,000 in FY15E (partly because of a rise in forward premium). However, strong order placement activity from PGCIL expected in 2HFY15 (amounting to 170,000MT) and likely revival in T&D capex in addition to rising share of HeC conductors is expected to result in a 13.4% CAGR in the conductor segment’s revenue along with improved profitability. We expect EBITDA/MT to rise to Rs10,500/Rs11,500 in FY15E/FY16E, respectively, translating to operating margin of 6.8%/7.6%, respectively.
Exhibit 16: Revenue trend in conductor segment Exhibit 17: Profitability trend in conductor segment
2.8
63.4
(27.0)
13.0 13.7 11.5
(40)
(30)
(20)
(10)
0
10
20
30
40
50
60
70
0
5,000
10,000
15,000
20,000
25,000
FY12 FY13 FY14 FY15E FY16E FY17E
Revenue Revenue growth (%)
(Rsmn) (%)
4.3
8.9
7.1
5.9
6.8
7.6
0
1
2
3
4
5
6
7
8
9
10
0
500
1,000
1,500
2,000
2,500
FY12 FY13 FY14 FY15E FY16E FY17E
EBITDA EBITDA margin (%)
(%)(Rsmn)
Source: Company, Nirmal Bang Institutional Equities Research Source: Company, Nirmal Bang Institutional Equities Research
8

Institutional Equities
Apar Industries
Transformer and specialty oils - 765KV transformers and automotive lubes to drive margins
Apar has a strong portfolio of over 400 types of various oils across categories like transformer oil (50% of oil segment’s revenue) and other specialty oils like white oil, industrial oil, auto lube and rubber processing oil. It is a pioneer in the manufacture of transformer oil since 1969 and is a preferred supplier for over 80% of the customer base with ABB, Crompton Greaves, Bharat Heavy Electricals and Alstom being its key customers. It is the fourth-largest transformer oil manufacturer in the world and has a 45% domestic market share. Collectively, the transformer and speciality oils segment has total manufacturing capacity of 4,42,000 KL as all oils are fungible in manufacturing. Apar has also successfully expanded to the automotive lube segment, through a licensing agreement with ENI, Italy, and made foray in the huge Rs180bn retail automotive lubricants market. As much as 36% of transformer and specialty oil revenue in FY14 came from exports, thereby posting a 27% CAGR over FY11-FY14.
Exhibit 18: Oil segment’s volume growth Exhibit 19: Oil segment’s value growth
0
50
100
150
200
250
300
350
FY10 FY11 FY12 FY13 FY14
('000 KL)
0
500
1,000
1,500
2,000
2,500
3,000
FY10 FY11 FY12 FY13 FY14
(Rsmn)
Source: Company, Nirmal Bang Institutional Equities Research Source: Company, Nirmal Bang Institutional Equities Research
Exhibit 20: Trend in oil segment’s export revenue
0
1,000
2,000
3,000
4,000
5,000
6,000
7,000
8,000
9,000
10,000
FY10 FY11 FY12 FY13 FY14
(Rsmn)
Source: Company, Nirmal Bang Institutional Equities Research
Transformer oil – A quasi play on transformer demand
Transformer oil is required to provide insulation and cooling properties to a transformer and accounts for a 5% to 7% of the total costs of a transformer. While transformer oil lasts for 15 years, every year oil top-up of 5% is required for maintenance of the transformer. New transformers account for 85% of total transformer oil sales while top-up oil for maintenance contributes the balance 15%, a relatively lower quantum compared to developed countries as spending on regular maintenance of transformers is insufficient in India. A higher quantum of Apar’s revenue comes from power transformers (60%) compared to distribution transformers (40%), as a distribution transformer requires low grade oil (less than 22KV) which makes it a relatively low- margin business compared to power transformer oil, even though a power transformer needs 0.35 KL to 0.40 KL oil per MVA compared to 0.5 KL to 0.6 KL per MVA required by a distribution transformer. Besides Apar (45% market share), the key players in the transformer oil segment include Savita Oil Technologies (30% market share), Raj Petro and Columbia Petro.
9

Institutional Equities
Apar Industries
Exhibit 21: Sub-station capacity addition Exhibit 22: Break-up of 12th Plan sub-station addition target
0
20,000
40,000
60,000
80,000
100,000
120,000
140,000
160,000
765KV 400KV 220KV
11th FYP addition 12th FYP target
(ckm)
765KV55%
400KV17%
220KV28%
Source: Company, Nirmal Bang Institutional Equities Research Source: Company, Nirmal Bang Institutional Equities Research
Higher grade oil to drive profitability
With rising high output capacity power plants in India at a single location, the demand for 765KV transformers is growing exponentially. As much as 55% of the sub-stations under the 12th Five Year Plan will be of 765KV, up from 16% in the 11th Five Year Plan period. Also, 765KV and 400KV collectively will constitute more than 72% of new sub-stations under the 12th Plan. Apar is the first Indian company to introduce 765KV transformer oil in India, having received approval from PGCIL for its Rabale and Silvassa manufacturing plants. The margins in 765KV transformer oil is also much better, as only two companies have the capability to manufacture it - Apar and Savita Oil Technologies (which received approval in March 2013 - two years after Apar). Further, Apar is the only player in India which is currently undergoing testing for 1,200KV transformer oil. (1,200KV transformers are under testing by PGCIL and its commercial order placement is yet to begin).
Exhibit 23: Oil portfolio of Apar
Type of oil Share in FY14 revenue End-user industry
Transformer oil 50% Transformer - for insulation and cooling
White oil 22% FMCG and Pharmaceuticals
Auto lube 11% Automobiles
Industrial oil 10% Various manufacturing industries
Rubber processing oil 7% Tyres and polymer
Source: Company, Nirmal Bang Institutional Equities Research
Diversification in automotive lubricants – a significant opportunity
Apar has diversified into automotive lubricants business via a technology and manufacturing licensing agreement with ENI Spa, an Italian industrial giant, the world’s eighth largest automotive lubricant manufacturer. As automotive lube needs the same base oil that is required for transformer oil, it gives Apar a better control over raw materials and hence makes a commercial sense to enter this business. Further, it opens up almost 60% of total 2mn tones lube business with a better margin profile. Apar sells automotive lubes under its premium brand ENI, focusing on the retail market, while its own brand PowerOil is a value-for-money proposition targeted towards the wholesale market and fleet operators. The domestic automotive lube market is a Rs180bn opportunity where Apar can grow exponentially from its current market share of 1%. It has expanded its sales network to 450 distributors and 15,000 stockists across India. The market penetration focus remains on Tier 2 and Tier 3 cities, while the southern region accounts for over half of this segment’s revenue. Apar has tied up with10 OEMs (original equipment manufacturers), the prominent ones being ITL, Escorts and Greaves. Automotive lube has the highest margin among the entire specialty oil product portfolio.
10

Institutional Equities
Apar Industries
Exhibit 24: Trend in automotive lube revenue
0
500
1,000
1,500
2,000
2,500
3,000
FY09 FY10 FY11 FY12 FY13 FY14
(Rsmn)
Source: Company, Nirmal Bang Institutional Equities Research
Exhibit 25: Transformer and specialty oil business - peer comparison
Particulars Apar Industries Savita Oil Technologies
Revenue (Rsmn) 24,029 20,480
Volume 327,393 KL 272,805 KL
Market share (in transformer oil) (%) 45% 30%
Exports (Rsmn) 8,660 NA
Exporting countries 100 75
Manufacturing started in (year) 1969 1961
Three-year revenue CAGR 16% 10%
EBIT margin (%) 8% 7%
RoCE (%) 48% 28%
Source: Company, Nirmal Bang Institutional Equities Research (FY14 data)
We expect 6.2%/11.4% revenue/EBITDA CAGR, respectively, over FY14-FY16E
The oil segment reported a 5.5% volume CAGR over the past five years. While FY15E is likely to continue registering a modest 5% rise in volume, we expect it to pick up from FY16 onwards led by revival in power T&D capex which could lead to improved demand from SEBs as well as from the replacement market. We have factored in a 8% volume growth in FY16E, translating to a 6.2% revenue CAGR over FY14-FY16E. Profitability in FY15E is likely to remain flat with EBITDA/KL of Rs4,500, translating into a 6.3% margin. However, we expect a gradual improvement from FY16 onwards, driven by rising contribution of high-margin 765KV transformer oil, improved traction in automotive lubes and better volume growth. We have estimated EBITDA/KL of Rs4,950 in FY16E, leading to an operating margin of 6.8%, a 50bps YoY rise.
Exhibit 26: Revenue trend in oil segment Exhibit 27: Profitability trend in oil segment
27.1
4.1
17.8
3.0
9.58.0
0
5
10
15
20
25
30
0
5,000
10,000
15,000
20,000
25,000
30,000
35,000
FY12 FY13 FY14 FY15E FY16E FY17E
Revenue Revenue growth (%)
(Rsmn) (%)
5.8
4.8
6.2 6.3
6.8
7.5
0.0
1.0
2.0
3.0
4.0
5.0
6.0
7.0
8.0
0
500
1,000
1,500
2,000
2,500
FY12 FY13 FY14 FY15E FY16E FY17E
EBITDA EBITDA margin (%)
(%)(Rsmn)
Source: Company, Nirmal Bang Institutional Equities Research Source: Company, Nirmal Bang Institutional Equities Research
11

Institutional Equities
Apar Industries
Cables segment in turnaround mode
Apar entered the cable business through the acquisition of Uniflex Cables in 2008 as a means of forward integration. While Apar has managed to report healthy revenue CAGR of 44% - from Rs1.3bn in FY09 to Rs6bn in FY14 - the subsequent industrial slowdown post Uniflex acquisition hit profitability as the cable industry suffered from an over-supply situation. The management has taken various steps over the past three years to turn around the cable segment, including foray into high-technology specialised cables like optic fibre cables (OFC), elastomeric cables and E-beam technology cables apart from venturing into the export markets where the margins are better for conventional HT/LT cables. Exports accounted for 40% of FY14 revenue.
Exhibit 28: Cable segment’s revenue profile Exhibit 29: Cable segment’s exports
0
1,000
2,000
3,000
4,000
5,000
6,000
7,000
FY09 FY10 FY11 FY12 FY13 FY14
(Rsmn)
21.9
28.926.8
14.9
40.2
0
5
10
15
20
25
30
35
40
45
0
500
1,000
1,500
2,000
2,500
3,000
FY10 FY11 FY12 FY13 FY14
Exports Exports as a % of total revenue (RHS)
(Rsmn) (%)
Source: Company, Nirmal Bang Institutional Equities Research Source: Company, Nirmal Bang Institutional Equities Research
Foray into OFC and elastomeric cables
Apar has a presence in cables up to 33KV, which has turned into a highly competitive market over past few years because of an over-supply situation in the industry with more than 30 players in the traditional HT/LT cables category leading to most of the players, including Apar, to incur losses. HT/LT cable segment posted revenue of Rs4.3bn in FY14 out of the total cable segment top-line of Rs6bn, thereby accounting for 72% of total revenue. Consequently, Apar decided to diversify its offerings and enter into high-technology specialty cables instead of EHV cables of 220KV/400KV, which many players in the industry were entering. The management identified three key specialised cables viz. OFC, elastomeric and E-beam which are technology-intensive future growth drivers, where competition would remain limited. Consequently, it went for a capex of Rs1.3bn over the past three years, half of the company’s total capex, to set up Khatalwad cable plant to double OFC cable capacity, shift elastomeric cable manufacturing facility from Umbergaon and set up two E-beam accelerators.
With the completion of capex, Apar can meet the rising demand for all three specialised cables. OFC is a telecommunications cable used for setting up of the national optic fibre network (NOFN) and the Bharat Broadband project. Apar has already received a Rs1bn order for the same, which will be booked over FY15 and FY16. Apart from the above two government projects, the key private customers for OFC are Reliance Communications, Reliance Jio, Hathway and Sify. Currently, there are five-six players in India having OFC manufacturing capability, including Aksh Optifibre and Sterlite Technologies. Strong growth in OFC is expected because of the e-governance initiative of the government to connect all villages through the internet. Apar also forayed into elastomeric cables, which are power cables made of rubber, thereby offering a flexible physical property. Its application is primarily in sectors such as railways, defence, and wind mill/solar energy generation. Being technology-intensive, the manufacturers are limited, thereby resulting in high profitability.
E-beam technology can be a game changer
Apar has set up a state-of-the-art E-beam irradiation facility at Khatalwad with two accelerators (of 1.5 MeV and 3 MeV capacity) to cater to a wide range of elastomeric cables and various other products. E-beam cross-linking protects cables from short circuit and high temperature, prevents fire and improves their physical properties like tensile strength, stress resistance and abrasion/thermal resistance. These cables are mainly used in railways, marine sector, defence sector, ship-building and solar energy generation. E-beam cables are 1.75x times costlier than elastomeric cables. Apar is the fourth company in India to introduce E-beam cables and has the highest voltage capability of 3 MeV, compared to the second-highest prevailing capability of 2 MeV. Apar is expected to witness huge demand for its E-beam cables and irradiation services, currently being met by imports. While there are more than 1,800 accelerators all over the world, with 650 in the US and
12

Institutional Equities
Apar Industries
240 in China, India has only 5 including the two facilities of Apar. Apar has already executed its first major commercial E-beam cable order worth Rs550mn from the Nuclear Power Corporation of India. Apar is also a level-one supplier to Indian Railways for E-beam cables where it can bid for 15% of total tenders and is on course to become a level-2 supplier. Other applications of irradiation service are in making polymer materials, automotive components, diamond processing and medical sterilisation.
Better product mix to aid profitability turnaround
While the margin in conventional HT/LT cables (72% of cable segment revenue in FY14) remains flat-to-negative, the margins in other three specialised cable remains robust. Apar aims to reduce the order intake of HT/LT cables because the orders for three specialised cables are rising. With a change in the product mix, operating margin is likely to rebound from FY15 itself as HT/LT cables’ revenue is poised to fall to Rs3.3bn, a 24% YoY drop, while the three specialised cables’ revenue is likely to collectively rise 71% YoY at Rs3bn.
We expect a 7.5% revenue CAGR with a sharp improvement in margins over FY14-FY16E
The focus of the management is on downsizing the traditional HT/LT cable business and scaling up of the three specialised cable business. Consequently, the revenue growth in the cable segment is likely to remain soft at 5%/10% in FY15E/FY16E, respectively. However, a change in the product mix, with the three specialised cables having strong margins replacing the flat-to-negative business of HT/LT cables is expected to propel the operating margin to touch 5%/7% in FY15E/FY16E, respectively, compared to losses at the operating level reported over the past two years.
Exhibit 30: Revenue trend in cable segment Exhibit 31: Profitability trend in cable segment
12.5
18.0
43.7
5.0
10.012.0
0
5
10
15
20
25
30
35
40
45
50
0
1,000
2,000
3,000
4,000
5,000
6,000
7,000
8,000
9,000
FY12 FY13 FY14 FY15E FY16E FY17E
Revenue Revenue growth (%)
(%)(Rsmn)
0.7
(0.2)0.1
5.0
7.0
8.0
(1)
0
1
2
3
4
5
6
7
8
9
(100)
0
100
200
300
400
500
600
700
FY12 FY13 FY14 FY15E FY16E FY17E
EBITDA EBITDA margin (%)
(%)(Rsmn)
Source: Company, Nirmal Bang Institutional Equities Research Source: Company, Nirmal Bang Institutional Equities Research
Key risks
Lack of revival in power T&D capex can affect revenue traction.
Any unforeseen rise in competitive intensity, especially in high-technology products, can hurt margins.
Any sharp rise in commodity prices - if cannot be passed on to end-customers - will hurt margins.
High volatility in foreign exchange rates and base oil rates - if cannot be passed on to end-customers - can affect margins.
Exhibit 32: Key management personnel
Source: Company
13

Institutional Equities
Apar Industries
Financials (consolidated)
Exhibit 33: Income statement
Y/E March (Rsmn) FY13 FY14 FY15E FY16E FY17E
Net sales 46,507 46,329 49,520 55,035 60,455
% growth 29.3 (0.4) 6.9 11.1 9.8
Raw material costs 36,555 36,755 39,121 43,202 47,155
Staff costs 573 668 782 897 998
Other overheads 6,267 5,933 6,654 7,168 7,715
Total expenditure 43,394 43,355 46,558 51,267 55,868
EBITDA 3,113 2,974 2,963 3,768 4,588
% growth 44.6 (4.4) (0.4) 27.2 21.8
EBITDA margin (%) 6.7 6.4 6.0 6.8 7.6
Other income 23 45 36 32 29
Interest costs 1,346 1,455 1,280 1,195 1,110
Depreciation 240 270 306 323 342
Profit before tax 1,549 1,294 1,412 2,282 3,165
Tax 402 386 466 753 1,044
PAT 1,148 908 946 1,529 2,120
Minority interest 7 3 - - -
Exceptional items (46) (9) - - -
Net profit 1,095 896 946 1,529 2,120
% growth 49.9 (18.1) 5.5 61.6 38.7
Net profit margin (%) 2.4 1.9 1.9 2.8 3.5
EPS (Rs) 28.5 23.3 24.6 39.7 55.1
% growth 49.9 (18.1) 5.5 61.6 38.7
Source: Company, Nirmal Bang Institutional Equities Research
Exhibit 35: Balance sheet
Y/E March (Rsmn) FY13 FY14 FY15E FY16E FY17E
Share capital 385 385 385 385 385
Reserves 5,882 6,578 7,276 8,535 10,340
Net worth 6,266 6,962 7,661 8,919 10,725
Minority interest 18 18 18 18 18
Short-term loans 9,403 7,080 6,580 6,080 5,580
Long-term loans 329 701 701 701 701
Total loans 9,733 7,781 7,281 6,781 6,281
Deferred tax liability (net) 103 225 225 225 225
Liabilities 16,120 14,986 15,185 15,943 17,249
Gross block 4,358 5,412 5,713 6,038 6,388
Depreciation 1,932 2,032 2,338 2,661 3,002
Net block 2,426 3,380 3,375 3,377 3,385
Capital work-in-progress 454 181 100 100 100
Goodwill 207 207 207 207 207
Investments 796 15 15 15 15
Inventories 7,515 10,170 10,504 11,172 12,024
Debtors 8,138 11,036 11,817 12,604 13,606
Cash 10,549 2,306 3,035 3,319 3,992
Loans and advances 1,835 2,202 2,492 2,718 3,003
Other current assets 665 484 575 627 693
Total current assets 28,702 26,197 28,424 30,441 33,317
Creditors 14,841 13,673 15,071 16,126 17,453
Other current liabilities & provisions 1,624 1,321 1,864 2,069 2,322
Total current liabilities 16,465 14,994 16,935 18,196 19,775
Net current assets 12,238 11,204 11,488 12,245 13,542
Total assets 16,120 14,986 15,185 15,943 17,249
Source: Company, Nirmal Bang Institutional Equities Research
Exhibit 34: Cash flow
Y/E March (Rsmn) FY13 FY14 FY15E FY16E FY17E
EBIT 2,872 2,704 2,657 3,445 4,246
(Inc.)/dec. in working capital 3,138 (7,209) 445 (473) (624)
Cash flow from operations 6,011 (4,505) 3,101 2,972 3,622
Other income 23 45 36 32 29
Depreciation 240 270 306 323 342
Interest paid (-) (1,346) (1,455) (1,280) (1,195) (1,110)
Tax paid (-) (430) (265) (466) (753) (1,044)
Dividends paid (-) (236) (236) (248) (270) (315)
Minority interest (-) (7) (3) - - -
Net cash from operations 4,255 (6,149) 1,449 1,109 1,523
Capital expenditure (-) (1,054) (952) (220) (325) (350)
Net cash after capex 3,201 (7,101) 1,229 784 1,173
Inc./(dec.) in short-term borrowing (86) (2,323) (500) (500) (500)
Inc./(dec.) in long-term borrowing (17) 372 - - -
Inc./(dec.) in total borrowings (104) (1,951) (500) (500) (500)
(Inc.)/dec. in investments (796) 781 - - -
Minority interest 6 0.4 - - -
Equity issue/(Buyback) 25 - - - -
Cash from financial activities (868) (1,170) (500) (500) (500)
Others (103) 27 - - -
Opening cash 8,319 10,549 2,306 3,035 3,319
Closing cash 10,549 2,306 3,035 3,319 3,992
Change in cash 2,230 (8,243) 729 284 673
Source: Company, Nirmal Bang Institutional Equities Research
Exhibit 36: Key ratios
Y/E March FY13 FY14 FY15E FY16E FY17E
Per share (Rs)
EPS 28.5 23.3 24.6 39.7 55.1
Book value 162.9 181.0 199.1 231.9 278.8
Valuation (x)
P/E 13.7 16.7 15.9 9.8 7.1
P/BV 2.4 2.2 2.0 1.7 1.4
EV/EBITDA 4.6 6.9 6.5 4.9 3.8
EV/sales 0.3 0.4 0.4 0.3 0.3
Return ratios (%)
RoCE 18.3 17.4 17.6 22.1 25.6
RoE 19.0 13.6 12.9 18.4 21.6
RoIC 49.2 31.0 21.4 27.8 32.9
Profitability ratios (%)
EBITDA margin 6.7 6.4 6.0 6.8 7.6
EBIT margin 6.2 5.8 5.4 6.3 7.0
PAT margin 2.4 1.9 1.9 2.8 3.5
Turnover ratios
Total asset turnover ratio (x) 3.0 3.0 3.3 3.5 3.6
Debtor days 66 76 90 88 86
Inventory days 56 70 80 78 76
Creditors days 116 142 145 143 141
Solvency ratios (x)
Debt-equity 1.6 1.1 1.0 0.8 0.6
Interest coverage 2.1 1.9 2.1 2.9 3.8
Source: Company, Nirmal Bang Institutional Equities Research
14

Capital Goods
Chirag Muchhala ([email protected] )
Company CMP Current M-cap
(Rs) Rating (US$mn) FY14 FY15E FY16E FY14 FY15E FY16E FY14 FY15E FY16E Sales EBITDA PAT FY14 FY15E FY16E FY14 FY15E FY16E FY14 FY15E FY16E FY14 FY15E FY16E FY14 FY15E FY16E FY14 FY15E FY16E
ABB India 1,224 552 Sell 4,258 77,220 82,368 91,166 4,699 6,010 7,386 1,793 2,580 3,542 8.7 25.4 40.5 8.5 12.2 16.7 144.6 100.5 73.2 55.8 43.7 35.5 9.7 9.1 8.3 6.8 9.3 11.8 11.8 14.4 17.5
BHEL 221 160 Sell 8,866 391,088 367,835 353,445 45,198 39,387 39,681 34,608 31,912 32,613 (4.9) (6.3) (2.9) 14.1 13.0 13.3 15.6 16.9 16.6 9.9 11.2 10.3 1.6 1.5 1.4 10.9 9.3 8.9 10.5 7.8 7.1
BGR Energy 164 112 Sell 195 33,008 36,626 42,035 3,680 3,956 4,246 932 1,303 1,472 12.8 7.4 25.6 12.9 18.1 20.4 12.7 9.1 8.1 6.7 6.9 6.7 0.9 0.8 0.8 7.4 9.7 10.1 8.9 9.3 9.5
Bajaj Electricals 272 335 Buy 449 40,298 47,352 55,461 818 2,782 3,992 (53) 1,210 2,094 17.3 120.9 NA (0.5) 12.1 20.9 NA 22.5 13.0 36.8 10.8 7.4 3.8 3.4 2.8 (0.7) 16.0 23.3 5.9 22.9 30.8
Crompton Greaves 215 221 Accumulate 2,217 134,806 146,382 160,606 6,820 9,097 11,704 2,443 4,621 6,348 9.2 31.0 61.2 3.9 7.4 10.1 55.3 29.2 21.3 22.3 16.7 12.9 3.8 3.5 3.1 6.8 12.1 15.0 7.4 10.1 13.3
KEC International 108 126 Accumulate 454 79,018 85,232 94,406 4,933 6,051 7,364 668 1,642 2,488 9.3 22.2 93.1 2.6 6.4 9.7 41.4 16.8 11.1 9.6 7.8 6.3 2.3 2.1 1.8 5.7 13.0 17.4 13.5 15.2 18.3
PGCIL 136 159 Buy 11,694 152,303 179,095 208,540 129,563 151,156 176,634 44,974 50,668 60,832 17.0 16.8 16.3 8.6 9.7 11.6 15.8 14.1 11.7 11.3 10.4 9.6 2.1 1.9 1.7 13.1 13.4 14.6 5.3 5.3 5.6
Siemens 886 394 Sell 5,181 113,527 108,338 127,960 4,207 6,392 10,493 1,940 2,920 5,610 6.2 57.9 70.1 5.4 8.2 15.8 162.7 108.1 56.3 73.6 48.9 29.6 7.8 7.7 7.3 4.9 7.2 13.3 4.3 9.5 18.3
Thermax 841 712 Sell 1,644 50,999 58,094 70,549 4,373 5,228 6,491 2,460 3,225 4,038 17.6 21.8 28.1 20.6 27.1 33.9 40.7 31.1 24.8 23.6 19.5 15.6 4.9 4.4 3.9 11.2 13.0 14.9 13.0 13.5 16.2
Triveni Turbine 89 118 Buy 483 5,154 7,799 9,633 1,036 1,735 2,256 680 1,190 1,556 36.7 47.6 51.3 2.1 3.6 4.7 43.3 24.8 18.9 28.5 16.9 12.8 16.9 11.9 8.5 38.9 48.0 45.0 43.5 58.8 56.7
Voltas 242 253 Accumulate 1,315 52,660 56,201 62,004 2,656 3,294 4,442 2,238 2,779 3,636 8.5 29.3 27.5 6.8 8.4 11.0 35.8 28.8 22.0 30.1 24.0 17.4 4.4 4.0 3.5 14.2 14.5 16.9 12.1 13.8 17.1
Cement
Giriraj Daga ([email protected])
Company CMP Current M-cap
(Rs) Rating (US$mn) FY14 FY15E FY16E FY14 FY15E FY16E FY14 FY15E FY16E Sales EBITDA PAT FY14 FY15E FY16E FY14 FY15E FY16E FY14 FY15E FY16E FY14 FY15E FY16E FY14 FY15E FY16E FY14 FY15E FY16E
ACC 1,495 1,828 Buy 4,610 111,689 124,363 147,088 16,288 22,390 30,028 10,958 13,232 18,478 14.3 31.3 26.5 58.3 70.5 98.4 25.6 21.2 15.2 3.6 3.3 3.0 15.6 11.3 7.9 14.4 16.2 20.5 12.3 14.2 18.6
Ambuja 209 224 Acc. 5,320 91,917 105,028 124,316 16,356 21,647 29,625 12,784 13,955 18,964 16.3 29.9 21.5 8.4 9.1 12.4 25.0 22.9 16.9 3.4 3.1 2.7 17.1 11.8 8.6 14.0 14.0 17.1 11.0 12.8 14.9
Grasim Industries 3,540 4,620 Buy 5,339 293,240 347,457 413,631 49,144 60,467 80,680 20,715 24,768 32,368 17.6 24.1 23.6 225.6 267.3 349.3 15.7 13.2 10.1 1.5 1.4 1.2 8.1 6.8 4.9 10.0 10.9 12.8 8.7 10.0 11.8
HeidelbergCement 77 92 Buy 288 11,936 16,317 20,186 867 2,630 4,127 (407) 492 1,544 25.2 83.5 (284.5) (1.8) 2.2 6.8 (43.0) 35.6 11.3 2.1 1.9 1.6 34.5 10.8 6.6 (4.8) 5.6 15.4 0.7 6.5 10.7
India Cement 113 165 Buy 568 44,584 47,759 57,036 5,546 7,018 10,500 (1,624) 625 2,903 13.7 34.3 (244.7) (5.3) 2.0 9.5 (21.3) 55.4 11.9 0.9 0.9 0.9 10.3 8.1 5.1 (4.2) 1.6 7.2 3.2 5.8 7.7
JK Cement 539 469 Sell 618 27,815 34,592 42,399 3,749 4,933 7,135 970 962 1,658 20.8 33.3 43.5 13.9 13.8 23.7 38.8 39.1 22.7 2.1 2.1 1.9 11.1 11.8 8.1 5.6 5.4 8.7 5.4 6.2 7.6
JK Lakshmi Cement 317 348 Buy 612 20,566 25,712 31,240 3,020 4,421 6,873 930 1,216 2,888 21.4 40.8 61.5 7.9 10.3 24.5 40.1 30.7 12.9 2.9 2.7 2.3 15.5 11.1 6.8 7.3 9.0 19.1 6.1 8.0 11.4
Sagar Cement 361 480 Buy 108 4,889 5,755 6,837 13 467 922 (256) 2,970 491 17.7 365.5 (251.9) (14.7) 170.8 28.2 (24.5) 2.1 12.8 2.6 1.2 1.1 560.5 10.4 4.8 (10.1) 76.7 8.8 (1.1) 5.5 9.1
Shree Cement 8,500 8,498 Acc. 4,863 58,873 70,576 86,652 13,898 18,099 24,994 7,872 9,189 14,059 20.5 31.5 32.6 226.0 263.7 403.5 37.6 32.2 21.1 6.3 5.2 4.1 20.3 15.5 11.0 18.4 17.6 21.9 17.8 15.9 19.9
The Ramco Cement 317 354 Buy 1,239 37,382 41,489 49,197 6,177 7,989 11,388 1,377 2,086 4,437 14.6 31.7 68.1 5.8 8.8 18.6 54.8 36.2 17.0 3.0 2.8 2.5 16.4 12.4 8.3 5.5 7.8 14.6 5.0 5.9 9.4
Ultratech Cement 2,600 2,963 Acc. 11,715 202,798 244,603 297,625 38,179 50,693 69,219 21,445 29,204 40,875 19.6 28.5 32.7 78.2 106.5 149.0 33.2 24.4 17.4 4.2 3.6 3.1 18.8 14.9 10.7 12.5 16.1 18.8 9.7 11.3 14.1
FMCG
Krishnan Sambamoorthy ([email protected] )
Company CMP Current M-cap
(Rs) Rating (US$mn) FY14 FY15E FY16E FY14 FY15E FY16E FY14 FY15E FY16E Sales EBITDA PAT FY14 FY15E FY16E FY14 FY15E FY16E FY14 FY15E FY16E FY14 FY15E FY16E FY14 FY15E FY16E FY14 FY15E FY16E
Colgate Palmolive 1,613 1,813 Accumulate 3,616 35,788 40,619 47,525 6,640 8,408 10,883 4,755 5,875 7,476 15.2 28.0 25.4 35.0 43.2 55.0 46.1 37.3 29.3 32.5 25.5 19.5 36.6 31.5 26.8 87.3 90.6 98.6 85.4 89.0 96.7
PGHH 4,850 4,716 Accumulate 2,598 20,510 24,285 29,337 4,207 4,978 6,307 3,020 3,513 4,315 19.6 22.4 19.5 92.9 108.1 132.8 52.2 44.9 36.5 36.8 30.7 23.9 15.7 13.3 11.3 33.4 33.4 33.4 34.0 32.4 33.6
Britannia Inds. 1,453 780 Sell 2,869 68,927 77,543 87,623 6,072 6,669 7,711 3,954 4,207 4,915 12.7 12.7 11.5 33.0 35.1 41.0 44.0 41.4 35.4 28.3 25.7 21.7 21.8 16.7 13.1 58.3 45.7 41.4 39.6 38.1 35.5
Nestle India 6,088 4,240 Sell 9,676 90,814 98,714 110,560 19,999 20,335 23,218 11,033 11,298 13,286 10.3 7.7 9.7 114.4 117.2 137.8 53.2 52.0 44.2 29.2 28.4 24.5 24.8 20.2 17.1 53.0 42.8 41.9 32.7 27.9 28.7
Glaxo Consumer 5,036 3,828 Sell 3,491 48,686 42,357 48,710 8,728 7,158 8,378 6,748 5,628 6,315 0.0 (2.0) (3.3) 128.4 133.8 150.1 39.2 37.6 33.5 27.7 27.0 23.0 11.7 10.1 8.7 34.0 28.8 27.9 31.1 26.0 25.7
United Breweries 698 483 Sell 3,042 42,297 45,934 54,202 5,881 5,834 7,588 2,260 2,119 3,039 13.2 13.6 16.0 8.6 8.0 11.5 81.5 86.9 60.6 33.2 33.6 26.3 10.8 9.8 8.6 14.0 11.8 15.1 8.5 7.7 10.0
Metal & Mining
Giriraj Daga ([email protected])
Company CMP Current M-cap
(Rs) Rating (US$mn) FY14 FY15E FY16E FY14 FY15E FY16E FY14 FY15E FY16E Sales EBITDA PAT FY14 FY15E FY16E FY14 FY15E FY16E FY14 FY15E FY16E FY14 FY15E FY16E FY14 FY15E FY16E FY14 FY15E FY16E
Coal India 339 336 Sell 35,198 688,100 745,128 810,052 159,632 181,484 198,641 151,116 169,603 185,982 8.2 10.7 10.5 23.9 26.9 29.4 14.2 12.6 11.5 5.1 4.4 3.8 10.0 8.0 6.8 33.3 37.4 35.7 32.6 37.3 35.8
GMDC 150 130 Sell 785 12,897 15,805 15,987 6,146 6,572 6,835 4,391 4,263 4,064 11.3 6.9 (2.6) 13.8 13.4 12.8 10.9 11.2 11.8 1.7 1.5 1.4 6.0 6.2 6.6 16.3 14.1 12.2 16.3 14.1 12.2
Hindalco 161 141 Sell 5,447 876,955 977,117 1,040,218 82,863 100,695 112,433 21,750 30,484 33,818 7.9 12.9 1.9 10.5 14.8 16.4 15.3 10.9 9.8 0.8 0.8 0.7 10.3 8.8 7.8 5.7 7.3 7.5 4.5 5.1 5.3
Hindustan Zinc 164 180 Acc. 11,376 136,360 144,838 159,623 69,654 76,112 89,068 69,047 76,777 87,388 9.6 14.4 13.8 16.3 18.2 20.7 10.0 9.0 7.9 1.9 1.6 1.4 6.3 5.2 3.8 18.5 17.7 17.5 18.7 17.8 17.6
IMFA 303 437 Buy 129 13,179 13,162 15,408 2,975 2,641 4,281 349 45 1,051 8.2 19.5 67.2 13.4 1.7 40.4 22.5 174.5 7.5 0.9 0.9 0.8 6.1 6.8 4.0 4.0 0.5 11.4 5.9 4.2 9.3
JSW Steel 1,311 1,515 Buy 5,203 512,196 566,507 597,018 91,655 114,685 124,052 4,519 33,457 38,979 7.5 15.0 122.8 18.7 138.4 161.3 70.1 9.5 8.1 1.5 1.3 1.2 8.1 6.5 5.8 1.9 13.9 14.2 3.2 9.2 9.9
NALCO 65 48 Sell 2,749 67,809 71,455 75,515 9,342 12,102 12,385 6,423 8,460 7,545 4.4 8.3 3.1 2.5 3.3 2.9 26.1 19.8 22.2 1.4 1.3 1.3 12.3 9.2 9.1 5.3 6.8 5.9 5.6 6.8 5.9
NMDC 175 215 Buy 11,403 120,582 137,919 142,831 77,715 92,905 95,939 64,201 73,977 75,852 7.9 9.6 6.9 16.2 18.7 19.1 10.8 9.4 9.2 2.3 2.1 1.9 6.5 5.2 5.2 21.4 22.0 20.5 21.3 22.0 20.5
Sesa Sterlite 285 360 Buy 13,855 661,475 747,574 820,756 203,597 275,446 316,614 62,985 54,352 83,598 9.3 18.6 16.9 21.2 18.3 28.2 13.4 15.5 10.1 1.2 1.1 1.0 7.5 5.5 4.6 8.6 7.0 9.9 9.0 9.1 9.6
SAIL 76 89 Acc. 5,127 467,601 513,406 590,539 41,757 62,979 77,637 26,165 26,035 25,462 13.9 34.1 9.3 6.3 6.3 6.2 11.9 12.0 12.3 0.7 0.7 0.7 12.8 9.8 8.5 6.3 6.0 5.6 4.0 5.2 5.0
Tata Steel 498 669 Buy 7,949 1,486,136 1,494,051 1,516,007 164,110 184,207 204,488 35,949 45,747 66,241 1.9 12.7 35.4 37.0 47.1 68.2 13.5 10.6 7.3 1.2 1.1 1.0 7.2 6.6 5.8 9.8 10.9 14.3 5.4 5.5 7.1
Vesuvius India 700 856 Buy 233 6,018 6,528 7,247 1,109 1,120 1,320 652 671 821 10.3 12.4 15.7 32.1 33.1 40.4 21.8 21.2 17.3 3.6 3.1 2.7 11.9 11.3 9.2 17.6 15.8 16.9 17.6 15.8 17.0
EPS (Rs)CAGR FY14-FY16E P/E (X)
Valuation Of Companies In Our Coverage Universe
Net sales (Rsmn) EBITDA (Rsmn) PAT (Rsmn) CAGR FY14-FY16E EPS (Rs) P/E (X) EV/EBITDA (X) P/BV (X) RoE (%) RoCE (%)TP
(Rs)
RoCE (%)TP
(Rs)
Net sales (Rsmn) EBITDA (Rsmn) PAT (Rsbn) CAGR FY14-FY16E EPS (Rs) P/E (X) P/BV (X) EV/EBITDA (X) RoE (%)
RoE (%) RoCE (%)
RoE (%) RoCE (%)
CAGR FY14-FY16E EPS (Rs) P/E (X)
EV/EBITDA (X)P/BV (X)
EV/EBITDA (X) P/BV (X)Target
Price
Net sales (Rsmn) EBITDA (Rsmn) PAT (Rsmn)
EBITDA (Rsmn) PAT (Rsmn)TP
(Rs)
Net sales (Rsmn)
Institutional Equities
15

Midcap
Jignesh Kamani ([email protected] )
Company CMP Current M-cap
(Rs) Rating (US$mn) FY14 FY15E FY16E FY14 FY15E FY16E FY14 FY15E FY16E Sales EBITDA PAT FY14 FY15E FY16E FY14 FY15E FY16E FY14 FY15E FY16E FY14 FY15E FY16E FY14 FY15E FY16E FY14 FY15E FY16E
Bata India 1,245 1,507 Buy 1,313 20,652 22,785 26,682 3,220 3,490 4,469 1,976 2,142 2,786 13.7 17.8 18.7 30.7 33.3 43.4 40.5 37.3 28.7 24.1 21.9 16.8 9.5 8.1 6.7 25.7 23.5 25.6 25.3 23.5 25.6
Kajaria Ceramics 645 767 Buy 800 18,400 22,088 27,099 2,807 3,511 4,307 1,242 1,724 2,212 21.4 23.9 33.4 16.4 21.7 27.8 39.2 29.7 23.2 18.2 14.4 11.7 9.2 6.9 5.6 27.9 27.2 26.7 20.9 22.1 23.1
Supreme Inds 663 622 Accumulate 1,382 39,622 47,254 56,345 5,888 6,545 7,719 2,585 3,475 4,164 19.2 14.5 26.9 20.4 27.4 32.8 32.6 24.2 20.2 14.9 13.2 11.2 8.1 6.6 5.5 27.0 30.0 29.7 22.7 23.5 24.3
Just Dial 1,716 2,010 Buy 1,977 4,613 5,952 7,624 1,422 1,957 2,526 1,206 1,481 1,913 28.6 33.3 25.9 17.2 21.1 27.3 99.8 81.3 63.0 84.4 61.2 47.3 22.5 18.7 15.4 25.1 25.2 26.8 25.1 25.1 26.8
Arvind 319 - UR 1,353 68,621 82,166 96,135 9,340 11,279 13,596 3,686 3,854 4,978 18.4 20.6 16.2 14.3 14.9 19.3 22.4 21.4 16.6 11.8 10.1 8.5 3.2 2.8 2.5 15.2 14.1 16.1 13.1 12.1 12.9
Havells India 267 285 Buy 2,739 81,858 91,999 102,104 7,425 8,962 10,634 4,463 5,936 7,251 11.7 19.7 27.5 7.2 9.5 11.6 37.4 28.1 23.0 23.5 19.3 15.9 10.0 8.3 6.8 28.7 32.3 32.7 15.7 18.8 20.5
Tilaknagar Inds 45 63 Buy 92 8,118 8,089 8,929 1,575 1,466 1,949 459 265 621 4.9 11.3 16.3 3.7 2.1 5.0 12.2 21.1 9.0 8.6 9.1 6.9 0.9 0.8 0.7 8.2 4.2 8.7 7.2 7.1 8.6
Greenply Inds 994 1,075 Buy 394 22,169 25,789 28,506 2,646 3,484 3,940 1,176 1,537 1,820 13.4 22.0 24.4 48.7 63.7 75.4 20.4 15.6 13.2 11.8 8.7 7.5 4.1 3.3 2.7 22.2 23.4 22.3 13.2 14.4 14.7
La Opala RG 1,538 1,272 Accumulate 268 1,779 2,272 2,834 500 667 852 300 405 565 26.2 30.5 37.3 28.3 36.5 50.9 54.4 42.2 30.2 32.7 23.6 18.2 16.7 9.2 7.3 34.9 28.5 26.8 30.1 27.7 26.8
JBF Industries 153 152 Accumulate 165 85,677 101,277 182,654 7,119 9,337 18,558 112 2,890 8,127 46.0 61.5 752.2 1.3 43.8 124.0 118.7 3.5 1.2 10.2 8.5 3.8 0.5 0.5 0.3 0.6 14 31.8 1.4 6.4 13.3
CARE 1,426 1,610 Buy 679 2,356 2,750 3,224 1,477 1,720 2,031 1,294 1,474 1,728 17.0 17.3 15.5 44.6 50.8 59.6 32.0 28.0 23.9 24.7 21.0 17.5 8.5 7.9 7.2 28.5 29.2 31.2 28.5 29.2 31.2
ICRA 2,559 3,302 Accumulate 420 2,830 3,219 3,730 856 990 1,159 689 805 943 14.8 16.4 17.0 68.9 80.5 94.3 37.1 31.8 27.1 26.2 22.2 18.4 6.6 5.8 5.1 19.0 19.5 20.1 18.6 19.1 20.1
Crisil 1,936 2,102 Accumulate 2,255 11,106 13,002 15,482 3,606 4,290 5,183 2,527 3,068 3,808 18.1 19.9 22.7 35.7 43.4 53.9 54.1 44.6 35.9 36.9 30.5 24.8 20.3 17.1 14.2 42.0 41.6 43.1 41.8 41.6 43.1
V Guard 822 915 Buy 403 15,176 18,081 21,592 1,226 1,576 1,915 702 943 1,188 19.3 25.0 30.1 23.5 31.6 39.8 34.9 26.0 20.6 20.8 16.1 13.0 7.7 6.2 4.9 24.2 26.4 26.5 20.5 23.3 24.3
CCL Products 113 140 Buy 248 7,168 9,496 10,682 1,431 1,805 2,070 644 920 1,237 22.1 20.3 38.6 4.8 6.9 9.3 23.4 16.4 12.2 12.3 9.5 7.8 4.3 3.5 2.8 20.4 23.6 25.8 12.3 16.4 20.2
Adi Finchem 338 417 Buy 77 1,518 1,956 2,830 333 403 583 187 225 349 36.5 32.3 36.6 14.9 16.3 25.3 22.7 20.7 13.4 14.9 12.2 8.3 9.0 6.9 4.7 47.9 39.3 41.7 32.8 29.6 35.0
Pharmaceutical
Praful Bohra ([email protected])
Company CMP Current M-cap
(Rs) Rating (US$mn) FY14 FY15E FY16E FY14 FY15E FY16E FY14 FY15E FY16E FY14 FY15E FY16E FY14 FY15E FY16E FY14 FY15E FY16E FY14 FY15E FY16E FY14 FY15E FY16E FY14 FY15E FY16E FY14 FY15E FY16E
Aurobindo Pharma 868 781 Accumulate 4,155 80,873 121,273 136,451 21,195 21,235 24,972 13,333 13,503 16,258 29.9 8.5 10.4 45.7 46.3 55.8 19.0 18.7 15.6 13.6 13.5 11.2 6.7 5.0 3.8 36.9 30.6 27.7 26.1 21.7 22.9
Cadila 1,270 1,195 Accumulate 4,270 72,240 80,454 94,797 12,001 14,943 18,438 8,036 10,156 12,881 14.6 23.9 26.6 40.0 49.6 62.9 31.8 25.6 20.2 23.5 18.8 15.1 7.6 6.1 5.0 25.7 26.5 27.2 16.0 18.9 21.0
Cipla 610 462 Accumulate 8,044 100,973 117,229 136,125 21,329 24,083 30,074 13,884 16,043 20,588 16.1 18.7 21.8 17.3 20.0 25.6 35.3 30.5 23.8 22.9 20.4 16.2 4.8 4.2 3.6 14.5 14.8 16.5 15.8 15.6 18.0
Divis Labs 1,693 1,595 Accumulate 3,689 25,187 30,139 36,167 10,391 11,604 13,924 7,733 8,782 10,582 19.8 15.8 17.0 58.3 66.2 79.7 29.1 25.6 21.2 21.6 19.3 16.1 7.6 6.4 5.4 28.3 27.1 27.5 33.2 31.2 32.0
Ipca Labs 779 815 Accumulate 1,614 32,818 36,017 43,372 8,106 8,457 10,301 4,764 5,546 6,859 15.0 12.7 20.0 42.3 43.9 54.4 18.4 17.7 14.3 12.8 12.2 9.9 5.0 4.0 3.2 27.1 25.2 25.1 27.1 25.2 25.1
Glenmark Pharma 735 629 Accumulate 3,273 60,053 68,995 80,928 13,087 14,970 18,166 5,493 8,355 10,661 16.1 17.8 39.3 26.4 30.0 38.6 27.8 24.5 19.1 17.1 14.7 11.9 6.7 5.2 4.1 24.9 23.9 23.9 19.6 20.0 22.4
Jubilant Lifescience 164 171 Sell 429 57,984 63,579 72,169 9,984 9,394 11,979 3,347 2,763 4,532 11.6 9.5 16.4 21.0 17.3 28.5 7.8 9.5 5.8 5.8 6.1 4.6 1.0 0.9 0.8 13.1 10.1 14.9 10.7 9.5 12.8
Lupin 1,365 1,284 Accumulate 10,056 112,866 137,936 157,539 30,028 38,270 42,937 18,364 23,975 27,421 18.1 19.6 22.2 41.0 53.5 61.2 33.3 25.5 22.3 20.3 15.7 13.7 8.8 6.9 5.5 30.3 30.4 27.5 38.1 40.3 36.9
Natco Pharma 1,524 1,125 Accumulate 828 7,389 8,909 10,426 1,793 2,138 2,554 1,026 1,306 1,717 18.8 19.3 29.4 30.4 38.4 50.5 50.2 39.7 30.2 29.7 24.8 20.5 8.3 7.1 5.9 17.8 19.4 21.6 15.4 17.4 20.1
Sun Pharma 792 872 Accumulate 26,946 160,804 189,987 217,299 71,956 84,910 96,067 57,218 65,714 72,238 16.2 15.5 12.4 27.6 31.7 34.9 28.7 25.0 22.7 22.1 18.3 15.7 8.7 6.9 5.6 33.9 30.9 27.2 33.4 30.4 28.2
Torrent Pharma 856 683 Sell 2,377 41,847 49,938 56,039 9,515 12,433 13,717 6,640 7,046 7,706 15.7 20.1 7.7 39.2 41.6 45.5 21.8 20.6 18.8 15.6 13.5 12.0 7.6 5.7 4.5 39.9 31.8 26.9 32.8 25.2 21.5
Banking
Hatim Broachwala ([email protected])
Company CMP Current M-cap
(Rs) Rating (US$mn) FY14 FY15E FY16E FY14 FY15E FY16E FY14 FY15E FY16E NII Op. Profit PAT FY14 FY15E FY16E FY14 FY15E FY16E FY14 FY15E FY16E FY14 FY15E FY16E FY14 FY15E FY16E
Axis Bank 398 472 Buy 15,409 119,516 136,714 153,871 111,426 118,587 132,190 62,176 66,877 73,016 13.5 8.9 8.4 26.5 28.5 31.1 15.0 14.0 12.8 2.5 2.2 1.9 17.4 16.3 15.6 1.7 1.6 1.6
HDFC Bank 846 960 Buy 33,542 184,826 219,257 262,842 142,464 169,908 206,964 84,784 102,207 123,378 19.3 20.5 20.6 35.3 42.6 51.4 23.9 19.9 16.5 4.6 3.9 3.4 21.3 21.5 21.9 1.9 1.9 1.9
ICICI Bank 1,530 1,700 Buy 29,060 164,756 188,057 211,936 156,927 172,946 196,865 98,105 108,047 122,025 13.4 12.0 11.5 84.9 93.5 105.6 18.0 16.4 14.5 2.5 2.3 2.1 14.0 14.1 14.4 1.7 1.7 1.7
State Bank of India 2,562 2,915 Buy 31,408 492,822 561,099 631,419 300,712 365,605 415,334 108,912 143,068 177,711 13.2 17.5 27.7 145.9 191.6 238.0 17.6 13.4 10.8 2.2 2.0 1.7 10.0 11.5 13.0 0.6 0.7 0.8
Bank of Baroda 929 865 Accumulate 6,546 119,653 139,698 164,986 85,470 101,505 123,927 45,411 55,862 66,555 17.4 20.4 21.1 105.4 129.7 154.5 8.8 7.2 6.0 1.3 1.2 1.1 13.4 14.7 15.5 0.8 0.8 0.8
Punjab National Bank 968 975 Accumulate 5,753 161,460 180,014 203,127 108,351 119,453 143,253 33,425 58,558 68,855 12.2 15.0 43.5 92.3 161.7 190.2 10.5 6.0 5.1 1.4 1.3 1.1 9.7 15.4 16.0 0.6 1.0 1.0
Bank of India 286 275 Accumulate 3,020 108,305 119,653 147,020 76,273 85,328 111,682 27,293 32,681 41,279 16.5 21.0 23.0 42.4 50.8 64.2 6.7 5.6 4.5 1.0 1.0 0.8 10.1 10.5 12.1 0.5 0.5 0.6
Canara Bank 391 370 Sell 2,964 89,444 104,387 120,510 62,921 72,194 81,723 24,382 31,224 37,101 16.1 14.0 23.4 52.9 67.7 80.4 7.4 5.8 4.9 0.7 0.7 0.6 8.9 10.1 10.9 0.5 0.6 0.6
Syndicate Bank 125 Under review 1,281 55,398 58,701 67,481 34,050 37,346 44,032 17,114 15,651 20,023 10.4 13.7 8.2 27.4 25.1 32.1 4.6 5.0 3.9 0.7 0.6 0.6 15.7 12.7 14.7 0.7 0.6 0.6
ING Vysya Bank 625 790 Buy 1,952 17,532 19,395 22,919 10,713 12,766 16,119 6,579 7,190 9,915 14.3 22.7 22.8 34.9 38.1 52.6 17.9 16.4 11.9 1.7 1.6 1.4 11.2 9.8 12.3 1.1 1.1 1.3
EPS (Rs) P/E (X) P/ABV (X)
P/E (X) EV/EBITDA (X)
RoE (%) RoA (%)TP
(Rs)
Net Interest Income (Rsmn) Op Profit (Rsmn) PAT (Rsmn) CAGR FY14-FY16E
RoCE (%)RoE (%)
RoE (%) RoCE (%)
EV/EBITDA (X)P/E (X)CAGR FY14-FY16E EPS (Rs) P/BV (X)
P/BV (X)CAGR FY14-FY16E EPS (Rs)
TP
(Rs)
Net sales (Rsmn) EBITDA (Rsmn) PAT (Rsbn)
TP
(Rs)
Net sales (Rsmn) EBITDA (Rsmn) PAT (Rsmn)
Institutional Equities
16

Institutional Equities
Disclaimer
Stock Ratings Absolute Returns
BUY > 15%
ACCUMULATE -5% to15%
SELL < -5%
This report is published by Nirmal Bang’s Institutional Equities Research desk. Nirmal Bang has other business units with independent research teams separated by Chinese walls, and therefore may, at times, have different or contrary views on stocks and markets. This report is for the personal information of the authorised recipient and is not for public distribution. This should not be reproduced or redistributed to any other person or in any form. This report is for the general information for the clients of Nirmal Bang Equities Pvt. Ltd., a division of Nirmal Bang, and should not be construed as an offer or solicitation of an offer to buy/sell any securities.
We have exercised due diligence in checking the correctness and authenticity of the information contained herein, so far as it relates to current and historical information, but do not guarantee its accuracy or completeness. The opinions expressed are our current opinions as of the date appearing in the material and may be subject to change from time to time without notice.
Nirmal Bang or any persons connected with it do not accept any liability arising from the use of this document or the information contained therein. The recipients of this material should rely on their own judgment and take their own professional advice before acting on this information. Nirmal Bang or any of its connected persons including its directors or subsidiaries or associates or employees or agents shall not be in any way responsible for any loss or damage that may arise to any person/s from any inadvertent error in the information contained, views and opinions expressed in this publication.
‘Access our reports on Bloomberg Type NBIE <GO>’
Team Details:
Name Email Id Direct Line
Rahul Arora CEO [email protected] -
Dealing
Ravi Jagtiani Dealing Desk [email protected] +91 22 3926 8230, +91 22 6636 8833
Pradeep Kasat Dealing Desk [email protected] +91 22 3926 8100/8101, +91 22 6636 8831
Michael Pillai Dealing Desk [email protected] +91 22 3926 8102/8103, +91 22 6636 8830
Umesh Bharadia Dealing Desk [email protected] +91-22-39268226
Nirmal Bang Equities Pvt. Ltd.
Correspondence Address
B-2, 301/302, Marathon Innova,
Nr. Peninsula Corporate Park
Lower Parel (W), Mumbai-400013.
Board No. : 91 22 3926 8000/1
Fax. : 022 3926 8010
17