imf country report no. 15/26 montenegro. public debt sustainability analysis _____39 ii. external...
TRANSCRIPT

© 2015 International Monetary Fund
IMF Country Report No. 15/26
MONTENEGRO 2014 ARTICLE IV CONSULTATION––STAFF REPORT; PRESS RELEASE; AND STATEMENT BY THE EXECUTIVE DIRECTOR FOR MONTENEGRO
Under Article IV of the IMF’s Articles of Agreement, the IMF holds bilateral discussions with members, usually every year. In the context of the 2014 Article IV consultation with Montenegro, the following documents have been released and are included in this package: The Staff Report prepared by a staff team of the IMF for the Executive Board’s
consideration on January 23, 2015, following discussions that ended on November 4, 2014, with the officials of Montenegro on economic developments and policies. Based on information available at the time of these discussions, the staff report was completed on January 8, 2015.
An Informational Annex prepared by the IMF.
A Press Release summarizing the views of the Executive Board as expressed during its January 23, 2015 consideration of the staff report that concluded the Article IV consultation with Montenegro.
A Statement by the Executive Director for Montenegro.
The policy of publication of staff reports and other documents allows for the deletion of market-sensitive information.
Copies of this report are available to the public from
International Monetary Fund Publication Services PO Box 92780 Washington, D.C. 20090
Telephone: (202) 623-7430 Fax: (202) 623-7201 E-mail: [email protected] Web: http://www.imf.org
Price: $18.00 per printed copy
International Monetary Fund Washington, D.C.
February 2015

MONTENEGRO STAFF REPORT FOR THE 2014 ARTICLE IV CONSULTATION
KEY ISSUES
Context: Moderate growth is continuing; however credit and wage growth are weak.
The level of nonperforming loans (NPLs) remains high and public debt has risen sharply
in recent years.
Fiscal policy: Medium-term funding needs to roll over existing debt and to fund budget
deficits are large. A new highway, budgeted to cost about one quarter of GDP, will cause
deficits to widen and add to public debt. The draft 2015 budget shows appropriate
restraint on other spending, but a long period of strong fiscal discipline will be needed
to manage fiscal risks. Laying out clear long-term plans for managing the public finances
would boost credibility and reduce risks to market access. Fundamental expenditure
reform, especially of the pension system and the public sector wage bill, would be an
essential part of such plans.
Financial sector: The banking system’s liquidity appears comfortable; however,
profitability is low and lending spreads are high. Regulatory provisioning is set higher
than that reported under international accounting standards, but a wide range of
provisioning levels across banks and weak incentives to take losses remain concerns. A
more transparent and comprehensive reporting environment would be beneficial.
Reforms to ensure better enforcement of contracts and collateral would help bring down
structural lending risk premia.
Structural reform: Higher levels of labor participation and employment are needed to
boost potential growth and safeguard the public finances. Ensuring that wages adjust in
line with productivity alongside reforms to achieve better employment outcomes and
boost productivity would enhance the economy’s ability to respond to macroeconomic
shocks, and are even more important in a country that lacks its own currency and with
decreasing fiscal buffers.
January 8, 2015

MONTENEGRO
2 INTERNATIONAL MONETARY FUND
Approved By European Department
Discussions were held in Podgorica October 22–November 4, 2014.
The staff team comprised Alasdair Scott (head), Thomas Dowling,
Christopher Faircloth, and Zsoka Koczan (all EUR). Mr. Aasim Husain
(EUR) attended some of the meetings. The team met with the
authorities (central bank, ministries of finance, justice, transportation,
and labor), private sector representatives (unions, employers, and
banks), and international agencies (EC, EBRD, and World Bank). HQ
support was provided by Dustin Smith and Patricia Mendoza (EUR).
CONTENTS
CONTEXT_________________________________________________________________________________________ 4
RECENT DEVELOPMENTS _______________________________________________________________________ 4
OUTLOOK AND RISKS ___________________________________________________________________________ 6
POLICY DISCUSSIONS ___________________________________________________________________________ 7
A. Fiscal Policy: Safeguarding Debt Sustainability Amid Mounting Fiscal Pressures _______________ 8
B. Monetary and Financial Sector Policies: Strengthening Credit Conditions _____________________ 14
C. Structural Reform: Strengthening Economic Resilience and Reinvigorating Growth ___________ 19
STAFF APPRAISAL _____________________________________________________________________________ 23
BOXES
1. Montenegro’s Highway Project _________________________________________________________________ 5
2. Fiscal Policy in a Unilaterally Euroized Economy _______________________________________________ 10
3. Interest Rate Spreads __________________________________________________________________________ 17
4. External Competitiveness ______________________________________________________________________ 20
FIGURES
1. Real Sector Developments ____________________________________________________________________ 25
2. Fiscal Developments ___________________________________________________________________________ 26
3. Pension Expenditures __________________________________________________________________________ 27
4. Financial Sector Developments ________________________________________________________________ 28
5. Risk Assessment Matrix ________________________________________________________________________ 29
TABLES
1. Selected Economic Indicators, 2010–19 _______________________________________________________ 30
2. Savings and Investment Balances, 2010–19 ___________________________________________________ 31
3. Summary of Accounts of the Financial System, 2010–14 ______________________________________ 32

MONTENEGRO
INTERNATIONAL MONETARY FUND 3
4. Balance of Payments, 2010–19 ________________________________________________________________ 33
5a. Consolidated General Government Fiscal Operations, 2010–19 (In millions of euros) ________ 34
5b. Consolidated General Government Fiscal Operations, 2010–19 (In percent of GDP) _________ 35
5c. Consolidated General Government (In millions of euros, GFSM2001) ________________________ 36
5d. Consolidated General Government Fiscal Operations, 2010–19 (In percent of GDP,
GFSM2001) ______________________________________________________________________________________ 37
6. Financial Soundness Indicators of the Banking Sector, 2009–14 _______________________________ 38
APPENDICES
I. Public Debt Sustainability Analysis ____________________________________________________________ 39
II. External Debt Sustainability Analysis __________________________________________________________ 46

MONTENEGRO
4 INTERNATIONAL MONETARY FUND
CONTEXT
1. Montenegro’s economy is highly dependent on tourism and FDI. It is suffering from
relatively high public debt, unprofitable state companies, high levels of NPLs, and ongoing bank
deleveraging. It faces challenges from an aging population and low employment. It is euroized and
therefore lacks independent monetary policy, while flexibility is weak owing to a relatively rigid labor
market. During the past two years, the government has implemented significant fiscal consolidation
measures. But it has also committed to a highway investment project, of which the first phase is
budgeted to cost EUR 809 million (24 percent of 2013 GDP) (Box 1).1 In December 2010,
Montenegro received official candidate status for EU accession; negotiations are ongoing.
RECENT DEVELOPMENTS
2. Moderate growth is continuing. After contracting by 2½ percent in 2012, real GDP
rebounded by 3¼ percent last year, supported by increased hydro electricity production, growth in
tourism, and the commencement of several tourism-based investment projects. Preliminary data
indicates a sharp growth slowdown beginning in the second quarter of 2014. Construction activity
has decelerated, associated with delayed infrastructure projects (including the highway project).
Manufacturing production has contracted over the year to date, while electricity production has
slowed to more normal levels (Figure 1).
3. The nominal side of the economy is weak. The CPI decreased steadily in 2014 through
October, mainly because of low international energy and food prices and weak inflation pressures in
the euro area. Average net earnings have been broadly flat since 2011 and bank credit has
retrenched through the first three quarters of 2014.
1 In what follows, “highway” denotes the first stage only, unless otherwise stated, not the complete highway (which
has not yet been contracted or budgeted).
-10
-5
0
5
10
15
20
25
2009 2010 2011 2012 2013 2014
CPI inflation
Wages Monthly 1/
Wages (12-mth moving average) 1/
Wage and Price Inflation(in percent, yoy)
Sources: MONSTAT and staff estimates
1/ Excludes taxes and contributions.
-30
-20
-10
0
10
20
30
Jan-09 Jan-10 Jan-11 Jan-12 Jan-13 Jan-14
Private Credit
(Year-on-year percent change)
Total
Credit to households
Credit to enterprises

MONTENEGRO
INTERNATIONAL MONETARY FUND 5
Box 1. Montenegro’s Highway Project
The Bar-Boljare Highway is a project to connect Bar, Montenegro’s main seaport, to the border of Serbia.
The authorities see major economic and non-economic benefits arising from the project, including regional
development, trade, road safety, and national security.
The authorities selected China Road and Bridge Cooperation (CRBC) and China ExIm Bank as the main
partners for the first stage of the project, to link the capital city Podgorica with the northern municipality
Kolašin. The agreement signed with CRBC stipulates a construction period of four years and 30 percent of
the investment to be subcontracted to domestic companies. Construction was to start in 2014, but is now
expected to begin in the spring of 2015.
ExIm Bank will provide 85 percent of the financing (EUR 688 million) as a 20 year loan, denominated in
dollars, with a fixed 2 percent interest rate and a six-year grace period. The government will provide the
remaining 15 percent of the project’s financing, from revenue over-performance, cuts in non-highway capital
spending, and/or additional borrowing. The government also intends to rely on tolls once the highway is
completed.
4. Laudable fiscal adjustment was achieved in 2013, but public debt continues to increase
(Figure 2). Personal income tax (PIT) and value-added tax (VAT) rate hikes, a freeze on pensions,
efforts to increase tax compliance, and recovering economic activity contributed to a fiscal
adjustment of nearly 3 percent of GDP in 2013, despite large repayments of guarantees to the
aluminum producer KAP. This reduced the overall deficit to 3.3 percent of GDP and the primary
deficit to 1.1 percent (an overall balance of 0 and a primary surplus of 2.1 percent excluding the
repayment of loan guarantees). Nonetheless, public debt increased to 58 percent in 2013, double
the level of five years ago. Revenues in 2014 are expected to be higher than (conservatively)
budgeted; however, so are expenditures. Balances for the year as a whole will depend on
expenditure restraint in the last quarter.
5. Underlying vulnerability in external balances remains. The economy has a narrow
production base and very high import penetration—the trade imbalance was 40 percent of GDP in
2013. The current account deficit has widened in the first nine months of 2014 by 1.2 percent of
GDP, mainly as a result of a worsening income balance, which deteriorated by about 1¼ percent,
and transfers, which fell by ½ percent. The deterioration of the net exports of goods was more than
offset by net increases on the service side. Net FDI inflows, which historically cover about 70 percent
of the deficit, decreased by 7 percent in the first nine months of 2014.

MONTENEGRO
6 INTERNATIONAL MONETARY FUND
6. The effects of the weakening Russian economy on the Montenegrin economy are as
yet unclear. Russians comprise almost ¼ of total foreign tourists, yet tourist arrivals have increased
by 1¼ percent through 2013:Q3.2 However, capital inflows associated with real estate—the bulk of
which historically originate from Russia—have fallen by 11 percent in the first ten months of 2014.
OUTLOOK AND RISKS
7. Growth momentum has slowed, but is
expected to pick up over the medium term.
Growth is projected to be only 2 percent in 2014,
but converges to an underlying growth rate of
3¼ percent by 2019. The expenditures on the
highway add more to growth in the near term.3
Inflation pressures will likely remain negligible
given low international commodity prices and
subdued EU inflation. The current account is
expected to widen as the base effects of strong
electricity exports last year dissipate.
8. Montenegro faces a number of external and domestic risks (see Risk Assessment Matrix):
2 Tourist numbers were down in June and July, but recovered in August, suggesting the downturn might have had
more to do with poor weather.
3 The highway is assumed to add about 2 percentage points to GDP growth in 2015, with corresponding base effects
as work finishes in 2018. The increase reflects the assumed domestic value added from the extra spending on the
highway, with a small contemporaneous spillover to aggregate demand. As this first stage of the project does not
connect the coast to the Serbian border, and population density is low in the area of construction, significant effects
on potential growth are not assumed.
0
5
10
15
20
25
30
35
40
2009 2010 2011 2012 2013 2014F
Net FDI
CA Deficit
Current Account Deficit and FDI Flows(in percent of GDP)
Sources: MONSTAT and staff estimates
-30
-20
-10
0
10
20
30
40
50
60
70
2009 2010 2011 2012 2013 2014 2015 2016 2017 2018 2019
Net FDI Portfolio Investment
Other Unidentified Financing
Change in Reserves (+ is decrease) Errors and Omissions
Financial Account Current Account Deficit
Financing of Current Account Deficit(in percent of GDP)
Sources: CBCG and staff estimates
-3
-2
-1
0
1
2
3
4
5
2012 2013 2014 2015 2016 2017 2018 2019
Scenario without Highway Project
Scenario with Highway Project
Real GDP Growth (in percent)
Sources: MONSTAT and Staff projections.

MONTENEGRO
INTERNATIONAL MONETARY FUND 7
External risks are mainly to the downside:
Montenegro is vulnerable to a downturn in
external demand, especially from the euro area,
Russia, and Serbia, which exacerbate existing
competitiveness problems (see ¶30). Given
euroization, the economy is liable to import
“lowflation” from the euro area. Low oil prices
could lower inflation further, while also
improving external balances, lowering
production costs, and boosting real incomes.4
But they could also signal even weaker external
demand that could counteract terms of trade benefits. If very persistent, they could also drive
down electricity prices (on which Montenegro is highly dependent). Reliance on inward capital
flows, and substantial public financing needs (even in the absence of the highway project),
expose Montenegro to shifts in risk aversion and disruptions to global financial markets. Public
debt will increase substantially as a result of the highway spending, and could escalate
substantially in the event of negative growth shocks, and cost overruns on the highway could
generate higher financing needs (see also ¶14 and Appendix I). External private debt is also large
and projected to increase further, making the country vulnerable to growth and terms of trade
shocks (Appendix II).
There are upside and downside domestic risks: Growth could be substantially higher if some
large-scale investment projects start earlier than anticipated and their spillovers to the domestic
economy are greater. Conversely, delays to the highway and an undersea power connection with
Italy could undermine growth. Demands for higher pensions and public sector wages have so far
been resisted, but there is a risk that fiscal discipline could relax (¶14).
POLICY DISCUSSIONS
9. Major policy challenges include: (i) confronting significant risks to fiscal sustainability,
(ii) addressing the ongoing problems in the banking sector, and (iii) accelerating structural reforms
to boost growth potential and economic resilience.
4 Oil imports are substantial, at around 10 percent of total imports by value. Staff estimates that a persistent
25 percent reduction in oil prices would improve the current account deficit by about 2¼ percent of GDP relative to
the baseline projection. Energy accounts for 13 percent of the CPI basket.
0.0
0.5
1.0
1.5
2.0
2.5
3.0
3.5
2013 2014 2015 2016 2017 2018 2019
April 2014
Oct 2014
Average Real Growth Outlook of Major Trading Partners(in percent, weighted by 2013 export shares)
Sources: WEO, IMF Direction of Trade Statistics, and staff calculations

MONTENEGRO
8 INTERNATIONAL MONETARY FUND
A. Fiscal Policy: Safeguarding Debt Sustainability Amid Mounting Fiscal
Pressures
10. The draft 2015 budget shows spending restraint. Compared to the 2014 budget:
nominal (central government) non-highway capital spending is reduced by 23 percent (around
EUR 24 million, which would result in a 0.8 percentage point improvement in the overall
balance), with cuts focused on non-essential spending (e.g., sports centers rather than
infrastructure);
transfers for social protection fall as a share of GDP by 0.4 percentage points (0.3 percentage
points from the fall in pension and disability, 0.1 percentage points from redundancy payments),
though they increase in nominal levels; and there are increases in transfers to institutions,
individuals, NGOs and the public sector (0.1 percentage points), and reserves (0.1 percentage
points);
no new revenue measures are introduced, although the authorities intend to continue measures
against the informal economy.5 Planned VAT changes are revenue neutral, but an additional tax
bracket makes the system somewhat more complicated.6
Staff estimates that the expenditure measures would result in a 0.9 percent improvement in the
overall balance when excluding highway spending (and assuming revenues stay constant as a share
of non-highway GDP).7,8
11. However, the highway places a large burden on the public finances, more than
undoing the improvement in the fiscal balances over the past two years. Assuming that
revenue and non-highway expenditure policies in the 2015 budget are maintained through to 2019,
staff projects public debt to increase to around 69 percent of GDP in 2017, and to gradually decline
thereafter.9,10
The debt profile is particularly sensitive to the timing of expenditures—if highway
spending were to be more back-loaded, the peak debt ratio would not only be later but lower.
5 Tax revenues increased by 1ppt of GDP in 2013. The effects of administrative measures intended to reduce
informality, a VAT rate hike, and the post-crisis recovery are difficult to separate.
6 The current system has a standard 19 percent rate, a discounted 7 percent rate, and a full-exemption bracket. The
planned changes add two intermediate rates of 5 and 10 percent instead of the current 7 percent rate.
7 The highway will be exempt from VAT payments, fuel excise will apply at the lower rate, there will be no excises on
the import of machinery, and there is no requirement to pay PIT or contributions for foreign employees.
8 Note that rounding means that these numbers do not add up to the contribution of 0.9.
9 The profile of highway expenditures has not been finalized. Staff projections are based on the latest announced
schedule (EUR 206 million in 2015, EUR 253 million in 2016, EUR 303 million in 2017, and EUR 47 million in 2018).
10 In the absence of the highway, a primary surplus of 2.7 percent would have been expected from 2015; with the
highway, deficits of around 3 to 5 percent are incurred through 2015–2017.

MONTENEGRO
INTERNATIONAL MONETARY FUND 9
12. Medium-term funding needs are large. Substantial repayments of Eurobonds and
commercial bank loans to the state are due over the next five years, peaking at 8–9 percent of GDP
a year in 2015, 2016 and 2019. Demand for domestically-issued debt has been increasing, but
Montenegro will remain highly dependent on external funding. With the additional burden from
the highway, gross financing needs exceed 15 percent.
13. Important progress in divesting from state-owned industries has been made, but is
not yet complete. Consistent with Fund advice, the authorities have finished payments arising
from KAP guarantees (amounting to 0.8 and 3.2 percent of GDP in 2012 and 2013), and have sold
the loss-making aluminum producer, KAP, but privatization payments have not been fully
received.11
The state is still involved in a number of smaller companies that it has tried, as yet
unsuccessfully, to sell, and other guarantees amounting to almost 10 percent of GDP remain.
14. Hence, the public finances are subject to numerous risks:
Growth: Real GDP growth has historically been highly volatile, a particular concern for a
unilaterally euroized economy (Box 2). The accompanying DSA shows that debt would increase
to 86 percent of GDP following a one standard deviation shock to growth. The historical sample
includes the boom and bust; hence, the shock is large—4.9 percentage points—and arguably
not useful as a guide to likely future shocks. A 1ppt shock—as seen over the past year—would
increase debt to 72 percent of GDP.
11
Local company Uniprom signed a contract to buy KAP for EUR 28 million in June, and took over in July. However, it
received a two-month extension on payment at the time, and another six-month extension in September when it
paid EUR 4 million and provided a guarantee from BNP Paribas Bank for the remainder.
0
10
20
30
40
50
60
70
80
2014 2015 2016 2017 2018 2019
Public debt (% of GDP)
incl. highway
excl. highway
-6.0
-5.0
-4.0
-3.0
-2.0
-1.0
0.0
1.0
2.0
3.0
4.0
2014 2015 2016 2017 2018 2019
Projected primary balances (% of GDP)
incl. highway
excl. highway
Source: Montenegrian authorities and staff calculations.

MONTENEGRO
10 INTERNATIONAL MONETARY FUND
Box 2. Fiscal Policy in a Unilaterally Euroized Economy
Using another country’s currency provides for a strong monetary anchor and reduces administrative costs
associated with running an own currency. However, the arrangement puts a premium on disciplined fiscal
policies and flexibility to adjust to external shocks. With this in mind, some stylized facts of economies that
have unilaterally adopted another currency1 are notable:
First, Montenegro, along with other euroized and dollarized economies, has benefited from relatively
favorable interest rate-growth differentials. However, it has also experienced greater volatility of growth
rates. This is of particular concern as even brief, one-off growth shocks can erode much-needed fiscal
buffers and can have a lasting negative impact on debt sustainability.
Second, public revenues are more volatile in dollarized economies than in their non-dollarized peers.
Regression analysis suggests that primary balances have typically not responded to debt or economic
conditions in dollarized economies. As boom years were not used to build sufficient buffers, these countries
often had to resort to pro-cyclical cuts, for instance in reaction to difficulties in market access. Hence,
dollarized and euroized economies have faced large increases in debts since the crisis.
These economies differ greatly in many respects, so caution should be exercised when drawing inferences
about policy. Nonetheless, their experiences suggest that they should aim for larger fiscal buffers than their
emerging market peers. Fiscal policy should also become more responsive to the business cycle, in particular
by using boom years to create policy space.
___________________ 1 The countries in the “dollarized” sample include Montenegro, Kosovo, Ecuador, El Salvador and Panama.
“Floating EMs” includes Albania, Serbia, Argentina, Brazil, Chile, Colombia, Guatemala, Mexico, and Peru (for
the years for which they were classified as floating or free floating). “Western Balkans” includes Albania,
Bosnia and Herzegovina, Croatia, Kosovo, Macedonia, Montenegro, and Serbia.
0.0
1.0
2.0
3.0
4.0
5.0
6.0
mean standard deviation
Real interest rate (percent)
MNE
dollarized
floating EMs
Western Balkans
0.0
0.5
1.0
1.5
2.0
2.5
3.0
3.5
4.0
4.5
5.0
mean standard deviation
Real GDP growth (percent)
Source: World Economic Outlook.
Note: Averages over 2000-2013. The real interest rate is calculated from the effective nominal interest rate on gross government debt, deflat ed using the GDP deflator.
MONTENEGRO
INTERNATIONAL MONETARY FUND 11
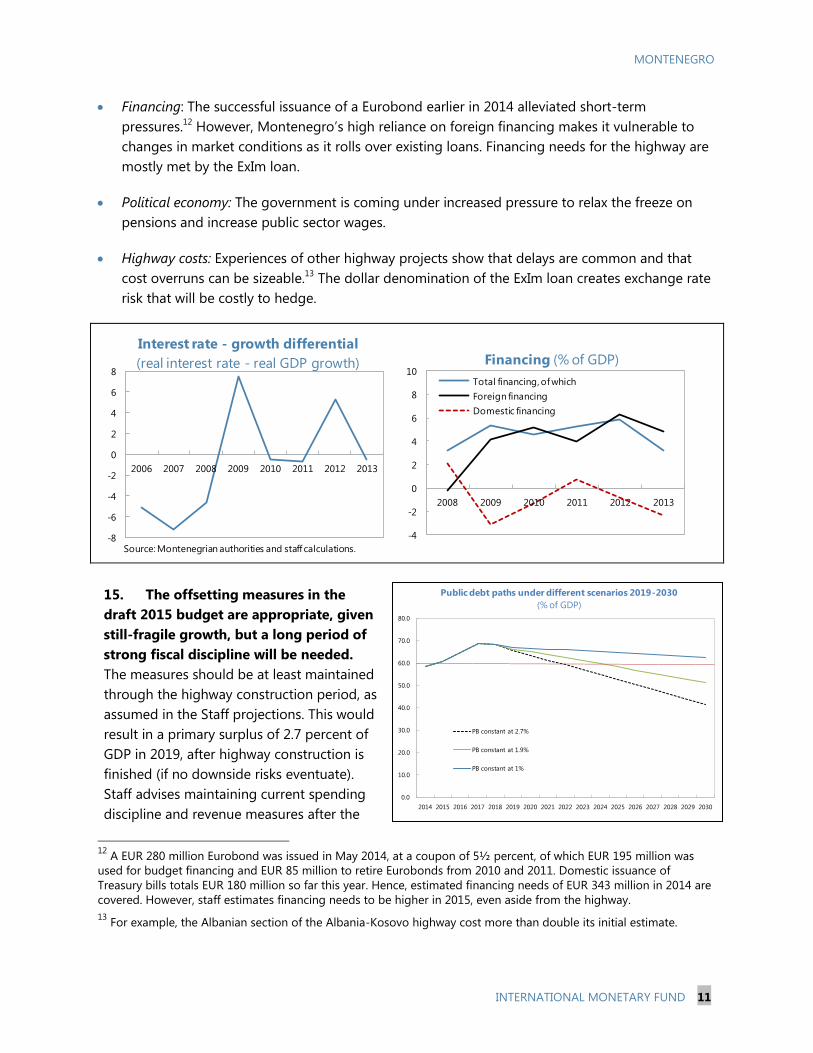
Financing: The successful issuance of a Eurobond earlier in 2014 alleviated short-term
pressures.12
However, Montenegro’s high reliance on foreign financing makes it vulnerable to
changes in market conditions as it rolls over existing loans. Financing needs for the highway are
mostly met by the ExIm loan.
Political economy: The government is coming under increased pressure to relax the freeze on
pensions and increase public sector wages.
Highway costs: Experiences of other highway projects show that delays are common and that
cost overruns can be sizeable.13
The dollar denomination of the ExIm loan creates exchange rate
risk that will be costly to hedge.
15. The offsetting measures in the
draft 2015 budget are appropriate, given
still-fragile growth, but a long period of
strong fiscal discipline will be needed.
The measures should be at least maintained
through the highway construction period, as
assumed in the Staff projections. This would
result in a primary surplus of 2.7 percent of
GDP in 2019, after highway construction is
finished (if no downside risks eventuate).
Staff advises maintaining current spending
discipline and revenue measures after the
12
A EUR 280 million Eurobond was issued in May 2014, at a coupon of 5½ percent, of which EUR 195 million was
used for budget financing and EUR 85 million to retire Eurobonds from 2010 and 2011. Domestic issuance of
Treasury bills totals EUR 180 million so far this year. Hence, estimated financing needs of EUR 343 million in 2014 are
covered. However, staff estimates financing needs to be higher in 2015, even aside from the highway.
13 For example, the Albanian section of the Albania-Kosovo highway cost more than double its initial estimate.
-4
-2
0
2
4
6
8
10
2008 2009 2010 2011 2012 2013
Financing (% of GDP)
Total financing, of which
Foreign financing
Domestic financing
-8
-6
-4
-2
0
2
4
6
8
2006 2007 2008 2009 2010 2011 2012 2013
Interest rate - growth differential
(real interest rate - real GDP growth)
Source: Montenegrian authorities and staff calculations.
0.0
10.0
20.0
30.0
40.0
50.0
60.0
70.0
80.0
2014 2015 2016 2017 2018 2019 2020 2021 2022 2023 2024 2025 2026 2027 2028 2029 2030
PB constant at 2.7%
PB constant at 1.9%
PB constant at 1%
Public debt paths under different scenarios 2019-2030
(% of GDP)

MONTENEGRO
12 INTERNATIONAL MONETARY FUND
highway spending ends, while restoring the non-highway capital budget, to allow for other
essential infrastructure projects. This would imply a surplus of 1.9 percent of GDP, to reduce debt
below 60 percent within ten years.
16. To reduce risks and improve funding conditions, the authorities should lay out long-
term fiscal plans. A credible and reliable consolidation requires fundamental expenditure reform,
especially of the pension system, which is persistently underfunded, and the public sector wage bill,
which is high by regional standards (Figure 3). Elements of a long-term plan would include:
Further pension reform, to show how pension costs can be contained over the near term.14
Further cuts in the public sector wage bill (including through rationalizing employment), which
would also reduce the relative reservation wage and help improve competitiveness.
Identification of and budgeting for essential non-highway capital budget items.15
17. Staff does not favor substantial and permanent increases in taxes, but there is
potential to raise VAT revenues in the near term. Revenues are relatively high for the region, a
low PIT rate is appropriate to avoid further disincentives to formalization, and a much higher CIT
rate risks deterring investment. However, there is potential to raise more revenues from VAT, for
instance by eliminating exemptions, and unifying rates, which could increase compliance and
yields.16
14
The 2011 pension reform increases the pensionable age to 67 only by 2025 for men and 2041 for women.
15 Key needs include infrastructure to support the sustainable development of the tourism sector and investment in
the energy sector, as losses in energy distribution are significant.
16 The current top rate of 19 percent is lower than many peers, and exemptions bring the average effective rate to
12–13 percent.

MONTENEGRO
INTERNATIONAL MONETARY FUND 13
18. Additional measures would be needed in the near term if risks eventuate. The
authorities should also lay out additional consolidation plans that would be applied in the event of
unanticipated shocks to growth or refinancing and highway costs. The first recourse should be to
cut or delay spending on the highway.
19. The fiscal framework should be bolstered. A fiscal rule was approved in April to embrace
the Maastricht 3 percent of GDP deficit and 60 percent of GDP debt limits. Enforcement is,
however, weak: there are no automatic spending caps, no deadlines for implementing fiscal
measures, and the exception for “strategically important projects” undermines its credibility.17
The
authorities should also strengthen controls in the broader public sector and refrain from providing
more support to enterprises, whether direct or indirect.
Authorities’ views
20. The authorities acknowledged the risks to the public finances from the new highway
and aim to manage them through a combination of revenue gains and expenditure restraint.
17
If the deficit or debt exceed the 3 and 60 percent, respectively, the government has to submit a proposal of
corrective measures to the parliament within 60 days, but there is no deadline by which the deficit/debt has to be
below the limit again.
4%
13%
5%11%
4%
11%
Main revenue sources (as % of GDP)
PIT
VAT
Excises
Social security
Non-tax
Other
11%
4%
2%
15%
4%
3%
1%
13%
Main expenditures (as % of GDP)
Gross salaries
Goods and services
Interest payments
Social security
Other transfers
Capital expenditures
Subsidies
Other
0
10
20
30
40
50
60Revenue (% of GDP)
2007 2013
0
2
4
6
8
10
12
14Compensation of employees (% of GDP)
2007 2013
Note: Data refer to 2013.
Source: World Economic Outlook, Montenegrian authorities and staff calculations.

MONTENEGRO
14 INTERNATIONAL MONETARY FUND
The authorities pointed to conservative revenue estimates in their budgets, and further gains
from on-going efforts to address informality (mainly through administrative measures, such as
changing the criminal code to treat the payment of wages without corresponding payment of
taxes and contributions by employers as a criminal offense, and similarly, treating the payment
of wages in cash as a criminal offense).
They pointed to the strong demand for the Eurobond issuance in May 2014 (which was heavily
oversubscribed), and saw good prospects for continued market access at favorable terms.
The authorities expect large growth benefits from the highway to tourism, transport, trade and
regional development, which in turn would boost social cohesion. They consider the highway
loan’s terms to be very attractive, despite the exchange rate risk. The authorities hope to raise
toll revenues of EUR 17 million (0.4 percent of projected 2018 GDP) per year on completion of
the highway in 2018, increasing to EUR 60 million in 2047, based on expectations of high traffic
flows.
B. Monetary and Financial Sector Policies: Strengthening Credit Conditions
21. Financial conditions remain tight.
Lending rates remain high and have increased in
real terms. Interest rate spreads are around
7½ percentage points, near their historical peak,
despite deposit rates falling to around 2 percent.
Notwithstanding a modest increase in lending to
households, overall credit contracted by
3 percent (yoy) through October.
22. The picture for banks’ health is mixed
(Figure 4):
Banks’ capitalization has improved, although it is relatively low compared to those in the rest of
Eastern Europe.18
In terms of funding, deposits continue to grow, and liquidity appears sufficient, at 30 percent of
short-term assets. On average, banks have reduced the ratio of loans to deposits since the crisis
to a more sensible 100 percent, although this figure conceals wide heterogeneity across banks.
18
Banks calculate regulatory capital based on Basel 1.
600
620
640
660
680
700
720
740
760
780
2011 2012 2013 2014
Deposit to Lending Rate Spread(Basis points)
Sources: Central Bank of Montenegro and Fund staff calculations.

MONTENEGRO
INTERNATIONAL MONETARY FUND 15
Asset quality remains a problem. Over the
course of 2011–12, some EUR 600 million in
NPLs were shifted to the balance sheets of
factoring companies. A change in
classification at the end of 2012 further
reduced reported NPLs, but the level remains
high at 17 percent of total loans for the
banking system as a whole. Banks with high
levels of NPLs are naturally more risk averse
and hesitant to lend and/or charge high
effective lending rates
23. Regulatory provisions exceed the required levels under IFRS accounting standards but
do not necessarily lead to losses being recognized. System-wide regulatory provisioning is
68 percent. The regulatory environment is reinforced by annual onsite reviews, coupled with stress
tests. However, regulatory provision levels exhibit a wide range across banks, from 33 percent to
85 percent. Given that banks in Montenegro have very similar business models and have
experienced the same lending environment, this raises questions about whether all banks follow
classification rules properly (e.g., whether they have been “evergreening” loans). Further, banks
report significantly lower levels of provisioning in their IFRS financial statements than under the
regulatory provisioning rules, which might reflect overly optimistic collateral valuations used to
offset loan impairment. Hence, banks might be understating losses implied by regulatory
provisions in their income statements and avoiding writing off bad loans.
24. Greater transparency, simplicity, and oversight could bring useful benefits.
Reporting: Currently, Montenegro misses potential benefits from its relatively strict regulatory
provisioning environment, as the provisions are not reported publicly (only the provisions per
IFRS standard are published). Quarterly Reports on banks are prepared but not published. Nor
does there appear to be a published policy on collateral valuations. An enhanced reporting
regime could expose problems and increase incentives to resolve bad loans. External asset
quality reviews could be considered as an independent assessment of banks’ financial health
and a means for boosting confidence.
Regulatory classifications: The regulations specify seven categories of loan performance for
provisioning purposes, but data on the values of loans in the “B1” and “B2” and “C1” and “C2”
subcategories are not available. Simplifying to five categories (A, B, C, D, and E) would make
corroboration easier, and greater automaticity of classifications might prevent evergreening
practices.
Oversight of factoring companies: The supervisor lacks any oversight over factoring companies,
which further reduces the transparency of the financial system as around EUR 600 million have
been effectively transferred out of the oversight of regulators but remain in the system. Staff
urged progress on the draft law on factoring companies, which should grant the supervisor
0
5
10
15
20
25
30
2007 2008 2009 2010 2011 2012 2013 2014
Nonperforming Loans(Percent of gross loans)
Sources: CBCG and Fund staff calculations.

MONTENEGRO
16 INTERNATIONAL MONETARY FUND
powers of direction over the use of factoring companies and create transparent and verifiable
standards for recording assets held by such vehicles.
25. The authorities are considering a number of measures:
The authorities have tabled a law before parliament on voluntary restructuring—the “Podgorica
Approach”—that aims to encourage out-of-court workouts to resolve impaired loans. The
approach is potentially useful for solvent firms with temporary cash flow or liquidity problems.
In response to what the authorities perceive as lack of competition in lending rates, new bank
licenses have been approved, bringing their number to 12, and the authorities have indicated a
willingness to grant more.19
26. Policies are needed to address credit risk. Staff analysis suggests that lending spreads
reflect structural lending risk premia, which commends reform of legal processes and enforcement.
The Montenegrin banking system does not show typical signs of lack of competition: the
number of banks is high, and profitability is relatively weak. Widening spreads could reflect the
wish to rebuild profitability. Going forward, lending spreads could remain high to cover lending
risks arising from difficulties in reliable credit information, securing collateral, and inconsistent
application of regulations (e.g., tax administration) (Box 3).20
The recent introduction of dedicated public enforcement officers could facilitate the resolution
of some claims, but further progress will depend on more timely court decisions, with penalties
for delays, and improved administration.
27. Reserve assets appear adequate. Montenegro is euroized. Hence, traditional reserve
metrics normally applied to countries with fixed exchange rate regimes—such as the coverage of a
certain number of months of imports or a percentage of short-term external debt—are not very
useful. As an economy without lending of last resort operations, a better metric is to look at
reserves as a ratio to deposits. On these terms, Montenegro ranks fairly well against other
dollarized or euroized economies, and the ratio has been broadly stable.
19
The authorities also discussed lending rate caps as a measure to boost credit growth but have opted not to pursue
such measures, which would risk reducing credit availability to newer and smaller enterprises.
20 Although net lending has been contracting, household lending has been expanding, which might be due in part to
lower lending risk: the law allows creditors to directly garnish wages for past due debts.

MONTENEGRO
INTERNATIONAL MONETARY FUND 17
Box 3. Interest Rate Spreads
High lending spreads over funding rates could be explained by large operational costs, weak
profitability, and high credit risk, the last in turn reflecting structural factors such as institutions,
legal frameworks, and the rule of law and its outcomes. To look at which of these could be
significant for Montenegro, lending spreads in a sample of central and eastern European
economies are correlated with a range of indicators.1
For example, nominal GDP—a proxy for economies of scale—is inversely and significantly
correlated with lending spreads, suggesting that smaller economies might face inherently higher
borrowing costs. (However, spreads are uncorrelated with the level of bank concentration.)
Contract enforcement is cited as a key risk to
lending by banks in Montenegro. Likewise, the
data indicate that structural factors are likely
to be important for credit risk. For example,
lending spreads are positively and significantly
correlated with the number of procedures to
enforce a contract. Similarly, higher recovery
rates are associated with a significantly lower
price of lending. Lending spreads are also
positively correlated with the average time
needed to enforce a contract and the cost of
enforcing a contract, while measures of the
strength of investor protection are negatively correlated, indicating that a higher level of
protection would generally be associated with lower markups. However, given the small sample
for which data are available, these latter correlations are not significant at conventional levels.
The results suggest that policy measures that address the time and cost of securing collateral and
the predictability of legal outcomes would help lower borrowing costs. Such reforms will have
long run effects in lowering the structural risk premia being paid by borrowers.
_____________ 1
The sample of countries includes Albania, Bosnia and Herzegovina, Bulgaria, Croatia, Hungary, Kosovo, Latvia,
Moldova, Montenegro, Romania, and Serbia. All measures are from the World Bank’s Doing Business survey.
ALB
BIHBRG HRV
HUN
KOS
LVA
MDA
MNE
ROM
SRB
20
25
30
35
40
45
50
55
3 4 5 6 7 8 9 10
Deposit Spread
Deposit Spread and DB Procedures to Enforce Contracts(X-axis: Percentage points; Y-axis: Number of procedures)

MONTENEGRO
18 INTERNATIONAL MONETARY FUND
28. The authorities have undertaken measures to increase oversight of AML/CFT issues.
Banks are responsible for identifying politically exposed persons and beneficial owners. In practice,
there are problems with data issues, owners of foreign firms can be difficult to trace, and banks
might be reluctant to jeopardize relations with clients. The authorities are thus encouraged to
closely monitor the implementation of risk management systems that identify politically exposed
persons and ultimate beneficial ownership. A new law in 2014 shifted the responsibility for initiating
violation procedures to the central bank. However, fines appear low, being limited by law to
EUR 25,000.
Authorities’ views
29. The authorities regard the large stock of NPLs and high prevailing interest rates as key
policy challenges. They expressed confidence that the set of policy initiatives underway hold the
potential to make progress in both these areas. In particular, the authorities indicated that:
The draft law on restructuring will help align incentives and facilitate a substantial reduction in
NPL levels. The authorities also indicated that a law granting the supervisor oversight of
factoring companies was imperative to enhance transparency and the smooth functioning of the
financial system.
Ensuring adequate competition in the banking sector is essential, as lending premiums reflect a
broader market failure.
The recent introduction of public enforcement officers marks an important step to strengthen
contract enforcement, but it is pre-mature to assess the effectiveness of the program at this
stage.
There is scope to increase penalties banks face for breaches of AML/CFT regulations, and the
authorities are currently reconsidering the laws governing the limit on bank penalties.
0
2
4
6
8
10
12
14
16
18
MNE UVK ECU 1/ SLV PAN TLS
Gross Reserve Holdings of Dollarized/Euroized Economies(2013, in percent of GDP)
1/ Net reserves.
Sources: WEO, Staff Reports, and staff estimates.
0
5
10
15
20
25
2007 2008 2009 2010 2011 2012 2013
Percent of bank deposits
Percent of nominal GDP
Gross International Reserves
Sources: CBCG, Haver Analytics, IFS, and staff calculations

MONTENEGRO
INTERNATIONAL MONETARY FUND 19
C. Structural Reform: Strengthening Economic Resilience and
Reinvigorating Growth
30. Potential growth and competitiveness are concerns (Box 4):
Montenegro has historically relied on
deepening capital and labor intensity to
achieve high growth, while productivity
growth has been relatively muted.
Population, however, is expected to decline,
implying that labor participation and
employment will need to increase from
their current low levels of 53½ and
43½ percent.
Recent low nominal wage growth has
lowered unit labor costs, but not in relation
to peers. In recent years, wages have
outpaced producer prices.
-2
0
2
4
6
8
10
12
14
16
18
NMS Balkans BIH HRV MNE MKD ALB SRB
Wage growth (euro)
Productivity growth (euro, minus = increase)
ULC growth (euro)
Balkans: Contribution to ULC, 2008-13(Year-on-year percent change)
Sources: WEO; Haver; and IMF staff calculations.
0
50
100
150
200
250
2005 2006 2007 2008 2009 2010 2011 2012 2013
Producer Prices (2005=100)
Average Gross Monthly Earnings
MNE - Gross Wage and Producer Price Differential(Index: 2005=100, and Euros)
Sources: Monstat and staff estimates.
-10
-5
0
5
10
15
20
2001 2003 2005 2007 2009 2011 2013
Labor
Capital
TFP
Real GDP Growth
Growth Accounting(Percent change, yoy)
Sources: Montenegrin authorities and staff calculations.

MONTENEGRO
20 INTERNATIONAL MONETARY FUND
Box 4. External Competitiveness
Indicators of Montenegro’s competitiveness are mixed. The CPI-REER has been roughly stable
relative to regional comparators, largely reflecting a modestly appreciating euro balanced by weak
price pressures. Wage growth has moderated substantially, but unit labor costs remain relatively
high, potentially pointing to competitiveness issues. Although Montenegro’s share in world trade
improved a little in 2013, the share is substantially lower than in previous years.
Staff analysis using the Macroeconomic Balance and External Sustainability approaches indicates
the current account balance is around 9–11 percentage points below its norm, possibly pointing
to weak cost competitiveness. However, data uncertainties (related to errors and omissions in the
balance of payments, which amount to about 7½ percent of GDP), the short length of the time
series, and the volatility associated with small countries make point estimates from a CGER-type
analysis highly imprecise.1
Staff’s preferred metric is to look at relative unit labor costs, which in Montenegro are slightly
above the average for the Western Balkans, which in turn is above the level of New Member
States. In the absence of an independent currency, this suggests ongoing wage restraint and/or a
boost to productivity will be required to restore competitiveness.
80
85
90
95
100
105
110
115
120
2008 2009 2010 2011 2012 2013
Balkan Average ALB BIH
HRV UVK MKD
MNE SRB
Real Effective Exchange Rate(Index 2008=100)
Sources: INS and staff calculations
0
0.005
0.01
0.015
0.02
0.025
0.000
0.001
0.001
0.002
0.002
0.003
0.003
0.004
0.004
0.005
0.005
2006 2007 2008 2009 2010 2011 2012 2013
Export Import
Sources: DoT Database and staff calculation
Montenegro: Importance in World Trade(percent of total world trade)
Macroeconomic
Balance
Approach
External
Sustainability
Approach
CA Norm 1/ -7.0 NA
NFA-stabilizing CA NA -5.6
CA Balance -16.2 -16.2
Gap 9.2 10.7
Source: IMF staff estimates
Current Account Balance Gap:
Macrobalances and External Sustainability Approaches
(in percent of GDP, unless otherwise specified)
1/ Vitek, Francis (2014), "Exchange Rate Assessment Tools for
Advanced, Emerging, and Developing Economies.'
204.6194.8
146.9
121.8
144.1
323.7
189.3
0
50
100
150
200
250
300
350MNE ALB
BIH HRV
MKD SRB
Balkan Average
Real Unit Labor Costs, 2013(Index 2005=100 Euros)
Sources: WEO; Haver; and IMF staff calculations.

MONTENEGRO
INTERNATIONAL MONETARY FUND 21
2011 2013 2011 2013 2011 2013 2011 2013
Spain 8 4 22 14 10 5 6 6
Cyprus 24 29 23 22 14 21 44 46
Greece 29 32 34 39 29 33 29 30
Italy 27 26 45 50 27 29 15 14
Malta 26 24 9 15 22 14 54 49
Croatia 34 35 42 42 36 39 43 42
Slovenia 33 36 29 33 33 35 53 52
Slovakia 54 54 39 43 57 60 52 55
Bulgaria 48 50 54 58 44 45 51 53
Montenegro 36 40 32 34 49 50 36 47
Turkey 50 46 66 64 55 52 28 27
Romania 63 68 51 66 66 68 66 73
Serbia 82 89 67 74 84 81 94 109
Albania 71 77 53 63 91 90 61 63
Source: World Economic Forum.
Note: A rise in the ranking indicates improvement.
The overall competitiveness ranking in tourism has been improving
Overall
ranking
Regulatory
framework
Business
environment and
infrastructure
Human, cultural,
and natural
resources
Box 4. External Competitiveness (continued)
Montenegro generally ranks well on business
indicators compared with regional peers.
Nonetheless, reforms to improve competitiveness
remain important. For example, continued
external stability will hinge on sustained tourism
development and attracting diversified FDI flows.
Priorities in this area include improving
infrastructure, enhancing the quality of services,
and reducing administrative burdens that could
undermine future diversified investment
opportunities.
_____________ 1 A significant share of the current account balance is
related to imports funded by FDI, reflecting large investment needs, especially for large-scale infrastructure
projects; conversely, in a small economy such as Montenegro, a surge in investment-related imports can result in
large swings to the current account balance.
31. Improving the functioning of the labor market is crucial. The labor market does not
appear efficient at allocating labor: unemployment rates are persistently high—registered
unemployment is around 18½ percent (youth unemployment 32½ percent) of which 91 percent is
long-term—while seasonal and low-paid employment is mostly provided by foreign workers. The
system appears rigid: a multi-tiered collective bargaining process applies a standard wage across
sectors. This includes public and private employment, which adds to the importance of public sector
wage setting for competitiveness. Further, non-wage costs are relatively high. Although the law
provides specific criteria for dismissal, in practice the burden of proof is placed on employers, and
outcomes are frequently over-turned by the courts. Hence, the risk premium for employment is
high. Private sector employers appear to respond by placing new workers on short-term contracts
and avoiding extending employment,21
which prevents development of human capital and inhibits
productivity.
32. The authorities have responded with a mix of structural reform initiatives and
temporary government-funded hiring programs. Substantial labor market reform was
undertaken in 2011. Lay-off costs were reduced, by restricting severance packages to “in-firm” as
opposed to “lifetime” years of service, thus reducing an important disincentive to hiring. Fixed-term
contracts were limited to a maximum of 24 months, which effectively tightened employment
21
Redundancy costs amount to 6½ weeks of salary after 5 years of continuous employment and increase to
13 weeks of salary after 10 years. This puts Montenegro’s ranking at around 73 out of 187 countries in terms of
redundancy costs (with 1 being least costly) according to World Bank indicators.

MONTENEGRO
22 INTERNATIONAL MONETARY FUND
protections. Despite these changes, unemployment remains high and labor participation low. In
recent years, the authorities have favored selective subsidy programs to boost employment, such as
financial incentives to hire “hard-to-employ” individuals and youths and a temporary (9-month)
government-sponsored internship program for recent university graduates. The effectiveness of
these programs, however, is not clear: youth unemployment has only decreased modestly since the
introduction of the internship program, and anecdotal information suggests that employers tend to
hire only around 10 percent of participating interns.
33. Social benefits are not the primary driver of labor informality. Although there is
potential scope to lower the opportunity costs of formal employment for people eligible for social
assistance (e.g., by shifting to a gradual withdrawal of benefits and/or earned income tax credits),
social benefits are not generally seen as a key source of labor market distortions.22
The authorities
plan to implement a “social card” system by the end of 2014, which will consolidate all benefits in a
single system. Staff welcomed this initiative, which is expected to significantly increase transparency
and deter fraudulent claims.
34. But the efficiency of the labor market will need to increase. Flexibility in wage
bargaining should be encouraged to allow wages to evolve with productivity. Measures are likely
needed to reduce informal employment incentives, such as onerous dismissal procedures. Subsidy
schemes constitute “stop-gap” measures.23
Outcome-oriented active labor market schemes, such as
where financial incentives are linked in some fashion to improved labor outcomes, are therefore
preferable.
35. Concentration is also a problem. Montenegro lacks domestic economies of scale, and the
lack of diversification makes it vulnerable to external shocks. Infrastructure failings—such as the
dependence on seasonal energy, and
inefficiencies in utilities—are likely holding back
development. Diversification might be held back
by investment bottlenecks, notably delays in
registering property and weaknesses in enforcing
contracts (which are areas in which Montenegro
ranks relatively poorly). The quality of the overall
macroeconomic environment is also cited as
problematic, which places a premium on policy
discipline and reforms to improve cost
competitiveness and economic flexibility.
22
Kovtun D, et. al, Boosting Job Growth in the Western Balkans (IMF Working Paper, WP/14/16).
23 Staff estimates the fiscal cost of the internship program at about 0.3 percent of GDP.
3.96
3.0
3.5
4.0
4.5
5.0
5.5
6.0
6.5
7.0
2013-14
Balkan CEE Baltics EU Montenegro
Quality of Macroeconomic Environment by Region(scale of 1-7, higher score indicates better rating)
Sources: WEF Competitiveness Indicators and Staff calculations.

MONTENEGRO
INTERNATIONAL MONETARY FUND 23
36. There is scope to further address structural impediments to investment. Staff
encourages efforts to further: i) rationalize and ensure the consistent application of regulations;
ii) facilitate property registration and streamline administrative procedures; iii) improve the
efficiency of the judicial system, particularly as regards collateral enforcement, and, iv) clamp down
on unregulated and informal businesses that hinder high-quality investments and fiscal revenue
intake, and v) fight corruption.
Authorities’ views
37. Efforts are underway to formulate a strategy to combat labor informality and increase
the transparency of the social benefit system. The authorities consider that the multi-tier
collective bargaining framework is well-understood and sufficiently flexible to avoid distortionary
labor market outcomes. They see ongoing merit in targeted employment programs, such as the
internship scheme which is a key initiative to bridge skills mismatch. A study of the underlying
causes of the informal economy is underway (to be completed by July 2015) and is regarded as a
pre-requisite to developing a broader policy strategy to improve labor market outcomes.
38. Initiatives to further improve the business environment are moving forward. The
authorities see FDI as critical to boosting long-term growth and promoting economic diversification,
particularly in tourism and energy. The government has recently introduced important business
environment improvements, notably establishing a one-stop shop for construction permits, strict
time limits for the issuance of approvals, and a decrease in procedures required for obtaining a
permit. In addition, nearly 60 percent of recommendations endorsed in a 2013 Action Plan to
improve the regulatory environment have been implemented; full implementation is expected by
end-2015. Amendments to the Law on Enforcement and Security are also being considered to
improve the enforcement of claims.
STAFF APPRAISAL
39. Montenegro is continuing its economic transition but confronts policy challenges
associated with a rising public debt burden and the fallout of the lending boom. The economy
is relatively undiversified and relies heavily on external financing. The rapid rise in public debt has
increased vulnerabilities and the large stock of bad loans has likely constrained lending. The
highway project should provide a short-term boost to economic activity but exacerbates debt-
related vulnerabilities.
40. Growth is expected to pick up, but risks weigh on the downside. Growth is projected to
increase to 4½ next year as the highway project gets underway. But Montenegro is vulnerable to a
downturn in external demand, especially from the euro area and Russia, and substantial financing
needs expose the country to shifts in risk aversion and disruptions to global financial markets.
MONTENEGRO
24 INTERNATIONAL MONETARY FUND
41. Sustained fiscal restraint over the medium-term will be needed, with an emphasis on
fundamental expenditure reform. The authorities have undertaken bold fiscal adjustment over the
past two years that constitutes an important step to addressing imbalances. These efforts, along
with a recovery in economic activity, helped deliver fiscal adjustment of nearly 3 percent of GDP in
2013. The authorities are to be commended for ceasing repayments of guarantees to the aluminum
producer, KAP, and addressing longstanding issues at KAP that have facilitated its sale. A timely
completion of the KAP transaction would be welcome. The measures in the draft 2015 budget that
partly offset the impact of the highway on the deficit are welcome, as are the authorities’ efforts to
restrain the public sector wage bill. Going forward, laying out clear long-term plans for managing
the public finances would boost credibility and reduce risks to market access. Fundamental
expenditure reform, especially of the pension system and the public sector wage bill, would be an
essential part of such plans. In addition, the authorities should define contingency measures to
address unforeseen fiscal shocks, with the first recourse being a delay or cut in highway spending.
Efforts should continue to reduce support, directly or indirectly, to risky and/or loss-making
state-owned enterprises.
42. Addressing NPLs and improving credit conditions are priorities. The “Podgorica
Approach” has the potential to facilitate debt workouts. This effort should be complemented by
reforms to address problems with contract enforcement and securing collateral that have impeded
timely NPL resolution and likely contribute to high interest rate margins. Although provisioning
coverage for the banking system as a whole appears sizable on a regulatory basis, the wide variation
across banks may warrant enhanced supervisory scrutiny. There is scope to improve regulatory
transparency, including by publishing quarterly banking reports with information on the level of
regulatory provisions and a summary of all stress test results.
43. Structural reforms are essential to raise potential growth and improve flexibility and
competitiveness. Measures to ensure that wages adjust in line with productivity developments and
to reduce disincentives for employment (such as onerous dismissal procedures) would improve
labor market outcomes. Sustaining recent policy momentum to strengthen the business
environment and spur investment is also critical. Priorities include simplifying the regulatory
environment, eliminating burdensome administrative procedures, improving the efficiency of the
judicial system, and combating economic informality, including by effectively implementing the
AML/CFT regime.
44. It is expected that the next Article IV consultation with Montenegro be held on the standard
12-month cycle.

MONTENEGRO
INTERNATIONAL MONETARY FUND 25
Figure 1. Montenegro: Real Sector Developments
A modest increase in tourism receipts is expected but…
…production is faltering. The unresolved privatization of KAP has
contributed to slow metals production…
…and a return to normal rain patterns has decreased electricity
output.
Overall industrial indicators point to a decrease in economic
activity in 2014...
…despite indications of a modest pick-up in private
consumption.
However, growth momentum is expected to pick-up next year as
delayed infrastructure projects get underway.
-40
-20
0
20
40
60
80
100
120
2008 2009 2010 2011 2012 2013 2014
Travel Income
(Year-on-year percent change)
600
1000
1400
1800
2200
-150
-50
50
150
250
2008 2009 2010 2011 2012 2013 2014
Metals Production
(Year-on-year percent change)
Production from mining and quarrying (left axis)
Aluminum price (right axis, Euro/ton)
-100
-50
0
50
100
150
200
250
300
350
2008 2009 2010 2011 2012 2013 2014
Electricity Production
(Year-on-year percent change)
-60
-40
-20
0
20
40
60
2008 2009 2010 2011 2012 2013 2014
Industrial Production
(Year-on-year percent change)
0
5
10
15
20
25
30
35
2011 2012 2013 2014
Retail Trade
(Year-on-year percent change)
-40
-20
0
20
40
60
80
2008 2009 2010 2011 2012 2013 2014
Construction Activity
(Year-on-year percent change)

MONTENEGRO
26 INTERNATIONAL MONETARY FUND
Figure 2. Montenegro: Fiscal Developments
-8
-6
-4
-2
0
2
4
6
8
10
2008 2009 2010 2011 2012 2013 2014f
Fiscal Balance
(Percent of GDP)
0
1
2
3
0
10
20
30
40
50
60
70
80
2008 2009 2010 2011 2012 2013 2014f
Public Debt
(Percent of GDP)
Public debt (lhs)
Public guarantees (lhs)
Interest payments (rhs)
0
10
20
30
40
50
60
2008 2009 2010 2011 2012 2013 2014f
Fiscal Revenue
(Percent of GDP)
0
10
20
30
40
50
60
2008 2009 2010 2011 2012 2013 2014f
Fiscal Expenditure
(Percent of GDP)
Capital expenditure
Current expenditure
0.0
0.5
1.0
1.5
2.0
2.5
3.0
3.5
4.0
2008 2009 2010 2011 2012 2013 2014f
Interest Expenditure
(Percent of GDP)
MNE BiH MKD
HRV SRB
-60
-40
-20
0
20
40
60
80
2008 2009 2010 2011 2012 2013 2014
VAT receipts
(Percent change, y/y)
Tax revenues have recovered modestly given recent tax reforms.VAT receipts increased in 2013, but have fallen off in 2014,
consistent with weakening growth.
Tax rate hikes and a pension freeze... ...resulted in a reduction of the fiscal deficit.
However, public debt has continued to increase... ...as have interest payments.

MONTENEGRO
INTERNATIONAL MONETARY FUND 27
Figure 3. Montenegro: Pension Expenditures
52
53
54
55
56
57
58
59
60
0
100
200
300
400
500
600
2006 2007 2008 2009 2010 2011 2012 2013
Average pension (EUR)
Average wage (EUR)
Avg pension/avg wage (rhs)
...driven by increasing pensions...
1.45
1.50
1.55
1.60
1.65
1.70
1.75
1.80
2006 2007 2008 2009 2010 2011 2012 2013
Dependency ratio (employees/retirees)
...further worsening an already very low dependency ratio.
0
10,000
20,000
30,000
40,000
50,000
60,000
2009 2010 2011 2012 2013
Old age pensions
Disability pensions
Family pensions
...and a rising number of pensioners...
0
2
4
6
8
10
12
14
16
18
20
PA
KID
NIN
DTH
AM
EX
KO
RPH
LZA
FSA
UM
YS
ISL
CH
NEG
YJO
RA
US
CA
NC
HL
NZL
TU
RU
SA
NLD
GBR
NO
RA
RG
SV
KLU
XIR
LD
NK
BG
RC
HE
LTU
RU
SBR
ASW
ELV
AR
OM
CZE
JPN
ESP
BEL
DEU
SV
NH
UN
PO
LM
NE
FIN
PR
TSR
BG
RC
FRA
EST
AU
TIT
AU
KR
Pension expenditure is very high by international comparison.
Advanced economies (avg)
Emerging economies (avg)
-12
-10
-8
-6
-4
-2
0
2
4
6
8
10
12
14
2006 2007 2008 2009 2010 2011 2012 2013
Contributions (% of GDP)
Expenditures (% of GDP)
Balance
Pension expenditures have increased much faster than contributions...
0
50
100
150
200
250
300
350
400
450
2006 2007 2008 2009 2010 2011 2012 2013
Mill
ion
s
PIO contributions
PIO expenditures
...contributions have however been largely flat...
0
5
10
15
20
25
30
2006 2007 2008 2009 2010 2011 2012 2013
PIO expenditures as a share of public spending
PIO expenditures as a share of GDP
Pension expenditures have increased as a share of total spending, as well as GDP...
0
10
20
30
40
50
60
70
80
90
2006 2007 2008 2009 2010 2011 2012 2013
Ratio of contributions to expenditures
...resulting in persistent and increasing underfinancingof pension expenditures from contributions.
Pension expenditures
MONTENEGRO
28 INTERNATIONAL MONETARY FUND
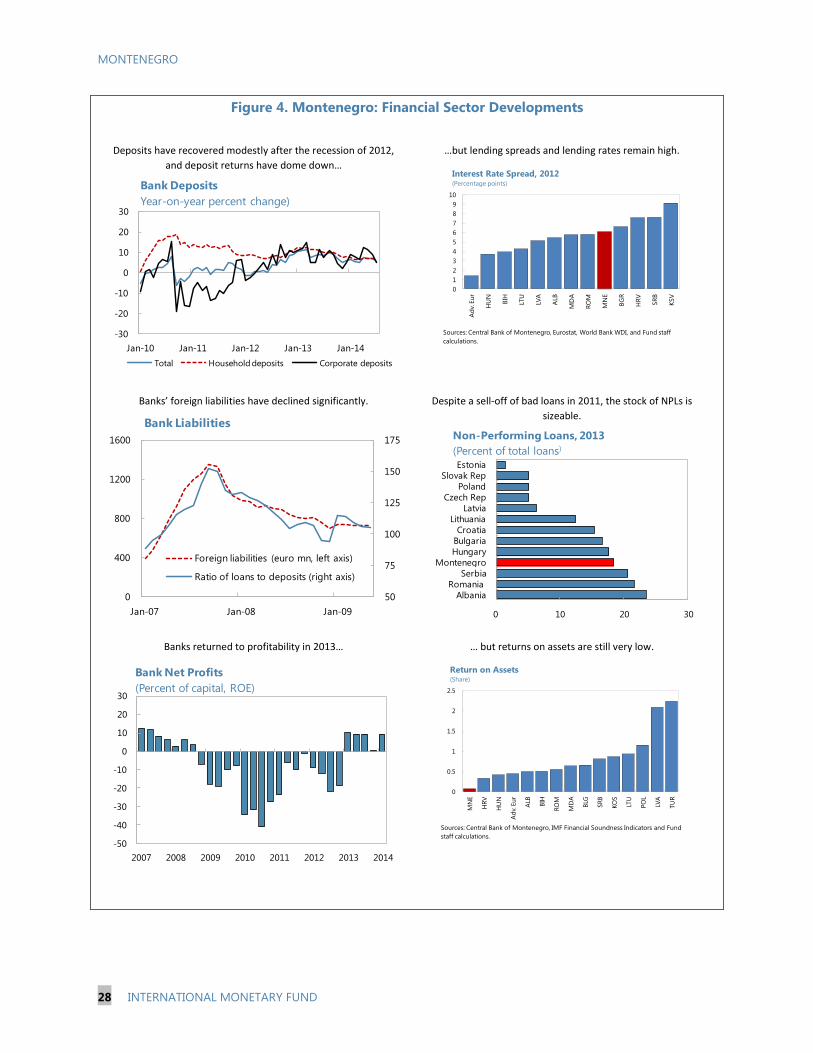
Figure 4. Montenegro: Financial Sector Developments
Deposits have recovered modestly after the recession of 2012,
and deposit returns have dome down…
…but lending spreads and lending rates remain high.
Banks’ foreign liabilities have declined significantly.
Despite a sell-off of bad loans in 2011, the stock of NPLs is
sizeable.
Banks returned to profitability in 2013…
… but returns on assets are still very low.
-30
-20
-10
0
10
20
30
Jan-10 Jan-11 Jan-12 Jan-13 Jan-14
Bank Deposits
Year-on-year percent change)
Total Household deposits Corporate deposits
0
1
2
3
4
5
6
7
8
9
10
Ad
v. E
ur
HU
N
BIH
LTU
LVA
ALB
MD
A
RO
M
MN
E
BG
R
HR
V
SR
B
KSV
Interest Rate Spread, 2012(Percentage points)
Sources: Central Bank of Montenegro, Eurostat, World Bank WDI, and Fund staff
calculations.
50
75
100
125
150
175
0
400
800
1200
1600
Jan-07 Jan-08 Jan-09
Bank Liabilities
Foreign liabilities (euro mn, left axis)
Ratio of loans to deposits (right axis)
0 10 20 30
Albania
Romania
Serbia
Montenegro
Hungary
Bulgaria
Croatia
Lithuania
Latvia
Czech Rep
Poland
Slovak Rep
Estonia
Non-Performing Loans, 2013
(Percent of total loans)
-50
-40
-30
-20
-10
0
10
20
30
2007 2008 2009 2010 2011 2012 2013 2014
Bank Net Profits
(Percent of capital, ROE)
0
0.5
1
1.5
2
2.5
MN
E
HR
V
HU
N
Ad
v. E
ur
ALB
BIH
RO
M
MD
A
BLG
SR
B
KO
S
LTU
PO
L
LVA
TU
RReturn on Assets(Share)
Sources: Central Bank of Montenegro, IMF Financial Soundness Indicators and Fund
staff calculations.
MONTENEGRO
INTERNATIONAL MONETARY FUND 29
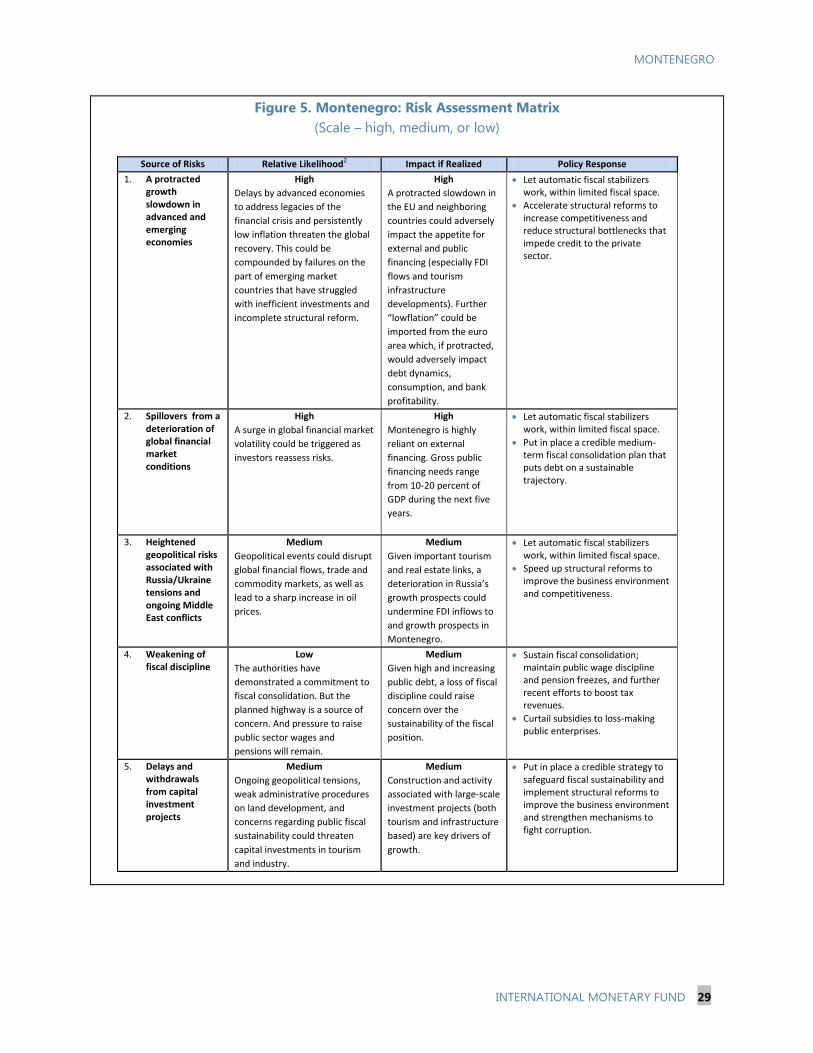
Figure 5. Montenegro: Risk Assessment Matrix
(Scale – high, medium, or low)
Source of Risks Relative Likelihood2 Impact if Realized Policy Response
1. A protracted growth slowdown in advanced and emerging economies
High
Delays by advanced economies
to address legacies of the
financial crisis and persistently
low inflation threaten the global
recovery. This could be
compounded by failures on the
part of emerging market
countries that have struggled
with inefficient investments and
incomplete structural reform.
High
A protracted slowdown in
the EU and neighboring
countries could adversely
impact the appetite for
external and public
financing (especially FDI
flows and tourism
infrastructure
developments). Further
“lowflation” could be
imported from the euro
area which, if protracted,
would adversely impact
debt dynamics,
consumption, and bank
profitability.
Let automatic fiscal stabilizers work, within limited fiscal space.
Accelerate structural reforms to increase competitiveness and reduce structural bottlenecks that impede credit to the private sector.
2. Spillovers from a deterioration of global financial market conditions
High
A surge in global financial market
volatility could be triggered as
investors reassess risks.
High
Montenegro is highly
reliant on external
financing. Gross public
financing needs range
from 10-20 percent of
GDP during the next five
years.
Let automatic fiscal stabilizers work, within limited fiscal space.
Put in place a credible medium-term fiscal consolidation plan that puts debt on a sustainable trajectory.
3. Heightened geopolitical risks associated with Russia/Ukraine tensions and ongoing Middle East conflicts
Medium
Geopolitical events could disrupt
global financial flows, trade and
commodity markets, as well as
lead to a sharp increase in oil
prices.
Medium
Given important tourism
and real estate links, a
deterioration in Russia’s
growth prospects could
undermine FDI inflows to
and growth prospects in
Montenegro.
Let automatic fiscal stabilizers work, within limited fiscal space.
Speed up structural reforms to improve the business environment and competitiveness.
4. Weakening of fiscal discipline
Low
The authorities have
demonstrated a commitment to
fiscal consolidation. But the
planned highway is a source of
concern. And pressure to raise
public sector wages and
pensions will remain.
Medium
Given high and increasing
public debt, a loss of fiscal
discipline could raise
concern over the
sustainability of the fiscal
position.
Sustain fiscal consolidation; maintain public wage discipline and pension freezes, and further recent efforts to boost tax revenues.
Curtail subsidies to loss-making public enterprises.
5. Delays and withdrawals from capital investment projects
Medium
Ongoing geopolitical tensions,
weak administrative procedures
on land development, and
concerns regarding public fiscal
sustainability could threaten
capital investments in tourism
and industry.
Medium
Construction and activity
associated with large-scale
investment projects (both
tourism and infrastructure
based) are key drivers of
growth.
Put in place a credible strategy to safeguard fiscal sustainability and implement structural reforms to improve the business environment and strengthen mechanisms to fight corruption.

MONTENEGRO
30 INTERNATIONAL MONETARY FUND
Table 1. Montenegro: Selected Economic Indicators, 2010–19
(Under current policies)
2010 2011 2012 2013 2014 2015 2016 2017 2018 2019
Real economy
Nominal GDP (millions of €) 3,104 3,234 3,149 3,327 3,387 3,588 3,759 3,944 4,045 4,228
Gross national saving (percent of GDP) -2.6 -2.0 0.9 1.3 3.0 3.8 2.3 3.2 2.6 4.0
Gross investment (percent of GDP) 22.8 19.5 19.5 15.9 18.1 24.0 25.9 27.3 21.2 20.3
Real GDP 2.5 3.2 -2.5 3.3 2.0 4.6 3.3 3.4 1.0 2.9
Industrial production 17.5 -10.3 -7.1 10.6 ... ... ... ... ... ...
Tourism
Arrivals 4.6 8.7 4.8 3.7 ... ... ... ... ... ...
Nights 5.5 10.2 4.3 2.8 ... ... ... ... ... ...
Consumer prices (period average) 0.7 3.1 3.6 2.2 -0.6 1.2 1.4 1.5 1.5 1.6
Consumer prices (end of period) 0.7 2.8 5.1 0.3 0.6 0.9 1.8 1.1 1.9 1.3
GDP deflator (percent change) 1.6 0.9 -0.1 2.2 -0.1 1.3 1.4 1.5 1.6 1.6
Average net wage (12-month) 1/ 3.5 1.0 0.6 -1.6 ... ... ... ... ... ...
Money and credit (end of period)
Bank credit to private sector 2/ -8.9 -13.0 -3.1 2.1 -3.6 3.2 3.8 4.3 4.5 4.5
Enterprises -11.2 -20.3 -4.9 0.1 ... ... ... ... ... ...
Households -5.7 -3.2 -1.1 3.7 ... ... ... ... ... ...
Private sector deposits 5.9 1.2 7.2 5.4 ... ... ... ... ... ...
General government finances (accrual) 3/
Revenue and grants 41.3 38.5 40.0 41.5 42.9 42.1 42.0 41.9 42.8 42.9
Expenditure 45.9 43.8 45.9 44.8 43.8 47.5 49.4 50.5 45.5 44.4
Overall balance -4.6 -5.2 -5.9 -3.3 -0.9 -5.3 -7.4 -8.6 -2.7 -1.5
Primary balance -3.6 -3.8 -4.0 -1.1 1.4 -3.1 -4.1 -5.0 1.6 2.7
Domestic financing (net) -1.4 0.7 -0.8 -2.4 -2.2 -2.7 -2.2 -2.1 -1.9 -1.8
Privatization receipts 0.8 0.5 0.4 0.8 0.6 0.0 0.0 0.0 0.0 0.0
General government gross debt 40.9 46.0 54.0 58.2 58.5 60.7 64.5 69.0 68.4 65.6
General government debt, including loan guarantees 52.4 57.8 65.0 67.6 67.9 70.1 73.9 78.4 77.8 75.0
Balance of payments
Current account balance -22.9 -17.7 -18.7 -14.6 -15.1 -20.2 -23.6 -24.1 -18.7 -16.2
Foreign direct investment 17.8 12.0 14.7 9.7 9.7 10.6 11.4 11.7 11.9 11.9
External debt (end of period, stock) 115.5 117.6 126.6 128.7 132.9 137.5 144.8 152.8 157.4 157.6
Of which: Private sector 4/ 86.1 84.7 85.5 85.6 88.0 87.1 87.2 87.1 88.6 88.5
REER (CPI-based; annual average change, in percent)
( - indicates depreciation) 2.8 -3.2 3.3 -1.1 … … … … … …
Memorandum:
Aluminum price (€ per tonne) 1,644 1,822 1,542 1,348 1,340 1,417 1,447 1,467 1,480 1,494
Projections
4/ Estimates, as private debt statistics are not officially published.
1/ Reflects a change in the methodology by Monstat starting January 1, 2010.
3/ Includes extra-budgetary funds and local governments, but not public enterprises.
(percent change)
(as percent of GDP)
2/ A change in classification in off-balance sheet items has resulted in a structural break in 2012; the annual changes for credit
growth in 2013 are distorted by the change in methodology.
Sources: Ministry of Finance, Central Bank of Montenegro, Statistical Office of Montenegro, and IMF staff estimates and
projections.

Table 2. Montenegro: Savings and Investment Balances, 2010–19
(Under current policies; percent of GDP, unless otherwise noted)
2010 2011 2012 2013 2014 2015 2016 2017 2018 2019
Projections
Gross national savings -2.6 -2.0 0.9 1.3 3.0 3.8 2.3 3.2 2.6 4.0
Non-government -2.6 0.2 4.4 3.2 0.6 0.8 1.7 3.1 3.8 5.1
Government 0.0 -2.2 -3.5 -1.9 2.4 3.0 0.7 0.1 -1.2 -1.1
Gross domestic investment 22.8 19.5 19.5 15.9 18.1 24.0 25.9 27.3 21.2 20.3
Non-government 17.5 15.3 15.6 12.7 12.8 13.9 14.8 15.2 15.6 15.7
Government 5.3 4.2 3.9 3.3 5.3 10.2 11.2 12.1 5.7 4.5
Savings - investment balance -25.4 -21.6 -18.7 -14.6 -15.1 -20.2 -23.6 -24.1 -18.7 -16.2
Non-government -20.1 -15.2 -11.2 -9.5 -12.2 -13.0 -13.1 -12.1 -11.8 -10.6
Government -5.3 -6.4 -7.5 -5.1 -2.9 -7.2 -10.5 -12.0 -6.8 -5.6
Current account balance 1/ -22.9 -17.7 -18.7 -14.6 -15.1 -20.2 -23.6 -24.1 -18.7 -16.2
Foreign direct investment (net) 17.8 12.0 14.7 9.7 9.7 10.6 11.4 11.7 11.9 11.9
External debt 115.5 117.6 126.6 128.7 132.9 137.5 144.8 152.8 157.4 157.6
Sources: Statistical Office of Montenegro, Ministry of Finance; and IMF staff estimates and projections.
1/ Balance of payments data were revised in late 2012 to correct for unrecorded tourism receipts, resulting in an average annual improvement
in the current account balance of 1.7 percent of GDP in 2009-2011. This revision has not yet been incorporated in the national accounts data, which
results in the large discrepancy between the current account balance and the savings-investment balance calculated from the national accounts.
MO
NTEN
EG
RO
INTER
NA
TIO
NA
L MO
NETA
RY F
UN
D
31

MONTENEGRO
32 INTERNATIONAL MONETARY FUND
Table 3. Montenegro: Summary of Accounts of the Financial System, 2010–14
(In millions of euros)
2010 2011 2012 2013 2014
Net foreign assets 386 273 318 395 483
Assets 416 303 348 424 512
Liabilities 30 31 30 29 29
Net domestic assets -321 -191 -227 -297 -380
Net credit to the nonfinancial public sector -71 -18 -24 -12 -12
Of which: general government -71 -18 -24 -12 -12
Net credit to the banking system -277 -207 -237 -319 -272
Required reserves -134 -129 -129 -150 -153
Giro account -142 -77 -108 -169 -119
Claims on depository institutions -1 -1 -1 -1 -1
Other assets net 27 35 34 34 -96
Deposits included in broad money 19 22 31 39 43
Equity 47 61 60 59 60
Net foreign assets -532 -348 -156 -162 -162
Assets 399 456 543 561 577
Liabilities 932 804 700 723 739
Net domestic assets 2,327 2,085 2,061 2,170 2,149
Net assets held in the central bank 276 206 236 318 271
Net credit to nonfinancial public sector -69 37 45 115 206
Of which: general government -70 65 45 115 206
Credit to the private sector 2,076 1,808 1,742 1,777 1,714
Other domestic assets 44 34 38 -41 -41
Liabilities 1,795 1,737 1,878 2,008 1,988
Private sector deposits 1,349 1,365 1,462 1,481 1,508
Other items, net 446 372 415 527 480
o/w capital 311 305 289 390 434
Net foreign assets -146 -75 161 233 321
Net domestic assets 2,007 1,894 1,834 1,873 1,769
Net credit to the nonfinancial public sector -140 19 21 103 194
Of which: general government -140 46 21 103 194
Credit to the private sector 2,076 1,808 1,742 1,777 1,714
Other net domestic assets 71 68 72 -8 -138
Liabilities 1,814 1,758 1,908 2,046 2,031
Equity capital of the central bank 47 61 60 59 60
Reserves ratio 20.5 15.1 16.2 21.5 18.0
Effective required reserves ratio 1/ 9.9 9.5 8.8 10.1 10.1
Credit to private sector / GDP 66.9 55.9 55.3 53.4 50.6
Banks' capital / credit to private sector 15.0 16.9 16.6 21.9 25.3
CBCG reserves / bank deposits 30.9 22.2 23.8 28.6 34.0
Banks' foreign liabilities / lending 44.9 44.4 40.0 40.0 40.0
Sources: Central Bank of Montenegro; and IMF staff estimates.
1/ Reserve requirements are set at 9.5% on deposits with maturity up to one year and 8.5% on deposits with maturity over one year.
IV. Ratios
I. Central Bank
II. Banking System
III. Consolidated System
Proj.

MONTENEGRO
INTERNATIONAL MONETARY FUND 33
Table 4. Montenegro: Balance of Payments, 2010–19
(Under current policies)
2010 2011 2012 2013 2014 2015 2016 2017 2018 2019
Projections
Current account balance -710 -573 -588 -487 -513 -726 -888 -951 -756 -687
Trade balance -1,267 -1,306 -1,389 -1,329 -1,342 -1,574 -1,718 -1,822 -1,667 -1,665
Exports 357 477 392 396 361 382 397 413 424 441
Imports -1,624 -1,783 -1,781 -1,724 -1,702 -1,956 -2,115 -2,235 -2,091 -2,106
Services account 464 589 612 653 647 654 677 721 788 849
Receipts 1/ 801 906 998 994 1,012 1,067 1,129 1,197 1,260 1,336
Expenditures -337 -317 -385 -341 -364 -413 -452 -476 -472 -487
Income account -22 26 54 66 56 61 15 4 -27 -27
Compensation of employees, net 150 168 174 185 189 200 209 220 225 235
Investment income, net -172 -142 -120 -120 -133 -139 -194 -216 -252 -263
Current transfers, net 114 117 135 123 125 133 139 146 150 157
Government, net 16 6 18 22 22 24 25 26 27 28
Other sectors, net 98 112 118 101 103 109 114 120 123 129
Capital and financial account 529 302 389 314 347 571 223 474 290 -77
Foreign direct investment, net 552 389 462 324 330 382 429 462 481 503
Portfolio investment, net 2/ -12 -16 -25 -38 -39 -41 -43 -45 -46 -48
Other investment, net 1/ -11 -68 -55 26 54 227 -165 55 -148 -535
General government 2/ 209 133 203 37 86 323 -49 178 -9 -390
Commercial banks -176 -205 -192 71 0 2 3 9 14 21
Other sectors -44 5 -67 -82 -32 -98 -119 -133 -154 -166
Errors and omissions 1/ 198 157 243 250 254 269 282 296 304 317
Unidentified financing 3/ 0 0 0 0 0 -36 410 247 198 533
Change in official reserves (- denotes increase) -17 114 -45 -77 -89 -78 -28 -65 -36 -86
Memorandum items
Current account balance -22.9 -17.7 -18.7 -14.6 -15.1 -20.2 -23.6 -24.1 -18.7 -16.2
Trade balance -40.8 -40.4 -44.1 -39.9 -39.6 -43.9 -45.7 -46.2 -41.2 -39.4
Exports 11.5 14.7 12.4 11.9 10.6 10.6 10.6 10.5 10.5 10.4
Imports -52.3 -55.1 -56.6 -51.8 -50.2 -54.5 -56.3 -56.7 -51.7 -49.8
Services account 15.0 18.2 19.4 19.6 19.1 18.2 18.0 18.3 19.5 20.1
Receipts 25.8 28.0 31.7 29.9 29.9 29.7 30.0 30.4 31.2 31.6
Payments -10.8 -9.8 -12.2 -10.3 -10.8 -11.5 -12.0 -12.1 -11.7 -11.5
Income account -0.7 0.8 1.7 2.0 1.6 1.7 0.4 0.1 -0.7 -0.6
Current transfers, net 3.7 3.6 4.3 3.7 3.7 3.7 3.7 3.7 3.7 3.7
Foreign direct investment, net 17.8 12.0 14.7 9.7 9.7 10.6 11.4 11.7 11.9 11.9
Portfolio investment, net -0.4 -0.5 -0.8 -1.1 -1.1 -1.1 -1.1 -1.1 -1.1 -1.1
Other investment, net -0.4 -2.1 -1.7 0.8 1.6 6.3 -4.4 1.4 -3.7 -12.7
Errors and omissions 6.4 4.9 7.7 7.5 7.5 7.5 7.5 7.5 7.5 7.5
Gross external debt 4/ 115.5 117.6 126.6 128.7 132.9 137.5 144.8 152.8 157.4 157.6
Sources: Central Bank of Montenegro; and IMF staff estimates.
1/ Balance of payments data were revised in late 2012 to correct for unrecorded tourism receipts, resulting in an average annual
improvement in the current account balance of 1.7 percent of GDP in 2009-2011. The revision also lowered the estimate of other
investment outflows, with a corresponding reduction in errors and omissions.
2/ Sovereign Eurobond issuance is classified under Other Investment rather than Portfolio Investment in this presentation.
4/ This includes only estimates of private external debt as private debt statistics are not officially published.
(percent of GDP)
(Millions of euros)
3/ Financing for the highway is included under general government flows (including the ExIm loan as well as the remaining 15
percent); unidentified financing is a residual, including all remaining financing needs for which specific sources have not been
identified yet--however this does not constitute a financing gap.

MONTENEGRO
34 INTERNATIONAL MONETARY FUND
Table 5a. Montenegro: Consolidated General Government Fiscal Operations, 2010–19 1/
(In millions of euros)
2010 2011 2012 2013 2014 2015 2016 2017 2018 2019
Projections
Total revenues and grants 1281.4 1246.0 1258.8 1381.8 1454.0 1511.9 1578.8 1651.2 1729.3 1814.2
Total revenues 1273.2 1237.8 1250.9 1372.1 1445.3 1503.2 1569.7 1641.8 1719.4 1803.8
Current revenues 1265.5 1232.3 1238.1 1366.0 1439.1 1496.8 1563.1 1634.8 1712.1 1796.1
Taxes 757.2 794.5 786.0 863.5 912.5 949.1 991.1 1036.6 1085.6 1138.9
Personal income tax 115.1 113.2 109.7 124.1 134.4 139.8 146.0 152.7 159.9 167.8
Corporate income tax 20.3 36.1 64.0 40.6 48.8 50.8 53.0 55.5 58.1 60.9
Taxes on turnover of real estate 16.5 15.7 14.4 18.3 18.6 19.4 20.2 21.2 22.2 23.2
Value added tax 364.2 392.2 354.7 429.2 459.3 477.7 498.8 521.7 546.4 573.2
Excises 134.3 143.4 151.8 161.4 160.4 166.8 174.2 182.2 190.8 200.1
Taxes on international trade 50.8 45.3 29.0 22.3 21.7 22.6 23.6 24.7 25.8 27.1
Local government taxes 44.6 44.5 58.2 62.4 63.6 66.1 69.0 72.2 75.6 79.3
Other taxes 11.6 4.2 4.3 5.1 5.7 5.9 6.2 6.5 6.8 7.1
Social security contributions 343.6 311.3 318.7 357.5 379.6 394.8 412.3 431.2 451.6 473.8
Nontax revenues 164.7 126.5 133.4 145.0 147.0 152.9 159.6 166.9 174.8 183.4
Capital revenues 7.7 5.5 12.8 6.0 6.1 6.4 6.7 7.0 7.3 7.7
Grants 8.2 8.2 7.9 9.7 8.7 8.7 9.1 9.5 9.9 10.4
Total expenditures and net lending 1424.3 1415.0 1444.3 1490.0 1484.5 1702.6 1856.9 1991.9 1840.2 1878.9
Total expenditures 1424.2 1415.8 1446.9 1493.4 1487.2 1703.2 1857.4 1992.4 1840.8 1879.5
Current expenditures 658.5 650.6 719.6 636.4 648.3 654.2 724.3 768.3 829.6 867.3
Gross salaries 350.2 361.6 364.2 361.2 375.9 368.1 384.4 402.1 421.1 441.7
Other personal income 24.6 20.2 13.3 14.5 15.2 14.7 15.3 16.0 16.8 17.6
Goods and services 163.1 131.6 199.1 118.4 105.1 87.7 91.6 95.8 100.3 105.7
Current maintenance 32.9 28.2 27.4 24.4 26.0 27.5 28.8 30.2 31.0 32.4
Interest payments 31.4 47.6 59.7 70.8 77.9 80.5 125.1 141.5 173.8 178.9
Rent 8.6 7.7 7.4 8.4 8.5 8.7 9.1 9.6 10.0 10.5
Subsidies to enterprises 2/ 39.8 46.4 26.6 18.2 19.6 22.1 23.0 24.1 25.2 26.5
Other outflows 2/ 7.9 7.3 21.9 20.6 20.2 45.0 47.0 49.1 51.4 54.0
Social security transfers 423.6 455.5 482.1 483.4 498.8 505.4 527.8 552.0 578.1 606.5
Other transfers 160.6 125.9 74.5 141.4 137.9 159.7 166.8 174.5 182.8 192.3
Capital expenditures 165.8 135.6 124.4 108.9 179.8 365.3 419.2 477.3 229.0 191.1
Repayment of guarantees 0.0 34.1 24.7 107.2 9.7 0.0 0.0 0.0 0.0 0.0
Reserves 15.8 14.1 21.5 15.9 12.7 18.5 19.4 20.2 21.2 22.2
Net lending 0.1 -0.8 -2.5 -3.4 -2.7 -0.5 -0.5 -0.6 -0.6 -0.6
Overall Balance -142.9 -169.0 -185.5 -108.2 -30.5 -190.8 -278.1 -340.6 -110.9 -64.7
Financing 3/ 142.9 167.9 185.5 108.2 30.5 190.8 278.1 340.6 110.9 64.7
Domestic financing -42.5 23.5 -26.7 -78.4 -75.3 -96.0 -82.7 -84.3 -78.3 -78.0
Use of gov. deposits 66.9 79.3 15.2 47.7 -86.0 35.4 -8.7 -10.3 -11.9 -12.6
Net borrowing from other sources -109.4 -55.8 -41.9 -126.1 10.7 -131.4 -74.0 -74.0 -66.4 -65.4
Foreign financing 160.3 129.4 198.3 159.8 86.0 323.1 -49.2 178.3 -8.7 -390.0
Privatization receipts 25.1 15.0 14.0 26.8 19.8 0.0 0.0 0.0 0.0 0.0
Unidentified 0.0 0.0 0.0 0.0 0.0 -36.3 409.9 246.6 197.9 532.7
Discrepancy 0.0 1.1 0.0 0.0 0.0 0.0 0.0 0.0 0.0 0.0
Memorandum items:
Primary balance -111.5 -121.4 -125.8 -37.4 47.4 -110.3 -153.0 -199.1 62.9 114.2
-142.9 -134.9 -160.8 -0.9 -20.8 -190.8 -278.1 -340.6 -110.9 -64.7
Source: Ministry of Finance; and Fund staff estimates and projections.
1/ Includes republican budget and local governments.
2/ According to GFSM 1986, payments of loan guarantees or related to court rulings are recorded as government expenses.
Overall balance excluding loan guarantee repayments
3/ Financing for the highway is included under foreign financing (including the ExIm loan as well as the remaining 15 percent);
unidentified financing is a residual, including all remaining financing needs for which specific sources have not been
identified yet--however this does not constitute a financing gap.

MONTENEGRO
INTERNATIONAL MONETARY FUND 35
Table 5b. Montenegro: Consolidated General Government Fiscal Operations, 2010–19 1/
(In percent of GDP)
2010 2011 2012 2013 2014 2015 2016 2017 2018 2019
Projections
Total revenues and grants 41.3 38.5 40.0 41.5 42.9 42.1 42.0 41.9 42.8 42.9
Total revenues 41.0 38.3 39.7 41.2 42.7 41.9 41.8 41.6 42.5 42.7
Current revenues 40.8 38.1 39.3 41.1 42.5 41.7 41.6 41.5 42.3 42.5
Taxes 24.4 24.6 25.0 26.0 26.9 26.5 26.4 26.3 26.8 26.9
Personal income tax 3.7 3.5 3.5 3.7 4.0 3.9 3.9 3.9 4.0 4.0
Corporate income tax 0.7 1.1 2.0 1.2 1.4 1.4 1.4 1.4 1.4 1.4
Taxes on turnover of real estate 0.5 0.5 0.5 0.5 0.5 0.5 0.5 0.5 0.5 0.5
Value added tax 11.7 12.1 11.3 12.9 13.6 13.3 13.3 13.2 13.5 13.6
Excises 4.3 4.4 4.8 4.9 4.7 4.6 4.6 4.6 4.7 4.7
Taxes on international trade 1.6 1.4 0.9 0.7 0.6 0.6 0.6 0.6 0.6 0.6
Local government taxes 1.4 1.4 1.8 1.9 1.9 1.8 1.8 1.8 1.9 1.9
Other taxes 0.4 0.1 0.1 0.2 0.2 0.2 0.2 0.2 0.2 0.2
Social security contributions 11.1 9.6 10.1 10.7 11.2 11.0 11.0 10.9 11.2 11.2
Nontax revenues 5.3 3.9 4.2 4.4 4.3 4.3 4.2 4.2 4.3 4.3
Capital revenues 0.2 0.2 0.4 0.2 0.2 0.2 0.2 0.2 0.2 0.2
Grants 0.3 0.3 0.3 0.3 0.3 0.2 0.2 0.2 0.2 0.2
Total expenditures and net lending 45.9 43.8 45.9 44.8 43.8 47.5 49.4 50.5 45.5 44.4
Total expenditures 45.9 43.8 45.9 44.9 43.9 47.5 49.4 50.5 45.5 44.5
Current expenditures 21.2 20.1 22.9 19.1 19.1 18.2 19.3 19.5 20.5 20.5
Gross salaries 11.3 11.2 11.6 10.9 11.1 10.3 10.2 10.2 10.4 10.4
Other personal income 0.8 0.6 0.4 0.4 0.4 0.4 0.4 0.4 0.4 0.4
Goods and services 5.3 4.1 6.3 3.6 3.1 2.4 2.4 2.4 2.5 2.5
Current maintenance 1.1 0.9 0.9 0.7 0.8 0.8 0.8 0.8 0.8 0.8
Interest payments 1.0 1.5 1.9 2.1 2.3 2.2 3.3 3.6 4.3 4.2
Rent 0.3 0.2 0.2 0.3 0.3 0.2 0.2 0.2 0.2 0.2
Subsidies to enterprises 2/ 1.3 1.4 0.8 0.5 0.6 0.6 0.6 0.6 0.6 0.6
Other outflows 2/ 0.3 0.2 0.7 0.6 0.6 1.3 1.2 1.2 1.3 1.3
Social security transfers 13.6 14.1 15.3 14.5 14.7 14.1 14.0 14.0 14.3 14.3
Other transfers 5.2 3.9 2.4 4.3 4.1 4.4 4.4 4.4 4.5 4.5
Capital expenditures 5.3 4.2 3.9 3.3 5.3 10.2 11.2 12.1 5.7 4.5
Repayment of guarantees 0.0 1.1 0.8 3.2 0.3 0.0 0.0 0.0 0.0 0.0
Reserves 0.5 0.4 0.7 0.5 0.4 0.5 0.5 0.5 0.5 0.5
Net lending 0.0 0.0 -0.1 -0.1 -0.1 0.0 0.0 0.0 0.0 0.0
Overall Balance -4.6 -5.2 -5.9 -3.3 -0.9 -5.3 -7.4 -8.6 -2.7 -1.5
Financing 3/ 4.6 5.2 5.9 3.3 0.9 5.3 7.4 8.6 2.7 1.5
Domestic financing -1.4 0.7 -0.8 -2.4 -2.2 -2.7 -2.2 -2.1 -1.9 -1.8
Use of gov. deposits 2.2 2.5 0.5 1.4 -2.5 1.0 -0.2 -0.3 -0.3 -0.3
Net borrowing from other sources -3.5 -1.7 -1.3 -3.8 0.3 -3.7 -2.0 -1.9 -1.6 -1.5
Foreign financing 5.2 4.0 6.3 4.8 2.5 9.0 -1.3 4.5 -0.2 -9.2
Privatization receipts 0.8 0.5 0.4 0.8 0.6 0.0 0.0 0.0 0.0 0.0
Unidentified 0.0 0.0 0.0 0.0 0.0 -1.0 10.9 6.3 4.9 12.6
Discrepancy 0.0 0.0 0.0 0.0 0.0 0.0 0.0 0.0 0.0 0.0
Memorandum items:
Primary balance -3.6 -3.8 -4.0 -1.1 1.4 -3.1 -4.1 -5.0 1.6 2.7
-4.6 -4.2 -5.1 0.0 -0.6 -5.3 -7.4 -8.6 -2.7 -1.5
Public debt (gross) 40.9 46.0 54.0 58.2 58.5 60.7 64.5 69.0 68.4 65.6
Public debt, including guarantees 52.4 57.8 65.0 67.6 67.9 70.1 73.9 78.4 77.8 75.0
Source: Ministry of Finance; and Fund staff estimates and projections.
1/ Includes republican budget and local governments.
2/ According to GFSM 1986, payments of loan guarantees or related to court rulings are recorded as government expenses.
Overall balance excluding loan guarantee
repayments
3/ Financing for the highway is included under foreign financing (including the ExIm loan as well as the remaining 15 percent);
unidentified financing is a residual, including all remaining financing needs for which specific sources have not been
identified yet--however this does not constitute a financing gap.

MONTENEGRO
36 INTERNATIONAL MONETARY FUND
Table 5c. Montenegro: Consolidated General Government 1/
(In millions of euros, GFSM2001)
2010 2011 2012 2013 2014 2015 2016 2017 2018 2019
Projections
1. Revenue 1273.7 1240.5 1246.0 1375.8 1447.9 1505.5 1572.1 1644.2 1722.0 1806.5
Taxes 757.2 794.5 786.0 863.5 912.5 949.1 991.1 1036.6 1085.6 1138.9
Personal income tax 115.1 113.2 109.7 124.1 134.4 139.8 146.0 152.7 159.9 167.8
Corporate income tax 20.3 36.1 64.0 40.6 48.8 50.8 53.0 55.5 58.1 60.9
Property taxes 16.5 15.7 14.4 18.3 18.6 19.4 20.2 21.2 22.2 23.2
Value added tax 364.2 392.2 354.7 429.2 459.3 477.7 498.8 521.7 546.4 573.2
Excises 134.3 143.4 151.8 161.4 160.4 166.8 174.2 182.2 190.8 200.1
Taxes on international trade 50.8 45.3 29.0 22.3 21.7 22.6 23.6 24.7 25.8 27.1
Local government taxes 44.6 44.5 58.2 62.4 63.6 66.1 69.0 72.2 75.6 79.3
Other taxes 11.6 4.2 4.3 5.1 5.7 5.9 6.2 6.5 6.8 7.1
Social security contributions 343.6 311.3 318.7 357.5 379.6 394.8 412.3 431.2 451.6 473.8
Nontax revenues 164.7 126.5 133.4 145.0 147.0 152.9 159.6 166.9 174.8 183.4
Grants 8.2 8.2 7.9 9.7 8.7 8.7 9.1 9.5 9.9 10.4
2. Expense 1258.4 1280.2 1322.5 1384.4 1307.3 1337.9 1438.3 1515.1 1611.8 1688.4
Gross salaries and other personal income 374.8 381.8 377.5 375.7 391.1 382.8 399.7 418.1 437.8 459.3
Use of goods and services 195.9 159.8 226.5 142.8 131.0 115.2 120.4 126.0 131.3 138.1
Interest payments 31.4 47.6 59.7 70.8 77.9 80.5 125.1 141.5 173.8 178.9
Subsidies to enterprises 39.8 46.4 26.6 18.2 19.6 22.1 23.0 24.1 25.2 26.5
Other current outflows 16.5 15.0 29.3 29.0 28.6 53.7 56.1 58.7 61.4 64.5
Social security transfers 423.6 455.5 482.1 483.4 498.8 505.4 527.8 552.0 578.1 606.5
Other transfers 160.6 125.9 74.5 141.4 137.9 159.7 166.8 174.5 182.8 192.3
Repayment of guarantees 0.0 34.1 24.7 107.2 9.7 0.0 0.0 0.0 0.0 0.0
Reserves 15.8 14.1 21.5 15.9 12.7 18.5 19.4 20.2 21.2 22.2
3. Gross operating balance (= 1 - 2) 15.3 -39.7 -76.5 -8.7 140.5 167.6 133.9 129.2 110.2 118.1
4. Net acquisition of nonfinancial assets 158.1 130.1 111.6 102.9 173.7 358.9 412.5 470.4 221.7 183.5
Capital revenue -7.7 -5.5 -12.8 -6.0 -6.1 -6.4 -6.7 -7.0 -7.3 -7.7
Capital expenditure 165.8 135.6 124.4 108.9 179.8 365.3 419.2 477.3 229.0 191.1
5. Net lending (+) / borrowing (-) (= 3 - 4) -142.8 -169.8 -188.1 -111.6 -33.2 -191.3 -278.6 -341.2 -111.5 -65.4
6. Net acquisition of financial assets -91.9 -95.1 -31.7 -77.9 63.5 -35.9 8.2 9.7 11.3 12.0
Domestic -91.9 -95.1 -31.7 -77.9 63.5 -35.9 8.2 9.7 11.3 12.0
Currency and deposits -66.9 -79.3 -15.2 -47.7 86.0 -35.4 8.7 10.3 11.9 12.6
Loans 0.1 -0.8 -2.5 -3.4 -2.7 -0.5 -0.5 -0.6 -0.6 -0.6
Equity and investment fund shares -25.1 -15.0 -14.0 -26.8 -19.8 0.0 0.0 0.0 0.0 0.0
7. Net incurrence of liabilities 50.9 73.6 156.3 33.7 96.7 191.7 -123.1 104.4 -75.0 -455.3
Domestic -109.4 -55.8 -41.9 -126.1 10.7 -131.4 -74.0 -74.0 -66.4 -65.4
Foreign 160.3 129.4 198.3 159.8 86.0 323.1 -49.2 178.3 -8.7 -390.0
8. Discrepancy (= 5 - 6 + 7) 0.0 -1.1 0.0 0.0 0.0 36.3 -409.9 -246.6 -197.9 -532.7
Memorandum items:
Primary balance -111.4 -122.2 -128.4 -40.8 44.7 -110.8 -153.5 -199.7 62.3 113.5
Nominal GDP 3104 3234 3149 3327 3387 3588 3759 3944 4045 4228
Source: Ministry of Finance; and Fund staff estimates and projections.
1/ Includes republican budget and local governments.

MONTENEGRO
INTERNATIONAL MONETARY FUND 37
5d. Montenegro: Consolidated General Government Fiscal Operations, 2010–19 1/
(In percent of GDP, GFSM2001)
2010 2011 2012 2013 2014 2015 2016 2017 2018 2019
Projections
1. Revenue 41.0 38.4 39.6 41.4 42.7 42.0 41.8 41.7 42.6 42.7
Taxes 24.4 24.6 25.0 26.0 26.9 26.5 26.4 26.3 26.8 26.9
Personal income tax 3.7 3.5 3.5 3.7 4.0 3.9 3.9 3.9 4.0 4.0
Corporate income tax 0.7 1.1 2.0 1.2 1.4 1.4 1.4 1.4 1.4 1.4
Property taxes 0.5 0.5 0.5 0.5 0.5 0.5 0.5 0.5 0.5 0.5
Value added tax 11.7 12.1 11.3 12.9 13.6 13.3 13.3 13.2 13.5 13.6
Excises 4.3 4.4 4.8 4.9 4.7 4.6 4.6 4.6 4.7 4.7
Taxes on international trade 1.6 1.4 0.9 0.7 0.6 0.6 0.6 0.6 0.6 0.6
Local government taxes 1.4 1.4 1.8 1.9 1.9 1.8 1.8 1.8 1.9 1.9
Other taxes 0.4 0.1 0.1 0.2 0.2 0.2 0.2 0.2 0.2 0.2
Social security contributions 11.1 9.6 10.1 10.7 11.2 11.0 11.0 10.9 11.2 11.2
Nontax revenues 5.3 3.9 4.2 4.4 4.3 4.3 4.2 4.2 4.3 4.3
Grants 0.3 0.3 0.3 0.3 0.3 0.2 0.2 0.2 0.2 0.2
2. Expense 40.5 39.6 42.0 41.6 38.6 37.3 38.3 38.4 39.8 39.9
Gross salaries and other personal income 12.1 11.8 12.0 11.3 11.5 10.7 10.6 10.6 10.8 10.9
Use of goods and services 6.3 4.9 7.2 4.3 3.9 3.2 3.2 3.2 3.2 3.3
Interest payments 1.0 1.5 1.9 2.1 2.3 2.2 3.3 3.6 4.3 4.2
Subsidies to enterprises 1.3 1.4 0.8 0.5 0.6 0.6 0.6 0.6 0.6 0.6
Other current outflows 0.5 0.5 0.9 0.9 0.8 1.5 1.5 1.5 1.5 1.5
Social security transfers 13.6 14.1 15.3 14.5 14.7 14.1 14.0 14.0 14.3 14.3
Other transfers 5.2 3.9 2.4 4.3 4.1 4.4 4.4 4.4 4.5 4.5
Repayment of guarantees 0.0 1.1 0.8 3.2 0.3 0.0 0.0 0.0 0.0 0.0
Reserves 0.5 0.4 0.7 0.5 0.4 0.5 0.5 0.5 0.5 0.5
3. Gross operating balance (= 1 - 2) 0.5 -1.2 -2.4 -0.3 4.1 4.7 3.6 3.3 2.7 2.8
4. Net acquisition of nonfinancial assets 5.1 4.0 3.5 3.1 5.1 10.0 11.0 11.9 5.5 4.3
Capital revenue -0.2 -0.2 -0.4 -0.2 -0.2 -0.2 -0.2 -0.2 -0.2 -0.2
Capital expenditure 5.3 4.2 3.9 3.3 5.3 10.2 11.2 12.1 5.7 4.5
5. Net lending (+) / borrowing (-) (= 3 - 4) -4.6 -5.2 -6.0 -3.4 -1.0 -5.3 -7.4 -8.7 -2.8 -1.5
6. Net acquisition of financial assets -3.0 -2.9 -1.0 -2.3 1.9 -1.0 0.2 0.2 0.3 0.3
Domestic -3.0 -2.9 -1.0 -2.3 1.9 -1.0 0.2 0.2 0.3 0.3
Currency and deposits -2.2 -2.5 -0.5 -1.4 2.5 -1.0 0.2 0.3 0.3 0.3
Loans 0.0 0.0 -0.1 -0.1 -0.1 0.0 0.0 0.0 0.0 0.0
Equity and investment fund shares -0.8 -0.5 -0.4 -0.8 -0.6 0.0 0.0 0.0 0.0 0.0
7. Net incurrence of liabilities 1.6 2.3 5.0 1.0 2.9 5.3 -3.3 2.6 -1.9 -10.8
Domestic -3.5 -1.7 -1.3 -3.8 0.3 -3.7 -2.0 -1.9 -1.6 -1.5
Foreign 5.2 4.0 6.3 4.8 2.5 9.0 -1.3 4.5 -0.2 -9.2
8. Discrepancy (= 5 - 6 + 7) 0.0 0.0 0.0 0.0 0.0 1.0 -10.9 -6.3 -4.9 -12.6
Memorandum items:
Primary balance -3.6 -3.8 -4.1 -1.2 1.3 -3.1 -4.1 -5.1 1.5 2.7
Source: Ministry of Finance; and Fund staff estimates and projections.
1/ Includes republican budget and local governments.

MONTENEGRO
38 INTERNATIONAL MONETARY FUND
Table 6. Montenegro: Financial Soundness Indicators of the Banking Sector, 2009–14
2009 2014
Dec Dec Dec Dec Mar Jun Sep Dec Mar Jun Sep
Capital adequacy
Regulatory capital as percent of risk-weighted assets 15.7 15.9 16.5 14.7 14.4 15.5 15.0 14.4 15.1 15.8 16.2
Capital as percent of assets 11.0 10.6 10.9 10.3 13.7 13.9 13.9 13.4 14.2 14.3 14.2
Asset composition and quality
Distribution of bank credit by borrower
Central government, local government, government agencies 1.3 2.1 4.9 4.8 4.5 5.2 6.9 6.7 6.4 6.1 5.5
Funds 1.2 0.1 0.5 0.2 0.0 0.0 0.0 0.0 0.1 0.1 0.2
State-owned companies 1.9 2.7 2.8 3.1 2.4 2.3 2.1 2.1 2.1 2.2 1.7
Private companies, entrepreneurs 56.4 54.8 47.7 47.6 36.8 36.7 34.4 35.7 35.7 36.3 33.5
Banks 0.0 0.0 0.0 0.0 18.6 16.9 18.9 15.8 15.5 15.5 19.5
Financial Institutions 0.3 0.4 0.5 0.1 0.2 0.2 0.2 0.2 0.3 0.2 0.3
Citizens 36.6 37.1 40.5 41.3 33.3 34.3 33.4 35.6 35.9 36.5 35.6
Credit cards 1.7 2.2 2.1 2.1 1.6 1.6 1.4 1.4 1.4 1.3 1.2
Other 0.6 0.6 0.9 0.8 2.6 2.9 2.8 2.6 2.7 1.8 2.6
Distribution of bank credit by sectoral economic activity
Agriculture, hunting, fishing 0.3 0.4 1.2 1.6 1.4 1.4 1.3 1.5 1.5 1.8 1.8
Mining and energy 2.2 2.5 1.8 1.9 1.9 2.2 2.2 2.0 1.7 1.5 1.4
Civil engineering 7.8 8.1 6.7 6.6 8.9 8.6 8.5 4.9 5.4 5.2 5.3
Trade 22.8 22.9 20.7 19.7 17.3 17.6 15.9 19.0 19.8 20.2 19.7
Services, tourism 7.5 7.4 6.1 6.8 5.5 3.7 3.7 4.0 4.4 4.5 4.1
Transport, warehousing, communications 2.6 3.0 3.1 3.0 3.8 3.6 3.3 3.6 3.0 3.0 2.9
Finance 2.4 1.7 2.7 2.2 2.5 3.0 5.1 2.1 1.0 0.8 0.8
Real estate trading 4.4 3.0 2.3 2.3 1.1 1.1 1.3 1.5 1.2 1.1 1.1
Administration, other public services 2.6 3.1 4.3 4.2 8.8 9.2 9.6 12.0 11.7 11.2 11.0
Consumer loans 38.3 39.3 42.6 43.4 43.5 43.8 43.6 44.5 45.2 45.6 47.1
Other 9.1 9.0 8.4 8.4 5.5 5.7 5.5 5.0 5.1 5.1 4.9
Asset quality
Non-performing loans (NPL), in percent of gross loans 13.5 21.0 15.5 17.6 19.4 18.8 18.4 18.4 17.2 17.9 17.3
Provisions, in percent of NPL 46.3 30.7 32.8 40.2 42.1 40.7 39.7 44.7 46.3 44.5 43.8
Provisions, in percent of total loans 6.3 6.4 5.1 7.1 8.2 7.7 7.3 8.2 8.0 8.0 7.6
NPL net of provisions, in percent of capital 52.5 102.8 66.9 68.0 71.7 68.6 66.9 62.4 53.5 56.0 54.5
Earnings and profitability
Gross profits, in percent of average assets (ROAA) -0.6 -2.7 -0.1 -2.0 1.5 1.4 1.3 0.1 0.3 0.5 0.7
Gross profits, in percent of average equity capital (ROAE) -6.9 -27.0 -0.6 -18.1 10.6 9.7 9.5 0.9 2.4 3.5 4.9
Net profits, in percent of average assets (ROAA) -0.7 -2.8 -0.1 -2.0 1.4 1.3 1.3 0.1 1.3 1.0 0.9
Net profits, in percent of average capital (ROAE) -7.8 -27.3 -1.1 -18.3 10.0 9.2 9.2 0.5 9.3 6.8 6.2
Net interest margin 1/ 4.9 4.9 4.8 5.0 1.0 2.1 3.2 4.2 1.1 2.2 3.4
Gross income, in percent of average assets 5.3 5.4 5.2 5.2 5.2 5.3 5.2 5.2 5.2 5.2 5.3
Net interest income, in percent of gross income 74.2 71.6 70.5 73.1 69.5 71.0 70.3 68.2 72.0 71.2 70.7
Non-interest income, in percent of gross income 25.8 28.4 29.5 26.9 30.5 29.0 29.7 31.8 28.0 26.0 26.5
Net fee income, in percent of net interest income 27.2 30.3 28.6 24.2 27.8 26.9 31.1 32.5 30.7 30.4 31.1
Trading income, in percent of gross income 5.7 6.7 9.4 9.2 11.1 9.9 7.8 9.7 5.9 4.4 4.5
Aggregate overhead expenses, in percent of gross income 62.3 64.0 70.7 77.7 69.1 67.6 67.9 69.1 68.5 68.7 67.4
Liquidity
Liquid assets, in percent of total assets 15.3 19.1 19.9 24.0 13.2 14.5 21.2 20.0 18.0 18.8 23.2
Liquid assets, in percent of short-term liabilities 25.8 32.9 32.8 40.1 21.3 23.5 34.1 32.2 29.0 29.6 36.1
Deposits, in percent of assets 60.3 60.8 64.7 70.5 69.9 69.7 71.5 71.6 71.6 72.1 73.5
Loans, in percent of deposits 131.4 122.9 107.6 94.0 114.8 113.4 108.8 105.8 105.5 102.4 99.9
Sensitivity to market risk
Off-balance sheet operations, in percent of assets 439.5 429.5 464.0 370.5 359.8 335.9 318.8 319.7 312.2 308.2 301.3
Original maturity of assets (in percent of total)
Less than 3 months 30.4 34.4 21.5 32.1 30.0 39.2 38.8 38.7 35.8 39.3 39.4
3 months to 1 year 20.5 17.2 28.2 23.4 23.3 17.3 18.7 16.6 19.8 17.0 19.0
1 to 5 years 33.9 33.6 35.4 31.5 31.0 30.6 30.0 31.6 31.9 31.4 29.8
Over 5 years 15.3 14.8 14.9 13.0 12.7 12.9 12.6 13.1 12.5 12.4 11.9
Original maturity of liabilities (in percent of total)
Less than 3 months 34.7 38.5 21.9 31.3 40.9 40.0 41.2 40.4 39.0 42.9 42.5
3 months to 1 year 32.4 27.1 47.1 27.9 31.3 31.7 31.4 31.7 33.8 31.6 32.8
1 to 5 years 23.5 24.4 23.4 23.8 23.6 22.9 22.2 22.9 22.4 21.7 19.6
Over 5 years 9.4 10.0 7.7 4.3 4.2 5.4 5.3 5.0 4.8 3.9 5.1
Source: Central Bank of Montenegro.
1/ Net interest income in percent of interest bearing assets.
20132010 2011 2012
MONTENEGRO
INTERNATIONAL MONETARY FUND 39
Appendix I. Montenegro: Public Debt Sustainability Analysis
Despite last year’s sizeable fiscal adjustment, public sector debt has increased and is projected to rise
further to 69 percent of GDP in the baseline. The projected debt trajectory is highly susceptible to
various shocks, especially a negative real GDP growth shock. Gross financing needs are high, a
particular concern as Montenegro is highly dependent on external financing.
Baseline and Realism of Projections
Macroeconomic assumptions. Growth momentum is projected to slow in 2014 on account of
base effects, as well as delays in several large infrastructure projects. Growth picks up gradually
through the projection period—in the absence of the highway project, it would reach
3.3 percent. The expenditures on the highway are assumed to add EUR 206 million,
EUR 253 million, EUR 303 million, and EUR 47 million to the nominal level of GDP in the years
2015–2018, less import content (assumed to be 70 percent), with an additional
contemporaneous multiplier on aggregate demand of 5 percent, resulting in additional growth
of 1.9, 0.3, 0.3, -2.2, and -0.4 in the years 2015–19. Inflation pressures are expected to remain
negligible given low international agricultural prices and subdued EU inflation.
Fiscal adjustment. A sizeable fiscal adjustment was achieved last year on account of a pension
freeze and PIT and VAT rate hikes. In staff’s baseline projections, the primary balance worsens
significantly in 2015–17 on account of highway expenditures. This assumes that non-highway
non-interest expenditures remain at their 2015 budget levels as a share of non-highway GDP in
2016-2019 as well, implying continued pension restraint and significant cuts in other capital
spending.
Heat map and debt profile vulnerabilities. Risks from the debt level are deemed high as debt
approaches the 70 percent of GDP benchmark under the baseline and exceeds it under several
shock scenarios. Gross financing needs are also well above the 15 percent benchmark, even
under the baseline. Public debt held by non-residents also constitutes a vulnerability. Growth
shocks have a very large impact on the debt profile.
Realism of baseline assumptions. The median forecast errors for real GDP growth and inflation
(actual minus projection) in 2005–2013 suggest on average an upward bias in staff’s past
projections. The median forecast error for the primary balance suggests that staff projections
have been too pessimistic on average. While the projected CAPB adjustment is small, the key
risks are high dependence on external financing and vulnerability to macro shocks.

MONTENEGRO
40 INTERNATIONAL MONETARY FUND
Shocks and Stress Tests
Stress tests indicate that in particular growth shocks, but also fiscal shocks and cost overruns and
delays related to the highway project, would have a major impact on fiscal sustainability.
Montenegro-specific stress tests
Highway shock. In this scenario, the construction of the highway is assumed to cost 20 percent
more (in 2018). Debt increases to 70 percent of GDP, while financing requirements far exceed
those under the baseline in 2018.
Standard stress tests
Growth shock. Under this scenario, real output growth rates are lowered during 2015 and 2016
by one standard deviation (4.9 ppt), also affecting inflation and interest rates. The public debt
ratio increases to 86 percent by 2018, while the gross financing needs ratio in 2016 increases
9 percentage points relative to the baseline. (Even half a standard deviation shock pushes debt
to 77 percent of GDP).
Interest rate shock. This scenario examines the implications of an increase in interest rates on
new debt by 200 basis points (relative to the baseline) in 2015–19. The deterioration in the ratios
for debt and gross financing needs are back loaded as old debt gradually matures. However, by
2019, the impact on financing needs is significant.
Combined macro shock. This scenario comprises a recession in 2015 and 2016, a 200 basis
point increase in interest rates, and a sharp rise in expenditures. It pushes the debt to GDP ratio
up to 89 percent of GDP, and has a very large impact on gross financing needs.
Financial contingent liability shock. The noninterest expenditure shock is equivalent to
10 percent of the size of the banking sector and is combined with a shock to GDP and interest
rates. The shock results in a sharp increase in the debt ratio to 85 percent of GDP. Meanwhile,
gross financing needs would rise to over 28 percent of GDP in 2015, and stay higher over the
medium term.
Primary balance shock. This scenario assumes a revenue shock and a rise in interest rates
leading to a 2 ppt of GDP deterioration in the primary balance in 2015 and 2016. The combined
shocks lead to deterioration in the debt ratio and gross financing needs, but the impact is more
muted than in other scenarios under consideration.
Real exchange rate shock. The scenario assumes a 13 percent devaluation in the real exchange
rate in 2015. As the ExIm loan is dollar denominated, debt increases to 70 percent, though the
impact depends critically on the extent of exchange rate pass-through to inflation.

MONTENEGRO
INTERNATIONAL MONETARY FUND 41
Montenegro: Public Sector Debt Sustainability Analysis (DSA) – Baseline Scenario
(In percent of GDP, unless otherwise indicated)
As of August 30, 20132/
2012 2013 2014 2015 2016 2017 2018 2019 Sovereign Spreads
Nominal gross public debt 37.6 54.0 58.2 58.5 60.7 64.5 69.0 68.4 65.6 EMBIG (bp) 3/ n.a.
Public gross financing needs 11.5 11.5 12.6 10.5 20.2 21.8 18.1 9.7 15.1 5Y CDS (bp) n.a.
Real GDP growth (in percent) 4.1 -2.5 3.3 2.0 4.6 3.3 3.4 1.0 2.9 Ratings Foreign Local
Inflation (GDP deflator, in percent) 5.9 -0.1 2.2 -0.1 1.3 1.4 1.5 1.6 1.6 Moody's Ba3 Ba3
Nominal GDP growth (in percent) 10.4 -2.6 5.7 1.8 5.9 4.8 4.9 2.6 4.5 S&Ps B+ B+
Effective interest rate (in percent) 4/ 3.2 4.0 4.2 4.2 4.5 4.4 4.2 4.2 4.5 Fitch n.a. n.a.
2012 2013 2014 2015 2016 2017 2018 2019 cumulative
Change in gross public sector debt -3.3 8.0 4.2 0.3 2.2 3.8 4.5 -0.6 -2.8 7.4
Identified debt-creating flows -2.5 7.3 0.0 0.0 2.3 3.9 4.6 -0.4 -2.7 7.7
Primary deficit 0.4 4.1 1.2 -1.3 3.1 4.1 5.1 -1.5 -2.7 6.7
Primary (noninterest) revenue and grants42.0 40.0 41.5 42.9 42.1 42.0 41.9 42.8 42.9 254.6
Primary (noninterest) expenditure 42.3 44.1 42.8 41.6 45.2 46.1 46.9 41.2 40.2 261.3
Automatic debt dynamics 5/
-2.8 3.2 -1.2 1.3 -0.8 -0.2 -0.5 1.1 0.0 1.0
Interest rate/growth differential 6/
-2.6 3.1 -0.8 1.3 -0.8 -0.2 -0.5 1.1 0.0 1.0
Of which: real interest rate -1.2 1.9 0.9 2.5 1.7 1.7 1.6 1.8 1.9 11.2
Of which: real GDP growth -1.4 1.2 -1.7 -1.1 -2.5 -1.9 -2.1 -0.7 -1.9 -10.2
Exchange rate depreciation 7/
-0.3 0.0 -0.5 … … … … … … …
Other identified debt-creating flows 0.0 0.0 0.0 0.0 0.0 0.0 0.0 0.0 0.0 0.0
Privatization (negative) 0.0 0.0 0.0 0.0 0.0 0.0 0.0 0.0 0.0 0.0
Contingent liabilities 0.0 0.0 0.0 0.0 0.0 0.0 0.0 0.0 0.0 0.0
Other debt flows 0.0 0.0 0.0 0.0 0.0 0.0 0.0 0.0 0.0 0.0
Residual, including asset changes 8/
-0.8 0.7 4.2 0.3 -0.1 -0.1 -0.1 -0.1 -0.1 -0.3
Source: IMF staff.
1/ Public sector is defined as general government.
2/ Based on available data.
3/ Long-term bond spread over German bonds.
4/ Defined as interest payments divided by debt stock (excluding guarantees) at the end of previous year.
5/ Derived as [(r - π(1+g) - g + ae(1+r)]/(1+g+π+gπ)) times previous period debt ratio, with r = interest rate; π = growth rate of GDP deflator; g = real GDP growth rate;
a = share of foreign-currency denominated debt; and e = nominal exchange rate depreciation (measured by increase in local currency value of U.S. dollar).
6/ The real interest rate contribution is derived from the numerator in footnote 5 as r - π (1+g) and the real growth contribution as -g.
7/ The exchange rate contribution is derived from the numerator in footnote 5 as ae(1+r).
8/ Includes asset changes and interest revenues (if any). For projections, includes exchange rate changes during the projection period.
9/ Assumes that key variables (real GDP growth, real interest rate, and other identified debt-creating flows) remain at the level of the last projection year.
0.0
balance 9/
primary
Debt, Economic and Market Indicators 1/
2003-2011
Actual
Projections
Contribution to Changes in Public Debt
Projections
2003-2011
Actual
debt-stabilizing
-40
-30
-20
-10
0
10
20
2003 2004 2005 2006 2007 2008 2009 2010 2011 2012 2013 2014 2015 2016 2017 2018 2019
Debt-Creating Flows
Primary deficit Real GDP growth Real interest rate
Exchange rate depreciation Other debt-creating flows Residual
Change in gross public sector debt
projection
(in percent of GDP)
-15
-10
-5
0
5
10
15
20
cumulative

MONTENEGRO
42 INTERNATIONAL MONETARY FUND
Montenegro: Composition of Public Debt and Alternative Scenarios
Baseline Scenario 2014 2015 2016 2017 2018 2019 Historical Scenario 2014 2015 2016 2017 2018 2019
Real GDP growth 2.0 4.6 3.3 3.4 1.0 2.9 Real GDP growth 2.0 3.6 3.6 3.6 3.6 3.6
Inflation -0.1 1.3 1.4 1.5 1.6 1.6 Inflation -0.1 1.3 1.4 1.5 1.6 1.6
Primary Balance 1.3 -3.1 -4.1 -5.1 1.5 2.7 Primary Balance 1.3 -0.7 -0.7 -0.7 -0.7 -0.7
Effective interest rate 4.2 4.5 4.4 4.2 4.2 4.5 Effective interest rate 4.2 4.5 3.3 2.2 1.8 1.9
Constant Primary Balance Scenario
Real GDP growth 2.0 4.6 3.3 3.4 1.0 2.9
Inflation -0.1 1.3 1.4 1.5 1.6 1.6
Primary Balance 1.3 1.3 1.3 1.3 1.3 1.3
Effective interest rate 4.2 4.5 4.5 4.2 4.3 4.7
Source: IMF staff.
Underlying Assumptions(in percent)
Alternative Scenarios
Composition of Public Debt
Baseline Historical Constant Primary Balance
0
10
20
30
40
50
60
70
80
2012 2013 2014 2015 2016 2017 2018 2019
Gross Nominal Public Debt
(in percent of GDP)
projection
0
5
10
15
20
25
2012 2013 2014 2015 2016 2017 2018 2019
Public Gross Financing Needs
(in percent of GDP)
projection
0
10
20
30
40
50
60
70
80
2003 2005 2007 2009 2011 2013 2015 2017 2019
By Maturity
Medium and long-term
Short-term
projection
(in percent of GDP)
0
10
20
30
40
50
60
70
80
2003 2005 2007 2009 2011 2013 2015 2017 2019
By Currency
Local currency-denominated
Foreign currency-denominated
projection
(in percent of GDP)

MONTENEGRO
INTERNATIONAL MONETARY FUND 43
Montenegro: DSA – Stress Tests
Primary Balance Shock 2014 2015 2016 2017 2018 2019 Real GDP Growth Shock 2014 2015 2016 2017 2018 2019
Real GDP growth 2.0 4.6 3.3 3.4 1.0 2.9 Real GDP growth 2.0 -0.3 -1.5 3.4 1.0 2.9
Inflation -0.1 1.3 1.4 1.5 1.6 1.6 Inflation -0.1 0.1 0.2 1.5 1.6 1.6
Primary balance 1.3 -5.1 -6.1 -5.1 1.5 2.7 Primary balance 1.3 -5.9 -10.0 -5.1 1.5 2.7
Effective interest rate 4.2 4.5 4.6 4.5 4.4 4.7 Effective interest rate 4.2 4.5 4.6 4.8 4.7 5.0
Real Interest Rate Shock Real Exchange Rate Shock
Real GDP growth 2.0 4.6 3.3 3.4 1.0 2.9 Real GDP growth 2.0 4.6 3.3 3.4 1.0 2.9
Inflation -0.1 1.3 1.4 1.5 1.6 1.6 Inflation -0.1 1.7 1.4 1.5 1.6 1.6
Primary balance 1.3 -3.1 -4.1 -5.1 1.5 2.7 Primary balance 1.3 -3.1 -4.1 -5.1 1.5 2.7
Effective interest rate 4.2 4.5 5.0 5.2 5.5 6.0 Effective interest rate 4.2 4.6 4.4 4.2 4.2 4.5
Combined Shock
Real GDP growth 2.0 -0.3 -1.5 3.4 1.0 2.9
Inflation -0.1 0.1 0.2 1.5 1.6 1.6
Primary balance 1.3 -5.9 -10.0 -5.1 1.5 2.7
Effective interest rate 4.2 4.6 5.0 5.3 5.6 6.0
Source: IMF staff.
Macro-Fiscal Stress Tests
Baseline Primary Balance Shock
Real GDP Growth Shock
Real Interest Rate Shock
(in percent)
Real Exchange Rate Shock
Combined Macro-Fiscal Shock
Additional Stress Tests
Baseline
Underlying Assumptions
Highway shock
0
10
20
30
40
50
60
70
80
90
100
2014 2015 2016 2017 2018 2019
Gross Nominal Public Debt(in percent of GDP)
0
50
100
150
200
250
2014 2015 2016 2017 2018 2019
Gross Nominal Public Debt
(in percent of Revenue)
0
5
10
15
20
25
30
35
2014 2015 2016 2017 2018 2019
Public Gross Financing Needs
(in percent of GDP)
0
10
20
30
40
50
60
70
80
90
100
2014 2015 2016 2017 2018 2019
Gross Nominal Public Debt(in percent of GDP)
0
50
100
150
200
250
300
2014 2015 2016 2017 2018 2019
Gross Nominal Public Debt
(in percent of Revenue)
0
5
10
15
20
25
30
35
2014 2015 2016 2017 2018 2019
Public Gross Financing Needs
(in percent of GDP)

MONTENEGRO
44 INTERNATIONAL MONETARY FUND
Montenegro: DSA – Risk Assessment
Montenegro, Rep. of
Source: IMF staff.
1/ The cell is highlighted in green if debt burden benchmark of 70% is not exceeded under the specific shock or baseline, yellow if exceeded under specific shock but not
baseline, red if benchmark is exceeded under baseline, white if stress test is not relevant.
Real Interest
Rate Shock
External
Financing
Requirements
Real GDP
Growth Shock
Heat Map
Upper early warning
Evolution of Predictive Densities of Gross Nominal Public Debt
(in percent of GDP)
Debt profile 3/
Lower early warning
(Indicators vis-à-vis risk assessment benchmarks, in 2013)
Debt Profile Vulnerabilities
Gross financing needs 2/
Debt level 1/ Real GDP
Growth Shock
Primary
Balance Shock
3/ The cell is highlighted in green if country value is less than the lower risk-assessment benchmark, red if country value exceeds the upper risk-assessment benchmark,
yellow if country value is between the lower and upper risk-assessment benchmarks. If data are unavailable or indicator is not relevant, cell is white.
Lower and upper risk-assessment benchmarks are:
Change in the
Share of Short-
Term Debt
Foreign
Currency
Debt
Public Debt
Held by Non-
Residents
Primary
Balance Shock
Real Interest
Rate Shock
Exchange Rate
Shock
Contingent
Liability Shock
Exchange Rate
Shock
Contingent
Liability shock
5/ External financing requirement is defined as the sum of current account deficit, amortization of medium and long-term total external debt, and short-term total external
debt at the end of previous period.
4/ Long-term bond spread over German bonds, an average over the last 3 months, 01-Jun-13 through 30-Aug-13.
2/ The cell is highlighted in green if gross financing needs benchmark of 15% is not exceeded under the specific shock or baseline, yellow if exceeded under specific shock
but not baseline, red if benchmark is exceeded under baseline, white if stress test is not relevant.
200 and 600 basis points for bond spreads; 5 and 15 percent of GDP for external financing requirement; 0.5 and 1 percent for change in the share of short-term debt; 15
and 45 percent for the public debt held by non-residents; and 20 and 60 percent for the share of foreign-currency denominated debt.
Market
Perception
20
60
20%
1 2
200
600
no
data
1 2
5
15
28%
1 2
0.5
1
0.7%
1 2
Bond spreadExternal Financing
Requirement
Annual Change in
Short-Term Public
Debt
Public Debt in
Foreign Currency
(in basis points) 4/ (in percent of GDP) 5/ (in percent of total) (in percent of total)
0
10
20
30
40
50
60
70
80
90
100
2012 2013 2014 2015 2016 2017 2018 2019
10th-25th 25th-75th 75th-90thPercentiles:Baseline
Symmetric Distribution
0
20
40
60
80
100
120
2012 2013 2014 2015 2016 2017 2018 2019
Restricted (Asymmetric) Distribution
no restriction on the growth rate shock
no restriction on the interest rate shock
0 is the max positive pb shock (percent GDP)
no restriction on the exchange rate shock
Restrictions on upside shocks:
15
45
74%
1 2
Public Debt Held
by Non-Residents
(in percent of total)

Montenegro: DSA – Realism of Baseline Assumptions
MO
NTEN
EG
RO
N
TER
NA
TIO
NA
L MO
NETA
RY F
UN
D 4
5

MONTENEGRO
46 INTERNATIONAL MONETARY FUND
Appendix II. Montenegro: External Debt Sustainability Analysis
External debt has increased by nearly 60 percentage points of GDP since 2007 to an estimated
133 percent of GDP in 2014. This was driven in part by the sharp increase in public debt, which more
than doubled over this period and comprises about 45 percent of total external debt. Under the
baseline, external debt is projected to increase to 157½ percent of GDP. The projected debt trajectory is
highly susceptible to various shocks, particularly a depreciation of the euro. Montenegro’s heavy
dependence on external financing reinforces the importance of fiscal and structural reforms to
safeguard market access.
Shocks and Stress Tests
Standardized stress tests indicate that external debt is particularly sensitive to currency
depreciation. Current account shocks—possibly related to highway project cost overruns—and a
combined deterioration in the macroeconomic environment would also impact external
sustainability, with significant implications for gross financing needs.
Standard stress tests
Growth shock. Under this scenario, the baseline real GDP growth profile is permanently
reduced by a one-half standard deviation calculated over the recent 10-year period (2.5 percent)
effective in 2015. This corresponds to an average growth rate of 0.6 percent of GDP over
2015–19, compared with baseline average growth of 3 percent. Under this scenario, the external
debt ratio increases to 172 percent of GDP in 2019.
Interest rate shock. This scenario examines the implications of an increase in nominal external
interest rates on new debt (relative to the baseline) by a one-half standard deviation in
2015–2019. Stable average external interest rates historically imply only a modest average
increase in interest rates of 27 basis points in this scenario and, consequently, a relatively small
increase in the external debt profile to 160 percent of GDP by 2019.
Non-Interest Current Account shock. This scenario permanently increases the non-interest
current account by one-half standard deviation in 2015–2019. Given historically-high current
account deficits, this amounts to an increase of 6¼ percentage points. In the absence of
offsetting debt creating flows, external debt increases to 189 percent of GDP by 2019.
Combined macro shock. This scenario comprises a permanent ¼ standard deviation shock
applied to the real interest rate, the growth rate, and the current account deficit effective
2015–19. The combined shock pushes the external debt ratio to 182 percent of GDP and
increases gross financing needs by 26½ percent of GDP cumulatively over the shock period.

MONTENEGRO
INTERNATIONAL MONETARY FUND 47
Real exchange rate shock. The scenario assumes a one-time 30 percent devaluation in the real
exchange rate in 2015 applied to the stock of external debt. Second round impacts (in terms of
potential increases in competitiveness and improved trade balances) are not taken into account.
Given the large stock of external debt, the shock increases the external debt-to-GDP ratio by
62½ percent of GDP in 2015. Gross financing needs are correspondingly higher, by about
17½ percent of GDP on average over 2015–19 relative to the baseline.

Table 1. Montenegro: External Debt Sustainability Framework, 2009–19
(In percent of GDP, unless otherwise indicated)
Projections
2009 2010 2011 2012 2013 2014 2015 2016 2017 2018 2019 Debt-stabilizing
non-interest
current account 6/
1 Baseline: External debt 93.5 115.5 117.6 126.6 128.7 132.9 137.5 144.8 152.8 157.4 157.6 -13.0
2 Change in external debt 2.7 22.0 2.1 9.0 2.1 4.2 4.6 7.4 8.0 4.6 0.3
3 Identified external debt-creating flows (4+8+9) -4.7 1.4 1.0 7.2 -1.9 2.9 3.9 7.8 7.7 5.3 0.0
4 Current account deficit, excluding interest payments 25.0 19.6 13.9 15.0 11.2 11.5 16.8 18.9 19.2 12.9 10.5
5 Deficit in balance of goods and services 30.9 25.9 22.2 24.7 20.3 20.5 25.6 27.7 27.9 21.7 19.3
6 Exports 34.5 37.3 42.7 44.1 41.8 40.5 40.4 40.6 40.8 41.7 42.0
7 Imports 65.4 63.2 64.9 68.8 62.1 61.0 66.0 68.3 68.7 63.4 61.3
8 Net non-debt creating capital inflows (negative) -35.8 -17.8 -12.0 -14.7 -9.7 -9.7 -10.6 -11.4 -11.7 -11.9 -11.9
9 Automatic debt dynamics 1/ 6.1 -0.4 -0.8 6.8 -3.4 1.1 -2.3 0.3 0.3 4.3 1.4
10 Contribution from nominal interest rate 2.9 3.3 3.8 3.6 3.4 3.6 3.5 4.7 5.0 5.7 5.7
11 Contribution from real GDP growth 5.4 -2.2 -3.6 3.1 -4.0 -2.5 -5.7 -4.4 -4.7 -1.5 -4.3
12 Contribution from price and exchange rate changes 2/ -2.2 -1.5 -1.1 0.1 -2.8 ... ... ... ... ... ...
13 Residual, incl. change in gross foreign assets (2-3) 3/ 7.5 20.6 1.1 1.8 3.9 1.3 0.8 -0.5 0.2 -0.8 0.3
External debt-to-exports ratio (in percent) 271.2 309.7 275.1 286.9 307.9 327.9 340.6 356.7 374.4 377.8 375.0
Gross external financing need (in billions of Euro) 4/ 1.3 1.1 0.9 0.9 0.9 1.1 1.4 1.6 1.6 1.3 1.6
in percent of GDP 42.9 35.3 28.0 29.9 26.9 10-Year 10-Year 31.9 40.3 43.3 39.3 32.7 38.5
Scenario with key variables at their historical averages 5/ 132.9 138.5 142.9 147.9 151.9 156.6 -20.2
Historical Standard
Key Macroeconomic Assumptions Underlying Baseline Average Deviation
Real GDP growth (in percent) -5.7 2.5 3.2 -2.5 3.3 3.6 4.9 2.0 4.6 3.3 3.4 1.0 2.9
GDP deflator in US dollars (change in percent) 2.4 1.6 0.9 -0.1 2.2 4.7 4.1 -0.1 1.3 1.4 1.5 1.6 1.6
Nominal external interest rate (in percent) 3.1 3.7 3.4 3.0 2.8 3.4 0.6 2.9 2.8 3.6 3.6 3.8 3.8
Growth of exports (Euro terms, in percent) -16.2 12.6 19.4 0.5 0.1 13.1 19.6 -1.3 5.5 5.4 5.5 4.7 5.5
Growth of imports (Euro terms, in percent) -32.3 0.6 7.1 3.2 -4.7 13.7 23.4 0.0 14.6 8.4 5.6 -5.4 1.2
Current account balance, excluding interest payments -25.0 -19.6 -13.9 -15.0 -11.2 -22.4 12.6 -11.5 -16.8 -18.9 -19.2 -12.9 -10.5
Net non-debt creating capital inflows 35.8 17.8 12.0 14.7 9.7 13.0 11.4 9.7 10.6 11.4 11.7 11.9 11.9
1/ Derived as [r - g - r(1+g) + ea(1+r)]/(1+g+r+gr) times previous period debt stock, with r = nominal effective interest rate on external debt; r = change in domestic GDP deflator in Euro terms, g = real GDP growth rate,
e = nominal appreciation (increase in dollar value of domestic currency), and a = share of domestic-currency denominated debt in total external debt.
2/ The contribution from price and exchange rate changes is defined as [-r(1+g) + ea(1+r)]/(1+g+r+gr) times previous period debt stock. r increases with an appreciating domestic currency (e > 0) and rising inflation (based on GDP deflator).
3/ For projection, line includes the impact of price and exchange rate changes.
4/ Defined as current account deficit, plus amortization on medium- and long-term debt, plus short-term debt at end of previous period.
5/ The key variables include real GDP growth; nominal interest rate; Euro deflator growth; and both non-interest current account and non-debt inflows in percent of GDP.
6/ Long-run, constant balance that stabilizes the debt ratio assuming that key variables (real GDP growth, nominal interest rate, Euro deflator growth, and non-debt inflows in percent of GDP) remain at their levels
Actual
MO
NTEN
EG
RO
47
IN
TER
NA
TIO
NA
L MO
NETA
RY F
UN
D

MONTENEGRO
INTERNATIONAL MONETARY FUND 49
Figure 1. Montenegro: External Debt Sustainability: Bound Tests 1/,2/
i-rate
shock
160
Baseline
158
60
80
100
120
140
160
180
200
2009 2011 2013 2015 2017 2019
Interest rate shock (in percent)
Sources: International Monetary Fund, country desk data, and staff estimates.
1/ Shaded areas represent actual data. Individual shocks are permanent one-half standard deviation
shocks. Figures in the boxes represent average projections for the respective variables in the baseline
and scenario being presented. Ten-year historical average for the variable is also shown.
2/ For historical scenarios, the historical averages are calculated over the ten-year period, and the
information is used to project debt dynamics five years ahead.
3/ Permanent 1/4 standard deviation shocks applied to real interest rate, growth rate, and current
account balance.
4/ One-time real depreciation of 30 percent occurs in 2015.
Historical
157Baseline
158
0
10
20
30
40
50
60
80
100
120
140
160
180
200
2009 2011 2013 2015 2017 2019
Baseline and historical scenarios
CA shock
189
Baseline
158
60
80
100
120
140
160
180
200
2009 2011 2013 2015 2017 2019
Comb.
shock
182
Baseline
158
60
80
100
120
140
160
180
200
2009 2011 2013 2015 2017 2019
Combined shock 3/
30 %
depreciat.
229
Baseline
158
60
80
100
120
140
160
180
200
220
240
2009 2011 2013 2015 2017 2019
Real depreciation shock 4/
Gross financing need
under baseline
(right scale)
Non-interest current account shock
(in percent of GDP)
Growth
shock
172
Baseline
158
60
80
100
120
140
160
180
200
2009 2011 2013 2015 2017 2019
Baseline:
Scenario:
Historical:
3.5
3.8
3.4
Baseline:
Scenario:
Historical:
3.0
0.6
3.6
Baseline:
Scenario:
Historical:
-15.7
-22.0
-22.4
Growth shock
(in percent per year)

MONTENEGRO
STAFF REPORT FOR THE 2014 ARTICLE IV
CONSULTATION—INFORMATIONAL ANNEX
Prepared By
The European Department
(In Consultation with Other Departments)
FUND RELATIONS _______________________________________________________________________ 2
WORLD BANK GROUP RELATIONS _____________________________________________________ 4
STATISTICAL ISSUES ____________________________________________________________________ 6
CONTENTS
January 8, 2015

MONTENEGRO
2 INTERNATIONAL MONETARY FUND
FUND RELATIONS
(As of October 31, 2014)
Membership Status: Joined January 18, 2007; Article VIII.
General Resources Account: SDR Million % Quota
Quota 27.50 100.00
Fund Holdings of Currency 20.90 76.00
Reserve Position 6.60 24.00
SDR Department: SDR Million % Allocation
Net cumulative allocation 25.82 100.00
Holdings 26.34 102.02
Outstanding Purchases and Loans: None.
Latest Financial Arrangements: None.
Projected Obligations to Fund (In millions of SDR):
Forthcoming
2013 2014 2015 2016 2017
Principal 0.00 0.00 0.00 0.00 0.00
Charges/Interest 0.00 0.00 0.00 0.00 0.00
Total 0.00 0.00 0.00 0.00 0.00
Implementation of HIPC Initiative: Not Applicable.
Implementation of Multilateral Debt Relief Initiative (MDRI): Not Applicable.
Implementation of Post-Catastrophe Debt Relief (PCDR): Not Applicable.

MONTENEGRO
INTERNATIONAL MONETARY FUND 3
Exchange Arrangement: Montenegro does not issue its own currency and has been using
the euro as legal tender since 2002. It has accepted the obligations under Article VIII.
Montenegro maintains an exchange system free of restrictions on the making of payments
and transfers for current international transactions, except with respect to pre-1992 blocked
foreign currency savings accounts and restrictions maintained for security purposes that
have not been notified to the Fund.
Latest Article IV Consultation: Concluded on July 22, 2013 (IMF Country Report
No. 13/271).
FSAP Participation: A Financial Sector Assessment Program was initiated in July 2006,
jointly with the World Bank, and concluded during the 2007 Article IV consultation. The
Executive Board discussed the Financial System Stability Assessment in January 2008
(IMF Country Report No. 08/50).
Technical Assistance in the Past 12 Months:
Department Timing Purpose
STA Sep-14 National Accounts Statistics
MCM Jul-14 Financial Stability Analysis, including Stress
Testing, Early Warning System
STA Jun-14 Consumer Prices/Producer Price
FAD Jun-14 Public Financial Management
STA Jun-14 National Accounts Statistics
MCM May-14 Reserve Management
STA Jan-14 Consumer Prices/Producer Price
STA Jan-14 National Accounts Statistics
In addition, technical assistance was available through resident advisors covering tax administration
and public financial management.
Resident Representative: None.

MONTENEGRO
4 INTERNATIONAL MONETARY FUND
WORLD BANK GROUP RELATIONS
1. Montenegro joined the World Bank Group (WBG) as an independent country in
January 2007. The Bank had implemented a program of lending and analytical work for
Montenegro for most of the period since the State Union of Serbia and Montenegro joined the WBG
in 2001. Six projects are currently active, with 1½ years before the end of the Montenegro’s second
Country Partnership Strategy (CPS) for the fiscal years 2011–15. The CPS was prepared at a time
when the country was striving to recover from a sharp economic contraction associated with the
2008 global and Eurozone crisis. In the wake of the crisis, the initially-envisaged total IBRD lending
of US$215.7 million was increased by nearly US$100 million. The lending program was
complemented by a mix of analytic and technical support aligned with the CPS pillars.
2. The Board approved the CPS in January 2011 and the CPS Progress Report in May
2014 extending the CPS by one year through FY15 as both CPS pillars—(i) strengthening institutions
and aligning them with European Union (EU) requirements in areas critical for longer-term
competitiveness in global markets; and (ii) improving environmental management—remain highly
relevant, and the additional year facilitates the delivery of the planned lending program. Also, with
uncertainties in the fiscal framework and public investment program, an additional year was deemed
helpful in gaining greater clarity on the likely medium-term macro-fiscal framework that would
underpin a new Country Partnership Framework (CPF) and influence planned lending volumes and
instruments.
Montenegro: World Bank Project Portfolio, November 2014
Project Name Date, Board
App
Net Comm
Amt ($m)
Total
Percent
Disb.
Percent Disb.
Ratio FY15 (as
of Oct. 2014)
Higher Education and Research for Innovation and
Competitiveness 01/24/2012 15.98 36.8 21.3
Energy Efficiency 12/09/2008 16.20 57.4 4.1
Montenegro Institutional Development and
Agriculture Strengthening 04/21/2009 15.70 66.7 19.3
Montenegro Institutional Development and
Agriculture Strengthening (GEF) 04/21/2009 4.00 58.1 21.8
Land Administration and Management 12/09/2008 16.20 71.3 19.6
Industrial Waste Management and Cleanup 09/19/2014 68.90 0.2 0.0
136.98 29.0 17.2
3. Within the CPS FY11–FY15, the IBRD Board approved five IBRD loans to provide
selective support to two key CPS priorities. The CPS originally envisaged a series of two financial
sector development policy operations (DPOs). In light of post-crisis needs, the second DPO was
converted into a larger financial sector policy-based guarantee (PBG) that supported a
comprehensive program of measures designed to strengthen the banking sector, address its
vulnerabilities, and bolster its resilience to possible future shocks. This support also led to advisory
work on nonperforming loans (NPL) resolution. Additional countercyclical stimulus was considered
through a Public Expenditure DPO, but did not materialize in FY13–14 given the remaining

MONTENEGRO
INTERNATIONAL MONETARY FUND 5
weaknesses in the medium-term fiscal framework. New investment lending was approved for a
Higher Education/R&D project (US$16 million), Energy Efficiency Additional Financing
(US$6.8 million) and an Industrial Waste Management and Clean-Up Project (US$69 million). The
committed portfolio has doubled since to US$137 million in 2014. About 71 percent of these
commitments remain to be disbursed.
4. Pipeline projects include (i) a Revenue Administration and Modernization Project building
on the recent tax administration assessment that aims to increase the effectiveness and efficiency of
tax administration as well as reduce the cost of compliance for the taxpayer; (ii) a Fiscal and Debt
Management technical assistance operation that aims to support strengthening the institutional
capacity of fiscal resources and public debt management; (iii) a Trade and Competitiveness project
that aims to provide support to the business environment, enterprise development and skills and
labor market development interventions; (iv) a second Health Improvement project that aims to
provide a support for financing reforms and governance for quality in the health sector.
5. Cooperation with the IMF has been good, particularly in the areas of macroeconomic
and financial sector policies. Bank and Fund teams coordinated closely during the preparation of
the Financial Sector DPL and Policy-Based Guarantee in 2011 and 2012 and the TA on NPL
resolution. The World Bank Group, through its ongoing and planned operations, as well its
complementary economic and sector work, will continue to provide input to the IMF on issues such
as (i) public expenditure, including pension and health reforms; (ii) business climate and
competitiveness, including labor market reform and the resolution of nonperforming loans;
(iii) public sector institutions and fiduciary reviews, (iv) agricultural assessments; and (v) statistical
capacity building and poverty monitoring. The Fund and Bank staff have sought each other’s input
in internal review processes.
Montenegro: Joint Management Action Plan - Bank and Fund Planned Activities in
Macro-critical Structural Reform Areas, January—December 2015
Title Products Provisional Timing of
Missions
Expected
Delivery Date
1. Fund work program Article IV staff report Fall 2015 January 2016
2. Bank work program Systematic Country
Diagnostics
TA on pension model PROST
Revenue Administration
Project
Fiscal and Debt
Management
February 2015
January-April 2015
February 2015
January 2015
March 2015
May 2015
April 2015
May 2013
3. Joint work program None None
Prepared by World Bank staff. Questions may be addressed to Sanja Madzarevic-Sujster, country economist
([email protected]), and Gallina A. Vincelette, lead economist Western Balkans

MONTENEGRO
6 INTERNATIONAL MONETARY FUND
STATISTICAL ISSUES
MONTENEGRO—STATISTICAL ISSUES APPENDIX
As of December 2014
I. Assessment of Data Adequacy for Surveillance
General: Data provision has some shortcomings, but is broadly adequate for surveillance. The most affected
areas are labor market indicators, and government finance statistics.
National Accounts: The Statistical Office of Montenegro (MONSTAT) compiles annual production and
expenditure accounts in current and previous year’s prices. The production GDP estimates are reconciled with
the expenditure GDP estimates through the supply and use framework (i.e. reconciling supply and use). The
quality of the annual GDP is good.
Montenegro started disseminating quarterly GDP by production using an indirect method in 2012, but the
methodology has room for improvement. The estimates are compiled at an aggregated level (mostly NACE
section level). The accuracy of the short term statistics needs to be improved, mostly for agriculture, and
construction. The latest national accounts TA mission in September 2014 continued working on developing
quarterly GDP. estimates by expenditure approach. Experimental estimates have been compiled; the official
dissemination will be in March 2015.
Price Statistics: MONSTAT compiles and disseminates a monthly consumer price index that broadly follows
international standards. MONSTAT continues to implement improvements to the producer price index.
Improvements include developing a total output PPI; expanding index coverage to include services and
construction; and updating index calculation methods. MONSTAT began compiling and disseminating the EU
harmonized consumer price indices, beginning in 2011. An export price index has been published since 2009,
and an industrial import price index since 2011. There is need to improve the industrial production index.
Labor market statistics: MONSTAT reports labor and wage statistics based on data from the labor force
survey (LFS) and administrative sources. The unemployment rate from the LFS is computed according to the
ILO definition. The quality of wage indicators is relatively good, but information on foreign employment
remains limited. The presence of a large informal sector impedes the accurate assessment of the
unemployment rate. Frequent methodological revisions also impair time series analyses.
Government Finance Statistics: Fiscal data are compiled by the Ministry of Finance (MOF) based on a new
GFS institutional classification, and, since early 2006, includes data on local governments and social security
funds. The latter was merged with the treasury account in 2010. The charter of accounts introduced in 2001 has
been implemented at the local level from mid-2005. Fiscal data reporting suffers from frequent re-
classifications. The MOF has established a unit responsible for data collection for state-owned enterprises, but
a satisfactory compilation of the public sector fiscal balance requires significant further effort. Data on
enterprises owned by municipalities are rarely available. Data on the stock of local government arrears need to
be significantly strengthened and disseminated. Data on stocks of financial assets and liabilities are incomplete.
The latest GFS TA mission in March 2013 recommended updating the table on the institutional structure of the
public sector to facilitate consistency among producers of official statistics. It was also recommended to
establish a migration plan to phase in the GFSM 2001 framework and to start publishing quarterly budgetary
central government data in the IFS.

MONTENEGRO
INTERNATIONAL MONETARY FUND 7
Monetary and Financial Statistics: Monetary and financial statistics are compiled by the Central Bank of
Montenegro (CBM), broadly following the institutional coverage, classification, and evaluation methodology
set forth in the Monetary and Financial Statistics Manual (2000). However, the monetary data are not reported
in IMF recommended Standardized Report Form format. Dissemination practices meet the recommendations
of the General Data Dissemination System (GDDS) with respect to the periodicity and timeliness for financial
sector data.
Beginning in early 2006, the CBM has published detailed monetary statistics in its monthly Statistical Bulletin,
which includes tables on monetary statistics, balance sheets and surveys for the CBM and commercial banks. At
the beginning of 2013, the CBM adopted new financial reporting requirements for banks in line with IAS 39; as
a result, monetary data for 2013 are not comparable with data from previous years.
Montenegro does not report Financial Soundness Indicators to the IMF.
External sector statistics: Balance of payments statistics are compiled by the CBM and follow international
reporting standards. External sector statistics have benefited from improvements undertaken by MONSTAT to
improve coverage, valuation, and classification of merchandise trade statistics. Data on imports and exports in
the BOP are compiled according to the special trade system. The CBM adjusts export and import data from
MONSTAT from CIF to FOB basis. The biggest challenge to the BoP statistics is the coverage of transactions
through the informal economy. As with many euroized economies, difficulty in estimating currency and
deposits and large errors and omissions continue to be an issue in the balance of payment statistics. Although
current account statistics have been revised recently, errors and omissions are still large and with a persistent
positive sign, largely due to an underestimation of the export of tourism services. The CBM has made progress
in improving the recording of transactions via the ITRS by refining the transactions coding system and
increasing interaction with commercial banks. However, the ITRS remains inadequate for recording a broad
range of balance of payments transactions such as reinvested earnings and trade credits. Further, the ITRS
records transactions on a cash basis, whereas balance of payments transactions should be recorded on an
accruals basis. The CBM still needs to undertake a small number of direct surveys of enterprises to supplement
the data received through the ITRS, and prepare comprehensive documentation on compilation methods and
data sources. The CBM has expressed its interest in reporting BoP statistics under the presentation of the sixth
edition of the Balance of Payments and International Investment Position Statistics Manual (BPM6).
The CBM has received TA on International Investment Position (IIP) statistics, but does not yet disseminate
these data. More recently, the CBM has conveyed to STA continuous difficulties with compiling and
disseminating IIP statistics.
The latest BoP TA mission in January 2013 concluded with the following action items: (i) the compilation and
regular dissemination of the IIP and external debt statistics; (ii) the revision of the compilation of the flows in
currency and deposits assets by other sectors; and (iii) the improvement of the currently estimation procedure
for the item Compensation of Employees (credit).
II. Data Standards and Quality
Participant in the Fund’s General Data Dissemination
System (GDDS) since December 2011. The latest
update of metadata and GDDS plans for improvement
were in 2012.
No data ROSC available.

MONTENEGRO
8 INTERNATIONAL MONETARY FUND
Table of Common Indicators Required for Surveillance
(As of end-Dec 2014) 1 Any reserve assets that are pledged or otherwise encumbered should be specified separately. Also, data should comprise short-
term liabilities linked to a foreign currency but settled by other means as well as the notional values of financial derivatives to pay
1Any reserve assets that are pledged or otherwise encumbered should be specified separately. Also, data should comprise
short-term liabilities linked to a foreign currency but settled by other means as well as the notional values of financial derivatives to
pay and to receive foreign currency, including those linked to a foreign currency but settled by other means.
2 Both market-based and officially-determined, including discount rates, money market rates, rates on treasury bills, notes and
bonds.
3 Foreign, domestic bank, and domestic nonbank financing.
4 The general government consists of the central government (budgetary funds, extra budgetary funds, and social security funds) and
state and local governments.
5 Including currency and maturity composition.
6 Includes external gross financial asset and liability positions vis-à-vis nonresidents.
7 Daily (D); weekly (W); monthly (M); quarterly (Q); annually (A); irregular (I); and not available (NA).
Date of latest
Observation )
Date Received Frequency of
Data7
Frequency of
Reporting7
Frequency of
Publication7
International Reserve Assets and
Reserve Liabilities of the Monetary
Authorities1
Oct-2014 21-Nov-2014 M M M
Reserve/Base Money Oct-2014 21-Nov-2014 M M M
Central Bank Balance Sheet Oct-2014 21-Nov-2014 M M M
Consolidated Balance Sheet of the
Banking System Oct-2014 21-Nov-2014 M M M
Interest Rates2 Oct-2014 21-Nov-2014 M M M
Consumer Price Index Oct-2014 21-Nov-2014 M M M
Revenue, Expenditure, Balance and
Composition of Financing3 – General
Government4
Sept-2014 21-Oct-2014 Q Q Q
Revenue, Expenditure, Balance and
Composition of Financing3– Central
Government
Sept-2014 21-Oct-2014 M M M
Stocks of Central Government and
Central Government-Guaranteed Debt5 Sept-2014 24-Oct-2014 Q Q Q
External Current Account Balance Q3-2014 21-Nov-2014 Q Q Q
Exports and Imports of Goods and
Services Q3-2014 21-Nov-2014 Q Q Q
GDP/GNP Q2-2013 24-Sept-2014 Q Q Q
Gross External Debt
-- -- NA NA NA
International Investment Position6 -- -- NA NA NA

Press Release No. 15/31 FOR IMMEDIATE RELEASE February 4, 2015
IMF Executive Board Concludes 2014 Article IV Consultation with Montenegro On January 23, 2015 the Executive Board of the International Monetary Fund (IMF) concluded the Article IV consultation with Montenegro.1 Economic momentum slowed in 2014, but growth is expected to accelerate in 2015, aided by expenditures on the highway project. Nonetheless, Montenegro is vulnerable to a downturn in external demand, and substantial financing needs expose the country to shifts in risk aversion and disruptions to global financial markets. The authorities have undertaken bold fiscal adjustment over the past years, reflecting a combination of tax hikes, pension freezes, and efforts to increase tax compliance. Measures in the draft 2015 budget that partly offset the extra spending on the highway are welcome, but a sustained period of fiscal discipline will be needed nonetheless. Laying out clear and credible long-term plans for managing the public finances, including savings on pensions and the public sector wage bill, would boost credibility and reduce risks to market access. In addition, the authorities should define contingency measures to address unforeseen fiscal shocks, with the first recourse being a delay or cut in highway spending. Addressing non performing loans and improving credit conditions are priorities. The “Podgorica Approach” has the potential to facilitate debt workouts; this effort should be complemented by reforms to address problems with contract enforcement and securing collateral. Although provisioning coverage for the banking system as a whole appears sizable on a regulatory basis, the wide variation across banks may warrant enhanced supervisory scrutiny. There is scope to improve transparency, including by publishing quarterly banking reports with information on the level of regulatory provisions and all stress test results. Structural reforms are essential to raise potential growth and improve flexibility and competitiveness. Bolstering the economy’s ability to respond to macroeconomic shocks is especially important in a country lacking its own currency and with decreasing fiscal buffers. Measures to ensure that wages adjust in line with productivity developments and to reduce
1 Under Article IV of the IMF's Articles of Agreement, the IMF holds bilateral discussions with members, usually every year. A staff team visits the country, collects economic and financial information, and discusses with officials the country's economic developments and policies. On return to headquarters, the staff prepares a report, which forms the basis for discussion by the Executive Board.
International Monetary Fund 700 19th Street, NW Washington, D. C. 20431 USA

2
disincentives for employment would improve labor market outcomes. Sustaining recent policy momentum to strengthen the business environment and spur investment is also critical to broaden the economic base. Executive Board Assessment2 The directors noted that moderate growth continues, but the outlook remains challenging, and risks weigh on the downside, including from external spillovers. Against this backdrop, Directors underscored the need for continued fiscal discipline, further efforts to strengthen the banking sector, and comprehensive structural reforms to address macroeconomic vulnerabilities and spur growth. Directors commended the authorities’ efforts to address fiscal imbalances in recent years. While recognizing the potential impact on economic growth, they noted that the Bar-Boljare highway project places a large burden on public finances and exacerbates debt and financing risks. Directors underscored that the underlying fiscal restraint embedded in the 2015 budget needs to be sustained to contain fiscal risks and ensure debt sustainability. In this context, they encouraged the authorities to lay out a clear long-term consolidation strategy, including further measures to reform the pension system and reduce the public-sector wage bill. Directors stressed that contingent fiscal measures should be identified to address unanticipated shocks. They welcomed ongoing efforts to reduce support to state-owned entities, and called for the timely completion of the sale of the aluminum producer KAP. Directors observed that banking system health indicators are mixed. Capitalization has improved and liquidity appears sufficient, but profitability has been weak and the large stock of non-performing loans burdens balance sheets and impedes lending. They agreed that improving credit conditions is a top priority, and welcomed the draft law on voluntary financial restructuring. Reforms to bolster contract and collateral enforcement are also needed. Directors agreed that the wide variation of provisioning coverage across banks warrants a strong supervisory scrutiny over banks’ classification and collateral valuation practices. They saw merit in taking steps to enhance regulatory transparency and reporting. Directors underscored the importance of reforms to boost competitiveness and economic flexibility. They emphasized that improving labor market outcomes is necessary to boost growth potential and help contain long-term fiscal pressures. Lasting improvements require measures to ensure wages adjust in line with productivity and to reduce informal employment incentives. Directors also encouraged the authorities to sustain progress in improving the business and investment environments so as to promote economic diversification and boost long-term growth.
2 At the conclusion of the discussion, the Managing Director, as Chairman of the Board, summarizes the views of Executive Directors, and this summary is transmitted to the country's authorities. An explanation of any qualifiers used in summings up can be found here: http://www.imf.org/external/np/sec/misc/qualifiers.htm.

3
Montenegro: Selected Economic Indicators
2010 2011 2012 2013 2014 2015
Proj. Proj.
Output, prices and labor market (percent change, unless otherwise noted)
Real GDP (percent change) 2.5 3.2 -2.5 3.3 2.0 4.6
Nominal GDP (in millions of euro) 3,104 3,234 3,149 3,327 3,387 3,588
Industrial production 17.5 -10.3 -7.1 10.6 -- --
Tourism (Overnight stays) 5.5 10.2 4.3 2.8 -- --
Unemployment rate (in percent) 1/ 19.7 19.7 19.7 19.5 -- --
Consumer prices (average) 0.7 3.1 3.6 2.2 -0.6 1.2
Consumer prices (end of period) 0.7 2.8 5.1 0.3 0.6 0.9
General government finances (percent of GDP) 2/
Revenue and grants 41.3 38.5 40.0 41.5 42.9 42.1
Expenditure 45.9 43.8 45.9 44.8 43.8 47.5
Fiscal balance -4.6 -5.2 -5.9 -3.3 -0.9 -5.3
Primary fiscal balance -3.6 -3.8 -4.0 -1.1 1.4 -3.1
General government gross debt 40.9 46.0 54.0 58.2 58.5 60.7
Monetary sector (end-period, percent change)
Bank credit to private sector -8.9 -13.0 -3.1 2.1 -3.6 3.2
Enterprises -11.2 -20.3 -4.9 0.1 -- --
Households -5.7 -3.2 -1.1 3.7 -- --
Private sector deposits 5.9 1.2 7.2 5.4 -- --
Balance of payments (percent of GDP, unless otherwise noted)
Current account balance -22.9 -17.7 -18.7 -14.6 -15.1 -20.2
Exports of goods and services 37.3 42.7 44.1 41.8 40.5 40.4
Imports of goods and services -63.2 -64.9 -68.8 -62.1 -61.0 -66.0
Foreign direct investment 17.8 12.0 14.7 9.7 9.7 10.6
External debt 3/ 115.5 117.6 126.6 128.7 132.9 137.5
REER (CPI-based; average change, in percent; 2.8 -3.2 3.3 -1.1 -- --
+ indicates appreciation)
Sources: Montenegro authorities; and IMF staff estimates and projections 1/ Labor Force Survey (LFS) data. 2/ Includes extra-budgetary funds and local governments, but not public enterprises. 3/ Staff estimates, as private debt statistics are not officially published.

Statement by Menno Snel, Executive Director for Montenegro and Andrijana Cudina, Advisor to Executive Director
January 23, 2015
The Montenegrin authorities thank staff for the very constructive dialogue during their mission in Montenegro. They appreciate staff’s comprehensive analysis and broadly agree with their assessments and policy recommendations. Discussions have helped the authorities to frame the policy measures needed to boost growth and resilience of the economy, and safeguard the fiscal sustainability going forward. Economic developments and outlook
The Montenegrin economy continues to grow against a challenging background. Real GDP rebounded by 3¼ percent in 2013, but has weakened in 2014 and looks likely to be close to 2½ percent for the year. The slowdown is attributable to the weakened external demand and the floods in the region. However, positive developments have been registered in tourism, construction, forestry and the retail trade. Although employment is on the rise, the unemployment rate is persistently high. Inflation has fallen sharply but remains in positive territory. Credit growth has still not recovered. The external position remains vulnerable, although the ongoing political uncertainties in the region so far have had only limited effects on the foreign direct investments and tourism performance. The medium-term growth is expected to converge to about 3 percent backed by a number of ambitious, large-scale investment projects, including the start of the first stage of the Bar-Boljare highway (costing a quarter of the national product), as well as projects in the energy sector and tourism. The authorities expect positive spillover effects from these projects to the rest of the economy. The highway is especially critical in this regard, not only in economic terms, but also for safety reasons, regional development and broader integration. However, there are clear risks to the outlook, given the country’s high dependence on foreign capital inflows and substantial refinancing needs, and it’s vulnerability to downturns in external demand. Fiscal policy
The fiscal consolidation continued with laudable adjustments in the last two years, narrowing the overall deficit from -5.9 in 2012 to -0.9 percent of GDP in 2014. Important steps including higher taxes, a freeze on pensions, and measures to fight the grey economy contributed to such significant consolidation. Nonetheless, the public debt is on the rise reaching 58 percent of GDP in 2014. The authorities agree with staff that, given the cost of the highway, strong fiscal discipline will be needed to preserve the sustainability of public finances. The recently adopted budget for 2015 envisages appropriate measures which are expected to result in further improvement in the budget balance (excluding the highway spending). Apart from better

2
revenue collection, the focus is on rationalization of the current expenditures, while the capital expenditures will be limited to essential infrastructural projects. The wage and pension bill as well as social transfers will be contained. Although staff expressed concerns about non-renewing of the pension freeze in 2015, the expenditure adjustment to the pensions is likely to be on the downside since they will follow the cost of living and the average wages in the economy which are both on a declining path. As for the fiscal rule, the authorities agree with staff that there is room for further strengthening of the framework. They have also made progress in divesting from state-owned companies. A positive example is the long-lasting issue of the aluminum plant (KAP) which was successfully sold to a new owner. However, full payment is still pending due to a prolonged court procedure. Privatization of the shipyards is also expected to start soon. Public debt sustainability
Staff’s public debt sustainability analysis (DSA) indicates serious vulnerability of the Montenegrin public finances in different scenarios. In the authorities’ view, the underlying drivers of the debt trajectory presented in the Staff Report are not fully capturing the spillover effects from the infrastructural projects on growth and inflation, which will likely mitigate the debt dynamics. Also, caution is warranted when interpreting the results of the shock-to-growth scenario, given the high volatility of domestic growth in the past. As staff points out, the medium-term financing needs are considerable. In the authorities’ view, the financial burden to the budget from the repayment of the highway loan may be somewhat overstated. The terms under which the loan for the first stage was signed with the Chinese partners are rather favorable. The annual installments of about EUR 50-60 million (taking into account the revenues from tolling, the net fiscal burden would amount to about EUR 25 million annually) are manageable. If the construction is finished as planned by 2019 the budget would have two years of receiving tolls before the first installment is due. Regarding the exchange rate risks, the authorities are prepared to consider a swap arrangement. In the event of shocks to public finance and unanticipated highway cost over-runs, the authorities are prepared to lay out a contingent consolidation plan. Cutting or delaying spending on the highway in the middle of the construction process would be counterproductive in their view. Instead, they would focus on tackling the current budget expenditures and boosting revenues, possibly through stronger taxation of goods like alcohol, tobacco and oil derivatives. Monetary policy and financial system
The Montenegrin banking sector is sound and liquid, as indicated by the liquidity and solvency ratios. However, the banks are operating in a challenging environment which is reflected in their tight lending policy, weak credit activity and low profitability. Despite recent improvements, the level of non-performing loans is still high at around 17 percent.

3
The authorities are taking comprehensive measures to address these challenges. The new regulatory framework on voluntary financial restructuring (Podgorica Approach) will be an important step to elevate the debt burden for solvent but illiquid companies and gradually facilitate the reduction in NPLs. From a financial sector perspective, closer monitoring of factoring companies would also have positive effects, given their important role in this process. The high level of lending interest rates is another major concern, as it hampers the resolution of NPLs and holds back new lending. Given the complexity of the underlying factors that contribute to such financing conditions, efforts are being made to reduce market inefficiencies stemming from the lack of competition and limited business opportunities. Despite the limitations of a small market, addressing structural credit risks will be the key to revive lending activity. Strengthening the institutions and legal framework as well as the rule of law, especially contract enforcement, is the priority in this regard. Competitiveness and structural reforms
The authorities recognize that structural reforms remain essential to raise potential growth and improve the flexibility and competitiveness of the economy. Their priority areas are the labor market, the pension system and the business environment. Labor market reforms are crucial given the high unemployment and low participation rate. Several reform initiatives have been implemented to increase the labor market flexibility by reducing dismissal costs and simplifying hiring. A temporary government-funded program for graduates is also in place with the aim to help integrating the young into the labor market. Efforts are made to better match the educational system and the labor market needs. Streamlining of the social benefits through the introduction of “social cards” will increase the transparency of the system and reduce the disincentives to work. With regard to the pension system, the ongoing reforms aim to reduce the deficit of the Pension Fund to a sustainable level, through better collection of contributions and stricter retirement rules. The Montenegrin business environment stands relatively well in a regional context. The latest improvement, from the 42nd to the 36th position on the World Bank’s Doing business 2015 list, is mostly due to the improvements in obtaining construction permits, which is critical for the upcoming tourism projects. However, the procedures for starting a business, enforcing contracts, registering property, and tax collection remain very challenging. In addition to focusing on these priorities, the authorities also focus on attracting FDI, which is essential to promote economic diversification. Along with efforts to simplify the investment procedures, they are considering new incentives for foreign investors.