imagerie et spectroscopie térahertz: application aux
TRANSCRIPT
HAL Id: tel-01343342https://tel.archives-ouvertes.fr/tel-01343342
Submitted on 8 Jul 2016
HAL is a multi-disciplinary open accessarchive for the deposit and dissemination of sci-entific research documents, whether they are pub-lished or not. The documents may come fromteaching and research institutions in France orabroad, or from public or private research centers.
L’archive ouverte pluridisciplinaire HAL, estdestinée au dépôt et à la diffusion de documentsscientifiques de niveau recherche, publiés ou non,émanant des établissements d’enseignement et derecherche français ou étrangers, des laboratoirespublics ou privés.
Imagerie et spectroscopie térahertz : application auxproblématiques de défense et de sécurité
Joyce Bou Sleiman
To cite this version:Joyce Bou Sleiman. Imagerie et spectroscopie térahertz : application aux problématiques de défense etde sécurité. Other [cond-mat.other]. Université de Bordeaux, 2016. English. �NNT : 2016BORD0077�.�tel-01343342�
THÈSE PRÉSENTÉE
POUR OBTENIR LE GRADE DE
DOCTEUR DE
L’UNIVERSITÉ DE BORDEAUX
ÉCOLE DOCTORALE DES SCIENCES PHYSIQUES ET DE L’INGENIEUR
SPÉCIALITÉ LASERS, MATIÈRE ET NANOSCIENCES
Joyce BOU SLEIMAN
Terahertz Imaging and Spectroscopy: Application to Defense and Security
Sous la direction de : Patrick MOUNAIX
Soutenue le 02 Juin 2016 Membres du jury : M. DEVAL Yann Professeur Université de Bordeaux Président Mme. COQUILLAT Dominique Directeur de recherche Université de Montpellier Rapporteur M. LAMPIN Jean-François Directeur de recherche Université de Lille 1 Rapporteur M. BOUSQUET Bruno Maître de conférences Université de Bordeaux Examinateur M. CHUSSEAU Laurent Directeur de recherche Université de Montpellier Examinateur M. FISCHER Bernd Docteur Institut franco-allemand de recherche de Saint-Louis Examinateur M. GUILLET Jean-Paul Maître de conférences Université de Bordeaux Examinateur M. MOUNAIX Patrick Directeur de recherche Université de Bordeaux Directeur de thèse Mme. DEFAYE-GENESTE Christelle Directrice chez Le Groupe La Poste Invité
II
Abstract in English
Terahertz Imaging and Spectroscopy: Application to Defense and Security
The aim of this work is to demonstrate the potential and capabilities of terahertz
technology for parcels screening and inspection to detect threats such as weapons and
explosives, without the need to open the parcel.
In this study, we first present terahertz time-domain spectroscopy and spectral imaging
for explosives detection. Two types of explosives as well as their binary mixture is analyzed.
Due to the complexity of extracting information when facing such mixtures of samples, three
chemometric tools are used: principal component analysis (PCA), partial least square analysis
(PLS) and partial least squares-discriminant analysis (PLS-DA). The analyses are applied to
terahertz spectral data and to spectral-images in order to: (i) describe a set of unknown data
and identify similarities between samples by PCA; (ii) create a classification model and
predict the belonging of unknown samples to each of the classes, by PLS-DA; (iii) create a
model able to quantify and predict the explosive concentrations in a pure state or in mixtures,
by PLS.
The second part of this work focuses on millimeter wave imaging for weapon detection
in parcels. Three different imaging techniques are studied: passive imaging, continuous wave
(CW) active imaging and frequency modulated continuous wave (FMCW) active imaging.
The performances, the advantages and the limitations of each of the three techniques, for
parcel inspection, are exhibited. Moreover, computed tomography is applied to each of the
three techniques to visualize data in 3D and inspect parcels in volume. Thus, a special
tomography algorithm is developed by taking in consideration the Gaussian propagation of
the wave.
Keywords: Time-domain terahertz spectroscopy, Chemometrics, PCA, PLS, PLS-DA,
Passive imaging, active imaging, Continuous wave (CW), Frequency modulated continuous
waves (FMCW), Computed tomography.
III
Abstract in French
Imagerie et Spectroscopie Térahertz : Application aux Problématiques de
Défense et de Sécurité
Le but de ce travail est de quantifier le potentiel et les capacités de la technologie
térahertz à contrôler des colis afin de détecter les menaces telles que les armes et les
explosifs, sans avoir besoin d'ouvrir le colis.
Dans cette étude, nous présentons la spectroscopie térahertz résolue en temps et
l'imagerie multi-spectrale pour la détection des explosifs. Deux types d’explosifs, ainsi que
leurs mélanges binaires sont analysés. En raison de la complexité de l'extraction des
informations face à tels échantillons, trois outils de chimiométrie sont utilisés: l’analyse en
composantes principales (ACP), l'analyse des moindres carrés partiels (PLS) et l'analyse des
moindres carrés partiels discriminante (PLS-DA). Les méthodes sont appliquées sur des
données spectrales térahertz et sur des images spectrales pour : (i) décrire un ensemble de
données inconnues et identifier des similitudes entre les échantillons par l'ACP ; (ii) créer des
classes, ensuite classer les échantillons inconnus par PLS-DA ; (iii) créer un modèle capable
de prédire les concentrations d’un explosif, à l'état pur ou dans des mélanges, par PLS.
Dans la deuxième partie de ce travail, nous présentons l'imagerie par les ondes
millimétriques pour la détection d'armes dans les colis. Trois techniques d'imagerie
différentes sont étudiées : l'imagerie passive, l’imagerie active par des ondes continues (CW)
et l’imagerie active par modulation de fréquence (FMCW). Les performances, les avantages
et les limitations de chacune de ces techniques, pour l’inspection de colis, sont présentés. En
outre, la technique de reconstruction tomographique est appliquée à chacune de ces trois
techniques, pour visualiser en 3D et inspecter les colis en volume. Dans cet ordre, un
algorithme de tomographie spécial est développé en prenant en considération la propagation
gaussienne de l'onde.
Mots-clés: Spectroscopie térahertz résolue en temps, Chimiométrie, ACP, PLS, PLS-DA,
Imagerie passive, Imagerie active, Onde continue, Modulation de fréquence, Tomographie.
IV
Acknowledgements
Three years of learning, experience, work, with fun and enthusiasm wouldn’t be possible
without every person who was present during this period…. I may not mention here every name, but I
will never forget every face.
First, I want to thank the ANR, La Poste and CNRS for funding my thesis.
I want to thank the two laboratories that hosted me, LOMA (Laboratoire Ondes et Matiere
d’Aquitaine) and IMS (laboratoire de l’Integration du Materiau au Systeme), M. Delville, M. Pellet
and M. Deval.
I would like to thank my jury members: Dominique Coquillat, Jean-François Lampin, Laurent
Chusseau, Christelle Defaye-Geneste, Yann Deval and Bernd Fischer, for accepting to evaluate my
work.
I would like to thank Norbert Palka from the Military University of Technology in Poland for
his help providing me the samples I needed for the analysis. Also, I would like to thank Sebastian
Engelbrecht, Lionel Merlat and Bernd Fischer for hosting me during one week in the French-German
Research Institute of Saint-Louis (ISL).
I would like to thank the collaborators in the InPoSec project: La Poste (Mme Defaye-Geneste,
M. Eggers, M. Richon, M. Malveau, Mlle Connet), Spykenet technology, Datalone, Sodexi, Deutsche
post, Mic, MC2, Teraview.
A big ‘thank you’ for my supervisor Patrick Mounaix that I cannot see as a boss, but more as a
leader who takes your hand and help you go up the stairs. Thank you for being a family for me. A big
thanks from the heart to Bruno Bousquet, Jean-Paul Guillet, Jean-Baptiste Perraud and Benoit Recur,
who were there every time I needed help. Bruno, I am amazed by the positive energy you give to
every person around you. You motivated me, not only in my studies, but also in diving. Thank you for
all the long meetings that we did even during conferences, for all the ideas that you gave me, for the
enthusiasm you shared with me and for every support! JP…, my guardian angel, thanks to you, I was
able to start my PhD, you helped in the first day, all along the three years, and you were by my side
even in the longest last day!! I am thankful for knowing you and I am grateful to have you, not only as
a colleague but as a dear friend. JB,… where should I start? From the office, the experiments room,
the meetings, the work trips, or from the lunches, friend’s trips and events, you were almost there in
every experience, even under water! Thank you for the conversations, for the support and for the help
you gave me all along these years. Thank you Ben for the long explanations, for your time and the for
the ICTMS opportunity.
A special thanks from the heart to Josette El Haddad. Thank you Josy, for being more than a
friend, for all the support, the smiles, the tears, the ideas, the fun, the wildness that we shared.. and
even more things yet to come.
I want to thank all the SLAM group, especially Lionel, Inka and Yannick for their warm
welcoming and support in a friendly environment, and all my friends: Nadezda, Konstantin, Gautier,
Arnaud, Nicolas, Anne-Lise, Wendey, Faten.
V
I want to thank the laser group: Dean, Frédéric D., Frédéric F., Hugo, Mingming, Michal, Amel
for their support and motivations, especially in the last period.
I would like to thank Mme Manieu from CNRS and M. Meadeb for easing my administrative
mission.
I would like to thank Suzanne, William, Sebastien, Bernadette, Richard, Hassan, Sandra, Eddie,
Alain, Annie for helping me during my stay in LOMA.
I would like to thank Simone, Christine, Serge, Regis and all the ‘info’ team for helping me
during my stay in IMS.
I would like to thank Philippe Cluzeau and LabexAmadeus for giving me the opportunity to
participate in the science diffusion missions. I would like to thank the UF of physics for giving me the
opportunity to teach at their departement. I would like to thank ED SPI, Mme Bordes, M. Audoin and
M. Mevel for their help.
The UCB1 .. Love you all. And the karate group, I wish that I was able to spend more time with
you.
I want to say thank you my friends for being here: Quentin (amazing president, non Spidoc or
SPIE chapter can be successful without you), Lena (l 7elwi Lena…), Antoine (we should try
Rock’n’Roll under water), Ludo (my music encyclopedia and PC formatter), David (my TP
colleague), Rim (I still want to do the ‘henne’), Alex (I am stronger than you in karate!), Marion M.
(best place for a party), Fabien & Rokhaya (amazing lunches), Marion C. my terahertz girl, with
whom I spend amazing and amusing conferences that I will never forget, Eddy A. for the up and
downs, for the motivations and especially for the matlab code of Sunday after noon, Alain for
supporting my yelling during the moments of anger and for the ‘kafta w batata’ that I never ate.
Thank you my Lebanese friends for being there: Rapho, Bach, Bob: for every moment with you
and the amazing friendship that we share, Diaa (jarte and my alarm), Eddy O. and Charbel (thank you
for the daily calls to check if I am still alive), Bader (for all the advices). Thank you Christelle,
Karmen, Fares, Elianne, Pia, Grace, Pierrot, Georges, Thalia, kiki, Joe, Mireille for being around. A
lovely thanks to Luce who always helped me and was one of the reasons that made me start the thesis,
and Tantoun for being there even if you were not, and for all the support that you gave me every time
I needed it.
I want to thank my family, even if a ‘thank you’ won’t be enough. Thank you for supporting
me all these years! and sorry for being far during the hardest days… you will always be the smile in
my thoughts.
And finally I want to say thank you my God for providing me power in the weakest moments
and putting on my path amazing people.
I
Table of Contents
List of Figures.............................................................................................................................. V
List of Tables .............................................................................................................................. XI
Acronyms ................................................................................................................................. XII
Introduction .................................................................................................................................. 1
General Introduction to terahertz waves and threats analysis ................................. 5 CHAPTER I
I. Terahertz technology ....................................................................................................... 5
I.1. Introduction ............................................................................................................. 5
I.2. Terahertz sources .................................................................................................... 7
I.2.1. Thermal sources ................................................................................................... 7
I.2.2. Solid-state electronic sources ............................................................................... 8
I.2.3. Vacuum electronic sources ................................................................................... 8
I.2.4. Terahertz laser sources ......................................................................................... 9
I.2.5. Sources driven by lasers ..................................................................................... 10
I.3. Terahertz detectors ................................................................................................ 10
I.3.1. Photoconductive antenna .................................................................................... 10
I.3.2. Electro-optic sampling ....................................................................................... 11
I.4. Basic applications ................................................................................................. 11
II. Parcel threats inspection ................................................................................................ 12
II.1. Explosives composition ........................................................................................ 13
II.2. Explosives detection techniques ........................................................................... 16
II.2.1. Animals ............................................................................................................. 16
II.2.2. Nuclear technologies ......................................................................................... 16
II.2.3. X-ray ................................................................................................................. 17
II.2.4. Ion mobility spectrometry ................................................................................. 18
II.2.5. Mass spectrometry ............................................................................................ 19
II.2.6. Raman spectroscopy ......................................................................................... 19
II.2.7. Sensors .............................................................................................................. 20
II.2.8. Technology comparison .................................................................................... 20
III. Terahertz security applications ..................................................................................... 21
II
III.1. Terahertz for weapons detection ........................................................................... 21
III.2. Terahertz for explosives detection ........................................................................ 24
Conclusion ............................................................................................................................. 27
Chemometrics applied to Terahertz spectroscopy and spectral imaging for CHAPTER II
explosive detection ................................................................................................................................ 29
I. Time-domain terahertz spectroscopy ............................................................................ 29
I.1. Introduction to terahertz spectroscopy .................................................................. 29
I.2. Transmission and reflection setups ....................................................................... 31
I.3. Terahertz generation and detection by photoconductive antennas ........................ 33
I.4. Beam propagation parameters ............................................................................... 35
I.5. Time domain principal .......................................................................................... 36
I.6. Signal processing and noise reduction .................................................................. 41
I.7. Reference selection ............................................................................................... 42
I.8. Mixture samples analyses ..................................................................................... 45
I.9. Synthesis ............................................................................................................... 47
II. Spectroscopic analysis of packaging materials ............................................................. 48
II.1. Samples used in postal chain................................................................................. 48
II.2. Terahertz spectroscopy through packaging ........................................................... 49
II.3. Imaging through packaging................................................................................... 50
II.4. Synthesis ............................................................................................................... 52
III. Chemometric tools ........................................................................................................ 53
III.1. Principal component analysis ................................................................................ 54
III.2. Partial Least Squares ............................................................................................. 56
III.3. Partial Least Square-Discriminant Analysis ......................................................... 57
III.4. Scaling ................................................................................................................... 57
III.5. Number of components and outliers ..................................................................... 58
III.6. Data scatter plot .................................................................................................... 59
III.7. Validation parameters ........................................................................................... 60
III.8. Synthesis ............................................................................................................... 61
IV. Chemometrics applied to terahertz spectroscopy for explosive detection ................ 61
IV.1. Sample preparation protocol ................................................................................. 61
IV.2. Absorbance spectra of RDX and PETN explosives .............................................. 63
III
IV.3. Partial least square analysis for quantification of explosives ................................ 65
V. Chemometrics applied to terahertz spectral-imaging .................................................... 69
V.1. Pre-processing ....................................................................................................... 70
V.2. Image descriptors .................................................................................................. 71
V.3. Chemometric analysis applied to terahertz images ............................................... 72
V.3.1. Principal component applied to pellet of compact powder ............................... 72
V.3.2. Principal component applied to non-compact powder in transmission ............ 74
V.3.3. Principal component applied to non-compact powder in reflection ................. 76
V.4. Chemometrics applied to terahertz explosive images ........................................... 77
V.4.1. Description by principal component analysis ................................................... 78
V.4.2. Classification by partial least square-discriminant analysis ............................. 80
V.4.2.1. Central zone of the pellets ............................................................................ 83
V.4.2.2. Restricted frequency band [1.5-3] THz ........................................................ 84
V.4.3. Merging PLS spectral and spectral-imaging models ........................................ 85
Conclusion ............................................................................................................................. 86
Multi-dimensional millimeter wave imaging for parcel inspection ................... 88 CHAPTER III
I. Passive millimeter wave imaging ................................................................................. 88
I.1. Planck’s law and blackbody emission ................................................................... 89
I.2. Passive millimeter wave imaging.......................................................................... 91
I.2.1. Passive millimeter waves concept and setup ...................................................... 91
I.2.2. Passive millimeter waves imaging results .......................................................... 94
I.2.3. Rotational stage .................................................................................................. 96
I.3. Synthesis ............................................................................................................... 96
II. Active continuous wave imaging .................................................................................. 97
II.1. Source ................................................................................................................... 97
II.2. Detector ................................................................................................................. 98
II.3. Continuous wave setup ......................................................................................... 98
II.4. Beam propagation parameters and resolution criteria ........................................... 99
II.5. Imaging results .................................................................................................... 103
II.6. Artifacts ............................................................................................................... 105
II.7. Synthesis ............................................................................................................. 112
III. Frequency modulated continuous wave imaging ........................................................ 113
IV
III.1. Concept description ............................................................................................. 113
III.2. Frequency modulated continuous wave setup ..................................................... 113
III.3. Imaging results .................................................................................................... 116
III.4. Synthesis ............................................................................................................. 118
IV. Terahertz computed tomography ............................................................................ 119
IV.1. Introduction to computed tomography ................................................................ 119
IV.2. Iterative algorithms for CW terahertz tomography ............................................. 121
IV.3. OSC reconstruction applied to parcels inspection ............................................... 123
IV.4. Segmentation of the reconstructed volume ......................................................... 126
IV.5. Synthesis ............................................................................................................. 127
Conclusion ........................................................................................................................... 128
General conclusion and perspectives ........................................................................................ 129
Bibliography ............................................................................................................................. 132
Summary in French .................................................................................................................. 144
Author contribution .................................................................................................................. 151
V
LIST OF FIGURES
Figure 0.1: Intended concept with the presence of terahertz technology in the postal chain
scanning process. .................................................................................................................................... 3
Figure I.1 : Terahertz positioning in the electromagnetic spectrum, the terahertz band is
localized between microwaves and infrared. .......................................................................................... 6
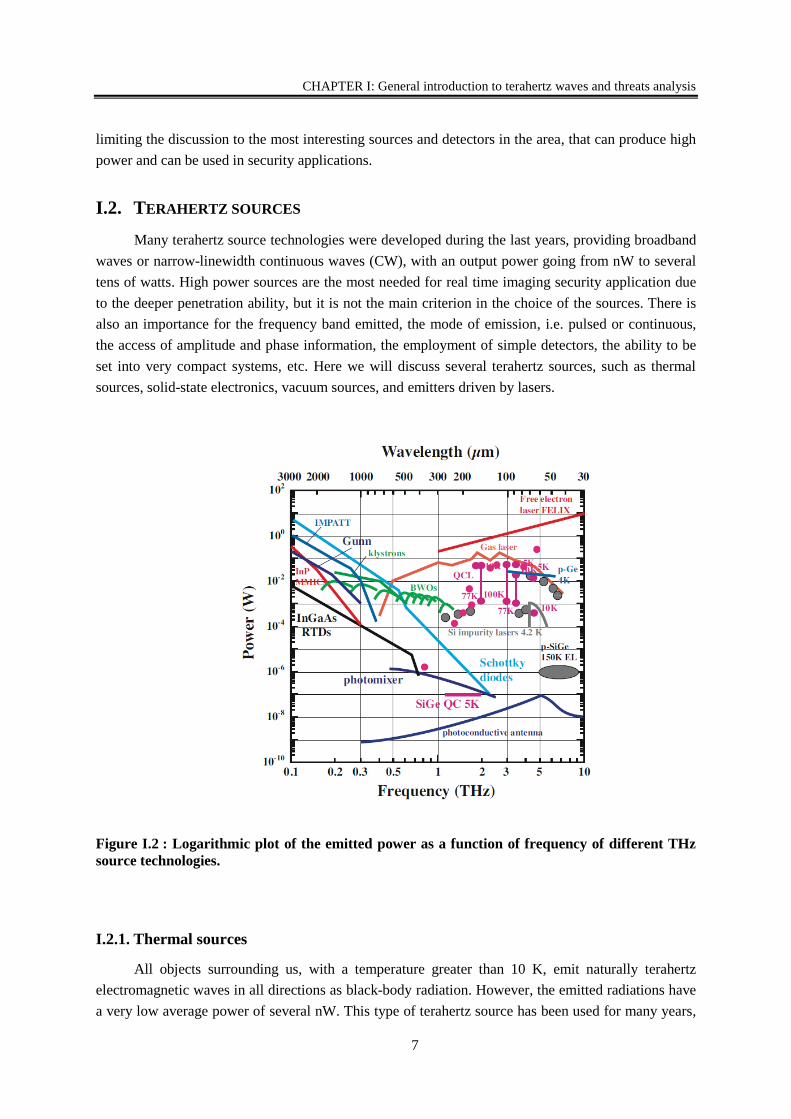
Figure I.2 : Logarithmic plot of the emitted power as a function of frequency of different THz
source technologies. ................................................................................................................................ 7
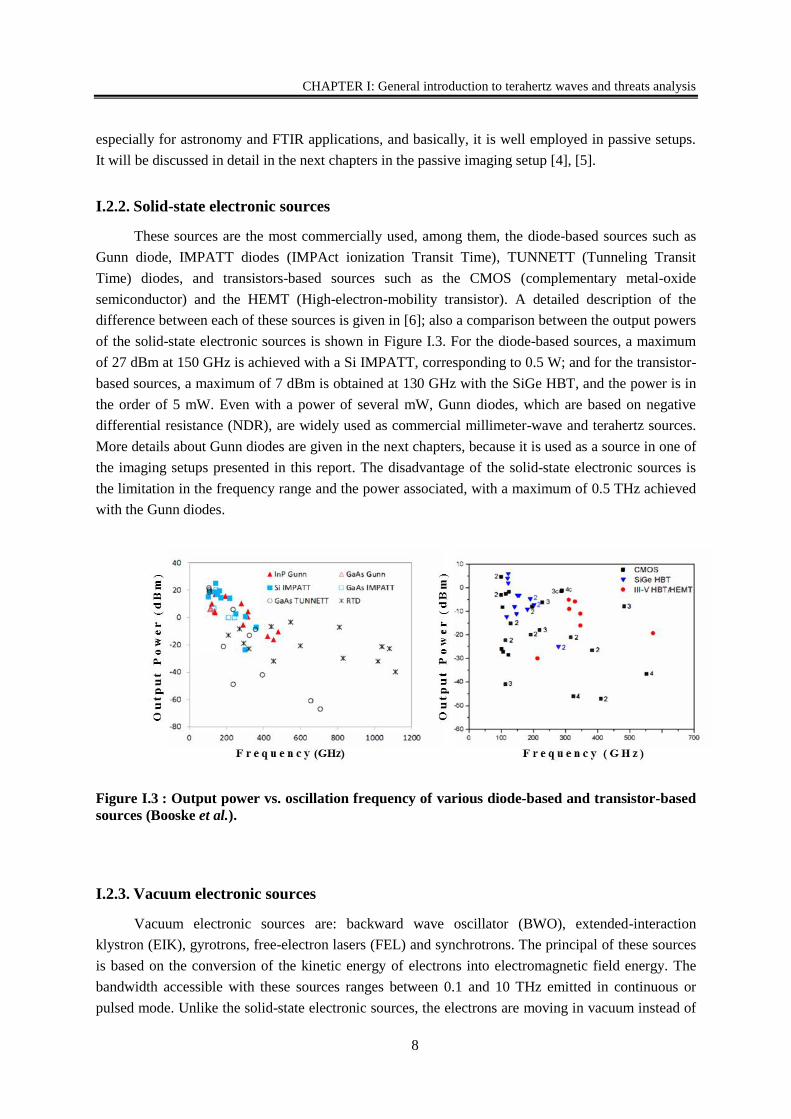
Figure I.3 : Output power vs. oscillation frequency of various diode-based and transistor-based
sources (Booske et al.). ........................................................................................................................... 8
Figure I.4 : (a) Internally fused pipe bomb diagram, (b) example of a bomb configuration:
bomb hidden in a cigarette box. ............................................................................................................ 13
Figure I.5 : Molecular composition of the two military explosives: RDX and PETN. .............. 15
Figure I.6 : X-ray images of three different parcels. The identification of objects is based on the
tri-color presentation. ............................................................................................................................ 18
Figure I.7 : Photo and X-ray images of parcels with organic content: powder and liquid. ........ 18
Figure I.8 : (a) Envisaged security screening application developed from electronic beam-
forming PMMW imaging technology, (b) a representation of the Millivision Passive Millimeter-Wave
whole body, (c) the apparition of the results of hidden object on the image, (d) the ProVision
commercial active body scanner, (e) front and back millimeter-wave whole body imaging results from
deploying scanners. ............................................................................................................................... 23
Figure I.9 : (a) Briefcase imaging using radar millimeter wave technology, (b) optical image
and terahertz image at 200 GHz of a leather briefcase containing pens, magazine and a large knife (c)
terahertz image at 0.56 THz of concealed cutter blade in a polystyrene foam using CMOS detectors.24
Figure I.10 : (1) Terahertz absorbance spectra of six high explosive materials: (a) Semtex H,
(b) PE4, (c) RDX, (d) PETN, (e) HMX, and (f) TNT, (2) attenuation of luggage and packaging
materials: (a) artificial leather from a suitcase and (b) cardboard, (3) THz-TDS transmission spectra of
a compressed pellet of pure cocaine measured with no covering material (a) , and when the cocaine
pellet is covered by different Fed-Ex packages materials (b), (c), (d), (e) and (f). ............................... 25
Figure I.11 : (a) Chemical mapping of lactose, aspirin, sucrose and tartaric acid using the higher
part of the spectral features of the absorption spectra obtained from a THz-TDS in transmission mode.
For aspirin and tartaric acid recognition, one peak is used, and for lactose and sucrose the sum of two
VI
peaks is used., (b) chemical mapping of MDMA, methamphetamine and aspirin concealed inside
envelope using component spatial pattern analysis. ............................................................................. 27
Figure I.12 : Possible threats inspection techniques in terahertz domain: spectroscopy, imaging
and spectral imaging. ............................................................................................................................ 28
Figure II.1 : Molecular transitions in the terahertz region combining interaction of the optic and
electronic domains. ............................................................................................................................... 30
Figure II.2 : (a) Photograph of the THz-TDS spectrometer TPS3000 from Teraview (b)
Schematic of the setup in the transmission mode (OAPM: off axis parabolic mirror, BS: beam splitter,
M: mirror). ............................................................................................................................................ 32
Figure II.3 : Reflection possible configurations: (a) traditional reflection setup, (b) false
transmission. ......................................................................................................................................... 33
Figure II.4 : (a) Schematic side view and (b) top view of THz emission by photoconductive
antenna. ................................................................................................................................................. 34
Figure II.5 : (a) Horizontal profile of the THz beam waist for the transmission setup for
different frequencies: 0.5, 1, 1.5, 2 and 2.5 THz, (b) Beam waist values for the frequencies between
0.2 and 3 THz calculated by the FWHM with the knife-edge method. ................................................ 36
Figure II.6 : Illustration of the sampling concept of reconstruction of the THz temporal pulse
detected by a PC-antenna. ..................................................................................................................... 37
Figure II.7 : (a) Scheme of the time-domain spectroscopy, (b) typical time domain-pulses after
propagation in the air (dashed line) and through the sample (plain line). ............................................. 38
Figure II.8 : (a) Temporal signal and (b) THz electric field in the frequency domain obtained by
FFT in three cases: without sample in dry air (red), in humid air (blue) and with a pellet of lactose of
400 mg total weight and 20 wt-% lactose in dry air (green). ................................................................ 39
Figure II.9 : Signal measured in dry air conditions with two different apodization functions:
boxcar (red) and Blackman-Harris 3-term (blue).................................................................................. 42
Figure II.10 : (a) Absorbance spectra of a lactose pellet of 400 mg content (20% lactose and
80% PE) and 3.52 mm thickness using three different references: Air (pink), PE pellet of 400 mg and
3.97 mm thickness (green) and PE pellet of 570 mg and 5.73 mm thickness (blue), (b) Absorbance
spectrum of the lactose pellet of 190 mg content and 1.64 mm thickness calculated with two
references: air (grey) and PE pellet of 400 mg and 3.97 mm thickness (red), also lactose pellet of 400
mg content and 3.52 mm thickness using the 400 mg PE pellet (green). ............................................. 44
Figure II.11 : Absorbance spectra, using air as reference, for a citric acid pellet in three cases:
pellet is made of 100 wt-% citric acid with a 1.85 mm thickness (brown), pellet made with 20 wt-%
citric acid and 80 wt-% PE with a total weight and thickness of 190 mg and 1.74 mm (green) and 400
mg and 3.70 mm (orange) respectively. ................................................................................................ 45
Figure II.12 : (a) Absorbance spectra, using PE as reference, of citric acid (blue), fructose
(green) and lactose (red) made of 20 wt-% of each compound and 80 wt-% of PE, sum of the
absorbance of the three mentioned pellets (purple), three times the absorbance spectra of a pellet made
by mixture of citric acid, fructose and lactose with 6.6 wt-% each and 80 wt-% PE (pink), (b) three
VII
pellets placed one after the other of Fructose then lactose then citric acid, each one is constituted by
20 wt-% of compound and 80 wt-% of PE (blue), Absorbance of three pellets of mixture made of 6.6
wt-% of citric acid, fructose and lactose and 80 wt-% PE each (yellow). ............................................ 47
Figure II.13 : (a) Photograph of typical packaging materials samples used in postal chain and
their (b) absorption coefficient. ............................................................................................................. 48
Figure II.14 : Absorbance spectra calculated by taking air as reference, for six samples: one
piece of cardboard (blue), two pieces of cardboards (green), lactose pellet (20 wt-% lactose + 80 wt-%
PE) (red) and the same lactose pellet placed between two pieces of cardboard (purple). .................... 50
Figure II.15 : (a) Optical image and (b) configuration of lactose pellet (20 wt-% lactose + 80
wt-% PE) between two pieces of cardboard, (b) spectra measured at one pixel through three
objects:cardboard1, pellet, cardboard2 , (c) photo of the internal structure of cardboard, THz image
extracted at 0.21 THz (d) and 0.52 THz (e). ......................................................................................... 51
Figure II.16 : (a) Photograph of the lactose powder filled inside a plastic bag and inserted inside
a letter, (b) terahertz image at 0.5 THz of the powder imaged through the letter, (c) Terahertz
waveform at two positions: (1) at the lactose powder and (2) at the letter. .......................................... 52
Figure II.17 : Data compression concept: transformation of the data projection space from two
dimensions (x1, x2) to one dimension vector (PC). ............................................................................... 55
Figure II.18 : Partial Least Squares concept and matrix decomposition into scores and loadings.
.............................................................................................................................................................. 57
Figure II.19 : The variation of eigenvalue (a), RMSEC and RMEP (b) as a function of the
number of the principal components, this evolution allows defining the ideal number of PCs for the
model. ................................................................................................................................................... 59
Figure II.20 : Ternary diagram displaying the compositions of the manufactured samples and
the datasets selected for data processing: the training set (red) and the test set (black), blue arrows
indicate the direction of projection on each axis. .................................................................................. 63
Figure II.21 : THz absorbance spectra of pure RDX (a) and pure PETN (b) inside 400 mg
pellets containing different amounts of RDX, PETN and PE. The red arrows highlight the risk of
interference between the spectra, (c) Absorbance spectra of 400 mg pellets containing 300 mg of PE
and 100 mg of RDX (blue), 300 mg of PE and 100 mg of PETN (red, and 300 mg of PE, 50 mg of
RDX and 50mg of PETN (green). ........................................................................................................ 65
Figure II.22 : Predicted scores of the two first principal components PC1 and PC2 of the PLS
model based on PLS1 algorithm dedicated to the prediction of PETN concentrations. ....................... 67
Figure II.23 : Loadings of (a) PC1 and (c) PC2 for the PLS-1 model optimized to predict the
concentrations of PETN, loadings of (b) PC1 and (d) PC2 for the PLS2 model optimized to
simultaneously predict the concentrations of PETN and RDX. ............................................................ 68
Figure II.24 : (a) Transformation diagram of temporal pulse to absorbance for one pixel, (b) 3D
resulting image of the TDS spectral imaging where each pixel corresponds to an absorbance spectra,
(c) unwrapping process transforming 2D matrix to 1D table, (d) resulting 2D matrix after unwrapping.
.............................................................................................................................................................. 70
VIII
Figure II.25 : Score image of the (a) PC1 and (b) PC2 of a pellet made from two parts
constituted of fructose and lactose each with 40 wt-% of element and 60 wt-% of PE, (c) loading plots
of the first two PCs of the PCA model: loading PC1 (blue) and loading PC2 (green). ........................ 73
Figure II.26 : (a) Photo and representation of the sample made by a piece of polyethylene with
three holes of 1mm diameter containing three powders: lactose, fructose, citric acid, (b) image
obtained at the frequency 0.8 THz, (c) waveform of the THz electric field at a specific position
highlighted by dashed lines in image (b), (d) image of the PC1 score of the PCA model, (e) loadings
of PC1. .................................................................................................................................................. 75
Figure II.27 : (a) Photograph of the sample composed of a plastic box filled with five powders:
three pure namely lactose (1), fructose (2), citric acid (3) and two mixtures of lactose with fructose (4)
and lactose with citric acid (5), (b) spectra of lactose (red), fructose (blue) and citric acid (green)
extracted from reflection measurements, (c) the PC1 and PC2 scores plot of the powders from the
PCA model. ........................................................................................................................................... 77
Figure II.28 : Score plot of the PCA model in the plane of the two first components for a data
set of 1452 spectra containing 469 variables each with a unit variance (a) and center (b) scales. The
plot represents three classes: RDX (red), mixture (green) and PETN (blue), loadings of PC1 (black)
and PC2 (red) for the PCA model for the unit variance (c) and center (d) scales. ................................ 79
Figure II.29 : (a) Optical image of the sample consisting of three different pellets: RDX (20%
wt-%), PETN (20% wt-%) mixture (10% wt-% RDX and 10% wt-% PETN) ; PC1 score images for
the UV (b) and centered (c) models, PC2 score images for the UV (d) and centered (e) models. ....... 80
Figure II.30 : PLS-DA prediction of model M6 for the class 1 (a) and class 3 (b). ................... 83
Figure II.31 : Absorbance spectra of 400 mg pellets constituted of 20 wt-% RDX and 80 wt-%
PE (blue), 10 wt-% RDX + 10 wt-% PETN+ 80 wt-% PE (green), 20 wt-%PETN and 80 wt-% PE
(red). ...................................................................................................................................................... 85
Figure II.32 : PC1 and PC2 predicted score of a PLS model, calibration data are created by the
spectroscopy configuration and the predicted scores of RDX, PETN and mixture 50/50 (grey) are
retrieved from spectral imaging acquisitions. ....................................................................................... 86
Figure III.1 : The radiance as a function of frequency, as defined in Planck’s Law, calculated
for seven different frequencies: Cosmic background radiations (2.7 K), liquid nitrogen (77 K), room
temperature (293 K), human body (310 K), incandescent lamp (2500 K), and sun surface temperature
(6000 K). ............................................................................................................................................... 89
Figure III.2: (a), (b) Photograph and (c) setup of the Millicam90 system from MC2 company. 92
Figure III.3 : Passive millimeter-wave images of two hidden guns underneath clothes made
with the Millicam90 system. ................................................................................................................. 92
Figure III.4 : Passive images produced by the Millicam90 in two cases (a) without absorber and
(b) with absorber. Intensity distribution at two positions for each image: (c) position 1 outside the
radiation emitter and (d) position 2 at the upper part from the radiation emitter. ................................. 94
Figure III.5 : Optical images and PMMW images of five different parcels and threats: (a) gun
and bullet, (b) gun and knife, (c) disassembled metallic gun, (d) metallic gun and tools concealed by
IX
paper, box and foam, (e) two different liquids in a plastic and glass bottles, (f) different object such as
medicine, soap, powder, correction fluid, etc. ...................................................................................... 95
Figure III.6 : Optical and electrical configuration of the raster scanning continuous wave setup.
.............................................................................................................................................................. 99
Figure III.7 : (a) Gaussian distribution of a terahertz beam in a focalized configuration for two
different frequencies. The higher the frequency, the smaller the waist and the shorter the Rayleigh
range, (b) Rayleigh criterion, (c) theoretical calculation of the beam waist and (d) the Rayleigh length
for a Gaussian beam for frequencies between 0.1 and 2 THz. ............................................................ 101
Figure III.8 : (a) Photograph and (b) image at 287 GHz of the USAF test target with a lens of
100 mm of focal, (c) variation of the transmitted signal through the elements 5 and 6 showing the
limit of resolution. ............................................................................................................................... 103
Figure III.9 : The liberator gun (a) photograph and (b) mm image at 84 GHz, (c) refractive
index and absorption coefficient of the polymer material constituent of the gun obtained by terahertz
time-domain spectroscopy. ................................................................................................................. 104
Figure III.10 : (a) Photograph and (b) image at 287 GHz of a ceramic knife. The same ceramic
material with two different treatments reveals two different results on the image. ............................ 105
Figure III.11 : Scissor image at (a) 84 GHz, (b) 287 GHz, (c) 84 GHz inside a box. .............. 106
Figure III.12 : Simulation of the refraction effect of a sphere placed at different position along
the perpendicular to the optical axes, (a) the center of the sphere is on the optical axis for Y=375,
moving the sphere up (b) Y= 391, (c) Y=393, (d) Y=399. ................................................................. 107
Figure III.13 : MMW images of a polyethylene cylinder of 50 mm diameter, without holes,
positioned horizontally, at (a) 84 GHz and (b) 287 GHz; Intensity distribution along Y axes for (c) the
84 GHz image at X= 360 mm and (d) the 287 GHz image at X= 150 mm. ....................................... 108
Figure III.14 : Terahertz image obtained from the TDS system in transmission, for a PTFE
cylinder of 6 mm diameter, at: 115 GHz (a), 307 GHz (b) and 506 GHz (c), (d) the terahertz signal
distribution for four specific frequencies along the band [0.1-3] THz for the position Y=40. ........... 109
Figure III.15 : (a) Optical configuration of the continuous wave combined to a goniometer, (b)
intensity distribution, using the four lenses configuration, when the detector is fixed and the PE
cylinder of 25 mm diameter is moving along X axes, (c) angular distribution of the intensity by
removing the lenses between the focalization point and the detector, for four cases: without any object
(black), center of the cylinder in positioned in the focal point (X2 in red), the focalization is
positioned between the center of the cylinder and its border (X1 and X3 in grey) . .......................... 110
Figure III.16 : (a) MMW images at 287 GHz of a polyethylene cylinder of 25.7 mm diameter,
positioned horizontally, representing two holes with different diameters; Intensity distribution along Y
axes at (b) X= 76 mm, (c) X= 100 mm and (d) X= 140 mm. ............................................................. 112
Figure III.17 : Frequency modulation continuous wave concept ............................................. 113
Figure III.18 : (a) SynView entire system photograph, (b) scheme of the setup constituted of
four heads for emission and reception in transmission and reflection modes for two different
frequencies. ......................................................................................................................................... 114
X
Figure III.19 : Images obtained at 100 GHz at different time of flight (1) z=-117 mm, (2) z=-
104 mm, (3) z=-78 mm, (4) z=0 mm, (5) z=26 mm, (6) z= 52 mm. .................................................. 115
Figure III.20 : Transmission image of (a) metallic gun and bullets at 300 GHz, (b) disassembled
gun at 300 GHz, (c) metallic gun and knife, hidden in different types and size of parcels, at 100 GHz,
(d) metallic gun concealed by tools at 300 GHz. ................................................................................ 116
Figure III.21 : Photographs and millimeter images at 300 GHz in transmission mode of
packaging containing (a) different type of powders, (b) plastic and glass bottles filled with different
type of liquids. Photograph and MMW images of an envelope containing several object such
medicines, powders, soap, etc., at 300 GHz in (c) reflection and (d) transmission mode. ................. 117
Figure III.22 : MMW images obtained by the SynView system in transmission mode at (a) 100
GHz and (b) 300 GHz, and (c) in reflection mode at 300 GHz, the combined image of (d) the 100
GHz with the 300 GHz in transmission, (e) the 100 GHz with the 300 in reflection, (f) the 300 GHz in
transmission with the 300 GHz in reflection. ..................................................................................... 118
Figure III.23: Schematic representation of the CT concept in X-ray (a) and terahertz (b)
domains. (c) Horizontal slice, sinogram, and the final reconstructed cross-sectional image by BFP
algorithm, at one Y position of the (X,Y) image, for a sample consisted of two cylindrical bars. ..... 120
Figure III.24 : (a) Procedure of information extraction by CT in terahertz, (b) organigram of the
iterative CT concept. ........................................................................................................................... 121
Figure III.25 : (a) Photograph of the sample, cross section along Y direction and 3D
visualization using (b) BFP (c) SART (d) THz ML-TR without Gaussian beam approximation. The
cross-sections corresponds, from left to right to y=15, 30, 45, 60, 75 and 90. ................................... 123
Figure III.26: (a) PMMW images of metallic gun and knife inside parcel at different projection
angles, (b) tomographic reconstruction using OSC algorithm. ........................................................... 124
Figure III.27 : Projection of the liberator gun at 0° at (a) 84 GHz and (b) 287 GHz, OSC
reconstruction of the liberator gun at (c) 84 GHz and (d) 287 GHz, transverse section of the OSC
reconstruction of the gun at (e) 84 GHz and (f) 287 GHz. ................................................................. 125
Figure III.28 : 2D projections of the plastic gun inside a parcel, scanned with the head T300 of
the SynView system at (a) 0°, (b) 70°, (c) 85° and (d) 130°, (e) OSC reconstruction of the plastic gun
inside a parcel using 36 projections. ................................................................................................... 126
Figure III.29 : (a) Photograph, (b) Terahertz radiographs and (c) 3D visualization after
rendering and segmentation applied to OSC reconstruction of a mango fruit. ................................... 127
XI
LIST OF TABLES
Table I.1 : Some properties of common secondary explosives. ................................................. 14
Table I.2 : Basic advantages and disadvantages of several technologies used in explosives
detection. ............................................................................................................................................... 20
Table II.1 : Difference between the absorbance values when changing the reference. .............. 43
Table II.2 : Refractive index of eight packaging materials used in postal chain. ....................... 49
Table II.3: RMS contrast calculation of the scores of PC1 and PC2 images, and for the images
at specific frequencies: 0.52, 1.37, 1.71 and 1.81 THz representing the characteristic frequencies of
the lactose and fructose. ........................................................................................................................ 74
Table II.4: RMS contrast calculation in the case of the sample made of pure powder, for the
image extracted at 0.8 THz from the terahertz signal, and the score image of PC1 and PC2 for
normalized data. .................................................................................................................................... 76
Table II.5: PLS-DA models parameters. .................................................................................... 81
Table II.6: RMSEC and RMSEP values obtained for the different PLS-DA models built with 81
Table II.7: Confusion matrix related to the classification of the observations in C1, C2 and C3
for the model M4. ................................................................................................................................. 82
Table II.8: Confusion matrix related to the classification of the observations in C1, C2 and C3
for the model M5. ................................................................................................................................. 82
Table II.9: Confusion matrix related to the classification of the observations in C1 and C3 for
the model M6. ....................................................................................................................................... 82
Table II.10: Confusion matrix related to the classification into three classes C1, C2, C3 after
PLS-DA model of the central parts of the explosive pellets. ................................................................ 84
Table II.11: Confusion matrix related to the classification of the observations of C1 and C3 for
the model M6. ....................................................................................................................................... 84
Table III.1 : Radiatives properties of different materials at 100 and 500 GHz: emissitivity and
reflectivity. ............................................................................................................................................ 90
Table III.2: Capabilities and limitations of Millicam system in packaging investigation. ......... 96
Table III.3 : Quantitative characteristics of the plastic mango after segmentation and rendering
processing. .......................................................................................................................................... 127
XII
ACRONYMS
BWO Backward Wave Oscillator
BFP Back-Projection of the Filtered Projections
CMOS Complementary Metal-Oxide Semiconductor
CT Computed Tomography
ctr Center
CW Continuous Waves
DR Dynamic Range
EIK Extended-Interaction Klystron
ENL Equivalent Number of Looks
EO Electro-Optic
FEL Free-Electron Lasers
FET Field Effect Transistors
FFT Fast Fourier Transform
FMCW Frequency Modulated Continuous Wave imaging
FWHM Full Width at Half Maximum
GHz Gigahertz
HEMT High-Electron-Mobility Transistor
IMPATT IMPAct ionization Transit Time
IMS Ion Mobility Spectrometry
LIBS Laser-Induced Breakdown Spectroscopy
ML-TR Maximum Likelihood for TRansmission tomography
MMW Millimeter Wave
MS Mass Spectrometry
NEP Noise Equivalent Power
OSC Ordered Subsets Convex
XIII
OSEM Ordered Subsets Expectation Maximizat ion
PC Principal Component
PCA Principal Component Analysis
PC-antennas Photoconductive Antennas
PE Polyethylene
PETN Pentaerythritol tetranitrate
PLS Partial Least Square
PLS-DA Partial Least Square-Discriminant Analysis
PTFE Polytetrafluoroethylene
QCL Quantum-Cascade Lasers
RDX Cyclotrimethylenetrinitramine (hexogen or cyclonite)
RE Relative Error
RMSEC Root Mean Square Error of Calibration
RMSEP Root Mean Square Error of Prediction
RMS contrast Root Mean Squared contrast
ROI Regions of Interest
SART Simultaneous Algebraic Reconstruction Technique
SNR Signal-to-Noise Ratio
TDS Time-Domain Spectroscopy
THz Terahertz
TUNNETT Tunneling Transit Time
UV Unit Variance
VCO Voltage-Controlled Oscillator
VOI Volume of Interest
1
INTRODUCTION
Security has always been an important issue for governments and organizations. The need for
more rigorous and systematic systems, providing the highest level of security, leads to increase
studies to develop more precise and efficient systems able to detect all kind of threats. Every
institution is looking for the best level of security, especially the postal chain institution around the
world. Nowadays, transportation of goods is made all over the world through different types of
transport such as planes, rails, trucks, etc., and this adduces the danger at different moment: during the
transportation and inside the sorting centers. Thus, postal chain institutions are looking for new ways
to increase their potential in securing and protecting the commodities and the workers while parcels
run through the warehouses. The unique challenge they are facing, is the need of ensuring high
security level, while keeping the efficiency and flexibility of the supply chain. Part of the parcel
inspection is manual and law conditions prohibit post members from opening the parcels. It needs the
intervention of a custom member to do so. This decelerates the scanning flow because the suspicious
package goes off the scanning chain and it is stored waiting for the customs opening and inspection.
So the probability of suspicion in the parcel should be very high before extracting it from the chain.
Also, the human control has three other main disadvantages:
1- Slowing down the flow of parcels and delaying the shipment procedure, due to the need of
sending the parcels for lab analysis.
2- Inducing a danger of facing risky chemicals while opening specific parcels.
3- Need of more manpower and inspectors.
Our work will provide preliminary methods that can be developed and adapted for the postal
chain to strengthen security while reducing human’s efforts in manual inspection, by presenting the
potential of terahertz techniques in parcel inspection.
This PhD is a part of the InPoSec (Integrated Postal Chain Security) project, dedicated to
finding complementary applications to the existing ones, in order to provide a technology exhibiting
the same level of performances compared to conventional daily used equipment’s in the postal chain
centers, which can be easily used by workers without any dangerous effects on their health. The entire
project is divided in different axes.
One of our missions is to provide all imaging supplies and spectroscopic data for other
members of the project. In this aim, analysis was performed at Chronopost center and CDG airport to
INTRODUCTION
2
retrieve statistical information about parcels and to carry out measurements on several parcels in X-
ray systems used in the sorting center. We fabricated these parcels with false threats and suspicious
objects, and analyze it with the terahertz imaging systems, thus, the performance of several terahertz
imaging techniques can be compared to X-ray scanners. Some of these data are transferred to other
project members for two basic studies:
1- Development of the Bayesian algorithm in collaboration with Datalone to be applied to the
statistical postal data to study the risk assessment of a parcel, based on several information,
such as expedition country, weight, size, etc.
2- Objects shape recognition algorithm in collaboration with Spykenet technology. The aim is to
automatically identify the presence of a weapon in a high velocity scanning flow. This
algorithm is applied to X-ray data extracted from the post center at CDG as well as terahertz
data obtained from our systems.
However, our main part of the work is the demonstration of the potential and capabilities of the
terahertz technology for parcels and letters screening and inspection to detect sought threats in parcels
and letters, as weapons, explosives, bombs, radioactive materials, etc. Therefore, terahertz technology
is chosen for several reasons:
1- It is a non-contact technique that is able to inspect objects through packaging,
2- Non-destructive for objects in inspection,
3- Non-invasive radiation that has no dangerous effects on human health,
4- It provides a chemical signature that can identify powders and dangerous material.
This study describes and explains a new process of parcels inspection by positioning the
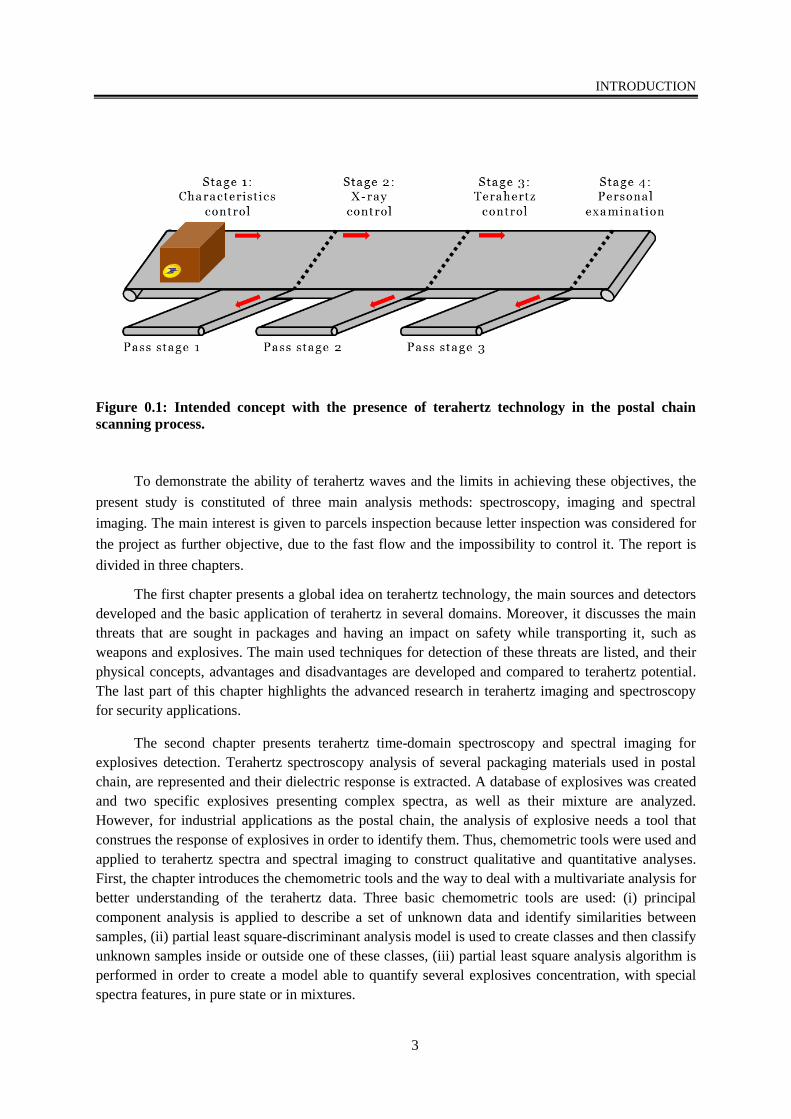
terahertz technology as complementary to X-ray scanner and not a substituted method. As Figure 0.1
shows, the processes of scanning passes first by the X-ray system that gives the first feedback on the
contents and compare it to the declaration of the owner. Here, most of the parcels are classified as safe
and can be distributed, yet, for several parcels the doubt in their content leads to pass them on the
second scanning stage. Here, terahertz imaging can inspect the parcel and provides similar
information compared to the X-ray scanner. However, two additional aspects can be provided by
terahertz. The first one is the identification of low dense amorphous materials that are almost
transparent to X-ray radiations. Secondly, having the possibility of terahertz spectral imaging will
provide chemical recognition and thus identification of a powder on an image made through
packaging. After this step, if suspicious doubt remains on the parcels content, then it passes to the last
stage which is the examination by an inspector. This process is able to provide more reliable
information and accelerate the process.
INTRODUCTION
3
Figure 0.1: Intended concept with the presence of terahertz technology in the postal chain
scanning process.
To demonstrate the ability of terahertz waves and the limits in achieving these objectives, the
present study is constituted of three main analysis methods: spectroscopy, imaging and spectral
imaging. The main interest is given to parcels inspection because letter inspection was considered for
the project as further objective, due to the fast flow and the impossibility to control it. The report is
divided in three chapters.
The first chapter presents a global idea on terahertz technology, the main sources and detectors
developed and the basic application of terahertz in several domains. Moreover, it discusses the main
threats that are sought in packages and having an impact on safety while transporting it, such as
weapons and explosives. The main used techniques for detection of these threats are listed, and their
physical concepts, advantages and disadvantages are developed and compared to terahertz potential.
The last part of this chapter highlights the advanced research in terahertz imaging and spectroscopy
for security applications.
The second chapter presents terahertz time-domain spectroscopy and spectral imaging for
explosives detection. Terahertz spectroscopy analysis of several packaging materials used in postal
chain, are represented and their dielectric response is extracted. A database of explosives was created
and two specific explosives presenting complex spectra, as well as their mixture are analyzed.
However, for industrial applications as the postal chain, the analysis of explosive needs a tool that
construes the response of explosives in order to identify them. Thus, chemometric tools were used and
applied to terahertz spectra and spectral imaging to construct qualitative and quantitative analyses.
First, the chapter introduces the chemometric tools and the way to deal with a multivariate analysis for
better understanding of the terahertz data. Three basic chemometric tools are used: (i) principal
component analysis is applied to describe a set of unknown data and identify similarities between
samples, (ii) partial least square-discriminant analysis model is used to create classes and then classify
unknown samples inside or outside one of these classes, (iii) partial least square analysis algorithm is
performed in order to create a model able to quantify several explosives concentration, with special
spectra features, in pure state or in mixtures.

INTRODUCTION
4
The third chapter discusses terahertz 2D and 3D imaging methods applied to parcel inspection
to provide internal information about the packages without opening it. Three different imaging setups
are presented and results of packages screening are shown. The first system is based on millimeter
passive imaging, the second is a home-made millimeter continuous wave setup, and the third is a
millimeter frequency modulated continuous wave commercial system. The performances of these
systems on packages that contain false threats are compared. Furthermore, three dimensional imaging
configurations are developed to provide data for tomography reconstruction. Thus, the last part
presents the tomographic reconstruction method where a special algorithm is developed to take into
account the Gaussian distribution of the terahertz beam while reconstructing a 3D volume. The results
of this reconstruction as well as image processing tools are presented for packaging inception.
5
CHAPTER I
GENERAL INTRODUCTION TO
TERAHERTZ WAVES AND THREATS
ANALYSIS
This chapter discusses the basic physics of terahertz (THz) radiations and presents some of the
terahertz sources and detectors that can be advantageous for specific applications. In addition, a
general idea of the applications domain of terahertz wave is provided. Then, a brief description of the
techniques used in security application for detection of weapons, explosives, bombs, drug, etc. is
presented and a comparison of the advantages and the disadvantages of each technique are discussed
for postal chain security applications. Finally, some of the terahertz studies in security applications are
presented, especially terahertz imaging and spectroscopy for postal security application.
I. TERAHERTZ TECHNOLOGY
I.1. INTRODUCTION
Electromagnetic (EM) spectrum contains several regions with different properties allowing
specific developments and achievements in many application fields. Since the mid twentieth century,
a particular region of the EM spectrum has been extensively studied, ranging between infrared and
microwaves, and known as terahertz domain [1]. In this domain, the frequencies of the EM waves are
ranging between 0.1 and 30 THz (1 THz = 1012
Hz), which correspond to the wavelengths between 3
mm and 10 μm. Figure I.1 shows the localization of the terahertz domain within the Electromagnetic
spectrum. In this positioning, THz waves share the characteristics of both infrared and microwaves
domains, namely:
- Non-ionizing: photons in the THz region have low energies, ranging between 0.41 meV and
124 meV. This low energy has no ionizing effect on biological tissues [2].
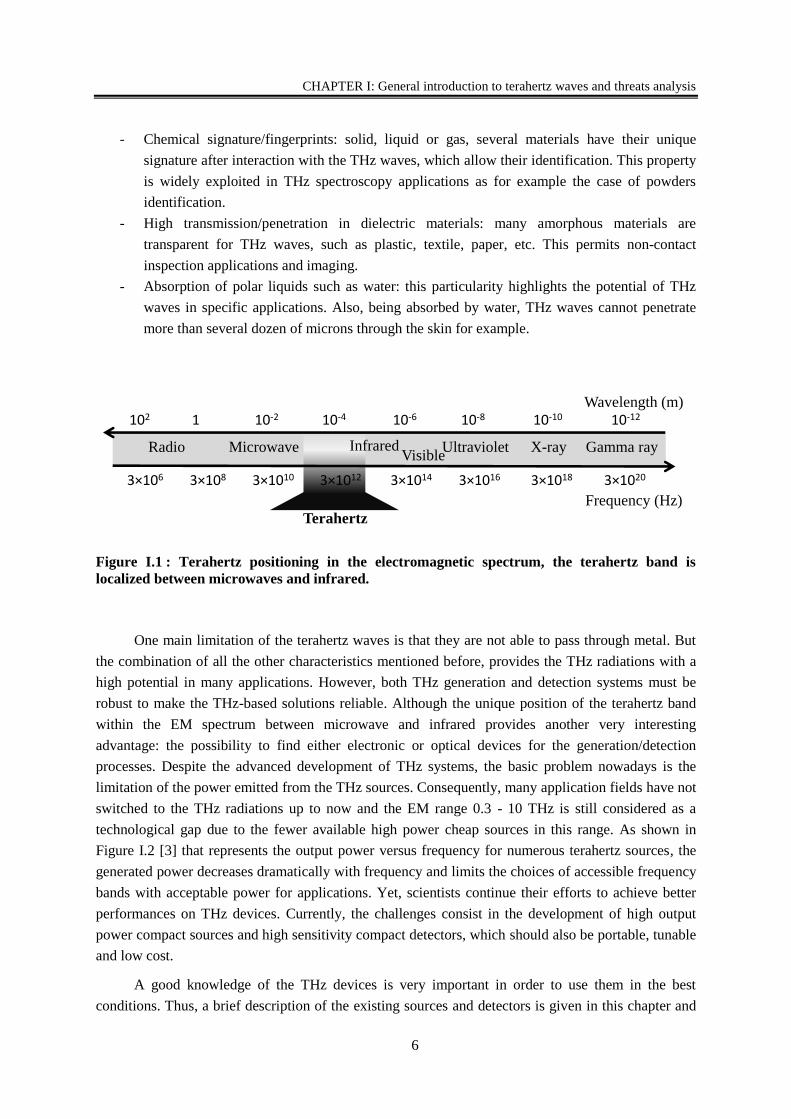
CHAPTER I: General introduction to terahertz waves and threats analysis
6
- Chemical signature/fingerprints: solid, liquid or gas, several materials have their unique
signature after interaction with the THz waves, which allow their identification. This property
is widely exploited in THz spectroscopy applications as for example the case of powders
identification.
- High transmission/penetration in dielectric materials: many amorphous materials are
transparent for THz waves, such as plastic, textile, paper, etc. This permits non-contact
inspection applications and imaging.
- Absorption of polar liquids such as water: this particularity highlights the potential of THz
waves in specific applications. Also, being absorbed by water, THz waves cannot penetrate
more than several dozen of microns through the skin for example.
One main limitation of the terahertz waves is that they are not able to pass through metal. But
the combination of all the other characteristics mentioned before, provides the THz radiations with a
high potential in many applications. However, both THz generation and detection systems must be
robust to make the THz-based solutions reliable. Although the unique position of the terahertz band
within the EM spectrum between microwave and infrared provides another very interesting
advantage: the possibility to find either electronic or optical devices for the generation/detection
processes. Despite the advanced development of THz systems, the basic problem nowadays is the
limitation of the power emitted from the THz sources. Consequently, many application fields have not
switched to the THz radiations up to now and the EM range 0.3 - 10 THz is still considered as a
technological gap due to the fewer available high power cheap sources in this range. As shown in
Figure I.2 [3] that represents the output power versus frequency for numerous terahertz sources, the
generated power decreases dramatically with frequency and limits the choices of accessible frequency
bands with acceptable power for applications. Yet, scientists continue their efforts to achieve better
performances on THz devices. Currently, the challenges consist in the development of high output
power compact sources and high sensitivity compact detectors, which should also be portable, tunable
and low cost.
A good knowledge of the THz devices is very important in order to use them in the best
conditions. Thus, a brief description of the existing sources and detectors is given in this chapter and
Figure I.1 : Terahertz positioning in the electromagnetic spectrum, the terahertz band is
localized between microwaves and infrared.
Wavelength (m)
Terahertz
102 10-2 10-4 10-6 10-1210-8 10-101
VisibleGamma rayX-rayUltravioletMicrowaveRadio
Frequency (Hz)
3×10⁶ 3×10¹⁰ 3×10¹² 3×10¹⁴ 3×10203×1016 3×10183×108
Infrared
CHAPTER I: General introduction to terahertz waves and threats analysis
7
limiting the discussion to the most interesting sources and detectors in the area, that can produce high
power and can be used in security applications.
I.2. TERAHERTZ SOURCES
Many terahertz source technologies were developed during the last years, providing broadband
waves or narrow-linewidth continuous waves (CW), with an output power going from nW to several
tens of watts. High power sources are the most needed for real time imaging security application due
to the deeper penetration ability, but it is not the main criterion in the choice of the sources. There is
also an importance for the frequency band emitted, the mode of emission, i.e. pulsed or continuous,
the access of amplitude and phase information, the employment of simple detectors, the ability to be
set into very compact systems, etc. Here we will discuss several terahertz sources, such as thermal
sources, solid-state electronics, vacuum sources, and emitters driven by lasers.
Figure I.2 : Logarithmic plot of the emitted power as a function of frequency of different THz
source technologies.
I.2.1. Thermal sources
All objects surrounding us, with a temperature greater than 10 K, emit naturally terahertz
electromagnetic waves in all directions as black-body radiation. However, the emitted radiations have
a very low average power of several nW. This type of terahertz source has been used for many years,
CHAPTER I: General introduction to terahertz waves and threats analysis
8
especially for astronomy and FTIR applications, and basically, it is well employed in passive setups.
It will be discussed in detail in the next chapters in the passive imaging setup [4], [5].
I.2.2. Solid-state electronic sources
These sources are the most commercially used, among them, the diode-based sources such as
Gunn diode, IMPATT diodes (IMPAct ionization Transit Time), TUNNETT (Tunneling Transit
Time) diodes, and transistors-based sources such as the CMOS (complementary metal-oxide
semiconductor) and the HEMT (High-electron-mobility transistor). A detailed description of the
difference between each of these sources is given in [6]; also a comparison between the output powers
of the solid-state electronic sources is shown in Figure I.3. For the diode-based sources, a maximum
of 27 dBm at 150 GHz is achieved with a Si IMPATT, corresponding to 0.5 W; and for the transistor-
based sources, a maximum of 7 dBm is obtained at 130 GHz with the SiGe HBT, and the power is in
the order of 5 mW. Even with a power of several mW, Gunn diodes, which are based on negative
differential resistance (NDR), are widely used as commercial millimeter-wave and terahertz sources.
More details about Gunn diodes are given in the next chapters, because it is used as a source in one of
the imaging setups presented in this report. The disadvantage of the solid-state electronic sources is
the limitation in the frequency range and the power associated, with a maximum of 0.5 THz achieved
with the Gunn diodes.
Figure I.3 : Output power vs. oscillation frequency of various diode-based and transistor-based
sources (Booske et al.).
I.2.3. Vacuum electronic sources
Vacuum electronic sources are: backward wave oscillator (BWO), extended-interaction
klystron (EIK), gyrotrons, free-electron lasers (FEL) and synchrotrons. The principal of these sources
is based on the conversion of the kinetic energy of electrons into electromagnetic field energy. The
bandwidth accessible with these sources ranges between 0.1 and 10 THz emitted in continuous or
pulsed mode. Unlike the solid-state electronic sources, the electrons are moving in vacuum instead of
CHAPTER I: General introduction to terahertz waves and threats analysis
9
a semiconductor, and this particularity is one of the vacuum electronic devices that allow generating
high power, that goes from mW to few GW in pulsed regime [7].
Until now, free electron laser sources are the most powerful source of THz coherent radiation.
They are frequency tunable and operate in pulsed or continuous mode. Several studies have examined
the application of FELs to perform basic scientific research and imaging applications [8]–[11].
However, their bulky sizes and high cost prevent their use outside laboratory applications. One of the
most powerful THz-FEL is the Novosibirsk terahertz FEL (NovoFEL), it can produce radiation with
an average power of up to 500 W and peak power of up to 0.5 MW in a spectral range of 1.2 - 2.7
THz [12].
Gyrotrons are one of the most widely used electron-beam sources. Their operation is based on
the interaction of a high-energy electron beam with a strong magnetic field inside resonant cavities or
waveguides, which results in an energy transfer between the electron beam and an electromagnetic
wave. THz gyrotrons have the potential to provide narrow bandwidth, high power coherent radiation
at frequencies well above 1 THz in pulsed and continuous wave operation. In 2006, Idehara et al.
presented the design of a gyrotron that can exceed 1 THz frequency [13]. The main potential of
gyrotrons is the possibility to reach an output power of several hundred kilowatts at sub-THz band.
Dammertz et al. developed a continuous wave gyrotron delivering power of 1 MW at 140 GHz in
pulsed regime [14], [15].
As for BWO sources, they have the advantages of high output power. They are commercially
available and used for spectroscopy and imaging applications with high spectral resolution [16], [17].
A comparison in the imaging results of two systems based on BWO and femtosecond time domain
spectroscopy, at 0.59 THz is shown in [18].
I.2.4. Terahertz laser sources
Solid-state lasers are the principal components to achieve pulsed and continuous modes of
terahertz wave generation. Terahertz laser sources are gas, semiconductors and quantum-cascade
lasers (QCL). For gas laser sources, usually a CO2 pump laser beams is injected into low-pressure
flowing-gas cavities that lases to produce the terahertz beams with a power level of tens of milliwatts.
In conventional semiconductor lasers, light is generated by the radiative recombination of conduction
band electrons with valence band holes across the bandgap of the active material; in contrast,
electrons in a quantum-cascade laser propagate through the connection of coupled quantum wells,
where the conduction band is split by quantum confinement into a number of distinct sub bands.
Started in 1994 by J. Faist as pulsed operation, quantum-cascade lasers are one of the most compact
and powerful terahertz semiconductor laser sources and well applied to imaging applications [19]. In
2002, Williams et al. presented pulsed QCL at 3.44 THz with 2.5 mW peak power[20]. Also, a QCL
emitting at 2 THz and operating in pulsed and continuous mode is detailed by Worrall et al. and
delivering peak power of tens of mW [21]. In 2006, Lee et al. reported a 50 mW at 4.3 THz QCL used
in real time reflection and transmission imaging and applied for mail screening by imaging the inside
of an envelope [22]. Also broadband QCL designs are presented in [23], with a frequency band lying
between 2.2 and 3.2 THz with 15 mW peak power in pulsed mode.
CHAPTER I: General introduction to terahertz waves and threats analysis
10
I.2.5. Sources driven by lasers
Among these sources, there are the continuous sources such as photomixers and mechanical
resonance; as well as the pulsed sources such as the photoconductive switches, magnetic dipoles,
terahertz parametric oscillator, optical rectification.
Photoconductive (PC) antennas are coherent terahertz sources. They are among the most used
candidates for developing compact, portable, low-power-consuming, rugged, and low-cost
spectroscopy and imaging systems for various broadband terahertz applications [24]. They are small
size tunable devices, operating at room temperature. They can generate waves in continuous or pulsed
mode, with short pulses having high peak powers even if the average powers are low. The most
advantage of these sources is the access of the amplitude and phase allowing the determination of the
complex dielectric properties of materials [25]. The generation of terahertz waves by PC antenna is
the result of the illumination of the PC gap by a laser beam with photon energy larger than the
bandgap energy of the PC material and is achieved by coherent detection technique. This illumination,
at femtosecond time scale, generates electrons and holes in the PC active layer. Due to the DC voltage
applied to the PC electrodes, a transient photo-induced current is formed by these electrons and holes,
which radiates a terahertz field. These sources are used in the time-domain spectroscopy system
involved in the present study, and are discussed in more details in chapter II.
Optical rectification is another way of generating short terahertz pulses. It is a nonlinear process
generated by ultra-short laser pulses in electro-optic crystals or gases as rectification media [26], [27].
In the optical rectification mode, the THz pulse duration is comparable to the optical pulse duration
and the frequency spectrum is mainly limited by the bandwidth of the laser pulse. A 5 MW peak
power at 0.5 THz is reported by Yeh et al. in 2007 [28].
I.3. TERAHERTZ DETECTORS
Many terahertz detectors have been developed and are commercially available. The choice of
the detector depends on the source and the application. When choosing a detector, several
performance parameters should be considered, namely Noise Equivalent Power (NEP), bandwidth,
response time, and sensitivity. The NEP is defined as the incident optical power required to obtain
signal-to-noise ratio equal to 1 in a bandwidth of 1 Hz. Two types of detectors can be set up: the first
one corresponds to coherent detectors that provide both the amplitude and phase of the
electromagnetic wave. This is the case of photoconductive antennas and electro-optical detection
techniques; the second type corresponds to incoherent detectors that only provide intensity or energy
information of the electromagnetic wave. Some of these detectors are the bolometers [29], the
Schottky-diode based detectors, field effect transistors (FET) [30] and Golay cell [31].
I.3.1. Photoconductive antenna
Photoconductive (PC) antennas can also be used as detectors. The electric field, carried by the
THz pulse focused onto the antenna, generates an electric field between the electrodes. In a pump-
probe like experimental setup, a probe laser pulse creates carriers exactly where the THz beam is
CHAPTER I: General introduction to terahertz waves and threats analysis
11
focused between the two electrodes. It allows the detection of the terahertz pulse by sampling
technique. The carriers in the semiconductor active layer have a short lifetime, typically hundreds of
femtosecond, thus the terahertz electric field is consequently sampled on a short time interval. A delay
line finally allows for sampling the entire electric THz field waveform. Then the THz pulse is
reconstructed point by point.
The bandwidth related to the use of PC antenna is limited by the laser pulse duration for both
the generation and detection. It typically reaches 10 THz for femtosecond laser pulses. PC antennas
have better signal-to-noise ratio than electro-optical devices and don’t need any cooling to achieve a
measurement with a reasonable signal-to-noise ratio. Indeed, the peak intensity of the THz pulse is
well above the thermal background-noise level. Finally, the PC antennas are used in pulsed mode for
several applications in imaging and spectroscopy [24], [32], [33].
I.3.2. Electro-optic sampling
Similar to the optical rectification for terahertz wave generation, a crystal material associated to
the Pockels effect are used for terahertz wave detection. The electro-optic (EO) detection method is a
nonlinear coupling between the terahertz electric field and the optical pulse of the laser beam in the
sensor crystal material. The noise sensitivity and frequency response in the EO detection is
determined by the choice of crystal and its thickness [34], [35].
I.4. BASIC APPLICATIONS
Sources and detectors are two of the components of imaging or spectroscopic terahertz system,
and the choice of these two essential components defines the performance of the system. In imaging
systems based on raster scanning, sources and detectors are mono-element. Consequently, the object
has to be moved in order to reconstruct an image pixel by pixel. Such active imaging system presents
high dynamic range but is time-consuming due to the point-by-point reconstruction and consequently,
not applicable to moving targets. Another type of imaging system uses matrix of detectors to provide
real time imaging. They are semiconductor or bolometer cameras that allows higher image rate, than
the raster scanning, but characterized by a low sensitivity in the THz range. In addition, their surface
areas are too small to provide high-resolution images of large dimension targets. For spectroscopy, at
the opposite of continuous systems that give access to narrowband spectrum, systems based on the
pulsed mode provide a broadband spectrum. Each of these systems is conventional for specific
application.
First, terahertz is having a great interest in biology, medicine and biomedical applications due
to lower energy levels (several mev) of the terahertz radiation that limits the damage to cells and
tissues due to thermal effects. The radiation effects of two frequencies, 120 and 130 GHz, on
biological samples is discussed by Scarfi et al.[2] and no dangerous impact is demonstrated. Terahertz
imaging and spectroscopy have been already applied by different groups around the world for
recognition of protein structural states [36], analysis of DNA components [37] and performing label-
free DNA sequencing [38]. Also, it is well applied to disease diagnostics in vivo and ex vivo, in
pulsed mode [39], [40], as well as in continuous mode [41]. Although its limitation in the accessible
CHAPTER I: General introduction to terahertz waves and threats analysis
12
frequency bandwidth, CW system can provide data with a frequency resolution not achievable with
pulsed systems.
In pharmaceutical applications, terahertz imaging is used for the analysis of the coating quality
of tablet [42] and terahertz spectroscopy is used for polymorphism analysis. It was demonstrated that
two different drugs polymorphisms could be discriminated using their terahertz spectra [43], [44].
Other application domains of terahertz imaging and spectroscopy are art, archeology and
anthropology. One of the reasons that give attention to terahertz waves in these domains is because a
nondestructive contactless inspection of materials on sites. It has the potential to determine the
spectroscopic response of a hidden sub-layer of a painting without destroying it [41] [42]. In 2010, the
analysis of painting sub-layers was demonstrated using a time-domain spectral imager system. This
work showed the possibility to reveal buried layers information such as a graphite handmade sketch
covered by several layers of painting, also demonstrated the possibility to evaluate painting thickness
[47]. Besides, 2D imaging and THz tomography give new information in the study of ancient cultures
by studying the internal structure of some of the objects of these cultures [48].
Wi-Fi and mobile communication rely on microwave frequencies. But the increasing demands
for data transfer in communication will become more than microwaves can handle. For that, scientists
are looking for terahertz application in communication due to his ability in delivering data up to one
hundred times faster than today. Also, terahertz waves have much higher frequency and therefore
more potential bandwidth and bit rate up to 46 Gbps for wireless communications [49]. Unfortunately,
terahertz wave attenuation is high for long distances [50] and power levels are nowadays low, thus it
is difficult to use these waves for long ranges communication. However, it is very promising for
point-to-point bandwidth in wireless short-range communications [51].
Security and screening is one of the most attractive applications of terahertz due to the ability
of these waves in producing imaging and spectroscopic analysis through several types of materials.
One of the studies in the context of mail security and screening was using THz-TDS for barcode
identification [52]. This domain of application is the main interest in our work and a detailed
discussion of the state of art is presented further in this chapter.
II. PARCEL THREATS INSPECTION
Major events over the past couple of years, including 9/11/2001 in the United States and
recently 11/13/2016 in Paris, have dramatized the vulnerability of the global security, and increase the
need of more technological development to detect any type of threats. The problem of threat detection
can be considered on several different axes, as follows:
1- Location: airports, public buildings, postal center, vulnerable high-value facilities,
2- Target: airplanes in luggage, in cargo, in parcels, in letter, on people,
3- Threat: weapons, drugs, explosives (solid and liquid), bombs, nuclear dirty weapons.
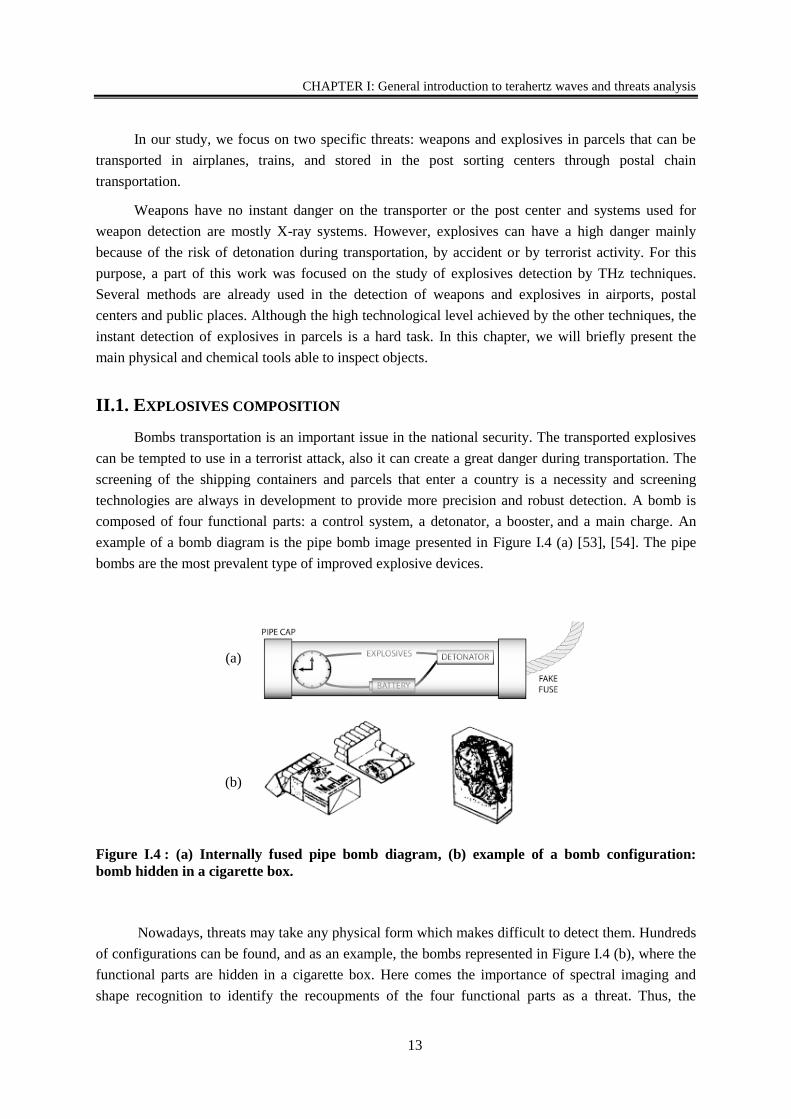
CHAPTER I: General introduction to terahertz waves and threats analysis
13
In our study, we focus on two specific threats: weapons and explosives in parcels that can be
transported in airplanes, trains, and stored in the post sorting centers through postal chain
transportation.
Weapons have no instant danger on the transporter or the post center and systems used for
weapon detection are mostly X-ray systems. However, explosives can have a high danger mainly
because of the risk of detonation during transportation, by accident or by terrorist activity. For this
purpose, a part of this work was focused on the study of explosives detection by THz techniques.
Several methods are already used in the detection of weapons and explosives in airports, postal
centers and public places. Although the high technological level achieved by the other techniques, the
instant detection of explosives in parcels is a hard task. In this chapter, we will briefly present the
main physical and chemical tools able to inspect objects.
II.1. EXPLOSIVES COMPOSITION
Bombs transportation is an important issue in the national security. The transported explosives
can be tempted to use in a terrorist attack, also it can create a great danger during transportation. The
screening of the shipping containers and parcels that enter a country is a necessity and screening
technologies are always in development to provide more precision and robust detection. A bomb is
composed of four functional parts: a control system, a detonator, a booster, and a main charge. An
example of a bomb diagram is the pipe bomb image presented in Figure I.4 (a) [53], [54]. The pipe
bombs are the most prevalent type of improved explosive devices.
Figure I.4 : (a) Internally fused pipe bomb diagram, (b) example of a bomb configuration:
bomb hidden in a cigarette box.
Nowadays, threats may take any physical form which makes difficult to detect them. Hundreds
of configurations can be found, and as an example, the bombs represented in Figure I.4 (b), where the
functional parts are hidden in a cigarette box. Here comes the importance of spectral imaging and
shape recognition to identify the recoupments of the four functional parts as a threat. Thus, the
(a)
(b)
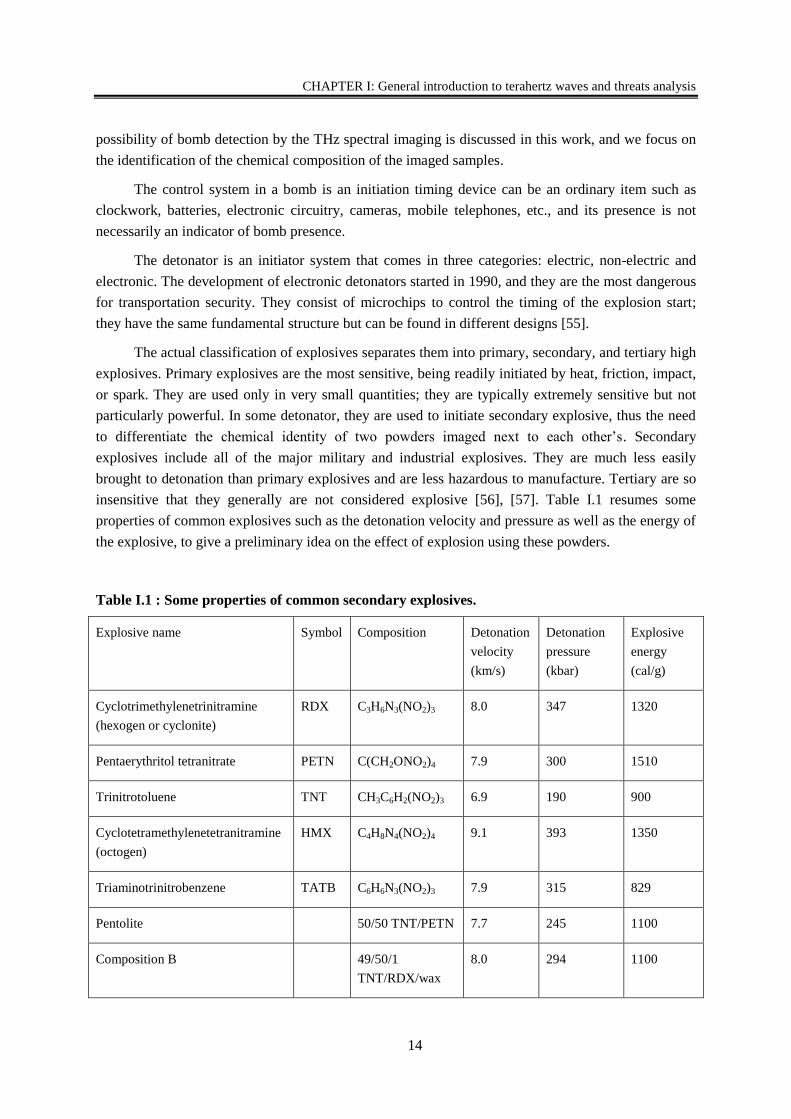
CHAPTER I: General introduction to terahertz waves and threats analysis
14
possibility of bomb detection by the THz spectral imaging is discussed in this work, and we focus on
the identification of the chemical composition of the imaged samples.
The control system in a bomb is an initiation timing device can be an ordinary item such as
clockwork, batteries, electronic circuitry, cameras, mobile telephones, etc., and its presence is not
necessarily an indicator of bomb presence.
The detonator is an initiator system that comes in three categories: electric, non-electric and
electronic. The development of electronic detonators started in 1990, and they are the most dangerous
for transportation security. They consist of microchips to control the timing of the explosion start;
they have the same fundamental structure but can be found in different designs [55].
The actual classification of explosives separates them into primary, secondary, and tertiary high
explosives. Primary explosives are the most sensitive, being readily initiated by heat, friction, impact,
or spark. They are used only in very small quantities; they are typically extremely sensitive but not
particularly powerful. In some detonator, they are used to initiate secondary explosive, thus the need
to differentiate the chemical identity of two powders imaged next to each other’s. Secondary
explosives include all of the major military and industrial explosives. They are much less easily
brought to detonation than primary explosives and are less hazardous to manufacture. Tertiary are so
insensitive that they generally are not considered explosive [56], [57]. Table I.1 resumes some
properties of common explosives such as the detonation velocity and pressure as well as the energy of
the explosive, to give a preliminary idea on the effect of explosion using these powders.
Table I.1 : Some properties of common secondary explosives.
Explosive name Symbol Composition Detonation
velocity
(km/s)
Detonation
pressure
(kbar)
Explosive
energy
(cal/g)
Cyclotrimethylenetrinitramine
(hexogen or cyclonite)
RDX C3H6N3(NO2)3 8.0 347 1320
Pentaerythritol tetranitrate PETN C(CH2ONO2)4 7.9 300 1510
Trinitrotoluene TNT CH3C6H2(NO2)3 6.9 190 900
Cyclotetramethylenetetranitramine
(octogen)
HMX C4H8N4(NO2)4 9.1 393 1350
Triaminotrinitrobenzene TATB C6H6N3(NO2)3 7.9 315 829
Pentolite 50/50 TNT/PETN 7.7 245 1100
Composition B 49/50/1
TNT/RDX/wax
8.0 294 1100
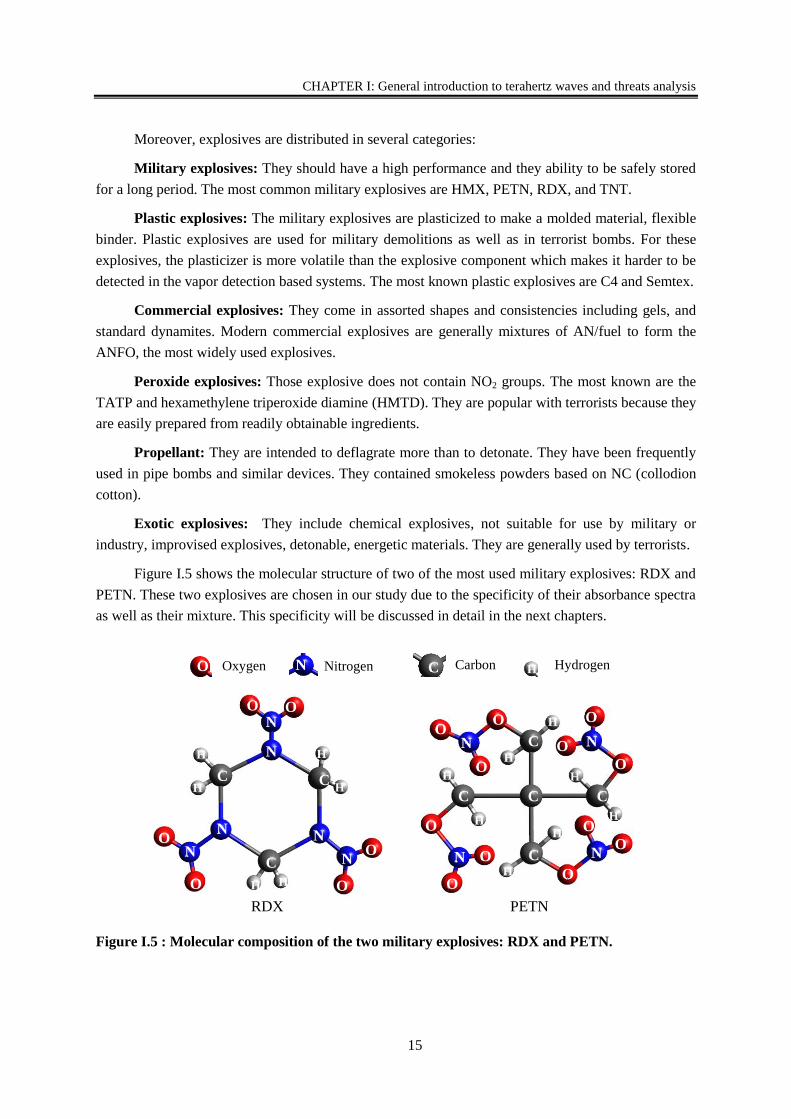
CHAPTER I: General introduction to terahertz waves and threats analysis
15
Moreover, explosives are distributed in several categories:
Military explosives: They should have a high performance and they ability to be safely stored
for a long period. The most common military explosives are HMX, PETN, RDX, and TNT.
Plastic explosives: The military explosives are plasticized to make a molded material, flexible
binder. Plastic explosives are used for military demolitions as well as in terrorist bombs. For these
explosives, the plasticizer is more volatile than the explosive component which makes it harder to be
detected in the vapor detection based systems. The most known plastic explosives are C4 and Semtex.
Commercial explosives: They come in assorted shapes and consistencies including gels, and
standard dynamites. Modern commercial explosives are generally mixtures of AN/fuel to form the
ANFO, the most widely used explosives.
Peroxide explosives: Those explosive does not contain NO2 groups. The most known are the
TATP and hexamethylene triperoxide diamine (HMTD). They are popular with terrorists because they
are easily prepared from readily obtainable ingredients.
Propellant: They are intended to deflagrate more than to detonate. They have been frequently
used in pipe bombs and similar devices. They contained smokeless powders based on NC (collodion
cotton).
Exotic explosives: They include chemical explosives, not suitable for use by military or
industry, improvised explosives, detonable, energetic materials. They are generally used by terrorists.
Figure I.5 shows the molecular structure of two of the most used military explosives: RDX and
PETN. These two explosives are chosen in our study due to the specificity of their absorbance spectra
as well as their mixture. This specificity will be discussed in detail in the next chapters.
Figure I.5 : Molecular composition of the two military explosives: RDX and PETN.
CC C
C
C
OO
O
O
O
O
O
OO
O
OO
N
N N
N
H
H
H
H
H
H
H
H
PETN
N
N
N
N
N
N
C C
C
H
H
H H
H
H
OO
O
O
O
O
RDX
Oxygen CarbonNitrogen HydrogenO N C H
CHAPTER I: General introduction to terahertz waves and threats analysis
16
II.2. EXPLOSIVES DETECTION TECHNIQUES
Detection of explosives is divided into bulk and trace technologies. Bulk detection looks for a
mass with certain properties considered indicative of an explosive, such as density, amounts of
oxygen and/or nitrogen, absorbance spectra in the case of THz technology, etc. Yet, the trace
detection looks for a specific chemical from a library of target compounds. The probability of false
alarm is significantly lower in trace detection than for bulk detection techniques. However, positive
trace detection provides no spatial or quantitative information to aid in decision-making, and is
limited to the explosives provided in the library. Some of the problem that faces trace detection is the
difficulty to obtain the sample into the detector and the inefficiency collection of vapor or particulate
by the detector. Known that the explosive number of molecules present in the atmosphere is very
small, for example, several ppb (particle per billion) for TNT explosive and several ppt (particle per
trillion) for RDX, that to say one molecule of explosives among billion of air molecules for TNT and
among 1000 billions of air molecules for RDX. This makes the detection of these molecules difficult
and consists to have sensitive detectors.
Most used methods for explosives detection are:
Animal
Nuclear technology
X-Ray
Ion mobility spectrometry
Mass spectrometry
Raman spectroscopy
Sensors-MEMS
Terahertz spectroscopy
Some of these techniques are discussed briefly to highlight their advantages and disadvantages
compared to terahertz [58].
II.2.1. Animals
The oldest and most used method for explosives detection in public places is animals,
especially dogs. They have a high sensitivity in identifying explosives even when they are hidden
within several types and thickness of objects. However, training dogs needs lots of time, money and
trainers. They can respond to the vapor constituent of explosives, such as acetone, toluene and
limonene as well as to complex mixture of chemical vapor constituents. However, different dogs may
not attend to exactly the same constituent.
II.2.2. Nuclear technologies
Nuclear detection technologies are used in the detection of objects hidden within thick and high
density materials. They involve two different aspects:
CHAPTER I: General introduction to terahertz waves and threats analysis
17
- Non-neutron-based detection can be based on probing the atom with particles, such as
photons and protons, which interact with atoms and gives off a signature according to the
properties of the target nuclei.
- Neutron techniques consist of irradiating the target by a neutron flux. The interaction of the
neutrons with the target nuclei generates a secondary radiation, which is detected and
analyzed. This method is basically used to identify the relative chemical content of specific
elements as carbon, oxygen, aluminum, sulfur and many other elements [59]–[61].
The main advantages of using nuclear technologies are they high penetration depth capability,
for example into metals, which is one of the reason to be chosen for container screening. It has the
specificity to differentiate between organic and inorganic materials. Also, it is easily implemented in
working spaces due to the fabricated portable systems. However, the neutron sources produce harmful
radiation doses if not shielded properly or at the correct stand-off. Also, the presence of nuclear
material at a site increases the threat from terrorists who may attempt to steal the material or to
explosively disperse it [62]–[65].
II.2.3. X-ray
An X-ray beam is a flow of discrete photon particles, each having a specific energy. The
attenuation of this photon with matter occurs via four basic modes of interaction: coherent X-ray
scatter, incoherent or Compton scatter, photoelectric absorption and pair production.
X-ray scanners are the most used systems in security; they are used for parcel and cargo
screening to give detailed images of the contents inside parcels, luggage, etc. They have high
resolution and high penetration ability. Although, for better precision, tomographic reconstruction
techniques are applied to X-ray data images to provide detailed information about each individual
object packed in luggage. These techniques are known by X-ray computer tomography (CT) and they
are based on three principles: single-slice CT, multi-slice CT and dual-energy CT. They generate a
three-dimensional representation of an object and they measure the X-ray attenuation coefficient µ of
every packed object which is proportional to a material’s density and the atomic number of the
material. Thus, they are able to recognize a wide variety of dangerous and innocuous objects based on
tri-color X-ray images assigned code colors as organic, inorganic or metallic, based on material
density and effective atomic number Zeff.
Typically, the organic range includes material having Zeff < 10, inorganic having 10 ≤ Zeff < 18,
and metallic having Zeff ≥ 18. Metallic threats are well detectable that metallic objects stand out
clearly from the background contents, but it is more complex for explosives because, being organic
substances, they do not have a distinctive appearance when imaged [66], [67].
An example of X-ray image results is shown in Figure I.6 and Figure I.7. These images were
taken especially for the InPoSec project during measurement campaign in La Poste center at Roissy
Charles-de-Gaulle airport in Paris.
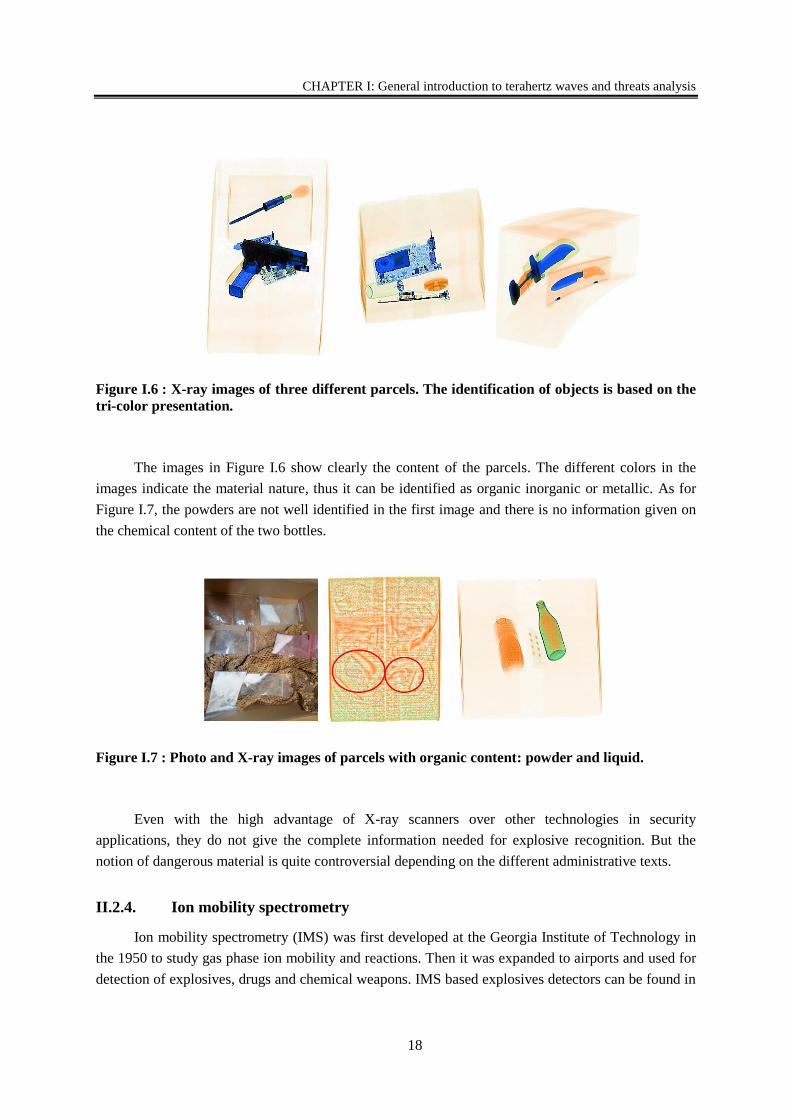
CHAPTER I: General introduction to terahertz waves and threats analysis
18
Figure I.6 : X-ray images of three different parcels. The identification of objects is based on the
tri-color presentation.
The images in Figure I.6 show clearly the content of the parcels. The different colors in the
images indicate the material nature, thus it can be identified as organic inorganic or metallic. As for
Figure I.7, the powders are not well identified in the first image and there is no information given on
the chemical content of the two bottles.
Figure I.7 : Photo and X-ray images of parcels with organic content: powder and liquid.
Even with the high advantage of X-ray scanners over other technologies in security
applications, they do not give the complete information needed for explosive recognition. But the
notion of dangerous material is quite controversial depending on the different administrative texts.
II.2.4. Ion mobility spectrometry
Ion mobility spectrometry (IMS) was first developed at the Georgia Institute of Technology in
the 1950 to study gas phase ion mobility and reactions. Then it was expanded to airports and used for
detection of explosives, drugs and chemical weapons. IMS based explosives detectors can be found in
CHAPTER I: General introduction to terahertz waves and threats analysis
19
security entrances at airports throughout the world [68]. It was also combined with other techniques as
mass spectrometry, gas chromatography and electrospray ionization [69].
IMS technique is based on the measurements of the substance ion mobility differences. The
extracted sample of a suspicious object is heated on 200 ºC to generate vapor that is mixed with gas
ions, the chemical reaction of the mix generates ions related to the sample. These ions enter a drift
tube that contains a weak electric field. As ions move in the tube, they are separated according to their
mass, size, shape, and charge. Differential migration time through the tube can be used to identify the
components. This technique has a high speed response; a measurement takes tens of milliseconds.
However, the analyses are not systematic, it needs the contribution of a human to collect samples and
place it in the analyzers [70].
II.2.5. Mass spectrometry
Mass spectrometry (MS) is one of the technologies used for vapor and trace detection of hidden
explosives. It identifies the substance by the masses of the atoms and molecules of which materials
are composed and depends on the substance mass-to-charge ratio. MS where successively applied to
several explosives such as TNT, RDX, HMX, PETN and their mixtures. The systems based on MS
can detect in real time small amounts of powders, going to nanograms and even femtograms. The
analysis is made in a few seconds, without any sample preparation, with a high sensitivity and
selectivity [71]–[74]. Mass spectrometry offers much better discrimination than IMS but has poor
sensitivity relative to IMS.
II.2.6. Raman spectroscopy
Raman spectroscopy is a non-destructive technique widely used for bulk explosives detection.
It is a vibrational spectroscopy technique used to collect a unique chemical fingerprint of molecules
by illuminating a surface with a laser beam and detect the scattered light corresponding to the phonon
generated after the interaction of the laser beam with the matter. The scattered light constitutes the
Raman spectrum that is represented as an intensity-versus-wavelength shift. One of the advantages of
Raman spectroscopy is the possibility of analysis without any sample preparation and in stand-off
configuration [75] [76]. It is able to provide quantitative information of the molecular content of the
sample. Several portable Raman systems are already commercialized, and most of them are constitute
of diode laser to provide smaller weight and acceptable cost [77]. The response is sensitive to
molecular vibrations and the spectrum of Raman scattered light depends on the molecular constituents
of the samples.
Moreover, Wentwoth et al. demonstrated the possibility to Raman sensor with a hyperspectral
imaging design that can provide chemical identification in images. This work was an initiative for
combination of Raman spectroscopy and Laser-induced breakdown spectroscopy (LIBS) to provide
high sensitivity, low false alarm rate standoff identification for explosives on surfaces [78]. Also
Moros et al. presented an experimental design that combines both technologies at a stand-off distance
of 20 m [79].
CHAPTER I: General introduction to terahertz waves and threats analysis
20
II.2.7. Sensors
Sensors are one of the most reliable and sensitive vapor explosives detection methods. They are
similar to the dog's keen sense of smell, have a small size and easy to use in any location. Several
types of sensors are well developed and used; most of them are based on Microelectromechanical
(MEMS) technology. One of the commercial systems is provided by “SpectraFluidics”. It is a
microsystem silicon chip based on free-surface microfluidics with surface-enhanced Raman
spectroscopy for detection of vapor trace of explosives in the air. Other types of sensors are those
based on electrochemical process. The detection concept is based on the chemical interaction of the
molecule with the electrode of the sensor that creates an electric current proportional to the gas
concentration. The limitation of such a detector is in identification of mixture even binary mixtures
[80], [81].
II.2.8. Technology comparison
A comparison of the advantages and disadvantages of each technology discussed earlier is
summarized in Table I.2. For parcel inspection, trace detection techniques as MS, IMS are not
efficient because most techniques rely on vapor detection. The presence of vapor molecules is
extremely small, and when the explosives are concealed in packaging materials, the generation of
vapor is dramatically reduced. As for Raman, the system must be very close to the surface of analysis.
So this techniques cannot provide useful information unless, in especial cases, where the parcel can be
opened and samples are extracted to be analyzed.
So, bulk detection techniques are the most helpful for forensic security parcel inspection.
Among bulk detection techniques, X-ray is the most efficient, with rapid scan, providing detailed 3D
images. However, X-ray cannot identify explosive identity.
Thus, THz spectral imaging is very promising for inspection of parcels being able to provide
2D and 3D images of objects through packaging, as well as it is able to identify powders. For these
reasons, THz imaging, spectroscopy and spectral imaging was studied in this work, as a
complementary technology to the X-rays. Also, chemometric analysis is applied to THz data for
extraction of additional information especially for explosive threats. The use of chemometrics is
expended to several measuring techniques as Raman and Laser-Induced Breakdown Spectroscopy
(LIBS), and it has a high progress in the last years.
Table I.2 : Basic advantages and disadvantages of several technologies used in explosives
detection.
Technology Advantage Disadvantage
Animal High degree of sensitivity and
selectivity.
Easy to use.
Portable and mobile.
Inexpensive.
Gives public reassurance.
Depend on the skills of the dog
handler in the interpretation of
the dog’s response.
Cannot identify the identity of
the threat: explosive, drug, etc.
CHAPTER I: General introduction to terahertz waves and threats analysis
21
Nuclear
technologies
High penetration.
Elemental identification.
Ability to penetrate deep into
cargo containers.
Dangerous for health.
X-ray High resolution.
High penetration.
Three-Dimensional
representation of objects.
No chemical identification of
materials.
Dangerous on health when people
are exposed to X-ray radiations.
Ion mobility
spectrometry
Rapid analysis.
Developed commercial
systems.
Need to collect samples to
analyze.
Only for trace detection.
Mass
spectrometry
High selectivity and
sensitivity.
Detect small amounts of
explosives.
Only for trace detection.
Raman High sensitivity.
Qualitative and quantitative
identification.
Contact with the sample.
Sensors Small, high sensitivity,
commercial, easy to use.
Only for vapor detection
III. TERAHERTZ SECURITY APPLICATIONS
Development of improved radiation sources and detectors at the end of the twentieth century
has enabled considerable progress in the THz systems for threat detection. Being weakly absorbed by
most non-conductive materials and providing chemical information, terahertz has a big advantage on
other technologies for investigation of parcels. However, it was used in many other security
applications for weapon and chemical detection. THz techniques can provide a chemical identification
of materials, especially powders at moderate standoff distances.
III.1. TERAHERTZ FOR WEAPONS DETECTION
Detection and identification of objects hidden behind barriers are one of the core requirements
for security inspection systems. Two main detection configurations are needed: long and short range
detection. Long range systems are dedicated for detection of suicide bombers and weapons hidden
under clothes and short range systems are more used for mail inspection as well as for weapons
detection. For both configurations, the two technologies can be used: passive and active. As it will be
discussed in detail in chapter III, passive systems are used when the radiation is provided by the target
itself and with active systems the target is illuminated by a source. Moreover, pulsed or continuous
wave systems can be used, but for weapon detection, continuous waves are advantageous due to their
higher single frequency dynamic range. Also, they can be chosen in the window of low water vapor
absorption, thus is easier to operate at longer standoff distances.
CHAPTER I: General introduction to terahertz waves and threats analysis
22
The ability of terahertz waves in clothing penetration, made possible the stand-off detection of
concealed weapon, especially those used for terrorist attacks. Thus, one of the main interests of using
terahertz in weapons detection is to observe objects underneath people’s clothing using passive or
active imaging. In this aim, several millimeter-wave (MMW) systems were developed by many
research groups and companies in the past years, which are suitable for stand-off detection of hidden
objects in real time. In 1996, TRW space & electronics group demonstrated an array sensitive to 0.4 K
for passive imaging using Schottky diodes as detectors [82]. Trex company presented in 2002 the
second generation of passive millimeter wave stand-off system operating in real time and having a 2
K temperature sensitivity [83]. In contrast, mechanically scanning passive imager operating at 94 GHz
is developed. The optical configuration is designed in a way to reduce the optical aberration. The
testing results show a high resolution image with a low noise [84], [85]. Moreover, MC2 technology
developed a low cost passive millimeter wave camera based on low noise amplification and detection
at 90 GHz [86]. This system is used in the present study to demonstrate the potential of this
technology in weapons detection, not only when they are concealed in human body, but also when
they are hidden in parcels. Detailed description and analysis are given in chapters III.
In 2009, the portal scanner based on millimeter waves started to be used in USA airports and in
some airports in Europe. In France, these scanners are not frequently used, yet the study on the effect
of these scanners did not show any dangerous side effects on human health [87]. The strategy of
scanning can be envisaged in two configurations: the first is similar to the scanner in Figure I.8 (a)
[88], and the second represents a scanning chamber. Figure I.8 (b) and (c) represents the scanner made
by Millivision [89]. It is self-contained, with imager, power, control and automatic threat recognition.
Also, it shows the visualized direct result and the way the software recognizes automatically threat
and places markers on the image eliminating any need to view the subject. Another development is
presented by the Pacific Northwest National laboratory with an active MMW body scanner known by
ProVision (Figure I.8 (d)). It uses coherent millimeter wave radiation emitter and is able to detect
amplitude and phase information and provide 2D and 3D images [90] [91].
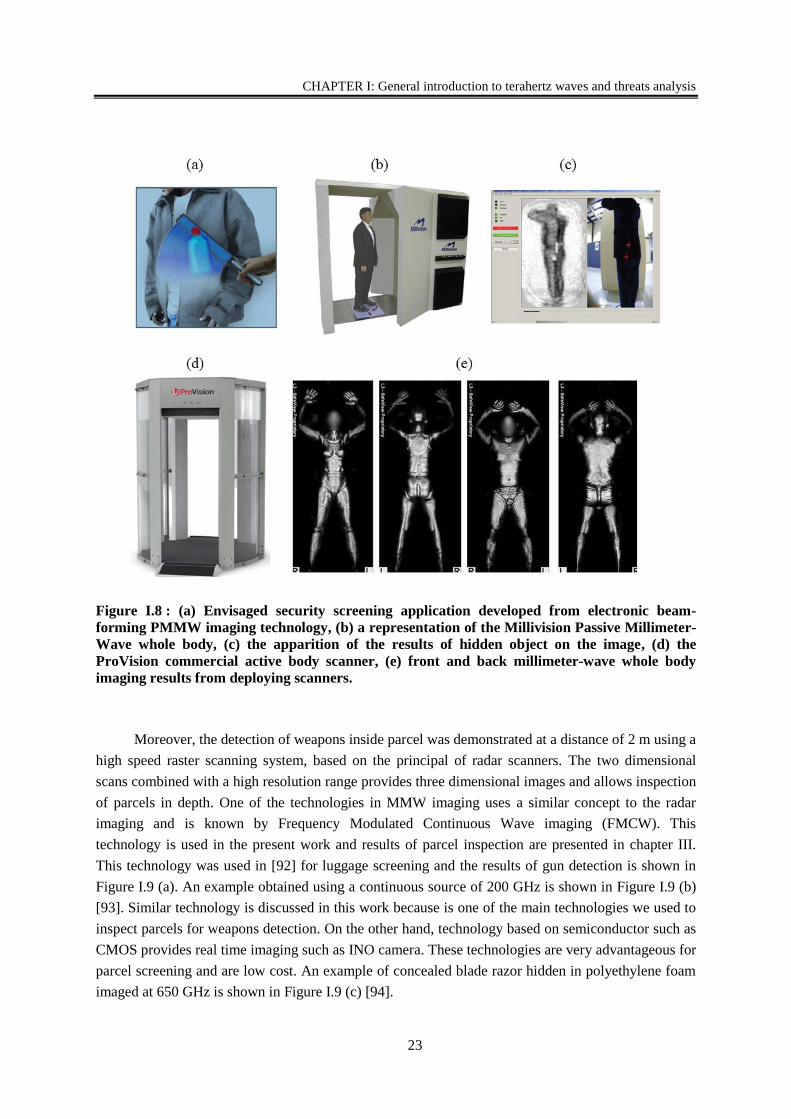
CHAPTER I: General introduction to terahertz waves and threats analysis
23
Figure I.8 : (a) Envisaged security screening application developed from electronic beam-
forming PMMW imaging technology, (b) a representation of the Millivision Passive Millimeter-
Wave whole body, (c) the apparition of the results of hidden object on the image, (d) the
ProVision commercial active body scanner, (e) front and back millimeter-wave whole body
imaging results from deploying scanners.
Moreover, the detection of weapons inside parcel was demonstrated at a distance of 2 m using a
high speed raster scanning system, based on the principal of radar scanners. The two dimensional
scans combined with a high resolution range provides three dimensional images and allows inspection
of parcels in depth. One of the technologies in MMW imaging uses a similar concept to the radar
imaging and is known by Frequency Modulated Continuous Wave imaging (FMCW). This
technology is used in the present work and results of parcel inspection are presented in chapter III.
This technology was used in [92] for luggage screening and the results of gun detection is shown in
Figure I.9 (a). An example obtained using a continuous source of 200 GHz is shown in Figure I.9 (b)
[93]. Similar technology is discussed in this work because is one of the main technologies we used to
inspect parcels for weapons detection. On the other hand, technology based on semiconductor such as
CMOS provides real time imaging such as INO camera. These technologies are very advantageous for
parcel screening and are low cost. An example of concealed blade razor hidden in polyethylene foam
imaged at 650 GHz is shown in Figure I.9 (c) [94].
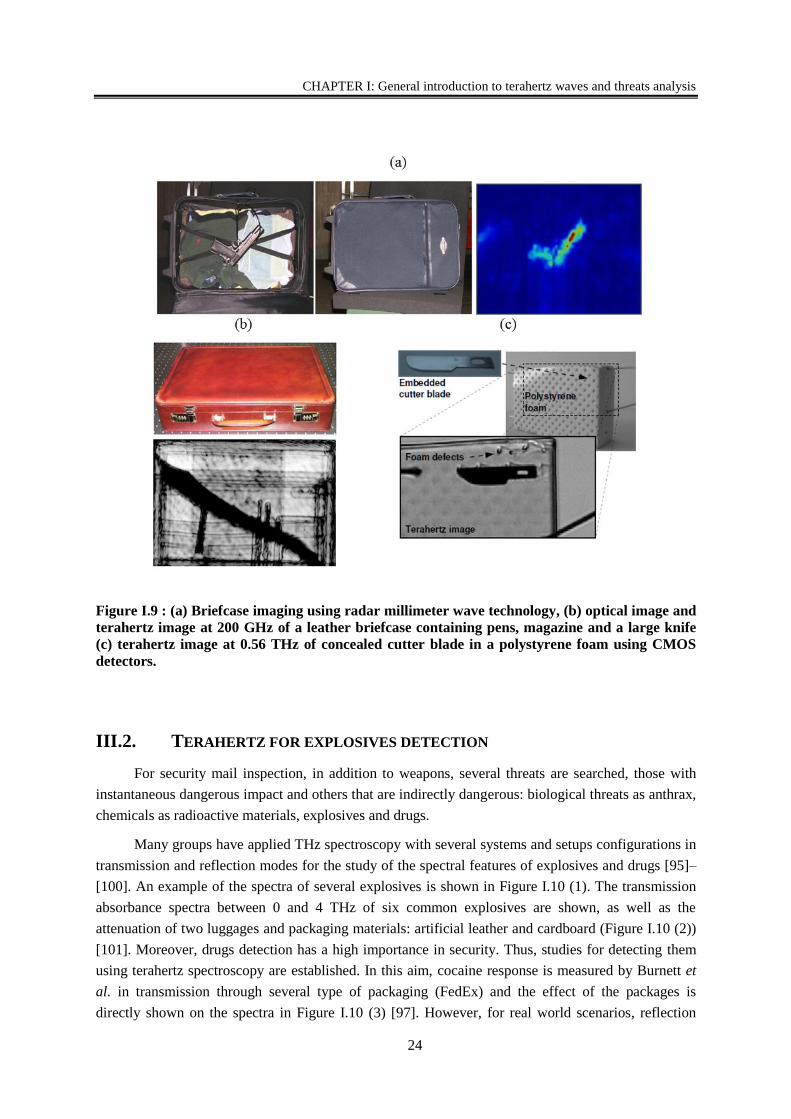
CHAPTER I: General introduction to terahertz waves and threats analysis
24
Figure I.9 : (a) Briefcase imaging using radar millimeter wave technology, (b) optical image and
terahertz image at 200 GHz of a leather briefcase containing pens, magazine and a large knife
(c) terahertz image at 0.56 THz of concealed cutter blade in a polystyrene foam using CMOS
detectors.
III.2. TERAHERTZ FOR EXPLOSIVES DETECTION
For security mail inspection, in addition to weapons, several threats are searched, those with
instantaneous dangerous impact and others that are indirectly dangerous: biological threats as anthrax,
chemicals as radioactive materials, explosives and drugs.
Many groups have applied THz spectroscopy with several systems and setups configurations in
transmission and reflection modes for the study of the spectral features of explosives and drugs [95]–
[100]. An example of the spectra of several explosives is shown in Figure I.10 (1). The transmission
absorbance spectra between 0 and 4 THz of six common explosives are shown, as well as the
attenuation of two luggages and packaging materials: artificial leather and cardboard (Figure I.10 (2))
[101]. Moreover, drugs detection has a high importance in security. Thus, studies for detecting them
using terahertz spectroscopy are established. In this aim, cocaine response is measured by Burnett et
al. in transmission through several type of packaging (FedEx) and the effect of the packages is
directly shown on the spectra in Figure I.10 (3) [97]. However, for real world scenarios, reflection
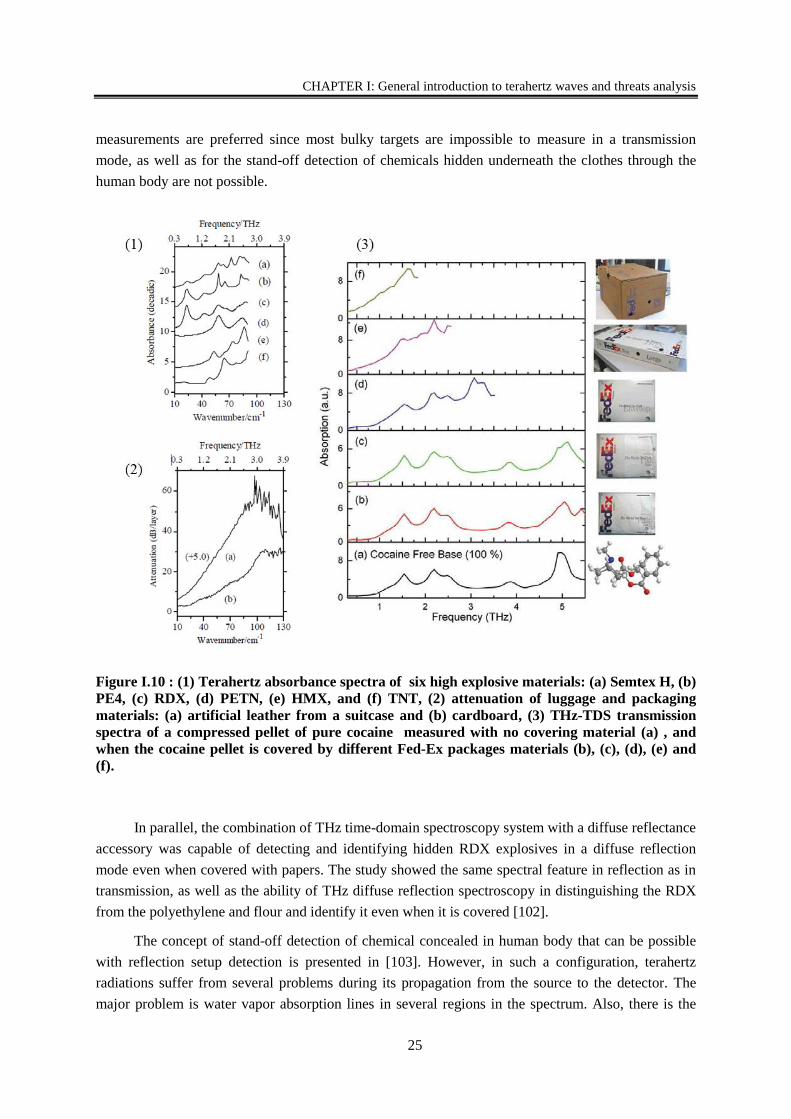
CHAPTER I: General introduction to terahertz waves and threats analysis
25
measurements are preferred since most bulky targets are impossible to measure in a transmission
mode, as well as for the stand-off detection of chemicals hidden underneath the clothes through the
human body are not possible.
Figure I.10 : (1) Terahertz absorbance spectra of six high explosive materials: (a) Semtex H, (b)
PE4, (c) RDX, (d) PETN, (e) HMX, and (f) TNT, (2) attenuation of luggage and packaging
materials: (a) artificial leather from a suitcase and (b) cardboard, (3) THz-TDS transmission
spectra of a compressed pellet of pure cocaine measured with no covering material (a) , and
when the cocaine pellet is covered by different Fed-Ex packages materials (b), (c), (d), (e) and
(f).
In parallel, the combination of THz time-domain spectroscopy system with a diffuse reflectance
accessory was capable of detecting and identifying hidden RDX explosives in a diffuse reflection
mode even when covered with papers. The study showed the same spectral feature in reflection as in
transmission, as well as the ability of THz diffuse reflection spectroscopy in distinguishing the RDX
from the polyethylene and flour and identify it even when it is covered [102].
The concept of stand-off detection of chemical concealed in human body that can be possible
with reflection setup detection is presented in [103]. However, in such a configuration, terahertz
radiations suffer from several problems during its propagation from the source to the detector. The
major problem is water vapor absorption lines in several regions in the spectrum. Also, there is the
CHAPTER I: General introduction to terahertz waves and threats analysis
26
attenuation, reflectivity and scattering caused by the target and the clothes. Some of these problems
are reduced for other security application such as letter inspection, where the detection can be made in
close environment under dry air at a distance smaller to 1 m of the target.
In addition to solid dangerous powders, inflammable liquid identification in plastic bottle is
studied with a time-domain system in transmission configuration. Usually, inflammable liquid cannot
be distinguished from water when they are concealed in plastic bottles. Mid-IR absorption and Raman
scattering are possible methods for inspecting inflammable liquids stored in transparent bottles.
However, terahertz spectroscopy can distinguish water from inflammable liquid in opaque plastic
bottles [104].
Beside simple spectroscopy, chemical mapping had a great interest in THz application. Several
demonstrations of the potential of powder identification by their spectra, on images have been carried
on using broadband terahertz spectroscopy, in reflection and in transmission. A first study held on
terahertz mapping of illegal drugs used in Japan was in 2003, where the spectral fingerprints at seven
frequencies was used for discrimination of 20 mg of methamphetamine, MDMA and aspirin
concealed in polyethylene bag inside envelopes as shown in Figure I.11 (b). Component spatial
pattern analysis was applied to the seven spectral images allowing the extraction of each of the three
components separately [105]. Similar study used pulsed THz in reflection mode for identification of
powder such as lactose and sucrose in the frequency band [0-2] THz. This study showed the
possibility to obtain the spatial distribution of individual chemical components in a mixture [106]. In
contrast, another study is held for the discrimination between four chemical compounds in a
transmission configuration through 1 cm thick samples (Figure I.11 (a)). The discrimination of the
powder was possible with a coefficient proportional to the weight of a spectral feature of the
absorption spectra [107].
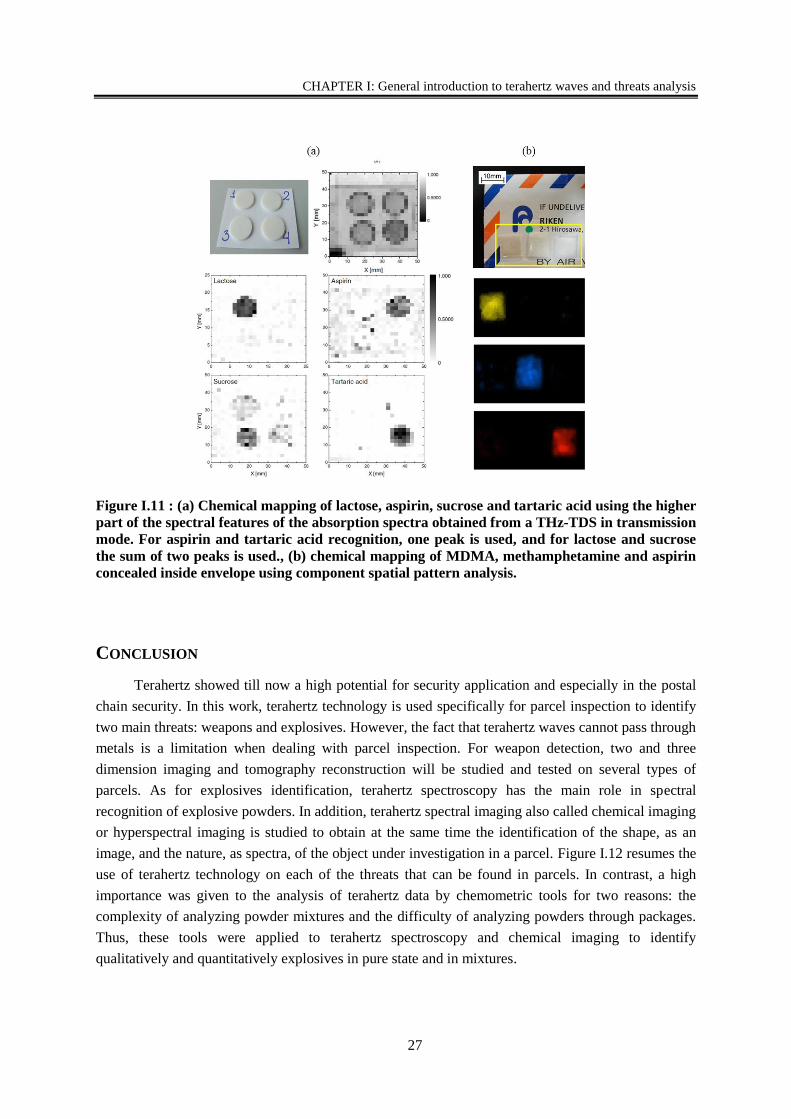
CHAPTER I: General introduction to terahertz waves and threats analysis
27
Figure I.11 : (a) Chemical mapping of lactose, aspirin, sucrose and tartaric acid using the higher
part of the spectral features of the absorption spectra obtained from a THz-TDS in transmission
mode. For aspirin and tartaric acid recognition, one peak is used, and for lactose and sucrose
the sum of two peaks is used., (b) chemical mapping of MDMA, methamphetamine and aspirin
concealed inside envelope using component spatial pattern analysis.
CONCLUSION
Terahertz showed till now a high potential for security application and especially in the postal
chain security. In this work, terahertz technology is used specifically for parcel inspection to identify
two main threats: weapons and explosives. However, the fact that terahertz waves cannot pass through
metals is a limitation when dealing with parcel inspection. For weapon detection, two and three
dimension imaging and tomography reconstruction will be studied and tested on several types of
parcels. As for explosives identification, terahertz spectroscopy has the main role in spectral
recognition of explosive powders. In addition, terahertz spectral imaging also called chemical imaging
or hyperspectral imaging is studied to obtain at the same time the identification of the shape, as an
image, and the nature, as spectra, of the object under investigation in a parcel. Figure I.12 resumes the
use of terahertz technology on each of the threats that can be found in parcels. In contrast, a high
importance was given to the analysis of terahertz data by chemometric tools for two reasons: the
complexity of analyzing powder mixtures and the difficulty of analyzing powders through packages.
Thus, these tools were applied to terahertz spectroscopy and chemical imaging to identify
qualitatively and quantitatively explosives in pure state and in mixtures.
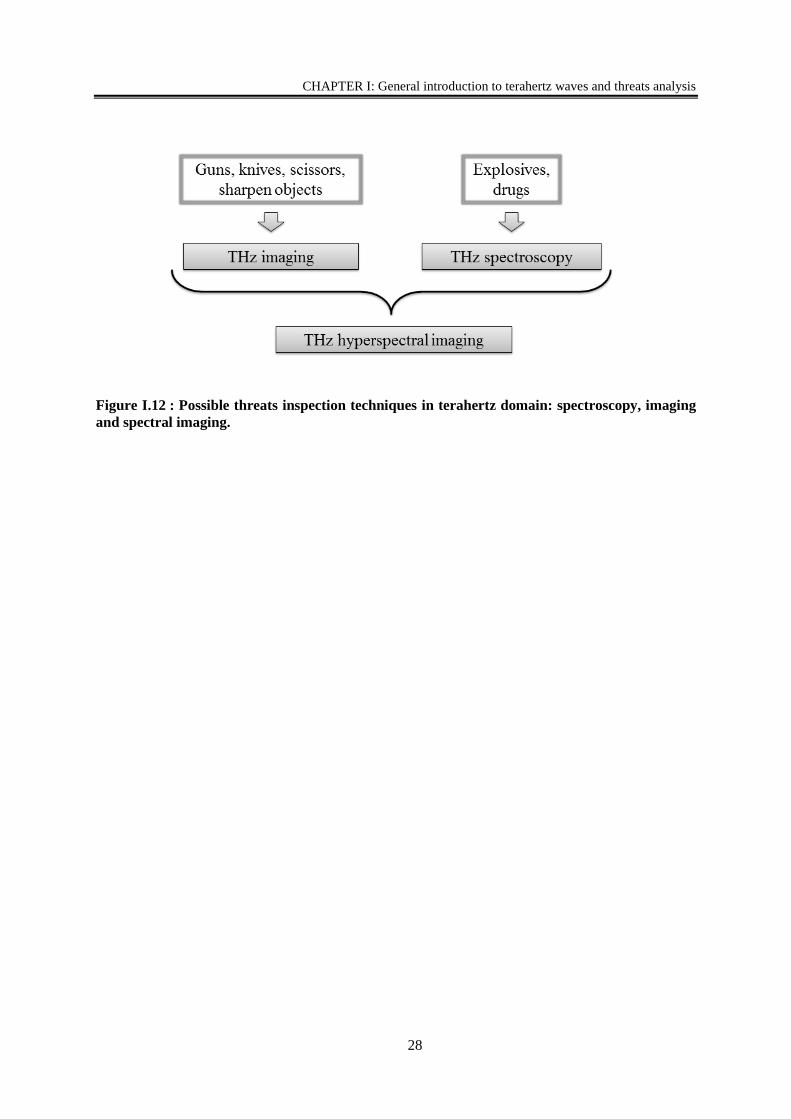
CHAPTER I: General introduction to terahertz waves and threats analysis
28
Figure I.12 : Possible threats inspection techniques in terahertz domain: spectroscopy, imaging
and spectral imaging.
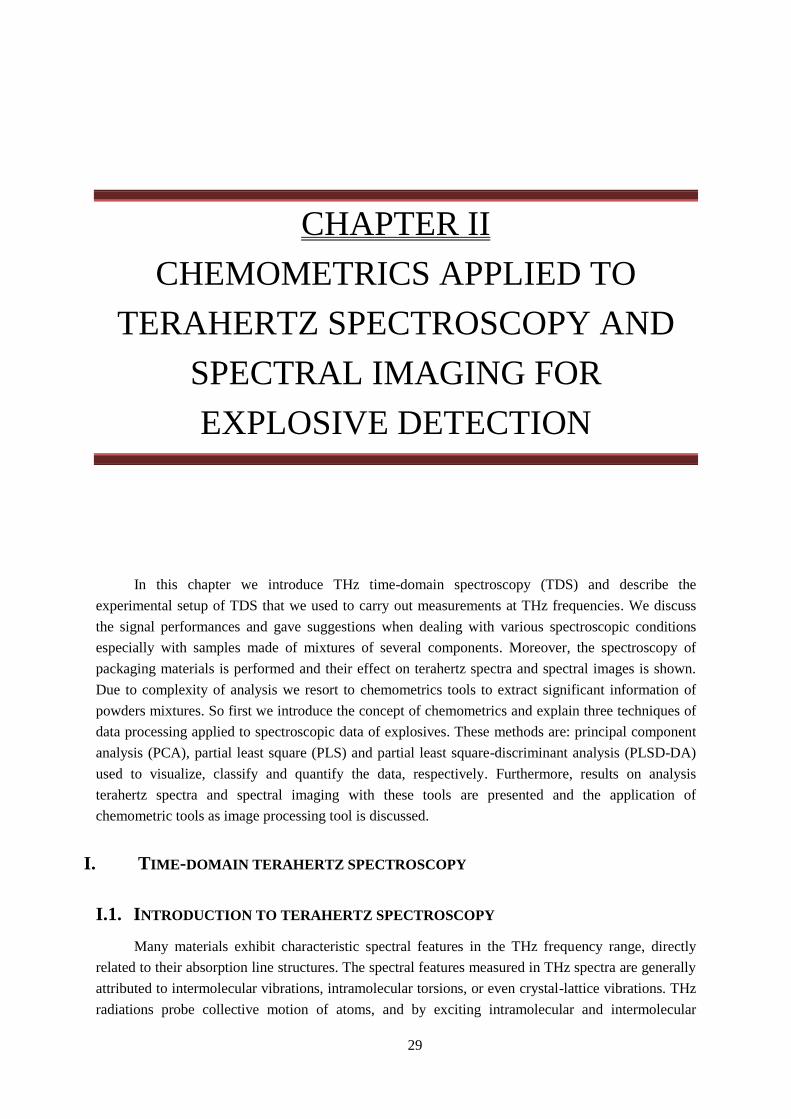
29
CHAPTER II
CHEMOMETRICS APPLIED TO
TERAHERTZ SPECTROSCOPY AND
SPECTRAL IMAGING FOR
EXPLOSIVE DETECTION
In this chapter we introduce THz time-domain spectroscopy (TDS) and describe the
experimental setup of TDS that we used to carry out measurements at THz frequencies. We discuss
the signal performances and gave suggestions when dealing with various spectroscopic conditions
especially with samples made of mixtures of several components. Moreover, the spectroscopy of
packaging materials is performed and their effect on terahertz spectra and spectral images is shown.
Due to complexity of analysis we resort to chemometrics tools to extract significant information of
powders mixtures. So first we introduce the concept of chemometrics and explain three techniques of
data processing applied to spectroscopic data of explosives. These methods are: principal component
analysis (PCA), partial least square (PLS) and partial least square-discriminant analysis (PLSD-DA)
used to visualize, classify and quantify the data, respectively. Furthermore, results on analysis
terahertz spectra and spectral imaging with these tools are presented and the application of
chemometric tools as image processing tool is discussed.
I. TIME-DOMAIN TERAHERTZ SPECTROSCOPY
I.1. INTRODUCTION TO TERAHERTZ SPECTROSCOPY
Many materials exhibit characteristic spectral features in the THz frequency range, directly
related to their absorption line structures. The spectral features measured in THz spectra are generally
attributed to intermolecular vibrations, intramolecular torsions, or even crystal-lattice vibrations. THz
radiations probe collective motion of atoms, and by exciting intramolecular and intermolecular
CHAPTER II: Chemometrics applied to terahertz spectroscopy and spectral imaging for explosive detection
30
vibrations modes, it has the potential to provide both chemical and structural information. Figure II.1
presents molecular motions in the terahertz region [108][109]. Till now, the understanding of the
chemical origin of the spectra obtained by terahertz spectroscopy has been difficult. The efforts in
molecular spectroscopy have been dedicated to the construction of spectral libraries and models for
different product in the THz region to compare and interpret THz spectra. However, for a given
product, the reported THz spectra highly differ from author to the other one. On the other hand,
several theoretical calculations of solid state products were made such as the solid-state density
functional theory (DFT). These calculations were applied to several chemical products, especially
explosives like PETN and RDX to understand the molecular motions responsible of specific spectral
features obtained after interaction with the terahertz radiation [110][111].
One of the main terahertz coherent spectroscopy methods is the time-domain terahertz
spectroscopy (THz-TDS) [112] that we chose to perform THz spectroscopy in the present study. This
spectroscopic technique appeared in the mid-1980s in the works of Auston et al. [113] and had
become an applicable technique for materials analysis with the first TDS system designed and
reported in 1989 [114]. Recently, time-domain terahertz spectroscopy has found applications in
various areas of material science such as gas sensing [115][116], measurement of material properties
of solids such as polymers [117], superconductors [118][119] as well as spectroscopy of liquids [104]
[120], etc.
Figure II.1 : Molecular transitions in the terahertz region combining interaction of the optic and
electronic domains.
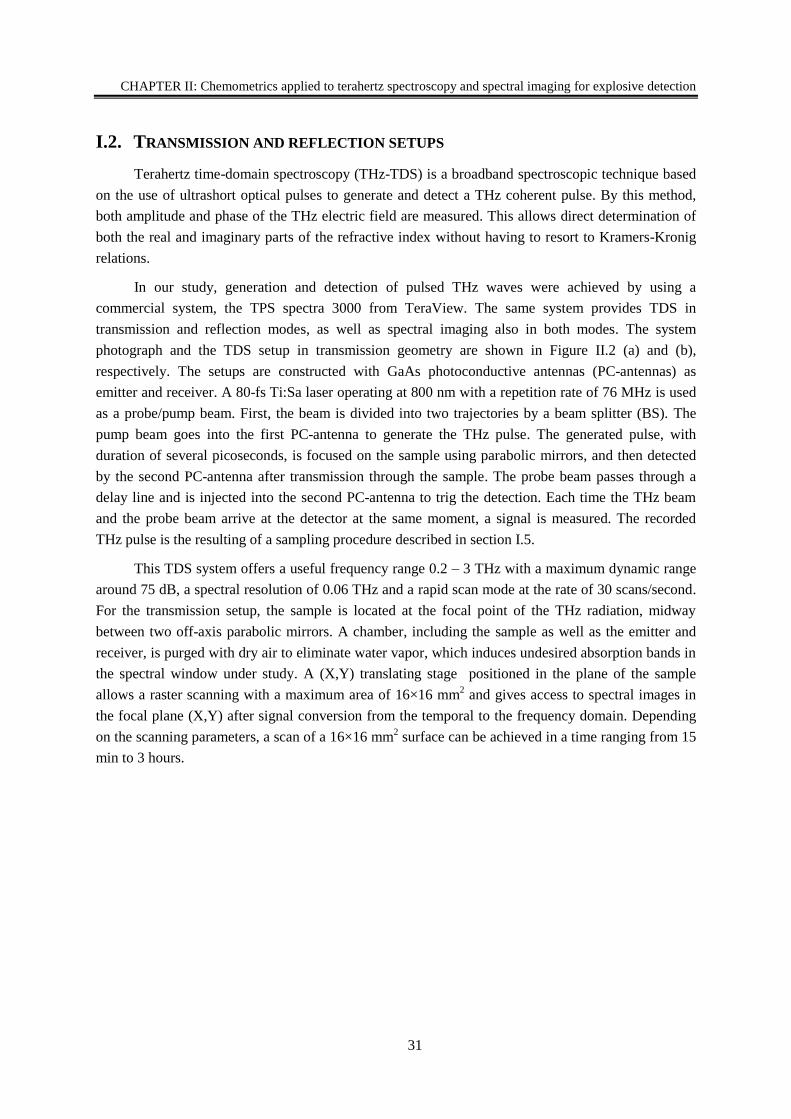
CHAPTER II: Chemometrics applied to terahertz spectroscopy and spectral imaging for explosive detection
31
I.2. TRANSMISSION AND REFLECTION SETUPS
Terahertz time-domain spectroscopy (THz-TDS) is a broadband spectroscopic technique based
on the use of ultrashort optical pulses to generate and detect a THz coherent pulse. By this method,
both amplitude and phase of the THz electric field are measured. This allows direct determination of
both the real and imaginary parts of the refractive index without having to resort to Kramers-Kronig
relations.
In our study, generation and detection of pulsed THz waves were achieved by using a
commercial system, the TPS spectra 3000 from TeraView. The same system provides TDS in
transmission and reflection modes, as well as spectral imaging also in both modes. The system
photograph and the TDS setup in transmission geometry are shown in Figure II.2 (a) and (b),
respectively. The setups are constructed with GaAs photoconductive antennas (PC-antennas) as
emitter and receiver. A 80-fs Ti:Sa laser operating at 800 nm with a repetition rate of 76 MHz is used
as a probe/pump beam. First, the beam is divided into two trajectories by a beam splitter (BS). The
pump beam goes into the first PC-antenna to generate the THz pulse. The generated pulse, with
duration of several picoseconds, is focused on the sample using parabolic mirrors, and then detected
by the second PC-antenna after transmission through the sample. The probe beam passes through a
delay line and is injected into the second PC-antenna to trig the detection. Each time the THz beam
and the probe beam arrive at the detector at the same moment, a signal is measured. The recorded
THz pulse is the resulting of a sampling procedure described in section I.5.
This TDS system offers a useful frequency range 0.2 – 3 THz with a maximum dynamic range
around 75 dB, a spectral resolution of 0.06 THz and a rapid scan mode at the rate of 30 scans/second.
For the transmission setup, the sample is located at the focal point of the THz radiation, midway
between two off-axis parabolic mirrors. A chamber, including the sample as well as the emitter and
receiver, is purged with dry air to eliminate water vapor, which induces undesired absorption bands in
the spectral window under study. A (X,Y) translating stage positioned in the plane of the sample
allows a raster scanning with a maximum area of 16×16 mm2 and gives access to spectral images in
the focal plane (X,Y) after signal conversion from the temporal to the frequency domain. Depending
on the scanning parameters, a scan of a 16×16 mm2 surface can be achieved in a time ranging from 15
min to 3 hours.
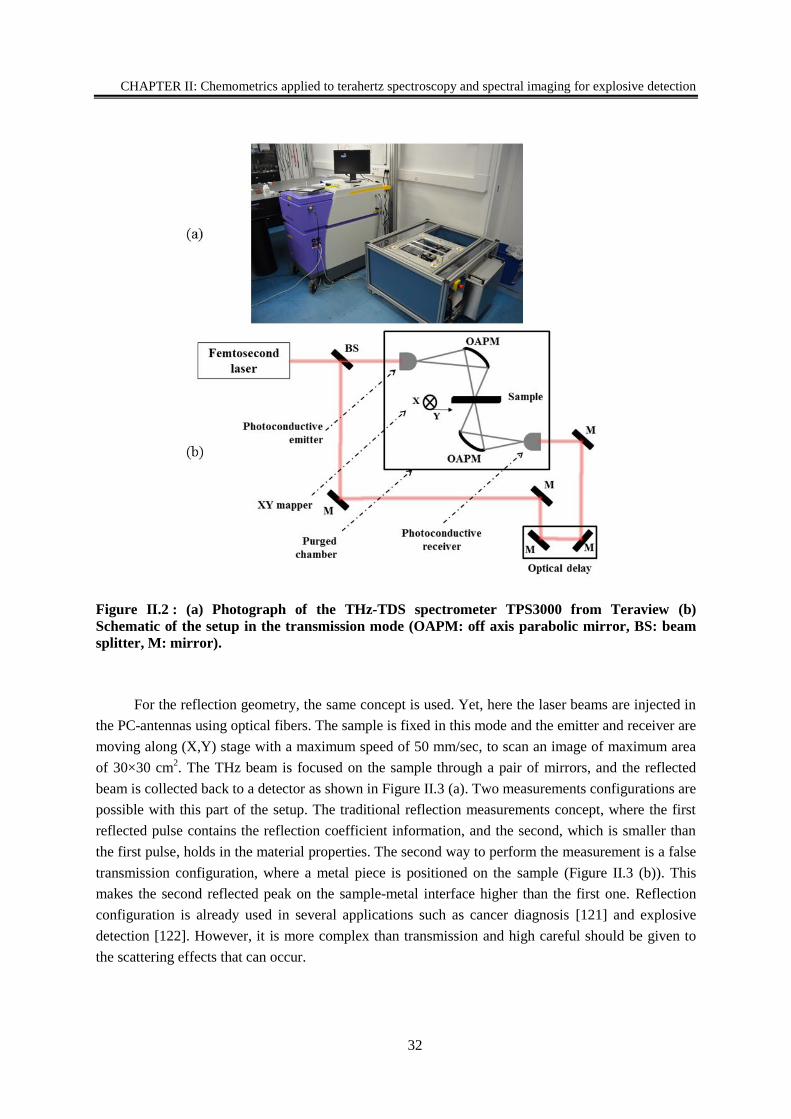
CHAPTER II: Chemometrics applied to terahertz spectroscopy and spectral imaging for explosive detection
32
Figure II.2 : (a) Photograph of the THz-TDS spectrometer TPS3000 from Teraview (b)
Schematic of the setup in the transmission mode (OAPM: off axis parabolic mirror, BS: beam
splitter, M: mirror).
For the reflection geometry, the same concept is used. Yet, here the laser beams are injected in
the PC-antennas using optical fibers. The sample is fixed in this mode and the emitter and receiver are
moving along (X,Y) stage with a maximum speed of 50 mm/sec, to scan an image of maximum area
of 30×30 cm2. The THz beam is focused on the sample through a pair of mirrors, and the reflected
beam is collected back to a detector as shown in Figure II.3 (a). Two measurements configurations are
possible with this part of the setup. The traditional reflection measurements concept, where the first
reflected pulse contains the reflection coefficient information, and the second, which is smaller than
the first pulse, holds in the material properties. The second way to perform the measurement is a false
transmission configuration, where a metal piece is positioned on the sample (Figure II.3 (b)). This
makes the second reflected peak on the sample-metal interface higher than the first one. Reflection
configuration is already used in several applications such as cancer diagnosis [121] and explosive
detection [122]. However, it is more complex than transmission and high careful should be given to
the scattering effects that can occur.
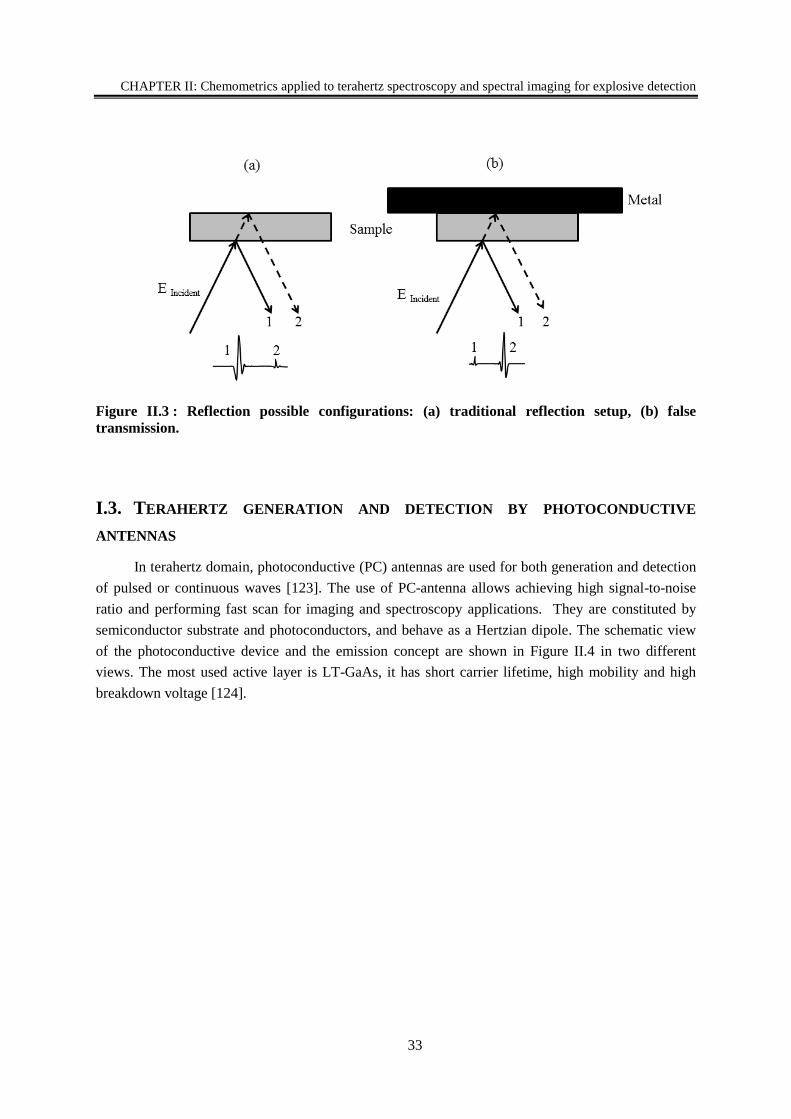
CHAPTER II: Chemometrics applied to terahertz spectroscopy and spectral imaging for explosive detection
33
Figure II.3 : Reflection possible configurations: (a) traditional reflection setup, (b) false
transmission.
I.3. TERAHERTZ GENERATION AND DETECTION BY PHOTOCONDUCTIVE
ANTENNAS
In terahertz domain, photoconductive (PC) antennas are used for both generation and detection
of pulsed or continuous waves [123]. The use of PC-antenna allows achieving high signal-to-noise
ratio and performing fast scan for imaging and spectroscopy applications. They are constituted by
semiconductor substrate and photoconductors, and behave as a Hertzian dipole. The schematic view
of the photoconductive device and the emission concept are shown in Figure II.4 in two different
views. The most used active layer is LT-GaAs, it has short carrier lifetime, high mobility and high
breakdown voltage [124].
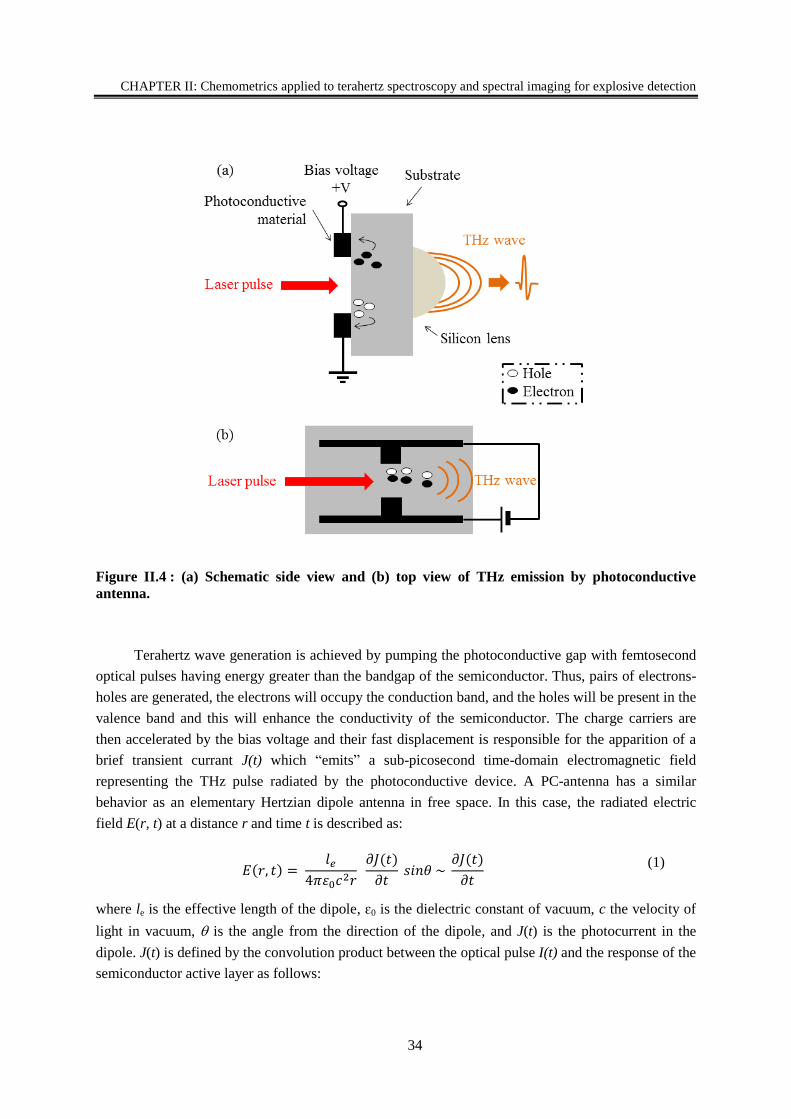
CHAPTER II: Chemometrics applied to terahertz spectroscopy and spectral imaging for explosive detection
34
Figure II.4 : (a) Schematic side view and (b) top view of THz emission by photoconductive
antenna.
Terahertz wave generation is achieved by pumping the photoconductive gap with femtosecond
optical pulses having energy greater than the bandgap of the semiconductor. Thus, pairs of electrons-
holes are generated, the electrons will occupy the conduction band, and the holes will be present in the
valence band and this will enhance the conductivity of the semiconductor. The charge carriers are
then accelerated by the bias voltage and their fast displacement is responsible for the apparition of a
brief transient currant J(t) which “emits” a sub-picosecond time-domain electromagnetic field
representing the THz pulse radiated by the photoconductive device. A PC-antenna has a similar
behavior as an elementary Hertzian dipole antenna in free space. In this case, the radiated electric
field E(r, t) at a distance r and time t is described as:
𝐸(𝑟, 𝑡) = 𝑙𝑒
4𝜋휀0𝑐2𝑟
𝜕𝐽(𝑡)
𝜕𝑡 𝑠𝑖𝑛𝜃 ~
𝜕𝐽(𝑡)
𝜕𝑡
(1)
where le is the effective length of the dipole, ɛ0 is the dielectric constant of vacuum, c the velocity of
light in vacuum, is the angle from the direction of the dipole, and J(t) is the photocurrent in the
dipole. J(t) is defined by the convolution product between the optical pulse I(t) and the response of the
semiconductor active layer as follows:
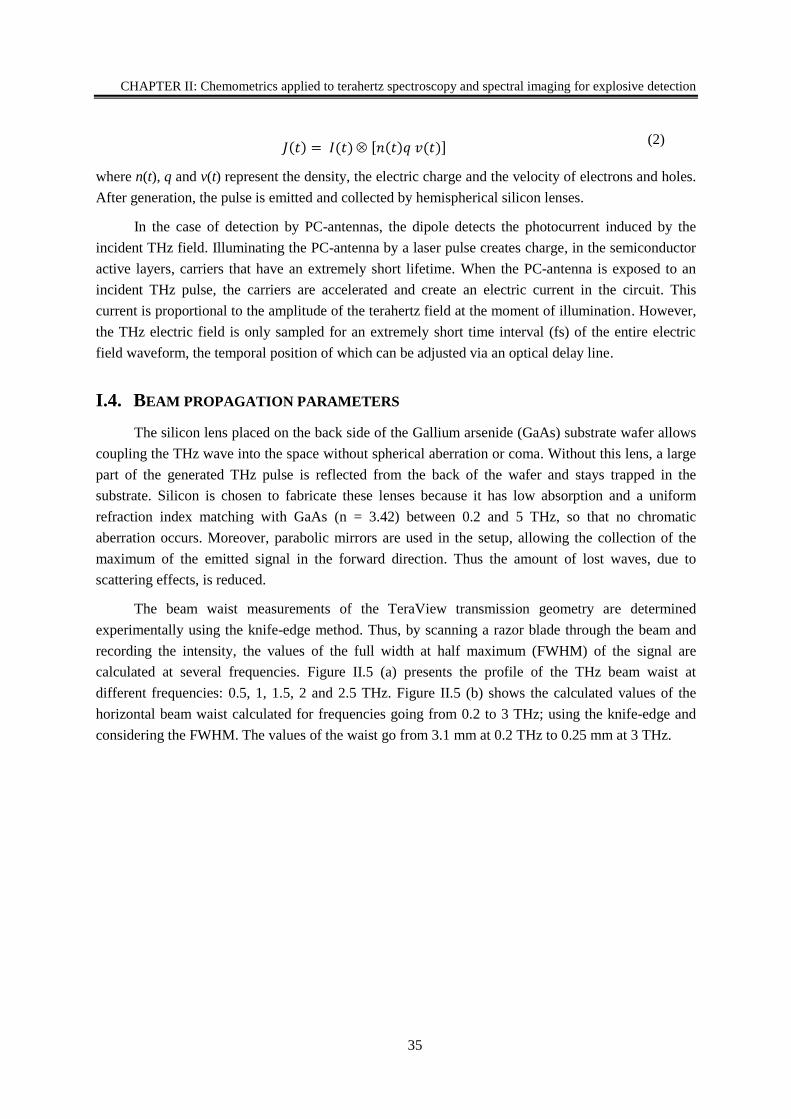
CHAPTER II: Chemometrics applied to terahertz spectroscopy and spectral imaging for explosive detection
35
𝐽(𝑡) = 𝐼(𝑡) [𝑛(𝑡)𝑞 𝑣(𝑡)] (2)
where n(t), q and v(t) represent the density, the electric charge and the velocity of electrons and holes.
After generation, the pulse is emitted and collected by hemispherical silicon lenses.
In the case of detection by PC-antennas, the dipole detects the photocurrent induced by the
incident THz field. Illuminating the PC-antenna by a laser pulse creates charge, in the semiconductor
active layers, carriers that have an extremely short lifetime. When the PC-antenna is exposed to an
incident THz pulse, the carriers are accelerated and create an electric current in the circuit. This
current is proportional to the amplitude of the terahertz field at the moment of illumination. However,
the THz electric field is only sampled for an extremely short time interval (fs) of the entire electric
field waveform, the temporal position of which can be adjusted via an optical delay line.
I.4. BEAM PROPAGATION PARAMETERS
The silicon lens placed on the back side of the Gallium arsenide (GaAs) substrate wafer allows
coupling the THz wave into the space without spherical aberration or coma. Without this lens, a large
part of the generated THz pulse is reflected from the back of the wafer and stays trapped in the
substrate. Silicon is chosen to fabricate these lenses because it has low absorption and a uniform
refraction index matching with GaAs (n = 3.42) between 0.2 and 5 THz, so that no chromatic
aberration occurs. Moreover, parabolic mirrors are used in the setup, allowing the collection of the
maximum of the emitted signal in the forward direction. Thus the amount of lost waves, due to
scattering effects, is reduced.
The beam waist measurements of the TeraView transmission geometry are determined
experimentally using the knife-edge method. Thus, by scanning a razor blade through the beam and
recording the intensity, the values of the full width at half maximum (FWHM) of the signal are
calculated at several frequencies. Figure II.5 (a) presents the profile of the THz beam waist at
different frequencies: 0.5, 1, 1.5, 2 and 2.5 THz. Figure II.5 (b) shows the calculated values of the
horizontal beam waist calculated for frequencies going from 0.2 to 3 THz; using the knife-edge and
considering the FWHM. The values of the waist go from 3.1 mm at 0.2 THz to 0.25 mm at 3 THz.
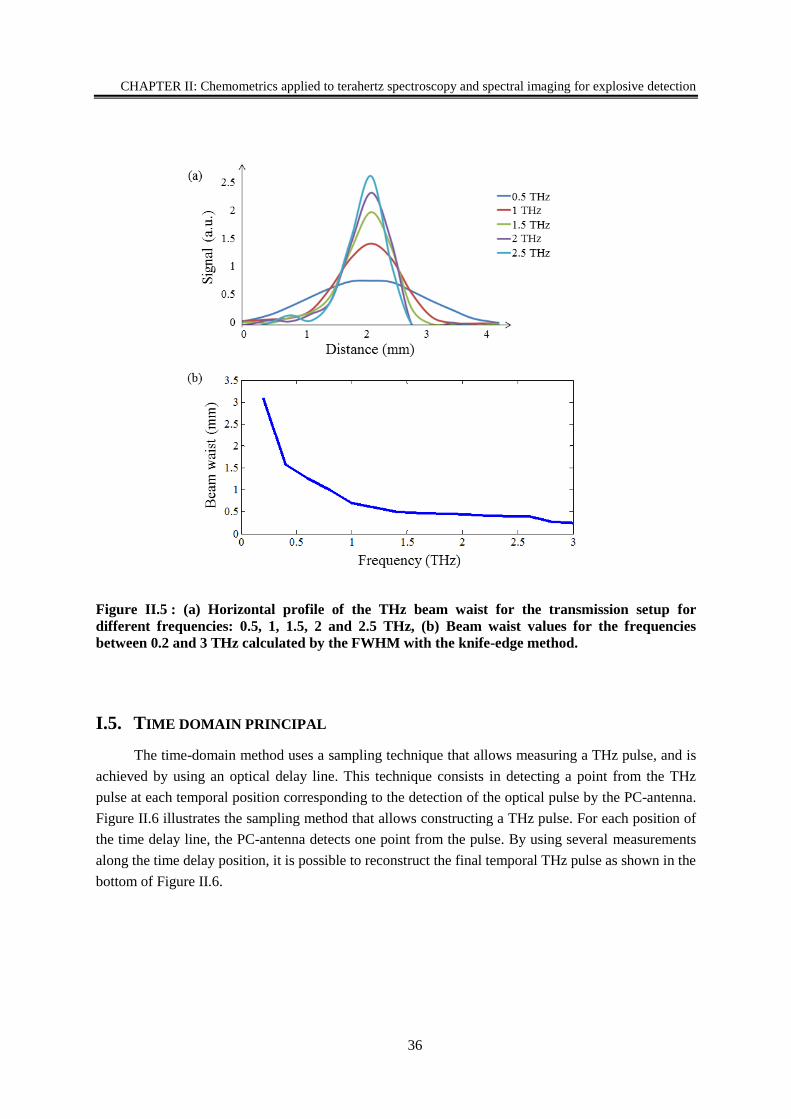
CHAPTER II: Chemometrics applied to terahertz spectroscopy and spectral imaging for explosive detection
36
Figure II.5 : (a) Horizontal profile of the THz beam waist for the transmission setup for
different frequencies: 0.5, 1, 1.5, 2 and 2.5 THz, (b) Beam waist values for the frequencies
between 0.2 and 3 THz calculated by the FWHM with the knife-edge method.
I.5. TIME DOMAIN PRINCIPAL
The time-domain method uses a sampling technique that allows measuring a THz pulse, and is
achieved by using an optical delay line. This technique consists in detecting a point from the THz
pulse at each temporal position corresponding to the detection of the optical pulse by the PC-antenna.
Figure II.6 illustrates the sampling method that allows constructing a THz pulse. For each position of
the time delay line, the PC-antenna detects one point from the pulse. By using several measurements
along the time delay position, it is possible to reconstruct the final temporal THz pulse as shown in the
bottom of Figure II.6.
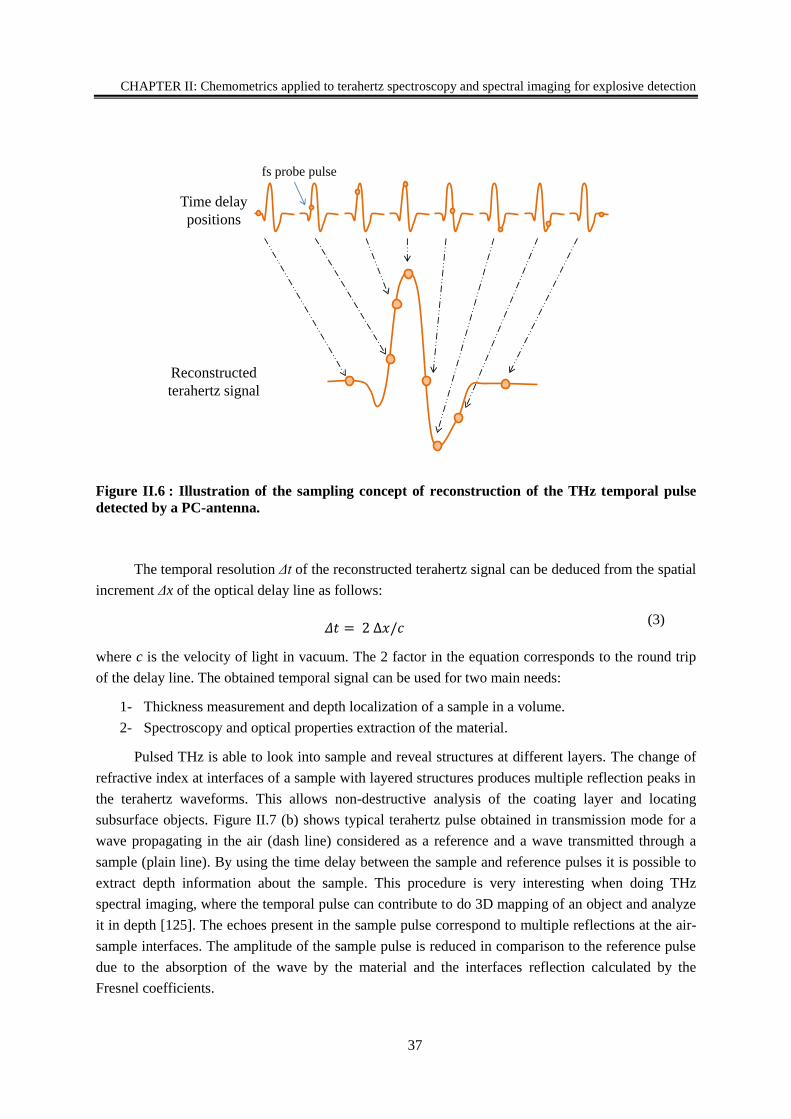
CHAPTER II: Chemometrics applied to terahertz spectroscopy and spectral imaging for explosive detection
37
Figure II.6 : Illustration of the sampling concept of reconstruction of the THz temporal pulse
detected by a PC-antenna.
The temporal resolution Δt of the reconstructed terahertz signal can be deduced from the spatial
increment Δx of the optical delay line as follows:
𝛥𝑡 = 2 Δ𝑥/𝑐 (3)
where c is the velocity of light in vacuum. The 2 factor in the equation corresponds to the round trip
of the delay line. The obtained temporal signal can be used for two main needs:
1- Thickness measurement and depth localization of a sample in a volume.
2- Spectroscopy and optical properties extraction of the material.
Pulsed THz is able to look into sample and reveal structures at different layers. The change of
refractive index at interfaces of a sample with layered structures produces multiple reflection peaks in
the terahertz waveforms. This allows non-destructive analysis of the coating layer and locating
subsurface objects. Figure II.7 (b) shows typical terahertz pulse obtained in transmission mode for a
wave propagating in the air (dash line) considered as a reference and a wave transmitted through a
sample (plain line). By using the time delay between the sample and reference pulses it is possible to
extract depth information about the sample. This procedure is very interesting when doing THz
spectral imaging, where the temporal pulse can contribute to do 3D mapping of an object and analyze
it in depth [125]. The echoes present in the sample pulse correspond to multiple reflections at the air-
sample interfaces. The amplitude of the sample pulse is reduced in comparison to the reference pulse
due to the absorption of the wave by the material and the interfaces reflection calculated by the
Fresnel coefficients.
Time delay
positions
Reconstructed
terahertz signal
fs probe pulse
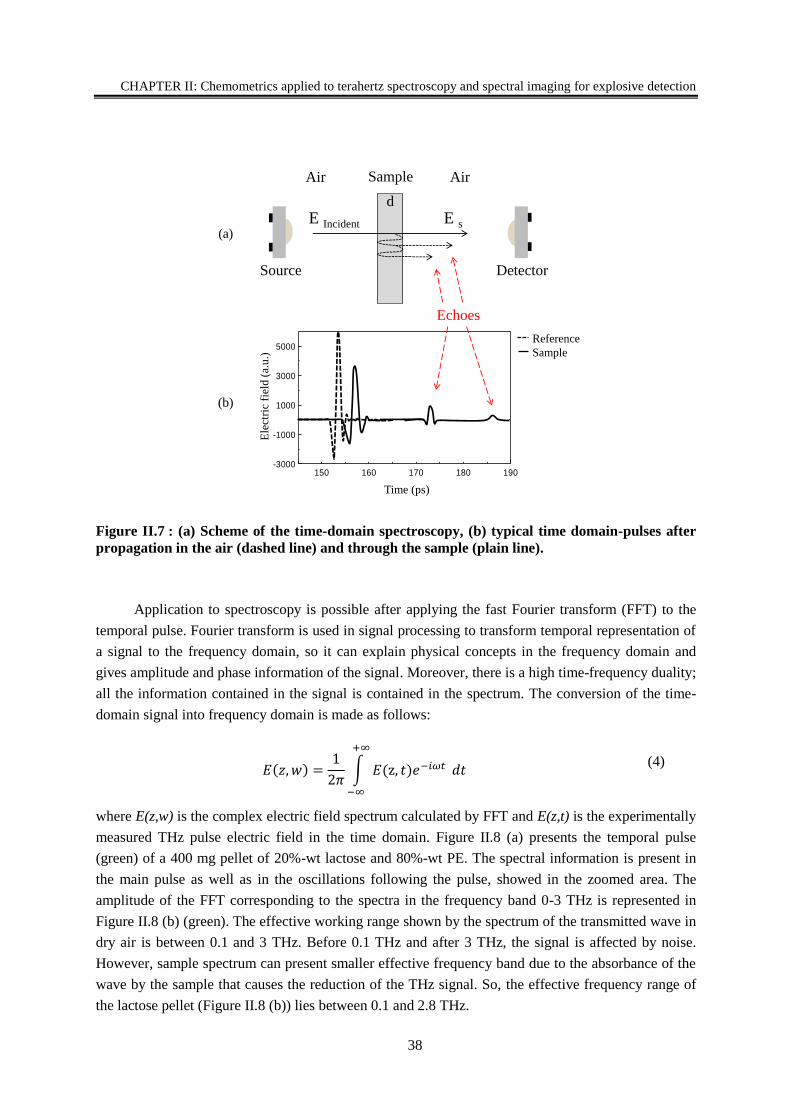
CHAPTER II: Chemometrics applied to terahertz spectroscopy and spectral imaging for explosive detection
38
Figure II.7 : (a) Scheme of the time-domain spectroscopy, (b) typical time domain-pulses after
propagation in the air (dashed line) and through the sample (plain line).
Application to spectroscopy is possible after applying the fast Fourier transform (FFT) to the
temporal pulse. Fourier transform is used in signal processing to transform temporal representation of
a signal to the frequency domain, so it can explain physical concepts in the frequency domain and
gives amplitude and phase information of the signal. Moreover, there is a high time-frequency duality;
all the information contained in the signal is contained in the spectrum. The conversion of the time-
domain signal into frequency domain is made as follows:
𝐸(𝑧, 𝑤) =1
2𝜋∫ 𝐸(z, 𝑡)𝑒−𝑖𝜔𝑡
+∞
−∞
𝑑𝑡 (4)
where E(z,w) is the complex electric field spectrum calculated by FFT and E(z,t) is the experimentally
measured THz pulse electric field in the time domain. Figure II.8 (a) presents the temporal pulse
(green) of a 400 mg pellet of 20%-wt lactose and 80%-wt PE. The spectral information is present in
the main pulse as well as in the oscillations following the pulse, showed in the zoomed area. The
amplitude of the FFT corresponding to the spectra in the frequency band 0-3 THz is represented in
Figure II.8 (b) (green). The effective working range shown by the spectrum of the transmitted wave in
dry air is between 0.1 and 3 THz. Before 0.1 THz and after 3 THz, the signal is affected by noise.
However, sample spectrum can present smaller effective frequency band due to the absorbance of the
wave by the sample that causes the reduction of the THz signal. So, the effective frequency range of
the lactose pellet (Figure II.8 (b)) lies between 0.1 and 2.8 THz.
E s
d
Echoes
Time (ps)
150 160 170 180 190
5000
3000
1000
-1000
-3000
sample 001 sans bf
ref sans bfE
lect
ric
fiel
d (
a.u
.)
(b)
(a)
Air AirSample
Source Detector
Reference
Sample
E Incident
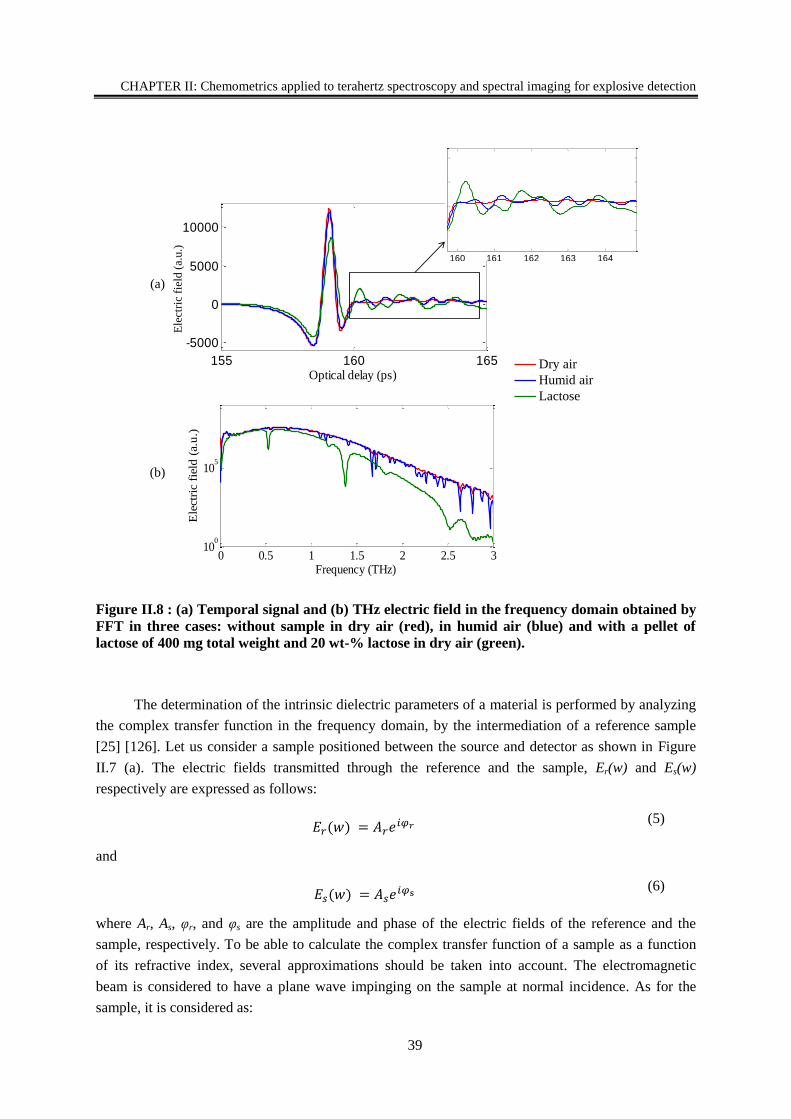
CHAPTER II: Chemometrics applied to terahertz spectroscopy and spectral imaging for explosive detection
39
Figure II.8 : (a) Temporal signal and (b) THz electric field in the frequency domain obtained by
FFT in three cases: without sample in dry air (red), in humid air (blue) and with a pellet of
lactose of 400 mg total weight and 20 wt-% lactose in dry air (green).
The determination of the intrinsic dielectric parameters of a material is performed by analyzing
the complex transfer function in the frequency domain, by the intermediation of a reference sample
[25] [126]. Let us consider a sample positioned between the source and detector as shown in Figure
II.7 (a). The electric fields transmitted through the reference and the sample, Er(w) and Es(w)
respectively are expressed as follows:
𝐸𝑟(𝑤) = 𝐴𝑟𝑒𝑖𝜑𝑟
(5)
and
𝐸𝑠(𝑤) = 𝐴𝑠𝑒𝑖𝜑s
(6)
where Ar, As, φr, and φs are the amplitude and phase of the electric fields of the reference and the
sample, respectively. To be able to calculate the complex transfer function of a sample as a function
of its refractive index, several approximations should be taken into account. The electromagnetic
beam is considered to have a plane wave impinging on the sample at normal incidence. As for the
sample, it is considered as:
0 0.5 1 1.5 2 2.5 310
0
105
Frequency (THz)
Ele
ctri
c fi
eld
(a.
u.)
Dry
Humid
Lactose
155 160 165
-5000
0
5000
10000
Optical delay (ps)
Sig
nal
(a.
u.)
Dry
Humid
Lactose
0 0.5 1 1.5 2 2.5 310
0
105
Frequency (THz)
Ele
ctr
ic f
ield
(a.u
.)
Dry
Humid
Lactose
(a)
(b)
160 161 162 163 164
-2000
0
2000
4000
Optical delay (ps)
Dry
Humid
Lactose
Ele
ctri
c fi
eld
(a.
u.)
Dry air
Humid air
Lactose
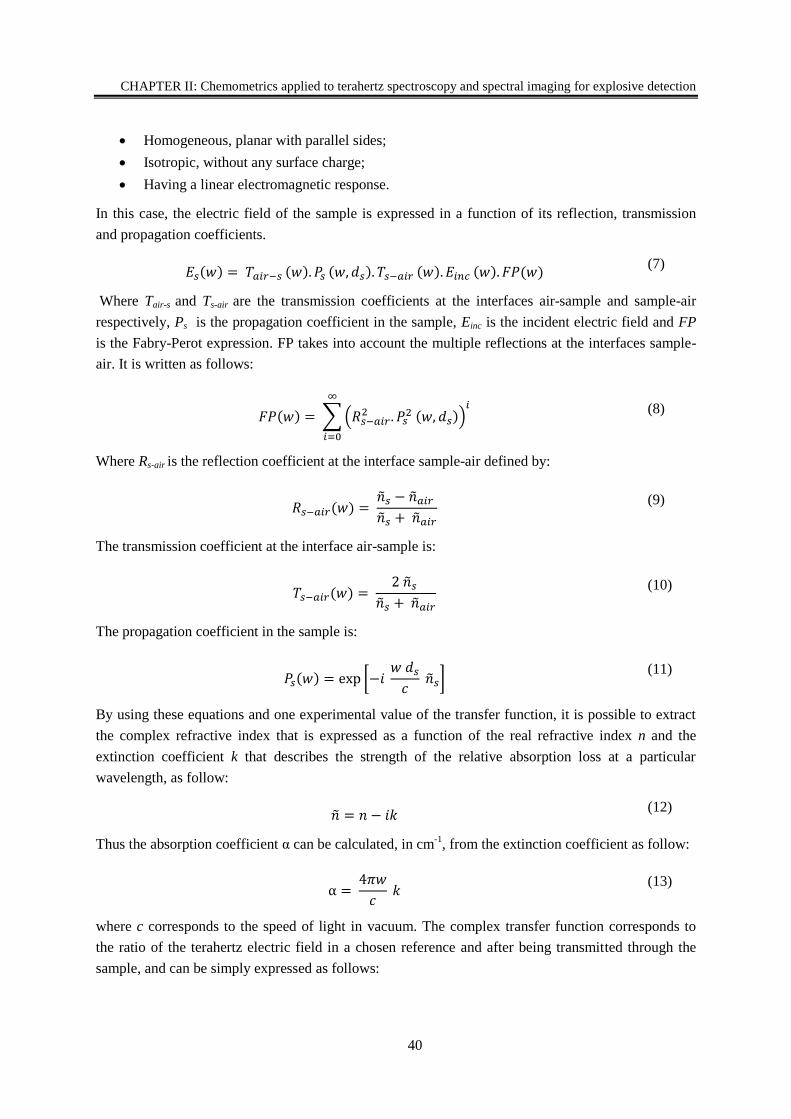
CHAPTER II: Chemometrics applied to terahertz spectroscopy and spectral imaging for explosive detection
40
Homogeneous, planar with parallel sides;
Isotropic, without any surface charge;
Having a linear electromagnetic response.
In this case, the electric field of the sample is expressed in a function of its reflection, transmission
and propagation coefficients.
𝐸𝑠(𝑤) = 𝑇𝑎𝑖𝑟−𝑠 (𝑤). 𝑃𝑠 (𝑤, 𝑑𝑠). 𝑇𝑠−𝑎𝑖𝑟 (𝑤). 𝐸𝑖𝑛𝑐 (𝑤). 𝐹𝑃(𝑤) (7)
Where Tair-s and Ts-air are the transmission coefficients at the interfaces air-sample and sample-air
respectively, Ps is the propagation coefficient in the sample, Einc is the incident electric field and FP
is the Fabry-Perot expression. FP takes into account the multiple reflections at the interfaces sample-
air. It is written as follows:
𝐹𝑃(𝑤) = ∑(𝑅𝑠−𝑎𝑖𝑟2 . 𝑃𝑠
2 (𝑤, 𝑑𝑠))
𝑖∞
𝑖=0
(8)
Where Rs-air is the reflection coefficient at the interface sample-air defined by:
𝑅𝑠−𝑎𝑖𝑟(𝑤) = ��𝑠 − ��𝑎𝑖𝑟
��𝑠 + ��𝑎𝑖𝑟
(9)
The transmission coefficient at the interface air-sample is:
𝑇𝑠−𝑎𝑖𝑟(𝑤) = 2 ��𝑠
��𝑠 + ��𝑎𝑖𝑟
(10)
The propagation coefficient in the sample is:
𝑃𝑠(𝑤) = exp [−𝑖 𝑤 𝑑𝑠
𝑐 ��𝑠]
(11)
By using these equations and one experimental value of the transfer function, it is possible to extract
the complex refractive index that is expressed as a function of the real refractive index n and the
extinction coefficient k that describes the strength of the relative absorption loss at a particular
wavelength, as follow:
�� = 𝑛 − 𝑖𝑘 (12)
Thus the absorption coefficient α can be calculated, in cm-1
, from the extinction coefficient as follow:
α = 4𝜋𝑤
𝑐 𝑘
(13)
where c corresponds to the speed of light in vacuum. The complex transfer function corresponds to
the ratio of the terahertz electric field in a chosen reference and after being transmitted through the
sample, and can be simply expressed as follows:
CHAPTER II: Chemometrics applied to terahertz spectroscopy and spectral imaging for explosive detection
41
𝑇𝑟(𝑤) = 𝐸𝑠
𝐸𝑟=
𝐴𝑠
𝐴𝑟 𝑒𝑥𝑝[𝜑𝑠 − 𝜑𝑟]
(14)
where the amplitude and phase take into account the reflection, transmission, propagation coefficients
and Fabry-Perot effect. By using the transfer function expression, the absorbance A(w) of the sample
is calculated:
𝐴(𝑤) = −log (𝑇𝑟(𝑤)) (15)
The absorbance is a positive value without unit used as the spectral feature to identify the
product. It is higher when the transmitted signal is lower.
I.6. SIGNAL PROCESSING AND NOISE REDUCTION
A common practice to describe the performance of a particular TDS system is to know its
dynamic range (DR) and signal-to-noise ratio (SNR). The DR indicates the minimum detectable
signal change and corresponds to the ratio of signal to noise expressed in dB. The SNR reports the
extent to which a signal can vary and still be accurately measured; it is the ratio between the largest
and smallest measured. For a system like THz-TDS, which measures both the amplitude and the
phase, several methods are used to define the SNR and DR. Naftaly et al. proposed a procedure to
calculate the SNR and DR for the time-domain and the spectra [127]. The main definitions of these
two values are:
𝐷𝑅 = 𝑚𝑎𝑥𝑖𝑚𝑢𝑚 𝑣𝑎𝑙𝑢𝑒 𝑜𝑓 𝑡ℎ𝑒 𝑠𝑖𝑔𝑛𝑎𝑙
𝑚𝑎𝑥𝑖𝑚𝑢𝑚 𝑣𝑎𝑙𝑢𝑒 𝑜𝑓 𝑡ℎ𝑒 𝑛𝑜𝑖𝑠𝑒
(16)
And
𝑆𝑁𝑅 = 𝑚𝑎𝑥𝑖𝑚𝑢𝑚 𝑣𝑎𝑙𝑢𝑒 𝑜𝑓 𝑡ℎ𝑒 𝑠𝑖𝑔𝑛𝑎𝑙
𝑠𝑡𝑎𝑛𝑑𝑎𝑟𝑑 𝑑𝑒𝑣𝑖𝑎𝑡𝑖𝑜𝑛 𝑜𝑓 𝑡ℎ𝑒 𝑠𝑖𝑔𝑛𝑎𝑙
(17)
To reduce noise and artifacts on the measured spectra, several actions are made:
1- The measurements are performed in a chamber purged with dry air to eliminate water
vapor. Figure II.8 (b) shows the spectra of a measurement made in dry (red), and humid air
(blue) by opening the chamber. The blue spectrum represents undesirable absorption bands
corresponding to the absorption of the THz waves by water molecules. A hygrometer is
added to the setup to control in real-time the relative humidity level, which was kept below
1% by using a flow of dry air.
2- Each spectrum is average over 1000 repetitions to stabilize the signal fluctuations.
However, the measurements of repeatability of the system are performed on the same
sample several times along a long period of time. Results show a signal variance of less
than 1% between one measured signal and the other one from another week. This variance
is considered negligible and the signal is considered as repeatable over a long period.
3- An apodization function is applied to the signal to remove some artifacts. Various
mathematical apodization functions are available, like Boxcar, triangular, Blackman-Harris
CHAPTER II: Chemometrics applied to terahertz spectroscopy and spectral imaging for explosive detection
42
3-term and 4-term. In our study, we chose to apply the Blackman-Harris 3-term provided
by the Teraview software to reduce the artifacts in our signal. However, these functions
decrease the apparent spectral resolution [128] [129]. Figure II.9 shows the spectrum
resulting from a measurement in dry air, where two apodization functions are applied: the
Boxcar (red) and the Blackman-Harris 3-term (blue). The Boxcar is already reducing noise
from the signal; however Blackman-Harris 3-term can smooth the spectrum and removes
every peak with no chemical significance.
Figure II.9 : Signal measured in dry air conditions with two different apodization functions:
boxcar (red) and Blackman-Harris 3-term (blue).
I.7. REFERENCE SELECTION
During the extraction of the absorbance spectrum, a high importance should be given to the
selection of the reference, since there is no unique way to determine it. Here we study the effect of
selecting different references on the resulting absorbance spectra. Figure II.10 (a) shows the
absorbance spectra of a pellet made of 20 wt-% lactose 80 wt-% polyethylene (PE) with a total weight
of 400 mg and 3.52 mm thickness. Three different references were used to extract the transfer
function:
1- The reference signal is measured when the wave propagates in the air, the resulting
absorbance spectrum is shown in pink (air),
2- The reference signal is measured when the wave propagates through a PE pellet of 400 mg
and 3.97 mm thickness presented by the green absorbance spectrum (PE400),
3- The reference signal is measured when the wave propagates through a PE pellet of 570 mg
and 5. 73 mm thickness, the absorbance spectrum in this case is shown in blue (PE570).
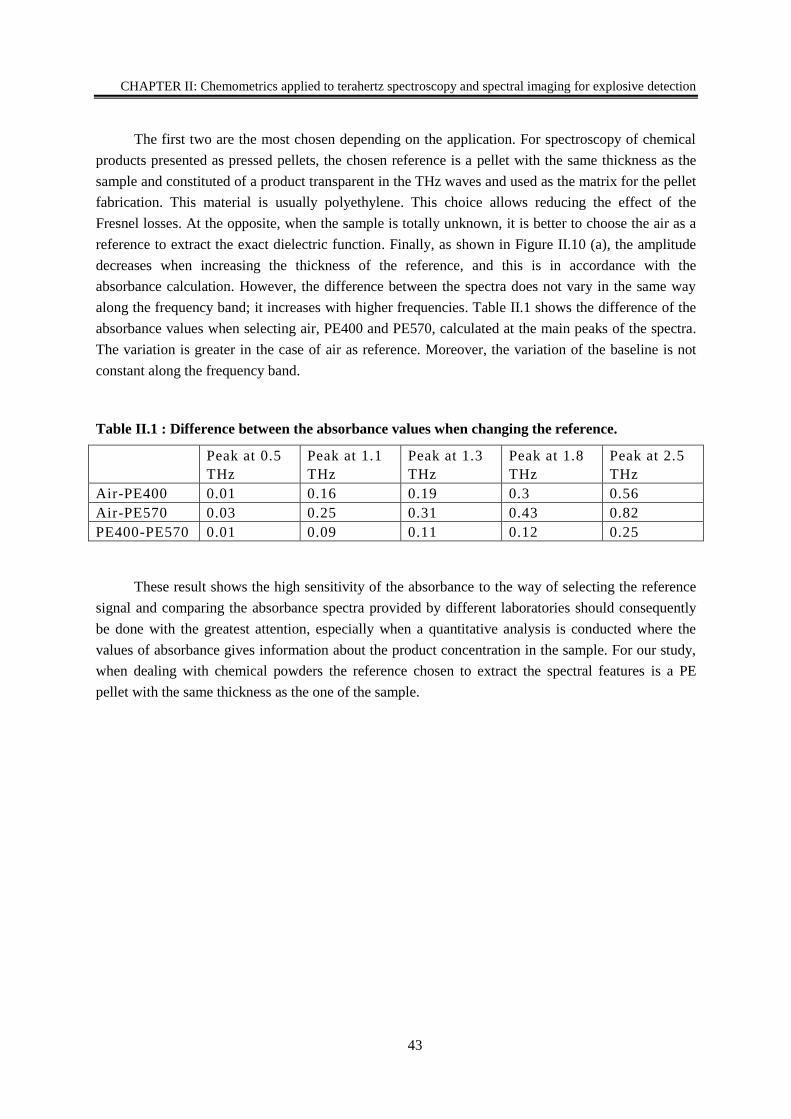
CHAPTER II: Chemometrics applied to terahertz spectroscopy and spectral imaging for explosive detection
43
The first two are the most chosen depending on the application. For spectroscopy of chemical
products presented as pressed pellets, the chosen reference is a pellet with the same thickness as the
sample and constituted of a product transparent in the THz waves and used as the matrix for the pellet
fabrication. This material is usually polyethylene. This choice allows reducing the effect of the
Fresnel losses. At the opposite, when the sample is totally unknown, it is better to choose the air as a
reference to extract the exact dielectric function. Finally, as shown in Figure II.10 (a), the amplitude
decreases when increasing the thickness of the reference, and this is in accordance with the
absorbance calculation. However, the difference between the spectra does not vary in the same way
along the frequency band; it increases with higher frequencies. Table II.1 shows the difference of the
absorbance values when selecting air, PE400 and PE570, calculated at the main peaks of the spectra.
The variation is greater in the case of air as reference. Moreover, the variation of the baseline is not
constant along the frequency band.
Table II.1 : Difference between the absorbance values when changing the reference.
Peak at 0.5
THz
Peak at 1.1
THz
Peak at 1.3
THz
Peak at 1.8
THz
Peak at 2.5
THz
Air-PE400 0.01 0.16 0.19 0.3 0.56
Air-PE570 0.03 0.25 0.31 0.43 0.82
PE400-PE570 0.01 0.09 0.11 0.12 0.25
These result shows the high sensitivity of the absorbance to the way of selecting the reference
signal and comparing the absorbance spectra provided by different laboratories should consequently
be done with the greatest attention, especially when a quantitative analysis is conducted where the
values of absorbance gives information about the product concentration in the sample. For our study,
when dealing with chemical powders the reference chosen to extract the spectral features is a PE
pellet with the same thickness as the one of the sample.
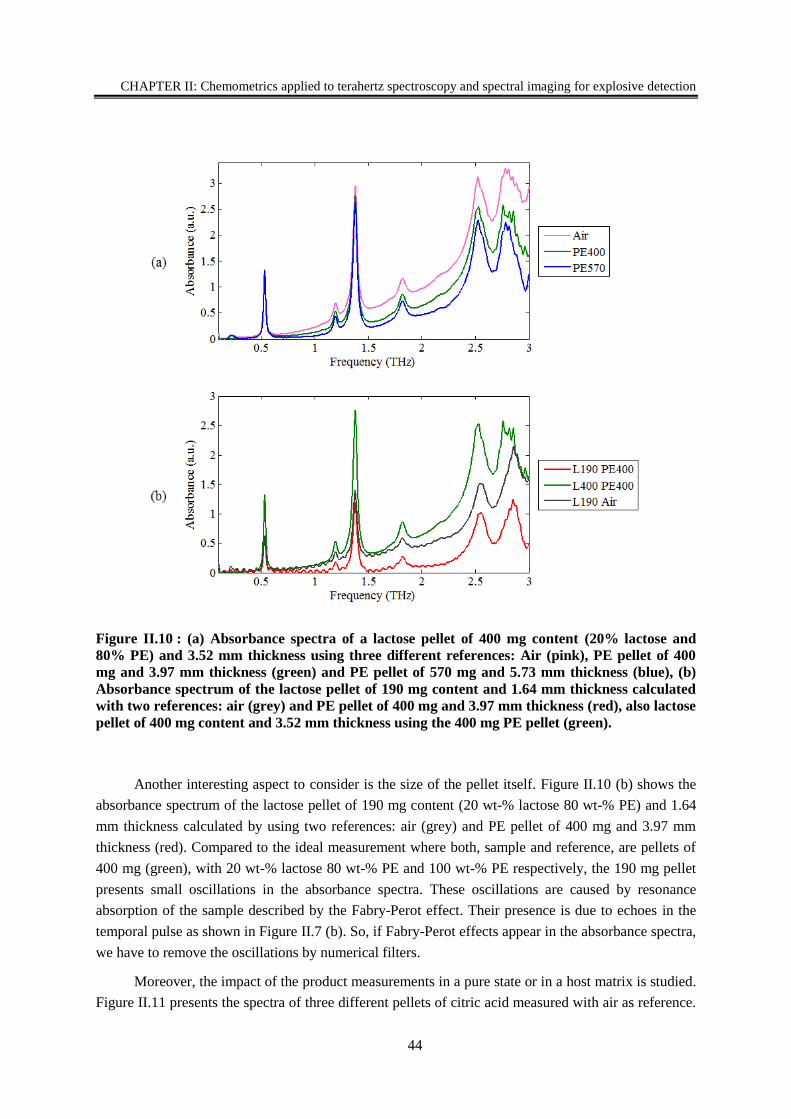
CHAPTER II: Chemometrics applied to terahertz spectroscopy and spectral imaging for explosive detection
44
Figure II.10 : (a) Absorbance spectra of a lactose pellet of 400 mg content (20% lactose and
80% PE) and 3.52 mm thickness using three different references: Air (pink), PE pellet of 400
mg and 3.97 mm thickness (green) and PE pellet of 570 mg and 5.73 mm thickness (blue), (b)
Absorbance spectrum of the lactose pellet of 190 mg content and 1.64 mm thickness calculated
with two references: air (grey) and PE pellet of 400 mg and 3.97 mm thickness (red), also lactose
pellet of 400 mg content and 3.52 mm thickness using the 400 mg PE pellet (green).
Another interesting aspect to consider is the size of the pellet itself. Figure II.10 (b) shows the
absorbance spectrum of the lactose pellet of 190 mg content (20 wt-% lactose 80 wt-% PE) and 1.64
mm thickness calculated by using two references: air (grey) and PE pellet of 400 mg and 3.97 mm
thickness (red). Compared to the ideal measurement where both, sample and reference, are pellets of
400 mg (green), with 20 wt-% lactose 80 wt-% PE and 100 wt-% PE respectively, the 190 mg pellet
presents small oscillations in the absorbance spectra. These oscillations are caused by resonance
absorption of the sample described by the Fabry-Perot effect. Their presence is due to echoes in the
temporal pulse as shown in Figure II.7 (b). So, if Fabry-Perot effects appear in the absorbance spectra,
we have to remove the oscillations by numerical filters.
Moreover, the impact of the product measurements in a pure state or in a host matrix is studied.
Figure II.11 presents the spectra of three different pellets of citric acid measured with air as reference.
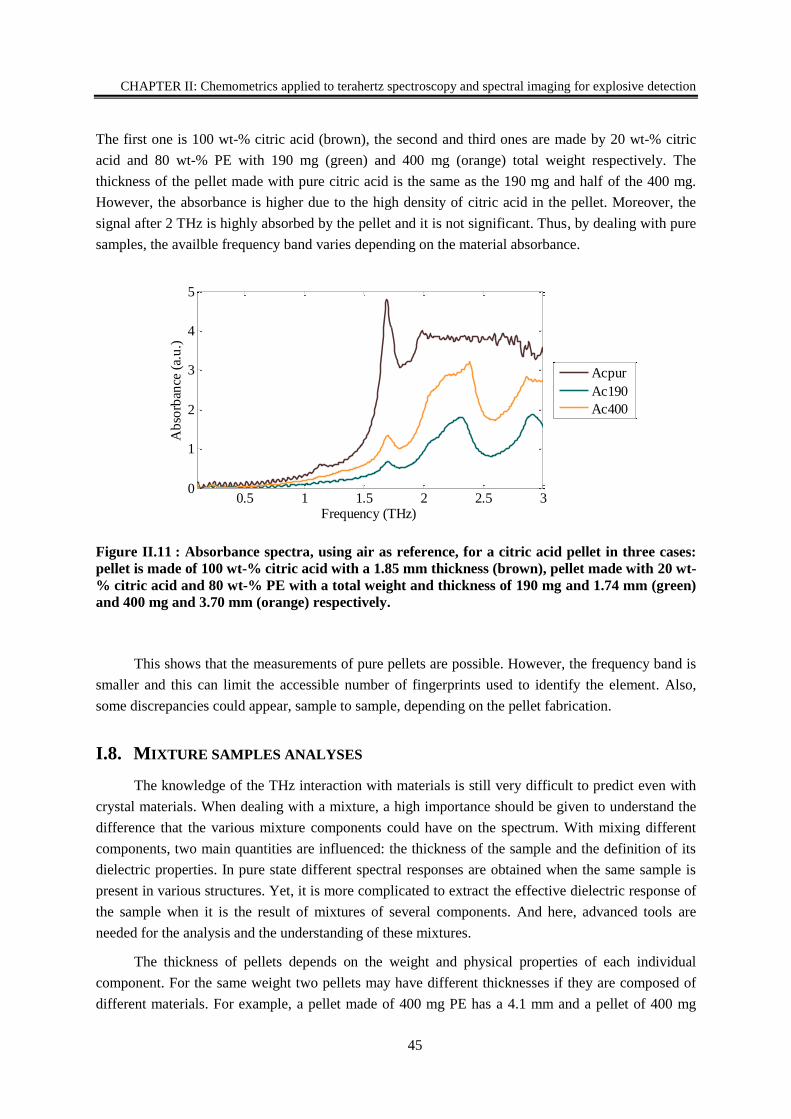
CHAPTER II: Chemometrics applied to terahertz spectroscopy and spectral imaging for explosive detection
45
The first one is 100 wt-% citric acid (brown), the second and third ones are made by 20 wt-% citric
acid and 80 wt-% PE with 190 mg (green) and 400 mg (orange) total weight respectively. The
thickness of the pellet made with pure citric acid is the same as the 190 mg and half of the 400 mg.
However, the absorbance is higher due to the high density of citric acid in the pellet. Moreover, the
signal after 2 THz is highly absorbed by the pellet and it is not significant. Thus, by dealing with pure
samples, the availble frequency band varies depending on the material absorbance.
Figure II.11 : Absorbance spectra, using air as reference, for a citric acid pellet in three cases:
pellet is made of 100 wt-% citric acid with a 1.85 mm thickness (brown), pellet made with 20 wt-
% citric acid and 80 wt-% PE with a total weight and thickness of 190 mg and 1.74 mm (green)
and 400 mg and 3.70 mm (orange) respectively.
This shows that the measurements of pure pellets are possible. However, the frequency band is
smaller and this can limit the accessible number of fingerprints used to identify the element. Also,
some discrepancies could appear, sample to sample, depending on the pellet fabrication.
I.8. MIXTURE SAMPLES ANALYSES
The knowledge of the THz interaction with materials is still very difficult to predict even with
crystal materials. When dealing with a mixture, a high importance should be given to understand the
difference that the various mixture components could have on the spectrum. With mixing different
components, two main quantities are influenced: the thickness of the sample and the definition of its
dielectric properties. In pure state different spectral responses are obtained when the same sample is
present in various structures. Yet, it is more complicated to extract the effective dielectric response of
the sample when it is the result of mixtures of several components. And here, advanced tools are
needed for the analysis and the understanding of these mixtures.
The thickness of pellets depends on the weight and physical properties of each individual
component. For the same weight two pellets may have different thicknesses if they are composed of
different materials. For example, a pellet made of 400 mg PE has a 4.1 mm and a pellet of 400 mg
0.5 1 1.5 2 2.5 30
1
2
3
4
5
Frequency (THz)
Ab
sorb
ance
(a.
u.)
Acpur
Ac190
Ac400
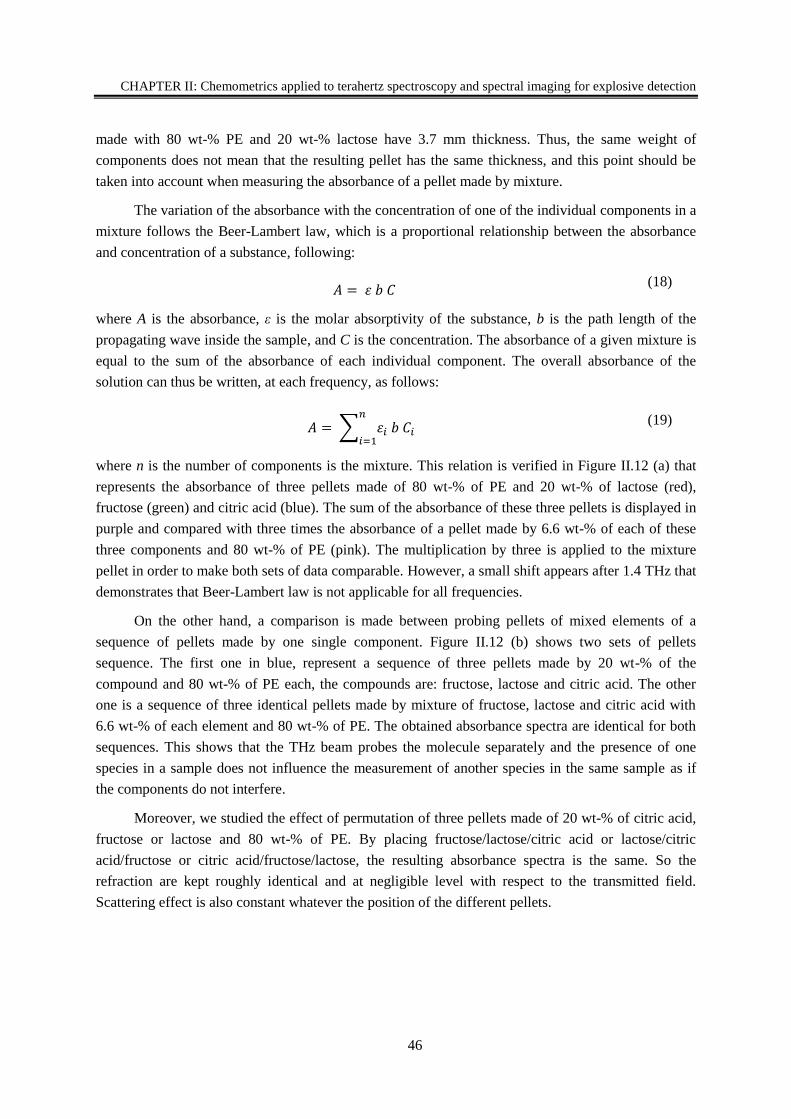
CHAPTER II: Chemometrics applied to terahertz spectroscopy and spectral imaging for explosive detection
46
made with 80 wt-% PE and 20 wt-% lactose have 3.7 mm thickness. Thus, the same weight of
components does not mean that the resulting pellet has the same thickness, and this point should be
taken into account when measuring the absorbance of a pellet made by mixture.
The variation of the absorbance with the concentration of one of the individual components in a
mixture follows the Beer-Lambert law, which is a proportional relationship between the absorbance
and concentration of a substance, following:
𝐴 = 휀 𝑏 𝐶 (18)
where A is the absorbance, ε is the molar absorptivity of the substance, b is the path length of the
propagating wave inside the sample, and C is the concentration. The absorbance of a given mixture is
equal to the sum of the absorbance of each individual component. The overall absorbance of the
solution can thus be written, at each frequency, as follows:
𝐴 = ∑ 휀𝑖 𝑏 𝐶𝑖
𝑛
𝑖=1
(19)
where n is the number of components is the mixture. This relation is verified in Figure II.12 (a) that
represents the absorbance of three pellets made of 80 wt-% of PE and 20 wt-% of lactose (red),
fructose (green) and citric acid (blue). The sum of the absorbance of these three pellets is displayed in
purple and compared with three times the absorbance of a pellet made by 6.6 wt-% of each of these
three components and 80 wt-% of PE (pink). The multiplication by three is applied to the mixture
pellet in order to make both sets of data comparable. However, a small shift appears after 1.4 THz that
demonstrates that Beer-Lambert law is not applicable for all frequencies.
On the other hand, a comparison is made between probing pellets of mixed elements of a
sequence of pellets made by one single component. Figure II.12 (b) shows two sets of pellets
sequence. The first one in blue, represent a sequence of three pellets made by 20 wt-% of the
compound and 80 wt-% of PE each, the compounds are: fructose, lactose and citric acid. The other
one is a sequence of three identical pellets made by mixture of fructose, lactose and citric acid with
6.6 wt-% of each element and 80 wt-% of PE. The obtained absorbance spectra are identical for both
sequences. This shows that the THz beam probes the molecule separately and the presence of one
species in a sample does not influence the measurement of another species in the same sample as if
the components do not interfere.
Moreover, we studied the effect of permutation of three pellets made of 20 wt-% of citric acid,
fructose or lactose and 80 wt-% of PE. By placing fructose/lactose/citric acid or lactose/citric
acid/fructose or citric acid/fructose/lactose, the resulting absorbance spectra is the same. So the
refraction are kept roughly identical and at negligible level with respect to the transmitted field.
Scattering effect is also constant whatever the position of the different pellets.
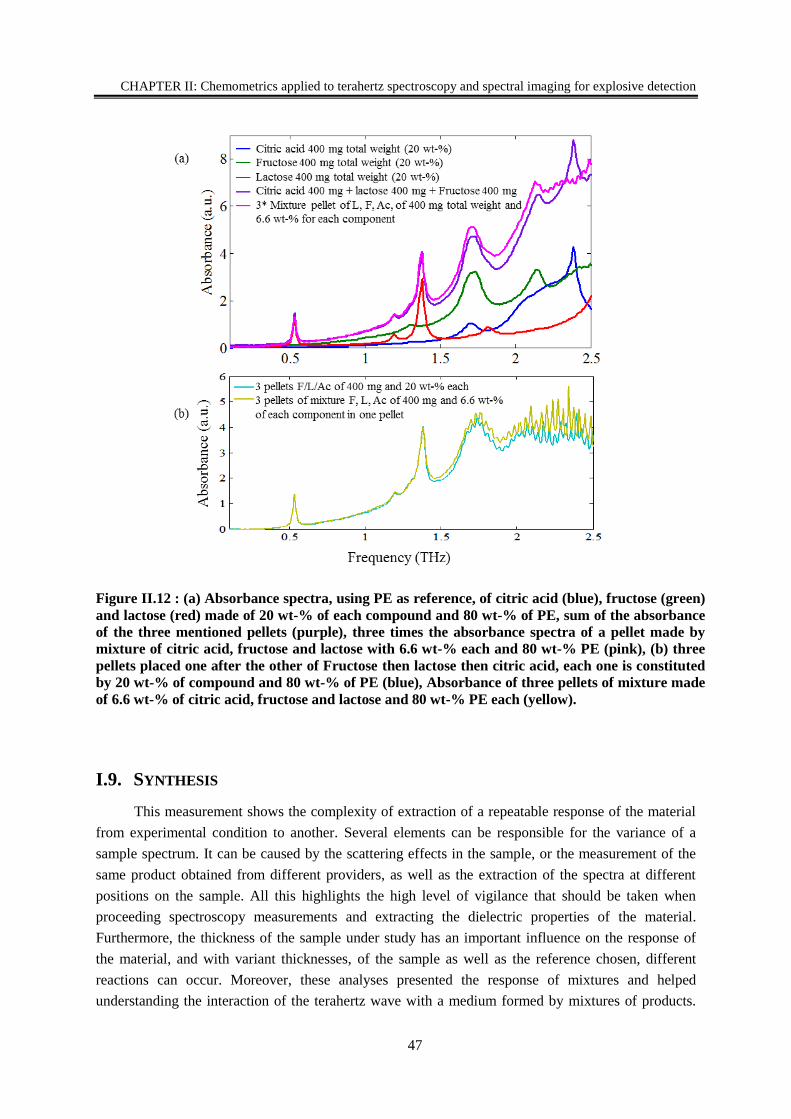
CHAPTER II: Chemometrics applied to terahertz spectroscopy and spectral imaging for explosive detection
47
Figure II.12 : (a) Absorbance spectra, using PE as reference, of citric acid (blue), fructose (green)
and lactose (red) made of 20 wt-% of each compound and 80 wt-% of PE, sum of the absorbance
of the three mentioned pellets (purple), three times the absorbance spectra of a pellet made by
mixture of citric acid, fructose and lactose with 6.6 wt-% each and 80 wt-% PE (pink), (b) three
pellets placed one after the other of Fructose then lactose then citric acid, each one is constituted
by 20 wt-% of compound and 80 wt-% of PE (blue), Absorbance of three pellets of mixture made
of 6.6 wt-% of citric acid, fructose and lactose and 80 wt-% PE each (yellow).
I.9. SYNTHESIS
This measurement shows the complexity of extraction of a repeatable response of the material
from experimental condition to another. Several elements can be responsible for the variance of a
sample spectrum. It can be caused by the scattering effects in the sample, or the measurement of the
same product obtained from different providers, as well as the extraction of the spectra at different
positions on the sample. All this highlights the high level of vigilance that should be taken when
proceeding spectroscopy measurements and extracting the dielectric properties of the material.
Furthermore, the thickness of the sample under study has an important influence on the response of
the material, and with variant thicknesses, of the sample as well as the reference chosen, different
reactions can occur. Moreover, these analyses presented the response of mixtures and helped
understanding the interaction of the terahertz wave with a medium formed by mixtures of products.
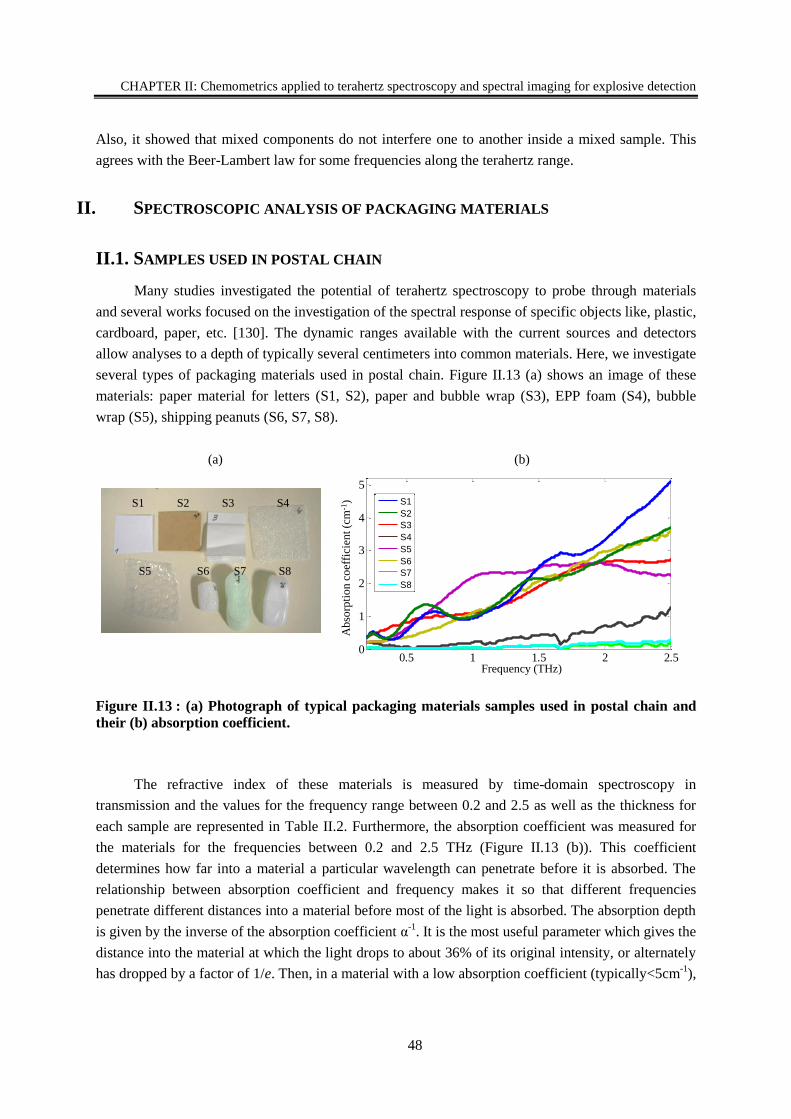
CHAPTER II: Chemometrics applied to terahertz spectroscopy and spectral imaging for explosive detection
48
Also, it showed that mixed components do not interfere one to another inside a mixed sample. This
agrees with the Beer-Lambert law for some frequencies along the terahertz range.
II. SPECTROSCOPIC ANALYSIS OF PACKAGING MATERIALS
II.1. SAMPLES USED IN POSTAL CHAIN
Many studies investigated the potential of terahertz spectroscopy to probe through materials
and several works focused on the investigation of the spectral response of specific objects like, plastic,
cardboard, paper, etc. [130]. The dynamic ranges available with the current sources and detectors
allow analyses to a depth of typically several centimeters into common materials. Here, we investigate
several types of packaging materials used in postal chain. Figure II.13 (a) shows an image of these
materials: paper material for letters (S1, S2), paper and bubble wrap (S3), EPP foam (S4), bubble
wrap (S5), shipping peanuts (S6, S7, S8).
Figure II.13 : (a) Photograph of typical packaging materials samples used in postal chain and
their (b) absorption coefficient.
The refractive index of these materials is measured by time-domain spectroscopy in
transmission and the values for the frequency range between 0.2 and 2.5 as well as the thickness for
each sample are represented in Table II.2. Furthermore, the absorption coefficient was measured for
the materials for the frequencies between 0.2 and 2.5 THz (Figure II.13 (b)). This coefficient
determines how far into a material a particular wavelength can penetrate before it is absorbed. The
relationship between absorption coefficient and frequency makes it so that different frequencies
penetrate different distances into a material before most of the light is absorbed. The absorption depth
is given by the inverse of the absorption coefficient α-1
. It is the most useful parameter which gives the
distance into the material at which the light drops to about 36% of its original intensity, or alternately
has dropped by a factor of 1/e. Then, in a material with a low absorption coefficient (typically<5cm-1
),
0.5 1 1.5 2 2.50
1
2
3
4
5
Frequency (THz)
Ab
sorp
tio
n c
oef
fici
ent (c
m-1
)S1 S2 S3 S4
S5 S6 S7 S8
(a) (b)
0.5 1 1.5 2 2.50.9
1
1.1
1.2
1.3
1.4
1.5
1.6
Frequency (THz)
Ref
ract
ive
ind
ex
S1
S2
S3
S4
S5
S6
S7
S8
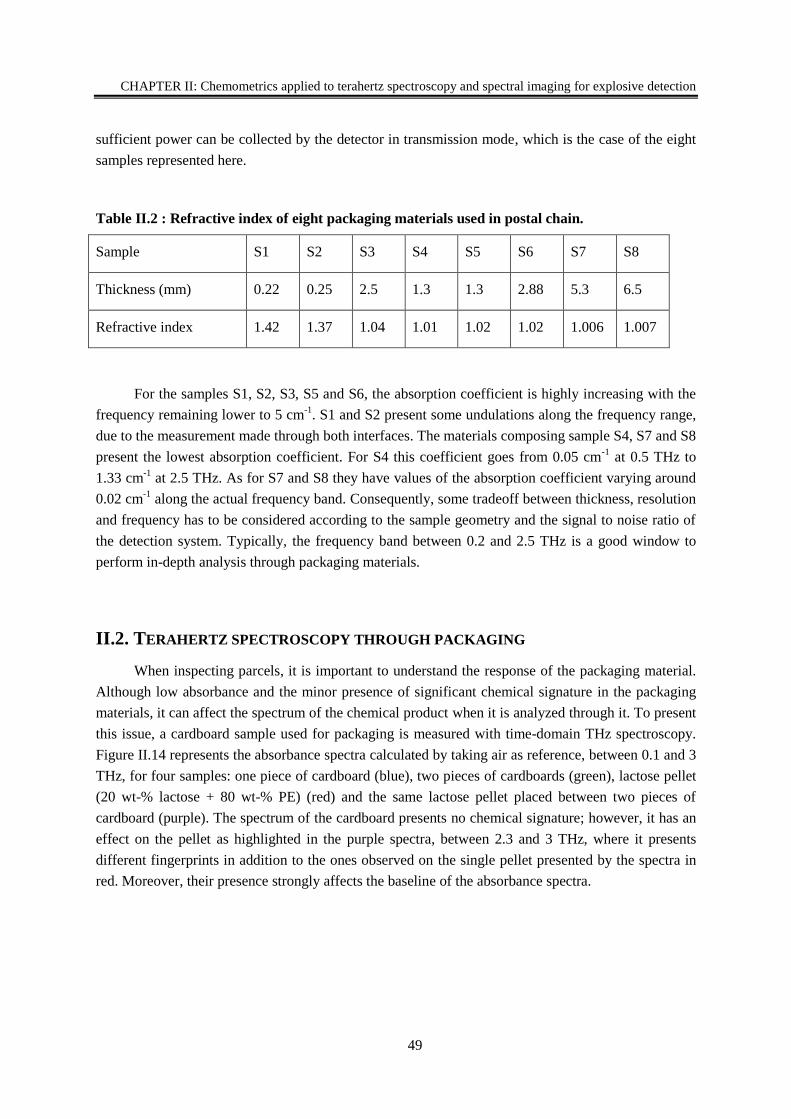
CHAPTER II: Chemometrics applied to terahertz spectroscopy and spectral imaging for explosive detection
49
sufficient power can be collected by the detector in transmission mode, which is the case of the eight
samples represented here.
Table II.2 : Refractive index of eight packaging materials used in postal chain.
Sample S1 S2 S3 S4 S5 S6 S7 S8
Thickness (mm) 0.22 0.25 2.5 1.3 1.3 2.88 5.3 6.5
Refractive index 1.42 1.37 1.04 1.01 1.02 1.02 1.006 1.007
For the samples S1, S2, S3, S5 and S6, the absorption coefficient is highly increasing with the
frequency remaining lower to 5 cm-1
. S1 and S2 present some undulations along the frequency range,
due to the measurement made through both interfaces. The materials composing sample S4, S7 and S8
present the lowest absorption coefficient. For S4 this coefficient goes from 0.05 cm-1
at 0.5 THz to
1.33 cm-1
at 2.5 THz. As for S7 and S8 they have values of the absorption coefficient varying around
0.02 cm-1
along the actual frequency band. Consequently, some tradeoff between thickness, resolution
and frequency has to be considered according to the sample geometry and the signal to noise ratio of
the detection system. Typically, the frequency band between 0.2 and 2.5 THz is a good window to
perform in-depth analysis through packaging materials.
II.2. TERAHERTZ SPECTROSCOPY THROUGH PACKAGING
When inspecting parcels, it is important to understand the response of the packaging material.
Although low absorbance and the minor presence of significant chemical signature in the packaging
materials, it can affect the spectrum of the chemical product when it is analyzed through it. To present
this issue, a cardboard sample used for packaging is measured with time-domain THz spectroscopy.
Figure II.14 represents the absorbance spectra calculated by taking air as reference, between 0.1 and 3
THz, for four samples: one piece of cardboard (blue), two pieces of cardboards (green), lactose pellet
(20 wt-% lactose + 80 wt-% PE) (red) and the same lactose pellet placed between two pieces of
cardboard (purple). The spectrum of the cardboard presents no chemical signature; however, it has an
effect on the pellet as highlighted in the purple spectra, between 2.3 and 3 THz, where it presents
different fingerprints in addition to the ones observed on the single pellet presented by the spectra in
red. Moreover, their presence strongly affects the baseline of the absorbance spectra.
CHAPTER II: Chemometrics applied to terahertz spectroscopy and spectral imaging for explosive detection
50
Figure II.14 : Absorbance spectra calculated by taking air as reference, for six samples: one
piece of cardboard (blue), two pieces of cardboards (green), lactose pellet (20 wt-% lactose + 80
wt-% PE) (red) and the same lactose pellet placed between two pieces of cardboard (purple).
This analysis illustrates the impact of the packaging materials on the identification of chemical
products and underlines the limitation of recognition of the product through packaging. It highlights
the importance of using statistical selection methods like chemometric tools used in the present study,
in order to extract the signature of the powder and avoids the impact of the packaging materials.
II.3. IMAGING THROUGH PACKAGING
The same configuration of “cardboard1/lactose pellet/cardboard2” measured in spectroscopy is
also imaged where the pellet of 13 mm diameter and 3 mm thickness is placed between two pieces of
cardboard of 1.8 mm thickness, as shown in Figure II.15 (a). The spectrum, in Figure II.15 (b), is
clearly pointing out the fingerprints of the lactose and it is identical at each pixel of the image
belonging to the pellets region. However, by analyzing the THz resulting image at different
frequencies, 0.21 (d) and 0.52 (e) THz for examples, the image reveals different information. This
effect is due to the multilayer structure of the cardboard (Figure II.15 (c)) that presents in depth a
various structure affecting the quality of the image. This impact is destructive to the real physical
information of the sample and can induce wrong interpretation.
0.5 1 1.5 2 2.5 30
2
4
6
8
absorb
ance
un carton
deux carton
past seul
pastille 2carton
0.5 1 1.5 2 2.5 30
2
4
6
8
absorb
ance
un carton
deux carton
past seul
pastille 2carton
One cardboard
Two cardboard
Pellet
Pellet with 2 cardboard
Ab
sorb
ance
Frequency (THz)
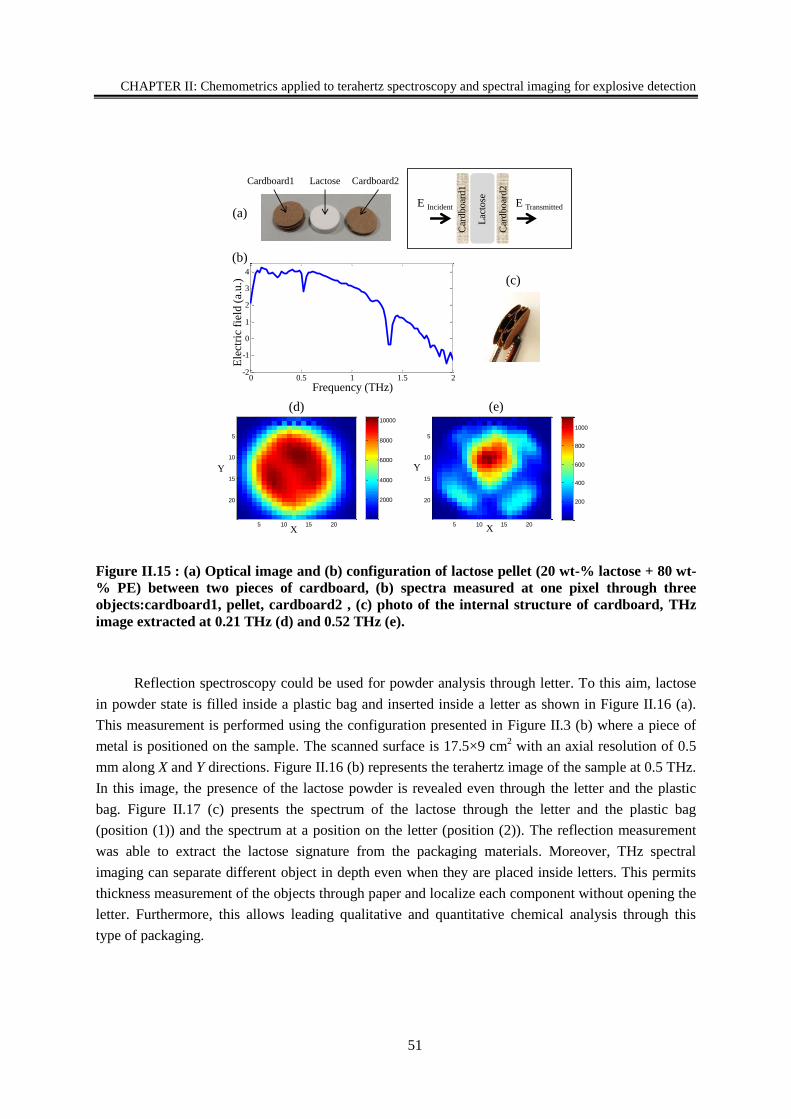
CHAPTER II: Chemometrics applied to terahertz spectroscopy and spectral imaging for explosive detection
51
Figure II.15 : (a) Optical image and (b) configuration of lactose pellet (20 wt-% lactose + 80 wt-
% PE) between two pieces of cardboard, (b) spectra measured at one pixel through three
objects:cardboard1, pellet, cardboard2 , (c) photo of the internal structure of cardboard, THz
image extracted at 0.21 THz (d) and 0.52 THz (e).
Reflection spectroscopy could be used for powder analysis through letter. To this aim, lactose
in powder state is filled inside a plastic bag and inserted inside a letter as shown in Figure II.16 (a).
This measurement is performed using the configuration presented in Figure II.3 (b) where a piece of
metal is positioned on the sample. The scanned surface is 17.5×9 cm2 with an axial resolution of 0.5
mm along X and Y directions. Figure II.16 (b) represents the terahertz image of the sample at 0.5 THz.
In this image, the presence of the lactose powder is revealed even through the letter and the plastic
bag. Figure II.17 (c) presents the spectrum of the lactose through the letter and the plastic bag
(position (1)) and the spectrum at a position on the letter (position (2)). The reflection measurement
was able to extract the lactose signature from the packaging materials. Moreover, THz spectral
imaging can separate different object in depth even when they are placed inside letters. This permits
thickness measurement of the objects through paper and localize each component without opening the
letter. Furthermore, this allows leading qualitative and quantitative chemical analysis through this
type of packaging.
E Incident E Transmitted
Cardboard1 Cardboard2Lactose
Car
db
oar
d1
Car
db
oar
d2
Lac
tose
(c)
5 10 15 20
5
10
15
20 2000
4000
6000
8000
10000
X
Y
(d)
(a)
0 0.5 1 1.5 2-2
-1
0
1
2
3
4
Frequency (THz)
5 10 15 20
5
10
15
20 200
400
600
800
1000
X
Y
(e)
(b)
Ele
ctri
c fi
eld
(a.
u.)
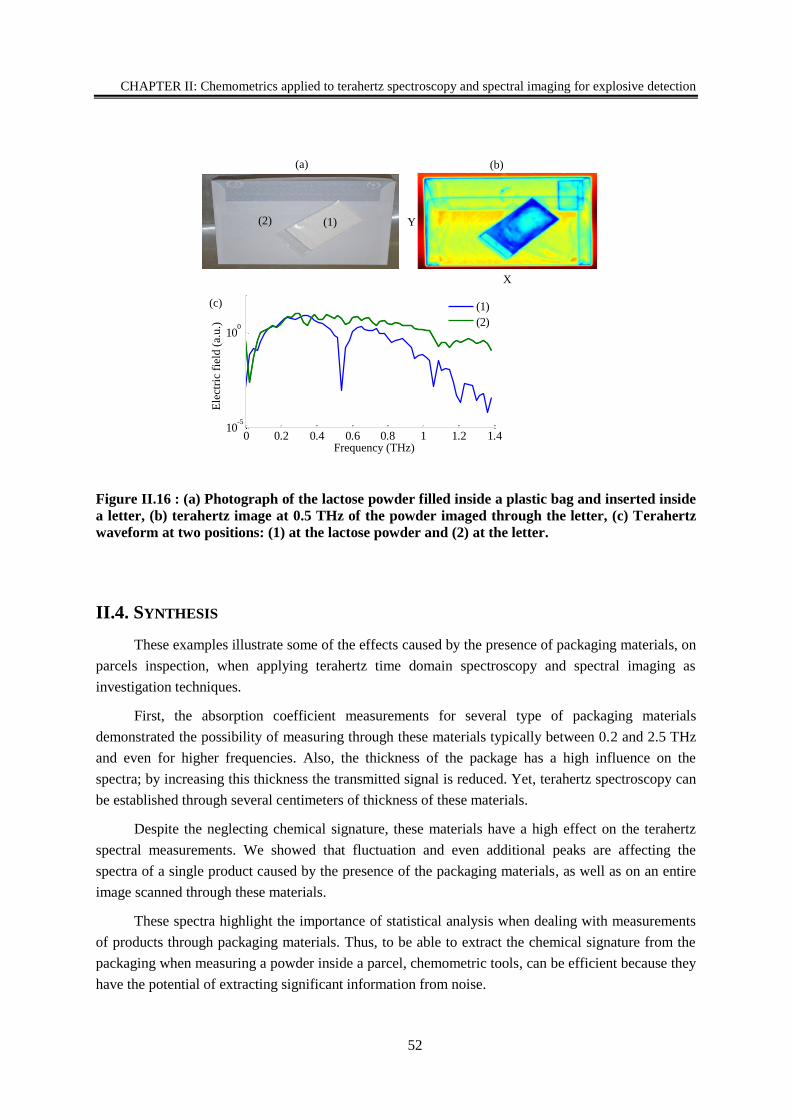
CHAPTER II: Chemometrics applied to terahertz spectroscopy and spectral imaging for explosive detection
52
Figure II.16 : (a) Photograph of the lactose powder filled inside a plastic bag and inserted inside
a letter, (b) terahertz image at 0.5 THz of the powder imaged through the letter, (c) Terahertz
waveform at two positions: (1) at the lactose powder and (2) at the letter.
II.4. SYNTHESIS
These examples illustrate some of the effects caused by the presence of packaging materials, on
parcels inspection, when applying terahertz time domain spectroscopy and spectral imaging as
investigation techniques.
First, the absorption coefficient measurements for several type of packaging materials
demonstrated the possibility of measuring through these materials typically between 0.2 and 2.5 THz
and even for higher frequencies. Also, the thickness of the package has a high influence on the
spectra; by increasing this thickness the transmitted signal is reduced. Yet, terahertz spectroscopy can
be established through several centimeters of thickness of these materials.
Despite the neglecting chemical signature, these materials have a high effect on the terahertz
spectral measurements. We showed that fluctuation and even additional peaks are affecting the
spectra of a single product caused by the presence of the packaging materials, as well as on an entire
image scanned through these materials.
These spectra highlight the importance of statistical analysis when dealing with measurements
of products through packaging materials. Thus, to be able to extract the chemical signature from the
packaging when measuring a powder inside a parcel, chemometric tools, can be efficient because they
have the potential of extracting significant information from noise.
(1)(2)
0 0.2 0.4 0.6 0.8 1 1.2 1.410
-5
100
(1)
(2)
Ele
ctri
c fi
eld
(a.
u.)
Frequency (THz)
(a) (b)
(c)
X
Y
CHAPTER II: Chemometrics applied to terahertz spectroscopy and spectral imaging for explosive detection
53
III. CHEMOMETRIC TOOLS
Chemometrics is the science of statistical and mathematical methods applied to chemical data
to extract the maximum chemical information. The application areas of chemometrics are various
going from chemical, physical and biological studies, to food industry [131] and psychology for
hedonics analyses [132]. Svante et al. discussed in 1998 how successful chemometrics has been used
in several applications [133]. Moreover, it has been successfully examined by many spectroscopic
methods like Raman and Laser-induce breakdown spectroscopy (LIBS) [134] [135].
One of the basic methods used in chemometrics is the multivariate analysis, which is used to
analyze data that arises from more than one variable e.g. frequencies in the THz spectroscopy. One of
the powerful advantages of multivariate analysis is the ability to separate out useful information from
noise. In this work, we are using three basic multivariate linear techniques: Principal Component
Analysis (PCA), Partial Least Square (PLS) and Partial Least Square-Discriminant Analysis (PLS-
DA). These techniques are applied to THz spectral data and spectral images, basically on explosives
spectra, to extract information about the samples in pure state and in mixtures, such as the material
nature, the components concentrations, etc. PCA is used to describe the data and visualize similarities
or groupings among the data. PLS-DA is performed in order to classify unknown data into specific
classes created by the model. And PLS is used to quantify unknown samples and extract the amount
of elements in mixtures. The techniques are computed using commercial software from UMETRICS,
the SIMCA-P+12. The detailed mathematical calculations are not developed here, but a brief
description of the way that each of these methods work, is presented below [136]. Before discussing
each method separately, let us introduce some mathematical parameters that are used in multivariate
analysis [137]. In statistical calculations, each group of data has a known type of distribution, where
different parameters are important to consider. The most used estimator for the central value is the
arithmetic mean ��. For a G vector of n data G= [G1, G2, …, Gn], the mean of the variable is the sum
of observed values in a data divided by the number of observations, expressed as follows:
𝐺 = 1
𝑛 ∑𝐺𝑖
𝑛
𝑖=1
(20)
The classical measure for the variation of the data is the standard deviation s that gives an idea
about how the data are spread. It is more sensitive to outliers than the mean because it is proportional
to the squared deviation. In normal statistical distribution, this measure is widely used. It is calculated
as follows:
𝑠 = √1
𝑛 − 1 ∑(𝐺𝑖 − ��)2
𝑛
𝑖=1
(21)
For multispectral data analysis, the most important calculation is the covariance matrix. It helps
understanding the relation between data. Considering X matrix with a dimension n×m, n is the number
of variables corresponding to the number of columns and m is the number of rows corresponding to
samples.
CHAPTER II: Chemometrics applied to terahertz spectroscopy and spectral imaging for explosive detection
54
𝑋 =
[ 𝑋11 𝑋21 𝑋31 ⋯ ⋯ 𝑋𝑛1
𝑋12 𝑋22
⋮⋮
𝑋1𝑚
⋮⋮
𝑋2𝑚
𝑋32 ⋯⋮⋮
𝑋3𝑚
⋮⋮⋯
⋯ 𝑋𝑛2
⋮⋮⋯
⋮⋮
𝑋𝑛𝑚]
(22)
The covariance matrix of X is a square matrix of n×n dimension. The diagonal of this
covariance matrix corresponds to the variance of each Xi column. The other elements of this
covariance matrix correspond to the covariance between two columns of X, because, in opposite to the
variance, the covariance is always measured between two dimensions. The covariance value between
the first two vectors X1 and X2 is written as:
𝑐𝑜𝑣(𝑋1, 𝑋2) = 1
𝑚 − 1 ∑(𝑋1𝑖 − 𝑋1
)
𝑚
𝑖=1
(𝑋2𝑖 − 𝑋2 )
(23)
where 𝑋1 and 𝑋2
are the arithmetic means of the vectors X1 and X2, respectively. Knowing that
𝑐𝑜𝑣(𝑋1, 𝑋2) = 𝑐𝑜𝑣(𝑋2, 𝑋1), and by applying the calculation to the entire columns, the covariance
matrix n×n can be written as:
𝐶 = [
𝑣𝑎𝑟(𝑋1) 𝑐𝑜𝑣(𝑋1, 𝑋2)𝑐𝑜𝑣(𝑋2, 𝑋1) 𝑣𝑎𝑟(𝑋2)
⋯ 𝑐𝑜𝑣(𝑋1, 𝑋𝑛)
⋯ 𝑐𝑜𝑣(𝑋2, 𝑋𝑛)
⋮ ⋮
𝑐𝑜𝑣(𝑋𝑛, 𝑋1) 𝑐𝑜𝑣(𝑋𝑛, 𝑋2)
⋱ ⋮⋯ 𝑣𝑎𝑟(𝑋𝑛)
] (24)
The sign of the covariance value gives an understanding of the relation between the n vectors.
A positive covariance value indicates that both dimensions increase together. A negative value means
that when one dimension increases the other decreases. Finally, if the covariance is zero, the two
dimensions are independent of each other.
III.1. PRINCIPAL COMPONENT ANALYSIS
Principal component analysis (PCA) is a widely used technique in various domains. It was first
invented by Karl Pearson in 1901. Later on, the algorithm was developed for different purposes.
Grung et al. developed, in 1989, a singular value decomposition (SVD) algorithm to compute missing
values when performing principal component analysis on messy data sets and Brown et al. evolves a
principal component analysis routine that utilizes maximum likelihood theory to compensate for
correlated measurement error among the variables in the data matrix [138][139]. Till now, PCA is
developed and used in various fields like signal processing and data compression for hyperspectral
images analysis [140] [141], in imaging for face recognition [142], in LIBS and Raman spectroscopy
for pigments and ink analysis [143], etc.
Principal Component Analysis is a linear transformation method used to reduce the
dimensionality of a data set which consists of a large number of variables, while retaining a maximum
of the variation present in the data set. The dimensionality reduction is achieved by projecting the data
onto a lower-dimensional orthogonal subspace, formed by new components called principal
components (PCs) of k dimension (k<n). So we are projecting the entire set of data onto a different
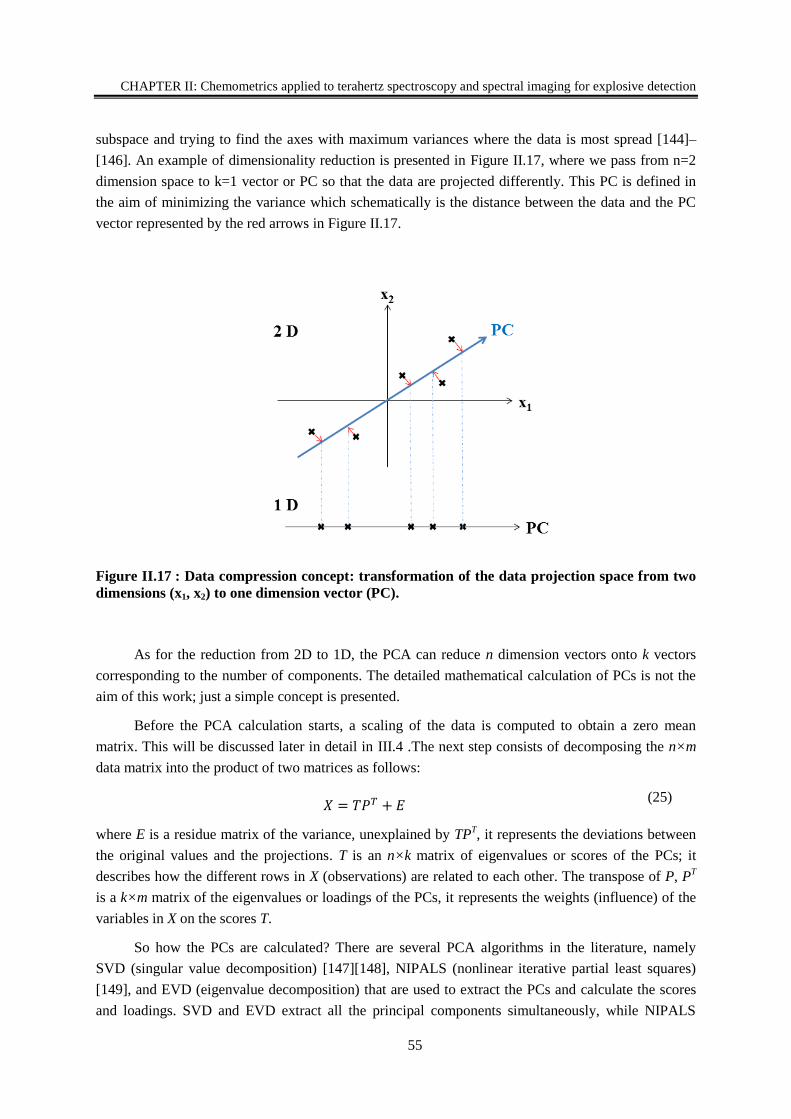
CHAPTER II: Chemometrics applied to terahertz spectroscopy and spectral imaging for explosive detection
55
subspace and trying to find the axes with maximum variances where the data is most spread [144]–
[146]. An example of dimensionality reduction is presented in Figure II.17, where we pass from n=2
dimension space to k=1 vector or PC so that the data are projected differently. This PC is defined in
the aim of minimizing the variance which schematically is the distance between the data and the PC
vector represented by the red arrows in Figure II.17.
Figure II.17 : Data compression concept: transformation of the data projection space from two
dimensions (x1, x2) to one dimension vector (PC).
As for the reduction from 2D to 1D, the PCA can reduce n dimension vectors onto k vectors
corresponding to the number of components. The detailed mathematical calculation of PCs is not the
aim of this work; just a simple concept is presented.
Before the PCA calculation starts, a scaling of the data is computed to obtain a zero mean
matrix. This will be discussed later in detail in III.4 .The next step consists of decomposing the n×m
data matrix into the product of two matrices as follows:
𝑋 = 𝑇𝑃𝑇 + 𝐸 (25)
where E is a residue matrix of the variance, unexplained by TPT, it represents the deviations between
the original values and the projections. T is an n×k matrix of eigenvalues or scores of the PCs; it
describes how the different rows in X (observations) are related to each other. The transpose of P, PT
is a k×m matrix of the eigenvalues or loadings of the PCs, it represents the weights (influence) of the
variables in X on the scores T.
So how the PCs are calculated? There are several PCA algorithms in the literature, namely
SVD (singular value decomposition) [147][148], NIPALS (nonlinear iterative partial least squares)
[149], and EVD (eigenvalue decomposition) that are used to extract the PCs and calculate the scores
and loadings. SVD and EVD extract all the principal components simultaneously, while NIPALS
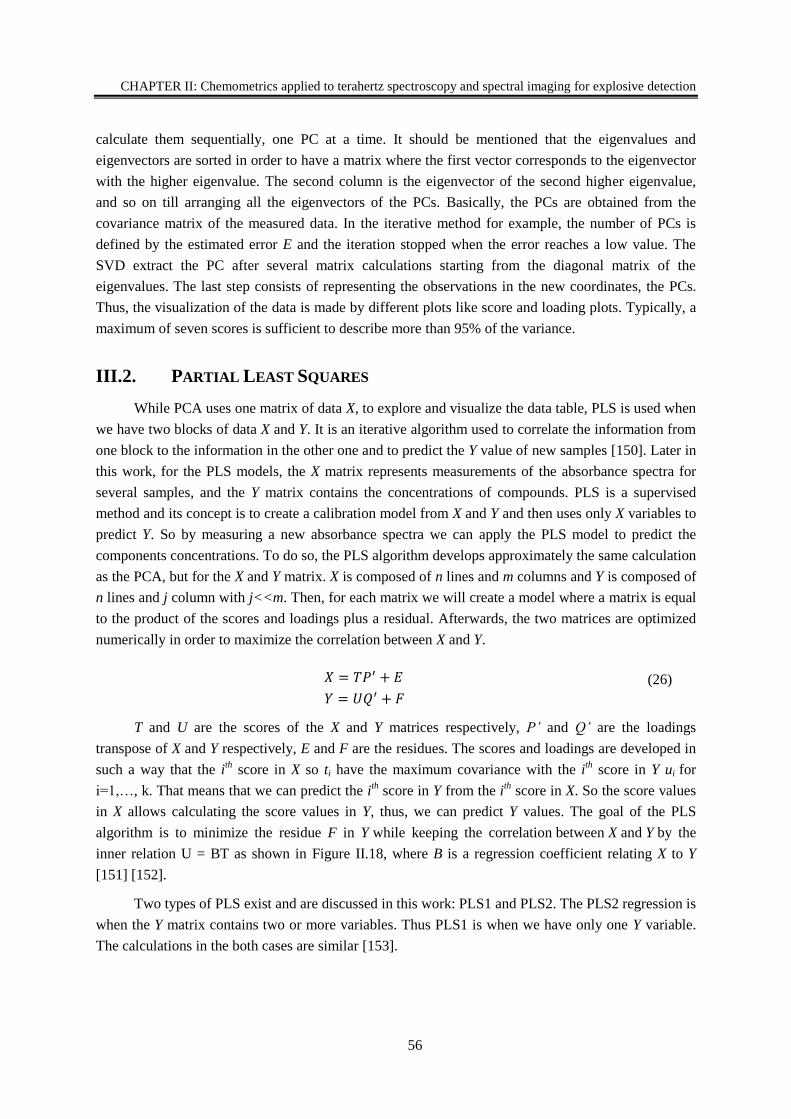
CHAPTER II: Chemometrics applied to terahertz spectroscopy and spectral imaging for explosive detection
56
calculate them sequentially, one PC at a time. It should be mentioned that the eigenvalues and
eigenvectors are sorted in order to have a matrix where the first vector corresponds to the eigenvector
with the higher eigenvalue. The second column is the eigenvector of the second higher eigenvalue,
and so on till arranging all the eigenvectors of the PCs. Basically, the PCs are obtained from the
covariance matrix of the measured data. In the iterative method for example, the number of PCs is
defined by the estimated error E and the iteration stopped when the error reaches a low value. The
SVD extract the PC after several matrix calculations starting from the diagonal matrix of the
eigenvalues. The last step consists of representing the observations in the new coordinates, the PCs.
Thus, the visualization of the data is made by different plots like score and loading plots. Typically, a
maximum of seven scores is sufficient to describe more than 95% of the variance.
III.2. PARTIAL LEAST SQUARES
While PCA uses one matrix of data X, to explore and visualize the data table, PLS is used when
we have two blocks of data X and Y. It is an iterative algorithm used to correlate the information from
one block to the information in the other one and to predict the Y value of new samples [150]. Later in
this work, for the PLS models, the X matrix represents measurements of the absorbance spectra for
several samples, and the Y matrix contains the concentrations of compounds. PLS is a supervised
method and its concept is to create a calibration model from X and Y and then uses only X variables to
predict Y. So by measuring a new absorbance spectra we can apply the PLS model to predict the
components concentrations. To do so, the PLS algorithm develops approximately the same calculation
as the PCA, but for the X and Y matrix. X is composed of n lines and m columns and Y is composed of
n lines and j column with j<<m. Then, for each matrix we will create a model where a matrix is equal
to the product of the scores and loadings plus a residual. Afterwards, the two matrices are optimized
numerically in order to maximize the correlation between X and Y.
𝑋 = 𝑇𝑃′ + 𝐸
𝑌 = 𝑈𝑄′ + 𝐹
(26)
T and U are the scores of the X and Y matrices respectively, P’ and Q’ are the loadings
transpose of X and Y respectively, E and F are the residues. The scores and loadings are developed in
such a way that the ith score in X so ti have the maximum covariance with the i
th score in Y ui for
i=1,…, k. That means that we can predict the ith score in Y from the i
th score in X. So the score values
in X allows calculating the score values in Y, thus, we can predict Y values. The goal of the PLS
algorithm is to minimize the residue F in Y while keeping the correlation between X and Y by the
inner relation U = BT as shown in Figure II.18, where B is a regression coefficient relating X to Y
[151] [152].
Two types of PLS exist and are discussed in this work: PLS1 and PLS2. The PLS2 regression is
when the Y matrix contains two or more variables. Thus PLS1 is when we have only one Y variable.
The calculations in the both cases are similar [153].
CHAPTER II: Chemometrics applied to terahertz spectroscopy and spectral imaging for explosive detection
57
Figure II.18 : Partial Least Squares concept and matrix decomposition into scores and loadings.
To build a PLS model, the data are divided in two sets. The calibration set used to create the
model, and the test set used to predict new samples unknown by the model. The test set shows the
prediction potential of a model and its limits in prediction. This is numerically described by special
parameter as RMSE and RE discussed later in this chapter.
III.3. PARTIAL LEAST SQUARE-DISCRIMINANT ANALYSIS
PLS Discriminant Analysis is performed in order to sharpen the separation between several
groups of observations, by creating PC components to obtain a maximum separation among classes.
PLS-DA is a variant of the PLS used when the Y represents a qualitative information expressing the
class membership of the statistical units. It is used for several needs in various domains like food
analysis with multivariate images [154], in biology [155], oil analysis [156], etc.
PCA can be used for classification purposes by sorting the groups formed by the score plot.
However, it is an unsupervised method and gives global visualization of group’s repartition. In
contrary, PLS-DA is a supervised method, and the classification information is combined with
identification of unknown sample by its belonging to a specified class. In this work, PLS-DA is
implemented to classify powder samples in classes of pure explosive or mixture, using spectral
information, and to group different types of explosives and their mixture in hyperspectral images.
III.4. SCALING
Two types of scaling can be applied to the initial X matrix of the measured data before
calculating the principal component: center (ctr) scale and unit variance (UV) scale. This step is
important in order to homogenize the data and remove dispersions. The choice of the scaling depends
1
.
.
.
.
.
n
1 . . . k 1 . . . . . m
1
.
.
.
k
1
.
.
.
.
.
n
1 . . . . . m
= *X T PT + E
1
.
.
.
.
.
n
1 . . f 1 . . . . j
1
.
.
f
1
.
.
.
.
.
n
1 . . . . . j
= *Y U QT
+ F
U = B*T
CHAPTER II: Chemometrics applied to terahertz spectroscopy and spectral imaging for explosive detection
58
mainly on the data quality. When the variables have symmetric distribution, then the mean is the
proper measure of the center of the data, thus center scale should give a better performance. When the
variables have a skewed distribution, the mean can be highly influenced by an observation that falls
far from the rest of the data, called an outlier. In this case, a unit variance scale can be more efficient
for the data description. Practically, if the variables are all on the same scale such as spectroscopic
data then center scale is recommended. If the variables have different scales (i.e. comparing powder
with liquid explosives) the unit variance scale is advisable [157].
For the center scale calculation, for i=1,.., n in the original matrix X, each value in each of the n
column is converted as follow:
𝑋𝑖𝑗′ = 𝑋𝑖𝑗 − ��𝑖
(27)
where j=1,…, m is the number of rows and 𝑋�� is the mean of each line of the X matrix. For the unit
variance scale, an additional step is to divide each value in the column by the standard deviation, so
the new value is:
𝑋𝑖𝑗′ =
𝑋𝑖𝑗 − ��𝑖
𝑠𝑖
(28)
where si is the standard deviation of the column I in the X matrix.
III.5. NUMBER OF COMPONENTS AND OUTLIERS
The important point when setting up a multivariate model is to make a decision about the
optimum number of principal components involved in the model. This can be determined from several
rules. Basically, it is done by the “scree” method that is applied by first plotting the eigenvalues as a
function of the corresponding principal component. To define the PC number, one should search for
the point in the plot called “elbow” which is the point of the graph where the slope goes from “steep”
to “flat” and keep only the components which are before the elbow as shown in Figure II.19 (a) [145].
For prediction models (PLS or PLS-DA) the optimum number of components is determined
empirically by cross validation [158] using an increasing number of components. Some methods
consist of calculating the PRESS (Prediction Residual Sum of Squares) value, corresponding to the
sum of squared differences between predicted and observed X-elements. The model with the
smallest PRESS value is regarded as the "best" model [159]. It is also possible to obtain this number
by calculating the root mean square error of calibration and prediction sets, RMSEC and RMSEP
respectively [160]. As shown in Figure II.19 (b), by plotting these two errors as a function of the PC
number, the RMSEC will decrease along the chosen PC, and RMSEP will decrease to achieve an
elbow point and will start to increase. The corresponding PC number at this point is chosen to create
the model. If additional PCs are calculated, the model is considered in an overfitting mode where it
describes error instead of real values.
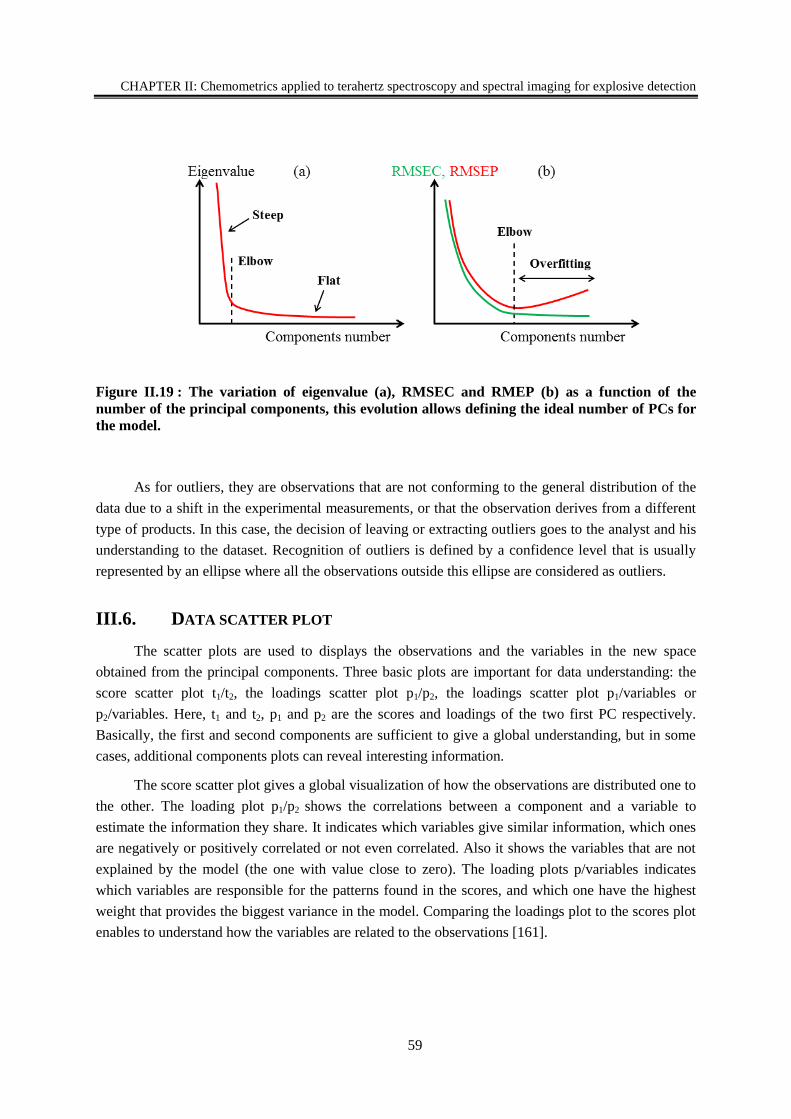
CHAPTER II: Chemometrics applied to terahertz spectroscopy and spectral imaging for explosive detection
59
Figure II.19 : The variation of eigenvalue (a), RMSEC and RMEP (b) as a function of the
number of the principal components, this evolution allows defining the ideal number of PCs for
the model.
As for outliers, they are observations that are not conforming to the general distribution of the
data due to a shift in the experimental measurements, or that the observation derives from a different
type of products. In this case, the decision of leaving or extracting outliers goes to the analyst and his
understanding to the dataset. Recognition of outliers is defined by a confidence level that is usually
represented by an ellipse where all the observations outside this ellipse are considered as outliers.
III.6. DATA SCATTER PLOT
The scatter plots are used to displays the observations and the variables in the new space
obtained from the principal components. Three basic plots are important for data understanding: the
score scatter plot t1/t2, the loadings scatter plot p1/p2, the loadings scatter plot p1/variables or
p2/variables. Here, t1 and t2, p1 and p2 are the scores and loadings of the two first PC respectively.
Basically, the first and second components are sufficient to give a global understanding, but in some
cases, additional components plots can reveal interesting information.
The score scatter plot gives a global visualization of how the observations are distributed one to
the other. The loading plot p1/p2 shows the correlations between a component and a variable to
estimate the information they share. It indicates which variables give similar information, which ones
are negatively or positively correlated or not even correlated. Also it shows the variables that are not
explained by the model (the one with value close to zero). The loading plots p/variables indicates
which variables are responsible for the patterns found in the scores, and which one have the highest
weight that provides the biggest variance in the model. Comparing the loadings plot to the scores plot
enables to understand how the variables are related to the observations [161].
CHAPTER II: Chemometrics applied to terahertz spectroscopy and spectral imaging for explosive detection
60
III.7. VALIDATION PARAMETERS
As mentioned before, PCA is an unsupervised model. The results obtained are used for the
visualization. Hence, no validation parameter is needed. However, a great careful should be given to
the choice on PC number when creating the model.
As for the multispectral prediction model, to judge a quantification model results (PLS), several
parameters can be used. The correlation coefficient r measures the strength of the linear relation
between the X and Y variables and it is used to estimate the degree of interdependence between the
variables, free from the effects of measurement units.
𝑟 = ∑ (𝑥𝑖 − �� ) (𝑦𝑖 − �� ) 𝑛
𝑖=1
√∑ (𝑥𝑖 − �� )2 𝑛𝑖=1 √∑ (𝑦𝑖 − �� )2 𝑛
𝑖=1
(29)
where �� and �� are the mean values of x and y respectively, and n is the number of lines in each
matrix. The values of r range from -1 to +1. A correlation coefficient close to +1 means that variables
are highly positively interdependent, whereas a correlation coefficient close to -1 shows that the
variables are negatively interdependent, the value of one variable decreases as the other increases. A
correlation coefficient close to zero indicates that the variables are linearly independent.
Another important coefficient is the Root Mean Square Error (RMSE) defined as:
𝑅𝑀𝑆𝐸 = √1
𝑁 ∑ (yipred − yi
N
i=1)2
(30)
where yi corresponds to the actual value of concentration of the sample i, yipred is the predicted value
by the model and N is the number of the samples in the dataset. This error can be calculated for a
training set (RMSEC) as well as for the test set (RMSEP). RMSEC and RMSEP values close to zero
indicate a better prediction ability of the model. RMSE being a mean value it is important to estimate
the error in prediction for every set of similar concentrations. This is achieved by calculating the
relative error (RE) for different sets of samples.
𝑅𝐸 = 1
𝑁𝑛 ∑
|yipred − yi|
yi
N
i=1× 100
(31)
where yi defines the actual concentration value of a sample, yipred is the corresponding predicted value
by the model and Nn is the number of samples in each set of concentration [157].
As for a classification model where, the Y matrix corresponds to values related to classes, the
evaluation of the model can be performed by using, in addition to the RMSE, a confusion matrix or a
table where each column of the matrix represents the number of observations in a predicted class
while each row represents this number in an actual class [162] [163].
CHAPTER II: Chemometrics applied to terahertz spectroscopy and spectral imaging for explosive detection
61
III.8. SYNTHESIS
Finally, to perform a chemometric analysis, several steps should be considered. First, the aim of
the analysis should be defined. When dealing with an unknown set of data and when the purpose is
visualization of the samples distribution and understanding the relation between the elements, PCA
model should be used. To begin, the scaling of the model should be fixed depending on the nature of
the data under study. Hereafter, the importance is in the choice of the number of PCs when building
the model. Then, the score and lodging plots lead to the understanding of the unknown samples and
reveal groups or similarities among them. If the goal is to predict unknown samples, first, the type of
prediction should be fixed. If it consists of quantitative prediction such as concentration estimation,
PLS algorithm is applied. If a qualitative prediction such as class number is needed, then PLS-DA
model should be performed. Hereafter, the same proceeding as in the case of PCA is established, by
specifying the scale and the PCs number. Then, a calibration model should be created and used to
predict the unknown samples. To validate the performance of prediction of a PLS model, r, RMSE
and RE metrics are calculated and the judgment of the results depends on the application and the rate
of precision needed. As for a PLS-DA model, a confusion matrix permits the attribution of the data
inside or outside each of the created classes and defines the correct rate of prediction of elements in
the right class.
IV. CHEMOMETRICS APPLIED TO TERAHERTZ SPECTROSCOPY FOR EXPLOSIVE
DETECTION
The most interesting advantage of the THz pulsed spectroscopy is the capability for the
spectroscopic recognition of materials by analyzing their spectra. This is possible when dealing with a
sample made of pure elements. However, with mixtures of complex powders, advanced techniques
like chemometrics are needed to extract the interesting spectral information about the sample. Many
technology tools already exist for explosive identification. Most of them rely on multivariate and
statistical analysis after physical measurements of the sample. Recently, several chemometric
techniques were applied to the terahertz domain and demonstrated their efficiency for qualitative and
quantitative analysis of terahertz data [164] [165]. These analytical methods were applied to terahertz
spectroscopy measurements for analyzing pesticides [166], chemical mixtures [167] and identification
of isomers [168]. In particular, partial least squares regression models were successfully applied to
terahertz spectra for quantitative analysis [169] in several applications like estimating the degree of
crystallinity in sucrose [170] and differentiating between different historically black inks [171]. In
this section, we applied chemometric analysis to terahertz spectra, measured in transmission
configuration, to investigate explosive materials made of pure elements or mixtures.
IV.1. SAMPLE PREPARATION PROTOCOL
In this study, we were interested in two specific explosives, namely cyclotrimethylene-
trinitramine and pentaerythritoltetranitrate, hereafter called RDX and PETN, respectively. The
mixture of these two creates another type of explosives, the Semtex, a very popular plastic explosive
within terrorist organizations because it was, until recently, extremely difficult to detect. The
CHAPTER II: Chemometrics applied to terahertz spectroscopy and spectral imaging for explosive detection
62
absorption peaks of these two explosives in PE matrix are “0.80, 1.45, 1.50, 1.98, 2.20, 2.95” THz for
RDX and “1.82, 2.63, 4.12, 5.20, 5.52” THz for PETN [110] [111]. It should be mentioned that the
peak position can varies by varying the matrix nature.
The analysis is conducted on different samples composed of either one single explosive or a
mixture of both of them with varying weight-percent (wt-%). In collaboration with the Institute of
optoelectronics in the Military University of Techanlology in Warsaw, thirty six samples were
carefully prepared from powders of pure explosives mixed with PE as a binder for all samples. We
used the same explosive provider for all samples to avoid any fluctuations in the absorption level
above 1.5 THz, due to different material crystallization quality [172]. Moreover, the grain size has a
strong influence on the porosity of the PE-based samples and consequently on the scattering effect
[173]. Therefore, the explosive powders were first ground using a mortar and pestle to reduce their
particle sizes and avoid scattering losses. Next, powders of both explosives and high grade PE with
particle sizes of approximatively 80 µm were mixed together and pressed using a manual hydraulic
press (7 tons/cm2 during 2 minutes). Finally, we prepared 36 pellets with a 400 mg total weight and a
13 mm diameter. Two replicates of each of the 36 samples were prepared for reproducibility
assessment, and thus 72 pellets were analyzed. It should be mentioned that the quality of the samples
was assessed from the THz-TDS spectra with the goal of reducing the scattering effects.
In the ternary diagram shown in Figure II.20, the squares represent the concentrations of the
manufactured samples. Three poles labeled as PE, PETN and RDX represent the following
concentrations: 400 mg (or 100 wt-%) PE (left), 100 mg PETN/300 mg PE (top) (or 25 wt-% PETN),
and 100 mg RDX/300 mg PE (bottom) (or 25 wt-% RDX), respectively. Samples representing binary
mixtures of PE and PETN (or RDX) are marked on the axis PETN (or RDX), respectively. Squares
inside the diagram show the rest of the samples containing PE, PETN and RDX.
As an example, let us provide the characteristics of the sample encircled in Figure II.20. The
blue arrows indicate the projections of the sample onto the three axes, which give the weights (in mg)
of the three individual products. One can conclude that this sample contains 20 mg RDX, 20 mg
PETN and 360 mg PE. Additionally, a 400 mg pellet of pure polyethylene was prepared as the
reference for all spectroscopic measurements. The distribution of the samples between training and
test set is made for the chemometric analysis applied further in this section.
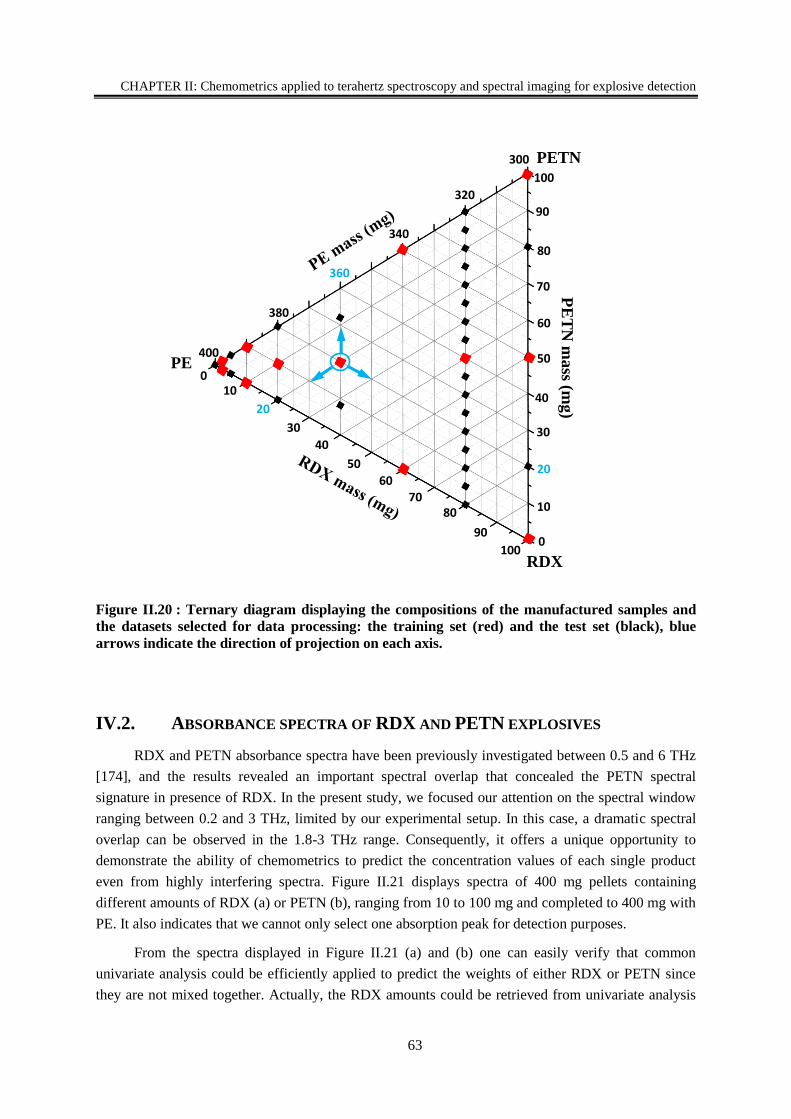
CHAPTER II: Chemometrics applied to terahertz spectroscopy and spectral imaging for explosive detection
63
Figure II.20 : Ternary diagram displaying the compositions of the manufactured samples and
the datasets selected for data processing: the training set (red) and the test set (black), blue
arrows indicate the direction of projection on each axis.
IV.2. ABSORBANCE SPECTRA OF RDX AND PETN EXPLOSIVES
RDX and PETN absorbance spectra have been previously investigated between 0.5 and 6 THz
[174], and the results revealed an important spectral overlap that concealed the PETN spectral
signature in presence of RDX. In the present study, we focused our attention on the spectral window
ranging between 0.2 and 3 THz, limited by our experimental setup. In this case, a dramatic spectral
overlap can be observed in the 1.8-3 THz range. Consequently, it offers a unique opportunity to
demonstrate the ability of chemometrics to predict the concentration values of each single product
even from highly interfering spectra. Figure II.21 displays spectra of 400 mg pellets containing
different amounts of RDX (a) or PETN (b), ranging from 10 to 100 mg and completed to 400 mg with
PE. It also indicates that we cannot only select one absorption peak for detection purposes.
From the spectra displayed in Figure II.21 (a) and (b) one can easily verify that common
univariate analysis could be efficiently applied to predict the weights of either RDX or PETN since
they are not mixed together. Actually, the RDX amounts could be retrieved from univariate analysis
340
360
320
300
380
400PE
RDX
PETN
90
8070
40
60
50
20
30
100
100
90
80
70
40
60
50
20
30
10
0
100
PE
TN
ma
ss (mg
)
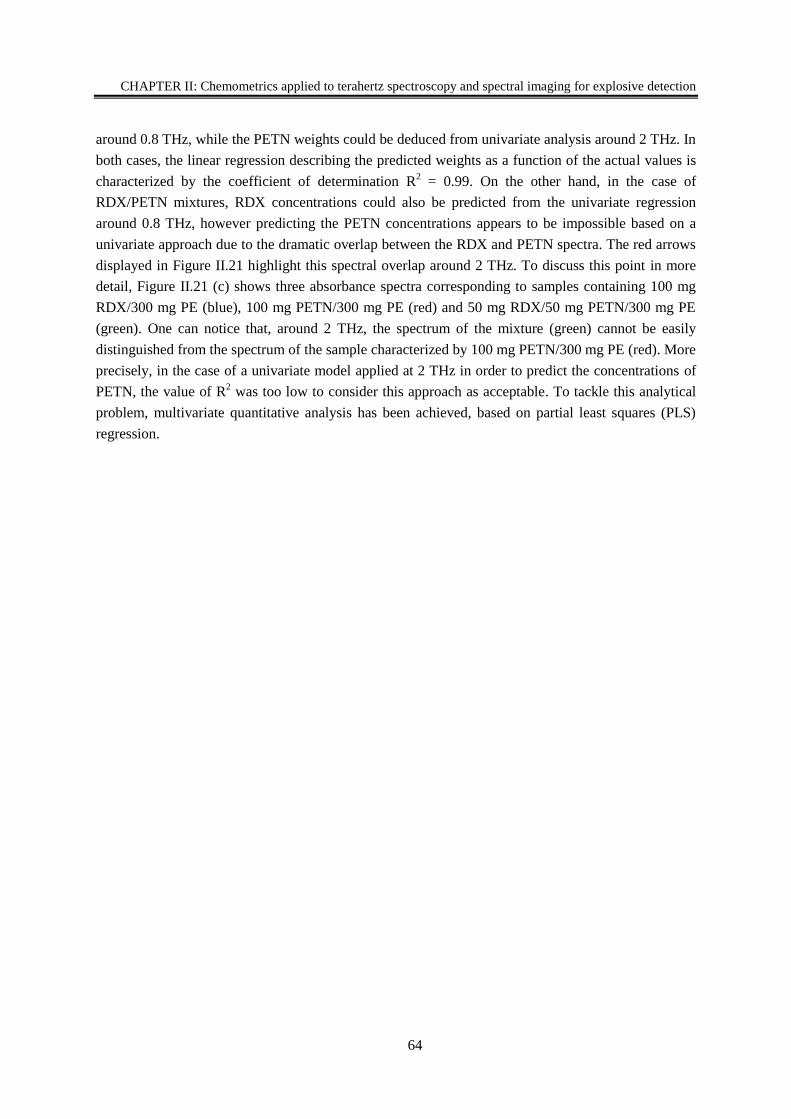
CHAPTER II: Chemometrics applied to terahertz spectroscopy and spectral imaging for explosive detection
64
around 0.8 THz, while the PETN weights could be deduced from univariate analysis around 2 THz. In
both cases, the linear regression describing the predicted weights as a function of the actual values is
characterized by the coefficient of determination R2 = 0.99. On the other hand, in the case of
RDX/PETN mixtures, RDX concentrations could also be predicted from the univariate regression
around 0.8 THz, however predicting the PETN concentrations appears to be impossible based on a
univariate approach due to the dramatic overlap between the RDX and PETN spectra. The red arrows
displayed in Figure II.21 highlight this spectral overlap around 2 THz. To discuss this point in more
detail, Figure II.21 (c) shows three absorbance spectra corresponding to samples containing 100 mg
RDX/300 mg PE (blue), 100 mg PETN/300 mg PE (red) and 50 mg RDX/50 mg PETN/300 mg PE
(green). One can notice that, around 2 THz, the spectrum of the mixture (green) cannot be easily
distinguished from the spectrum of the sample characterized by 100 mg PETN/300 mg PE (red). More
precisely, in the case of a univariate model applied at 2 THz in order to predict the concentrations of
PETN, the value of R2 was too low to consider this approach as acceptable. To tackle this analytical
problem, multivariate quantitative analysis has been achieved, based on partial least squares (PLS)
regression.
CHAPTER II: Chemometrics applied to terahertz spectroscopy and spectral imaging for explosive detection
65
Figure II.21 : THz absorbance spectra of pure RDX (a) and pure PETN (b) inside 400 mg
pellets containing different amounts of RDX, PETN and PE. The red arrows highlight the risk
of interference between the spectra, (c) Absorbance spectra of 400 mg pellets containing 300 mg
of PE and 100 mg of RDX (blue), 300 mg of PE and 100 mg of PETN (red, and 300 mg of PE, 50
mg of RDX and 50mg of PETN (green).
IV.3. PARTIAL LEAST SQUARE ANALYSIS FOR QUANTIFICATION OF
EXPLOSIVES
PLS1 and PLS2 were performed on a series of terahertz absorbance spectra. PLS1 was built to
retrieve the weights (in mg) of PETN in mixture samples while PLS2 was built to simultaneously
predict the weights (in mg) of RDX and PETN. We decided to focus our attention on the analysis of
PETN, because predicting the concentration values of RDX was not challenging, due to clearly isolate
spectral features easily treated by univariate approach.
To generate the PLS models, the experimental data were split into two independent subsets: the
training set containing data used to calibrate the model and the test set containing data, totally
independent from the previous ones and used to test the prediction ability of the model. All the
spectral data were centered as preprocessing of the PLS models and the analysis is applied to raw
CHAPTER II: Chemometrics applied to terahertz spectroscopy and spectral imaging for explosive detection
66
data, no transformation as 1st or 2sd derivative was used, since, for the present set of data, the raw data
gave sufficient performance in chemometric analysis.
In Figure II.20, the 12 samples belonging to the training set are displayed in the ternary
diagram as red squares. Briefly, the training dataset was made of 4 samples containing RDX, but no
PETN, another 4 samples containing PETN but no RDX and finally 4 last samples containing both
RDX and PETN in equal mass proportion. The other 24 samples represented in black belong to the
test set: 3 samples contained RDX but no PETN, the 3 other ones contained PETN but no RDX, 14
samples contained mixtures of RDX and PETN with the same amount of PE (320 mg) as a binder, and
finally, two other samples contained mixtures of RDX and PETN completed with 360 mg of PE, and
two last samples contained mixtures of RDX and PETN completed with 300 mg of PE.
The PLS1 algorithm was built to retrieve the concentrations of PETN. After a training step, the
concentrations of the test set samples are predicted from this model. Figure II.22 displays the
predicted scores in the plane of the two first principal components (PC1 and PC2), i.e. the two most
descriptive latent variables. In this score-plot, the samples are displayed inside a kind of triangular
area limited by two segments: one (top-black line) related to PETN samples (without RDX) and
another (bottom- red line) related to RDX samples (without PETN). All the samples displayed
between these two lines are the result of mixtures of RDX and PETN. While one can observe the
small dispersion of each group of points, the plane defined by the first two components of the PLS1
model in Figure II.22 allowed retrieving quite well the ternary diagram given in Figure II.20. More
precisely, the three poles of the triangle in Figure II.22 correspond to the three products composing
the samples, namely RDX, PETN and PE. The samples related to binary mixtures were correctly
displayed on the two lines limiting the triangle displayed in Figure II.22. As a first conclusion, one
can state that this PLS1 model is quite efficient in analyzing the THz absorbance spectra data.
Actually, the ternary diagram was correctly retrieved and the relative positions between the samples
were in good agreement with the ones given in Figure II.20. This demonstrates that the THz
absorbance spectra contain very informative features to describe the samples, mixtures of three
products. In addition, for this PLS1 model, the first component (PC1-horizontal axis) allowed
explaining more than 80% of the variance. Thus, the most concentrated samples (in either RDX or
PETN) were displayed on the right part of the graph in Figure II.22 while the samples containing
mainly the PE (the binder) were displayed on the left part of the graph. Moreover, the second
principal component (PC2-vertical axis) allowed separating the samples containing either RDX or
PETN. In this case, positive values of the PC2 scores were related to samples rich in the PETN while
negative values corresponded to samples rich in RDX. This result was confirmed by the loadings plots
displayed in Figure II.23 (a) and (c).
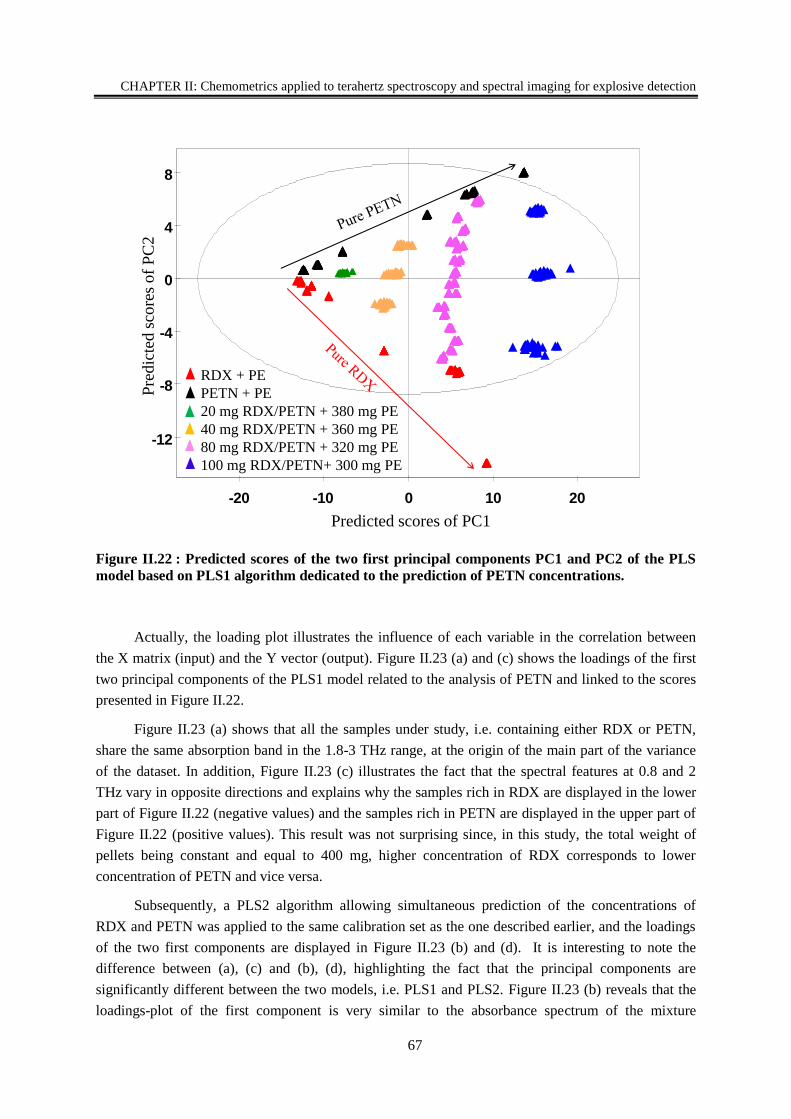
CHAPTER II: Chemometrics applied to terahertz spectroscopy and spectral imaging for explosive detection
67
Figure II.22 : Predicted scores of the two first principal components PC1 and PC2 of the PLS
model based on PLS1 algorithm dedicated to the prediction of PETN concentrations.
Actually, the loading plot illustrates the influence of each variable in the correlation between
the X matrix (input) and the Y vector (output). Figure II.23 (a) and (c) shows the loadings of the first
two principal components of the PLS1 model related to the analysis of PETN and linked to the scores
presented in Figure II.22.
Figure II.23 (a) shows that all the samples under study, i.e. containing either RDX or PETN,
share the same absorption band in the 1.8-3 THz range, at the origin of the main part of the variance
of the dataset. In addition, Figure II.23 (c) illustrates the fact that the spectral features at 0.8 and 2
THz vary in opposite directions and explains why the samples rich in RDX are displayed in the lower
part of Figure II.22 (negative values) and the samples rich in PETN are displayed in the upper part of
Figure II.22 (positive values). This result was not surprising since, in this study, the total weight of
pellets being constant and equal to 400 mg, higher concentration of RDX corresponds to lower
concentration of PETN and vice versa.
Subsequently, a PLS2 algorithm allowing simultaneous prediction of the concentrations of
RDX and PETN was applied to the same calibration set as the one described earlier, and the loadings
of the two first components are displayed in Figure II.23 (b) and (d). It is interesting to note the
difference between (a), (c) and (b), (d), highlighting the fact that the principal components are
significantly different between the two models, i.e. PLS1 and PLS2. Figure II.23 (b) reveals that the
loadings-plot of the first component is very similar to the absorbance spectrum of the mixture
-12
-8
-4
0
4
8
-20 -10 0 10 20
Sco
res o
f P
C2
Scores of PC1
Absorbance_all diagram_apres reparation exponentiel.M11 (PLS-Class(1)), PS-Class 1, WS 20
tPS[Comp. 1]/tPS[Comp. 2]
R2X[1] = 0,888558 R2X[2] = 0,103733 Ellipse: Hotelling T2 (0,95)
SIMCA-P+ 12.0.1 - 2014-12-06 16:09:12 (UTC+1)
RDX + PE
PETN + PE
20 mg RDX/PETN + 380 mg PE
40 mg RDX/PETN + 360 mg PE
80 mg RDX/PETN + 320 mg PE
100 mg RDX/PETN+ 300 mg PE
Predicted scores of PC1
Pre
dic
ted
sco
res
of
PC
2
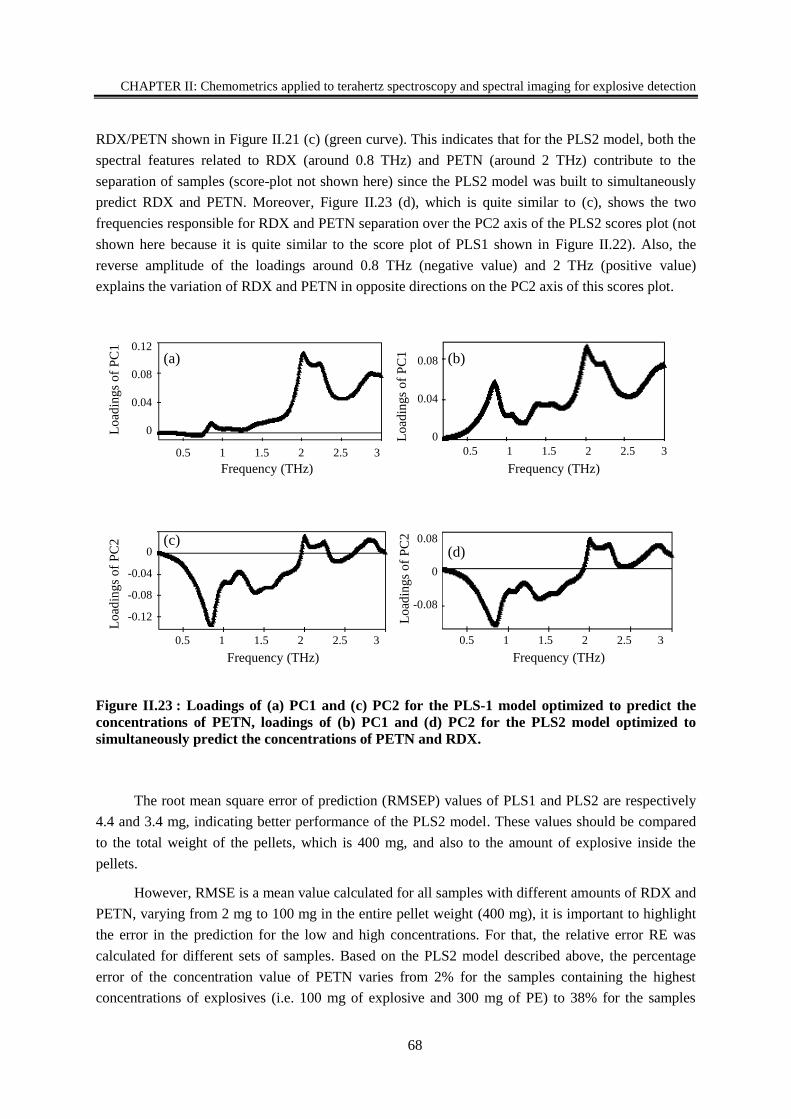
CHAPTER II: Chemometrics applied to terahertz spectroscopy and spectral imaging for explosive detection
68
RDX/PETN shown in Figure II.21 (c) (green curve). This indicates that for the PLS2 model, both the
spectral features related to RDX (around 0.8 THz) and PETN (around 2 THz) contribute to the
separation of samples (score-plot not shown here) since the PLS2 model was built to simultaneously
predict RDX and PETN. Moreover, Figure II.23 (d), which is quite similar to (c), shows the two
frequencies responsible for RDX and PETN separation over the PC2 axis of the PLS2 scores plot (not
shown here because it is quite similar to the score plot of PLS1 shown in Figure II.22). Also, the
reverse amplitude of the loadings around 0.8 THz (negative value) and 2 THz (positive value)
explains the variation of RDX and PETN in opposite directions on the PC2 axis of this scores plot.
Figure II.23 : Loadings of (a) PC1 and (c) PC2 for the PLS-1 model optimized to predict the
concentrations of PETN, loadings of (b) PC1 and (d) PC2 for the PLS2 model optimized to
simultaneously predict the concentrations of PETN and RDX.
The root mean square error of prediction (RMSEP) values of PLS1 and PLS2 are respectively
4.4 and 3.4 mg, indicating better performance of the PLS2 model. These values should be compared
to the total weight of the pellets, which is 400 mg, and also to the amount of explosive inside the
pellets.
However, RMSE is a mean value calculated for all samples with different amounts of RDX and
PETN, varying from 2 mg to 100 mg in the entire pellet weight (400 mg), it is important to highlight
the error in the prediction for the low and high concentrations. For that, the relative error RE was
calculated for different sets of samples. Based on the PLS2 model described above, the percentage
error of the concentration value of PETN varies from 2% for the samples containing the highest
concentrations of explosives (i.e. 100 mg of explosive and 300 mg of PE) to 38% for the samples
(a)
(c)
Lo
adin
gs
of
PC
1L
oad
ing
s o
f P
C2
Frequency (THz)
Frequency (THz)
(b)
(d)
Lo
adin
gs
of
PC
1L
oad
ing
s o
f P
C2
Frequency (THz)
Frequency (THz)
0.12
0.08
0.04
0
0.08
0.04
0
0
-0.04
-0.08
-0.12
0.08
0
-0.08
0.5 1 1.5 2 2.5 3 0.5 1 1.5 2 2.5 3
0.5 1 1.5 2 2.5 3 0.5 1 1.5 2 2.5 3
CHAPTER II: Chemometrics applied to terahertz spectroscopy and spectral imaging for explosive detection
69
containing the lowest concentrations of explosives (i.e. 2 mg of explosives and more than 398 mg of
PE). So clearly, a higher prediction error is committed for low concentrations.
From the other hand, the spectral overlap between the RDX and PETN spectra mainly exists in
the spectral window ranging between 1.8 and 3 THz, we decided to study the predictive ability of a
new PLS model from this reduced spectral band. Our objective was to investigate the influence of the
input variables onto the models and more precisely to assess how selecting a reduced spectral window
presenting dramatic overlap between the absorbance spectra could affect the predictive ability of the
model. Thus, a new PLS2 model was built from input data limited to the spectral window 1.8-3 THz
and the X matrix of input data was made of 622 spectra and 192 variables, where the 622 spectra are
resulting from measurments of replicates. The same training and test sets as described earlier were
considered. The prediction result gives a RMSEP of 4.8 mg. By comparing this result to the PLS2
model using the entire spectral band, one can conclude that reducing the spectral window increased
the RMSE values, which was not surprising, since the absorption band of RDX at 0.8 THz has been
removed from the input data. However, it is interesting to notice that the prediction ability was quite
similar in both cases with only a slight enhancement of the RMSE values when reducing the spectral
bandwidth. This result clearly emphasizes the very good predictive ability of the PLS models even
when the input data correspond to highly interfered spectral features, as demonstrated here in the case
of mixtures of RDX and PETN analyzed on a reduced spectral window.
Finally, these results published in 2015 [175], indicated that for samples made of explosives
binary mixtures, PLS2 gave better performance for quantification of individual element. However,
this result may not be the same when dealing with explosives ternary mixtures. In this study, we limit
the analysis on binary mixtures, but it will be important to investigate the performance of the PLS
model with more complex mixtures. In the other hand, we demonstrate that a PLS analysis can be
performed on a restricted frequency band and is still able to retrieve the amounts of elements in
mixtures. This shows that when using this analysis technique, it is not necessary to extend the
frequency band of measurements.
V. CHEMOMETRICS APPLIED TO TERAHERTZ SPECTRAL-IMAGING
Recently, terahertz imaging of chemical products has been taking a lot of interest and several
methods was investigated in order to identify the chemical content of an image [107]. Watanabe et al.
used principal component analysis to do chemical mapping of the spatial distribution of different
products on an image. The analytical calculation was performed on terahertz reflection measurements
of aspirin, palatinose and riboflavin samples [176]. Moreover, Zhang et al. present a method based on
component analysis to quantify benzoic acid and its monomethyl-substituted derivatives measured
with a TDS system in transmission configuration [177]. Newly, another analytical model, known as k-
means clustering, is used for terahertz image segmentation and tested on powders to retrieve the
features that are responsible of their discrimination [178].
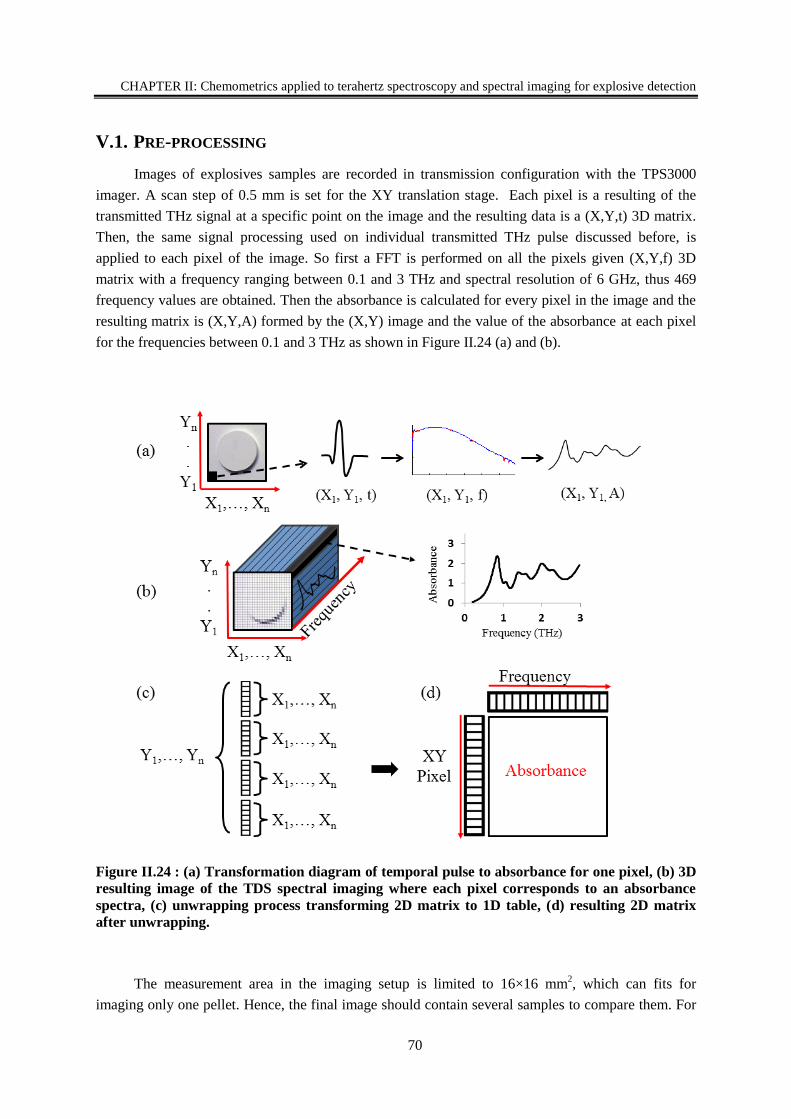
CHAPTER II: Chemometrics applied to terahertz spectroscopy and spectral imaging for explosive detection
70
V.1. PRE-PROCESSING
Images of explosives samples are recorded in transmission configuration with the TPS3000
imager. A scan step of 0.5 mm is set for the XY translation stage. Each pixel is a resulting of the
transmitted THz signal at a specific point on the image and the resulting data is a (X,Y,t) 3D matrix.
Then, the same signal processing used on individual transmitted THz pulse discussed before, is
applied to each pixel of the image. So first a FFT is performed on all the pixels given (X,Y,f) 3D
matrix with a frequency ranging between 0.1 and 3 THz and spectral resolution of 6 GHz, thus 469
frequency values are obtained. Then the absorbance is calculated for every pixel in the image and the
resulting matrix is (X,Y,A) formed by the (X,Y) image and the value of the absorbance at each pixel
for the frequencies between 0.1 and 3 THz as shown in Figure II.24 (a) and (b).
Figure II.24 : (a) Transformation diagram of temporal pulse to absorbance for one pixel, (b) 3D
resulting image of the TDS spectral imaging where each pixel corresponds to an absorbance
spectra, (c) unwrapping process transforming 2D matrix to 1D table, (d) resulting 2D matrix
after unwrapping.
The measurement area in the imaging setup is limited to 16×16 mm2, which can fits for
imaging only one pellet. Hence, the final image should contain several samples to compare them. For
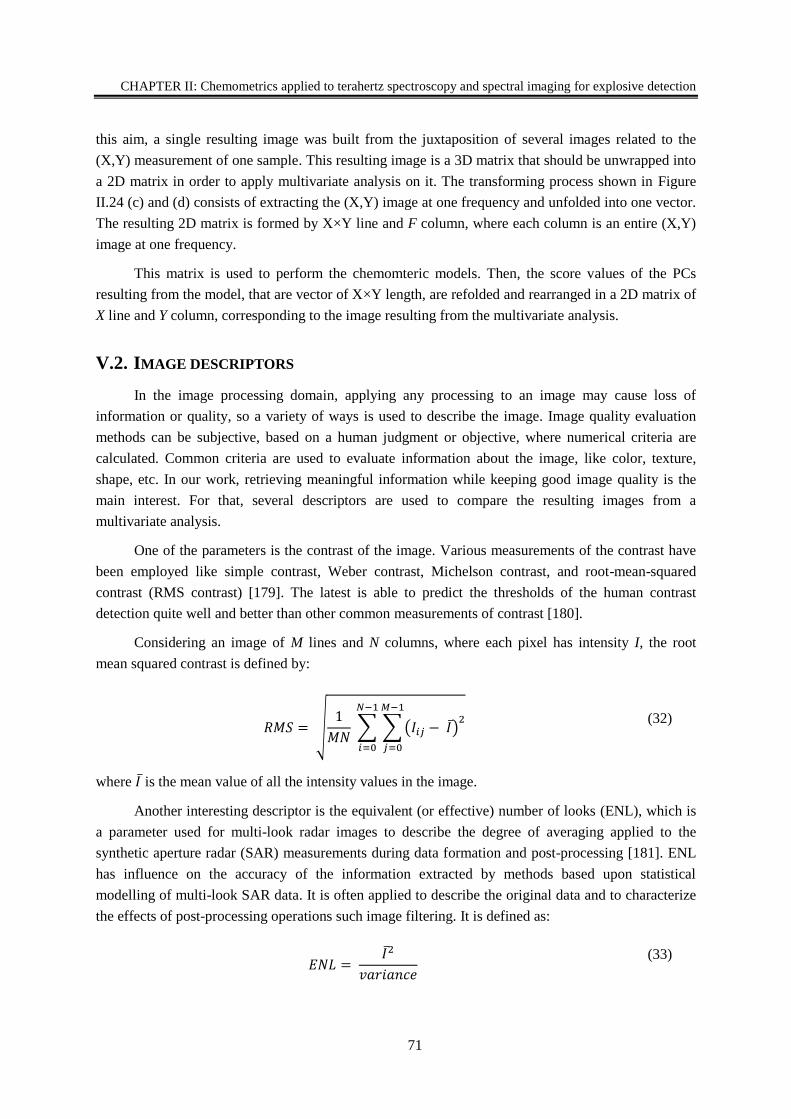
CHAPTER II: Chemometrics applied to terahertz spectroscopy and spectral imaging for explosive detection
71
this aim, a single resulting image was built from the juxtaposition of several images related to the
(X,Y) measurement of one sample. This resulting image is a 3D matrix that should be unwrapped into
a 2D matrix in order to apply multivariate analysis on it. The transforming process shown in Figure
II.24 (c) and (d) consists of extracting the (X,Y) image at one frequency and unfolded into one vector.
The resulting 2D matrix is formed by X×Y line and F column, where each column is an entire (X,Y)
image at one frequency.
This matrix is used to perform the chemomteric models. Then, the score values of the PCs
resulting from the model, that are vector of X×Y length, are refolded and rearranged in a 2D matrix of
X line and Y column, corresponding to the image resulting from the multivariate analysis.
V.2. IMAGE DESCRIPTORS
In the image processing domain, applying any processing to an image may cause loss of
information or quality, so a variety of ways is used to describe the image. Image quality evaluation
methods can be subjective, based on a human judgment or objective, where numerical criteria are
calculated. Common criteria are used to evaluate information about the image, like color, texture,
shape, etc. In our work, retrieving meaningful information while keeping good image quality is the
main interest. For that, several descriptors are used to compare the resulting images from a
multivariate analysis.
One of the parameters is the contrast of the image. Various measurements of the contrast have
been employed like simple contrast, Weber contrast, Michelson contrast, and root-mean-squared
contrast (RMS contrast) [179]. The latest is able to predict the thresholds of the human contrast
detection quite well and better than other common measurements of contrast [180].
Considering an image of M lines and N columns, where each pixel has intensity I, the root
mean squared contrast is defined by:
𝑅𝑀𝑆 = √1
𝑀𝑁 ∑ ∑(𝐼𝑖𝑗 − 𝐼)
2𝑀−1
𝑗=0
𝑁−1
𝑖=0
(32)
where 𝐼 is the mean value of all the intensity values in the image.
Another interesting descriptor is the equivalent (or effective) number of looks (ENL), which is
a parameter used for multi-look radar images to describe the degree of averaging applied to the
synthetic aperture radar (SAR) measurements during data formation and post-processing [181]. ENL
has influence on the accuracy of the information extracted by methods based upon statistical
modelling of multi-look SAR data. It is often applied to describe the original data and to characterize
the effects of post-processing operations such image filtering. It is defined as:
𝐸𝑁𝐿 = 𝐼2
𝑣𝑎𝑟𝑖𝑎𝑛𝑐𝑒
(33)
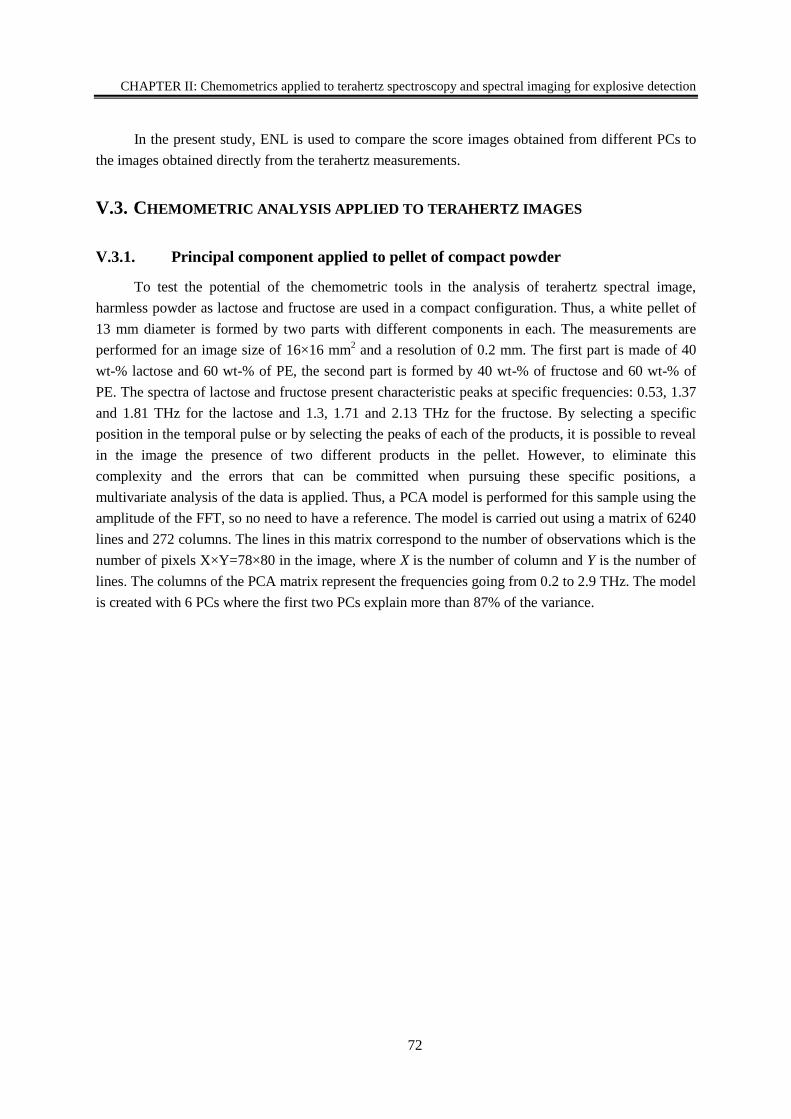
CHAPTER II: Chemometrics applied to terahertz spectroscopy and spectral imaging for explosive detection
72
In the present study, ENL is used to compare the score images obtained from different PCs to
the images obtained directly from the terahertz measurements.
V.3. CHEMOMETRIC ANALYSIS APPLIED TO TERAHERTZ IMAGES
V.3.1. Principal component applied to pellet of compact powder
To test the potential of the chemometric tools in the analysis of terahertz spectral image,
harmless powder as lactose and fructose are used in a compact configuration. Thus, a white pellet of
13 mm diameter is formed by two parts with different components in each. The measurements are
performed for an image size of 16×16 mm2 and a resolution of 0.2 mm. The first part is made of 40
wt-% lactose and 60 wt-% of PE, the second part is formed by 40 wt-% of fructose and 60 wt-% of
PE. The spectra of lactose and fructose present characteristic peaks at specific frequencies: 0.53, 1.37
and 1.81 THz for the lactose and 1.3, 1.71 and 2.13 THz for the fructose. By selecting a specific
position in the temporal pulse or by selecting the peaks of each of the products, it is possible to reveal
in the image the presence of two different products in the pellet. However, to eliminate this
complexity and the errors that can be committed when pursuing these specific positions, a
multivariate analysis of the data is applied. Thus, a PCA model is performed for this sample using the
amplitude of the FFT, so no need to have a reference. The model is carried out using a matrix of 6240
lines and 272 columns. The lines in this matrix correspond to the number of observations which is the
number of pixels X×Y=78×80 in the image, where X is the number of column and Y is the number of
lines. The columns of the PCA matrix represent the frequencies going from 0.2 to 2.9 THz. The model
is created with 6 PCs where the first two PCs explain more than 87% of the variance.
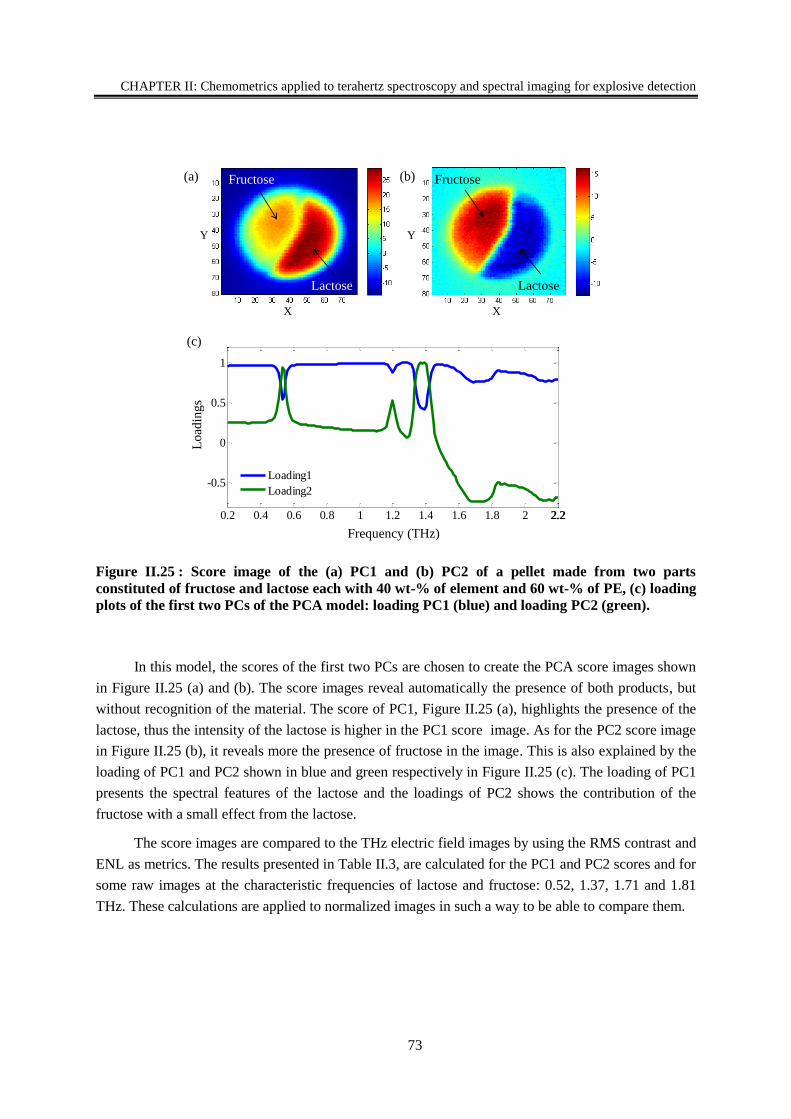
CHAPTER II: Chemometrics applied to terahertz spectroscopy and spectral imaging for explosive detection
73
Figure II.25 : Score image of the (a) PC1 and (b) PC2 of a pellet made from two parts
constituted of fructose and lactose each with 40 wt-% of element and 60 wt-% of PE, (c) loading
plots of the first two PCs of the PCA model: loading PC1 (blue) and loading PC2 (green).
In this model, the scores of the first two PCs are chosen to create the PCA score images shown
in Figure II.25 (a) and (b). The score images reveal automatically the presence of both products, but
without recognition of the material. The score of PC1, Figure II.25 (a), highlights the presence of the
lactose, thus the intensity of the lactose is higher in the PC1 score image. As for the PC2 score image
in Figure II.25 (b), it reveals more the presence of fructose in the image. This is also explained by the
loading of PC1 and PC2 shown in blue and green respectively in Figure II.25 (c). The loading of PC1
presents the spectral features of the lactose and the loadings of PC2 shows the contribution of the
fructose with a small effect from the lactose.
The score images are compared to the THz electric field images by using the RMS contrast and
ENL as metrics. The results presented in Table II.3, are calculated for the PC1 and PC2 scores and for
some raw images at the characteristic frequencies of lactose and fructose: 0.52, 1.37, 1.71 and 1.81
THz. These calculations are applied to normalized images in such a way to be able to compare them.
0.2 0.4 0.6 0.8 1 1.2 1.4 1.6 1.8 2 2.22.2
-0.5
0
0.5
1
Loading1
Loading2
Lo
adin
gs
Frequency (THz)
(a) (b)
(c)
Y Y
X X
Fructose
Lactose
Fructose
Lactose
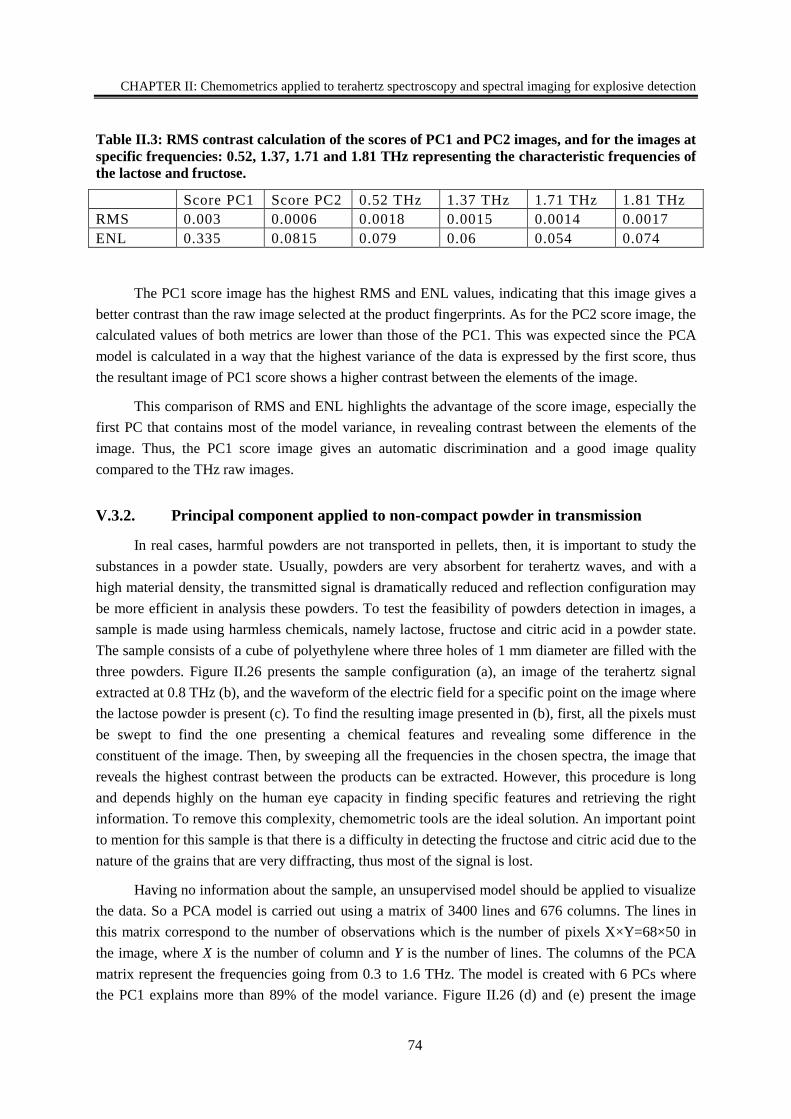
CHAPTER II: Chemometrics applied to terahertz spectroscopy and spectral imaging for explosive detection
74
Table II.3: RMS contrast calculation of the scores of PC1 and PC2 images, and for the images at
specific frequencies: 0.52, 1.37, 1.71 and 1.81 THz representing the characteristic frequencies of
the lactose and fructose.
Score PC1 Score PC2 0.52 THz 1.37 THz 1.71 THz 1.81 THz
RMS 0.003 0.0006 0.0018 0.0015 0.0014 0.0017
ENL 0.335 0.0815 0.079 0.06 0.054 0.074
The PC1 score image has the highest RMS and ENL values, indicating that this image gives a
better contrast than the raw image selected at the product fingerprints. As for the PC2 score image, the
calculated values of both metrics are lower than those of the PC1. This was expected since the PCA
model is calculated in a way that the highest variance of the data is expressed by the first score, thus
the resultant image of PC1 score shows a higher contrast between the elements of the image.
This comparison of RMS and ENL highlights the advantage of the score image, especially the
first PC that contains most of the model variance, in revealing contrast between the elements of the
image. Thus, the PC1 score image gives an automatic discrimination and a good image quality
compared to the THz raw images.
V.3.2. Principal component applied to non-compact powder in transmission
In real cases, harmful powders are not transported in pellets, then, it is important to study the
substances in a powder state. Usually, powders are very absorbent for terahertz waves, and with a
high material density, the transmitted signal is dramatically reduced and reflection configuration may
be more efficient in analysis these powders. To test the feasibility of powders detection in images, a
sample is made using harmless chemicals, namely lactose, fructose and citric acid in a powder state.
The sample consists of a cube of polyethylene where three holes of 1 mm diameter are filled with the
three powders. Figure II.26 presents the sample configuration (a), an image of the terahertz signal
extracted at 0.8 THz (b), and the waveform of the electric field for a specific point on the image where
the lactose powder is present (c). To find the resulting image presented in (b), first, all the pixels must
be swept to find the one presenting a chemical features and revealing some difference in the
constituent of the image. Then, by sweeping all the frequencies in the chosen spectra, the image that
reveals the highest contrast between the products can be extracted. However, this procedure is long
and depends highly on the human eye capacity in finding specific features and retrieving the right
information. To remove this complexity, chemometric tools are the ideal solution. An important point
to mention for this sample is that there is a difficulty in detecting the fructose and citric acid due to the
nature of the grains that are very diffracting, thus most of the signal is lost.
Having no information about the sample, an unsupervised model should be applied to visualize
the data. So a PCA model is carried out using a matrix of 3400 lines and 676 columns. The lines in
this matrix correspond to the number of observations which is the number of pixels X×Y=68×50 in
the image, where X is the number of column and Y is the number of lines. The columns of the PCA
matrix represent the frequencies going from 0.3 to 1.6 THz. The model is created with 6 PCs where
the PC1 explains more than 89% of the model variance. Figure II.26 (d) and (e) present the image
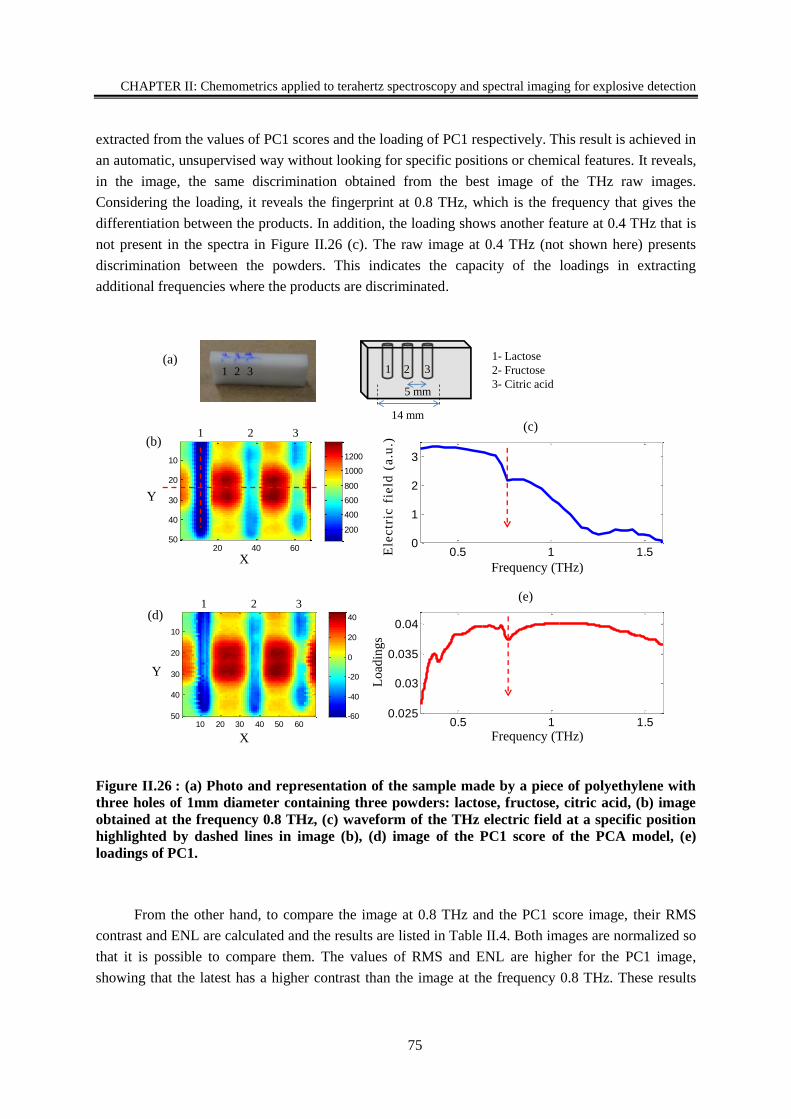
CHAPTER II: Chemometrics applied to terahertz spectroscopy and spectral imaging for explosive detection
75
extracted from the values of PC1 scores and the loading of PC1 respectively. This result is achieved in
an automatic, unsupervised way without looking for specific positions or chemical features. It reveals,
in the image, the same discrimination obtained from the best image of the THz raw images.
Considering the loading, it reveals the fingerprint at 0.8 THz, which is the frequency that gives the
differentiation between the products. In addition, the loading shows another feature at 0.4 THz that is
not present in the spectra in Figure II.26 (c). The raw image at 0.4 THz (not shown here) presents
discrimination between the powders. This indicates the capacity of the loadings in extracting
additional frequencies where the products are discriminated.
Figure II.26 : (a) Photo and representation of the sample made by a piece of polyethylene with
three holes of 1mm diameter containing three powders: lactose, fructose, citric acid, (b) image
obtained at the frequency 0.8 THz, (c) waveform of the THz electric field at a specific position
highlighted by dashed lines in image (b), (d) image of the PC1 score of the PCA model, (e)
loadings of PC1.
From the other hand, to compare the image at 0.8 THz and the PC1 score image, their RMS
contrast and ENL are calculated and the results are listed in Table II.4. Both images are normalized so
that it is possible to compare them. The values of RMS and ENL are higher for the PC1 image,
showing that the latest has a higher contrast than the image at the frequency 0.8 THz. These results
1- Lactose
2- Fructose
3- Citric acid
1 32
5 mm
14 mm
10 20 30 40 50 60
10
20
30
40
50 -60
-40
-20
0
20
40(d)
(e)
1 32
0.5 1 1.50
1
2
3
Ele
ctr
ic f
ield
(a
.u.)
Frequency (THz)
20 40 60
10
20
30
40
50200
400
600
800
1000
1200
(a)
(b)(c)
0.5 1 1.50.025
0.03
0.035
0.04
Frequency (THz)
X
Y
X
Y
Load
ing
s
2 31
2 31
CHAPTER II: Chemometrics applied to terahertz spectroscopy and spectral imaging for explosive detection
76
demonstrate the potential of PCA in providing automatic discrimination of product in a powder state
in image with a better contrast.
Table II.4: RMS contrast calculation in the case of the sample made of pure powder, for the
image extracted at 0.8 THz from the terahertz signal, and the score image of PC1 and PC2 for
normalized data.
Score PC1 Frequency 0.8 THz
RMS 0.0014 0.0012
ENL 1.429 1.262
V.3.3. Principal component applied to non-compact powder in reflection
Another test on powders in a non-compact state is made in reflection mode. The analysis of the
signal in reflection is more complex, but this configuration is more suitable for real-life situations
such as postal chain inspection. Figure II.27 (a) represents the sample made of five powders inside a
plastic box. The studied powders are formed by three elements in pure sate namely lactose (1),
fructose (2), citric acid (3) and two mixtures of lactose with fructose (4) and lactose with citric acid
(5). The spectra of the pure samples shown in Figure II.27 (b), obtained from measurements in
reflection, present no significant fingerprints that can be recognized by the eye. In order to test the
performance of chemometric tools in differentiating the powders even when their spectra presents no
significant peaks, a PCA model is build using the reflection spectra of 45 observations corresponding
to the number of pixels in the center of each one of the five components of the image, between 0.1
and 2.7 THz. The first two principal components explain more than 78 % of the variance in the model.
Thus, the score plot of these two PCs, presented in Figure II.27 (c), reveals the highest variance
among the data. Despite the impossibility to recognize the powders from their spectra presented in
Figure II.27 (b), the score plot was able to qualitatively separate them in groups. Along the PC1 score,
the data are divided into two groups: with and without lactose. Those with lactose, pure or mixture,
presented in red, orange and grey, are localized in the left side of the PC1 score axis. As for the
powder without lactose, they present anti-correlation with the first set, and are projected on the right
side of the PC1 score axis, presented in blue and green.
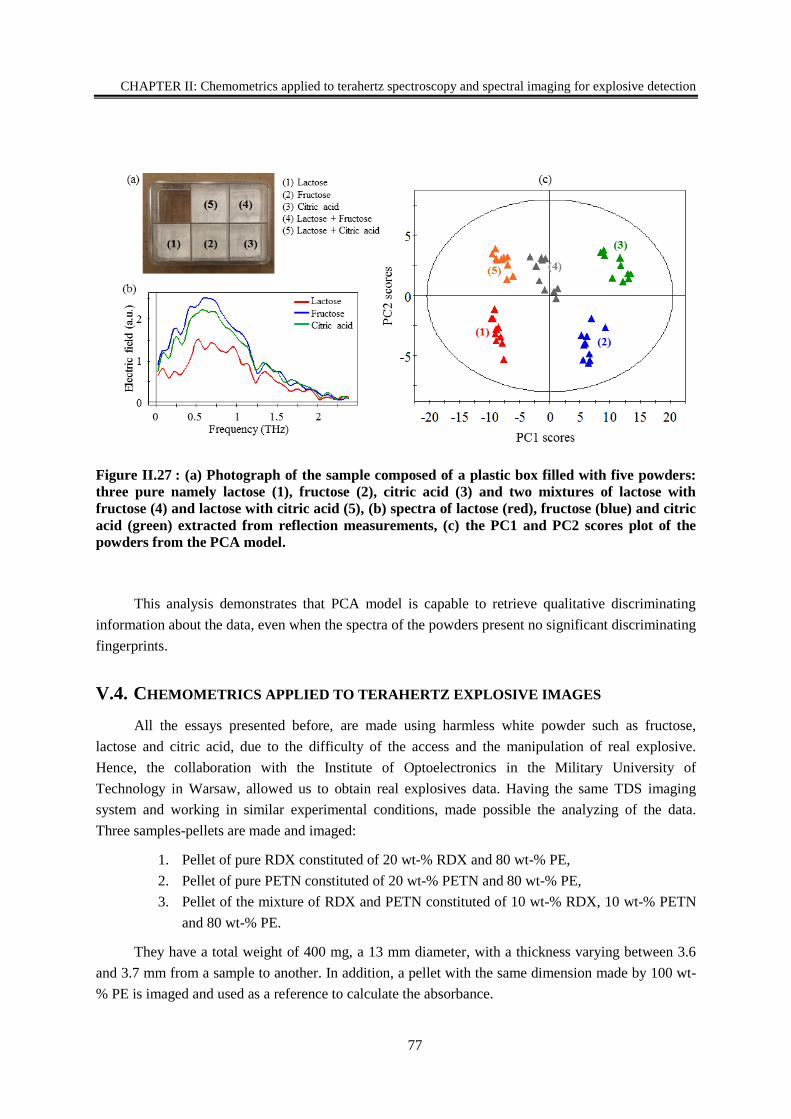
CHAPTER II: Chemometrics applied to terahertz spectroscopy and spectral imaging for explosive detection
77
Figure II.27 : (a) Photograph of the sample composed of a plastic box filled with five powders:
three pure namely lactose (1), fructose (2), citric acid (3) and two mixtures of lactose with
fructose (4) and lactose with citric acid (5), (b) spectra of lactose (red), fructose (blue) and citric
acid (green) extracted from reflection measurements, (c) the PC1 and PC2 scores plot of the
powders from the PCA model.
This analysis demonstrates that PCA model is capable to retrieve qualitative discriminating
information about the data, even when the spectra of the powders present no significant discriminating
fingerprints.
V.4. CHEMOMETRICS APPLIED TO TERAHERTZ EXPLOSIVE IMAGES
All the essays presented before, are made using harmless white powder such as fructose,
lactose and citric acid, due to the difficulty of the access and the manipulation of real explosive.
Hence, the collaboration with the Institute of Optoelectronics in the Military University of
Technology in Warsaw, allowed us to obtain real explosives data. Having the same TDS imaging
system and working in similar experimental conditions, made possible the analyzing of the data.
Three samples-pellets are made and imaged:
1. Pellet of pure RDX constituted of 20 wt-% RDX and 80 wt-% PE,
2. Pellet of pure PETN constituted of 20 wt-% PETN and 80 wt-% PE,
3. Pellet of the mixture of RDX and PETN constituted of 10 wt-% RDX, 10 wt-% PETN
and 80 wt-% PE.
They have a total weight of 400 mg, a 13 mm diameter, with a thickness varying between 3.6
and 3.7 mm from a sample to another. In addition, a pellet with the same dimension made by 100 wt-
% PE is imaged and used as a reference to calculate the absorbance.
CHAPTER II: Chemometrics applied to terahertz spectroscopy and spectral imaging for explosive detection
78
Terahertz time-domain spectral-imaging measurements were realized in transmission mode via
the THz-TDS spectral-imager with a step of 0.5 mm on the XY translation stage. Being limited in the
scanning area, each pellet of 22*22 pixels is imaged separately. A single synthetized image was built
from the juxtaposition of the three images related to the three samples. This final image is composed
of 22*66 pixels. The recorded data corresponds to the temporal pulse at each pixel on the image. Then
an FFT is applied to the signal to calculate the transfer function, using the FFT of the PE pellet. This
allows calculating the absorbance values of the components of the final image between 0 and 3 THz
with a frequency resolution of 6 GHz.
This acquisition produces a 3D matrix of (X,Y) pixels and one absorbance information at each
pixel. It is unwrapped as shown in Figure II.24 to obtain a 2D matrix of 1452 lines corresponding to
each X×Y pixel and F column representing the 486 frequency values. This matrix is used to perform
the chemometric models.
V.4.1. Description by principal component analysis
First, a PCA model is performed to visualize our data. This step is necessary when facing an
unknown object. It enables the recognition of the sample, and can highlight similarities between the
constituents of the image. The PCA model is created with 1452 observations (the pixels) and 469
variables (the frequencies), where the frequencies between 0 and 0.1 THz are retrieved from the raw
matrix because they add only noise. Two scales are tested on the samples: the center scale and unit
variance (UV) scale. The PC1 and PC2 in the UV model explain respectively more than 43% and
18% of the variance in the model. As for the center scaled model, the PC1 and PC2 variances are
more than 49% and 24% respectively. For each case, the score plot in the plane of the first two
components is displayed in Figure II.28 (a) for the UV scale and in Figure II.28 (b) for the center
scale. In this plot, the observations, corresponding to the pixels in the image, are organized into three
main groups of points corresponding to the three types of explosives, namely RDX (red), PETN (blue)
and mixture of both (green). Moreover, the points displayed in black correspond to the background
values and this is why they are widely spread on this plot. The background values are related to pixels
of the image located outside the pellets, which consequently don’t bring significant spectral
information. Both plots show the same accuracy and are able to reveal the presence of three different
groups of substances. However, to correctly understand the model, the loadings of the first two PCs
are plotted for both scales, for the frequency band [0.1-3] THz. Figure II.28 (c) and (d) display the
loadings of the PC1 (black) and PC2 (red) of the UV and the center scale models respectively. The
loadings of the centered model have more similarities with the absorbance spectra of the samples
presented in Figure II.21. Loading 1 shows that the fingerprints of RDX and PETN around 0.8 and 2
THz respectively, are anti-correlated. This is well explained in Figure II.28 (b) where the PETN
scores have negative values and RDX have positive ones. As for the loading 2 in the centered model,
it reveals more the presence of RDX. By comparing the two scales, the centered model describes our
data. It should be noted that the absorbance spectra obtained by imaging present more noise than the
spectra obtained in Figure II.21 and it affects the loading results of the PCA that present noise after
1.5 THz. This is due to the fact that the apodization function was not applied to the images and the
averaging was reduced to over 500 repetitions per spectra to minimize the measurement time.
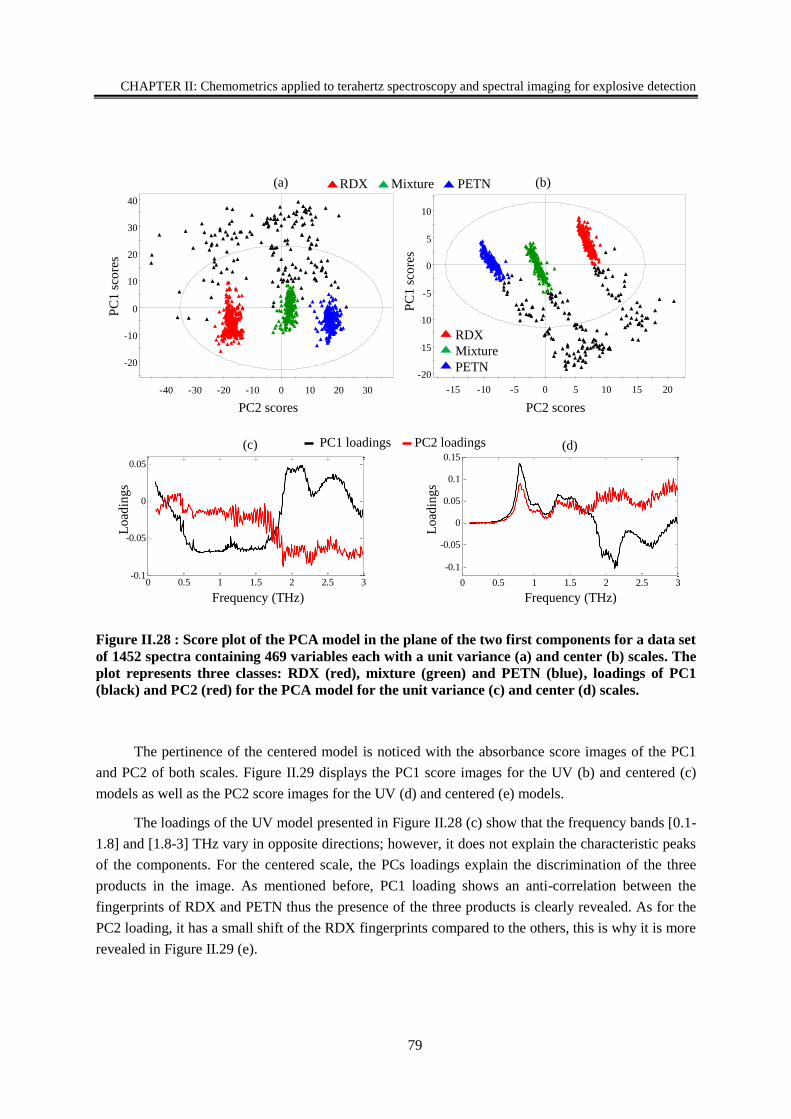
CHAPTER II: Chemometrics applied to terahertz spectroscopy and spectral imaging for explosive detection
79
Figure II.28 : Score plot of the PCA model in the plane of the two first components for a data set
of 1452 spectra containing 469 variables each with a unit variance (a) and center (b) scales. The
plot represents three classes: RDX (red), mixture (green) and PETN (blue), loadings of PC1
(black) and PC2 (red) for the PCA model for the unit variance (c) and center (d) scales.
The pertinence of the centered model is noticed with the absorbance score images of the PC1
and PC2 of both scales. Figure II.29 displays the PC1 score images for the UV (b) and centered (c)
models as well as the PC2 score images for the UV (d) and centered (e) models.
The loadings of the UV model presented in Figure II.28 (c) show that the frequency bands [0.1-
1.8] and [1.8-3] THz vary in opposite directions; however, it does not explain the characteristic peaks
of the components. For the centered scale, the PCs loadings explain the discrimination of the three
products in the image. As mentioned before, PC1 loading shows an anti-correlation between the
fingerprints of RDX and PETN thus the presence of the three products is clearly revealed. As for the
PC2 loading, it has a small shift of the RDX fingerprints compared to the others, this is why it is more
revealed in Figure II.29 (e).
-20
-10
0
10
20
30
40
-40 -30 -20 -10 0 10 20 30
t[2
]
t[1]
E2_E12_E18_linéarisé_absorbance_2.M1 (PCA-X)
t[Comp. 1]/t[Comp. 2]
R2X[1] = 0,435631 R2X[2] = 0,186618 Ellipse: Hotelling T2 (0,95)
SIMCA-P+ 12.0.1 - 2016-03-31 10:54:06 (UTC+1)
-20
-15
-10
-5
0
5
10
-15 -10 -5 0 5 10 15 20
t[2]
t[1]
E2_E12_E18_linéarisé_absorbance_2.M10 (PCA-X)
t[Comp. 1]/t[Comp. 2]
R2X[1] = 0,490305 R2X[2] = 0,24293 Ellipse: Hotelling T2 (0,95)
SIMCA-P+ 12.0.1 - 2016-03-31 10:56:16 (UTC+1)
(a) (b)
0 0.5 1 1.5 2 2.5 3
x 1012
-0.1
-0.05
0
0.05
(c)
Lo
adin
gs
Frequency (THz)
0 0.5 1 1.5 2 2.5 3
x 1012
-0.1
-0.05
0
0.05
0.1
0.15(d)
Frequency (THz)
Lo
adin
gs
PC
1 s
core
s
PC
1 s
core
sPC2 scores PC2 scores
RDX
Mixture
PETN
PC1 loadings PC2 loadings
RDX Mixture PETN
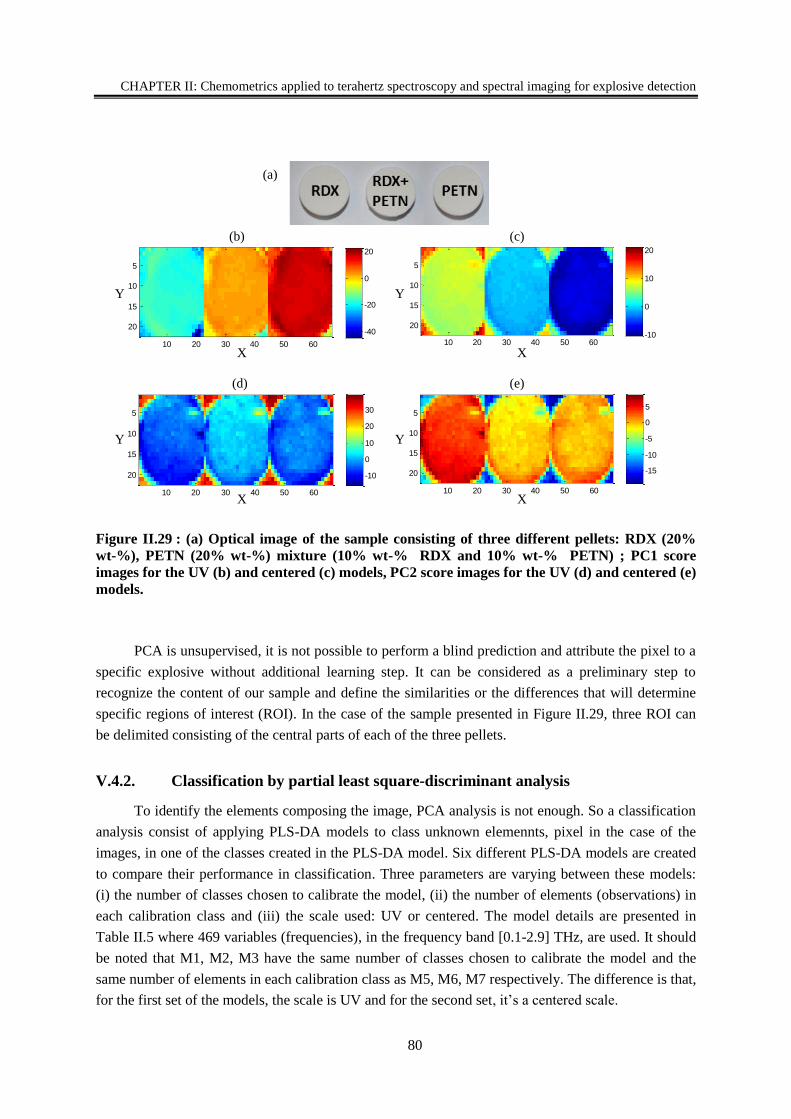
CHAPTER II: Chemometrics applied to terahertz spectroscopy and spectral imaging for explosive detection
80
Figure II.29 : (a) Optical image of the sample consisting of three different pellets: RDX (20%
wt-%), PETN (20% wt-%) mixture (10% wt-% RDX and 10% wt-% PETN) ; PC1 score
images for the UV (b) and centered (c) models, PC2 score images for the UV (d) and centered (e)
models.
PCA is unsupervised, it is not possible to perform a blind prediction and attribute the pixel to a
specific explosive without additional learning step. It can be considered as a preliminary step to
recognize the content of our sample and define the similarities or the differences that will determine
specific regions of interest (ROI). In the case of the sample presented in Figure II.29, three ROI can
be delimited consisting of the central parts of each of the three pellets.
V.4.2. Classification by partial least square-discriminant analysis
To identify the elements composing the image, PCA analysis is not enough. So a classification
analysis consist of applying PLS-DA models to class unknown elemennts, pixel in the case of the
images, in one of the classes created in the PLS-DA model. Six different PLS-DA models are created
to compare their performance in classification. Three parameters are varying between these models:
(i) the number of classes chosen to calibrate the model, (ii) the number of elements (observations) in
each calibration class and (iii) the scale used: UV or centered. The model details are presented in
Table II.5 where 469 variables (frequencies), in the frequency band [0.1-2.9] THz, are used. It should
be noted that M1, M2, M3 have the same number of classes chosen to calibrate the model and the
same number of elements in each calibration class as M5, M6, M7 respectively. The difference is that,
for the first set of the models, the scale is UV and for the second set, it’s a centered scale.
10 20 30 40 50 60
5
10
15
20-40
-20
0
20
10 20 30 40 50 60
5
10
15
20-10
0
10
20
10 20 30 40 50 60
5
10
15
20 -10
0
10
20
30
10 20 30 40 50 60
5
10
15
20 -15
-10
-5
0
5
X
Y
X
Y
X
Y
X
Y
(b) (c)
(d) (e)
(a)
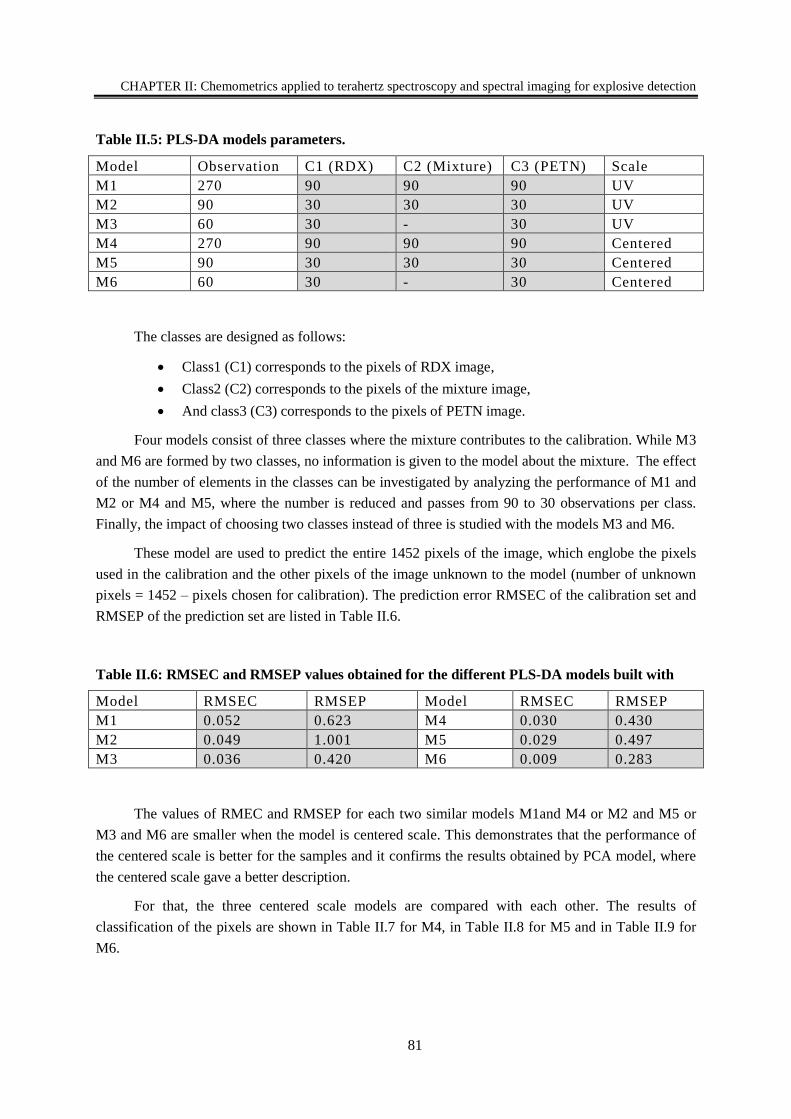
CHAPTER II: Chemometrics applied to terahertz spectroscopy and spectral imaging for explosive detection
81
Table II.5: PLS-DA models parameters.
Model Observation C1 (RDX) C2 (Mixture) C3 (PETN) Scale
M1 270 90 90 90 UV
M2 90 30 30 30 UV
M3 60 30 - 30 UV
M4 270 90 90 90 Centered
M5 90 30 30 30 Centered
M6 60 30 - 30 Centered
The classes are designed as follows:
Class1 (C1) corresponds to the pixels of RDX image,
Class2 (C2) corresponds to the pixels of the mixture image,
And class3 (C3) corresponds to the pixels of PETN image.
Four models consist of three classes where the mixture contributes to the calibration. While M3
and M6 are formed by two classes, no information is given to the model about the mixture. The effect
of the number of elements in the classes can be investigated by analyzing the performance of M1 and
M2 or M4 and M5, where the number is reduced and passes from 90 to 30 observations per class.
Finally, the impact of choosing two classes instead of three is studied with the models M3 and M6.
These model are used to predict the entire 1452 pixels of the image, which englobe the pixels
used in the calibration and the other pixels of the image unknown to the model (number of unknown
pixels = 1452 – pixels chosen for calibration). The prediction error RMSEC of the calibration set and
RMSEP of the prediction set are listed in Table II.6.
Table II.6: RMSEC and RMSEP values obtained for the different PLS-DA models built with
Model RMSEC RMSEP Model RMSEC RMSEP
M1 0.052 0.623 M4 0.030 0.430
M2 0.049 1.001 M5 0.029 0.497
M3 0.036 0.420 M6 0.009 0.283
The values of RMEC and RMSEP for each two similar models M1and M4 or M2 and M5 or
M3 and M6 are smaller when the model is centered scale. This demonstrates that the performance of
the centered scale is better for the samples and it confirms the results obtained by PCA model, where
the centered scale gave a better description.
For that, the three centered scale models are compared with each other. The results of
classification of the pixels are shown in Table II.7 for M4, in Table II.8 for M5 and in Table II.9 for
M6.
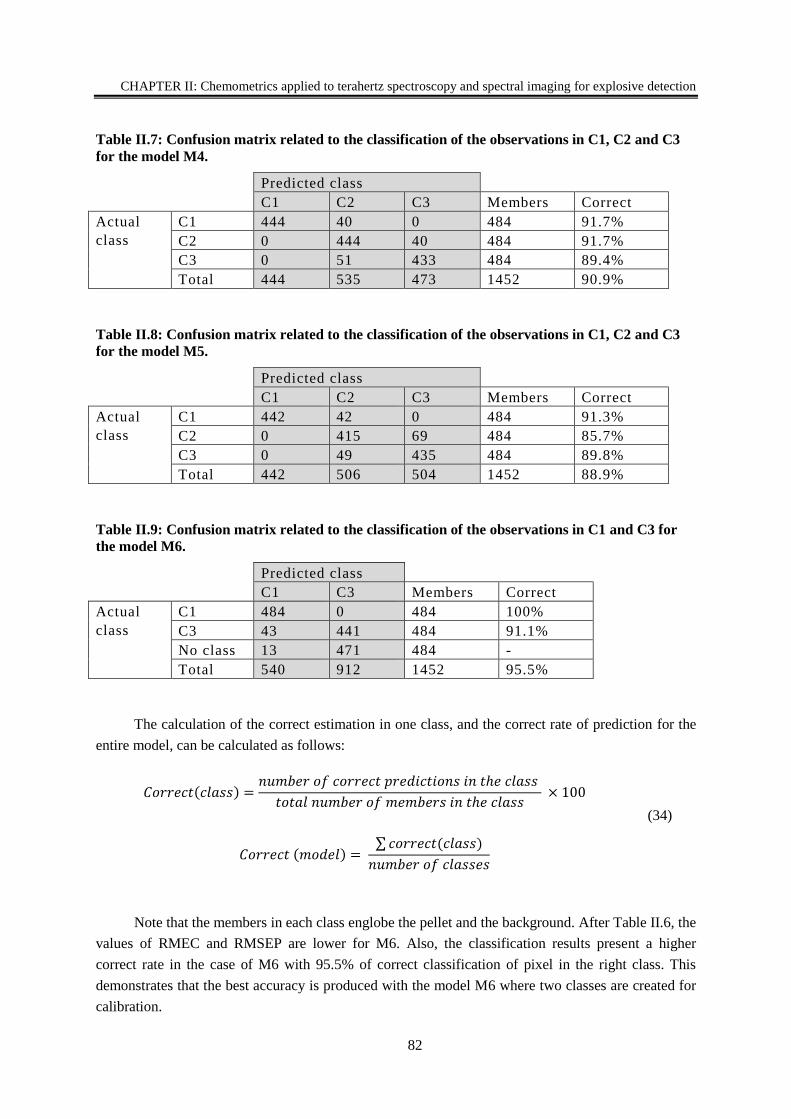
CHAPTER II: Chemometrics applied to terahertz spectroscopy and spectral imaging for explosive detection
82
Table II.7: Confusion matrix related to the classification of the observations in C1, C2 and C3
for the model M4.
Predicted class
C1 C2 C3 Members Correct
Actual
class
C1 444 40 0 484 91.7%
C2 0 444 40 484 91.7%
C3 0 51 433 484 89.4%
Total 444 535 473 1452 90.9%
Table II.8: Confusion matrix related to the classification of the observations in C1, C2 and C3
for the model M5.
Predicted class
C1 C2 C3 Members Correct
Actual
class
C1 442 42 0 484 91.3%
C2 0 415 69 484 85.7%
C3 0 49 435 484 89.8%
Total 442 506 504 1452 88.9%
Table II.9: Confusion matrix related to the classification of the observations in C1 and C3 for
the model M6.
Predicted class
C1 C3 Members Correct
Actual
class
C1 484 0 484 100%
C3 43 441 484 91.1%
No class 13 471 484 -
Total 540 912 1452 95.5%
The calculation of the correct estimation in one class, and the correct rate of prediction for the
entire model, can be calculated as follows:
𝐶𝑜𝑟𝑟𝑒𝑐𝑡(𝑐𝑙𝑎𝑠𝑠) =𝑛𝑢𝑚𝑏𝑒𝑟 𝑜𝑓 𝑐𝑜𝑟𝑟𝑒𝑐𝑡 𝑝𝑟𝑒𝑑𝑖𝑐𝑡𝑖𝑜𝑛𝑠 𝑖𝑛 𝑡ℎ𝑒 𝑐𝑙𝑎𝑠𝑠
𝑡𝑜𝑡𝑎𝑙 𝑛𝑢𝑚𝑏𝑒𝑟 𝑜𝑓 𝑚𝑒𝑚𝑏𝑒𝑟𝑠 𝑖𝑛 𝑡ℎ𝑒 𝑐𝑙𝑎𝑠𝑠 × 100
𝐶𝑜𝑟𝑟𝑒𝑐𝑡 (𝑚𝑜𝑑𝑒𝑙) = ∑ 𝑐𝑜𝑟𝑟𝑒𝑐𝑡(𝑐𝑙𝑎𝑠𝑠)
𝑛𝑢𝑚𝑏𝑒𝑟 𝑜𝑓 𝑐𝑙𝑎𝑠𝑠𝑒𝑠
(34)
Note that the members in each class englobe the pellet and the background. After Table II.6, the
values of RMEC and RMSEP are lower for M6. Also, the classification results present a higher
correct rate in the case of M6 with 95.5% of correct classification of pixel in the right class. This
demonstrates that the best accuracy is produced with the model M6 where two classes are created for
calibration.
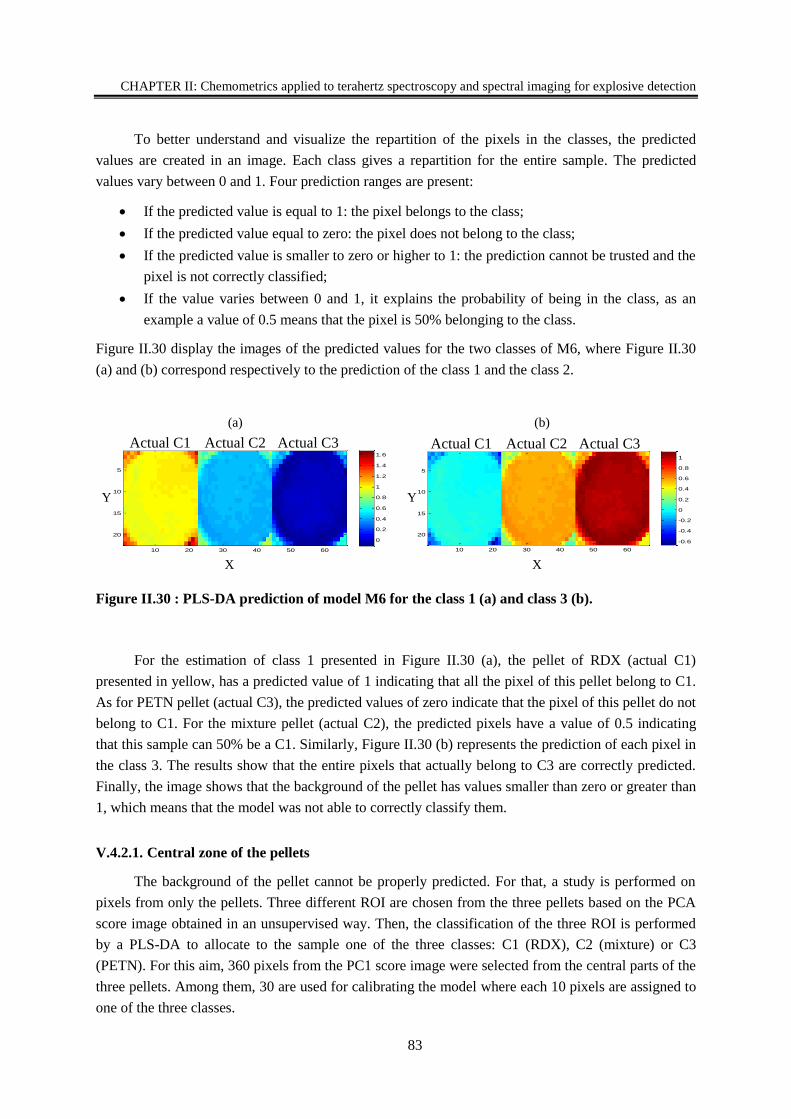
CHAPTER II: Chemometrics applied to terahertz spectroscopy and spectral imaging for explosive detection
83
To better understand and visualize the repartition of the pixels in the classes, the predicted
values are created in an image. Each class gives a repartition for the entire sample. The predicted
values vary between 0 and 1. Four prediction ranges are present:
If the predicted value is equal to 1: the pixel belongs to the class;
If the predicted value equal to zero: the pixel does not belong to the class;
If the predicted value is smaller to zero or higher to 1: the prediction cannot be trusted and the
pixel is not correctly classified;
If the value varies between 0 and 1, it explains the probability of being in the class, as an
example a value of 0.5 means that the pixel is 50% belonging to the class.
Figure II.30 display the images of the predicted values for the two classes of M6, where Figure II.30
(a) and (b) correspond respectively to the prediction of the class 1 and the class 2.
Figure II.30 : PLS-DA prediction of model M6 for the class 1 (a) and class 3 (b).
For the estimation of class 1 presented in Figure II.30 (a), the pellet of RDX (actual C1)
presented in yellow, has a predicted value of 1 indicating that all the pixel of this pellet belong to C1.
As for PETN pellet (actual C3), the predicted values of zero indicate that the pixel of this pellet do not
belong to C1. For the mixture pellet (actual C2), the predicted pixels have a value of 0.5 indicating
that this sample can 50% be a C1. Similarly, Figure II.30 (b) represents the prediction of each pixel in
the class 3. The results show that the entire pixels that actually belong to C3 are correctly predicted.
Finally, the image shows that the background of the pellet has values smaller than zero or greater than
1, which means that the model was not able to correctly classify them.
V.4.2.1. Central zone of the pellets
The background of the pellet cannot be properly predicted. For that, a study is performed on
pixels from only the pellets. Three different ROI are chosen from the three pellets based on the PCA
score image obtained in an unsupervised way. Then, the classification of the three ROI is performed
by a PLS-DA to allocate to the sample one of the three classes: C1 (RDX), C2 (mixture) or C3
(PETN). For this aim, 360 pixels from the PC1 score image were selected from the central parts of the
three pellets. Among them, 30 are used for calibrating the model where each 10 pixels are assigned to
one of the three classes.
10 20 30 40 50 60
5
10
15
20
-0.6
-0.4
-0.2
0
0.2
0.4
0.6
0.8
1
X
Y
(a) (b)
10 20 30 40 50 60
5
10
15
200
0.2
0.4
0.6
0.8
1
1.2
1.4
1.6
X
Y
Actual C1 Actual C2 Actual C3 Actual C1 Actual C2 Actual C3
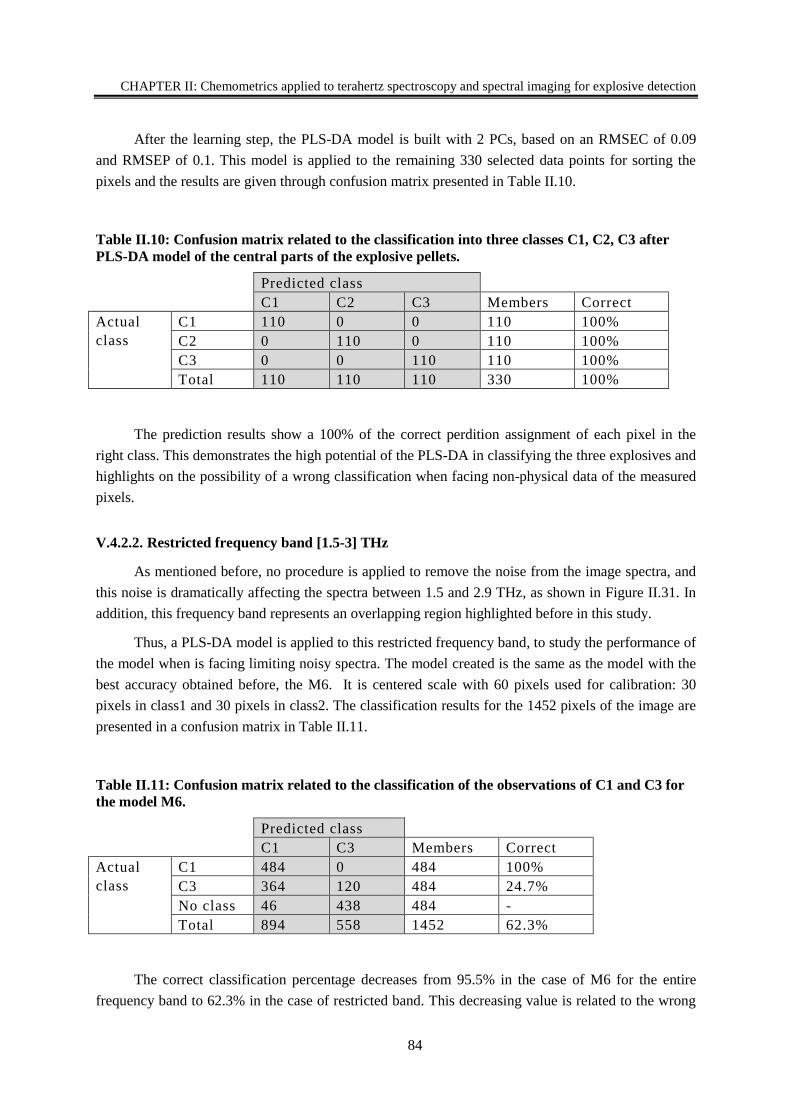
CHAPTER II: Chemometrics applied to terahertz spectroscopy and spectral imaging for explosive detection
84
After the learning step, the PLS-DA model is built with 2 PCs, based on an RMSEC of 0.09
and RMSEP of 0.1. This model is applied to the remaining 330 selected data points for sorting the
pixels and the results are given through confusion matrix presented in Table II.10.
Table II.10: Confusion matrix related to the classification into three classes C1, C2, C3 after
PLS-DA model of the central parts of the explosive pellets.
Predicted class
C1 C2 C3 Members Correct
Actual
class
C1 110 0 0 110 100%
C2 0 110 0 110 100%
C3 0 0 110 110 100%
Total 110 110 110 330 100%
The prediction results show a 100% of the correct perdition assignment of each pixel in the
right class. This demonstrates the high potential of the PLS-DA in classifying the three explosives and
highlights on the possibility of a wrong classification when facing non-physical data of the measured
pixels.
V.4.2.2. Restricted frequency band [1.5-3] THz
As mentioned before, no procedure is applied to remove the noise from the image spectra, and
this noise is dramatically affecting the spectra between 1.5 and 2.9 THz, as shown in Figure II.31. In
addition, this frequency band represents an overlapping region highlighted before in this study.
Thus, a PLS-DA model is applied to this restricted frequency band, to study the performance of
the model when is facing limiting noisy spectra. The model created is the same as the model with the
best accuracy obtained before, the M6. It is centered scale with 60 pixels used for calibration: 30
pixels in class1 and 30 pixels in class2. The classification results for the 1452 pixels of the image are
presented in a confusion matrix in Table II.11.
Table II.11: Confusion matrix related to the classification of the observations of C1 and C3 for
the model M6.
Predicted class
C1 C3 Members Correct
Actual
class
C1 484 0 484 100%
C3 364 120 484 24.7%
No class 46 438 484 -
Total 894 558 1452 62.3%
The correct classification percentage decreases from 95.5% in the case of M6 for the entire
frequency band to 62.3% in the case of restricted band. This decreasing value is related to the wrong
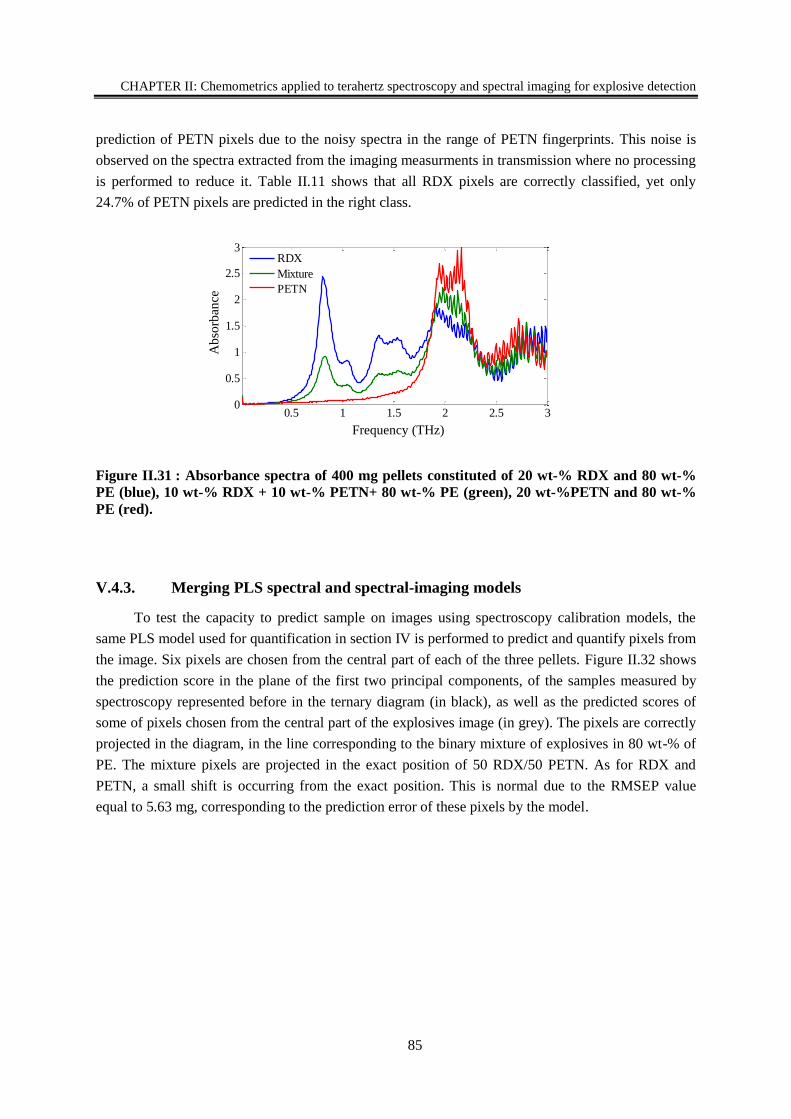
CHAPTER II: Chemometrics applied to terahertz spectroscopy and spectral imaging for explosive detection
85
prediction of PETN pixels due to the noisy spectra in the range of PETN fingerprints. This noise is
observed on the spectra extracted from the imaging measurments in transmission where no processing
is performed to reduce it. Table II.11 shows that all RDX pixels are correctly classified, yet only
24.7% of PETN pixels are predicted in the right class.
Figure II.31 : Absorbance spectra of 400 mg pellets constituted of 20 wt-% RDX and 80 wt-%
PE (blue), 10 wt-% RDX + 10 wt-% PETN+ 80 wt-% PE (green), 20 wt-%PETN and 80 wt-%
PE (red).
V.4.3. Merging PLS spectral and spectral-imaging models
To test the capacity to predict sample on images using spectroscopy calibration models, the
same PLS model used for quantification in section IV is performed to predict and quantify pixels from
the image. Six pixels are chosen from the central part of each of the three pellets. Figure II.32 shows
the prediction score in the plane of the first two principal components, of the samples measured by
spectroscopy represented before in the ternary diagram (in black), as well as the predicted scores of
some of pixels chosen from the central part of the explosives image (in grey). The pixels are correctly
projected in the diagram, in the line corresponding to the binary mixture of explosives in 80 wt-% of
PE. The mixture pixels are projected in the exact position of 50 RDX/50 PETN. As for RDX and
PETN, a small shift is occurring from the exact position. This is normal due to the RMSEP value
equal to 5.63 mg, corresponding to the prediction error of these pixels by the model.
0.5 1 1.5 2 2.5 3
x 1012
0
0.5
1
1.5
2
2.5
3
RDX
Mixture
PETN
Ab
sorb
ance
Frequency (THz)
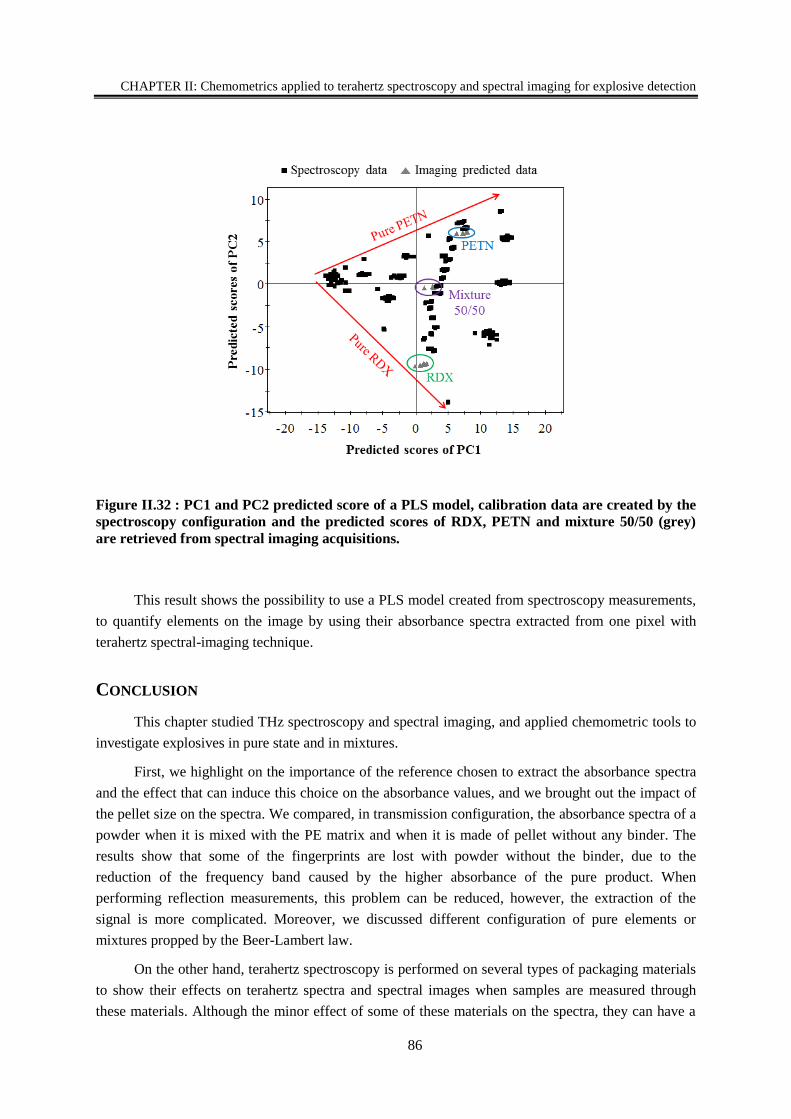
CHAPTER II: Chemometrics applied to terahertz spectroscopy and spectral imaging for explosive detection
86
Figure II.32 : PC1 and PC2 predicted score of a PLS model, calibration data are created by the
spectroscopy configuration and the predicted scores of RDX, PETN and mixture 50/50 (grey)
are retrieved from spectral imaging acquisitions.
This result shows the possibility to use a PLS model created from spectroscopy measurements,
to quantify elements on the image by using their absorbance spectra extracted from one pixel with
terahertz spectral-imaging technique.
CONCLUSION
This chapter studied THz spectroscopy and spectral imaging, and applied chemometric tools to
investigate explosives in pure state and in mixtures.
First, we highlight on the importance of the reference chosen to extract the absorbance spectra
and the effect that can induce this choice on the absorbance values, and we brought out the impact of
the pellet size on the spectra. We compared, in transmission configuration, the absorbance spectra of a
powder when it is mixed with the PE matrix and when it is made of pellet without any binder. The
results show that some of the fingerprints are lost with powder without the binder, due to the
reduction of the frequency band caused by the higher absorbance of the pure product. When
performing reflection measurements, this problem can be reduced, however, the extraction of the
signal is more complicated. Moreover, we discussed different configuration of pure elements or
mixtures propped by the Beer-Lambert law.
On the other hand, terahertz spectroscopy is performed on several types of packaging materials
to show their effects on terahertz spectra and spectral images when samples are measured through
these materials. Although the minor effect of some of these materials on the spectra, they can have a
CHAPTER II: Chemometrics applied to terahertz spectroscopy and spectral imaging for explosive detection
87
destructive impact on the spectral images and lead to a wrong interpretation of the content of the
image. Generally, careful attention must be paid for multilayered spectroscopy analysis without
precise information of the different layers.
Moreover, we demonstrate the potential of chemometrics applied to THz spectra in describing
and quantifying data of pure and mixed explosive, by using partial least square analysis. By
performing a quantitative PLS2 model, we were able to predict the concentration of pure explosives
and mixtures, with an impressive RMSEP value of 3.4 mg. We demonstrated that a PLS2 model
applied to these data has better performance than PLS1. Also, we showed that even by reducing the
frequency band of analyses to a region, where an overlap between the different spectra is present, we
are able to predict the concentration with an acceptable RMSEP of 4.8 mg.
For the imaging application, we demonstrated by using two metrics, RMS contrast and ENL,
that the quality of the images resulting from a PCA model is better than the raw images chosen near
the fingerprint frequency of the products. This demonstration is performed for two different samples:
compact and non-compact powders.
As for explosive samples, and based on the successful results of chemometrics applied to
spectra, we applied the same methods on THz spectral images. First, the PCA model is performed on
unknown data, to understand, compress the data and visualize the image. It was able to reveal three
different products in the image, and allows choosing three regions of interest to carry out, supervised
analysis, in order to define the nature and the concentration of the three components in the image.
Then, the results of different PLS-DA models showed that an optimum model of classification is
created with two classes where 30 pixels, from each of RDX and PETN pellets, are used to calibrate
the model. The prediction applied to all the 1452 pixels of the image gives a 95.5% correct
classification. However, by reducing the prediction pixels to few points belonging to the central part
of each of the three pellets, an impressive classification of 100% is achieved. Finally, the possibility
of quantifying the spectral-imaging data from the spectral data is considered by using the PLS2 model
performed on the spectral data. This model was able to predict 18 pixel concentrations from the
central zones of the image and project them in the correct position in the ternary diagram, with an
RMSE of 5.63 mg.
These results of chemometic analysis applied to terahertz spectroscopy are at the state of art
and have the route for the industrial transfer of this recent and complementary technique.
88
CHAPTER III
MULTI-DIMENSIONAL MILLIMETER
WAVE IMAGING FOR PARCEL
INSPECTION
Several imaging devices including THz technologies are used for security applications. In this
chapter, three different imaging techniques are discussed and results on scanning postal packages are
shown. Since each system uses different emission and detection techniques, three experimental setups
are presented. The first one is a passive camera, i.e. without an excitation source, and the two others
are based on active imaging involving continuous waves (CW) and frequency modulated continuous
waves (FMCW). These setups can provide either the amplitude or both the amplitude and the phase of
the detected signal. The advantages of each of the three techniques in the frame of postal control and
safety are discussed in this chapter. Moreover, the importance of visualizing in 3D the objects
contained inside parcels lead us to apply tomographic reconstruction, which is discussed in the last
section of this chapter.
I. PASSIVE MILLIMETER WAVE IMAGING
Among millimeter imagers, one commonly distinguishes between passive systems, that record
the contrast in radiometric temperature within a scene, and active systems that are sensitive to the
contrast in the scattered radiance within a scene when it is illuminated with excitation sources [182].
A comparison between active and passive imaging have been already published [183], but in the
present work, we describe each of these techniques to present their potentials in the frame of parcels
inspection. One of the main interests of the millimeter waves in imaging is its ability of producing
images even in difficult scenes and atmospheric conditions such as low-light or fog as well as its
ability to pass through different types of materials like walls, clothes, plastic, paper, etc. Finally, the
low energies of the photons related to the millimeter waves make them safe to human health [184].
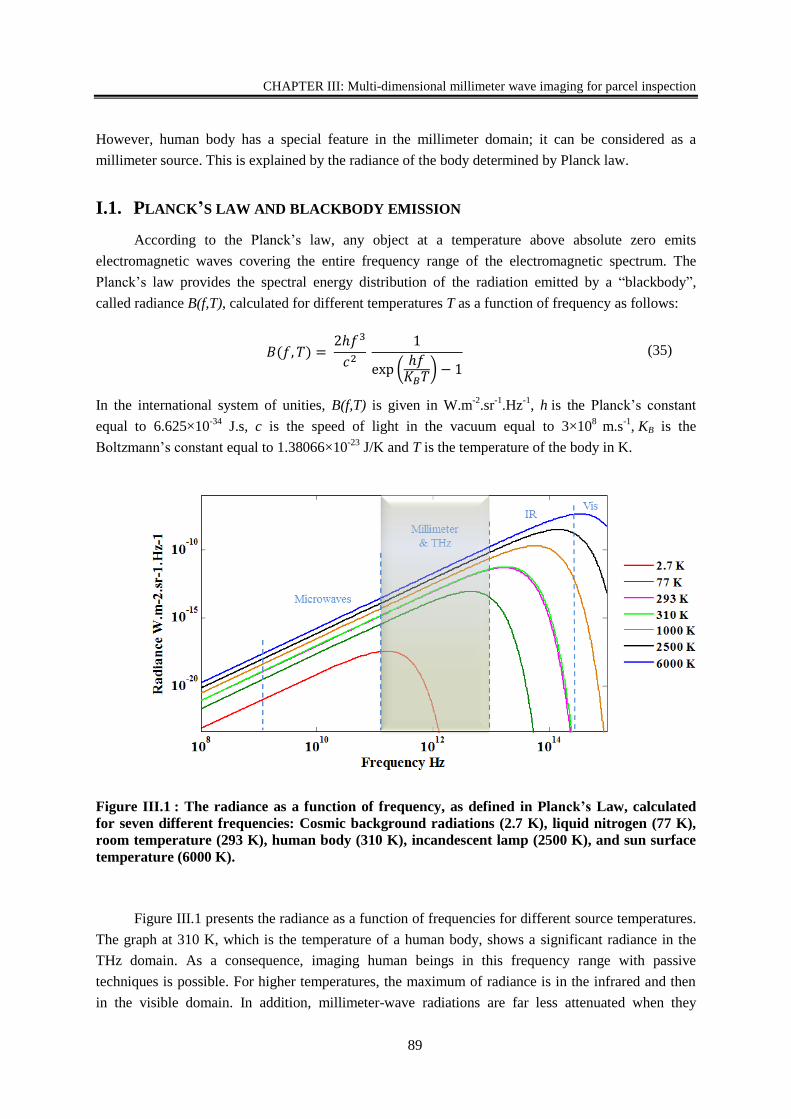
CHAPTER III: Multi-dimensional millimeter wave imaging for parcel inspection
89
However, human body has a special feature in the millimeter domain; it can be considered as a
millimeter source. This is explained by the radiance of the body determined by Planck law.
I.1. PLANCK’S LAW AND BLACKBODY EMISSION
According to the Planck’s law, any object at a temperature above absolute zero emits
electromagnetic waves covering the entire frequency range of the electromagnetic spectrum. The
Planck’s law provides the spectral energy distribution of the radiation emitted by a “blackbody”,
called radiance B(f,T), calculated for different temperatures T as a function of frequency as follows:
𝐵(𝑓, 𝑇) = 2ℎ𝑓3
𝑐2
1
exp (ℎ𝑓𝐾𝐵𝑇
) − 1 (35)
In the international system of unities, B(f,T) is given in W.m-2
.sr-1
.Hz-1
, h is the Planck’s constant
equal to 6.625×10⁻³⁴
J.s, c is the speed of light in the vacuum equal to 3×10⁸
m.s-1
, KB is the
Boltzmann’s constant equal to 1.38066×10⁻²³
J/K and T is the temperature of the body in K.
Figure III.1 : The radiance as a function of frequency, as defined in Planck’s Law, calculated
for seven different frequencies: Cosmic background radiations (2.7 K), liquid nitrogen (77 K),
room temperature (293 K), human body (310 K), incandescent lamp (2500 K), and sun surface
temperature (6000 K).
Figure III.1 presents the radiance as a function of frequencies for different source temperatures.
The graph at 310 K, which is the temperature of a human body, shows a significant radiance in the
THz domain. As a consequence, imaging human beings in this frequency range with passive
techniques is possible. For higher temperatures, the maximum of radiance is in the infrared and then
in the visible domain. In addition, millimeter-wave radiations are far less attenuated when they
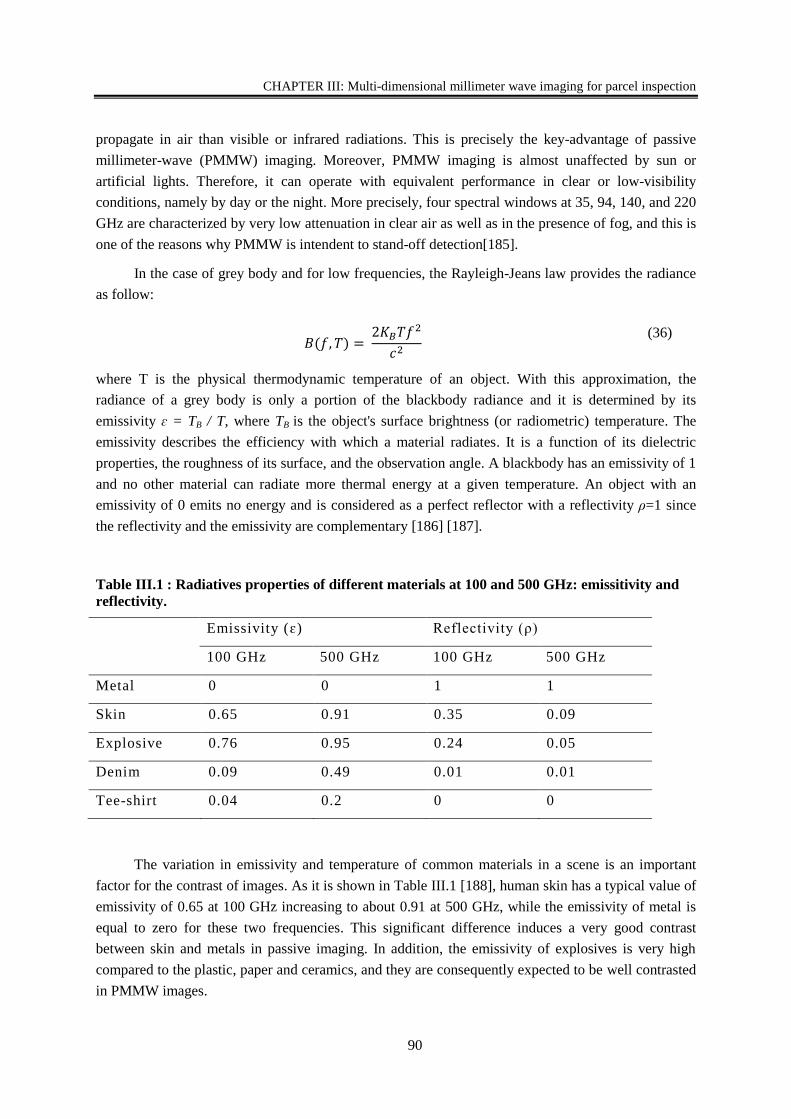
CHAPTER III: Multi-dimensional millimeter wave imaging for parcel inspection
90
propagate in air than visible or infrared radiations. This is precisely the key-advantage of passive
millimeter-wave (PMMW) imaging. Moreover, PMMW imaging is almost unaffected by sun or
artificial lights. Therefore, it can operate with equivalent performance in clear or low-visibility
conditions, namely by day or the night. More precisely, four spectral windows at 35, 94, 140, and 220
GHz are characterized by very low attenuation in clear air as well as in the presence of fog, and this is
one of the reasons why PMMW is intendent to stand-off detection[185].
In the case of grey body and for low frequencies, the Rayleigh-Jeans law provides the radiance
as follow:
𝐵(𝑓, 𝑇) = 2𝐾𝐵𝑇𝑓2
𝑐2
(36)
where T is the physical thermodynamic temperature of an object. With this approximation, the
radiance of a grey body is only a portion of the blackbody radiance and it is determined by its
emissivity ɛ = TB / T, where TB is the object's surface brightness (or radiometric) temperature. The
emissivity describes the efficiency with which a material radiates. It is a function of its dielectric
properties, the roughness of its surface, and the observation angle. A blackbody has an emissivity of 1
and no other material can radiate more thermal energy at a given temperature. An object with an
emissivity of 0 emits no energy and is considered as a perfect reflector with a reflectivity ρ=1 since
the reflectivity and the emissivity are complementary [186] [187].
Table III.1 : Radiatives properties of different materials at 100 and 500 GHz: emissitivity and
reflectivity.
Emissivity (ɛ) Reflectivity (ρ)
100 GHz 500 GHz 100 GHz 500 GHz
Metal 0 0 1 1
Skin 0.65 0.91 0.35 0.09
Explosive 0.76 0.95
.
0.24 0.05
Denim 0.09 0.49 0.01 0.01
Tee-shirt 0.04 0.2 0 0
The variation in emissivity and temperature of common materials in a scene is an important
factor for the contrast of images. As it is shown in Table III.1 [188], human skin has a typical value of
emissivity of 0.65 at 100 GHz increasing to about 0.91 at 500 GHz, while the emissivity of metal is
equal to zero for these two frequencies. This significant difference induces a very good contrast
between skin and metals in passive imaging. In addition, the emissivity of explosives is very high
compared to the plastic, paper and ceramics, and they are consequently expected to be well contrasted
in PMMW images.
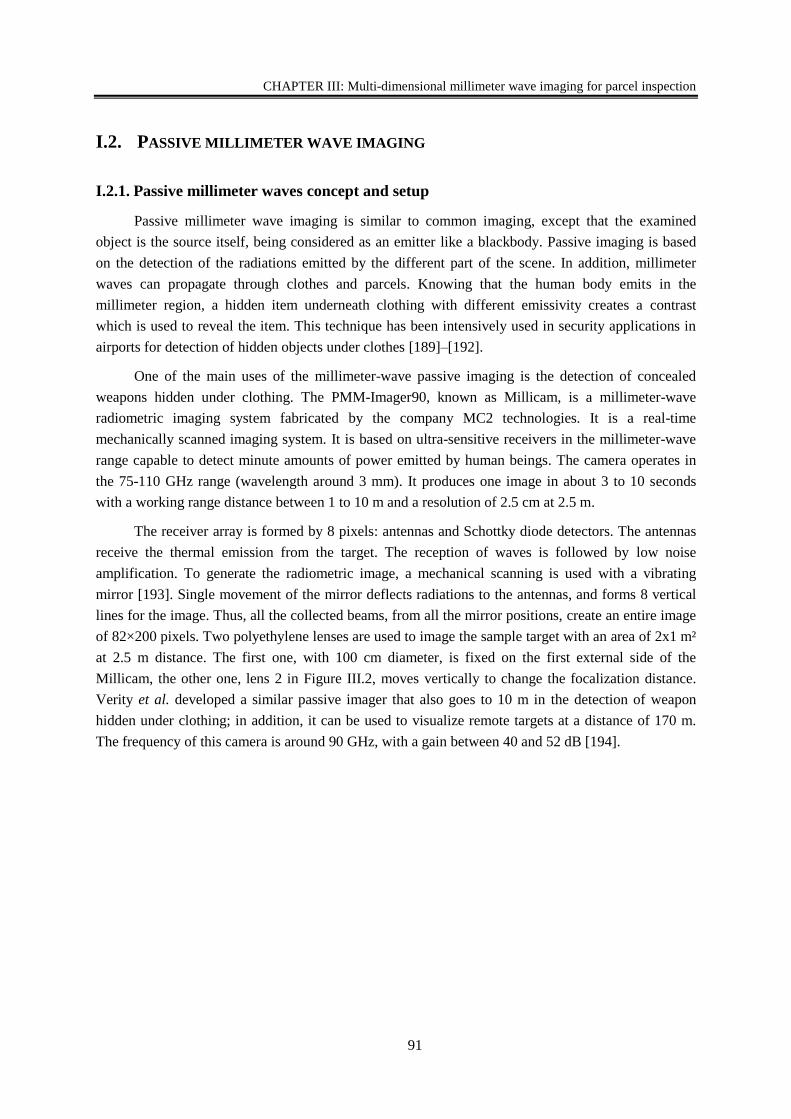
CHAPTER III: Multi-dimensional millimeter wave imaging for parcel inspection
91
I.2. PASSIVE MILLIMETER WAVE IMAGING
I.2.1. Passive millimeter waves concept and setup
Passive millimeter wave imaging is similar to common imaging, except that the examined
object is the source itself, being considered as an emitter like a blackbody. Passive imaging is based
on the detection of the radiations emitted by the different part of the scene. In addition, millimeter
waves can propagate through clothes and parcels. Knowing that the human body emits in the
millimeter region, a hidden item underneath clothing with different emissivity creates a contrast
which is used to reveal the item. This technique has been intensively used in security applications in
airports for detection of hidden objects under clothes [189]–[192].
One of the main uses of the millimeter-wave passive imaging is the detection of concealed
weapons hidden under clothing. The PMM-Imager90, known as Millicam, is a millimeter-wave
radiometric imaging system fabricated by the company MC2 technologies. It is a real-time
mechanically scanned imaging system. It is based on ultra-sensitive receivers in the millimeter-wave
range capable to detect minute amounts of power emitted by human beings. The camera operates in
the 75-110 GHz range (wavelength around 3 mm). It produces one image in about 3 to 10 seconds
with a working range distance between 1 to 10 m and a resolution of 2.5 cm at 2.5 m.
The receiver array is formed by 8 pixels: antennas and Schottky diode detectors. The antennas
receive the thermal emission from the target. The reception of waves is followed by low noise
amplification. To generate the radiometric image, a mechanical scanning is used with a vibrating
mirror [193]. Single movement of the mirror deflects radiations to the antennas, and forms 8 vertical
lines for the image. Thus, all the collected beams, from all the mirror positions, create an entire image
of 82×200 pixels. Two polyethylene lenses are used to image the sample target with an area of 2x1 m²
at 2.5 m distance. The first one, with 100 cm diameter, is fixed on the first external side of the
Millicam, the other one, lens 2 in Figure III.2, moves vertically to change the focalization distance.
Verity et al. developed a similar passive imager that also goes to 10 m in the detection of weapon
hidden under clothing; in addition, it can be used to visualize remote targets at a distance of 170 m.
The frequency of this camera is around 90 GHz, with a gain between 40 and 52 dB [194].
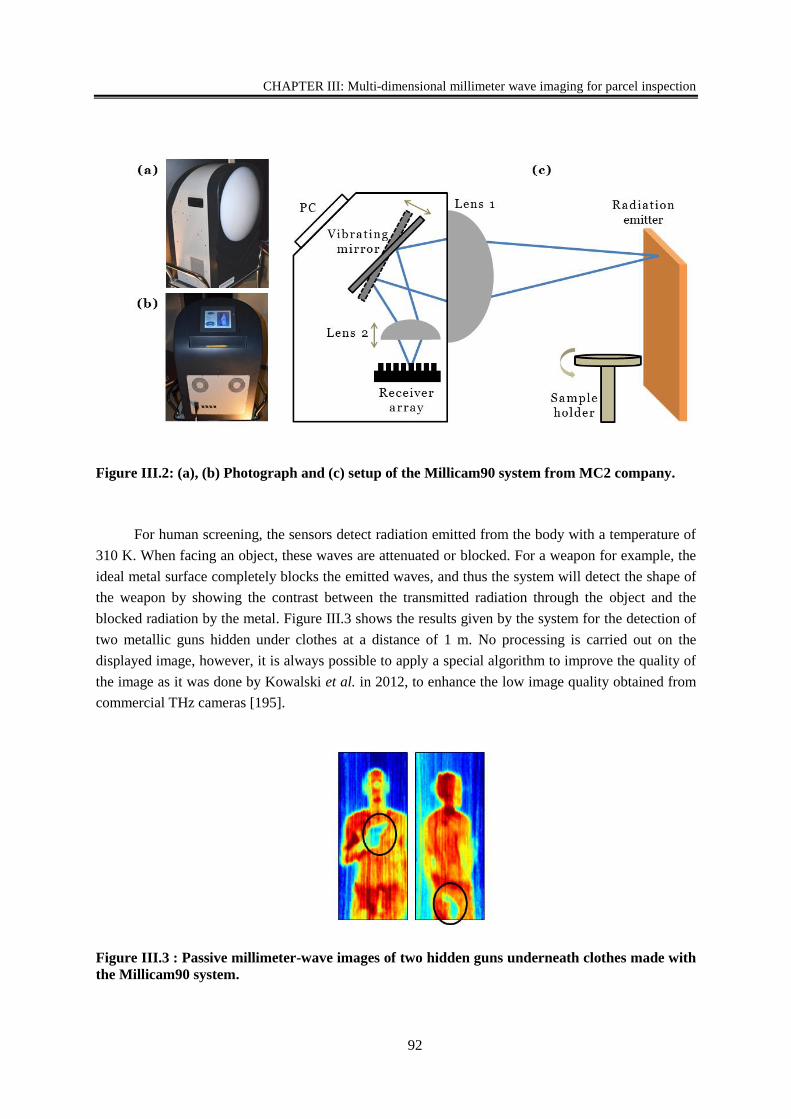
CHAPTER III: Multi-dimensional millimeter wave imaging for parcel inspection
92
Figure III.2: (a), (b) Photograph and (c) setup of the Millicam90 system from MC2 company.
For human screening, the sensors detect radiation emitted from the body with a temperature of
310 K. When facing an object, these waves are attenuated or blocked. For a weapon for example, the
ideal metal surface completely blocks the emitted waves, and thus the system will detect the shape of
the weapon by showing the contrast between the transmitted radiation through the object and the
blocked radiation by the metal. Figure III.3 shows the results given by the system for the detection of
two metallic guns hidden under clothes at a distance of 1 m. No processing is carried out on the
displayed image, however, it is always possible to apply a special algorithm to improve the quality of
the image as it was done by Kowalski et al. in 2012, to enhance the low image quality obtained from
commercial THz cameras [195].
Figure III.3 : Passive millimeter-wave images of two hidden guns underneath clothes made with
the Millicam90 system.
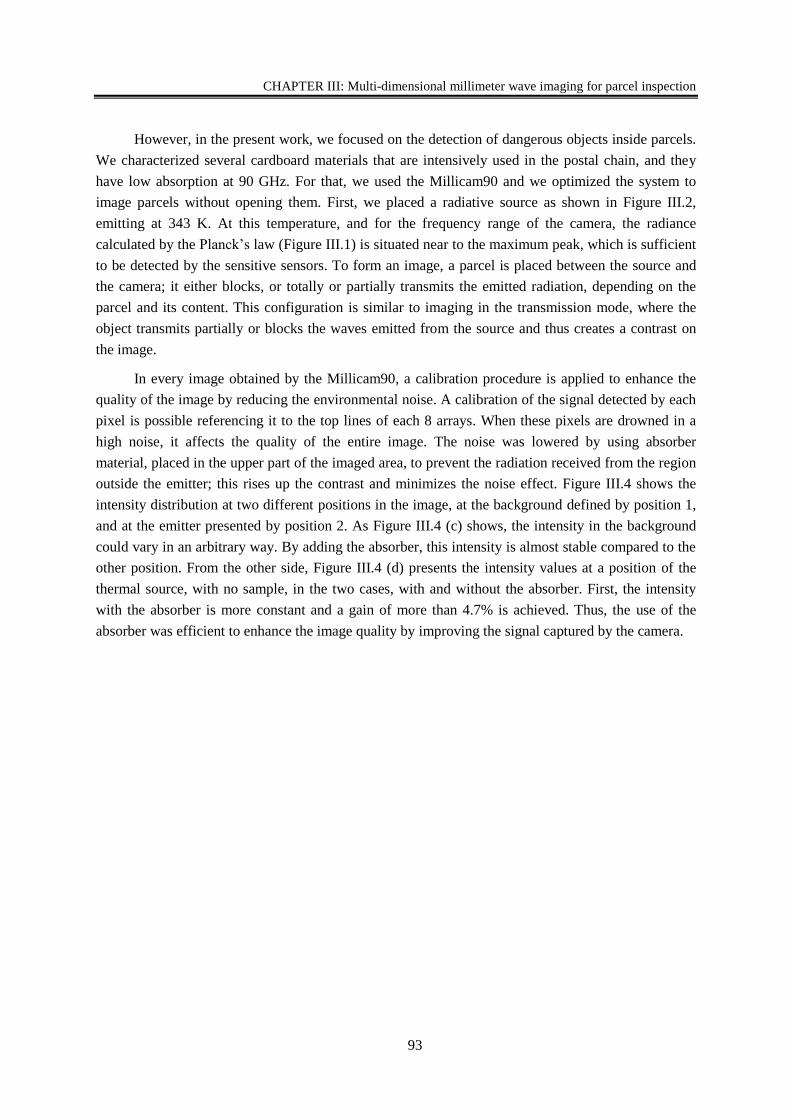
CHAPTER III: Multi-dimensional millimeter wave imaging for parcel inspection
93
However, in the present work, we focused on the detection of dangerous objects inside parcels.
We characterized several cardboard materials that are intensively used in the postal chain, and they
have low absorption at 90 GHz. For that, we used the Millicam90 and we optimized the system to
image parcels without opening them. First, we placed a radiative source as shown in Figure III.2,
emitting at 343 K. At this temperature, and for the frequency range of the camera, the radiance
calculated by the Planck’s law (Figure III.1) is situated near to the maximum peak, which is sufficient
to be detected by the sensitive sensors. To form an image, a parcel is placed between the source and
the camera; it either blocks, or totally or partially transmits the emitted radiation, depending on the
parcel and its content. This configuration is similar to imaging in the transmission mode, where the
object transmits partially or blocks the waves emitted from the source and thus creates a contrast on
the image.
In every image obtained by the Millicam90, a calibration procedure is applied to enhance the
quality of the image by reducing the environmental noise. A calibration of the signal detected by each
pixel is possible referencing it to the top lines of each 8 arrays. When these pixels are drowned in a
high noise, it affects the quality of the entire image. The noise was lowered by using absorber
material, placed in the upper part of the imaged area, to prevent the radiation received from the region
outside the emitter; this rises up the contrast and minimizes the noise effect. Figure III.4 shows the
intensity distribution at two different positions in the image, at the background defined by position 1,
and at the emitter presented by position 2. As Figure III.4 (c) shows, the intensity in the background
could vary in an arbitrary way. By adding the absorber, this intensity is almost stable compared to the
other position. From the other side, Figure III.4 (d) presents the intensity values at a position of the
thermal source, with no sample, in the two cases, with and without the absorber. First, the intensity
with the absorber is more constant and a gain of more than 4.7% is achieved. Thus, the use of the
absorber was efficient to enhance the image quality by improving the signal captured by the camera.
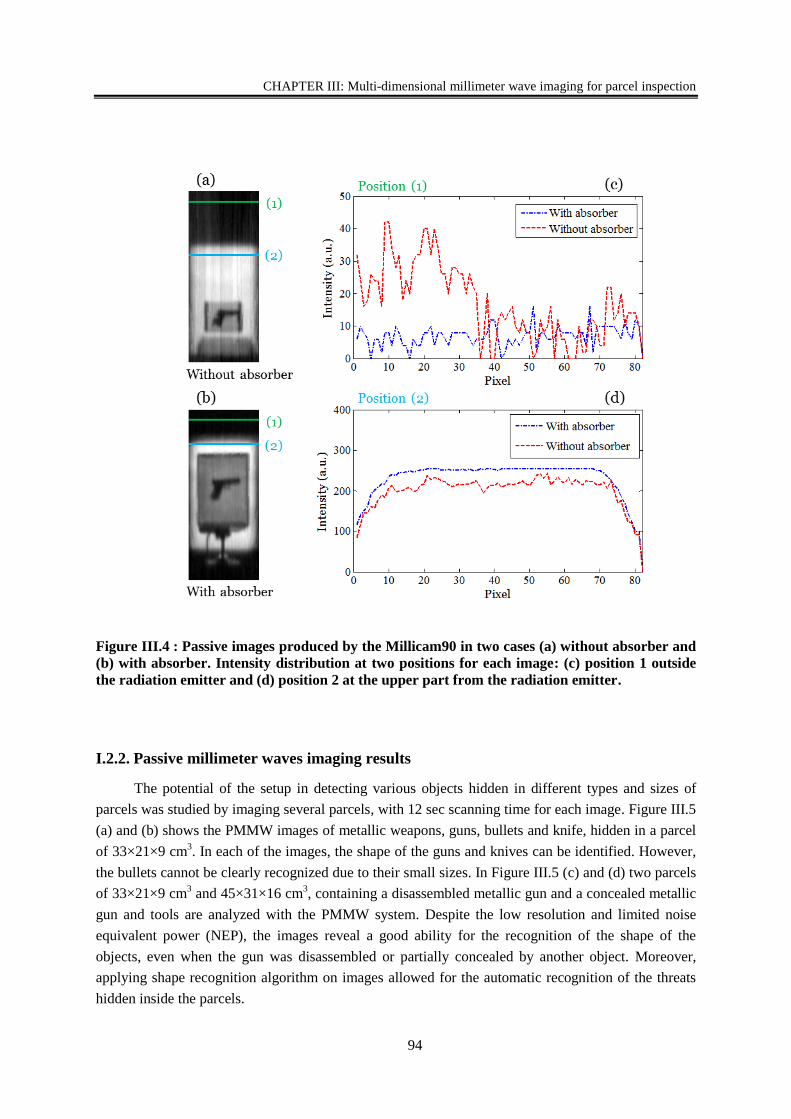
CHAPTER III: Multi-dimensional millimeter wave imaging for parcel inspection
94
I.2.2. Passive millimeter waves imaging results
The potential of the setup in detecting various objects hidden in different types and sizes of
parcels was studied by imaging several parcels, with 12 sec scanning time for each image. Figure III.5
(a) and (b) shows the PMMW images of metallic weapons, guns, bullets and knife, hidden in a parcel
of 33×21×9 cm3. In each of the images, the shape of the guns and knives can be identified. However,
the bullets cannot be clearly recognized due to their small sizes. In Figure III.5 (c) and (d) two parcels
of 33×21×9 cm3 and 45×31×16 cm
3, containing a disassembled metallic gun and a concealed metallic
gun and tools are analyzed with the PMMW system. Despite the low resolution and limited noise
equivalent power (NEP), the images reveal a good ability for the recognition of the shape of the
objects, even when the gun was disassembled or partially concealed by another object. Moreover,
applying shape recognition algorithm on images allowed for the automatic recognition of the threats
hidden inside the parcels.
Figure III.4 : Passive images produced by the Millicam90 in two cases (a) without absorber and
(b) with absorber. Intensity distribution at two positions for each image: (c) position 1 outside
the radiation emitter and (d) position 2 at the upper part from the radiation emitter.
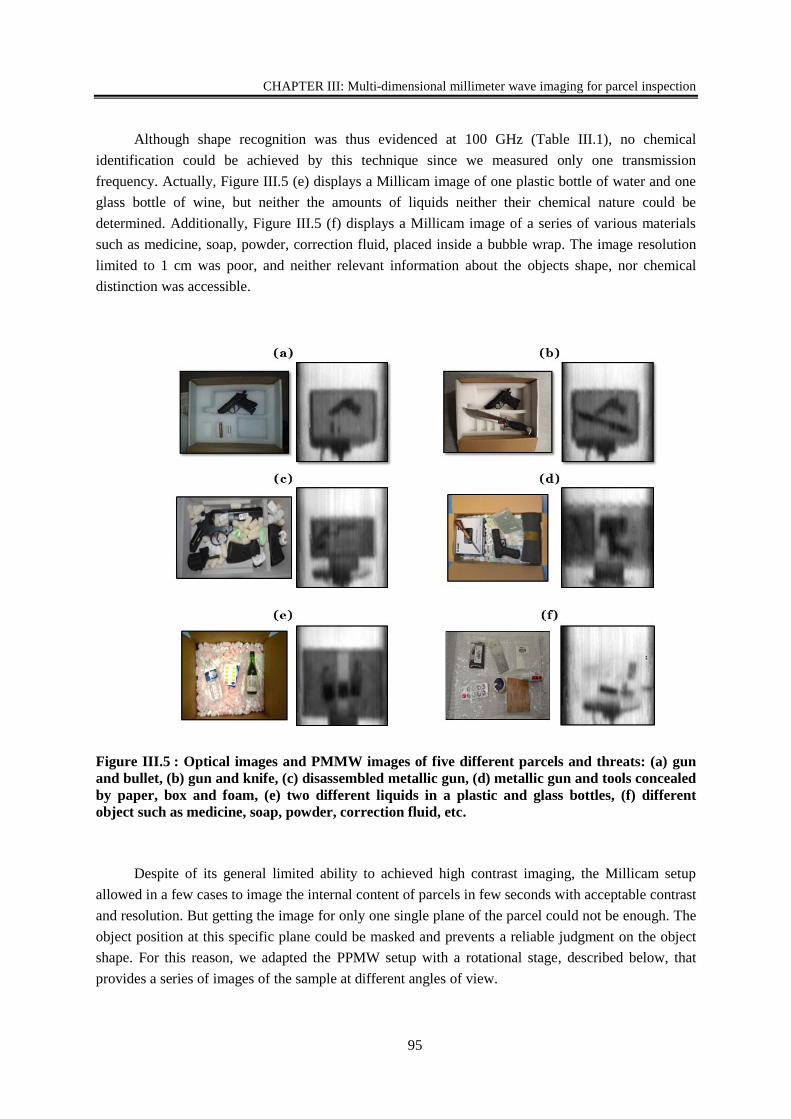
CHAPTER III: Multi-dimensional millimeter wave imaging for parcel inspection
95
Although shape recognition was thus evidenced at 100 GHz (Table III.1), no chemical
identification could be achieved by this technique since we measured only one transmission
frequency. Actually, Figure III.5 (e) displays a Millicam image of one plastic bottle of water and one
glass bottle of wine, but neither the amounts of liquids neither their chemical nature could be
determined. Additionally, Figure III.5 (f) displays a Millicam image of a series of various materials
such as medicine, soap, powder, correction fluid, placed inside a bubble wrap. The image resolution
limited to 1 cm was poor, and neither relevant information about the objects shape, nor chemical
distinction was accessible.
Despite of its general limited ability to achieved high contrast imaging, the Millicam setup
allowed in a few cases to image the internal content of parcels in few seconds with acceptable contrast
and resolution. But getting the image for only one single plane of the parcel could not be enough. The
object position at this specific plane could be masked and prevents a reliable judgment on the object
shape. For this reason, we adapted the PPMW setup with a rotational stage, described below, that
provides a series of images of the sample at different angles of view.
Figure III.5 : Optical images and PMMW images of five different parcels and threats: (a) gun
and bullet, (b) gun and knife, (c) disassembled metallic gun, (d) metallic gun and tools concealed
by paper, box and foam, (e) two different liquids in a plastic and glass bottles, (f) different
object such as medicine, soap, powder, correction fluid, etc.
CHAPTER III: Multi-dimensional millimeter wave imaging for parcel inspection
96
Finally, more complex objects placed inside different types and shapes of cardboard boxes and
letters were thus tested to simulate the real life conditions that might be observed in the postal chain,
including various types of holders and packaging materials like foams, plastic film, etc.
Table III.2: Capabilities and limitations of Millicam system in packaging investigation.
Positive Limitations
Identification of metallic weapons
through all types of parcels and
letters.
Recognition of objects shape inside
parcels and letters.
Visualization of the content of
plastic and glass bottles.
Maximum length and width at 1 m: 120×49cm2.
Maximum thickness: >25cm.
One frequency at a time.
Identification of the objects is not possible when
wrapped in dense boxes.
No chemical recognition.
No identification when the object is overlapped
by another.
I.2.3. Rotational stage
For parcel inspection, 2D imaging is not sufficient in most of the cases for instance, when an
object is facing the detector and is concealed by another object. Consequently, 3D imaging of parcels
has become mandatory and this is the reason why we developed a homemade tomographic
reconstruction algorithm that will be presented later in this chapter. To provide data for tomographic
reconstruction, we optimized the experimental setup by placing the sample holder onto a rotation
stage and we recorded a series of images per sample, one image at each angle of the rotation stage.
Angular steps of 10º represented the optimized conditions to manage both the acquisition time and
resolution. The automation of the image acquisition was performed through a homemade LabVIEW
program, allowing the acquisition of 36 images corresponding to 36 projections in approximately 9
minutes. In order to demonstrate for the first time the feasibility of tomographic reconstruction
applied to PMMW images, a parcel of 55×36 cm2 containing a metallic gun and a metallic knife
covered by foam was selected. By applying special tomographic reconstructions, it was possible to
reconstruct and visualize in 3D the content of the parcel (Figure III.26). This result represents a
significant progress in terahertz 3D imaging since it is the first time that tomographic reconstruction
was achieved from a series of images obtained from a PMMW imaging system.
I.3. SYNTHESIS
Finally, the results of passive imaging setup show a high potential in the use of this technology
for parcels inspection. However, the resolution in our setup was not sufficient for identification of
small objects. This problem can be easily resolved by using passive imaging systems performing with
CHAPTER III: Multi-dimensional millimeter wave imaging for parcel inspection
97
higher frequencies, which occurre better resolution. Moreover, it is possible to perform measurements
in real time with a good signal-to-noise ratio. Finally, this technique is very efficient for human
screening being able to detect hidden object through clothes without causing dangerous effects on
human health. In contrast, we showed that PMMW imaging can be well performed on parcel
inspection, and by using images at different angle and applying special tomographic reconstruction
algorithm, it is possible to retrieve the shape of the object in volume, inside parcels.
II. ACTIVE CONTINUOUS WAVE IMAGING
Active imaging differs from passive imaging by the need of a radiative source. In this chapter,
two types of active imaging systems are discussed. The choice of the sources and detectors varies
depending on the application. The choice of the emission frequency is linked to the available power,
which is a technological limitation. For the postal chain security, high-speed imaging is mandatory,
and thus the higher the THz radiation power, the best will be the images, allowing to overcome the
absorption of the THz waves by the different materials. Based on this, two imaging active techniques
were chosen. The first one based on continuous wave (CW) imaging only gives access to the
amplitude of the wave. The second one, known as frequency modulated continuous wave (FMCW)
technique gives access to both the amplitude and the phase of the wave. The details of these two
techniques, as well as the results obtained in the frame of parcels inspection are presented hereafter.
II.1. SOURCE
For the CW imaging, Gunn diodes are used to generate the millimeter waves. A Gunn diode
consists of only N-doped semiconductor materials, and involves the negative resistance effect. This
effect allows generating oscillations determined by the semiconductor properties. To produce higher
frequency, the size of the semiconductor should be reduced and thus the power is lower. Once
generated in a cavity, lumped elements improve impedance matching and optimize power generation.
Finally, the wave is emitted by a specially designed horn antenna coupled to the Gunn-diode. To have
access to other frequencies and to increase the output frequency of the emitter, frequency multiplier
chain can be used but obviously leading to a decrease in the output power.
The sources we have been using to generate the continuous waves in the present work were two
Gunn diodes characterized as follows. The first one is a diode coupled to a frequency tripler, the
WAX3 from “Wasa MilliMeter Wave” [196]. It has an output frequency range of 261-315 GHz and
delivers a maximum output power of 14 mW at 287 GHz. The second one is the GDM-10 Gunn diode
from “millitech” [197]. It emit in the 75-90 GHz frequency range delivering a maximum output power
of 51 mW at 84 GHz. Each diode is coupled to output horn antenna. The advantage of the WAX3 is
essentially the better spatial resolution owing to the shorter wavelength, whereas the GDM-10 has a
much larger output power.
CHAPTER III: Multi-dimensional millimeter wave imaging for parcel inspection
98
II.2. DETECTOR
The detection is performed by two zero-bias Schottky diodes from “Virginia Diodes” combined
with lock-in amplifier and involving the use of mechanical choppers to modulate the incoming wave
intensities. The Schottky diodes implemented in the present work are the WR10 operating in the
frequency range of 75-110 GHz and the WR3.4 operating in the frequency range of 220-330 GHz,
with a noise equivalent power (NEP) of 13.2 pW/√Hz and 17.6 pW/√Hz respectively. The WR10
guide is equipped with a 17-mm diameter cylindrical horn antenna and the WR3.4 are coupled to a
pyramidal horn antenna of 9 mm. The typical responsivity of the WR10 and WR3.4 diodes along their
frequency range is 2000 V/W and 1500 V/W respectively.
The experimental environment emits terahertz radiation that can generate noise. The lock-in
amplifier is able to extract a very small signal even when it seems to be concealed by noise by
modulating the incident radiation in this case at low frequency. In our experimental setup, we use two
mechanical choppers with two different modulation frequencies of typically hundreds of hertz. The
parameters of the lock-in amplifier were set in accordance with the modulation reference frequency,
namely the time constant that should be at least three times higher than the period of modulation, to
make sure that more than one full period of the modulated signal is detected. In addition, the response
time of the Schottky diodes should be ten times smaller than the reference period. For those used in
our setup, the response time is several ns, which is comfortable to achieve the mentioned requirement.
Another important parameter of the lock-in amplifier is the sensitivity. Changing the sensitivity may
change the dynamic reserve, and highlights different details in the sample to image. A low sensitivity
may lead to a saturation effect of the resulting image if the objet to image presents different materials
with variant absorbance.
II.3. CONTINUOUS WAVE SETUP
The system is based on raster scan single-pixel in transmission geometry, where the incident
beam is focused onto the sample with a pair of 50 mm diameter high-density polyethylene (PEHD)
lenses. Depending on the size of the object to be imaged, the focal length can be set to 50 mm or 100
mm. The detection is made point-by-point by moving the sample thanks to a 2-axis translation stage
by step of 0.5 mm in both directions, and simultaneously producing two images at 84 GHz and 287
GHz, representing the amplitude of the THz wave at each pixel. Here the translation stages velocity
and the response time of the detectors limit the imaging speed. Considering the speed 40 pixels/sec for
the translation stages, a 100×100 pixels image can be made in about 28 minutes. An alternative
configuration consists in continuously moving the sample along the X-axis thus decreasing the
acquisition time to 8 minutes but also reducing the image quality. Considering the time necessary to
reconstruct an image, the present system is far from allowing real-time imaging. Finally, the sample is
rotated from 0 to 180°, by steps of 5° or 10°, thus providing 18 or 36 projections. Figure III.6 shows
the basic optical and electrical setups for single-pixel scanned-imaging in transmission-mode.
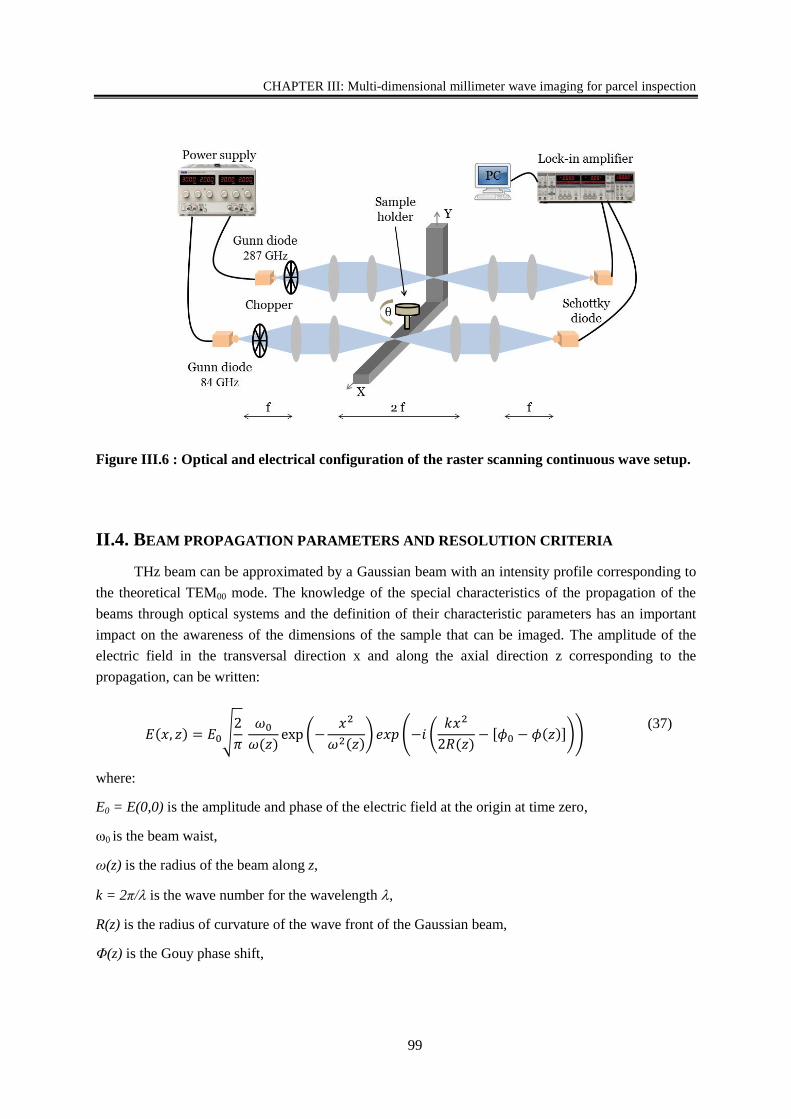
CHAPTER III: Multi-dimensional millimeter wave imaging for parcel inspection
99
Figure III.6 : Optical and electrical configuration of the raster scanning continuous wave setup.
II.4. BEAM PROPAGATION PARAMETERS AND RESOLUTION CRITERIA
THz beam can be approximated by a Gaussian beam with an intensity profile corresponding to
the theoretical TEM00 mode. The knowledge of the special characteristics of the propagation of the
beams through optical systems and the definition of their characteristic parameters has an important
impact on the awareness of the dimensions of the sample that can be imaged. The amplitude of the
electric field in the transversal direction x and along the axial direction z corresponding to the
propagation, can be written:
𝐸(𝑥, 𝑧) = 𝐸0√2
𝜋
𝜔0
𝜔(𝑧)exp(−
𝑥2
𝜔2(𝑧)) 𝑒𝑥𝑝(−𝑖 (
𝑘𝑥2
2𝑅(𝑧)− [𝜙0 − 𝜙(𝑧)]))
(37)
where:
E0 = E(0,0) is the amplitude and phase of the electric field at the origin at time zero,
ω0 is the beam waist,
ω(z) is the radius of the beam along z,
k = 2π/ is the wave number for the wavelength ,
R(z) is the radius of curvature of the wave front of the Gaussian beam,
Φ(z) is the Gouy phase shift,
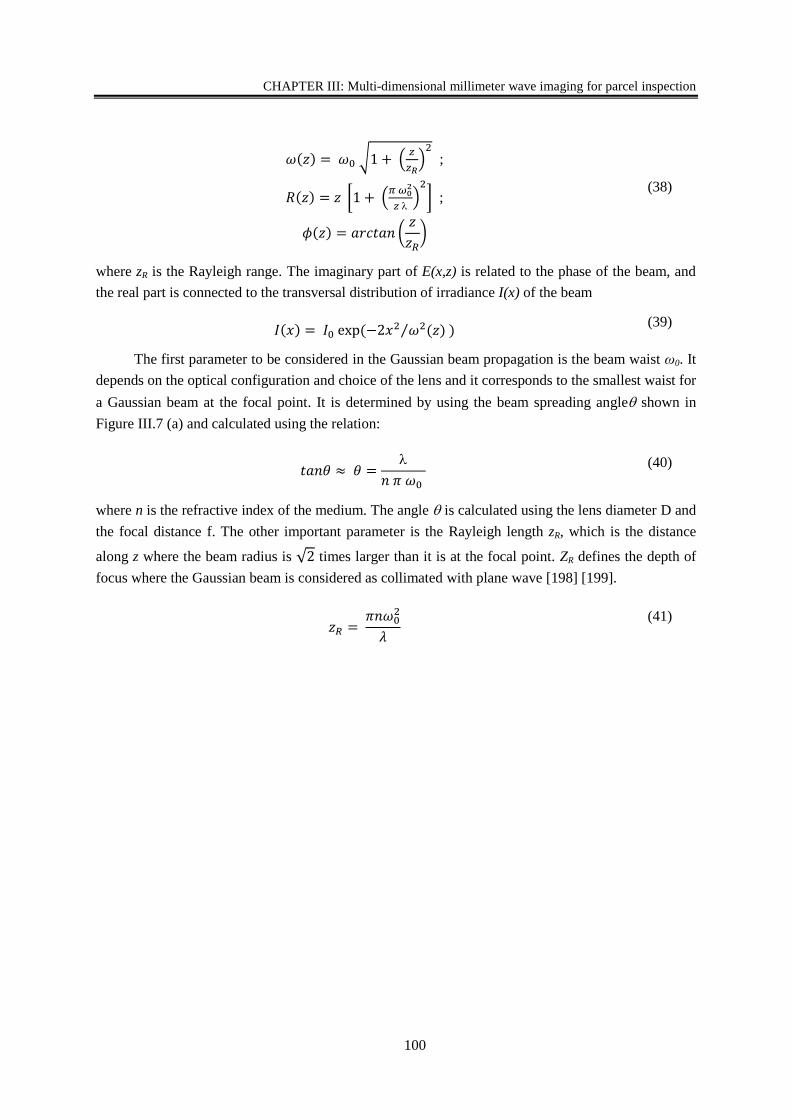
CHAPTER III: Multi-dimensional millimeter wave imaging for parcel inspection
100
𝜔(𝑧) = 𝜔0 √1 + (𝑧
𝑧𝑅)2 ;
𝑅(𝑧) = 𝑧 [1 + (𝜋 𝜔0
2
𝑧 )2
] ;
𝜙(𝑧) = 𝑎𝑟𝑐𝑡𝑎𝑛 (𝑧
𝑧𝑅)
(38)
where zR is the Rayleigh range. The imaginary part of E(x,z) is related to the phase of the beam, and
the real part is connected to the transversal distribution of irradiance I(x) of the beam
𝐼(𝑥) = 𝐼0 exp (−2𝑥2 𝜔2(𝑧)⁄ ) (39)
The first parameter to be considered in the Gaussian beam propagation is the beam waist ω0. It
depends on the optical configuration and choice of the lens and it corresponds to the smallest waist for
a Gaussian beam at the focal point. It is determined by using the beam spreading angle shown in
Figure III.7 (a) and calculated using the relation:
𝑡𝑎𝑛𝜃 ≈ 𝜃 =
𝑛 𝜋 𝜔0
(40)
where n is the refractive index of the medium. The angle is calculated using the lens diameter D and
the focal distance f. The other important parameter is the Rayleigh length zR, which is the distance
along z where the beam radius is √2 times larger than it is at the focal point. ZR defines the depth of
focus where the Gaussian beam is considered as collimated with plane wave [198] [199].
𝑧𝑅 = 𝜋𝑛𝜔0
2
𝜆
(41)
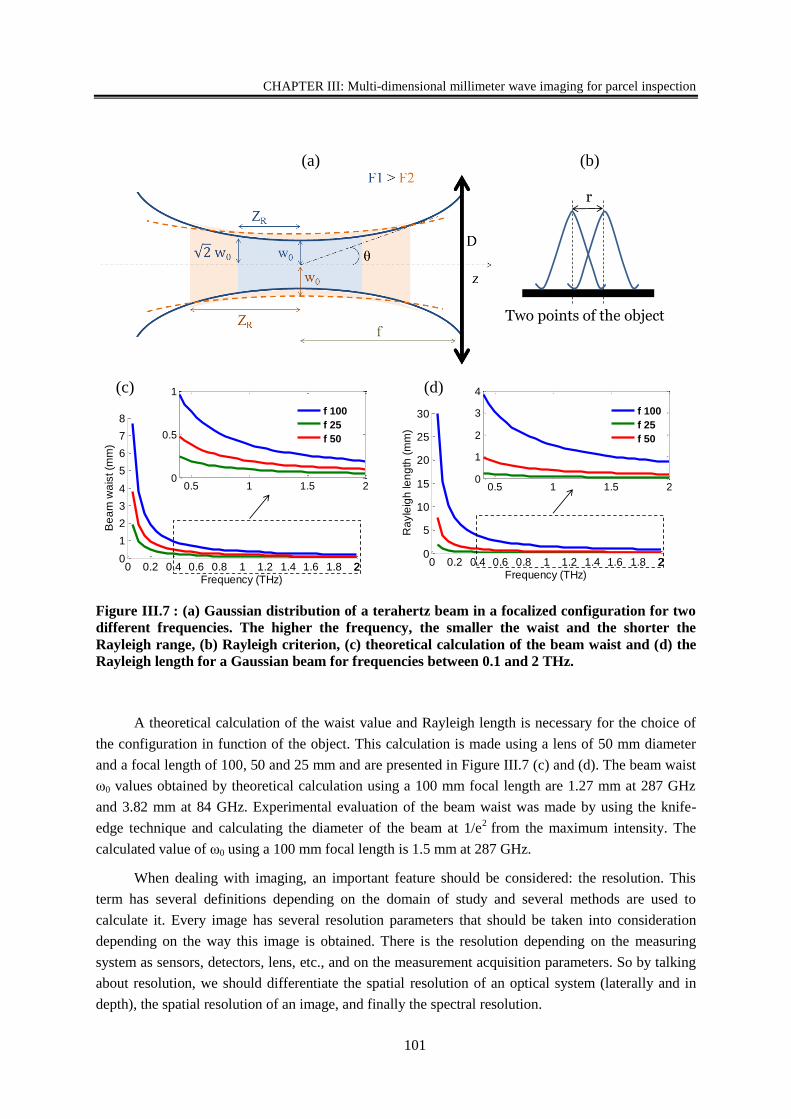
CHAPTER III: Multi-dimensional millimeter wave imaging for parcel inspection
101
Figure III.7 : (a) Gaussian distribution of a terahertz beam in a focalized configuration for two
different frequencies. The higher the frequency, the smaller the waist and the shorter the
Rayleigh range, (b) Rayleigh criterion, (c) theoretical calculation of the beam waist and (d) the
Rayleigh length for a Gaussian beam for frequencies between 0.1 and 2 THz.
A theoretical calculation of the waist value and Rayleigh length is necessary for the choice of
the configuration in function of the object. This calculation is made using a lens of 50 mm diameter
and a focal length of 100, 50 and 25 mm and are presented in Figure III.7 (c) and (d). The beam waist
ω0 values obtained by theoretical calculation using a 100 mm focal length are 1.27 mm at 287 GHz
and 3.82 mm at 84 GHz. Experimental evaluation of the beam waist was made by using the knife-
edge technique and calculating the diameter of the beam at 1/e2
from the maximum intensity. The
calculated value of ω0 using a 100 mm focal length is 1.5 mm at 287 GHz.
When dealing with imaging, an important feature should be considered: the resolution. This
term has several definitions depending on the domain of study and several methods are used to
calculate it. Every image has several resolution parameters that should be taken into consideration
depending on the way this image is obtained. There is the resolution depending on the measuring
system as sensors, detectors, lens, etc., and on the measurement acquisition parameters. So by talking
about resolution, we should differentiate the spatial resolution of an optical system (laterally and in
depth), the spatial resolution of an image, and finally the spectral resolution.
0 0.2 0.4 0.6 0.8 1 1.2 1.4 1.6 1.8 220
5
10
15
20
25
30
Frequency (THz)
Ra
yle
igh
le
ng
th (
mm
)
f 100
f 25
f 50
0 0.2 0.4 0.6 0.8 1 1.2 1.4 1.6 1.8 220
1
2
3
4
5
6
7
8
Frequency (THz)
Be
am
wa
ist (m
m)
f 100
f 25
f 50
(a)
(d)
r
Two points of the object
(b)
0.5 1 1.5 20
1
2
3
4
0.5 1 1.5 20
0.5
1(c)
0 0.2 0.4 0.6 0.8 1 1.2 1.4 1.6 1.8 220
1
2
3
4
5
6
7
8
Frequency (THz)
Be
am
wa
ist (m
m)
f 100
f 25
f 50
0 0.2 0.4 0.6 0.8 1 1.2 1.4 1.6 1.8 220
1
2
3
4
5
6
7
8
Frequency (THz)
Be
am
wa
ist (m
m)
f 100
f 25
f 50
CHAPTER III: Multi-dimensional millimeter wave imaging for parcel inspection
102
Resolution is the capability of the sensor to observe or measure the smallest object clearly with
distinct boundaries and the ability of a lens to produce sharp images of two closely spaced point
objects. It is defined as the minimum distance between two objects that can be distinguished in the
image as illustrated in Figure III.7 (b). The smaller the distance by which two objects can be separated
and still be seen as distinct, the greater the resolution. According to the Rayleigh criterion, and for the
small angle approximation, lateral resolution is defined as the distance between two points that can be
resolved and is determined as follows:
𝑟𝑙 =1.22 𝑓
𝐷
(42)
Where:
rl is the minimum distance between resolvable points, measured in a unit of distance
such as mm,
is the wavelength of light,
D is the diameter of the aperture of the lens,
f is the focal distance of the lens.
Smaller value of rl indicates a better distinguish between two points, thus better spatial
resolution. The spatial resolution can be limited by diffraction, as well as by aberrations, imperfect
focus, and atmospheric distortion. Also, the lenses display and alignment has a high effect on the
variation of the resolving power of an imaging setup. So a great careful should be considered when
building the setup.
The values ω0 contribute to the maximum resolution that can be achieved. As shown in the plot
of the beam waist, decreasing the focal length at a given frequency reduces the value of the waist,
which is proportional to the resolution, and thus a smaller resolution value with the 25 mm focal
indicates a better resolution. However, the need of space for imaging large objects leads to the use of
the 100 mm focal length. However, for higher focal length, the distance between the source and the
detector will be larger and with the available power, the signal will be attenuated by the long
propagation distance. Also, the decreasing of the beam waist with the frequency indicated that better
resolution is obtained with higher frequencies. As for Rayleigh length, it contributes to the depth of
focus where the beam is considered collimated and it helps defining the thickness of the object that we
can image. For lower frequencies, the Rayleigh zone is larger, and is recommended for large object.
However, when dealing with imaging, acquisition parameters contributes in the resolution
determination. The pixel size chosen, defined by the translation step size, contribute to the resolution
determination too. It is assumed that the pixel size is chosen to be equal to the full width at half
maximum (FWHM) spot size. More pixels can be fit into the same display area by choosing the pixel
size smaller than the FWHM spot size. To take this into consideration, another way can be used to
evaluate the limit of resolution in an imaging setup, which consists of using the USAF target shown in
Figure III.8 (a), and identifies the element corresponding to the first resolved lines. The USAF target
is a resolution test target widely used to test the resolution of optical imaging systems such as
microscope and cameras. As shown in Figure III.8 (b) and (c), the MMW image at 287 GHz shows a
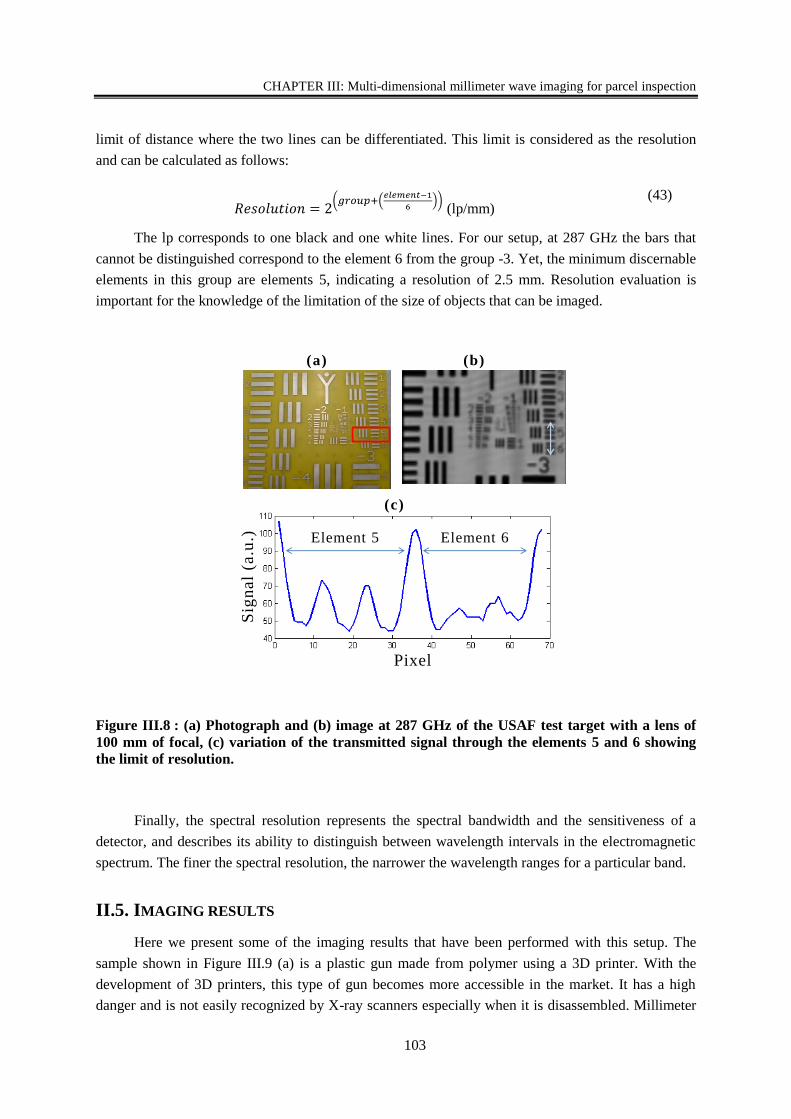
CHAPTER III: Multi-dimensional millimeter wave imaging for parcel inspection
103
limit of distance where the two lines can be differentiated. This limit is considered as the resolution
and can be calculated as follows:
𝑅𝑒𝑠𝑜𝑙𝑢𝑡𝑖𝑜𝑛 = 2(𝑔𝑟𝑜𝑢𝑝+(
𝑒𝑙𝑒𝑚𝑒𝑛𝑡−1
6))
(lp/mm) (43)
The lp corresponds to one black and one white lines. For our setup, at 287 GHz the bars that
cannot be distinguished correspond to the element 6 from the group -3. Yet, the minimum discernable
elements in this group are elements 5, indicating a resolution of 2.5 mm. Resolution evaluation is
important for the knowledge of the limitation of the size of objects that can be imaged.
Figure III.8 : (a) Photograph and (b) image at 287 GHz of the USAF test target with a lens of
100 mm of focal, (c) variation of the transmitted signal through the elements 5 and 6 showing
the limit of resolution.
Finally, the spectral resolution represents the spectral bandwidth and the sensitiveness of a
detector, and describes its ability to distinguish between wavelength intervals in the electromagnetic
spectrum. The finer the spectral resolution, the narrower the wavelength ranges for a particular band.
II.5. IMAGING RESULTS
Here we present some of the imaging results that have been performed with this setup. The
sample shown in Figure III.9 (a) is a plastic gun made from polymer using a 3D printer. With the
development of 3D printers, this type of gun becomes more accessible in the market. It has a high
danger and is not easily recognized by X-ray scanners especially when it is disassembled. Millimeter
Sig
nal
(a.u
.)
Pixel
(a)
(c)
(b)
Element 5 Element 6
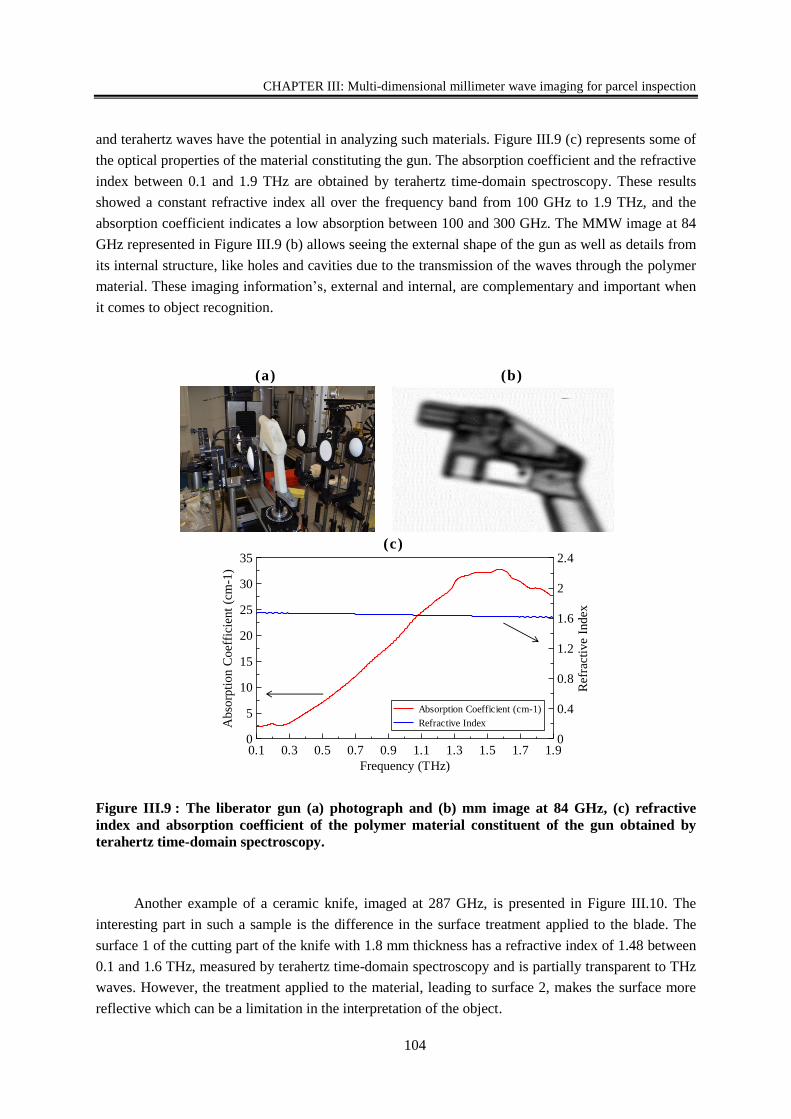
CHAPTER III: Multi-dimensional millimeter wave imaging for parcel inspection
104
and terahertz waves have the potential in analyzing such materials. Figure III.9 (c) represents some of
the optical properties of the material constituting the gun. The absorption coefficient and the refractive
index between 0.1 and 1.9 THz are obtained by terahertz time-domain spectroscopy. These results
showed a constant refractive index all over the frequency band from 100 GHz to 1.9 THz, and the
absorption coefficient indicates a low absorption between 100 and 300 GHz. The MMW image at 84
GHz represented in Figure III.9 (b) allows seeing the external shape of the gun as well as details from
its internal structure, like holes and cavities due to the transmission of the waves through the polymer
material. These imaging information’s, external and internal, are complementary and important when
it comes to object recognition.
Figure III.9 : The liberator gun (a) photograph and (b) mm image at 84 GHz, (c) refractive
index and absorption coefficient of the polymer material constituent of the gun obtained by
terahertz time-domain spectroscopy.
Another example of a ceramic knife, imaged at 287 GHz, is presented in Figure III.10. The
interesting part in such a sample is the difference in the surface treatment applied to the blade. The
surface 1 of the cutting part of the knife with 1.8 mm thickness has a refractive index of 1.48 between
0.1 and 1.6 THz, measured by terahertz time-domain spectroscopy and is partially transparent to THz
waves. However, the treatment applied to the material, leading to surface 2, makes the surface more
reflective which can be a limitation in the interpretation of the object.
(a) (b)
(c)
0.1 0.3 0.5 0.7 0.9 1.1 1.3 1.5 1.7 1.9
Frequency (THz)
35
30
25
20
15
10
5
0
Abso
rpti
on
Co
effi
cien
t (c
m-1
)
2.4
2
1.6
1.2
0.8
0.4
0
Ref
ract
ive
Ind
ex
Absorption Coefficient (cm-1)
Refractive Index
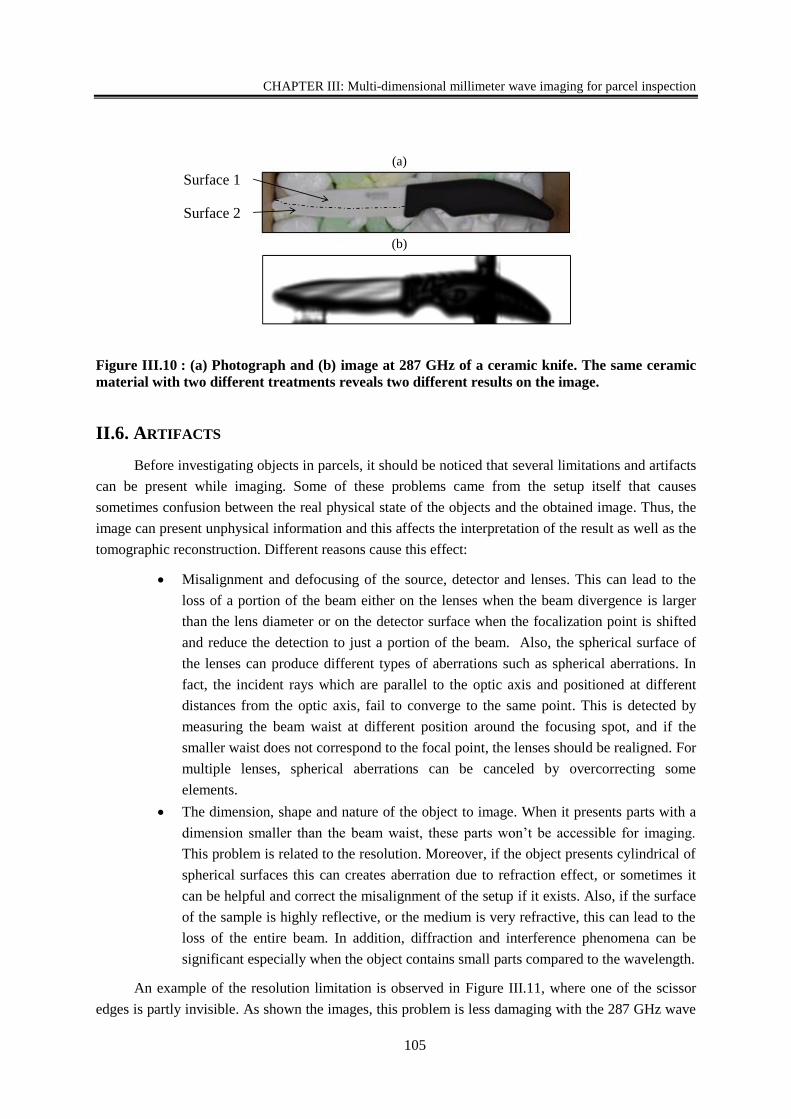
CHAPTER III: Multi-dimensional millimeter wave imaging for parcel inspection
105
Figure III.10 : (a) Photograph and (b) image at 287 GHz of a ceramic knife. The same ceramic
material with two different treatments reveals two different results on the image.
II.6. ARTIFACTS
Before investigating objects in parcels, it should be noticed that several limitations and artifacts
can be present while imaging. Some of these problems came from the setup itself that causes
sometimes confusion between the real physical state of the objects and the obtained image. Thus, the
image can present unphysical information and this affects the interpretation of the result as well as the
tomographic reconstruction. Different reasons cause this effect:
Misalignment and defocusing of the source, detector and lenses. This can lead to the
loss of a portion of the beam either on the lenses when the beam divergence is larger
than the lens diameter or on the detector surface when the focalization point is shifted
and reduce the detection to just a portion of the beam. Also, the spherical surface of
the lenses can produce different types of aberrations such as spherical aberrations. In
fact, the incident rays which are parallel to the optic axis and positioned at different
distances from the optic axis, fail to converge to the same point. This is detected by
measuring the beam waist at different position around the focusing spot, and if the
smaller waist does not correspond to the focal point, the lenses should be realigned. For
multiple lenses, spherical aberrations can be canceled by overcorrecting some
elements.
The dimension, shape and nature of the object to image. When it presents parts with a
dimension smaller than the beam waist, these parts won’t be accessible for imaging.
This problem is related to the resolution. Moreover, if the object presents cylindrical of
spherical surfaces this can creates aberration due to refraction effect, or sometimes it
can be helpful and correct the misalignment of the setup if it exists. Also, if the surface
of the sample is highly reflective, or the medium is very refractive, this can lead to the
loss of the entire beam. In addition, diffraction and interference phenomena can be
significant especially when the object contains small parts compared to the wavelength.
An example of the resolution limitation is observed in Figure III.11, where one of the scissor
edges is partly invisible. As shown the images, this problem is less damaging with the 287 GHz wave
Surface 1
Surface 2
(a)
(b)
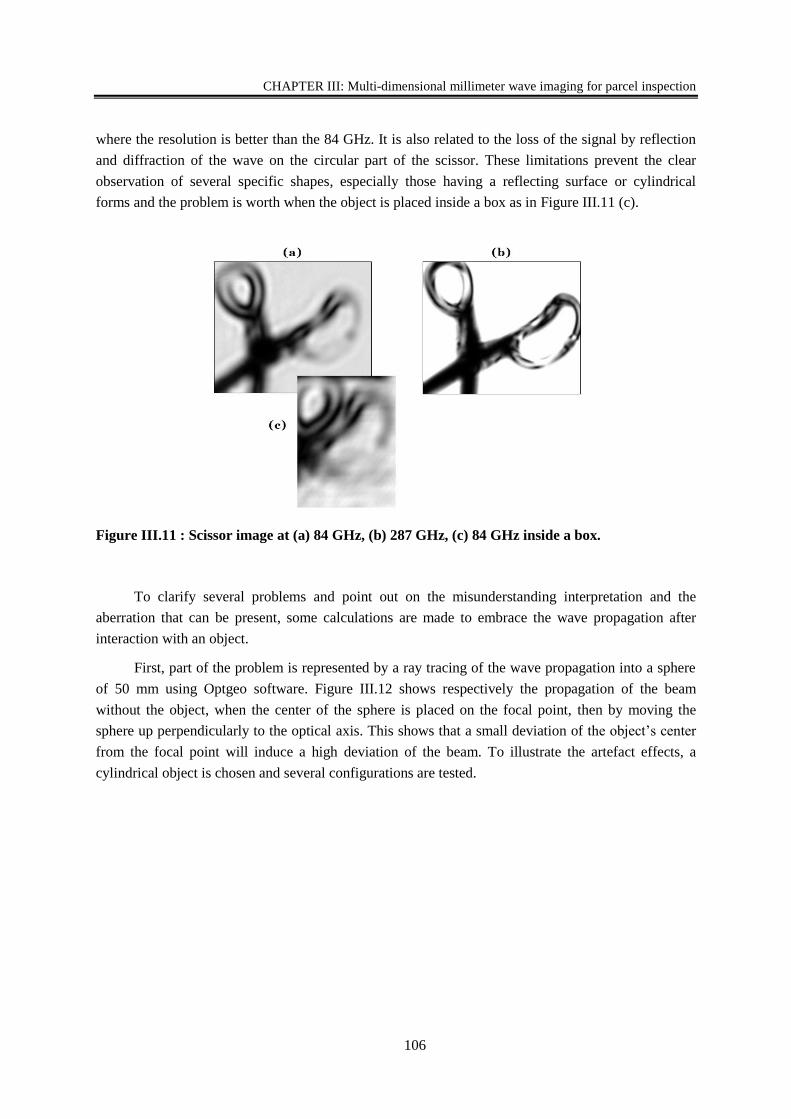
CHAPTER III: Multi-dimensional millimeter wave imaging for parcel inspection
106
where the resolution is better than the 84 GHz. It is also related to the loss of the signal by reflection
and diffraction of the wave on the circular part of the scissor. These limitations prevent the clear
observation of several specific shapes, especially those having a reflecting surface or cylindrical
forms and the problem is worth when the object is placed inside a box as in Figure III.11 (c).
Figure III.11 : Scissor image at (a) 84 GHz, (b) 287 GHz, (c) 84 GHz inside a box.
To clarify several problems and point out on the misunderstanding interpretation and the
aberration that can be present, some calculations are made to embrace the wave propagation after
interaction with an object.
First, part of the problem is represented by a ray tracing of the wave propagation into a sphere
of 50 mm using Optgeo software. Figure III.12 shows respectively the propagation of the beam
without the object, when the center of the sphere is placed on the focal point, then by moving the
sphere up perpendicularly to the optical axis. This shows that a small deviation of the object’s center
from the focal point will induce a high deviation of the beam. To illustrate the artefact effects, a
cylindrical object is chosen and several configurations are tested.
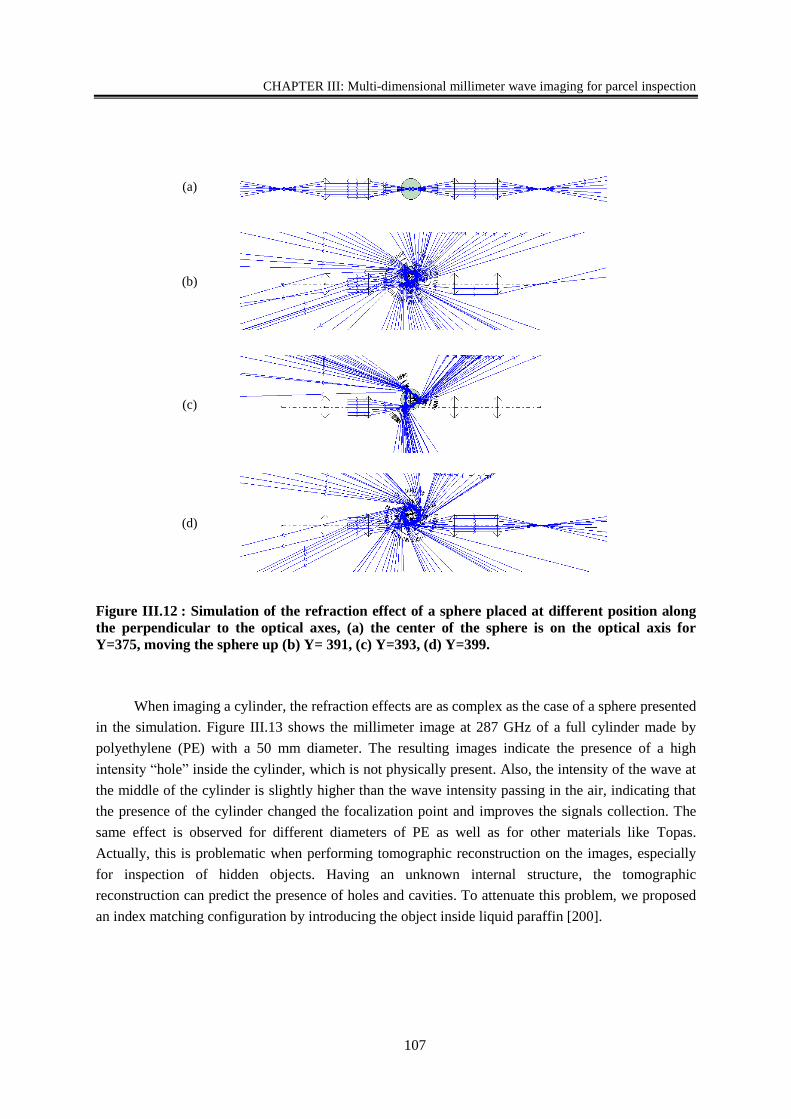
CHAPTER III: Multi-dimensional millimeter wave imaging for parcel inspection
107
Figure III.12 : Simulation of the refraction effect of a sphere placed at different position along
the perpendicular to the optical axes, (a) the center of the sphere is on the optical axis for
Y=375, moving the sphere up (b) Y= 391, (c) Y=393, (d) Y=399.
When imaging a cylinder, the refraction effects are as complex as the case of a sphere presented
in the simulation. Figure III.13 shows the millimeter image at 287 GHz of a full cylinder made by
polyethylene (PE) with a 50 mm diameter. The resulting images indicate the presence of a high
intensity “hole” inside the cylinder, which is not physically present. Also, the intensity of the wave at
the middle of the cylinder is slightly higher than the wave intensity passing in the air, indicating that
the presence of the cylinder changed the focalization point and improves the signals collection. The
same effect is observed for different diameters of PE as well as for other materials like Topas.
Actually, this is problematic when performing tomographic reconstruction on the images, especially
for inspection of hidden objects. Having an unknown internal structure, the tomographic
reconstruction can predict the presence of holes and cavities. To attenuate this problem, we proposed
an index matching configuration by introducing the object inside liquid paraffin [200].
(a)
(b)
(d)
(c)
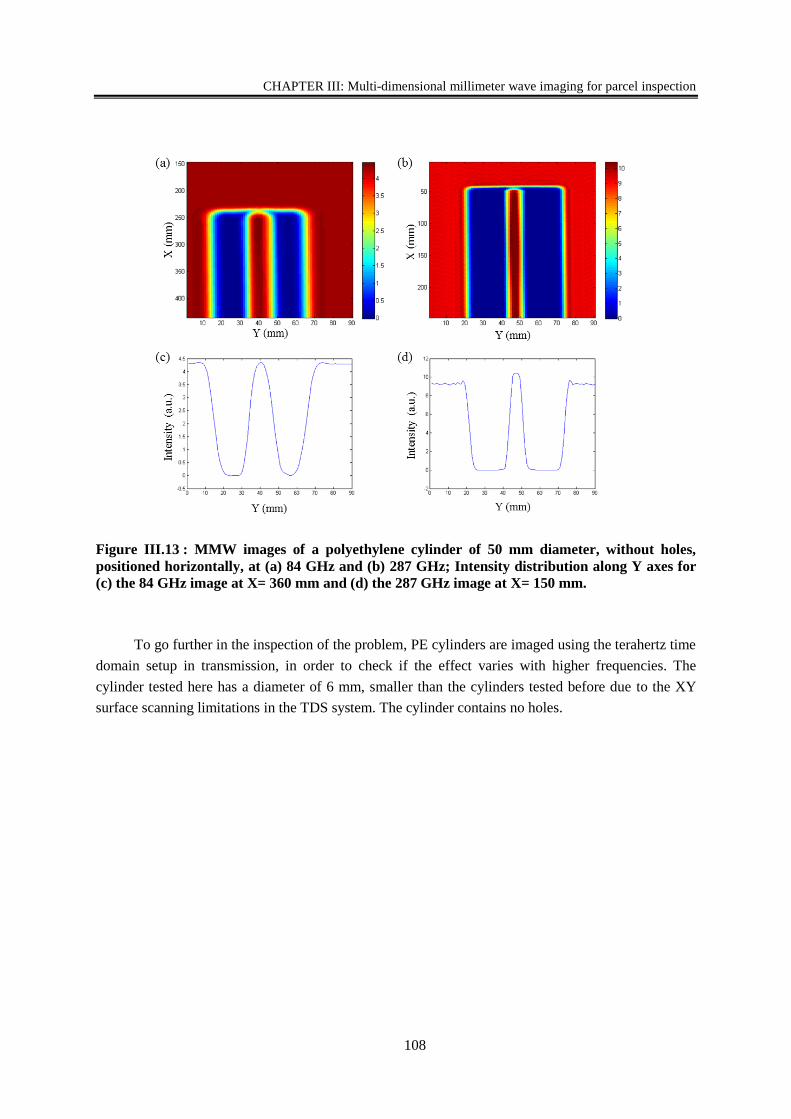
CHAPTER III: Multi-dimensional millimeter wave imaging for parcel inspection
108
Figure III.13 : MMW images of a polyethylene cylinder of 50 mm diameter, without holes,
positioned horizontally, at (a) 84 GHz and (b) 287 GHz; Intensity distribution along Y axes for
(c) the 84 GHz image at X= 360 mm and (d) the 287 GHz image at X= 150 mm.
To go further in the inspection of the problem, PE cylinders are imaged using the terahertz time
domain setup in transmission, in order to check if the effect varies with higher frequencies. The
cylinder tested here has a diameter of 6 mm, smaller than the cylinders tested before due to the XY
surface scanning limitations in the TDS system. The cylinder contains no holes.
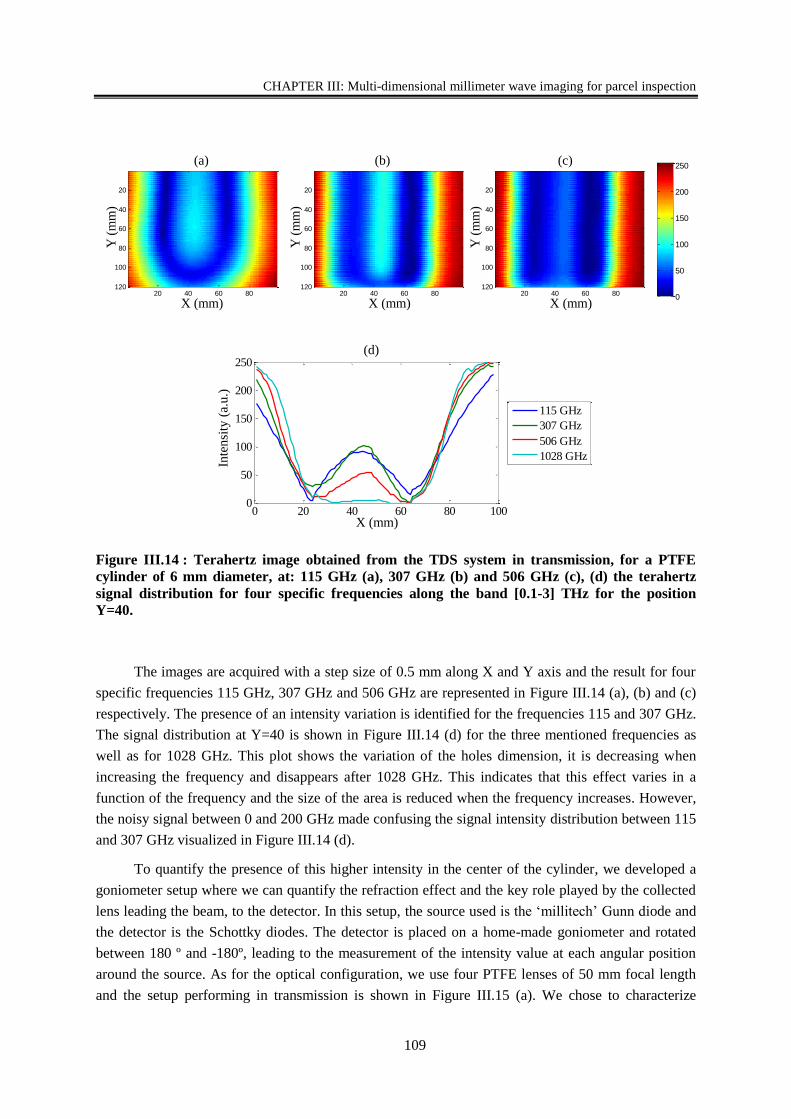
CHAPTER III: Multi-dimensional millimeter wave imaging for parcel inspection
109
Figure III.14 : Terahertz image obtained from the TDS system in transmission, for a PTFE
cylinder of 6 mm diameter, at: 115 GHz (a), 307 GHz (b) and 506 GHz (c), (d) the terahertz
signal distribution for four specific frequencies along the band [0.1-3] THz for the position
Y=40.
The images are acquired with a step size of 0.5 mm along X and Y axis and the result for four
specific frequencies 115 GHz, 307 GHz and 506 GHz are represented in Figure III.14 (a), (b) and (c)
respectively. The presence of an intensity variation is identified for the frequencies 115 and 307 GHz.
The signal distribution at Y=40 is shown in Figure III.14 (d) for the three mentioned frequencies as
well as for 1028 GHz. This plot shows the variation of the holes dimension, it is decreasing when
increasing the frequency and disappears after 1028 GHz. This indicates that this effect varies in a
function of the frequency and the size of the area is reduced when the frequency increases. However,
the noisy signal between 0 and 200 GHz made confusing the signal intensity distribution between 115
and 307 GHz visualized in Figure III.14 (d).
To quantify the presence of this higher intensity in the center of the cylinder, we developed a
goniometer setup where we can quantify the refraction effect and the key role played by the collected
lens leading the beam, to the detector. In this setup, the source used is the ‘millitech’ Gunn diode and
the detector is the Schottky diodes. The detector is placed on a home-made goniometer and rotated
between 180 º and -180º, leading to the measurement of the intensity value at each angular position
around the source. As for the optical configuration, we use four PTFE lenses of 50 mm focal length
and the setup performing in transmission is shown in Figure III.15 (a). We chose to characterize
0 20 40 60 80 1000
50
100
150
200
250
115 GHz
307 GHz
506 GHz
1028 GHz
20 40 60 80
20
40
60
80
100
120 0
50
100
150
200
250
20 40 60 80
20
40
60
80
100
120 0
50
100
150
200
250
20 40 60 80
20
40
60
80
100
120 0
50
100
150
200
250
20 40 60 80
20
40
60
80
100
120 0
50
100
150
200
250
X (mm)
Y (
mm
)
X (mm)Y
(m
m)
X (mm)
Y (
mm
)
(a) (b) (c)
(d)
X (mm)
Inte
nsi
ty (
a.u
.)
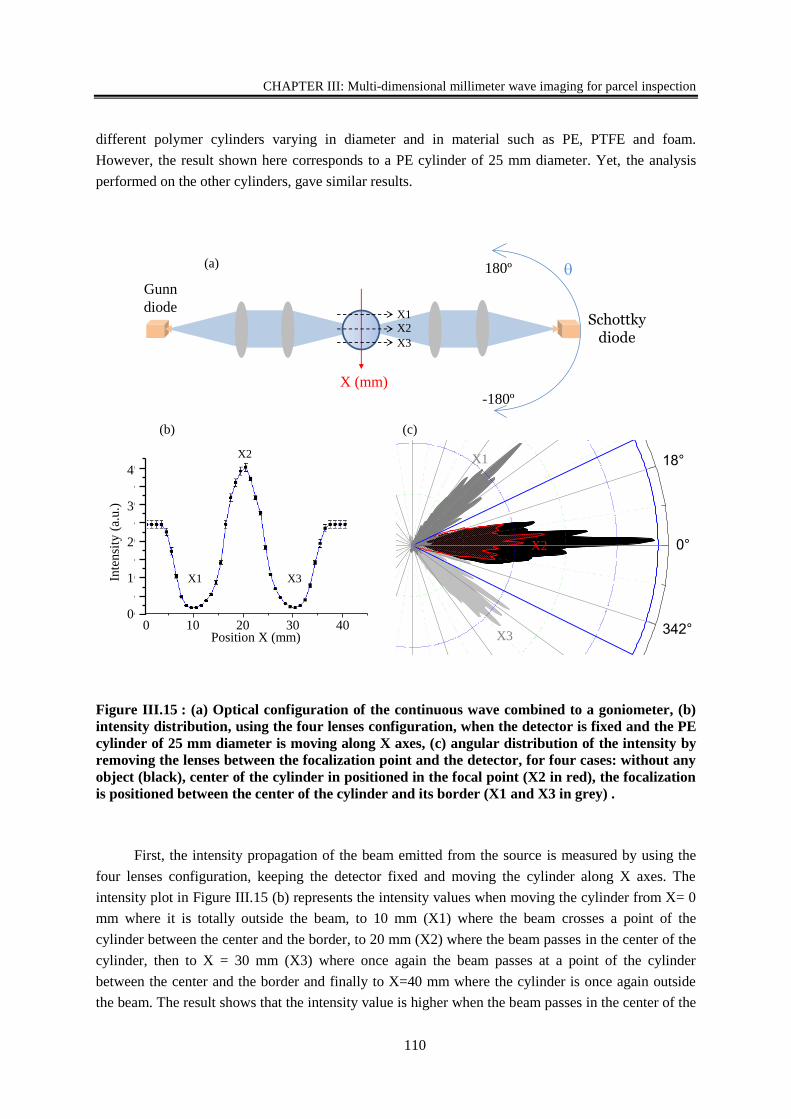
CHAPTER III: Multi-dimensional millimeter wave imaging for parcel inspection
110
different polymer cylinders varying in diameter and in material such as PE, PTFE and foam.
However, the result shown here corresponds to a PE cylinder of 25 mm diameter. Yet, the analysis
performed on the other cylinders, gave similar results.
Figure III.15 : (a) Optical configuration of the continuous wave combined to a goniometer, (b)
intensity distribution, using the four lenses configuration, when the detector is fixed and the PE
cylinder of 25 mm diameter is moving along X axes, (c) angular distribution of the intensity by
removing the lenses between the focalization point and the detector, for four cases: without any
object (black), center of the cylinder in positioned in the focal point (X2 in red), the focalization
is positioned between the center of the cylinder and its border (X1 and X3 in grey) .
First, the intensity propagation of the beam emitted from the source is measured by using the
four lenses configuration, keeping the detector fixed and moving the cylinder along X axes. The
intensity plot in Figure III.15 (b) represents the intensity values when moving the cylinder from X= 0
mm where it is totally outside the beam, to 10 mm (X1) where the beam crosses a point of the
cylinder between the center and the border, to 20 mm (X2) where the beam passes in the center of the
cylinder, then to X = 30 mm (X3) where once again the beam passes at a point of the cylinder
between the center and the border and finally to X=40 mm where the cylinder is once again outside
the beam. The result shows that the intensity value is higher when the beam passes in the center of the
Position X (mm)
Inte
nsi
ty (
a.u
.)
4
3
2
1
00 10 20 30 40
0 10 20 30 40-0,5
0,0
0,5
1,0
1,5
2,0
2,5
3,0
3,5
4,0
Intensité
Inte
nsité
(a.u
)
Position X (mm)
0 10 20 30 40-0,5
0,0
0,5
1,0
1,5
2,0
2,5
3,0
3,5
4,0
Intensité
Inte
nsité
(a
.u)
Position X (mm)
Gunn
diode Schottky
diode
180º
-180º
X (mm)
0
50
100
0°
18°
36°
54°
72°90°
108°
126°
144°
162°
180°
198°
216°
234°
252°270°
288°
306°
324°
342°
0
50
100
(c)
(a)
(b)
X1
X2
X3
X1
X2
X3
X1
X2
X3
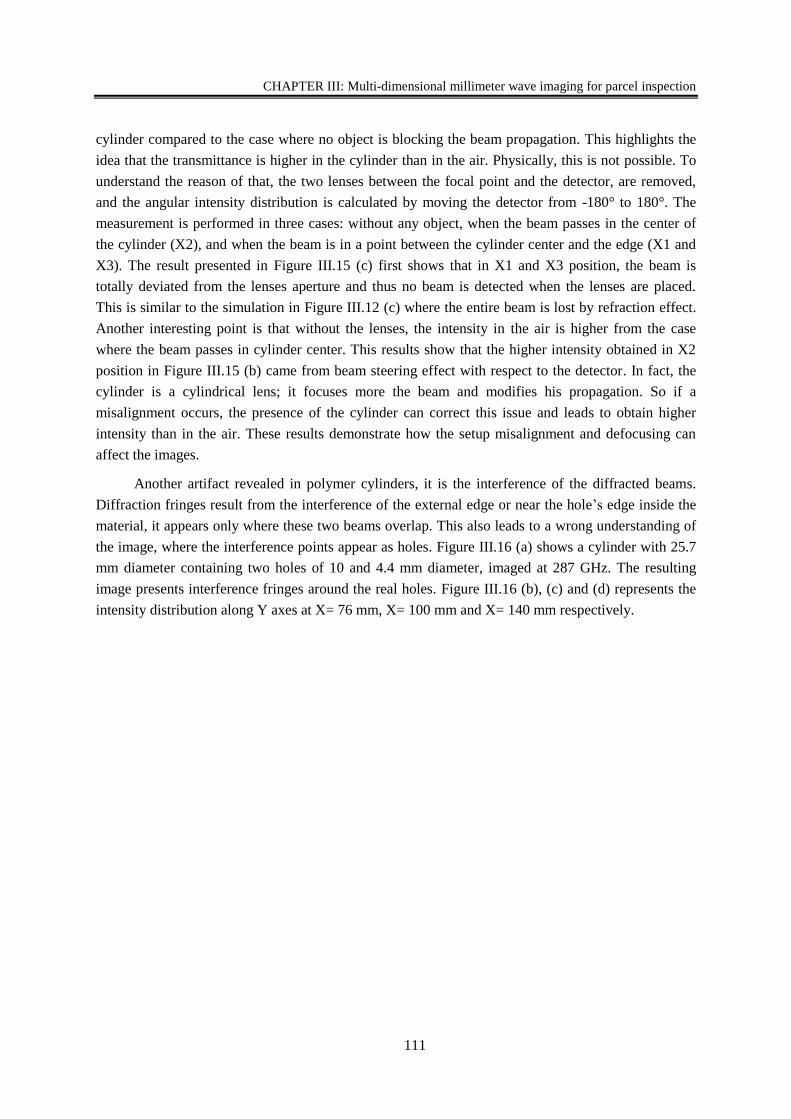
CHAPTER III: Multi-dimensional millimeter wave imaging for parcel inspection
111
cylinder compared to the case where no object is blocking the beam propagation. This highlights the
idea that the transmittance is higher in the cylinder than in the air. Physically, this is not possible. To
understand the reason of that, the two lenses between the focal point and the detector, are removed,
and the angular intensity distribution is calculated by moving the detector from -180° to 180°. The
measurement is performed in three cases: without any object, when the beam passes in the center of
the cylinder (X2), and when the beam is in a point between the cylinder center and the edge (X1 and
X3). The result presented in Figure III.15 (c) first shows that in X1 and X3 position, the beam is
totally deviated from the lenses aperture and thus no beam is detected when the lenses are placed.
This is similar to the simulation in Figure III.12 (c) where the entire beam is lost by refraction effect.
Another interesting point is that without the lenses, the intensity in the air is higher from the case
where the beam passes in cylinder center. This results show that the higher intensity obtained in X2
position in Figure III.15 (b) came from beam steering effect with respect to the detector. In fact, the
cylinder is a cylindrical lens; it focuses more the beam and modifies his propagation. So if a
misalignment occurs, the presence of the cylinder can correct this issue and leads to obtain higher
intensity than in the air. These results demonstrate how the setup misalignment and defocusing can
affect the images.
Another artifact revealed in polymer cylinders, it is the interference of the diffracted beams.
Diffraction fringes result from the interference of the external edge or near the hole’s edge inside the
material, it appears only where these two beams overlap. This also leads to a wrong understanding of
the image, where the interference points appear as holes. Figure III.16 (a) shows a cylinder with 25.7
mm diameter containing two holes of 10 and 4.4 mm diameter, imaged at 287 GHz. The resulting
image presents interference fringes around the real holes. Figure III.16 (b), (c) and (d) represents the
intensity distribution along Y axes at X= 76 mm, X= 100 mm and X= 140 mm respectively.
CHAPTER III: Multi-dimensional millimeter wave imaging for parcel inspection
112
Figure III.16 : (a) MMW images at 287 GHz of a polyethylene cylinder of 25.7 mm diameter,
positioned horizontally, representing two holes with different diameters; Intensity distribution
along Y axes at (b) X= 76 mm, (c) X= 100 mm and (d) X= 140 mm.
II.7. SYNTHESIS
Finally, we presented a continuous wave imaging setup, able to raster scan samples at two
frequencies in transmission and providing intensity measurements at each pixel. With this setup, we
described the different artifacts that can occur when dealing with terahertz imaging, especially for
specific objects such as cylinders. We demonstrated the problematic of misunderstanding the real
structure of an object due to artifacts occurred from the measurements. Moreover, we highlighted the
importance of taking this phenomenon into consideration when dealing with tomography
reconstruction. Further works will be dedicated to integrate this problem when applying tomographic
algorithms.
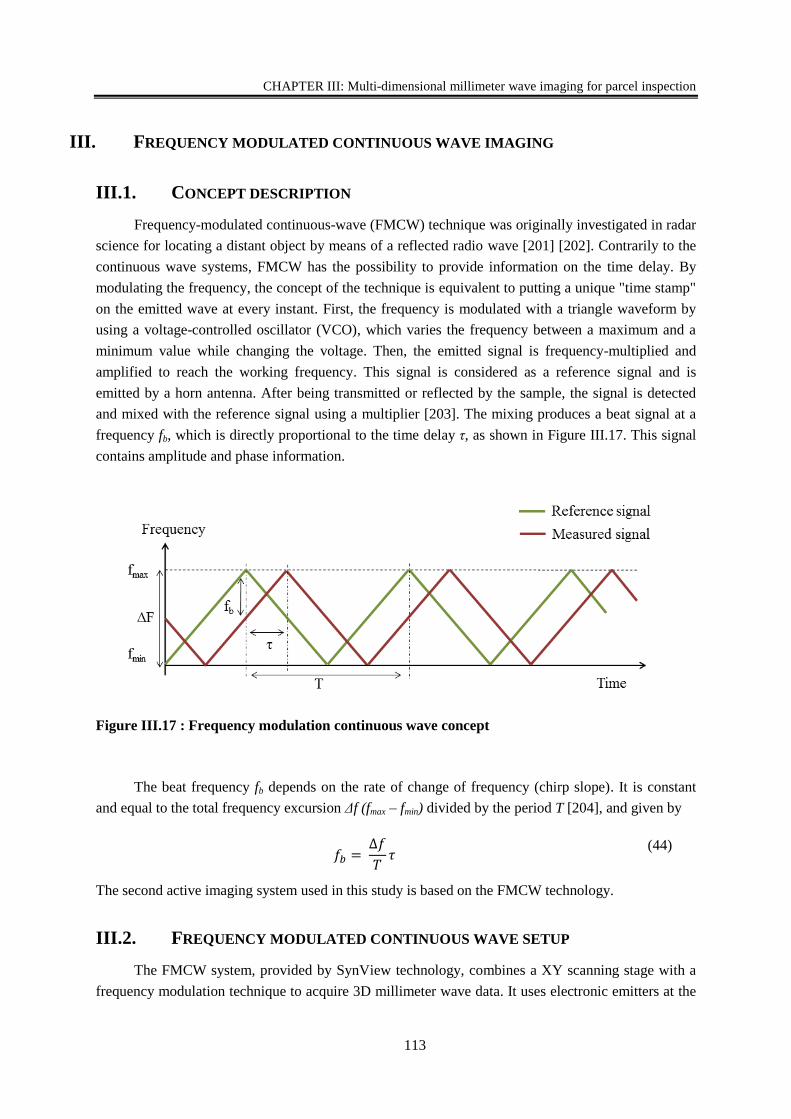
CHAPTER III: Multi-dimensional millimeter wave imaging for parcel inspection
113
III. FREQUENCY MODULATED CONTINUOUS WAVE IMAGING
III.1. CONCEPT DESCRIPTION
Frequency-modulated continuous-wave (FMCW) technique was originally investigated in radar
science for locating a distant object by means of a reflected radio wave [201] [202]. Contrarily to the
continuous wave systems, FMCW has the possibility to provide information on the time delay. By
modulating the frequency, the concept of the technique is equivalent to putting a unique "time stamp"
on the emitted wave at every instant. First, the frequency is modulated with a triangle waveform by
using a voltage-controlled oscillator (VCO), which varies the frequency between a maximum and a
minimum value while changing the voltage. Then, the emitted signal is frequency-multiplied and
amplified to reach the working frequency. This signal is considered as a reference signal and is
emitted by a horn antenna. After being transmitted or reflected by the sample, the signal is detected
and mixed with the reference signal using a multiplier [203]. The mixing produces a beat signal at a
frequency fb, which is directly proportional to the time delay τ, as shown in Figure III.17. This signal
contains amplitude and phase information.
Figure III.17 : Frequency modulation continuous wave concept
The beat frequency fb depends on the rate of change of frequency (chirp slope). It is constant
and equal to the total frequency excursion Δf (fmax – fmin) divided by the period T [204], and given by
𝑓𝑏 = ∆𝑓
𝑇𝜏
(44)
The second active imaging system used in this study is based on the FMCW technology.
III.2. FREQUENCY MODULATED CONTINUOUS WAVE SETUP
The FMCW system, provided by SynView technology, combines a XY scanning stage with a
frequency modulation technique to acquire 3D millimeter wave data. It uses electronic emitters at the
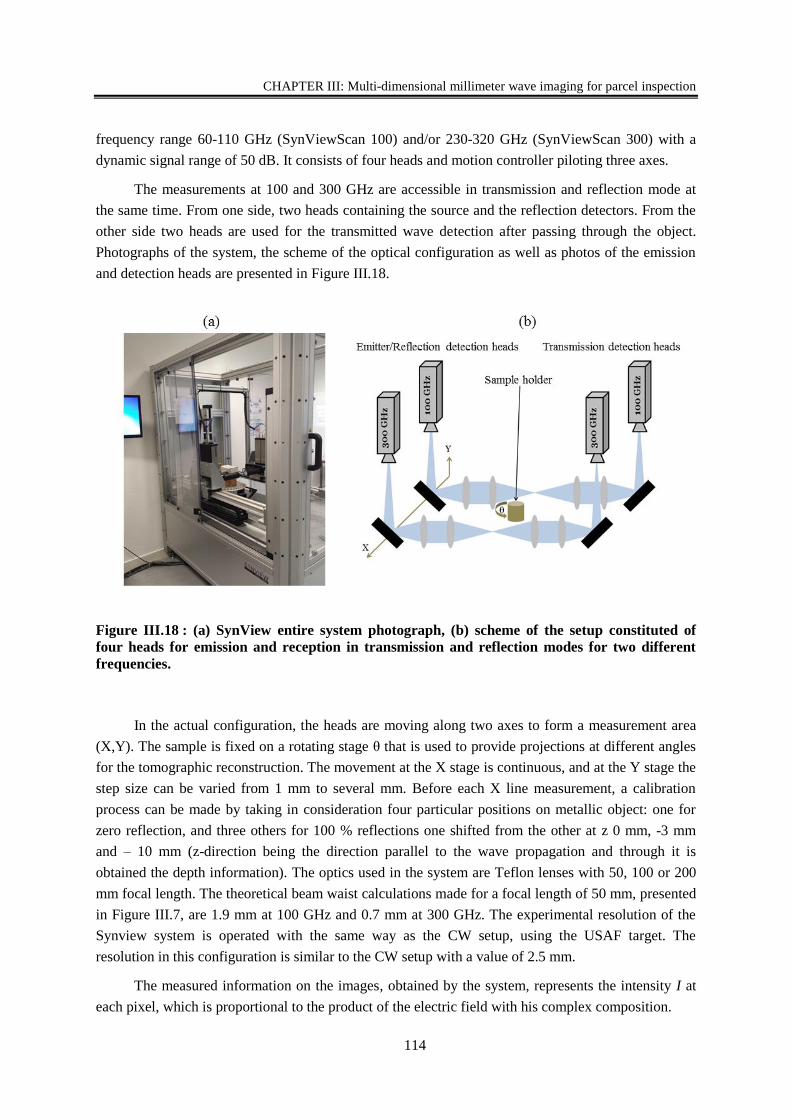
CHAPTER III: Multi-dimensional millimeter wave imaging for parcel inspection
114
frequency range 60-110 GHz (SynViewScan 100) and/or 230-320 GHz (SynViewScan 300) with a
dynamic signal range of 50 dB. It consists of four heads and motion controller piloting three axes.
The measurements at 100 and 300 GHz are accessible in transmission and reflection mode at
the same time. From one side, two heads containing the source and the reflection detectors. From the
other side two heads are used for the transmitted wave detection after passing through the object.
Photographs of the system, the scheme of the optical configuration as well as photos of the emission
and detection heads are presented in Figure III.18.
Figure III.18 : (a) SynView entire system photograph, (b) scheme of the setup constituted of
four heads for emission and reception in transmission and reflection modes for two different
frequencies.
In the actual configuration, the heads are moving along two axes to form a measurement area
(X,Y). The sample is fixed on a rotating stage θ that is used to provide projections at different angles
for the tomographic reconstruction. The movement at the X stage is continuous, and at the Y stage the
step size can be varied from 1 mm to several mm. Before each X line measurement, a calibration
process can be made by taking in consideration four particular positions on metallic object: one for
zero reflection, and three others for 100 % reflections one shifted from the other at z 0 mm, -3 mm
and – 10 mm (z-direction being the direction parallel to the wave propagation and through it is
obtained the depth information). The optics used in the system are Teflon lenses with 50, 100 or 200
mm focal length. The theoretical beam waist calculations made for a focal length of 50 mm, presented
in Figure III.7, are 1.9 mm at 100 GHz and 0.7 mm at 300 GHz. The experimental resolution of the
Synview system is operated with the same way as the CW setup, using the USAF target. The
resolution in this configuration is similar to the CW setup with a value of 2.5 mm.
The measured information on the images, obtained by the system, represents the intensity I at
each pixel, which is proportional to the product of the electric field with his complex composition.
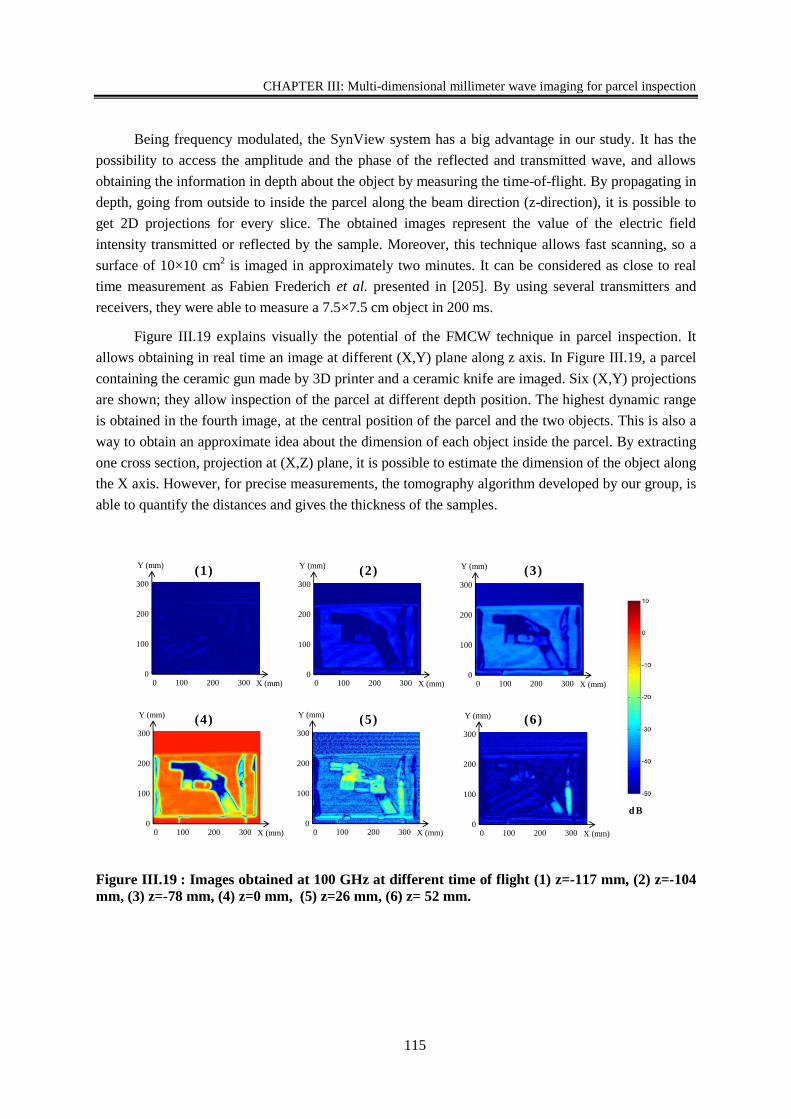
CHAPTER III: Multi-dimensional millimeter wave imaging for parcel inspection
115
Being frequency modulated, the SynView system has a big advantage in our study. It has the
possibility to access the amplitude and the phase of the reflected and transmitted wave, and allows
obtaining the information in depth about the object by measuring the time-of-flight. By propagating in
depth, going from outside to inside the parcel along the beam direction (z-direction), it is possible to
get 2D projections for every slice. The obtained images represent the value of the electric field
intensity transmitted or reflected by the sample. Moreover, this technique allows fast scanning, so a
surface of 10×10 cm2 is imaged in approximately two minutes. It can be considered as close to real
time measurement as Fabien Frederich et al. presented in [205]. By using several transmitters and
receivers, they were able to measure a 7.5×7.5 cm object in 200 ms.
Figure III.19 explains visually the potential of the FMCW technique in parcel inspection. It
allows obtaining in real time an image at different (X,Y) plane along z axis. In Figure III.19, a parcel
containing the ceramic gun made by 3D printer and a ceramic knife are imaged. Six (X,Y) projections
are shown; they allow inspection of the parcel at different depth position. The highest dynamic range
is obtained in the fourth image, at the central position of the parcel and the two objects. This is also a
way to obtain an approximate idea about the dimension of each object inside the parcel. By extracting
one cross section, projection at (X,Z) plane, it is possible to estimate the dimension of the object along
the X axis. However, for precise measurements, the tomography algorithm developed by our group, is
able to quantify the distances and gives the thickness of the samples.
Figure III.19 : Images obtained at 100 GHz at different time of flight (1) z=-117 mm, (2) z=-104
mm, (3) z=-78 mm, (4) z=0 mm, (5) z=26 mm, (6) z= 52 mm.
(1) (3)
(4) (6)
(2)
(5)
d B
0 100 200 300
300
200
100
0 X (mm)
Y (mm)
0 100 200 300
300
200
100
0 X (mm)
Y (mm)
0 100 200 300
300
200
100
0 X (mm)
Y (mm)
0 100 200 300
300
200
100
0 X (mm)
Y (mm)
0 100 200 300
300
200
100
0 X (mm)
Y (mm)
0 100 200 300
300
200
100
0 X (mm)
Y (mm)
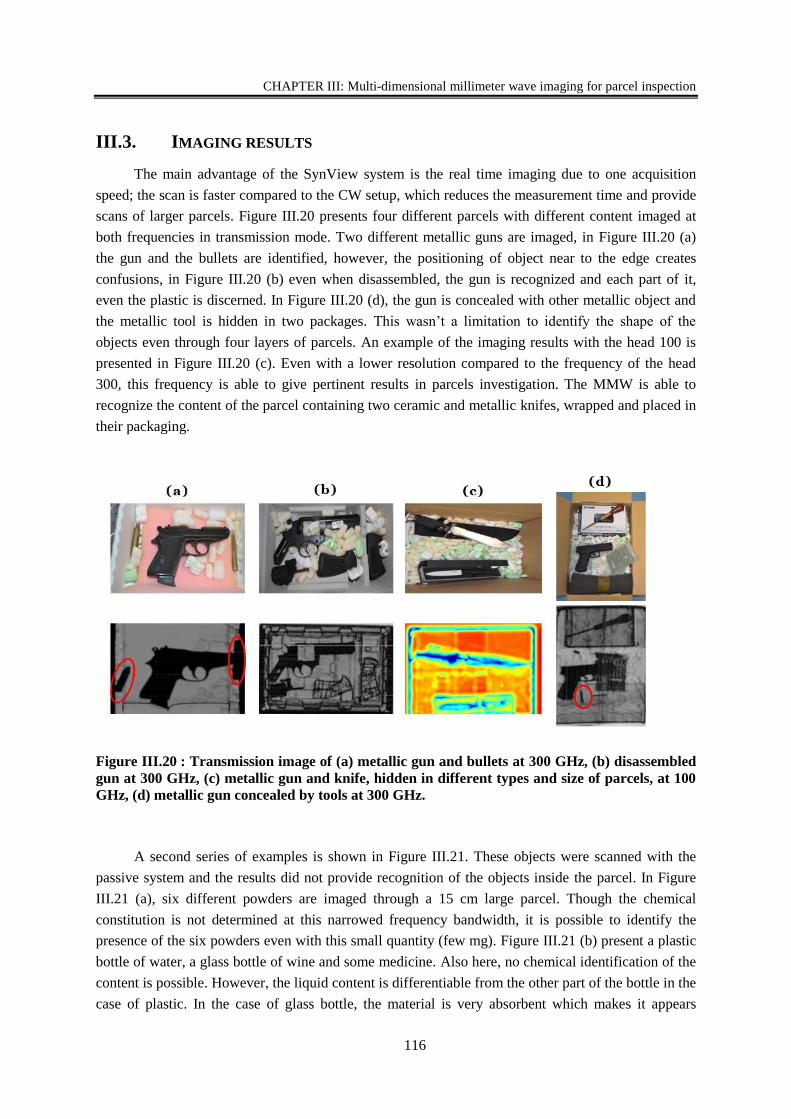
CHAPTER III: Multi-dimensional millimeter wave imaging for parcel inspection
116
III.3. IMAGING RESULTS
The main advantage of the SynView system is the real time imaging due to one acquisition
speed; the scan is faster compared to the CW setup, which reduces the measurement time and provide
scans of larger parcels. Figure III.20 presents four different parcels with different content imaged at
both frequencies in transmission mode. Two different metallic guns are imaged, in Figure III.20 (a)
the gun and the bullets are identified, however, the positioning of object near to the edge creates
confusions, in Figure III.20 (b) even when disassembled, the gun is recognized and each part of it,
even the plastic is discerned. In Figure III.20 (d), the gun is concealed with other metallic object and
the metallic tool is hidden in two packages. This wasn’t a limitation to identify the shape of the
objects even through four layers of parcels. An example of the imaging results with the head 100 is
presented in Figure III.20 (c). Even with a lower resolution compared to the frequency of the head
300, this frequency is able to give pertinent results in parcels investigation. The MMW is able to
recognize the content of the parcel containing two ceramic and metallic knifes, wrapped and placed in
their packaging.
Figure III.20 : Transmission image of (a) metallic gun and bullets at 300 GHz, (b) disassembled
gun at 300 GHz, (c) metallic gun and knife, hidden in different types and size of parcels, at 100
GHz, (d) metallic gun concealed by tools at 300 GHz.
A second series of examples is shown in Figure III.21. These objects were scanned with the
passive system and the results did not provide recognition of the objects inside the parcel. In Figure
III.21 (a), six different powders are imaged through a 15 cm large parcel. Though the chemical
constitution is not determined at this narrowed frequency bandwidth, it is possible to identify the
presence of the six powders even with this small quantity (few mg). Figure III.21 (b) present a plastic
bottle of water, a glass bottle of wine and some medicine. Also here, no chemical identification of the
content is possible. However, the liquid content is differentiable from the other part of the bottle in the
case of plastic. In the case of glass bottle, the material is very absorbent which makes it appears
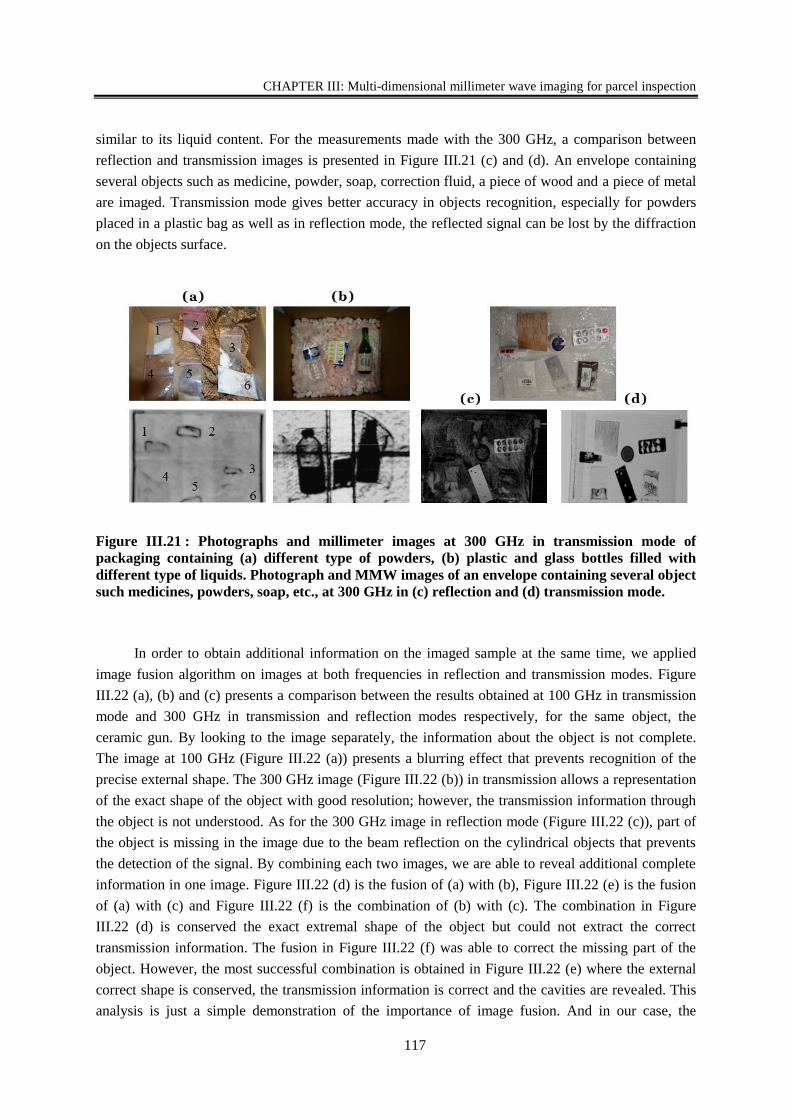
CHAPTER III: Multi-dimensional millimeter wave imaging for parcel inspection
117
similar to its liquid content. For the measurements made with the 300 GHz, a comparison between
reflection and transmission images is presented in Figure III.21 (c) and (d). An envelope containing
several objects such as medicine, powder, soap, correction fluid, a piece of wood and a piece of metal
are imaged. Transmission mode gives better accuracy in objects recognition, especially for powders
placed in a plastic bag as well as in reflection mode, the reflected signal can be lost by the diffraction
on the objects surface.
Figure III.21 : Photographs and millimeter images at 300 GHz in transmission mode of
packaging containing (a) different type of powders, (b) plastic and glass bottles filled with
different type of liquids. Photograph and MMW images of an envelope containing several object
such medicines, powders, soap, etc., at 300 GHz in (c) reflection and (d) transmission mode.
In order to obtain additional information on the imaged sample at the same time, we applied
image fusion algorithm on images at both frequencies in reflection and transmission modes. Figure
III.22 (a), (b) and (c) presents a comparison between the results obtained at 100 GHz in transmission
mode and 300 GHz in transmission and reflection modes respectively, for the same object, the
ceramic gun. By looking to the image separately, the information about the object is not complete.
The image at 100 GHz (Figure III.22 (a)) presents a blurring effect that prevents recognition of the
precise external shape. The 300 GHz image (Figure III.22 (b)) in transmission allows a representation
of the exact shape of the object with good resolution; however, the transmission information through
the object is not understood. As for the 300 GHz image in reflection mode (Figure III.22 (c)), part of
the object is missing in the image due to the beam reflection on the cylindrical objects that prevents
the detection of the signal. By combining each two images, we are able to reveal additional complete
information in one image. Figure III.22 (d) is the fusion of (a) with (b), Figure III.22 (e) is the fusion
of (a) with (c) and Figure III.22 (f) is the combination of (b) with (c). The combination in Figure
III.22 (d) is conserved the exact extremal shape of the object but could not extract the correct
transmission information. The fusion in Figure III.22 (f) was able to correct the missing part of the
object. However, the most successful combination is obtained in Figure III.22 (e) where the external
correct shape is conserved, the transmission information is correct and the cavities are revealed. This
analysis is just a simple demonstration of the importance of image fusion. And in our case, the
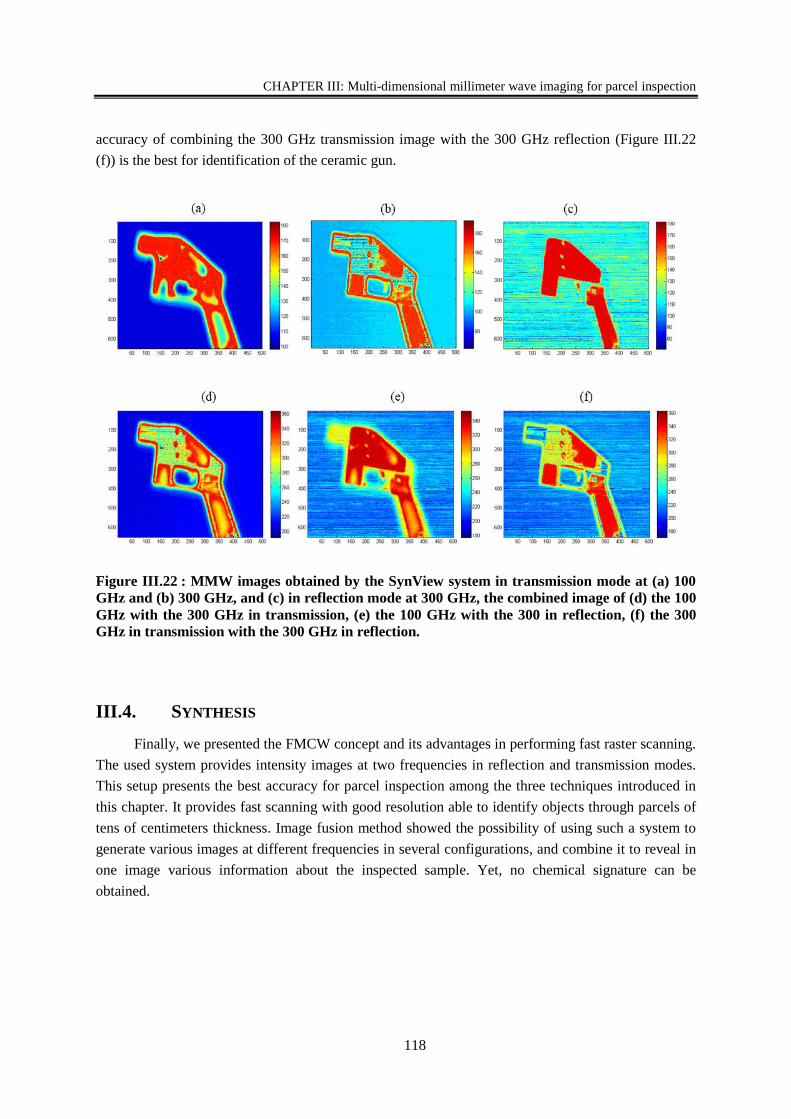
CHAPTER III: Multi-dimensional millimeter wave imaging for parcel inspection
118
accuracy of combining the 300 GHz transmission image with the 300 GHz reflection (Figure III.22
(f)) is the best for identification of the ceramic gun.
Figure III.22 : MMW images obtained by the SynView system in transmission mode at (a) 100
GHz and (b) 300 GHz, and (c) in reflection mode at 300 GHz, the combined image of (d) the 100
GHz with the 300 GHz in transmission, (e) the 100 GHz with the 300 in reflection, (f) the 300
GHz in transmission with the 300 GHz in reflection.
III.4. SYNTHESIS
Finally, we presented the FMCW concept and its advantages in performing fast raster scanning.
The used system provides intensity images at two frequencies in reflection and transmission modes.
This setup presents the best accuracy for parcel inspection among the three techniques introduced in
this chapter. It provides fast scanning with good resolution able to identify objects through parcels of
tens of centimeters thickness. Image fusion method showed the possibility of using such a system to
generate various images at different frequencies in several configurations, and combine it to reveal in
one image various information about the inspected sample. Yet, no chemical signature can be
obtained.
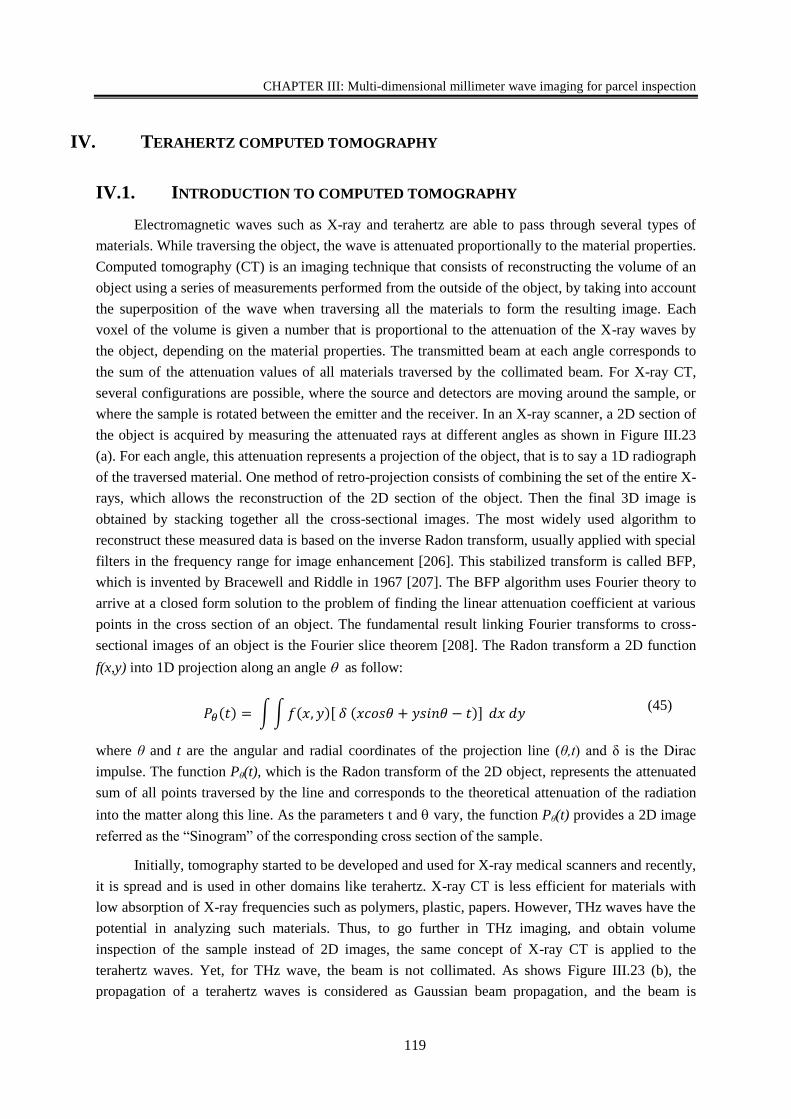
CHAPTER III: Multi-dimensional millimeter wave imaging for parcel inspection
119
IV. TERAHERTZ COMPUTED TOMOGRAPHY
IV.1. INTRODUCTION TO COMPUTED TOMOGRAPHY
Electromagnetic waves such as X-ray and terahertz are able to pass through several types of
materials. While traversing the object, the wave is attenuated proportionally to the material properties.
Computed tomography (CT) is an imaging technique that consists of reconstructing the volume of an
object using a series of measurements performed from the outside of the object, by taking into account
the superposition of the wave when traversing all the materials to form the resulting image. Each
voxel of the volume is given a number that is proportional to the attenuation of the X-ray waves by
the object, depending on the material properties. The transmitted beam at each angle corresponds to
the sum of the attenuation values of all materials traversed by the collimated beam. For X-ray CT,
several configurations are possible, where the source and detectors are moving around the sample, or
where the sample is rotated between the emitter and the receiver. In an X-ray scanner, a 2D section of
the object is acquired by measuring the attenuated rays at different angles as shown in Figure III.23
(a). For each angle, this attenuation represents a projection of the object, that is to say a 1D radiograph
of the traversed material. One method of retro-projection consists of combining the set of the entire X-
rays, which allows the reconstruction of the 2D section of the object. Then the final 3D image is
obtained by stacking together all the cross-sectional images. The most widely used algorithm to
reconstruct these measured data is based on the inverse Radon transform, usually applied with special
filters in the frequency range for image enhancement [206]. This stabilized transform is called BFP,
which is invented by Bracewell and Riddle in 1967 [207]. The BFP algorithm uses Fourier theory to
arrive at a closed form solution to the problem of finding the linear attenuation coefficient at various
points in the cross section of an object. The fundamental result linking Fourier transforms to cross-
sectional images of an object is the Fourier slice theorem [208]. The Radon transform a 2D function
f(x,y) into 1D projection along an angle as follow:
𝑃𝜃(𝑡) = ∫∫𝑓(𝑥, 𝑦)[ 𝛿 (𝑥𝑐𝑜𝑠𝜃 + 𝑦𝑠𝑖𝑛𝜃 − 𝑡)] 𝑑𝑥 𝑑𝑦 (45)
where θ and t are the angular and radial coordinates of the projection line (θ,t) and δ is the Dirac
impulse. The function Pθ(t), which is the Radon transform of the 2D object, represents the attenuated
sum of all points traversed by the line and corresponds to the theoretical attenuation of the radiation
into the matter along this line. As the parameters t and vary, the function Pθ(t) provides a 2D image
referred as the “Sinogram” of the corresponding cross section of the sample.
Initially, tomography started to be developed and used for X-ray medical scanners and recently,
it is spread and is used in other domains like terahertz. X-ray CT is less efficient for materials with
low absorption of X-ray frequencies such as polymers, plastic, papers. However, THz waves have the
potential in analyzing such materials. Thus, to go further in THz imaging, and obtain volume
inspection of the sample instead of 2D images, the same concept of X-ray CT is applied to the
terahertz waves. Yet, for THz wave, the beam is not collimated. As shows Figure III.23 (b), the
propagation of a terahertz waves is considered as Gaussian beam propagation, and the beam is
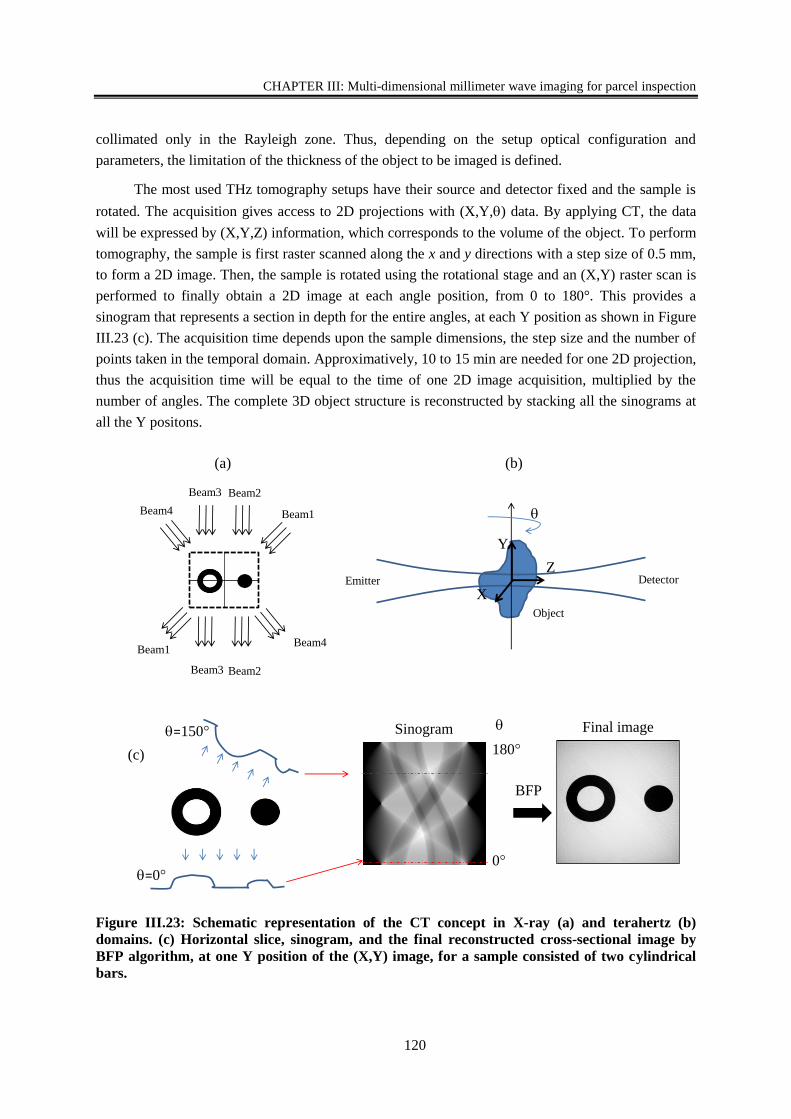
CHAPTER III: Multi-dimensional millimeter wave imaging for parcel inspection
120
collimated only in the Rayleigh zone. Thus, depending on the setup optical configuration and
parameters, the limitation of the thickness of the object to be imaged is defined.
The most used THz tomography setups have their source and detector fixed and the sample is
rotated. The acquisition gives access to 2D projections with (X,Y,) data. By applying CT, the data
will be expressed by (X,Y,Z) information, which corresponds to the volume of the object. To perform
tomography, the sample is first raster scanned along the x and y directions with a step size of 0.5 mm,
to form a 2D image. Then, the sample is rotated using the rotational stage and an (X,Y) raster scan is
performed to finally obtain a 2D image at each angle position, from 0 to 180°. This provides a
sinogram that represents a section in depth for the entire angles, at each Y position as shown in Figure
III.23 (c). The acquisition time depends upon the sample dimensions, the step size and the number of
points taken in the temporal domain. Approximatively, 10 to 15 min are needed for one 2D projection,
thus the acquisition time will be equal to the time of one 2D image acquisition, multiplied by the
number of angles. The complete 3D object structure is reconstructed by stacking all the sinograms at
all the Y positons.
Figure III.23: Schematic representation of the CT concept in X-ray (a) and terahertz (b)
domains. (c) Horizontal slice, sinogram, and the final reconstructed cross-sectional image by
BFP algorithm, at one Y position of the (X,Y) image, for a sample consisted of two cylindrical
bars.
Beam1
Beam2Beam3
Beam4
Beam4
Beam3 Beam2
Beam1
Object
Emitter Detector
Y
X
Z
(a) (b)
0
180
=150
=0
BFP
Final imageSinogram
(c)
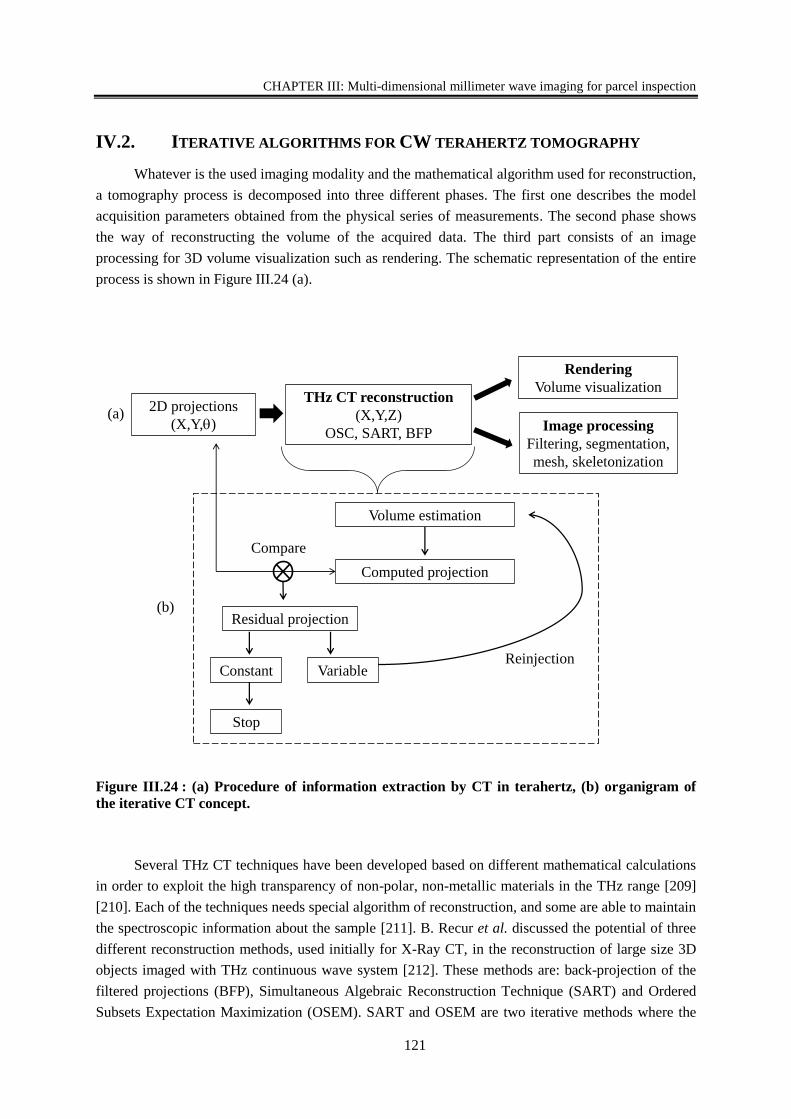
CHAPTER III: Multi-dimensional millimeter wave imaging for parcel inspection
121
IV.2. ITERATIVE ALGORITHMS FOR CW TERAHERTZ TOMOGRAPHY
Whatever is the used imaging modality and the mathematical algorithm used for reconstruction,
a tomography process is decomposed into three different phases. The first one describes the model
acquisition parameters obtained from the physical series of measurements. The second phase shows
the way of reconstructing the volume of the acquired data. The third part consists of an image
processing for 3D volume visualization such as rendering. The schematic representation of the entire
process is shown in Figure III.24 (a).
Figure III.24 : (a) Procedure of information extraction by CT in terahertz, (b) organigram of
the iterative CT concept.
Several THz CT techniques have been developed based on different mathematical calculations
in order to exploit the high transparency of non-polar, non-metallic materials in the THz range [209]
[210]. Each of the techniques needs special algorithm of reconstruction, and some are able to maintain
the spectroscopic information about the sample [211]. B. Recur et al. discussed the potential of three
different reconstruction methods, used initially for X-Ray CT, in the reconstruction of large size 3D
objects imaged with THz continuous wave system [212]. These methods are: back-projection of the
filtered projections (BFP), Simultaneous Algebraic Reconstruction Technique (SART) and Ordered
Subsets Expectation Maximization (OSEM). SART and OSEM are two iterative methods where the
2D projections
(X,Y,)
THz CT reconstruction
(X,Y,Z)
OSC, SART, BFP
Rendering
Volume visualization
Image processing
Filtering, segmentation,
mesh, skeletonization
Volume estimation
Compare
Computed projection
Constant Variable
Stop
Reinjection
(a)
(b)Residual projection
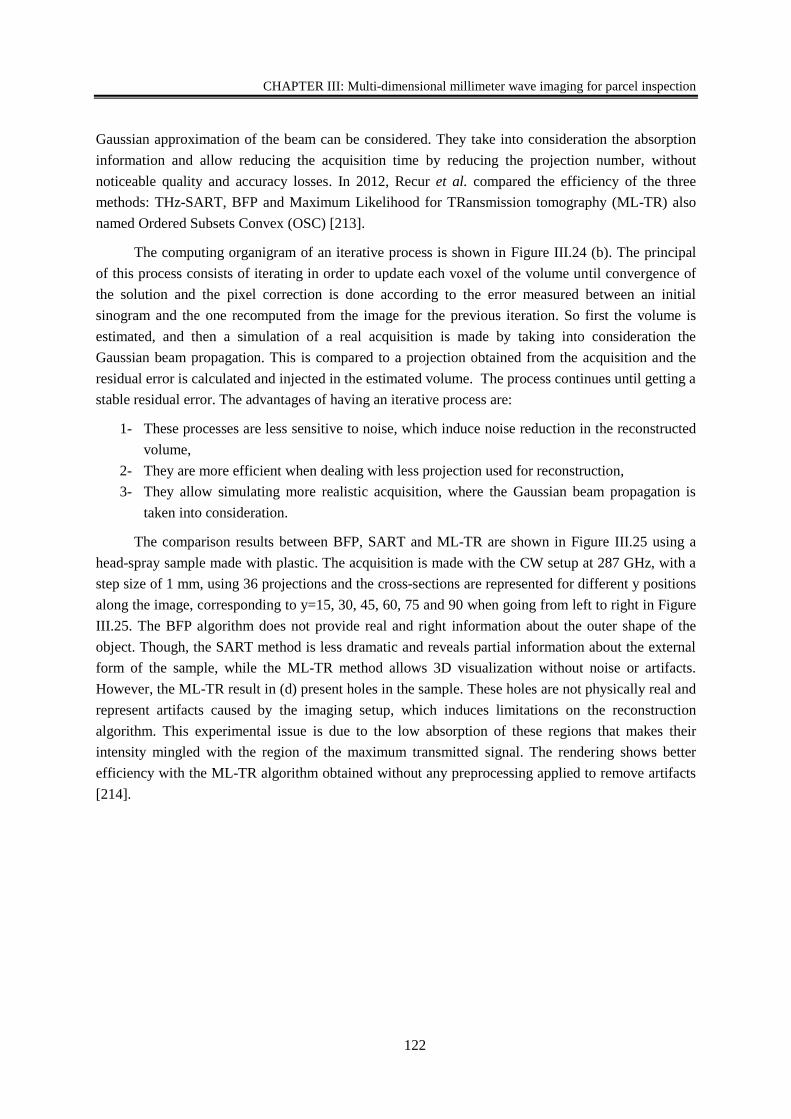
CHAPTER III: Multi-dimensional millimeter wave imaging for parcel inspection
122
Gaussian approximation of the beam can be considered. They take into consideration the absorption
information and allow reducing the acquisition time by reducing the projection number, without
noticeable quality and accuracy losses. In 2012, Recur et al. compared the efficiency of the three
methods: THz-SART, BFP and Maximum Likelihood for TRansmission tomography (ML-TR) also
named Ordered Subsets Convex (OSC) [213].
The computing organigram of an iterative process is shown in Figure III.24 (b). The principal
of this process consists of iterating in order to update each voxel of the volume until convergence of
the solution and the pixel correction is done according to the error measured between an initial
sinogram and the one recomputed from the image for the previous iteration. So first the volume is
estimated, and then a simulation of a real acquisition is made by taking into consideration the
Gaussian beam propagation. This is compared to a projection obtained from the acquisition and the
residual error is calculated and injected in the estimated volume. The process continues until getting a
stable residual error. The advantages of having an iterative process are:
1- These processes are less sensitive to noise, which induce noise reduction in the reconstructed
volume,
2- They are more efficient when dealing with less projection used for reconstruction,
3- They allow simulating more realistic acquisition, where the Gaussian beam propagation is
taken into consideration.
The comparison results between BFP, SART and ML-TR are shown in Figure III.25 using a
head-spray sample made with plastic. The acquisition is made with the CW setup at 287 GHz, with a
step size of 1 mm, using 36 projections and the cross-sections are represented for different y positions
along the image, corresponding to y=15, 30, 45, 60, 75 and 90 when going from left to right in Figure
III.25. The BFP algorithm does not provide real and right information about the outer shape of the
object. Though, the SART method is less dramatic and reveals partial information about the external
form of the sample, while the ML-TR method allows 3D visualization without noise or artifacts.
However, the ML-TR result in (d) present holes in the sample. These holes are not physically real and
represent artifacts caused by the imaging setup, which induces limitations on the reconstruction
algorithm. This experimental issue is due to the low absorption of these regions that makes their
intensity mingled with the region of the maximum transmitted signal. The rendering shows better
efficiency with the ML-TR algorithm obtained without any preprocessing applied to remove artifacts
[214].
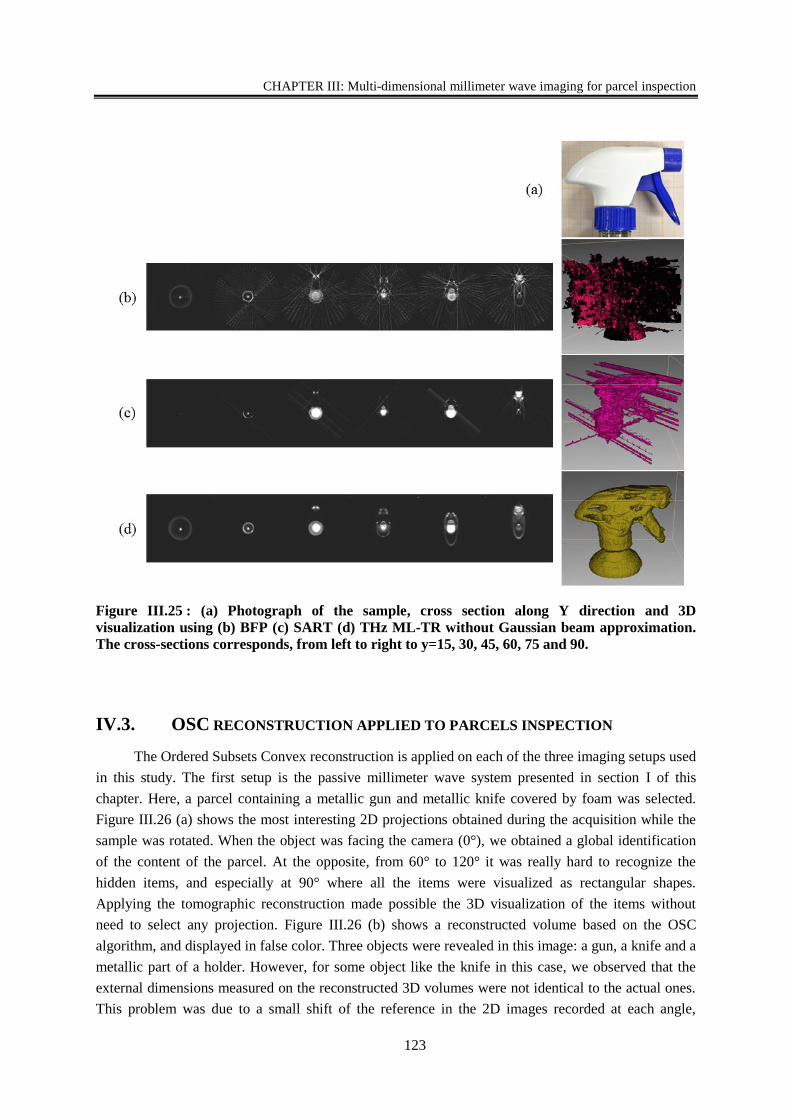
CHAPTER III: Multi-dimensional millimeter wave imaging for parcel inspection
123
Figure III.25 : (a) Photograph of the sample, cross section along Y direction and 3D
visualization using (b) BFP (c) SART (d) THz ML-TR without Gaussian beam approximation.
The cross-sections corresponds, from left to right to y=15, 30, 45, 60, 75 and 90.
IV.3. OSC RECONSTRUCTION APPLIED TO PARCELS INSPECTION
The Ordered Subsets Convex reconstruction is applied on each of the three imaging setups used
in this study. The first setup is the passive millimeter wave system presented in section I of this
chapter. Here, a parcel containing a metallic gun and metallic knife covered by foam was selected.
Figure III.26 (a) shows the most interesting 2D projections obtained during the acquisition while the
sample was rotated. When the object was facing the camera (0°), we obtained a global identification
of the content of the parcel. At the opposite, from 60° to 120° it was really hard to recognize the
hidden items, and especially at 90° where all the items were visualized as rectangular shapes.
Applying the tomographic reconstruction made possible the 3D visualization of the items without
need to select any projection. Figure III.26 (b) shows a reconstructed volume based on the OSC
algorithm, and displayed in false color. Three objects were revealed in this image: a gun, a knife and a
metallic part of a holder. However, for some object like the knife in this case, we observed that the
external dimensions measured on the reconstructed 3D volumes were not identical to the actual ones.
This problem was due to a small shift of the reference in the 2D images recorded at each angle,
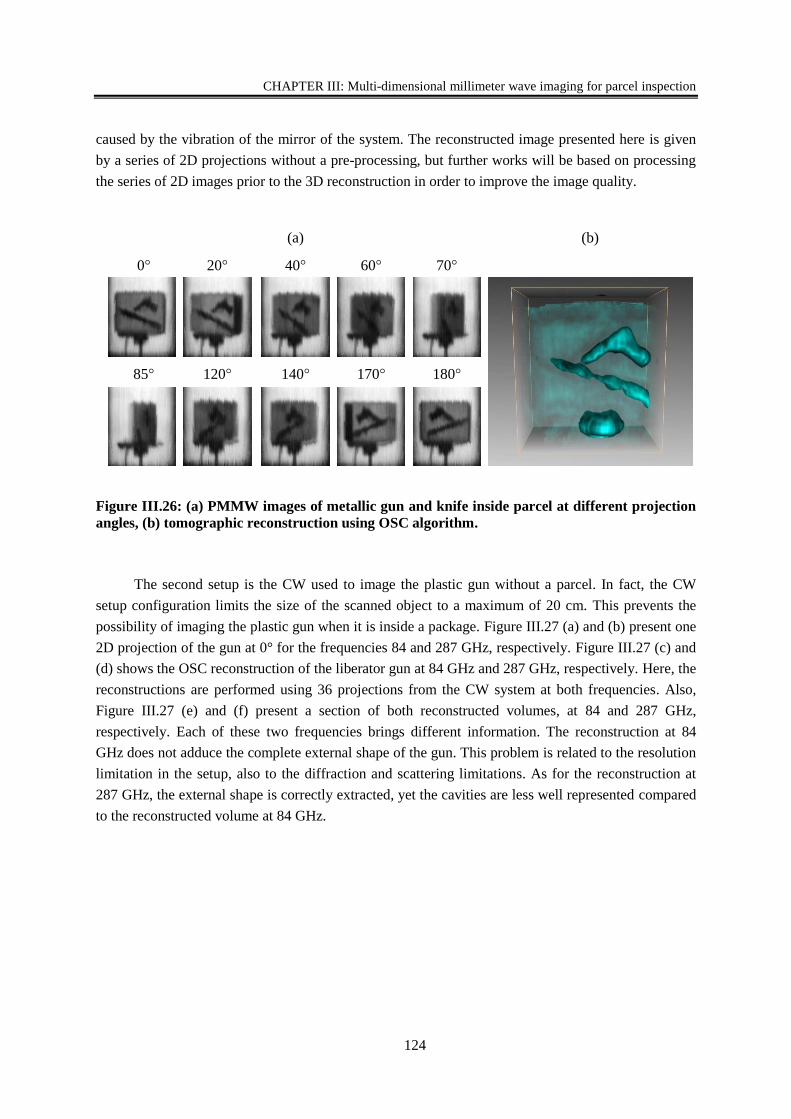
CHAPTER III: Multi-dimensional millimeter wave imaging for parcel inspection
124
caused by the vibration of the mirror of the system. The reconstructed image presented here is given
by a series of 2D projections without a pre-processing, but further works will be based on processing
the series of 2D images prior to the 3D reconstruction in order to improve the image quality.
Figure III.26: (a) PMMW images of metallic gun and knife inside parcel at different projection
angles, (b) tomographic reconstruction using OSC algorithm.
The second setup is the CW used to image the plastic gun without a parcel. In fact, the CW
setup configuration limits the size of the scanned object to a maximum of 20 cm. This prevents the
possibility of imaging the plastic gun when it is inside a package. Figure III.27 (a) and (b) present one
2D projection of the gun at 0° for the frequencies 84 and 287 GHz, respectively. Figure III.27 (c) and
(d) shows the OSC reconstruction of the liberator gun at 84 GHz and 287 GHz, respectively. Here, the
reconstructions are performed using 36 projections from the CW system at both frequencies. Also,
Figure III.27 (e) and (f) present a section of both reconstructed volumes, at 84 and 287 GHz,
respectively. Each of these two frequencies brings different information. The reconstruction at 84
GHz does not adduce the complete external shape of the gun. This problem is related to the resolution
limitation in the setup, also to the diffraction and scattering limitations. As for the reconstruction at
287 GHz, the external shape is correctly extracted, yet the cavities are less well represented compared
to the reconstructed volume at 84 GHz.
(a) (b)
40 0 20 60 70
140 85 120 170 180
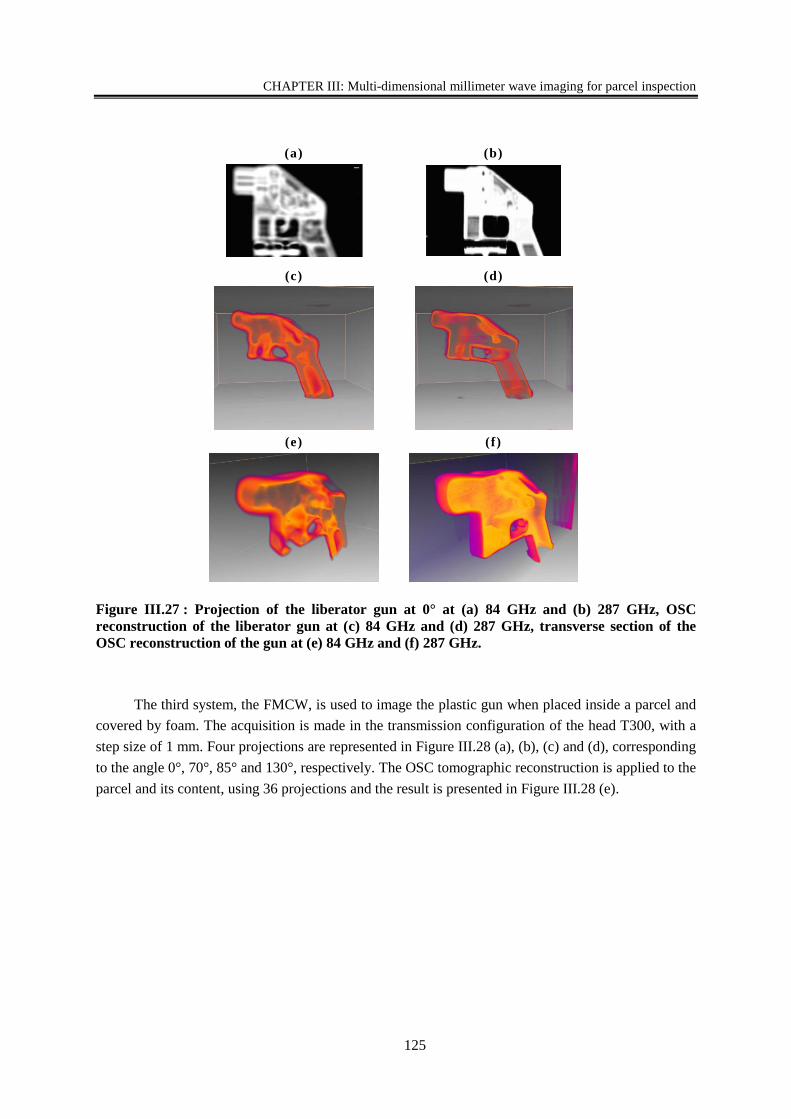
CHAPTER III: Multi-dimensional millimeter wave imaging for parcel inspection
125
Figure III.27 : Projection of the liberator gun at 0° at (a) 84 GHz and (b) 287 GHz, OSC
reconstruction of the liberator gun at (c) 84 GHz and (d) 287 GHz, transverse section of the
OSC reconstruction of the gun at (e) 84 GHz and (f) 287 GHz.
The third system, the FMCW, is used to image the plastic gun when placed inside a parcel and
covered by foam. The acquisition is made in the transmission configuration of the head T300, with a
step size of 1 mm. Four projections are represented in Figure III.28 (a), (b), (c) and (d), corresponding
to the angle 0°, 70°, 85° and 130°, respectively. The OSC tomographic reconstruction is applied to the
parcel and its content, using 36 projections and the result is presented in Figure III.28 (e).
(a) (b)
(c) (d)
(e) (f)
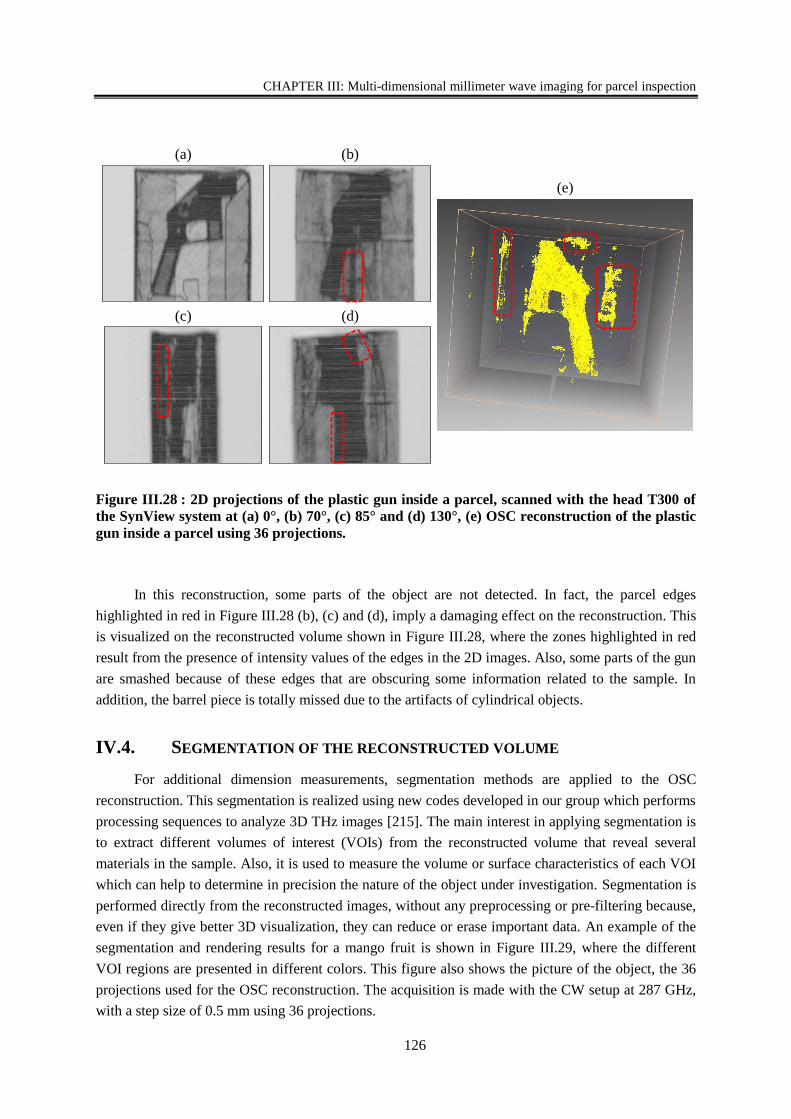
CHAPTER III: Multi-dimensional millimeter wave imaging for parcel inspection
126
Figure III.28 : 2D projections of the plastic gun inside a parcel, scanned with the head T300 of
the SynView system at (a) 0°, (b) 70°, (c) 85° and (d) 130°, (e) OSC reconstruction of the plastic
gun inside a parcel using 36 projections.
In this reconstruction, some parts of the object are not detected. In fact, the parcel edges
highlighted in red in Figure III.28 (b), (c) and (d), imply a damaging effect on the reconstruction. This
is visualized on the reconstructed volume shown in Figure III.28, where the zones highlighted in red
result from the presence of intensity values of the edges in the 2D images. Also, some parts of the gun
are smashed because of these edges that are obscuring some information related to the sample. In
addition, the barrel piece is totally missed due to the artifacts of cylindrical objects.
IV.4. SEGMENTATION OF THE RECONSTRUCTED VOLUME
For additional dimension measurements, segmentation methods are applied to the OSC
reconstruction. This segmentation is realized using new codes developed in our group which performs
processing sequences to analyze 3D THz images [215]. The main interest in applying segmentation is
to extract different volumes of interest (VOIs) from the reconstructed volume that reveal several
materials in the sample. Also, it is used to measure the volume or surface characteristics of each VOI
which can help to determine in precision the nature of the object under investigation. Segmentation is
performed directly from the reconstructed images, without any preprocessing or pre-filtering because,
even if they give better 3D visualization, they can reduce or erase important data. An example of the
segmentation and rendering results for a mango fruit is shown in Figure III.29, where the different
VOI regions are presented in different colors. This figure also shows the picture of the object, the 36
projections used for the OSC reconstruction. The acquisition is made with the CW setup at 287 GHz,
with a step size of 0.5 mm using 36 projections.
(a) (b)
(c) (d)
(e)
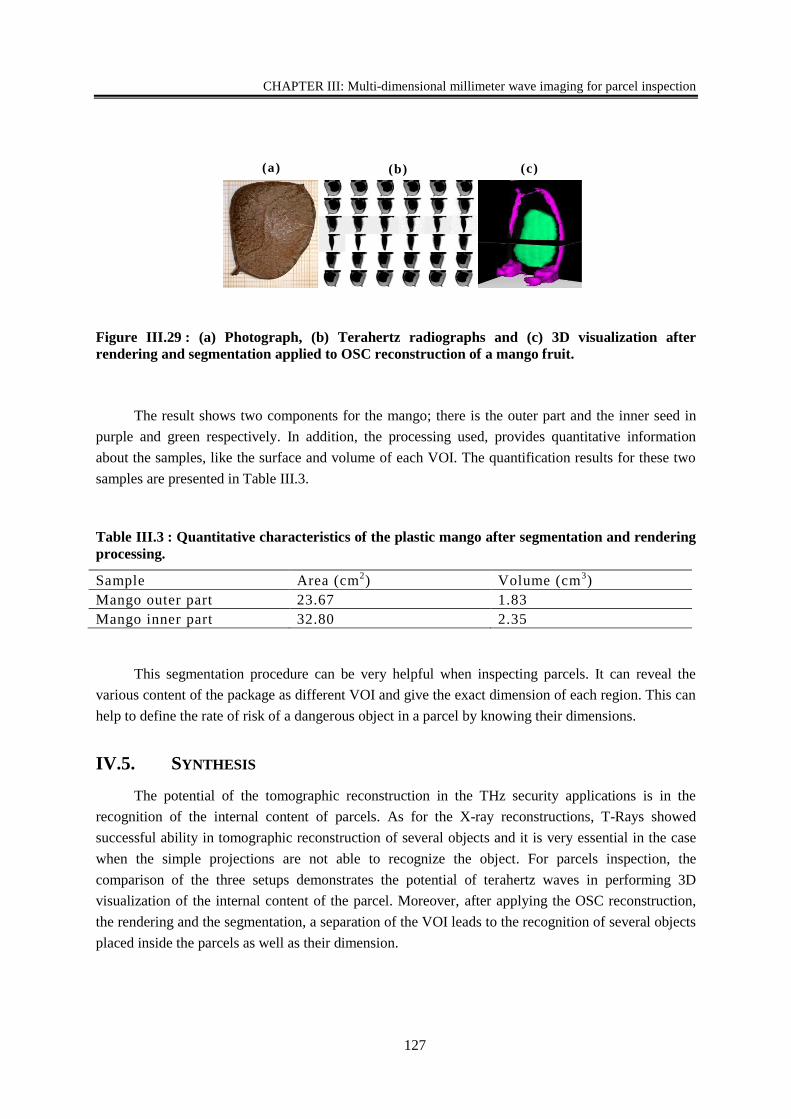
CHAPTER III: Multi-dimensional millimeter wave imaging for parcel inspection
127
Figure III.29 : (a) Photograph, (b) Terahertz radiographs and (c) 3D visualization after
rendering and segmentation applied to OSC reconstruction of a mango fruit.
The result shows two components for the mango; there is the outer part and the inner seed in
purple and green respectively. In addition, the processing used, provides quantitative information
about the samples, like the surface and volume of each VOI. The quantification results for these two
samples are presented in Table III.3.
Table III.3 : Quantitative characteristics of the plastic mango after segmentation and rendering
processing.
Sample Area (cm2) Volume (cm
3)
Mango outer part 23.67 1.83
Mango inner part 32.80 2.35
This segmentation procedure can be very helpful when inspecting parcels. It can reveal the
various content of the package as different VOI and give the exact dimension of each region. This can
help to define the rate of risk of a dangerous object in a parcel by knowing their dimensions.
IV.5. SYNTHESIS
The potential of the tomographic reconstruction in the THz security applications is in the
recognition of the internal content of parcels. As for the X-ray reconstructions, T-Rays showed
successful ability in tomographic reconstruction of several objects and it is very essential in the case
when the simple projections are not able to recognize the object. For parcels inspection, the
comparison of the three setups demonstrates the potential of terahertz waves in performing 3D
visualization of the internal content of the parcel. Moreover, after applying the OSC reconstruction,
the rendering and the segmentation, a separation of the VOI leads to the recognition of several objects
placed inside the parcels as well as their dimension.
(a) (b) (c)
CHAPTER III: Multi-dimensional millimeter wave imaging for parcel inspection
128
CONCLUSION
In this chapter we presented three different imaging techniques and the possible tomography
reconstruction in this domain. The results are shown for parcels inspection application. Yet, the choice
of the technology and the frequency depends on the need of the user: acquisition time, resolution,
power, penetration, etc.
The accuracy of the passive imaging is not the best between the three systems, and cannot be
trusted for complex parcels. However, it is fast and easy to establish in public places. It is more
adequate for body screening than for parcels inspection.
As for the active imaging, both show good accuracy and robust results in parcel inspection. The
CW setup is presented for two different frequencies in transmission mode. The 84 GHz have a higher
power and can penetrate thicker parcels compared to the 287 GHz. Also it has a larger Rayleigh zone
that allows imaging into a larger thickness. However, the resolution is better for the 287 GHz and is
more compatible with small parcels containing tiny details that should be recognized.
On the other hand, the resolution of the SynView setup is better than the CW, and has
additional advantages. By using the FMCW technique, it is possible to access time-of-flight and phase
information thus the ability to image in real time different depth positions inside the parcel. For this
setup, the T300 head in transmission mode showed the best accuracy for parcels screening. Moreover,
we showed that the combination of frequencies and modes is the ideal way for visualization various
type of information in the same image.
Nevertheless, these three technologies cannot be used in security applications only by using 2D
projections, because one projection isn’t always sufficient for identification of all threats. Also, the
interpretation of several 2D projections is difficult to be made by human. Thus, the need of applying
tomographic reconstruction on these technologies to provide 3D visualization and inspection of
objects such parcels and their contents. Also, without tomography, a simple 2D image does not give
the positioning of the objects in the volume and the understanding of the object in question is not
totally possible. For these reasons, a special tomographic algorithm, OSC, is developed for terahertz
Gaussian beam propagation and the results showed a successful 3D reconstruction in passive and
active imaging. However, some limitations prevent obtaining similar performance as in X-ray
tomography. First, the 2D projections suffer from various artifacts that can yield to wrong
understanding of the physical state of an object. Also, the technology limitations in terahertz domain
especially the low penetration power demean the signal after traversing thick objects and that
influences the tomographic reconstruction.
129
GENERAL CONCLUSION AND
PERSPECTIVES
The aim of the present work was to investigate the potential of terahertz as complimentary
solution for inspection of specific parcels from the postal chain. Two types of threats are sought:
weapons and explosives and three investigation methods are performed: terahertz spectroscopy,
imaging and spectral imaging.
The state of the art presented for the different techniques used for threat detection, showed the
need of terahertz technology for non-contact, non-ionizing inspection of parcels, to provide imaging
and spectral information especially for powder samples. In fact, the high potential of terahertz
radiation compared to the used technologies in the postal chain, such as X-ray, is the possibility of the
chemical identification of materials.
For that, we studied the performances of terahertz technology for explosive detection in parcels.
This was achieved by performing terahertz spectroscopy and spectral imaging measurements using
time-domain technology. This modern technology delivers a high signal to noise ratio and an
acceptable effective frequency band, [0-4] THz, which earned it an efficient reliable instrument. With
this system, one spectrum needs several tens of ms to be acquired. As for spectral imaging, one image
acquisition takes longer time due to the need of a raster-scan, which for the postal chain, can be
sometimes considered as a long scanning time.
For postal needs, we performed spectroscopic analysis on several packaging materials. The
outcomes indicate the possibility of measuring through these materials for frequencies up to 3 THz.
Nevertheless, the influence of these materials on the obtained spectra is not neglected, and high care
should be considered when analyzing multi-layered package. Moreover, the spectral analysis was
performed in laboratory conditions, with high concern, in order to extract low noise, repeatable
signals. Yet, the measurements are very sensitive, and for spectroscopy analysis, we observed that a
variation in the product signature can be occurred by:
- Changing the measurement position on a pellet, the signal can vary from point to point on the
same side or from side to another,
- Measuring the same sample obtained from two providers, that can give varying spectra,
GENERAL CONCLUSION AND PERSPECTIVES
130
- The method of the signal extraction, and the reference chosen to do so,
- Dealing with different sample configuration: the product is in powder state, or it is made into
pellets, with or without a binder,
- Dealing with pure elements or mixture of products,
- Having overlap between the spectra of the samples, which make impossible to identify each
element when they are mixed.
All these reasons make complicated the transfer of the technology to the industrial world
especially when we demand to detect mixtures of elements. However, the only way is to implement
statistical methods to analyze the response of the material, such as chemometric tools. With these
tools, it is possible to extract significant information about the data. In our work, we applied three of
these tools on terahertz spectra and spectral images. Principal component analysis (PCA) was
performed to visualize and understand unknown set of data, partial least square (PLS) was used to
create a model able to quantify unknown samples and partial least square-discriminant analysis (PLS-
DA) was established to create a model able to classify unknown explosives.
The quantitative analysis was performed on terahertz spectra by PLS model, on two explosives:
RDX and PETN as well as their mixtures, with varying concentrations. The PLS2 model showed
better performances than the PLS1, with a prediction error of less than 3.5 mg in a mass of 400 mg.
This result is considered very acceptable. Moreover, The PLS2 model was able to quantify explosive
samples in a restricted frequency region even when it presents an overlap and prevent any simple
analysis. This shows that it is not necessary to have access to broadband frequency to be able to
quantify these explosives.
To overwhelm the limitation of analysis on only spectral measurements, and to be capable to
analyze samples directly from an image, chemometric tools were applied on terahertz spectral images.
PCA analysis showed a capability in providing automatically a contrasted image of an unknown set of
data, where it is possible to identify similarity and groups, and to understand the variety of elements
on the image. Then, regions of interest can be extracted to apply a classification model and identify
each component. To do so, the PLS-DA algorithm was performed and the optimum calibration for
classifying unknown data was demonstrated. This model was able to achieve a successful prediction
with 100% of correct classification. Moreover, we demonstrated that a model created by data of
spectroscopic measurements is able to quantify, with an error less than 6 mg inside a 400 mg pellet,
explosives spectra carried out using spectral-imaging measurements.
These examples are the first demonstration of the algorithm that can be integrated into
industrial systems and use terahertz technology to automatically analyze spectral information, even on
images, to identify, discriminate and quantify explosives and explosive mixtures. However, in this
study, we were limited by the variety of samples, due to the difficulty to access such products, and
only binary mixtures were analyzed.
To go further in terahertz spectroscopy for parcel inspection, the response of some explosives
in powders should be analyzed by chemometric tools, because in real life, explosives are not found in
a pellet format. In contrast, this cannot be achieved by transmission configuration due to the high
absorbance of the powder. Thus, the reflection geometry should be performed on explosives.
GENERAL CONCLUSION AND PERSPECTIVES
131
Furthermore, the performances of the models should be tested using spectra of powders measured
though packaging.
As for imaging, we compared the potential of three different millimeter wave imaging
techniques in parcel inspection. The first one is a passive system that is able to image large parcels in
few seconds, yet, the resolution and the signal-to-noise ratio are not efficient for parcels. However,
higher frequencies should be considered.
Active imaging was also tested using two different technologies, CW and FMCW, in
transmission and reflection configurations at two frequencies. The power emitted by the sources of
these two setups was sufficient enough for parcels of tens of centimeter thick with good resolution
and low noise. The reflection configuration presents several limitations that cause the loss of
information on the image due to the loss of the signal by some artifacts. As for transmission
configuration, although the good performances that it showed, when the content of the parcel presents
several juxtaposed objects, the identification of each of them is difficult. In this case, a tomographic
reconstruction can be the solution. For that, we developed the ordered subsets convex (OSC)
algorithm that is compatible with tomographic reconstruction when dealing with a Gaussian
propagation like in the case of the terahertz waves. In comparison to the existent tomographic
algorithm, the OSC showed fewer artifacts obtained from the reconstruction. However, it cannot
remove the physical artifacts caused by the acquisition experiments. Using this algorithm, we
performed for the first time, a tomographic reconstruction of data obtained with a passive imaging
system; also we showed the capacity in reconstructing an object inside a parcel using FMCW imaging
method. Even so, the low penetration power limits the reconstruction performances.
This study successfully shows the potential of 2D and 3D millimeter wave imaging in detecting
threats through packaging; however, terahertz technology cannot perform with the same efficiency as
X-ray systems, which are the main technology used in postal sorting centers. It suffers from several
limitations like the impossibility of measuring through metal.
Finally, terahertz technology showed good and promising performances in parcel inspection for
explosives and weapons detection. Yet, a lot of technological developments are needed in order to
incorporate terahertz technology in the industry. Furthermore, other procedures should be considered
to automate the recognition of objects and reinforce the detection of threats considering the high flow
of parcels in the postal chain. First, statistical methods such the Bayesian algorithm should be used as
preliminary stage of scanning, to class the parcels depending on their label information, such as the
origin, the declared content, the weight, etc. This stage can point out the most suspicious parcels that
need more detailed investigation. Another procedure to be considered and implemented in the chain
scanning process is shape recognition algorithms like those developed by Spykenet technology. These
methods have a high ability in the recognition of objects on X-ray images as well as on terahertz
images in a fast flow of scanning. Adding these complementary techniques shall greatly improve
threats detection within the postal flux.
132
BIBLIOGRAPHY
[1] A. J. Kerecman, “Real Time Millimeter Wave Imaging,” in DEvelopments in Electronic
Imaging Techniques. International Society for Optics and Photonics, 1973, pp. 69–76.
[2] M. R. Scarfi, M. Romano, R. Di Pietro, O. Zeni, A. Doria, G. P. Gallerano, E. Giovenale, G.
Messina, A. Lai, and G. Campurra, “THz exposure of whole blood for the study of biological
effects on human lymphocytes,” J. Biol. Phys., vol. 29, no. 2–3, pp. 171–176, 2003.
[3] D. J. Paul, “The progress towards terahertz quantum cascade lasers on silicon substrates,”
Laser Photon. Rev., vol. 4, no. 5, pp. 610–632, 2010.
[4] B. Gutschwager, C. Monte, H. Delsim-Hashemi, O. Grimm, and J. Hollandt, “Calculable
blackbody radiation as a source for the determination of the spectral responsivity of THz
detectors,” Metrologia, vol. 46, no. 4, p. S165, 2009.
[5] A. Svetlitza, M. Slavenko, T. Blank, I. Brouk, S. Stolyarova, and Y. Nemirovsky, “THz
measurements and calibration based on a blackbody source,” Terahertz Sci. Technol. IEEE
Trans., vol. 4, no. 3, pp. 347–359, 2014.
[6] J.-S. Rieh, D. Yoon, and J. Yun, “An overview of solid-state electronic sources and detectors
for Terahertz imaging,” in Solid-State and Integrated Circuit Technology (ICSICT), 2014 12th
IEEE International Conference on, 2014, pp. 1–4.
[7] J. H. Booske, R. J. Dobbs, C. D. Joye, C. L. Kory, G. R. Neil, G.-S. Park, J. Park, and R. J.
Temkin, “Vacuum electronic high power terahertz sources,” Terahertz Sci. Technol. IEEE
Trans., vol. 1, no. 1, pp. 54–75, 2011.
[8] P. Tan, J. Huang, K. Liu, Y. Xiong, and M. Fan, “Terahertz radiation sources based on free
electron lasers and their applications,” Sci. China Inf. Sci., vol. 55, no. 1, pp. 1–15, 2012.
[9] V. S. Cherkassky, B. A. Knyazev, V. V Kubarev, G. N. Kulipanov, G. L. Kuryshev, A. N.
Matveenko, A. K. Petrov, V. M. Popik, M. A. Scheglov, and O. A. Shevchenko, “Imaging
techniques for a high-power THz free electron laser,” Nucl. Instruments Methods Phys. Res.
Sect. A Accel. Spectrometers, Detect. Assoc. Equip., vol. 543, no. 1, pp. 102–109, 2005.
[10] Y. U. Jeong, G. M. Kazakevitch, H. J. Cha, S. H. Park, and B. C. Lee, “Application of a wide-
band compact FEL on THz imaging,” Nucl. Instruments Methods Phys. Res. Sect. A Accel.
Spectrometers, Detect. Assoc. Equip., vol. 543, no. 1, pp. 90–95, 2005.
[11] C. Sung, S. Y. Tochitsky, J. E. Ralph, S. Reiche, J. B. Rosenzweig, C. Pellegrini, and C. Joshi,
“High-gain seeded FEL amplifier tunable in the terahertz range,” in Proceedings of the 27th
International Free Electron Laser Conference, California, 2005, vol. 87, p. 90.
[12] B. A. Knyazev, G. N. Kulipanov, and N. A. Vinokurov, “Novosibirsk terahertz free electron
laser: instrumentation development and experimental achievements,” Meas. Sci. Technol., vol.
21, no. 5, p. 54017, 2010.
[13] T. Idehara, T. Saito, H. Mori, H. Tsuchiya, L. Agusu, and S. Mitsudo, “The first experiment of
a THz gyrotron with a pulse magnet,” Int. J. Infrared Millimeter Waves, vol. 27, no. 3, pp.
BIBLIOGRAPHY
133
319–331, 2006.
[14] G. Dammertz, S. Alberti, A. Arnold, E. Borie, V. Erckmann, G. Gantenbein, E. Giguet, R.
Heidinger, J. P. Hogge, S. Illy, W. Kasparek, K. Koppenburg, M. Kuntze, H. P. Laqua, G.
LeCloarec, Y. LeGoff, W. Leonhardt, C. Lievin, R. Magne, G. Michel, G. Müller, G. Neffe, B.
Piosczyk, M. Schmid, K. Schwörer, M. K. Thumm, and M. Q. Tran, “Development of a 140-
GHz 1-MW continuous wave gyrotron for the W7-X stellarator,” IEEE Trans. Plasma Sci.,
vol. 30, no. 3 I, pp. 808–818, 2002.
[15] M. Y. Glyavin, N. S. Ginzburg, A. L. Goldenberg, G. G. Denisov, and A. G. Luchinin, “THz
Gyrotrons : Status and Possible Optimizations,” vol. 5, no. 2, pp. 67–77, 2012.
[16] B. Gompf, M. Gerull, T. Müller, and M. Dressel, “THz-micro-spectroscopy with backward-
wave oscillators,” Infrared Phys. Technol., vol. 49, no. 1, pp. 128–132, 2006.
[17] B. Gorshunov, A. Volkov, I. Spektor, A. Prokhorov, A. Mukhin, M. Dressel, S. Uchida, and A.
Loidl, “Terahertz BWO-spectrosopy,” Int. J. Infrared Millimeter Waves, vol. 26, no. 9, pp.
1217–1240, 2005.
[18] A. Dobroiu, M. Yamashita, Y. N. Ohshima, Y. Morita, C. Otani, and K. Kawase, “Terahertz
imaging system based on a backward-wave oscillator,” Appl. Opt., vol. 43, no. 30, pp. 5637–
5646, 2004.
[19] P. Dean, A. Valavanis, J. Keeley, K. Bertling, Y. L. Lim, R. Alhathlool, A. D. Burnett, L. H.
Li, S. P. Khanna, and D. Indjin, “Terahertz imaging using quantum cascade lasers—a review
of systems and applications,” J. Phys. D. Appl. Phys., vol. 47, no. 37, p. 374008, 2014.
[20] B. S. Williams, H. Callebaut, S. Kumar, Q. Hu, and J. L. Reno, “3.4-THz quantum cascade
laser based on longitudinal-optical-phonon scattering for depopulation,” Appl. Phys. Lett., vol.
82, no. 7, pp. 1015–1017, 2003.
[21] C. Worrall, J. Alton, M. Houghton, S. Barbieri, H. E. Beere, D. Ritchie, and C. Sirtori,
“Continuous wave operation of a superlattice quantum cascade laser emitting at 2 THz,” Opt.
Express, vol. 14, no. 1, pp. 171–181, 2006.
[22] A. W. M. Lee, B. S. Williams, S. Kumar, Q. Hu, and J. L. Reno, “Real-time imaging using a
4.3-THz quantum cascade laser and a 320/spl times/240 microbolometer focal-plane array,”
Photonics Technol. Lett. IEEE, vol. 18, no. 13, pp. 1415–1417, 2006.
[23] D. Turčinková, G. Scalari, F. Castellano, M. I. Amanti, M. Beck, and J. Faist, “Ultra-
broadband heterogeneous quantum cascade laser emitting from 2.2 to 3.2 THz,” Appl. Phys.
Lett., vol. 99, no. 19, p. 191104, 2011.
[24] Y. C. Shen, P. C. Upadhya, H. E. Beere, E. H. Linfield, A. G. Davies, I. S. Gregory, C. Baker,
W. R. Tribe, and M. J. Evans, “Generation and detection of ultrabroadband terahertz radiation
using photoconductive emitters and receivers,” Appl. Phys. Lett., vol. 85, no. 2, pp. 164–166,
2004.
[25] J.-L. Coutaz, Optoélectronique térahertz. 2008.
[26] A. Rice, Y. Jin, X. F. Ma, X. Zhang, D. Bliss, J. Larkin, and M. Alexander, “Terahertz optical
rectification from< 110> zinc‐blende crystals,” Appl. Phys. Lett., vol. 64, no. 11, pp. 1324–
1326, 1994.
[27] D. J. Cook and R. M. Hochstrasser, “Intense terahertz pulses by four-wave rectification in air,”
Opt. Lett., vol. 25, no. 16, pp. 1210–1212, 2000.
[28] K. L. Yeh, M. C. Hoffmann, J. Hebling, and K. A. Nelson, “Generation of 10 J ultrashort
terahertz pulses by optical rectification,” Appl. Phys. Lett, vol. 90, no. 17, p. 171121, 2007.
[29] F. Simoens, “THz Bolometer Detectors,” in Physics and Applications of Terahertz Radiation,
Springer, 2014, pp. 35–75.
BIBLIOGRAPHY
134
[30] W. Knap, M. Dyakonov, D. Coquillat, F. Teppe, N. Dyakonova, J. Łusakowski, K. Karpierz,
M. Sakowicz, G. Valusis, and D. Seliuta, “Field effect transistors for terahertz detection:
physics and first imaging applications,” J. Infrared, Millimeter, Terahertz Waves, vol. 30, no.
12, pp. 1319–1337, 2009.
[31] N. Karpowicz, H. Zhong, J. Xu, K.-I. Lin, J.-S. Hwang, and X.-C. Zhang, “Non-destructive
sub-THz CW imaging,” in Integrated Optoelectronic Devices 2005, 2005, pp. 132–142.
[32] M. Tani, M. Herrmann, and K. Sakai, “Generation and detection of terahertz pulsed radiation
with photoconductive antennas and its application to imaging,” Meas. Sci. Technol., vol. 13,
no. 11, p. 1739, 2002.
[33] D. Saeedkia, “Terahertz photoconductive antennas: Principles and applications,” in
Proceedings of the 5th European Conference on Antennas and Propagation (EUCAP), 2011.
[34] Q. Wu and X.-C. Zhang, “7 terahertz broadband GaP electro-optic sensor,” Appl. Phys. Lett.,
vol. 70, no. 14, pp. 1784–1786, 1997.
[35] Q. Wu and X.-C. Zhang, “Design and characterization of traveling-wave electrooptic terahertz
sensors,” Sel. Top. Quantum Electron. IEEE J., vol. 2, no. 3, pp. 693–700, 1996.
[36] A. Markelz, S. Whitmire, J. Hillebrecht, and R. Birge, “THz time domain spectroscopy of
biomolecular conformational modes,” Phys. Med. Biol., vol. 47, no. 21, p. 3797, 2002.
[37] B. M. Fischer, M. Walther, and P. U. Jepsen, “Far-infrared vibrational modes of DNA
components studied by terahertz time-domain spectroscopy,” Phys. Med. Biol., vol. 47, no. 21,
p. 3807, 2002.
[38] P. H. Bolivar, M. Brucherseifer, M. Nagel, H. Kurz, and A. Bosserhoff, “Label-free probing of
genes by time-domain terahertz sensing,” Phys. Med. Biol., vol. 47, no. 21, p. 3815, 2002.
[39] V. P. Wallace, A. J. Fitzgerald, S. Shankar, N. Flanagan, R. Pye, J. Cluff, and D. D. Arnone,
“Terahertz pulsed imaging of basal cell carcinoma ex vivo and in vivo,” Br. J. Dermatol., vol.
151, no. 2, pp. 424–432, 2004.
[40] R. M. Woodward, V. P. Wallace, R. J. Pye, B. E. Cole, D. D. Arnone, E. H. Linfield, and M.
Pepper, “Terahertz pulse imaging of ex vivo basal cell carcinoma,” J. Invest. Dermatol., vol.
120, no. 1, pp. 72–78, 2003.
[41] K. J. Siebert, T. Löffler, H. Quast, M. Thomson, T. Bauer, R. Leonhardt, S. Czasch, and H. G.
Roskos, “All-optoelectronic continuous wave THz imaging for biomedical applications,” Phys.
Med. Biol., vol. 47, no. 21, p. 3743, 2002.
[42] L. Ho, R. Müller, M. Römer, K. C. Gordon, J. Heinämäki, P. Kleinebudde, M. Pepper, T.
Rades, Y. C. Shen, and C. J. Strachan, “Analysis of sustained-release tablet film coats using
terahertz pulsed imaging,” J. Control. release, vol. 119, no. 3, pp. 253–261, 2007.
[43] P. F. Taday, I. V Bradley, D. D. Arnone, and M. Pepper, “Using terahertz pulse spectroscopy
to study the crystalline structure of a drug: a case study of the polymorphs of ranitidine
hydrochloride,” J. Pharm. Sci., vol. 92, no. 4, pp. 831–838, 2003.
[44] J. A. Zeitler, D. A. Newnham, P. F. Taday, T. L. Threlfall, R. W. Lancaster, R. W. Berg, C. J.
Strachan, M. Pepper, K. C. Gordon, and T. Rades, “Characterization of temperature‐induced
phase transitions in five polymorphic forms of sulfathiazole by terahertz pulsed spectroscopy
and differential scanning calorimetry,” J. Pharm. Sci., vol. 95, no. 11, pp. 2486–2498, 2006.
[45] J. B. Jackson, J. Bowen, G. Walker, J. Labaune, G. Mourou, M. Menu, and K. Fukunaga, “A
survey of terahertz applications in cultural heritage conservation science,” IEEE Trans.
Terahertz Sci. Technol, vol. 1, no. 1, pp. 220–231, 2011.
[46] K. Fukunaga and I. Hosako, “Innovative non-invasive analysis techniques for cultural heritage
using terahertz technology,” Comptes Rendus Phys., vol. 11, no. 7, pp. 519–526, 2010.
BIBLIOGRAPHY
135
[47] E. Abraham, A. Younus, J.-C. Delagnes, and P. Mounaix, “Non-invasive investigation of art
paintings by terahertz imaging,” Appl. Phys. A, vol. 100, no. 3, pp. 585–590, 2010.
[48] L. Bassel, J. B. Perraut, J. BouSleiman, B. Bousquet, H. Ballacey, B. Recur, H. Coqueugniot,
N. Del, P. Solar, and R. Chapoulie, “3D terahertz versus X-ray imaging for Mochica ceramic
investigation,” sub. IRMMW-THz, 2014.
[49] G. Ducournau, P. Szriftgiser, A. Beck, D. Bacquet, F. Pavanello, E. Peytavit, M. Zaknoune, T.
Akalin, and J.-F. Lampin, “Ultrawide-bandwidth single-channel 0.4-THz wireless link
combining broadband quasi-optic photomixer and coherent detection,” Terahertz Sci. Technol.
IEEE Trans., vol. 4, no. 3, pp. 328–337, 2014.
[50] T. Kleine-Ostmann and T. Nagatsuma, “A review on terahertz communications research,” J.
Infrared, Millimeter, Terahertz Waves, vol. 32, no. 2, pp. 143–171, 2011.
[51] J. Federici and L. Moeller, “Review of terahertz and subterahertz wireless communications,” J.
Appl. Phys., vol. 107, no. 11, p. 111101, 2010.
[52] Y. Guan, M. Yamamoto, T. Kitazawa, S. R. Tripathi, K. Takeya, and K. Kawase, “A
Concealed Barcode Identification System Using Terahertz Time-domain Spectroscopy,” J.
Infrared, Millimeter, Terahertz Waves, vol. 36, no. 3, pp. 298–311, 2015.
[53] C. O. Marshall, Maurice; Jimmie, Aspects of explosives detection. Elsevier. 2011.
[54] U. S. D. of State, “Overseas bomb threat awareness,” 2001.
[55] K. Podoliak, “The Evolution of the Detonator,” in New Leaders’ Conference, 2004.
[56] Tenney L. Davis and T. L. Davis, The Chemistry of Powder and Explosives. John Wiley, 1943.
[57] D. Cranney and W. Sudweeks, “Chemical explosives,” in Handbook of Industrial Chemistry
and Biotechnology, 2012, pp. 1473–1495.
[58] H. Schubert and K. Andrey, Detection of liquid explosives and flammable agents in connection
with terrorism, no. 1. Springer Science & Business Media, 2008.
[59] T. J. Shaw, D. Brown, J. D’Arcy, F. Liu, P. Shea, M. Sivakumar, and T. Gozani, “Small threat
and contraband detection with TNA-based systems,” Appl. Radiat. Isot., vol. 63, no. 5, pp.
779–782, 2005.
[60] D. Strellis and T. Gozani, “Classifying threats with a 14-MeV neutron interrogation system,”
Appl. Radiat. Isot., vol. 63, no. 5, pp. 799–803, 2005.
[61] D. Sudac, S. Blagus, and V. Valkovic, “Chemical composition identification using fast
neutrons,” Appl. Radiat. Isot., vol. 61, no. 1, pp. 73–79, 2004.
[62] R. Osman, Ahmad; Abd-elrhman, Ashraf; Bashter, ll; Megahid, “Detection and Identification
of Contraband in Air Cargo Containers Using Neutron Based Techniques,” J. Nucl. Energy
Sci. Power Gener. Technol., vol. 2, no. 3, pp. 2–6, 2013.
[63] W. A. Megahid, R.M., Osman, A.M., Kansouhfg, “Neutron Based Techniques for the
Detection of Illicit Materials and Explosives,” 2009.
[64] T. Gozani, “The role of neutron based inspection techniques in the post 9/11/01 era,” Nucl.
Instruments Methods Phys. Res. Sect. B Beam Interact. with Mater. Atoms, vol. 213, pp. 460–
463, 2004.
[65] D. Sudac, S. Blagus, and V. Valkovic, “Inspections for contraband in a shipping container
using fast neutrons and the associated alpha particle technique: Proof of principle,” Nucl.
Instruments Methods Phys. Res. Sect. B Beam Interact. with Mater. Atoms, vol. 241, no. 1, pp.
798–803, 2005.
[66] G. Harding, “X-ray scatter tomography for explosives detection,” Radiat. Phys. Chem., vol.
71, pp. 869–881, 2004.
BIBLIOGRAPHY
136
[67] K. Wells and D. A. Bradley, “A review of X-ray explosives detection techniques for checked
baggage,” Appl. Radiat. Isot., vol. 70, no. 8, pp. 1729–1746, 2012.
[68] R. Ewing, “A critical review of ion mobility spectrometry for the detection of explosives and
explosive related compounds,” Talanta, vol. 54, pp. 515–529, 2001.
[69] G. Reid Asbury, J. Klasmeier, and H. H. Hill, “Analysis of explosives using electrospray
ionization/ion mobility spectrometry (ESI/IMS),” Talanta, vol. 50, no. 6, pp. 1291–1298,
2000.
[70] A. B. Kanu and H. H. Hill, “Ion mobility spectrometry: recent developments and novel
applications,” LabPlus Int. April., no. May, pp. 20–26, 2004.
[71] Z. Takáts, I. Cotte-Rodriguez, N. Talaty, H. Chen, and R. G. Cooks, “Direct, trace level
detection of explosives on ambient surfaces by desorption electrospray ionization mass
spectrometry.,” Chem. Commun. (Camb)., no. 15, pp. 1950–1952, 2005.
[72] J. M. Nilles, T. R. Connell, S. T. Stokes, and H. Dupont Durst, “Explosives detection using
direct analysis in real time (DART) mass spectrometry,” Propellants, Explos. Pyrotech., vol.
35, no. 5, pp. 446–451, 2010.
[73] Y. Zhang, X. Ma, S. Zhang, C. Yang, Z. Ouyang, and X. Zhang, “Direct detection of
explosives on solid surfaces by low temperature plasma desorption mass spectrometry.,”
Analyst, vol. 134, no. 1, pp. 176–181, 2009.
[74] D. R. Justes, N. Talaty, I. Cotte-Rodriguez, and R. G. Cooks, “Detection of explosives on skin
using ambient ionization mass spectrometry.,” Chem. Commun. (Camb)., no. 21, pp. 2142–
2144, 2007.
[75] N. Gupta and R. Dahmani, “AOTF Raman spectrometer for remote detection of explosives,”
Spectrochim. Acta Part A Mol. Biomol. Spectrosc., vol. 56, no. 8, pp. 1453–1456, 2000.
[76] J. C. Carter, S. M. Angel, M. Lawrence-Snyder, J. Scaffidi, R. E. Whipple, and J. G. Reynolds,
“Standoff detection of high explosive materials at 50 meters in ambient light conditions using
a small Raman instrument,” Appl. Spectrosc., vol. 59, no. 6, pp. 769–775, 2005.
[77] D. S. Moore and R. J. Scharff, “Portable Raman explosives detection,” Anal. Bioanal. Chem.,
vol. 393, no. 6–7, pp. 1571–1578, 2009.
[78] R. M. Wentworth, J. Neiss, M. P. Nelson, and P. J. Treado, “Standoff Raman hyperspectral
imaging detection of explosives,” in Antennas and Propagation Society International
Symposium, 2007 IEEE, 2007, pp. 4925–4928.
[79] J. Moros, J. A. Lorenzo, P. Lucena, L. Miguel Tobaria, and J. J. Laserna, “Simultaneous
Raman Spectroscopy− Laser-Induced Breakdown Spectroscopy for instant standoff analysis of
explosives using a mobile integrated sensor platform,” Anal. Chem., vol. 82, no. 4, pp. 1389–
1400, 2010.
[80] S. Singh, “Sensors—an effective approach for the detection of explosives,” J. Hazard. Mater.,
vol. 144, no. 1, pp. 15–28, 2007.
[81] L. Senesac and T. G. Thundat, “Nanosensors for trace explosive detection,” Mater. Today, vol.
11, no. 3, pp. 28–36, 2008.
[82] G. S. Dow, D. C. W. Lo, Y. Guo, E. W. Lin, T. T. Chung, M. D. Biedenbender, O.
Miromontes, A. Marashi, L. Yujiri, and P. S. C. Lee, “Large scale W-band focal plane array
for passive radiometric imaging,” in Microwave Symposium Digest, 1996., IEEE MTT-S
International, 1996, vol. 1, pp. 369–372.
[83] C. Martin, S. Clark, J. Galliano, and J. Lovberg, “Advances in millimeter-wave imaging
technology for enhanced vision systems,” in Digital Avionics Systems Conference, 2002.
Proceedings. The 21st, 2002, vol. 2, pp. 11D4–1.
BIBLIOGRAPHY
137
[84] R. Appleby, R. N. Anderton, S. Price, N. A. Salmon, G. N. Sinclair, P. R. Coward, A. R.
Barnes, P. D. Munday, M. Moore, and A. H. Lettington, “Mechanically scanned real-time
passive millimeter-wave imaging at 94 GHz,” in AeroSense 2003, 2003, pp. 1–6.
[85] R. N. Anderton, R. Appleby, J. E. Beale, P. R. Coward, and S. Price, “Security scanning at
94GHz,” in Defense and Security Symposium, 2006, p. 62110C–62110C.
[86] J. Lampin, M. Zaknoune, X. Wallart, L. Desplanque, E. Peytavit, and G. Ducournau,
“Millimeter wave passive radiometric imaging system,” 2012.
[87] B. Rajaonah, J.-B. Ravenel, J. C. Castelli, A. Osmont, P. Cabrol, and G. Le Fur, “Acceptabilité
des scanners de sûreté dans les aéroports français,” in Workshop Interdisciplinaire sur la
Sécurité Globale-WISG2013, 2013.
[88] N. A. Salmon, J. Beale, S. Hayward, P. Hall, R. Macpherson, R. Metcalfe, and A. Harvey,
“Compact and light-weight digital beam-forming passive millimetre-wave imagers,” in SPIE
Europe Security and Defence, 2008, p. 711709.
[89] A. Luukanen, R. Appleby, M. Kemp, and N. Salmon, “Millimeter-wave and terahertz imaging
in security applications,” in Terahertz Spectroscopy and Imaging, Springer, 2012, pp. 491–
520.
[90] D. L. McMakin, P. E. Keller, D. M. Sheen, and T. E. Hall, “Dual-surface dielectric depth
detector for holographic millimeter-wave security scanners,” in SPIE Defense, Security, and
Sensing, 2009, p. 73090G–73090G.
[91] D. M. Sheen, D. L. McMakin, and T. E. Hall, “Three-dimensional millimeter-wave imaging
for concealed weapon detection,” Microw. Theory Tech. IEEE Trans., vol. 49, no. 9, pp. 1581–
1592, 2001.
[92] H. Essen, R. Zimmermann, S. Hantscher, and N. Pohl, “3D millimetre-wave scanner for
luggage and parcels,” in SPIE Security+ Defence, 2012, p. 854406.
[93] H.-B. Liu, H. Zhong, N. Karpowicz, Y. Chen, and X.-C. Zhang, “Terahertz Spectroscopy and
Imaging for Defense and Security Applications,” Proc. IEEE IEEE, vol. 95, no. 8, pp. 1514–
1527, 2007.
[94] E. Öjefors, N. Baktash, Y. Zhao, R. Al Hadi, H. Sherry, and U. R. Pfeiffer, “Terahertz imaging
detectors in a 65-nm CMOS SOI technology,” in ESSCIRC, 2010 Proceedings of the, 2010,
pp. 486–489.
[95] D. G. Allis, D. A. Prokhorova, A. M. Fedor, and T. M. Korter, “First principles analysis of the
terahertz spectrum of PETN,” in Defense and Security Symposium, 2006, p. 62120F–62120F.
[96] R. Beigang, S. G. Biedron, S. Dyjak, F. Ellrich, M. W. Haakestad, D. Hübsch, T. Kartaloglu,
E. Ozbay, F. Ospald, and N. Palka, “Comparison of terahertz technologies for detection and
identification of explosives,” in SPIE Sensing Technology+ Applications, 2014, p. 91020C–
91020C.
[97] A. G. Davies, A. D. Burnett, W. Fan, E. H. Linfield, and J. E. Cunningham, “Terahertz
spectroscopy of explosives and drugs,” Mater. today, vol. 11, no. 3, pp. 18–26, 2008.
[98] Y. Hu, P. Huang, L. Guo, X. Wang, and C. Zhang, “Terahertz spectroscopic investigations of
explosives,” Phys. Lett. A, vol. 359, no. 6, pp. 728–732, 2006.
[99] M. R. Leahy-Hoppa, M. J. Fitch, and R. Osiander, “Terahertz spectroscopy techniques for
explosives detection,” Anal. Bioanal. Chem., vol. 395, no. 2, pp. 247–257, 2009.
[100] N. Palka, “Identification of concealed materials, including explosives, by terahertz reflection
spectroscopy,” Opt. Eng., vol. 53, no. 3, p. 31202, 2014.
[101] W. R. Tribe, D. A. Newnham, P. F. Taday, and M. C. Kemp, “Hidden object detection:
security applications of terahertz technology,” in Integrated Optoelectronic Devices 2004,
BIBLIOGRAPHY
138
2004, pp. 168–176.
[102] H.-B. Liu, Y. Chen, G. J. Bastiaans, and X.-C. Zhang, “Detection and identification of
explosive RDX by THz diffuse reflection spectroscopy,” Opt. Express, vol. 14, no. 1, pp. 415–
423, 2006.
[103] M. C. Kemp, “Explosives detection by terahertz spectroscopy—a bridge too far?,” Terahertz
Sci. Technol. IEEE Trans., vol. 1, no. 1, pp. 282–292, 2011.
[104] T. Ikeda, A. Matsushita, M. Tatsuno, Y. Minami, M. Yamaguchi, K. Yamamoto, M. Tani, and
M. Hangyo, “Investigation of inflammable liquids by terahertz spectroscopy,” Appl. Phys.
Lett., vol. 87, no. 3, p. 34105, 2005.
[105] K. Kawase, Y. Ogawa, Y. Watanabe, and H. Inoue, “Non-destructive terahertz imaging of
illicit drugs using spectral fingerprints,” Opt. Express, vol. 11, no. 20, pp. 2549–2554, 2003.
[106] Y. C. Shen, P. F. Taday, D. A. Newnham, and M. Pepper, “Chemical mapping using reflection
terahertz pulsed imaging,” Semicond. Sci. Technol., vol. 20, no. 7, p. S254, 2005.
[107] B. Fischer, M. Hoffmann, H. Helm, G. Modjesch, and P. U. Jepsen, “Chemical recognition in
terahertz time-domain spectroscopy and imaging,” Semicond. Sci. Technol., vol. 20, no. 7, p.
S246, 2005.
[108] Y. Ueno and K. Ajito, “Analytical terahertz spectroscopy,” Anal. Sci., vol. 24, no. 2, pp. 185–
192, 2008.
[109] M. Hangyo, M. Tani, and T. Nagashima, “Terahertz time-domain spectroscopy of solids: a
review,” Int. J. Infrared Millimeter Waves, vol. 26, no. 12, pp. 1661–1690, 2005.
[110] D. G. Allis and T. M. Korter, “Theoretical analysis of the terahertz spectrum of the high
explosive PETN,” ChemPhysChem, vol. 7, no. 11, pp. 2398–2408, 2006.
[111] D. G. Allis, J. A. Zeitler, P. F. Taday, and T. M. Korter, “Theoretical analysis of the solid-state
terahertz spectrum of the high explosive RDX,” Chem. Phys. Lett., vol. 463, no. 1, pp. 84–89,
2008.
[112] G. Kozlov and A. Volkov, “Coherent source submillimeter wave spectroscopy,” in Millimeter
and submillimeter wave spectroscopy of solids, Springer, 1998, pp. 51–109.
[113] D. H. Auston, K. P. Cheung, and P. R. Smith, “Picosecond photoconducting Hertzian dipoles,”
Appl. Phys. Lett., vol. 45, no. 3, pp. 284–286, 1984.
[114] M. Van Exter, C. Fattinger, and D. Grischkowsky, “Terahertz time-domain spectroscopy of
water vapor,” Opt. Lett., vol. 14, no. 20, pp. 1128–1130, 1989.
[115] D. M. Mittleman, R. H. Jacobsen, R. Neelamani, R. G. Baraniuk, and M. C. Nuss, “Gas
sensing using terahertz time-domain spectroscopy,” Appl. Phys. B Lasers Opt., vol. 67, no. 3,
pp. 379–390, 1998.
[116] R. A. Cheville and D. Grischkowsky, “Far-infrared foreign and self-broadened rotational
linewidths of high-temperature water vapor,” JOSA B, vol. 16, no. 2, pp. 317–322, 1999.
[117] T.-I. Jeon, D. Grischkowsky, A. K. Mukherjee, and R. Menon, “Electrical characterization of
conducting polypyrrole by THz time-domain spectroscopy,” Appl. Phys. Lett., vol. 77, no. 16,
pp. 2452–2454, 2000.
[118] S. D. Brorson, R. Buhleier, I. E. Trofimov, J. O. White, C. Ludwig, F. F. Balakirev, H.-U.
Habermeier, and J. Kuhl, “Electrodynamics of high-temperature superconductors investigated
with coherent terahertz pulse spectroscopy,” JOSA B, vol. 13, no. 9, pp. 1979–1993, 1996.
[119] I. Wilke, M. Khazan, C. T. Rieck, P. Kuzel, C. Jaekel, and H. Kurz, “Time-domain Terahertz
spectroscopy as a diagnostic tool for the electrodynamic properties of high temperature
superconductors,” Phys. C Supercond., vol. 341, pp. 2271–2272, 2000.
BIBLIOGRAPHY
139
[120] N. Vieweg, B. M. Fischer, M. Reuter, P. Kula, R. Dabrowski, M. A. Celik, G. Frenking, M.
Koch, and P. U. Jepsen, “Ultrabroadband terahertz spectroscopy of a liquid crystal,” Opt.
Express, vol. 20, no. 27, pp. 28249–28256, 2012.
[121] M.-A. Brun, F. Formanek, A. Yasuda, M. Sekine, N. Ando, and Y. Eishii, “Terahertz imaging
applied to cancer diagnosis,” Phys. Med. Biol., vol. 55, no. 16, p. 4615, 2010.
[122] C. Baker, W. R. Tribe, T. Lo, B. E. Cole, S. Chandler, and M. C. Kemp, “People screening
using terahertz technology (Invited Paper),” 2005, vol. 5790, pp. 1–10.
[123] Y. Huang, N. Khiabani, Y. Shen, and D. Li, “Terahertz photoconductive antenna efficiency,”
in Antenna Technology (iWAT), 2011 International Workshop on, 2011, pp. 152–156.
[124] K. Sakai and M. Tani, “Introduction to terahertz pulses,” in Terahertz optoelectronics,
Springer, 2005, pp. 1–30.
[125] Y.-C. Shen, P. F. Taday, D. A. Newnham, M. C. Kemp, and M. Pepper, “3D chemical
mapping using terahertz pulsed imaging,” in Integrated Optoelectronic Devices 2005, 2005,
pp. 24–31.
[126] Dexheimer Suzan, Ed., Terahertz spectroscopy principales and applications. 2007.
[127] M. Naftaly and R. Dudley, “Methodologies for determining the dynamic ranges and signal-to-
noise ratios of terahertz time-domain spectrometers,” Opt. Lett., vol. 34, no. 8, pp. 1213–1215,
2009.
[128] M. Aarstol and M. B. Comisarow, “Apodization of FT-ICR spectra,” Int. J. Mass Spectrom.
Ion Process., vol. 76, no. 3, pp. 287–297, 1987.
[129] O. M. Solomon Jr, “The use of DFT windows in signal-to-noise ratio and harmonic distortion
computations,” Instrum. Meas. IEEE Trans., vol. 43, no. 2, pp. 194–199, 1994.
[130] M. Naftaly, J. F. Molloy, G. V Lanskii, K. a Kokh, and Y. M. Andreev, “Terahertz time-
domain spectroscopy for textile identification.,” Appl. Opt., vol. 52, no. 19, pp. 4433–7, 2013.
[131] L. Munck, L. Nørgaard, S. B. Engelsen, R. Bro, and C. a. Andersson, “Chemometrics in food
science - A demonstration of the feasibility of a highly exploratory, inductive evaluation
strategy of fundamental scientific significance,” Chemom. Intell. Lab. Syst., vol. 44, no. 1–2,
pp. 31–60, 1998.
[132] D. MacKay, “Chemometrics, econometrics, psychometrics-How best to handle hedonics?,”
Food Qual. Prefer., vol. 17, pp. 529–535, 2006.
[133] S. Wold and M. Sjöström, “Chemometrics, present and future success,” Chemom. Intell. Lab.
Syst., vol. 44, no. 1–2, pp. 3–14, 1998.
[134] J. El Haddad, L. Canioni, and B. Bousquet, “Good practices in LIBS analysis: Review and
advices,” Spectrochim. Acta Part B At. Spectrosc., vol. 101, pp. 171–182, 2014.
[135] R. B. Shah, M. A. Tawakkul, and M. A. Khan, “Process analytical technology: Chemometric
analysis of Raman and near infra‐red spectroscopic data for predicting physical properties of
extended release matrix tablets,” J. Pharm. Sci., vol. 96, no. 5, pp. 1356–1365, 2007.
[136] M. J. Adams, Chemometrics in analytical spectroscopy. Royal Society of Chemistry, 2004.
[137] J. Isotalo, “Basics of Statistics,” University of Tampere. pp. 0–82, 2001.
[138] B. Grung and R. Manne, “Missing values in principal component analysis,” Chemom. Intell.
Lab. Syst., vol. 42, no. 1–2, pp. 125–139, 1998.
[139] C. D. Brown and P. D. Wentzell, “Hazards of digital smoothing filters as a preprocessing tool
in multivariate calibration,” J. Chemom., vol. 13, no. 2, pp. 133–152, 1999.
[140] G. Shaw and D. Manolakis, “Signal processing for hyperspectral image exploitation,” IEEE
Signal Process. Mag., vol. 19, no. January, pp. 12–16, 2002.
BIBLIOGRAPHY
140
[141] Q. Du and J. E. Fowler, “Hyperspectral image compression using JPEG2000 and principal
component analysis,” Geosci. Remote Sens. Lett. IEEE, vol. 4, no. 2, pp. 201–205, 2007.
[142] M. A. O. Vasilescu and D. Terzopoulos, “Multilinear Image Analysis for Facial Recognition,”
in International Conference on Pattern Recognition, 2002, pp. 1–4.
[143] M. Hoehse, A. Paul, I. Gornushkin, and U. Panne, “Multivariate classification of pigments and
inks using combined Raman spectroscopy and LIBS,” Anal. Bioanal. Chem., vol. 402, no. 4,
pp. 1443–1450, 2012.
[144] G. Julnes, Handbook of Research Methods in Public Administration edited by. 1999.
[145] H. Abdi and L. J. Williams, “Principal Component Analysis,” Wiley Interdiscip. Rev. Comput.
Stat., vol. 2, no. 4, pp. 433–459, 2010.
[146] W. Elmi Rayaleh, “Extraction des connaissances en imagerie microspectrométrique par
analyse chimiométrique. Application à la caractérisation des constituants d’un calcul
urinaire.,” 2006.
[147] J. J. Gerbrands, “On the relationships between SVD, KLT and PCA,” Pattern Recognit., vol.
14, no. 1, pp. 375–381, 1981.
[148] N. Halko, P.-G. Martinsson, Y. Shkolnisky, and M. Tygert, “An algorithm for the principal
component analysis of large data sets,” SIAM J. Sci. Comput., vol. 33, no. 5, pp. 2580–2594,
2011.
[149] P. R. C. Nelson, P. a. Taylor, and J. F. MacGregor, “Missing data methods in PCA and PLS:
Score calculations with incomplete observations,” Chemom. Intell. Lab. Syst., vol. 35, no. 1,
pp. 45–65, 1996.
[150] B.-H. Mevik and R. Wehrens, “The pls package: principal component and partial least squares
regression in R,” J. Stat. Softw., vol. 18, no. 2, pp. 1–24, 2007.
[151] S. Wold, M. Sjöström, and L. Eriksson, “PLS-regression: a basic tool of chemometrics,”
Chemom. Intell. Lab. Syst., vol. 58, no. 2, pp. 109–130, 2001.
[152] S. Joe Qin, “Recursive PLS algorithms for adaptive data modeling,” Comput. Chem. Eng., vol.
22, no. 4, pp. 503–514, 1998.
[153] R. Rosipal, N. Kr, and N. Krämer, “Overview and recent advances in partial least squares,” in
Subspace, Latent Structure and Feature Selection, 2006, pp. 34–51.
[154] S. Chevallier, D. Bertrand, A. Kohler, and P. Courcoux, “Application of PLS-DA in
multivariate image analysis,” J. Chemom., vol. 20, no. MAY, pp. 221–229, 2006.
[155] M. Pérez-Enciso and M. Tenenhaus, “Prediction of clinical outcome with microarray data: a
partial least squares discriminant analysis (PLS-DA) approach.,” Hum. Genet., vol. 112, no. 5–
6, pp. 581–592, 2003.
[156] O. Galtier, O. Abbas, Y. Le Dréau, C. Rebufa, J. Kister, J. Artaud, and N. Dupuy,
“Comparison of PLS1-DA, PLS2-DA and SIMCA for classification by origin of crude
petroleum oils by MIR and virgin olive oils by NIR for different spectral regions,” Vib.
Spectrosc., vol. 55, no. 1, pp. 132–140, 2011.
[157] H. Martens and N. Tormod, Multivariate calibration. John Wiley & Sons, 1992.
[158] L. Stahle, “Partial least squares analysis with cross-validation for the two-class problem : a
Monte Carlo study,” J. Chemom., vol. 1, no. February, pp. 185–196, 1987.
[159] P. Geladi and B. R. Kowalski, “Partial Least-Squares Regression: A tutorial,” Anal. Chim.
Acta, vol. 185, pp. 1–17, 1986.
[160] J. El Haddad, “Chimiométrie appliquée à la spectroscopie de plasma induit par laser (LIBS) et
à la spectroscopie terahertz.” Université Sciences et Technologies-Bordeaux I, 2013.
BIBLIOGRAPHY
141
[161] Umetrics, “User guide to SIMCA-P+ 12,” 2008.
[162] D. Ballabio and V. Consonni, “Classification tools in chemistry. Part 1: linear models. PLS-
DA,” Anal. Methods, vol. 5, no. 16, pp. 3790–3798, 2013.
[163] A. C. Silva, L. F. B. L. Pontes, M. F. Pimentel, and M. J. C. Pontes, “Detection of adulteration
in hydrated ethyl alcohol fuel using infrared spectroscopy and supervised pattern recognition
methods,” Talanta, vol. 93, pp. 129–134, 2012.
[164] J. El Haddad, B. Bousquet, L. Canioni, and P. Mounaix, “Review in terahertz spectral
analysis,” TrAC Trends Anal. Chem., vol. 44, pp. 98–105, 2013.
[165] Q. Wang and Y. Ma, “Qualitative and quantitative identification of nitrofen in terahertz
region,” Chemom. Intell. Lab. Syst., vol. 127, pp. 43–48, 2013.
[166] Y. Hua and H. Zhang, “Qualitative and quantitative detection of pesticides with terahertz time-
domain spectroscopy,” Microw. Theory Tech. IEEE Trans., vol. 58, no. 7, pp. 2064–2070,
2010.
[167] J. El Haddad, F. De Miollis, J. Bou Sleiman, L. Canioni, P. Mounaix, and B. Bousquet,
“Chemometrics applied to quantitative analysis of ternary mixtures by terahertz spectroscopy,”
Anal. Chem., vol. 86, no. 10, pp. 4927–4933, 2014.
[168] Z. Zhang, X. Yu, H. Zhao, T. Xiao, Z. Xi, and H. Xu, “Component analysis to isomer mixture
with THz-TDS,” Opt. Commun., vol. 277, pp. 273–276, 2007.
[169] R. Nishikiori, M. Yamaguchi, K. Takano, T. Enatsu, M. Tani, U. C. de Silva, N. Kawashita, T.
Takagi, S. Morimoto, and M. Hangyo, “Application of partial least square on quantitative
analysis of L-, D-, and DL-tartaric acid by terahertz absorption spectra,” Chem. Pharm. Bull.,
vol. 56, no. 3, pp. 305–307, 2008.
[170] I. Ermolina, J. Darkwah, and G. Smith, “Characterisation of crystalline-amorphous blends of
sucrose with terahertz-pulsed spectroscopy: the development of a prediction technique for
estimating the degree of crystallinity with partial least squares regression,” AAPS
PharmSciTech, vol. 15, no. 2, pp. 253–260, 2014.
[171] T. Bardon, R. K. May, P. F. Taday, and M. Strlič, “Systematic study of terahertz time-domain
spectra of historically informed black inks,” Analyst, vol. 138, no. 17, pp. 4859–4869, 2013.
[172] M. Franz, B. M. Fischer, and M. Walther, “The Christiansen effect in terahertz time-domain
spectra of coarse-grained powders,” Appl. Phys. Lett., vol. 92, pp. 10–13, 2008.
[173] A. Bandyopadhyay, A. Sengupta, R. B. Barat, D. E. Gary, J. F. Federici, M. Chen, and D. B.
Tanner, “Effects of scattering on THz spectra of granular solids,” Int. J. Infrared Millimeter
Waves, vol. 28, pp. 969–978, 2007.
[174] M. R. Leahy-Hoppa, M. J. Fitch, X. Zheng, L. M. Hayden, and R. Osiander, “Wideband
terahertz spectroscopy of explosives,” Chem. Phys. Lett., vol. 434, pp. 227–230, 2007.
[175] J. Bou Sleiman, B. Bousquet, N. Palka, and P. Mounaix, “Quantitative Analysis of Hexahydro-
1, 3, 5-trinitro-1, 3, 5, Triazine/Pentaerythritol Tetranitrate (RDX–PETN) Mixtures by
Terahertz Time Domain Spectroscopy,” Appl. Spectrosc., vol. 69, no. 12, pp. 1464–1471,
2015.
[176] Y. Watanabe, K. Kawase, T. Ikari, H. Ito, Y. Ishikawa, and H. Minamide, “Component
analysis of chemical mixtures using terahertz spectroscopic imaging,” Opt. Commun., vol.
234, no. 1, pp. 125–129, 2004.
[177] Z. Zhang, X. Yu, H. Zhao, T. Xiao, Z. Xi, and H. Xu, “Component analysis to isomer mixture
with THz-TDS,” Opt. Commun., vol. 277, no. 2, pp. 273–276, 2007.
[178] M. W. Ayech and D. Ziou, “Terahertz image segmentation using k-means clustering based on
weighted feature learning and random pixel sampling,” Neurocomputing, vol. 175, pp. 243–
BIBLIOGRAPHY
142
264, 2016.
[179] E. Peli, “Contrast in complex images,” JOSA A, vol. 7, no. 10, pp. 2032–2040, 1990.
[180] P. J. Bex and W. Makous, “Spatial frequency, phase, and the contrast of natural images,”
JOSA A, vol. 19, no. 6, pp. 1096–1106, 2002.
[181] S. N. Anfinsen, A. P. Doulgeris, and T. Eltoft, “Estimation of the equivalent number of looks
in polarimetric synthetic aperture radar imagery,” Geosci. Remote Sensing, IEEE Trans., vol.
47, no. 11, pp. 3795–3809, 2009.
[182] M. Moreno-Moreno, J. Fierrez, and J. Ortega-Garcia, “Millimeter- and Submillimeter-Wave
Imaging Technologies for Biometric Purposes,” in Proceedings of XXIV Simposium Nacional
de la Union Cientifica Internacional de Radio, 2009, p. 244.
[183] D. T. Petkie, C. Casto, F. C. De Lucia, S. R. Murrill, B. Redman, R. L. Espinola, C. C. Franck,
E. L. Jacobs, S. T. Griffin, C. E. Halford, J. Reynolds, S. O’Brien, and D. Tofsted, “Active and
passive imaging in the THz spectral region: phenomenology, dynamic range, modes, and
illumination,” J. Opt. Soc. Am. B, vol. 25, no. 9, pp. 1523–1531, 2008.
[184] B. R. Appleby and R. N. Anderton, “Millimeter-Wave and Submillimeter-Wave Imaging for
Security and Surveillance,” Proc. IEEE IEEE, vol. 95, no. 8, pp. 1683–1690, 2007.
[185] L. Yujiri, M. Shoucri, and P. Moffa, “Passive millimeter-wave imaging,” IEEE microwave
magazine, vol. 1, no. September, pp. 39–50, 2003.
[186] R. A. Lewis, Terahertz Physics. Cambridge University Press, 2013.
[187] C. Johnson, “Mathematical Physics of BlackBody Radiation,” Icarus iDucation. Sk. för
datavetenskap och Kommun. K. Tek. Högskolan, Stock., 2012.
[188] R. Appleby and H. B. Wallace, “Standoff detection of weapons and contraband in the 100
GHz to 1 THz region,” IEEE Trans. Antennas Propag., vol. 55, no. 11 I, pp. 2944–2956, 2007.
[189] H. Sato, K. Sawaya, K. Mizuno, J. Uemura, and M. Takeda, “Passive millimeter-wave
imaging for security and safety applications,” in Terahertz Physics, Devices, and Systems IV:
Advanced Applications in Industry and Defense, 2010, vol. 7671, pp. 1–11.
[190] L. Yujiri, “Passive Millimeter wave imaging,” in Microwave Symposium Digest, 2006, no. 3,
pp. 98–101.
[191] Y. A. Pirogov, “Passive millimeter-wave imaging,” Radiophys. Quantum Electron., vol. 46,
pp. 660–670, 2003.
[192] E. Grossman, C. Dietlein, J. Ala-laurinaho, M. Leivo, L. Gronberg, M. Gronholm, P.
Lappalainen, A. Rautiainen, A. Tamminen, and A. Luukanen, “Passive terahertz camera for
standoff security screening,” Appl. Opt., vol. 49, no. 19, pp. 106–120, 2010.
[193] R. Appleby, R. N. Anderton, S. Price, N. A. Salmon, G. N. Sinclair, P. R. Coward, A. R.
Barnes, D. Munday, M. Moore, A. H. Lettington, S. A. Rd, and G. Malvern, “Mechanically
scanned real time passive millimetre wave imaging at 94GHz,” in Passive Millimeter-Wave
Imaging Technology VI and Radar Sensor Technology VII, 2003, vol. 5077, pp. 1–6.
[194] A. Vertiy, S. Ozbek, A. Pavlyuchenko, M. Tekbas, A. Kizilhan, H. Cetinkaya, A. Unal, and S.
B. Panin, “Short-and long-range passive imaging in millimeter-wave-band,” in General
Assembly and Scientific Symposiumm IEEE, 2011, pp. 1–4.
[195] M. Kowalski, N. Palka, M. Piszczek, and M. Szustakowski, “Processing of THz images
acquired by passive camera,” Photonics Lett. Pol., vol. 4, no. 3, pp. 97–99, 2012.
[196] “Wasa Millimeter Wave , Wax3-864,” Sweden, 2014.
[197] Millitech, “Mechanically-Tuned Gunn Oscillators,” 2004. .
[198] J. Alda, “Laser and Gaussian Beam Propagation and Transformation,” Opt. Eng., vol. 110, pp.
BIBLIOGRAPHY
143
999–1013, 2003.
[199] G. Gbur and E. Wolf, “The Rayleigh range of Gaussian Schell-model beams,” J. Mod. Opt.,
vol. 48, no. 11, pp. 1735–1741, 2001.
[200] J. B. Perraud, J. Bou Sleiman, F. Simoens, and P. Mounaix, “Refractive index matching for 2D
and 3D terahertz imaging improvement,” in 40th International Conference on Infrared,
Millimeter, and Terahertz waves, 2015, p. 1.
[201] H. P. Marshall and G. Koh, “FMCW radars for snow research,” Cold Reg. Sci. Technol., vol.
52, no. 2, pp. 118–131, 2008.
[202] O. Postolache, R. N. Madeira, P. S. Girão, and G. Postolache, “Microwave FMCW Doppler
radar implementation for in-house pervasive health care system,” Med. Meas. Appl. Proc., pp.
47–52, 2010.
[203] C. Am Weg, W. Von Spiegel, R. Henneberger, R. Zimmermann, T. Loeffler, and H. G.
Roskos, “Fast active THz cameras with ranging capabilities,” J. Infrared, Millimeter,
Terahertz Waves, vol. 30, no. 12, pp. 1281–1296, 2009.
[204] G. M. Brooker, “Understanding Millimetre Wave FMCW Radars,” no. 2, pp. 152–157, 2005.
[205] F. Friederich, W. Von Spiegel, M. Bauer, F. Meng, M. D. Thomson, S. Boppel, A. Lisauskas,
B. Hils, V. Krozer, S. Member, A. Keil, T. Löf, R. Henneberger, A. K. Huhn, G. Spickermann,
P. H. Bolívar, and H. G. Roskos, “THz Active Imaging Systems With Real-Time
Capabilities,” IEEE Trans. TERAHERTZ Sci. Technol., vol. 1, no. 1, pp. 183–200, 2011.
[206] G. N. Ramachandran and A. V Lakshminarayanan, “Three-dimensional reconstruction from
radiographs and electron micrographs: application of convolutions instead of Fourier
transforms,” Proc. Natl. Acad. Sci., vol. 68, no. 9, pp. 2236–2240, 1971.
[207] R. N. Bracewell and Ac. Riddle, “Inversion of fan-beam scans in radio astronomy,” Astrophys.
J., vol. 150, p. 427, 1967.
[208] L. A. Shepp and B. F. Logan, “The Fourier reconstruction of a head section,” Nucl. Sci. IEEE
Trans., vol. 21, no. 3, pp. 21–43, 1974.
[209] J. P. Guillet, B. Recur, L. Frederique, B. Bousquet, L. Canioni, I. Manek-Hönninger, P.
Desbarats, and P. Mounaix, “Review of terahertz tomography techniques,” J. Infrared,
Millimeter, Terahertz Waves, vol. 35, pp. 382–411, 2014.
[210] B. Ferguson, S. Wang, D. Gray, and D. Abbott, “Towards functional 3D T-ray imaging,” Phys.
Med. Biol., vol. 47, p. 3735, 2002.
[211] H. Jiang, Computed tomography principales, design, artifacts, and recent advances, no. 2.
SPIE, 2009.
[212] B. Recur, a Younus, S. Salort, P. Mounaix, B. Chassagne, P. Desbarats, J.-P. Caumes, and E.
Abraham, “Investigation on reconstruction methods applied to 3D terahertz computed
tomography.,” Opt. Express, vol. 19, no. 6, pp. 5105–5117, 2011.
[213] B. Recur, H. Balacey, J. Bou Sleiman, J. B. Perraud, J.-P. Guillet, a. Kingston, and P.
Mounaix, “Ordered subsets convex algorithm for 3D terahertz transmission tomography,” Opt.
Express, vol. 22, no. 19, p. 23299, 2014.
[214] B. Recur, J. P. Guillet, I. Manek-Hönninger, J. C. Delagnes, W. Benharbone, P. Desbarats, J.
P. Domenger, L. Canioni, and P. Mounaix, “Propagation beam consideration for 3D THz
computed tomography,” Opt. Express, vol. 20, no. 6, p. 5817, 2012.
[215] H. Balacey, J.-B. Perraud, J. Bou Sleiman, J.-P. Guillet, B. Recur, and P. Mounaix,
“Processing sequence for non-destructive inspection based on 3D terahertz images,” Proc.
SPIE, vol. 9275, p. 92750J, 2014.
144
SUMMARY IN FRENCH
L’amélioration du niveau de la sécurité a été toujours un grand défi pour les gouvernements et
les organisations. La nécessité d’avoir des systèmes plus rigoureux et systématiques, conduit à la
création de nouvelles études pour développer des technologies capables de détecter toutes les types de
menaces. Actuellement, le transport des marchandises est effectué dans tout le monde à travers
différents types de transport tels que les avions, les trains, les camions, etc. Ainsi une menace peux
être insérée à différentes étapes du processus : pendant le transport et dans les centres de tri par
exemple. Pour cela, ‘La Poste’ et les postes européennes sont à la recherche de nouveaux moyens
permettant d’accroître le niveau de sécurité lors du transport et de l’inspection de colis. Par suite, le
grand défi sera d’accomplir un niveau de sécurité élevé, tout en conservant l'efficacité et la flexibilité
du flux de la chaîne postale.
Les systèmes les plus utilisés dans les centres de tri postal sont basés sur la technologie des
rayons-X où l’analyse est effectuée systématiquement à l’exportation mais également à l’importation
pour éviter l’exposition des employés à des menaces. Dans certains cas, l’analyse par rayon-X, qui
présente l’information sous une image en fausse couleur, est insuffisante pour détailler la nature
chimique d’un produit. Un code de couleur international est utilisé pour les grandes familles de
matériaux (métaux, polymères, organiques, etc). En cas de doute, l’intervention humaine est
systématique aboutit à plusieurs inconvénients :
1- Le ralentissement du flux de colis et le retard dans la procédure d'envoi.
2- Vue les obligations de la légalisation, l’ouverture des colis suspects est effectuée par une
personne de la douane et non pas de la Poste, d’où la mise en place d’une logistique couteuse.
3- Induire un danger sur l’inspecteur, s’il est face à un produit chimique risqué.
4- Le besoin de plus de main-d'œuvre et d’inspecteurs.
Dans ce contexte, cette thèse fait partie du projet franco-Allemand InPoSec (Integrated Postal
Security), qui déploie des technologies complémentaires à celles déjà existantes. Cette nouvelle
approche de moyens d’inspection de colis dans les centres de tri postal couplé avec des moyens de
recherche d’information en amont sur la base d’échanges d’informations électroniques entre services
douaniers et l’ajout de technologie complémentaire dans la chaine du transport de colis. Ainsi
l’objectif est de compiler et d’analyser ce méta donné et de fournir aux services un niveau de risque
sur la nature frauduleuse du colis. Ainsi, le projet s’attaque à plusieurs modules dont :
SUMMARY IN FRENCH
145
1- Le développement de l'algorithme bayésien, en collaboration avec le partenaire Datalone. Cet
algorithme est appliqué aux données d’expédition pour étudier l'évaluation des risques d'un
colis, en se basant sur plusieurs informations, telles que le pays d'expédition, le poids, la
taille, le contenu déclaré, etc., et les données fournis par les systèmes d’imagerie X,
Terahertz, et les techniques de spectroscopie (Ion Mass spectroscopy, Terahertz spectroscopy,
Raman spectroscopy).
2- L’algorithme de reconnaissance de forme, en collaboration avec la technologie neuronale
Spykenet. L'objectif est d'identifier automatiquement la présence d'une arme dans un flux
d’images à grande vitesse. Cet algorithme est appliqué aux données de rayons X extraites de
mesures réelles effectuées au centre de la poste à CDG ainsi qu’aux données térahertz
obtenues avec nos systèmes.
Cependant, notre principale tâche dans le projet est d’évaluer quantitativement l’apport de la
spectroscopie THz et l’imagerie Terahertz. En effet notre rôle est de démontrer le potentiel et les
capacités de cette nouvelle technologie pour l’inspection des colis et des lettres. Le champ de
détection a été restreint aux menaces telles que les armes, les explosifs, les bombes, les matières
radioactives, etc. Cette technologie est attractive pour plusieurs raisons :
1- C’est une technique sans contact, capable d'inspecter des objets à travers les emballages,
2- Elle est non destructive pour les objets en inspection,
3- Les rayonnements n’ont pas d’effets dangereux sur la santé des inspecteurs,
4- Elle peut fournir une signature chimique, et une analyse qualitative de matériaux ce qui n’est
pas le cas des systèmes RX. Dans ce cas, le système térahertz est utilisé pour analyser le colis
et fournir des informations similaires par rapport au scanner à rayons X pour l’aspect
imagerie. Toutefois, deux informations supplémentaires peuvent être potentiellement fournies
par le système térahertz. La première est l'identification des matériaux amorphes, peu denses
qui sont quasi transparents aux rayons-X. Le deuxième est la possibilité d’effectuer des
mesures d’imagerie spectrale large bande, ce qui permet l’identification de la nature chimique
d’un élément sur une image effectuée à travers l'emballage.
Ainsi, ce nouveau moyen d’inspection de colis, basé sur l'utilisation de la technologie térahertz est
perçue comme une technique complémentaire au scanner rayons-X et non pas comme un substituant.
Jusqu'à présent, le domaine térahertz a montré un fort potentiel d'application dans le domaine de
la sécurité. Dans ce travail, la technologie térahertz est utilisée spécifiquement pour identifier deux
principales menaces dans les colis : les armes et les explosifs. Cependant, comme les ondes térahertz
ne peuvent pas se propager au travers des métaux, cela constitue une limitation pour l’inspection de
colis.
Cette thèse propose de démontrer qualitativement et quantitativement le potentiel et les limitations
des ondes térahertz dans l’inspection de colis. L'objectif principal est donné aux petits colis car
l'inspection systématiques des lettres a été considérée, pour le projet, comme un objectif
supplémentaire et de moindre impact en termes de dangerosité (excepté l’envoie d’éléments toxiques
comme l’anthrax). Le travail a été effectué en déployant et en optimisant trois principales méthodes
d'analyse dans le domaine des fréquences térahertz : la spectroscopie résolue en temps, l'imagerie et
l'imagerie multi spectrale.
SUMMARY IN FRENCH
146
Pour l'identification des explosifs, la spectroscopie térahertz joue un rôle principal dans la
reconnaissance de la composition des poudres telles les explosifs. En outre, l'imagerie spectrale dans
le domaine térahertz est capable en même temps d’être utile pour la reconnaissance de la forme de
l’objet, et l’identification chimique de sa nature sous forme de spectres, même à travers un emballage.
Pour cela, l'analyse des données térahertz par des outils de chimiométrie est indispensable pour deux
raisons : la complexité de l'analyse des mélanges de poudres et la difficulté d'analyse des spectres des
poudres à travers des emballages. Ainsi, ces outils sont appliqués à la spectroscopie térahertz et la
spéctro-imagerie térahertz pour identifier qualitativement et quantitativement des explosifs à l'état pur
et dans des mélanges. Pour la détection d'armes, l’imagerie 2D et 3D ainsi que la reconstruction
tomographique sont étudiées, développées et testés sur plusieurs types d’imagerie térahertz
différentes. Le manuscrit est divisé en trois chapitres.
Le premier chapitre présente une description globale de la technologie térahertz. Il discute les
principales sources et détecteurs développés ainsi que les applications variées des ondes térahertz dans
plusieurs domaines applicatifs d’importances. D’autre part, ce chapitre présente brièvement les
principales menaces recherchées dans les colis qui peuvent présenter un danger lors du transport :
comme les armes et les explosifs. Ensuite, les principales techniques utilisées pour la détection de ces
menaces sont répertoriées, ainsi que leurs concepts physiques, leurs avantages et leurs inconvénients.
Elles sont par suite comparées aux technologies térahertz. La dernière partie de ce chapitre rapporte
les importants travaux effectués en imagerie et spectroscopie térahertz pour des applications de
sécurité.
Le deuxième chapitre expose le concept de la spectroscopie térahertz résolue en temps ainsi que
l'imagerie spectrale, qui sont appliquées pour la détection des explosifs dans les colis. Premièrement,
nous avons étudié un protocole robuste de préparation d’échantillons et aussi d’acquisition des
données. Nous mettons en évidence l'importance de la référence choisie pour l’extraction des
propriétés optique de l’échantillon et l'effet que peut induire ce choix sur les valeurs d'absorbance. En
plus, une étude de robustesse de la mesure vis-à-vis de la taille des pastilles sur les résultats
spectrales. Nous comparons par suite, en mode transmission, les spectres d'absorbance d'une poudre
préparée avec ou sans polyéthylène (PE), utilisé comme un liant. Ceci souligne l’effet de l’utilisation
des pastilles fabriquées sans matrice qui mène à la perte de certaines signatures spectrales si les
matériaux sont trop concentrés et/ou trop absorbants. Cela provient de la réduction de la bande de
fréquences utile corélée au phénomène d’absorption et d’épaisseur de l’échantillon. Ce problème peut
être réduit en effectuant des mesures en réflexion, cependant, l'extraction du signal sera plus complexe
due à une incertitude sur la phase.
D'autre part, la spectroscopie térahertz est employée sur plusieurs types de matières utilisées
comme emballage de colis. Le but est de chiffrer leurs effets sur les spectres térahertz et sur les
images spectrales. Bien que l'impact de ces matériaux soit négligeable sur les spectres à cause d’une
absorption intrinsèque faible, ils peuvent avoir un effet néfaste sur une image spectrale à cause du
multiple effet Fabry-Pérot et conduire à une fausse interprétation de cette image. En général, il faut
être vigilant lors de l'analyse spectroscopique de multicouche.
En raison de la complexité des analyses des mélanges et même à travers des emballages, des
outils d’analyse de chimiométrie sont appliqués pour extraire des informations significatives sur les
SUMMARY IN FRENCH
147
matériaux. Trois techniques de traitement statistique de données sont appliquées, soit à des mesures
spectroscopiques d'explosifs soit à des images spectrales. Ces méthodes sont : l’analyse en
composantes principales (ACP), la régression par moindres carrés partiels (PLS) et l'analyse des
moindres carrés partiels discriminante (PLS-DA) utilisés pour visualiser, quantifier et classer les
données, respectivement.
Pour l’analyse des spectres des échantillons des explosifs, et dans le but de déterminer la
concentration des explosifs en état pur et en mélange, dans des échantillons inconnus, l'analyse des
moindres carrés partiels est appliquée. La comparaison entre la performance de PLS1, utilisant une
seule variable, et PLS2 utilisant deux variables différentes, a montré la pertinence du modèle avec
deux variables. Nous avons validé la méthode et tester les limites sur des mesures de simulant
d’explosifs dans notre laboratoire. Par suite, un modèle PLS2 est construit entre 0,2 et 3 THz, en
utilisant deux explosifs, RDX et PETN ainsi que leur mélange, avec des concentrations variant de 2%
à 25% dans une pastille de 400 mg fabriquée en utilisant le PE comme liant. Ces échantillons
présentent un artefact dû au chevauchement entre leurs spectres pour les fréquences entre 1,8 et 3
THz. Cela rend plus complexe l’identification de leur mélange si on ne se fie qu’à la présence ou pas
et l’intensité du pic d’absorption de l’espèce recherchée. Ainsi, le modèle construit était capable de
prédire la concentration des explosifs inconnus, purs et mélangés, avec une valeur d’erreur de 3,4 mg
dans la masse totale de la pastille. En outre, le même modèle est utilisé pour la prédiction des
échantillons entre 1,8 et 3 THz. Cette étude montre que, même en réduisant la bande de fréquence, où
il y a un chevauchement entre les spectres des différents échantillons, les analyses de chimiométre
sont capables de déterminer les concentrations des explosifs avec une erreur de 4,8 mg dans la masse
totale de la pastille. Cette technique s’avère efficace au prix de très nombreuses mesures pour
construire le modèle, le tester et le confronter à des échantillons inconnus.
Pour l'application en specto-imagerie, nous démontrons à l'aide de deux métriques, le RMS (Root
Mean Square) et le ENL (Equivalent Number of Looks), que la qualité des images obtenues à partir
d'un modèle ACP est supérieur aux images brutes sélectionnées à des fréquences spécifiques tout au
long du spectre. Pour cela, une transformation des données permet de traiter l’image comme une
succession de mesures spectroscopiques et après reconstruire l’image avec les meilleures données de
contraste. Cette démonstration est effectuée pour deux préparations d’échantillon différents : en
poudres compactés et non compactés. Cela démontre l’importance de l'ACP à fournir
automatiquement, une image discriminante des différents produits présents, sans perte d’information
ou de qualité d’image.
Quant aux échantillons des explosifs, et en se basant sur les résultats du modèle de chimiométrie
appliqué aux spectres térahertz, nous effectuons les mêmes méthodes de traitement sur des images
spectrales, de trois pastilles. Ces pastilles sont formées de : RDX, PETN ainsi que leurs mélanges.
Tout d'abord, un modèle d’ACP est appliqué sur l’image, pour compresser les données, comprendre et
visualiser les éléments donnant le plus de contraste sur cette image. Cela permet de révéler les trois
différents produits qui sont présents, de sélectionner trois régions d'intérêt pour mener ensuite à une
analyse supervisée ( afin de définir la nature et la concentration des trois éléments de l'image).
Ensuite, différentes configurations du modèle de classification PLS-DA sont déployées sur l’ensemble
de l’image. Les résultats montrent que le modèle optimal de la classification est obtenu avec deux
SUMMARY IN FRENCH
148
classes où 30 pixels de chacune des pastilles RDX et PETN sont sélectionnés pour calibrer le modèle.
La prédiction appliquée à tous les 1452 pixels restant de l'image donne une classification correcte de
95,5% des pixels. Cependant, les 5% d’erreur, sont dus au contour des pastilles pour lequel le signal
ne présente aucune information chimique significative. Pour cela, et pour étudier la performance du
modèle sans l’effet de bord, la prédiction est réduite aux trois zones centrales des trois pastilles. Dans
ce cas, tous les pixels prédits sont correctement classés. Enfin, la possibilité de quantifier les données
du spectro-imagerie à partir des données spectrales est considérée, en utilisant le modèle PLS2. Ce
modèle permet de détérminer les concentrations de 18 pixels inconnus choisis dans des zones
centrales de l'image avec une erreur de 5,63 mg dans la masse totale de la pastille de 400mg. Cela
montre la possibilité de prédire des éléments mesurés en spectro-imagerie térahertz tout en utilisant un
modèle de calibration produis à partir de données de mesure en spectroscopie térahertz.
Ces exemples sont la première démonstration d’algorithme qui peuvent être intégrés dans des
systèmes industriels utilisant la technologie térahertz pour analyser automatiquement des informations
spectrales, même sur des images, afin d'identifier, de discriminer et de quantifier des explosifs à l'état
pur ou dans des mélanges. Toutefois, dans cette étude, nous sommes limités par le nombre
d’échantillons et de la difficulté d'accès aux explosifs.
Dans le troisième chapitre, on a développé et adapté des techniques d’imagerie dans les domaines
des ondes millimétriques pour l’inspection de colis et la détection des armes à travers les emballages
sans ouverture du paquet. Pour cela, trois techniques d'imagerie millimétriques sont présentées, dont
chacune utilise des systèmes d'émission et de détection différents. La première présente un système
d’imagerie passive, et les deux autres sont basées sur l'imagerie active impliquant des ondes continues
(continuous-wave (CW)) et la modulation de fréquence des ondes continues (Frequency-
modulatedcontinuous-wave (FMCW)). Avec ces trois techniques, deux informations sur le signal sont
obtenue : l’amplitude ou la phase. Les potentiels, les avantages et les inconvénients de chacune des
trois techniques, dans le cadre de la sécurité postale, sont abordés.
Le système passif est une caméra radiométrique, Millicam90, qui est fabriquée par la société MC2
pour la détection d’armes cachées lors du contrôle aux frontières. Nous adaptons cette caméra pour
fonctionner dans un setup dédié à l’analyse de colis. Cette caméra, reposant sur un balayage
mécanique, contient des récepteurs ultra-sensibles dans la gamme des ondes millimétriques capables
de détecter des fréquences autour de 90 GHz de très faible puissance. Ce système est rapide,
permettant d’obtenir une image en quelques secondes. En plus, d’utilisation facile à mettre en place, il
peut scanner des colis de grandes dimensions. Cependant, ces performances pour l’inspection de colis
ne sont pas les meilleurs parmi les trois systèmes, à cause des limitations de résolutions et de l’optique
non optimisées pour nos applications. Cela peut être amélioré en adaptant le même système à d’autres
fréquences.
Pour l'imagerie active, deux dispositifs sont étudiés. Le premier est développé au sein de notre
équipe. Il utilise deux diodes Gunn pour émettre des ondes millimétriques continues à deux
fréquences 84 et 287 GHz. La détection se fait en transmission, en utilisant deux diodes Schottky
comme détecteur. Les optiques utilisées pour focaliser le faisceau à 100 mm sont des lentilles
fabriqués avec du polyéthylène. Le deuxième système est un système commercial fabriqué par la
société Synview. Il présente deux têtes R100 et R300 comme émetteur et récepteurs en mode
SUMMARY IN FRENCH
149
réflexion. Deux autres têtes, T100 et T300 jouent le rôle de détecteur en mode transmission. Ce
système est basé sur la modulation de fréquence, permettant d'obtenir les informations de profondeur
sur l'objet (donc une information en trois dimensions), en mesurant le temps de vol. En plus, il permet
d'accéder à l'amplitude et la phase de l'onde réfléchie et transmise. Les deux systèmes présentent des
résultats intéressants pour l'inspection de colis. Pour le setup continues, les ondes délivrées à 84 GHz
et à 284 GHz de puissance plus importante et ce dispositif nous servira de référence pour la mise au
point des algorithme de reconstruction tomographique. D'autre part, le setup SynView présente des
avantages supplémentaires par rapport au setup CW. En utilisant la technique FMCW, il est possible
d'accéder au temps de vol et à l’information de phase, d’où la possibilité d’accéder, en temps réel, à
l’information en profondeur sur l’objet. Pour cette configuration, la tête de T300 en mode de
transmission montre la meilleure précision pour l’inspection de colis. De plus, ce système permet
d’étudier la combinaison de fréquences et de modes de visualisation par des techniques de fusion
d’images. On démontre que cette combinaison est le moyen idéal pour visualiser différents types
d'informations dans une même image, pour mieux comprendre son contenu.
Néanmoins, une projection n’est pas toujours suffisante pour l'identification de toutes les
menaces. L'interprétation d’une projection 2D peut être biaisée par des artefacts de mesures mais aussi
par le contenu du colis en soit. Ainsi la nécessité d'appliquer une reconstruction tomographique pour
fournir une visualisation 3D permettant l'inspection des colis et leur contenu a été entreprise. Un
algorithme tomographique spécial, basé sur la technique Ordered Subsets Convex (OSC), a été
développé au sein de notre équipe pour tenir compte de la propagation gaussienne du faisceau
térahertz. Les reconstructions appliquées aux trois systèmes d’imagerie montrent une grande efficacité
de cet algorithme qui place notre travail à l’état de l’art. En plus, c’est la première fois qu’une
reconstruction est appliquée à des donnés obtenues d’un système d’imagerie passif. Cependant,
certaines limites physiques et mathématiques restreignent les performances. D'abord, les projections
2D souffrent de divers artefacts (diffraction, réfraction) qui mènent à une mauvaise compréhension de
la géométrie d'un objet. En particulier le faible pouvoir de pénétration en haute fréquence atténue
fortement le rapport signal sur bruit près et influence la reconstruction tomographique.
Les études d’imagerie montrent le potentiel de l’imagerie millimétrique 2D et 3D dans la
détection des menaces à travers les emballages ; cependant, la technologie térahertz n’est pas encore
complétement mature avec la même efficacité que les systèmes à rayons X. Ils souffrent de plusieurs
limitations intrinsèques qui limitent la portée des champs applicatifs.
En conclusion, la technologie térahertz a montré des performances prometteuses pour la détection
d’explosifs et d’armes. La spectroscopie résolue en temps couplée à des techniques de chimiométrie
permettent l analyse et quantification de produits chimiques. Les résultats obtenus pour des corps purs
mais aussi des mélanges à deux et trois éléments sont à l’état de l’art en termes de limite de
quantification. Cette avancée est obtenue sur la base de modèles statistiques complexes et de
campagnes de calibration des modèles importants. Un soin particulier doit aussi être montré lors de la
phase de fabrication des échantillons testés. L’imagerie passive et active a également montré des
résultats intéressants. Loin de concurrencer la tomographie ou l’imagerie X, la spectro imagerie a des
atouts comme la non dangerosité pour l’utilisateur, et un pouvoir de séparation des matériaux légers et
peu denses. Il s’agit d’un avantage par rapport aux RX, la contrepartie est la résolution moins bonne et

SUMMARY IN FRENCH
150
des épaisseurs d’objets limités par les phénomènes d’absorption. Enfin, un développement
technologique est nécessaire afin d'intégrer la technologie térahertz dans l'industrie. En outre, des
sources plus puissantes et des détecteurs matriciels semblent être la priorité numéro un pour des
transferts efficaces. De très nombreuses évolutions dans ce sens sont en cours de développement dans
les laboratoires publics et privés. De nombreuses caméra terahertz sont disponibles commercialement.
L'ajout de ces techniques complémentaires couplées avec d’autres techniques de contrôles devraient
améliorer considérablement la détection des menaces dans les centres de tri postaux.
151
AUTHOR CONTRIBUTION
Journal papers
Terahertz imaging and tomography as efficient instruments for testing polymer additive
manufacturing objects
Perraud, J.B., Obaton, A.F., Bou-Sleiman, J., Recur, B., Balacey, H., Darracq, F., Guillet, J.P. and
Mounaix, Applied Optics 55, no. 13 (2016): 3462-3467.
Advanced processing sequence for 3D THz imaging
Hugo Balacey, Benoit Recur, Jean-Baptiste Perraud, Joyce Bou Sleiman, Jean-Paul Guillet, and
Patrick Mounaix , IEEE transactions on terahertz science and technology, vol. 6, no. 2, march 2016.
Quantitative Analysis of Hexahydro-1,3,5-trinitro-1,3,5, Triazine/Pentaerythritol
Tetranitrate (RDX–PETN) Mixtures by Terahertz Time Domain Spectroscopy
Sleiman, Joyce Bou, Bruno Bousquet, Norbert Palka, and Patrick Mounaix, Applied spectroscopy 69,
no. 12 (2015): 1464-1471.
Low-frequency noise effect on terahertz tomography using thermal detectors
Guillet, J. P., B. Recur, H. Balacey, J. Bou Sleiman, F. Darracq, D. Lewis, and P. Mounaix, Applied
optics 54, no. 22 (2015): 6758-6762.
Processing sequence for non-destructive inspection based on 3D terahertz images
Balacey, Hugo, J-B. Perraud, J. Bou Sleiman, J-P. Guillet, Benoît Recur, and Patrick Mounaix,
In SPIE/COS Photonics Asia, pp. 92750J-92750J. International Society for Optics and Photonics,
2014.
AUTHOR CONTRIBUTION
152
Ordered subsets convex algorithm for 3D terahertz transmission tomography
Recur, Benoît, Hugo Balacey, J. Bou Sleiman, Jean-Baptiste Perraud, J-P. Guillet, Andrew Kingston,
and Patrick Mounaix, Optics express 22, no. 19 (2014): 23299-23309.
Chemometrics Applied to Quantitative Analysis of Ternary Mixtures by Terahertz
Spectroscopy
El Haddad, Josette, Frederick de Miollis, Joyce Bou Sleiman, Lionel Canioni, Patrick Mounaix, and
Bruno Bousquet, Analytical chemistry 86, no. 10 (2014): 4927-4933.
Conference proceedings
Discrimination and identification of RDX/PETN explosives by chemometrics applied to
terahertz time-domain spectral imaging (invited oral)
Bou-Sleiman, J., J-B. Perraud, B. Bousquet, J-P. Guillet, N. Palka, and P. Mounaix, In SPIE
Security+ Defence, pp. 965109-965109. International Society for Optics and Photonics, 2015.
Chemical imaging and quantification of RDX/PETN mixtures by PLS applied on
terahertz time-domain spectroscopy (Poster)
Sleiman, J. Bou, J. B. Perraud, B. Bousquet, N. Palka, J. P. Guillet, and P. Mounaix, In Infrared,
Millimeter, and Terahertz waves (IRMMW-THz), 2015 40th International Conference on, pp. 1-1.
IEEE, 2015.
Immersion in refractive index matching liquid for 2D and 3D terahertz imaging (oral)
Perraud, J. B., J. Bou Sleiman, F. Simoens, and P. Mounaix, In Infrared, Millimeter, and Terahertz
waves (IRMMW-THz), 2015 40th International Conference on, pp. 1-1. IEEE, 2015.
Ordered subsets convex algorithm and automatic image processing sequences: the solid
bases for 3D THz inspection (poster)
Balacey, Hugo, Jean-Baptiste Perraud, J. Bou Sleiman, Benoit Recur, and Patrick Mounaix, In
International Symposium on Ultrafast Phenomena and Terahertz Waves, p. MS3_2. Optical Society
of America, 2014.
AUTHOR CONTRIBUTION
153
Qualitative and quantitative analysis of explosives by terahertz time-domain
spectroscopy: application to imaging (poster)
Sleiman, J. Bou, J. El Haddad, J. B. Perraud, L. Bassel, B. Bousquet, Norbert Palka, and Patrick
Mounaix, In 39th International Conference on IRMMW-THz, pp. 1-2. 2014.
3D terahertz versus X-ray imaging for Mochica ceramic investigation (oral)
Bassel, Lena, J. B. Perraut, J. BouSleiman, B. Bousquet, H. Ballacey, Benoit Recur, H. Coqueugniot
H, Del N, Solar P, Chapoulie R, Mounaix P, sub. IRMMW-THz (2014).
Conference and communication without proceedings
Identifying explosives by chemometrics with terahertz spectral imaging
Joyce Bou Sleiman, Jean-Baptiste Perraud, Bruno Bousquet, Jean-Paul Guillet, Norbert Palka and
Patrick Mounaix, SPIE newsroom/Defense and security, 03 November 2015
THz detection and identification of dangerous objects and substances (invited oral)
NATO ARW on THz Diagnostics of CBRN effects and Detection of Explosives & CBRN
3-6 November 2015, Izmir, Turkey
Collaboration with: Military University of Technology, Warsaw, Poland;
& Fraunhofer Institute for Physical Measurement Techniques IPM, Kaiserslautern, Germany
3D-THz imaging vs X-Ray tomography: Applications to material inspection (oral)
2nd
International Conference on Tomography and Materials and Structures (ICTMS)
29 June - 3 July 2015, Quebec, Canada
Terahertz Imaging and Spectroscopy: Applications To Defense And Security (Poster)
3th Laphia International Symoisium, 2-3 July 2015, Bordeaux, France
Chemical imaging of RDX PETN explosives by chemometrics applied on terahertz time-
domain spectroscopy (oral)
8Th
Terahertz Days Conference, 31March- 2 April 2015, Arêches-Beaufort, France
AUTHOR CONTRIBUTION
154
Multivariate analysis of terahertz absorbance spectra: classification and quantitation of
explosives mixtures of RDX and PETN (poster)
8Th
Terahertz Days Conference, 31March- 2 April 2015, Arêches-Beaufort, France
Ordered subsets convex algorithm and automatic image processing sequences: the solid
bases for 3D THz inspection (oral)
H. Balaceya,b
, J.-B. Perrauda, J. Bou Sleiman
a, B. Recur
c and P. Mounaix
a, 8
Th Terahertz Days
Conference, 31March- 2 April 2015, Arêches-Beaufort, France
Qualitative And Quantitative Analysis of Explosives by Terahertz Time domain
Spectroscopy: Application to Imaging (poster)
Congrès annuel de Chimiometrie XVI, 20-21 January 2015, Genève, Suisse
Spectroscopy and terahertz imaging for Anthropology science (oral)
3rd International congress Biomedical Sciences and Methods in Archaeology, 6-9 November 2014,
Bordeaux, France
Detection of Nonmetallic Guns by Millimeter and submillimeter imaging (poster)
6th International Workshop on Terahertz Technology and Applications, 11-12 March 2014,
Kaiserslautern, Germany
Imagerie et spectroscopie Terahertz: applications aux problématiques de défense et de
sécurité (poster)
ED SPI day, 6 March 2014
Conferences participation
SPIE Security+ Defence
21-24 September 2015, Toulouse, France, Invited oral
2nd
International Conference on Tomography and Materials and Structures (ICTMS)
29 June - 3 July 2015, Quebec, Canada, Oral
AUTHOR CONTRIBUTION
155
8Th
Terahertz Days Conference
31March- 2 April 2015, Arêches-Beaufort, France, Oral and Poster
Congrès annuel de Chimiometrie XVI
20-21 January 2015, Genève, Suisse, Poster
39th International Conference on Infrared, Millimeter, and Terahertz Waves (IRMMW-THz)
14-19 September 2014, University of Arizona,Tucson, USA, Oral and Poster
6th International Workshop on Terahertz Technology and Applications
11-12 March 2014, Kaiserslautern, Germany, Poster
38th International Conference on Infrared, Millimeter, and Terahertz Waves (IRMMW-THz)
1-6 September 2013, Mainz, Germany, Presentation of 4 poster of the group
Activities
Teaching at university of Bordeaux (2014-2015).
Science diffusion in high schools (2013-2014).
Vice-president of the ‘SPIE Student Chapter Bordeaux’, (since March 2015).
Vice-president of the PhD student association SPIDoc, (since July 2014)
PhD student representative in the doctoral school SPI, (March 2014 till February 2015).
Distinctions
Best student paper presentation
« SPIE defense and security » conference, Toulouse, 2015
Audience Awards
FameLab competition 2015, France national final, cite des Sciences, Paris.