illinois community colleges’ economic impacts and …
TRANSCRIPT

A Report to the Illinois Community College Boardby the Center for Governmental StudiesNorthern Illinois University
SEPTEMBER 2021
ILLINOIS COMMUNITY COLLEGES’ ECONOMIC IMPACTS AND STUDENT EMPLOYMENT OUTCOMES
ii
The Illinois Community Colleges’ Economic Impacts report was prepared by the Center for Governmental Studies at Northern Illinois University (NIU) under agreement with the Illinois Community College Board (ICCB). Questions and inquiries regarding the contents of this report may be directed to Brian Richard at NIU (815/753-0162) or Nathan Wilson at ICCB (217/558-2067). The findings and conclusions presented in this report are those of the NIU project team alone and do not necessarily reflect the views, opinions, or policies of the officers and/or trustees of Northern Illinois University nor those of the employees, officers, and/or trustees of the Illinois Community College System.

iii
ACKNOWLEDGEMENTS The Northern Illinois University (NIU) project team consisted of Center for Governmental Studies staff Brian Richard, Assistant Director, Workforce Development, Andrew Blanke, Research Associate, and Nicolas Castillo, Graduate Research Assistant. Our invaluable Illinois Community College Board (ICCB) project team included Nathan Wilson, Deputy Director for Research, and Jay Brooks, Associate Deputy Director for Research and Analytics. The project advisory committee provided deep insight and constructive feedback during all phases of the project. Members include: Derrell Carter, AVP of Communications & Institutional Advancement, Triton College Christian Collins, Vice Chancellor of Institutional Effectiveness, City Colleges of Chicago - District Office Matthew Crull, Director of Research, Kishwaukee College Dr. Jose da Silva, Vice President, Student Affairs, Kankakee Community College Bryan Gleckler, VP Admin Services, Lincoln Land Community College Dr. Vance Gray, Dean of Instruction, City Colleges of Chicago - Olive-Harvey College Brittany Grimes, Director of Marketing & Public Relations, Carl Sandburg College Travis Henson, Director Marketing, Kaskaskia College Dr. Sadya Khan, Director, Institutional Research and Planning, Moraine Valley Community College Dr. Dennis Krieb, Director of Institutional Research and Library Services, Lewis and Clark Community College Dr. Judy Mitchell, President, Joliet Junior College Dr. Ali O’Brien, Vice President of Community & Workforce Partnerships, College of Lake County Dr. Sheila Quirk-Bailey, President, Illinois Central College Melissa Roche, Chief Financial Officer, Southwestern Illinois College Dr. Karen Weiss, Vice President of Academic Affairs, Southeastern Illinois College

iv
CONTENTS
Introduction ............................................................................................... 1
Illinois Community College Districts Map ......................................................... 3
Illinois Community Colleges’ Operating Environments ........................................ 4
Population ............................................................................................... 4
Race & Ethnicity Changes ........................................................................ 4
Meeting the Needs of Business and Industry ................................................. 6
Industry Employment Trends ................................................................... 7
Currently Available Jobs .......................................................................... 7
Current Demand for Workers ................................................................... 8
Workforce Trends ................................................................................... 11
Occupational Employment ..................................................................... 11
The Aging of the Workforce ................................................................... 13
Diversity, Equity, and Inclusion ................................................................... 14
Regional Equity Indicators ........................................................................ 17
Income and Poverty ............................................................................. 17
Educational Attainment ......................................................................... 18
Occupational Employment ..................................................................... 20
Coronavirus Pandemic ................................................................................ 24
Illinois Community Colleges Student Outcomes .............................................. 30
Student Return on Investment .................................................................. 31
Student Employment Outcomes ................................................................ 33
Employment........................................................................................ 34
Postsecondary Enrollment ..................................................................... 37
Earnings ............................................................................................. 38
Short-Term Certificate Student Employment Outcomes ................................. 42
Illinois Community College Economic Impacts ................................................ 44
References ............................................................................................... 46

Illinois Community Colleges’ Economic Impacts and Student Employment Outcomes
1
INTRODUCTION Illinois’ community college system consists of 39 college districts, along with the East St. Louis Higher Education Center, and includes 48 colleges (see map of the 39 college districts on Page 3). As the third largest community college system in the nation, Illinois community colleges serve more than 600,000 Illinois residents each year in credit and noncredit courses. The system provides traditional and nontraditional students with smooth transitions into and across higher education and training for in-demand occupations with economic value. Community colleges create an educated and skilled workforce by increasing credential attainment, building quality career pathways, closing the skills gap, and addressing the current and future needs of the workforce. Community colleges produce substantial economic impacts for the state and communities where they reside. This is an in-depth study of these impacts. Overall, the impacts are positive and are achieved on two fronts. First the study looks at students completing certificates and degrees in the Illinois Community College System (ICCS) that generate economic impacts by their employment and earnings gains. Then the study turns to evaluating economic impacts generated by the ICCS in the form of increased expenditures and employment. Additionally, to provide context with the economic impacts of the system, an analysis of the ICCS operating environment (i.e., environmental scan) is presented and focuses on external factors impacting community colleges such as population shifts, workforce trends, and the Coronavirus pandemic. Additionally, equity within the ICCS and its commitment to it is examined. A summary of key findings is presented below followed by the detailed study. Illinois’ 48 community colleges boost the economies of local communities. They are important sources of revenue and employment for the communities and regions they serve. These direct impacts ripple through the economy creating additional jobs, payrolls, and other economic activity.
In fiscal year 2020, Illinois community colleges directly employed 32,867 staff with a total payroll of $1.3 billion. In addition to wages and salaries, Illinois community colleges account for around $500 million in additional expenditures for a total of $1.8 billion in total operating expenditures.
These direct impacts ripple through the economy creating additional jobs, payrolls, and other economic activity. The total economic output of Illinois community colleges on the statewide economy in fiscal year 2020 is estimated at $3.5 billion and 43,316 jobs.
Illinois community colleges meet the needs of business and industry.
Illinois community colleges support local workforce and economic development services through employer and business engagement. During academic year 2020, Illinois community colleges worked with nearly 9,800 unique employers. Activities ranged from curriculum and apprenticeship development and review, contract training, internships, and professional development to job placement for graduating students.

Illinois Community Colleges’ Economic Impacts and Student Employment Outcomes
2
An Illinois community college education increases earnings for workers.
Obtaining a credential at a community college is an investment for students. The time and money invested in education results in higher earnings after completion. Investing in an Illinois community college long-term certificate or Associate in Applied Science degree yields an average annual rate of return of nearly 27%.
After adjusting for inflation, the class of 2009 community college graduates (long-term certificates and Associate degrees), earned $54,516 at the ten year mark after graduating. Earnings growth is most significant in the first few years after graduation, and there was an immediate increase of 40 % for the first year after graduation.
Annual earnings are even greater in specific areas of study. For students graduating with long-term certificates in architecture and construction programs, annual earnings five years after graduating were $60,552 while manufacturing program graduates earned $54,378 in the same timeframe.
Short-term certificates (defined as certificates under 30 credit hours) provide students with a quick and focused program of study that can lead to immediate employment. Select short-term programs that yield considerable annual earnings three years after completion include:
o Electrical and Power Transmission Installers - $69,216 o Fire Protection - $54,108 o HVAC and Refrigerator Maintenance - $48,708 o Criminal Justice and Corrections - $43,902 o Computer Systems Networking and Telecommunications - $43,554 o Ground Transportation (Truck Driving) - $42,492
When isolating graduates from long-term certificate and Associate in Applied Science
programs and examining earnings one year prior to completion to three years after, African American student earnings increased 88% and Latinx students increased their earnings by 119%.
Graduates from Illinois community colleges obtain stable employment upon completion.
More than 84% of completers in long-term certificate or Associate in Applied Science programs are employed in jobs in their chosen career field within a year of graduation.
Graduates with an associate degree (i.e., transfer degrees to a four-year institution) have an employment rate of 85% after five years and this increases to 92% ten years after graduation.

Illinois Community Colleges’ Economic Impacts and Student Employment Outcomes
3
ILLINOIS COMMUNITY COLLEGE DISTRICTS MAP
Illinois Community Colleges’ Economic Impacts and Student Employment Outcomes
4
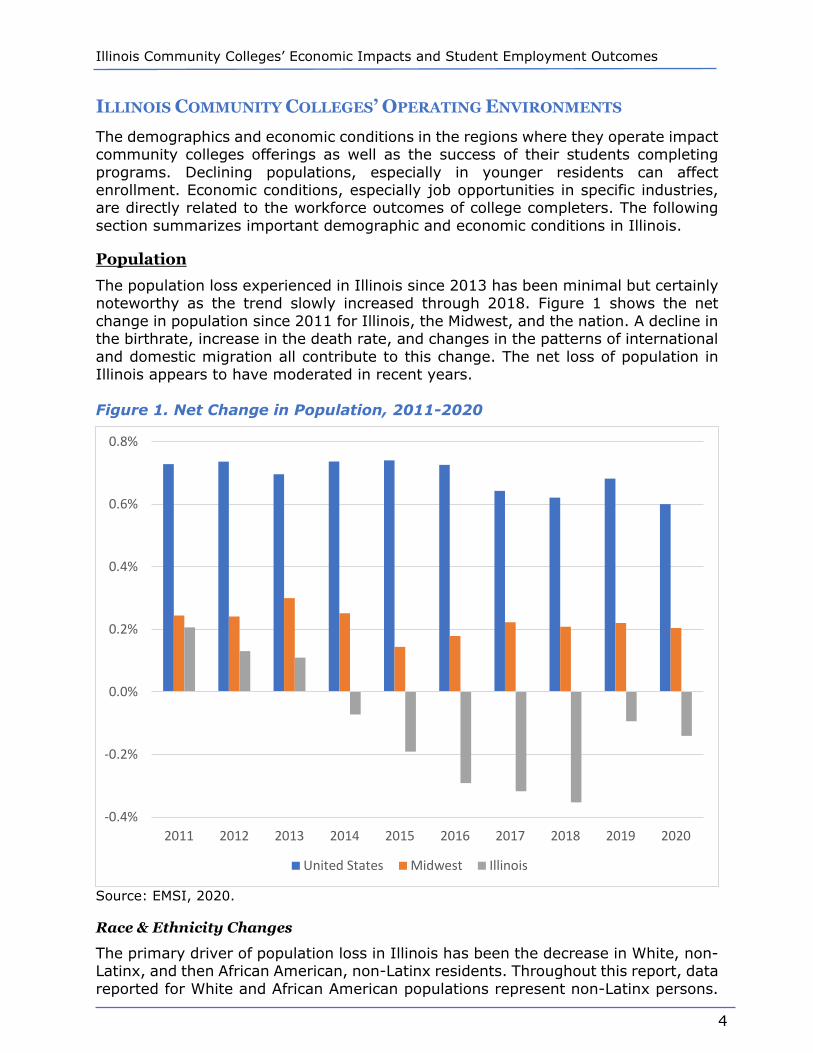
ILLINOIS COMMUNITY COLLEGES’ OPERATING ENVIRONMENTS The demographics and economic conditions in the regions where they operate impact community colleges offerings as well as the success of their students completing programs. Declining populations, especially in younger residents can affect enrollment. Economic conditions, especially job opportunities in specific industries, are directly related to the workforce outcomes of college completers. The following section summarizes important demographic and economic conditions in Illinois.
Population
The population loss experienced in Illinois since 2013 has been minimal but certainly noteworthy as the trend slowly increased through 2018. Figure 1 shows the net change in population since 2011 for Illinois, the Midwest, and the nation. A decline in the birthrate, increase in the death rate, and changes in the patterns of international and domestic migration all contribute to this change. The net loss of population in Illinois appears to have moderated in recent years. Figure 1. Net Change in Population, 2011-2020
Source: EMSI, 2020.
Race & Ethnicity Changes
The primary driver of population loss in Illinois has been the decrease in White, non-Latinx, and then African American, non-Latinx residents. Throughout this report, data reported for White and African American populations represent non-Latinx persons.
-0.4%
-0.2%
0.0%
0.2%
0.4%
0.6%
0.8%
2011 2012 2013 2014 2015 2016 2017 2018 2019 2020
United States Midwest Illinois

Illinois Community Colleges’ Economic Impacts and Student Employment Outcomes
5
The Latinx may contain multiple races. If it were not for the Asian, Other, and Latinx populations having higher birth rates or moving into Illinois, the population loss would be much greater. Figure 2 shows the change in the race and ethnicity categories for Illinois and the U.S. Illinois has lost nearly 550,000 White and more than 67,000 African American residents since 2010. The Latinx population in Illinois grew by about 200,000. Figure 2. Race & Ethnicity Change in Population, 2010-2020
Population Change
White, Non-
Latinx
African American,
Non-Latinx
Asian Other Latinx
United States 21,269,775 38,668 3,504,790 4,562,575 2,416,042 10,747,700
Illinois (221,803) (544,675) (67,721) 146,570 44,341 199,683 Source: EMSI, 2020. age cohorts, below age 30, are relatively smaller. Figure 3 shows the age and gender distribution of the Illinois population. There are significant numbers of people at or approaching retirement age (55-64). The younger age cohorts, below age 30, are relatively smaller. Figure 3. Age Pyramid for Illinois, 2019
Source: EMSI, 2020. The Illinois population is projected to decline slightly in the next decade. As displayed in Figure 4, both the White and African American populations are expected to decline. Offsetting those declines, Latinx, Asian, and other racial groups are expected to grow.
374,985376,278396,203403,101413,074444,285428,267426,518393,278407,046409,660436,663417,491352,347274,627202,650141,087174,973
392,105393,490412,681422,357424,241456,307437,944428,114392,531399,789399,051417,675387,427314,167232,818157,52799,03989,362
Under 5 years5 to 9 years
10 to 14 years15 to 19 years20 to 24 years25 to 29 years30 to 34 years35 to 39 years40 to 44 years45 to 49 years50 to 54 years55 to 59 years60 to 64 years65 to 69 years70 to 74 years75 to 79 years80 to 84 years
85 years and over
Female Male
Wor
king
Age
Illinois Community Colleges’ Economic Impacts and Student Employment Outcomes
6
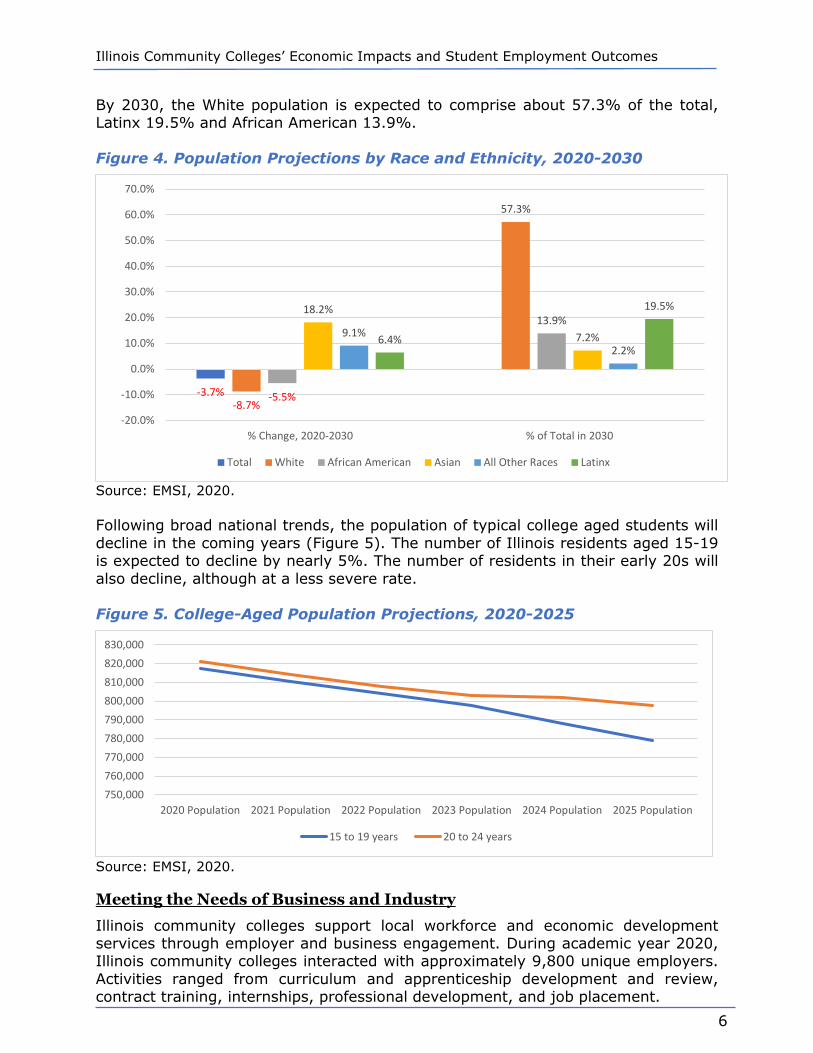
By 2030, the White population is expected to comprise about 57.3% of the total, Latinx 19.5% and African American 13.9%. Figure 4. Population Projections by Race and Ethnicity, 2020-2030
Source: EMSI, 2020. Following broad national trends, the population of typical college aged students will decline in the coming years (Figure 5). The number of Illinois residents aged 15-19 is expected to decline by nearly 5%. The number of residents in their early 20s will also decline, although at a less severe rate. Figure 5. College-Aged Population Projections, 2020-2025
Source: EMSI, 2020.
Meeting the Needs of Business and Industry
Illinois community colleges support local workforce and economic development services through employer and business engagement. During academic year 2020, Illinois community colleges interacted with approximately 9,800 unique employers. Activities ranged from curriculum and apprenticeship development and review, contract training, internships, professional development, and job placement.
-3.7%-8.7%
57.3%
-5.5%
13.9%18.2%
7.2%9.1%2.2%
6.4%
19.5%
-20.0%
-10.0%
0.0%
10.0%
20.0%
30.0%
40.0%
50.0%
60.0%
70.0%
% Change, 2020-2030 % of Total in 2030
Total White African American Asian All Other Races Latinx
750,000760,000770,000780,000790,000800,000810,000820,000830,000
2020 Population 2021 Population 2022 Population 2023 Population 2024 Population 2025 Population
15 to 19 years 20 to 24 years
Illinois Community Colleges’ Economic Impacts and Student Employment Outcomes
7
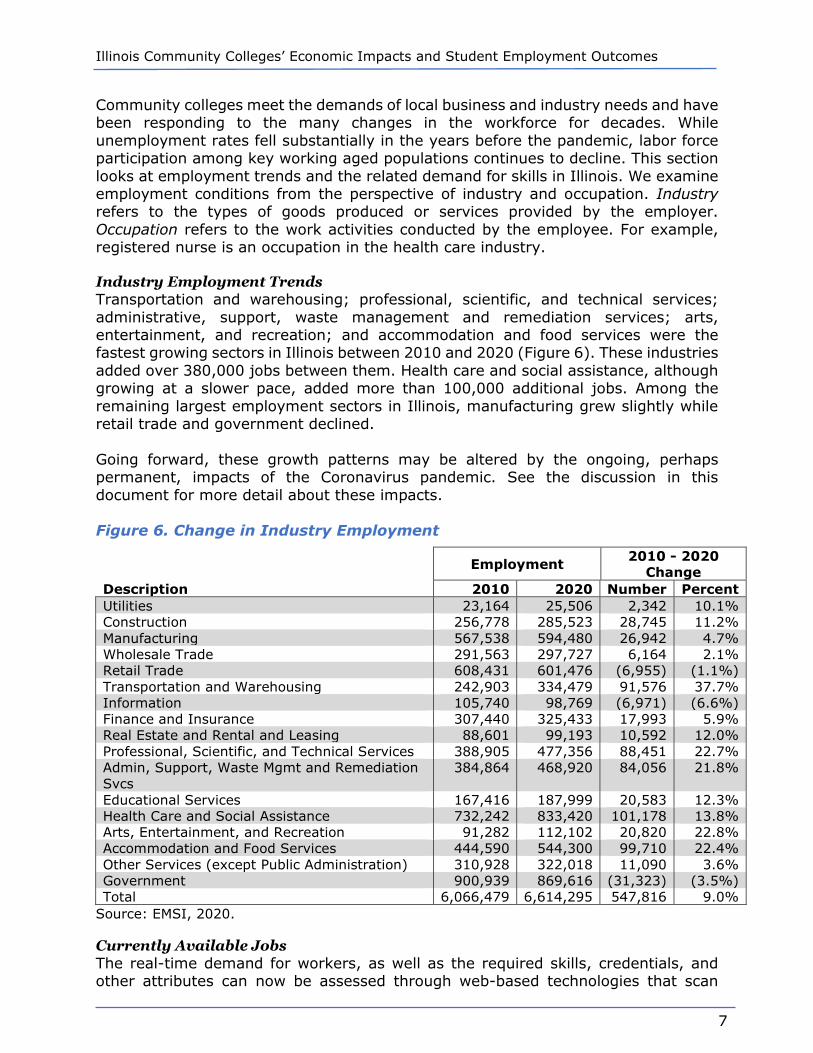
Community colleges meet the demands of local business and industry needs and have been responding to the many changes in the workforce for decades. While unemployment rates fell substantially in the years before the pandemic, labor force participation among key working aged populations continues to decline. This section looks at employment trends and the related demand for skills in Illinois. We examine employment conditions from the perspective of industry and occupation. Industry refers to the types of goods produced or services provided by the employer. Occupation refers to the work activities conducted by the employee. For example, registered nurse is an occupation in the health care industry. Industry Employment Trends Transportation and warehousing; professional, scientific, and technical services; administrative, support, waste management and remediation services; arts, entertainment, and recreation; and accommodation and food services were the fastest growing sectors in Illinois between 2010 and 2020 (Figure 6). These industries added over 380,000 jobs between them. Health care and social assistance, although growing at a slower pace, added more than 100,000 additional jobs. Among the remaining largest employment sectors in Illinois, manufacturing grew slightly while retail trade and government declined. Going forward, these growth patterns may be altered by the ongoing, perhaps permanent, impacts of the Coronavirus pandemic. See the discussion in this document for more detail about these impacts. Figure 6. Change in Industry Employment
Employment 2010 - 2020 Change
Description 2010 2020 Number Percent Utilities 23,164 25,506 2,342 10.1% Construction 256,778 285,523 28,745 11.2% Manufacturing 567,538 594,480 26,942 4.7% Wholesale Trade 291,563 297,727 6,164 2.1% Retail Trade 608,431 601,476 (6,955) (1.1%) Transportation and Warehousing 242,903 334,479 91,576 37.7% Information 105,740 98,769 (6,971) (6.6%) Finance and Insurance 307,440 325,433 17,993 5.9% Real Estate and Rental and Leasing 88,601 99,193 10,592 12.0% Professional, Scientific, and Technical Services 388,905 477,356 88,451 22.7% Admin, Support, Waste Mgmt and Remediation Svcs
384,864 468,920 84,056 21.8%
Educational Services 167,416 187,999 20,583 12.3% Health Care and Social Assistance 732,242 833,420 101,178 13.8% Arts, Entertainment, and Recreation 91,282 112,102 20,820 22.8% Accommodation and Food Services 444,590 544,300 99,710 22.4% Other Services (except Public Administration) 310,928 322,018 11,090 3.6% Government 900,939 869,616 (31,323) (3.5%) Total 6,066,479 6,614,295 547,816 9.0%
Source: EMSI, 2020.
Currently Available Jobs The real-time demand for workers, as well as the required skills, credentials, and other attributes can now be assessed through web-based technologies that scan
Illinois Community Colleges’ Economic Impacts and Student Employment Outcomes
8
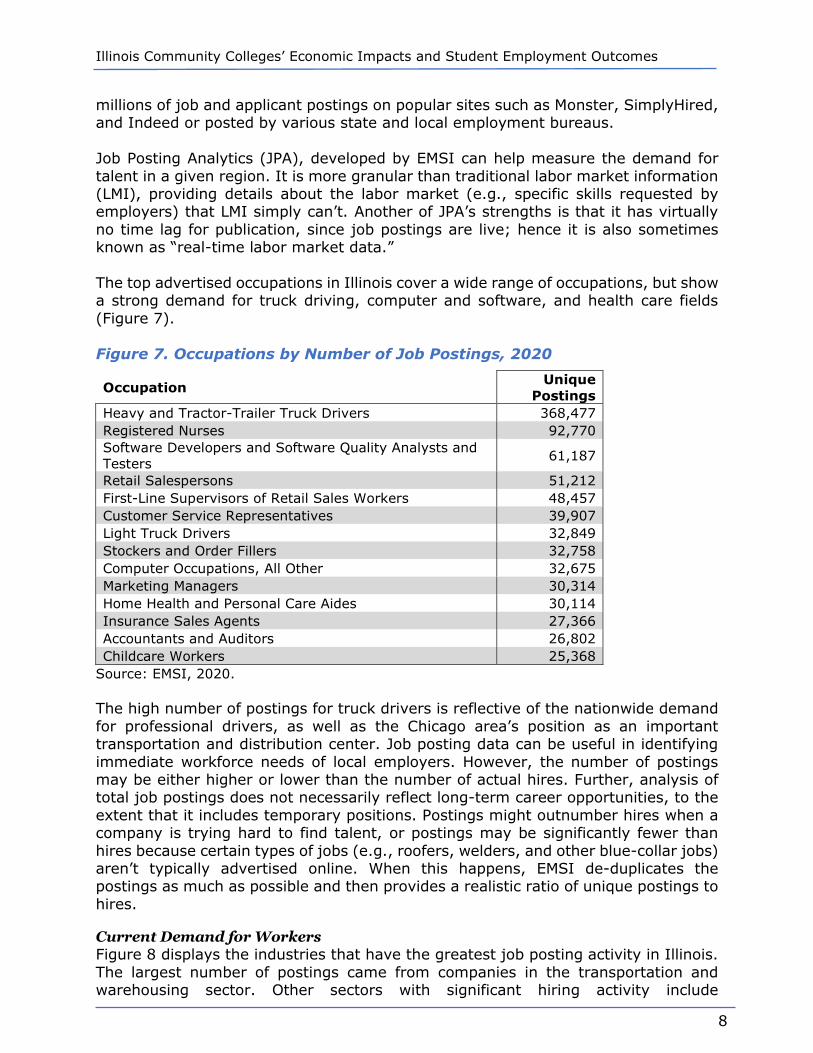
millions of job and applicant postings on popular sites such as Monster, SimplyHired, and Indeed or posted by various state and local employment bureaus. Job Posting Analytics (JPA), developed by EMSI can help measure the demand for talent in a given region. It is more granular than traditional labor market information (LMI), providing details about the labor market (e.g., specific skills requested by employers) that LMI simply can’t. Another of JPA’s strengths is that it has virtually no time lag for publication, since job postings are live; hence it is also sometimes known as “real-time labor market data.” The top advertised occupations in Illinois cover a wide range of occupations, but show a strong demand for truck driving, computer and software, and health care fields (Figure 7). Figure 7. Occupations by Number of Job Postings, 2020
Occupation Unique Postings
Heavy and Tractor-Trailer Truck Drivers 368,477 Registered Nurses 92,770 Software Developers and Software Quality Analysts and Testers 61,187
Retail Salespersons 51,212 First-Line Supervisors of Retail Sales Workers 48,457 Customer Service Representatives 39,907 Light Truck Drivers 32,849 Stockers and Order Fillers 32,758 Computer Occupations, All Other 32,675 Marketing Managers 30,314 Home Health and Personal Care Aides 30,114 Insurance Sales Agents 27,366 Accountants and Auditors 26,802 Childcare Workers 25,368
Source: EMSI, 2020. The high number of postings for truck drivers is reflective of the nationwide demand for professional drivers, as well as the Chicago area’s position as an important transportation and distribution center. Job posting data can be useful in identifying immediate workforce needs of local employers. However, the number of postings may be either higher or lower than the number of actual hires. Further, analysis of total job postings does not necessarily reflect long-term career opportunities, to the extent that it includes temporary positions. Postings might outnumber hires when a company is trying hard to find talent, or postings may be significantly fewer than hires because certain types of jobs (e.g., roofers, welders, and other blue-collar jobs) aren’t typically advertised online. When this happens, EMSI de-duplicates the postings as much as possible and then provides a realistic ratio of unique postings to hires.
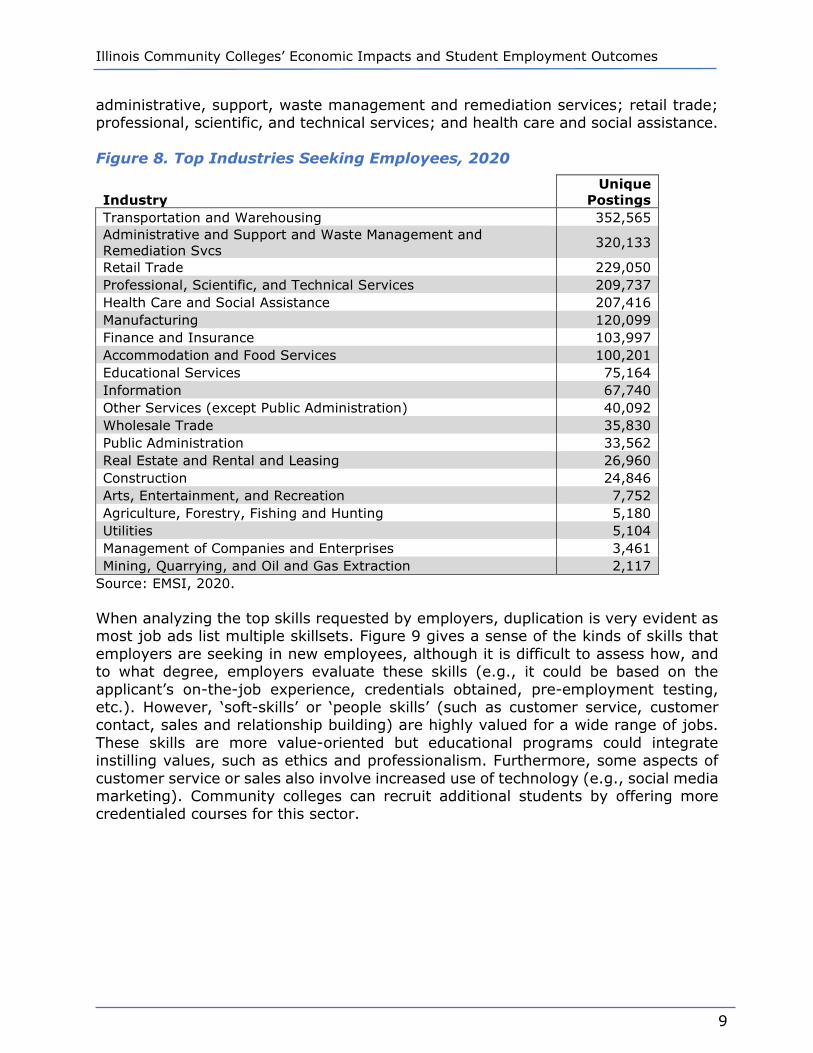
Current Demand for Workers Figure 8 displays the industries that have the greatest job posting activity in Illinois. The largest number of postings came from companies in the transportation and warehousing sector. Other sectors with significant hiring activity include
Illinois Community Colleges’ Economic Impacts and Student Employment Outcomes
9
administrative, support, waste management and remediation services; retail trade; professional, scientific, and technical services; and health care and social assistance. Figure 8. Top Industries Seeking Employees, 2020
Industry Unique
Postings Transportation and Warehousing 352,565 Administrative and Support and Waste Management and Remediation Svcs 320,133
Retail Trade 229,050 Professional, Scientific, and Technical Services 209,737 Health Care and Social Assistance 207,416 Manufacturing 120,099 Finance and Insurance 103,997 Accommodation and Food Services 100,201 Educational Services 75,164 Information 67,740 Other Services (except Public Administration) 40,092 Wholesale Trade 35,830 Public Administration 33,562 Real Estate and Rental and Leasing 26,960 Construction 24,846 Arts, Entertainment, and Recreation 7,752 Agriculture, Forestry, Fishing and Hunting 5,180 Utilities 5,104 Management of Companies and Enterprises 3,461 Mining, Quarrying, and Oil and Gas Extraction 2,117
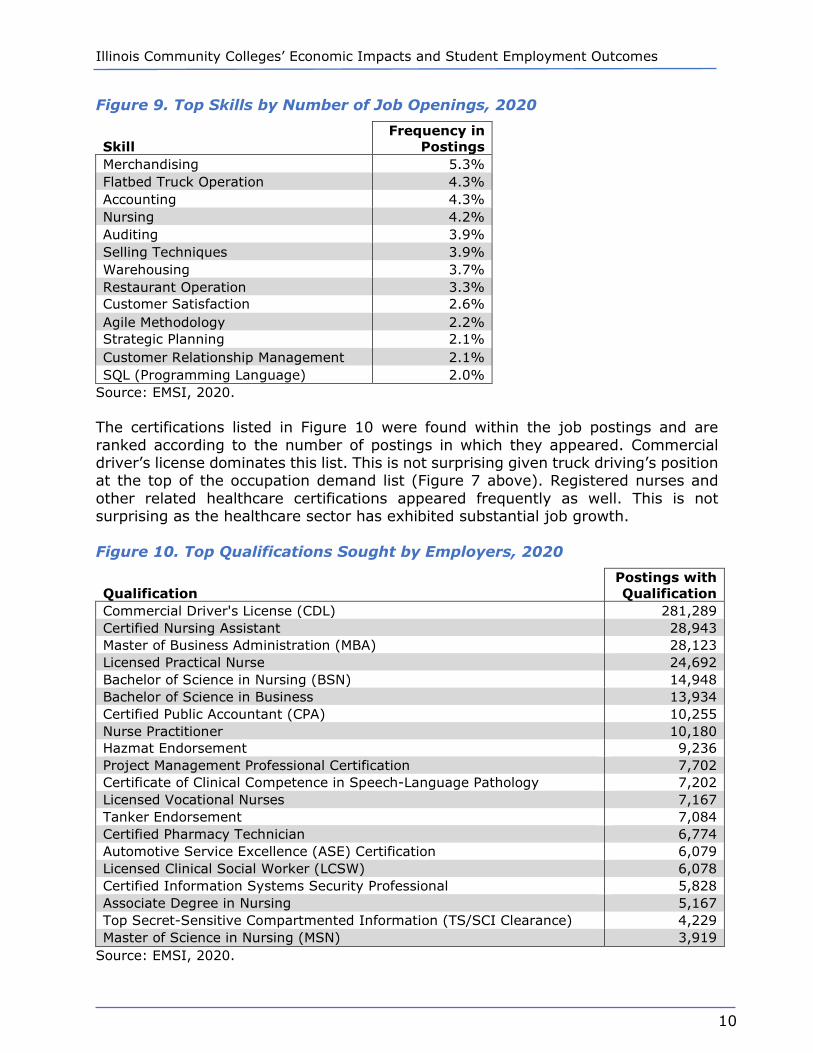
Source: EMSI, 2020. When analyzing the top skills requested by employers, duplication is very evident as most job ads list multiple skillsets. Figure 9 gives a sense of the kinds of skills that employers are seeking in new employees, although it is difficult to assess how, and to what degree, employers evaluate these skills (e.g., it could be based on the applicant’s on-the-job experience, credentials obtained, pre-employment testing, etc.). However, ‘soft-skills’ or ‘people skills’ (such as customer service, customer contact, sales and relationship building) are highly valued for a wide range of jobs. These skills are more value-oriented but educational programs could integrate instilling values, such as ethics and professionalism. Furthermore, some aspects of customer service or sales also involve increased use of technology (e.g., social media marketing). Community colleges can recruit additional students by offering more credentialed courses for this sector.
Illinois Community Colleges’ Economic Impacts and Student Employment Outcomes
10
Figure 9. Top Skills by Number of Job Openings, 2020
Skill Frequency in
Postings Merchandising 5.3% Flatbed Truck Operation 4.3% Accounting 4.3% Nursing 4.2% Auditing 3.9% Selling Techniques 3.9% Warehousing 3.7% Restaurant Operation 3.3% Customer Satisfaction 2.6% Agile Methodology 2.2% Strategic Planning 2.1% Customer Relationship Management 2.1% SQL (Programming Language) 2.0%
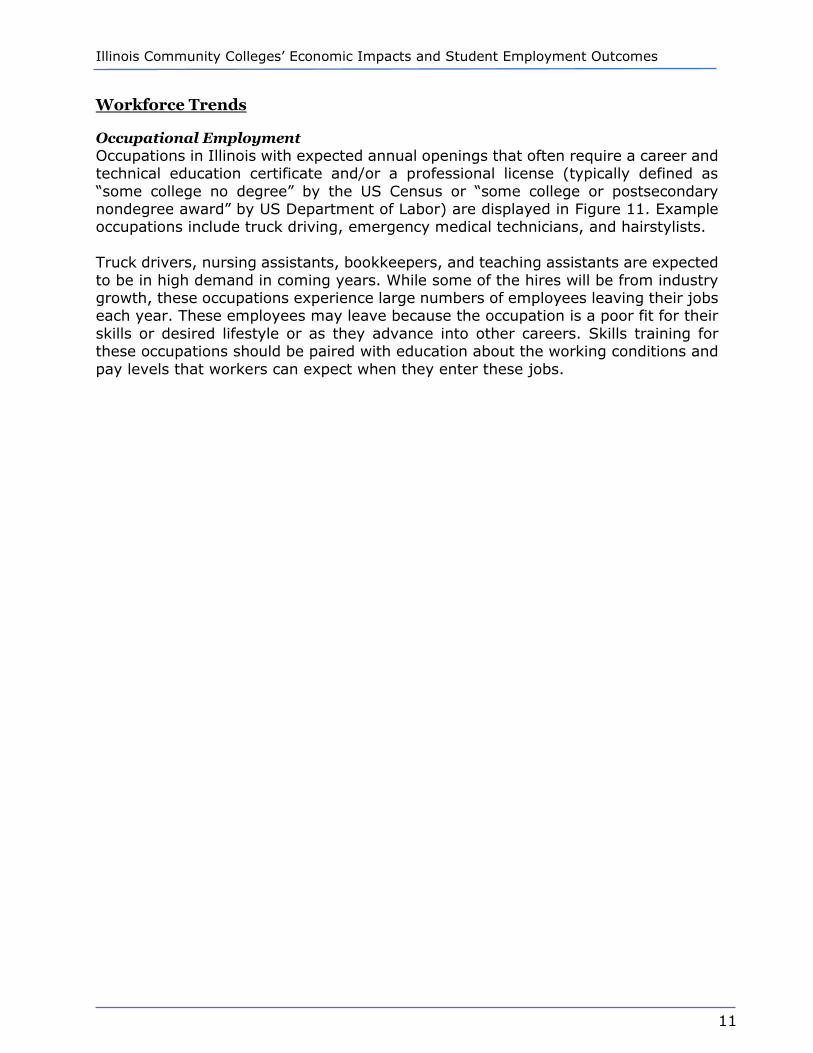
Source: EMSI, 2020. The certifications listed in Figure 10 were found within the job postings and are ranked according to the number of postings in which they appeared. Commercial driver’s license dominates this list. This is not surprising given truck driving’s position at the top of the occupation demand list (Figure 7 above). Registered nurses and other related healthcare certifications appeared frequently as well. This is not surprising as the healthcare sector has exhibited substantial job growth. Figure 10. Top Qualifications Sought by Employers, 2020
Qualification Postings with Qualification
Commercial Driver's License (CDL) 281,289 Certified Nursing Assistant 28,943 Master of Business Administration (MBA) 28,123 Licensed Practical Nurse 24,692 Bachelor of Science in Nursing (BSN) 14,948 Bachelor of Science in Business 13,934 Certified Public Accountant (CPA) 10,255 Nurse Practitioner 10,180 Hazmat Endorsement 9,236 Project Management Professional Certification 7,702 Certificate of Clinical Competence in Speech-Language Pathology 7,202 Licensed Vocational Nurses 7,167 Tanker Endorsement 7,084 Certified Pharmacy Technician 6,774 Automotive Service Excellence (ASE) Certification 6,079 Licensed Clinical Social Worker (LCSW) 6,078 Certified Information Systems Security Professional 5,828 Associate Degree in Nursing 5,167 Top Secret-Sensitive Compartmented Information (TS/SCI Clearance) 4,229 Master of Science in Nursing (MSN) 3,919
Source: EMSI, 2020.
Illinois Community Colleges’ Economic Impacts and Student Employment Outcomes
11
Workforce Trends
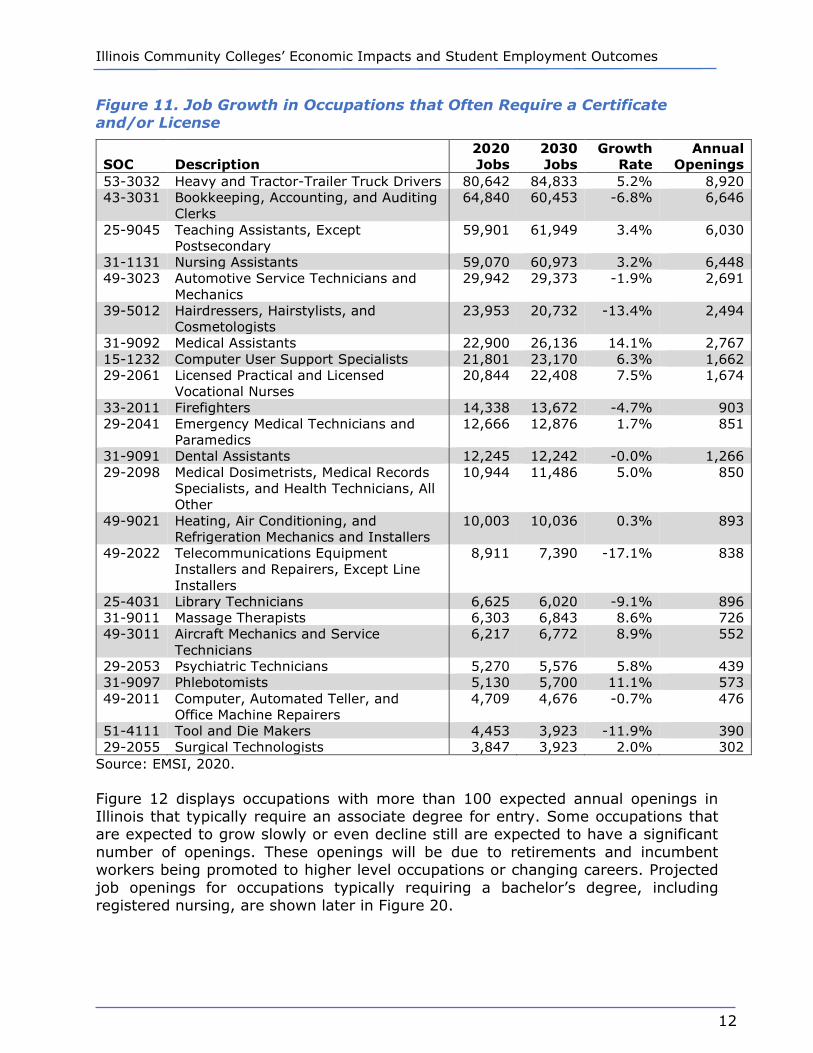
Occupational Employment Occupations in Illinois with expected annual openings that often require a career and technical education certificate and/or a professional license (typically defined as “some college no degree” by the US Census or “some college or postsecondary nondegree award” by US Department of Labor) are displayed in Figure 11. Example occupations include truck driving, emergency medical technicians, and hairstylists. Truck drivers, nursing assistants, bookkeepers, and teaching assistants are expected to be in high demand in coming years. While some of the hires will be from industry growth, these occupations experience large numbers of employees leaving their jobs each year. These employees may leave because the occupation is a poor fit for their skills or desired lifestyle or as they advance into other careers. Skills training for these occupations should be paired with education about the working conditions and pay levels that workers can expect when they enter these jobs.
Illinois Community Colleges’ Economic Impacts and Student Employment Outcomes
12
Figure 11. Job Growth in Occupations that Often Require a Certificate and/or License
SOC Description 2020 Jobs
2030 Jobs
Growth Rate
Annual Openings
53-3032 Heavy and Tractor-Trailer Truck Drivers 80,642 84,833 5.2% 8,920 43-3031 Bookkeeping, Accounting, and Auditing
Clerks 64,840 60,453 -6.8% 6,646
25-9045 Teaching Assistants, Except Postsecondary
59,901 61,949 3.4% 6,030
31-1131 Nursing Assistants 59,070 60,973 3.2% 6,448 49-3023 Automotive Service Technicians and
Mechanics 29,942 29,373 -1.9% 2,691
39-5012 Hairdressers, Hairstylists, and Cosmetologists
23,953 20,732 -13.4% 2,494
31-9092 Medical Assistants 22,900 26,136 14.1% 2,767 15-1232 Computer User Support Specialists 21,801 23,170 6.3% 1,662 29-2061 Licensed Practical and Licensed
Vocational Nurses 20,844 22,408 7.5% 1,674
33-2011 Firefighters 14,338 13,672 -4.7% 903 29-2041 Emergency Medical Technicians and
Paramedics 12,666 12,876 1.7% 851
31-9091 Dental Assistants 12,245 12,242 -0.0% 1,266 29-2098 Medical Dosimetrists, Medical Records
Specialists, and Health Technicians, All Other
10,944 11,486 5.0% 850
49-9021 Heating, Air Conditioning, and Refrigeration Mechanics and Installers
10,003 10,036 0.3% 893
49-2022 Telecommunications Equipment Installers and Repairers, Except Line Installers
8,911 7,390 -17.1% 838
25-4031 Library Technicians 6,625 6,020 -9.1% 896 31-9011 Massage Therapists 6,303 6,843 8.6% 726 49-3011 Aircraft Mechanics and Service
Technicians 6,217 6,772 8.9% 552
29-2053 Psychiatric Technicians 5,270 5,576 5.8% 439 31-9097 Phlebotomists 5,130 5,700 11.1% 573 49-2011 Computer, Automated Teller, and
Office Machine Repairers 4,709 4,676 -0.7% 476
51-4111 Tool and Die Makers 4,453 3,923 -11.9% 390 29-2055 Surgical Technologists 3,847 3,923 2.0% 302
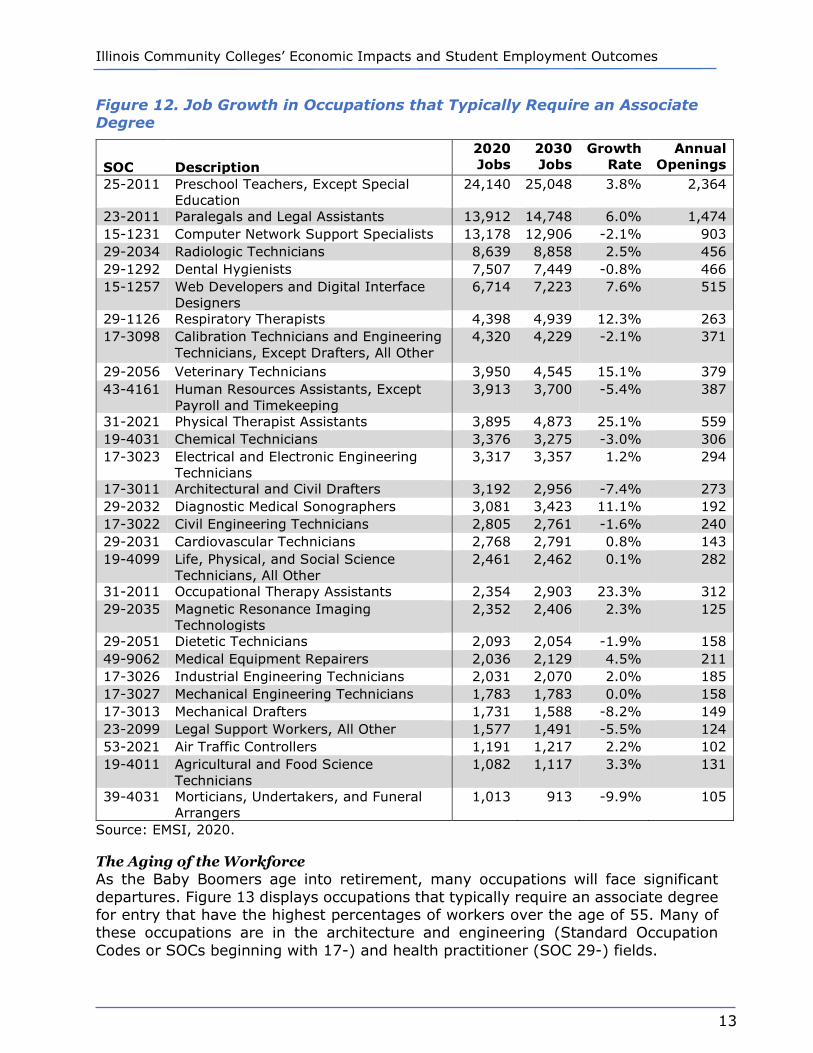
Source: EMSI, 2020. Figure 12 displays occupations with more than 100 expected annual openings in Illinois that typically require an associate degree for entry. Some occupations that are expected to grow slowly or even decline still are expected to have a significant number of openings. These openings will be due to retirements and incumbent workers being promoted to higher level occupations or changing careers. Projected job openings for occupations typically requiring a bachelor’s degree, including registered nursing, are shown later in Figure 20.
Illinois Community Colleges’ Economic Impacts and Student Employment Outcomes
13
Figure 12. Job Growth in Occupations that Typically Require an Associate Degree
SOC Description 2020 Jobs
2030 Jobs
Growth Rate
Annual Openings
25-2011 Preschool Teachers, Except Special Education
24,140 25,048 3.8% 2,364
23-2011 Paralegals and Legal Assistants 13,912 14,748 6.0% 1,474 15-1231 Computer Network Support Specialists 13,178 12,906 -2.1% 903 29-2034 Radiologic Technicians 8,639 8,858 2.5% 456 29-1292 Dental Hygienists 7,507 7,449 -0.8% 466 15-1257 Web Developers and Digital Interface
Designers 6,714 7,223 7.6% 515
29-1126 Respiratory Therapists 4,398 4,939 12.3% 263 17-3098 Calibration Technicians and Engineering
Technicians, Except Drafters, All Other 4,320 4,229 -2.1% 371
29-2056 Veterinary Technicians 3,950 4,545 15.1% 379 43-4161 Human Resources Assistants, Except
Payroll and Timekeeping 3,913 3,700 -5.4% 387
31-2021 Physical Therapist Assistants 3,895 4,873 25.1% 559 19-4031 Chemical Technicians 3,376 3,275 -3.0% 306 17-3023 Electrical and Electronic Engineering
Technicians 3,317 3,357 1.2% 294
17-3011 Architectural and Civil Drafters 3,192 2,956 -7.4% 273 29-2032 Diagnostic Medical Sonographers 3,081 3,423 11.1% 192 17-3022 Civil Engineering Technicians 2,805 2,761 -1.6% 240 29-2031 Cardiovascular Technicians 2,768 2,791 0.8% 143 19-4099 Life, Physical, and Social Science
Technicians, All Other 2,461 2,462 0.1% 282
31-2011 Occupational Therapy Assistants 2,354 2,903 23.3% 312 29-2035 Magnetic Resonance Imaging
Technologists 2,352 2,406 2.3% 125
29-2051 Dietetic Technicians 2,093 2,054 -1.9% 158 49-9062 Medical Equipment Repairers 2,036 2,129 4.5% 211 17-3026 Industrial Engineering Technicians 2,031 2,070 2.0% 185 17-3027 Mechanical Engineering Technicians 1,783 1,783 0.0% 158 17-3013 Mechanical Drafters 1,731 1,588 -8.2% 149 23-2099 Legal Support Workers, All Other 1,577 1,491 -5.5% 124 53-2021 Air Traffic Controllers 1,191 1,217 2.2% 102 19-4011 Agricultural and Food Science
Technicians 1,082 1,117 3.3% 131
39-4031 Morticians, Undertakers, and Funeral Arrangers
1,013 913 -9.9% 105
Source: EMSI, 2020.
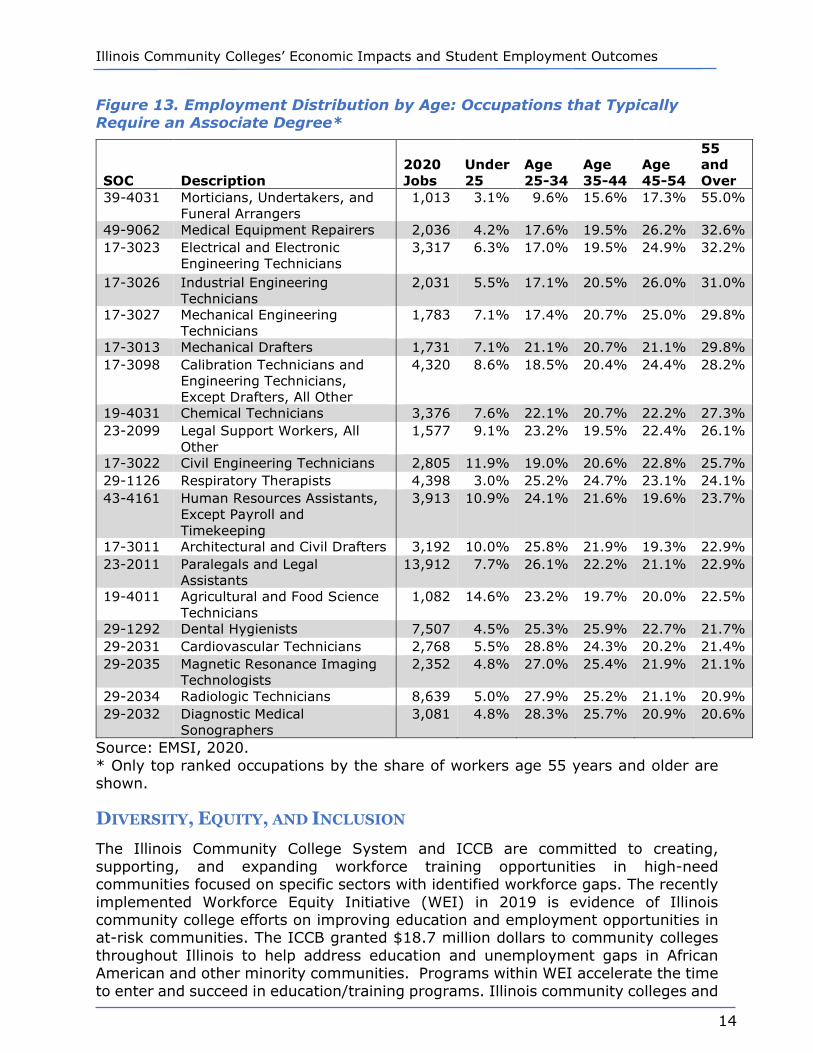
The Aging of the Workforce As the Baby Boomers age into retirement, many occupations will face significant departures. Figure 13 displays occupations that typically require an associate degree for entry that have the highest percentages of workers over the age of 55. Many of these occupations are in the architecture and engineering (Standard Occupation Codes or SOCs beginning with 17-) and health practitioner (SOC 29-) fields.
Illinois Community Colleges’ Economic Impacts and Student Employment Outcomes
14
Figure 13. Employment Distribution by Age: Occupations that Typically Require an Associate Degree*
SOC Description 2020 Jobs
Under 25
Age 25-34
Age 35-44
Age 45-54
55 and Over
39-4031 Morticians, Undertakers, and Funeral Arrangers
1,013 3.1% 9.6% 15.6% 17.3% 55.0%
49-9062 Medical Equipment Repairers 2,036 4.2% 17.6% 19.5% 26.2% 32.6% 17-3023 Electrical and Electronic
Engineering Technicians 3,317 6.3% 17.0% 19.5% 24.9% 32.2%
17-3026 Industrial Engineering Technicians
2,031 5.5% 17.1% 20.5% 26.0% 31.0%
17-3027 Mechanical Engineering Technicians
1,783 7.1% 17.4% 20.7% 25.0% 29.8%
17-3013 Mechanical Drafters 1,731 7.1% 21.1% 20.7% 21.1% 29.8% 17-3098 Calibration Technicians and
Engineering Technicians, Except Drafters, All Other
4,320 8.6% 18.5% 20.4% 24.4% 28.2%
19-4031 Chemical Technicians 3,376 7.6% 22.1% 20.7% 22.2% 27.3% 23-2099 Legal Support Workers, All
Other 1,577 9.1% 23.2% 19.5% 22.4% 26.1%
17-3022 Civil Engineering Technicians 2,805 11.9% 19.0% 20.6% 22.8% 25.7% 29-1126 Respiratory Therapists 4,398 3.0% 25.2% 24.7% 23.1% 24.1% 43-4161 Human Resources Assistants,
Except Payroll and Timekeeping
3,913 10.9% 24.1% 21.6% 19.6% 23.7%
17-3011 Architectural and Civil Drafters 3,192 10.0% 25.8% 21.9% 19.3% 22.9% 23-2011 Paralegals and Legal
Assistants 13,912 7.7% 26.1% 22.2% 21.1% 22.9%
19-4011 Agricultural and Food Science Technicians
1,082 14.6% 23.2% 19.7% 20.0% 22.5%
29-1292 Dental Hygienists 7,507 4.5% 25.3% 25.9% 22.7% 21.7% 29-2031 Cardiovascular Technicians 2,768 5.5% 28.8% 24.3% 20.2% 21.4% 29-2035 Magnetic Resonance Imaging
Technologists 2,352 4.8% 27.0% 25.4% 21.9% 21.1%
29-2034 Radiologic Technicians 8,639 5.0% 27.9% 25.2% 21.1% 20.9% 29-2032 Diagnostic Medical
Sonographers 3,081 4.8% 28.3% 25.7% 20.9% 20.6%
Source: EMSI, 2020. * Only top ranked occupations by the share of workers age 55 years and older are shown.
DIVERSITY, EQUITY, AND INCLUSION The Illinois Community College System and ICCB are committed to creating, supporting, and expanding workforce training opportunities in high-need communities focused on specific sectors with identified workforce gaps. The recently implemented Workforce Equity Initiative (WEI) in 2019 is evidence of Illinois community college efforts on improving education and employment opportunities in at-risk communities. The ICCB granted $18.7 million dollars to community colleges throughout Illinois to help address education and unemployment gaps in African American and other minority communities. Programs within WEI accelerate the time to enter and succeed in education/training programs. Illinois community colleges and
Illinois Community Colleges’ Economic Impacts and Student Employment Outcomes
15
ICCB are devoted to initiatives like WEI and others to promote gainful employment for underrepresented populations. There are several state and federal initiatives that the Illinois Community College System and ICCB are committed to and collaborating on with state agency and business/workforce partners. One of Governor Pritzker’s earliest actions was to issue Executive Order 2019-03 (EO3), focused on strengthening the state’s commitment to workforce development and job creation. EO3 directed the Department of Commerce and Economic Opportunity (DCEO) to deliver a report containing three components: identify target growth industries, review of effective and efficient investment in targeted industries, and report on improving alignment of workforce resources for disenfranchised communities. That final component stated the report should contain “comprehensive recommendations for improving the alignment of workforce resources for communities that have been disenfranchised, including rural and urban communities.” The report prepared in response by DCEO in cooperation with Departments of Employment Security and Human Services and the Illinois Community College Board includes three Action Areas (An Action Agenda, p. 3-4):
• Action Area 1. Unite workforce development partners around regional cluster strategies: Regional cluster strategies will focus resources on the industries with the highest potential to add jobs and increase prosperity in regions across Illinois. These strategies bring together the public and private sectors in each region to build on their unique strengths.
• Action Area 2. Prepare Illinois workers for a career, not just their next job: Regardless of background, life circumstances, or education level, Illinois workers can be prepared for high-demand careers by developing core academic, technical, and essential employability skills throughout their lifetimes.
• Action Area 3. Connect job seekers with employers: Illinois businesses can find the productive workers they need through more efficient training and better services for job seekers and employers.
Action Area 2 included a strategy focused on equity: Establish and support equity goals. “Preparing workers to meet the needs of business while connecting them to viable career pathways in Illinois’ most vibrant industries will lead to economic prosperity at all levels. An important focus of these efforts must be ensuring that disenfranchised populations have access to these employment opportunities” (An Action Agenda, p. 15). This strategy had several Action Steps, including (An Action Agenda, p. 16):
o Disaggregate data by race, gender, and target population to reveal where disparities and inequities exist in policies and programs.
o Compel advisory and oversight boards/councils to set equity goals and prepare action plans to achieve them.
Subsequent to the release of the EO3 report, a number of economic, education, and workforce development plans have been developed and released. These plans have
Illinois Community Colleges’ Economic Impacts and Student Employment Outcomes
16
increasingly placed an importance on equity issues. The Illinois economic development plan includes an aspirational goal focused on equity (A Plan to Revitalize, p. 3):
Reduce the Equity Gap by investing in, providing support to, and taking down barriers for economically disadvantaged populations. We will track our progress toward this goal by tracking average earnings relative to the statewide average for the following populations:
• Women
• Rural residents
• People of color
• People with disabilities
• Veterans
• Justice-impacted populations
• Immigrant populations
The Illinois State Plan for Perkins V includes a Foundational Tenet focused on increasing educational equity for members of special populations (Illinois’ Perkins V State Plan, p. 5):
Illinois aims to place equity at the forefront of decisions made regarding career and technical education (CTE) programming, acknowledging that opportunity and achievement gaps exist for members of special populations. Perkins V affords Illinois the opportunity for an increased focus on meeting the needs of members of special populations by improving systems to identify and understand equity gaps, aligning resource systems, and providing professional learning to support the implementation of CTE programs that are accessible and effective for all students.
Similarly, the Illinois Workforce Innovation Board guided the development of the Illinois Workforce Innovation and Opportunity Act (WIOA) Unified State Plan, which includes a set of principles as part of its vision statement. One focuses on equity:
Equitable Access and Opportunity for All Populations - Connecting individuals with relevant supports, such as transportation, child care, and transition services will enable the system to be responsive to the workforce readiness needs of all individuals and help targeted populations prepare for and advance along a career pathway.
While these plans place an importance on equity issues, only the economic development plan provides guidance on how equity should be quantified and tracked. There are other resources that suggest metrics for tracking progress on equity. The Center for Urban Education states that “Effective state attainment goals are based on an understanding of for whom and by how much higher education access and success must improve” (Making Equity Part, p. 4). This understanding answers these questions:
Illinois Community Colleges’ Economic Impacts and Student Employment Outcomes
17
• Which populations have the lowest rates of postsecondary attainment historically?
• Which populations are the fastest growing in the state?
• What career fields and occupations in the state have strong labor market demand currently? In five, 10, 15 years? What are the levels of educational attainment required for those jobs? What are the projected shortfalls of adults with those credentials?
• At current rates of educational attainment, will some populations in the state be disproportionately excluded from opportunities in high-wage, high-demand jobs?
Similarly, a report from Education Trust cites degree attainment as an important regional measure of equity. Based on an analysis of social mobility (the ability of people to achieve higher incomes than their parents), the authors conclude that education is a way out of poverty. Thus, they suggest three ways of looking at educational attainment (Del Pilar & Berger, p. 16):
• Overall degree attainment
• Growth in degree attainment
• Gaps in degree attainment The Office of Community College Research and Leadership at University of Illinois at Urbana-Champaign also suggests metrics for ensuring programs align with labor market needs and demands, with a particular focus on equity (Welton & James-Gallaway, p. 9-11). These include using data to identify inequitable employment outcomes.
Regional Equity Indicators
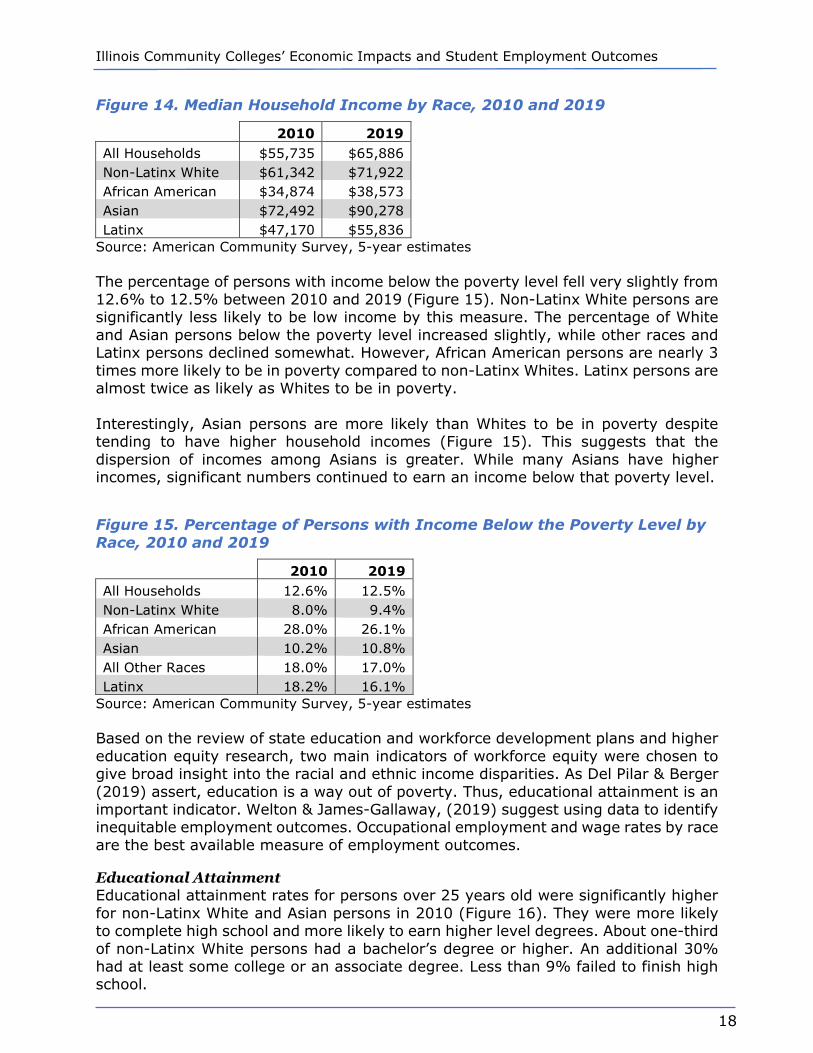
Income and Poverty Racial and ethnic income disparities are significant and persistent in Illinois. Non-Latinx White and Asian workers earn significantly more than African American and Latinx workers. Consequently, African American and Latinx households are more likely to be in poverty. In 2010, the median income for African American households in Illinois was about 57% of non-Latinx White households (Figure 14). The median income for non-Latinx White households grew by about 18% between 2010 and 2019 while African American households only grew by about 12%. Thus, the median income for African American households in 2019 fell to just 54% of non-Latinx White households. Latinx households tend to have higher incomes than African American households, but still earn significantly less than non-Latinx White households. However, Latinx household median income grew slightly more than non-Latinx White households. Latinx household median income grew from about 77% of non-Latinx White households in 2010 to about 78% in 2019. Care must be taken when comparing incomes for Latinx households, since Latinx ethnicity can include any race.
Illinois Community Colleges’ Economic Impacts and Student Employment Outcomes
18
Figure 14. Median Household Income by Race, 2010 and 2019
2010 2019 All Households $55,735 $65,886 Non-Latinx White $61,342 $71,922 African American $34,874 $38,573 Asian $72,492 $90,278 Latinx $47,170 $55,836
Source: American Community Survey, 5-year estimates The percentage of persons with income below the poverty level fell very slightly from 12.6% to 12.5% between 2010 and 2019 (Figure 15). Non-Latinx White persons are significantly less likely to be low income by this measure. The percentage of White and Asian persons below the poverty level increased slightly, while other races and Latinx persons declined somewhat. However, African American persons are nearly 3 times more likely to be in poverty compared to non-Latinx Whites. Latinx persons are almost twice as likely as Whites to be in poverty. Interestingly, Asian persons are more likely than Whites to be in poverty despite tending to have higher household incomes (Figure 15). This suggests that the dispersion of incomes among Asians is greater. While many Asians have higher incomes, significant numbers continued to earn an income below that poverty level.
Figure 15. Percentage of Persons with Income Below the Poverty Level by Race, 2010 and 2019
2010 2019 All Households 12.6% 12.5% Non-Latinx White 8.0% 9.4% African American 28.0% 26.1% Asian 10.2% 10.8% All Other Races 18.0% 17.0% Latinx 18.2% 16.1%
Source: American Community Survey, 5-year estimates Based on the review of state education and workforce development plans and higher education equity research, two main indicators of workforce equity were chosen to give broad insight into the racial and ethnic income disparities. As Del Pilar & Berger (2019) assert, education is a way out of poverty. Thus, educational attainment is an important indicator. Welton & James-Gallaway, (2019) suggest using data to identify inequitable employment outcomes. Occupational employment and wage rates by race are the best available measure of employment outcomes.
Educational Attainment Educational attainment rates for persons over 25 years old were significantly higher for non-Latinx White and Asian persons in 2010 (Figure 16). They were more likely to complete high school and more likely to earn higher level degrees. About one-third of non-Latinx White persons had a bachelor’s degree or higher. An additional 30% had at least some college or an associate degree. Less than 9% failed to finish high school.

Illinois Community Colleges’ Economic Impacts and Student Employment Outcomes
19
The percentage of African American persons that earned a high school diploma but did not continue their education was about 29%, the same rate as White persons. A higher percentage of African American persons (34%) than Whites had some college or an associate degree. However, African American persons are significantly less likely to earn a bachelor’s degree or higher than Whites. Nearly 19% of African American persons had not earned a high school diploma or equivalent. Latinx persons had significantly lower attainment rates than the other groups. Over 40% had not completed high school in 2010. They were also much less likely to continue their education beyond high school. Figure 16. 2010 Educational Attainment by Race and Ethnicity for Population Age 25 and Over
Total
Non-Latinx White
African American Asian
All other races Latinx
Total 8,345,982 5,770,378 1,109,827 384,202 1,081,575 1,012,645 Less than high school diploma
13.8% 8.6% 18.5% 9.0% 38.5% 40.5%
HS graduate (incl equivalency)
27.9% 28.7% 28.7% 11.6% 28.4% 28.8%
Some college or associate deg
28.1% 29.2% 34.3% 16.8% 19.9% 18.9%
Bachelor's degree or higher
30.3% 33.6% 18.5% 62.6% 13.2% 11.8%
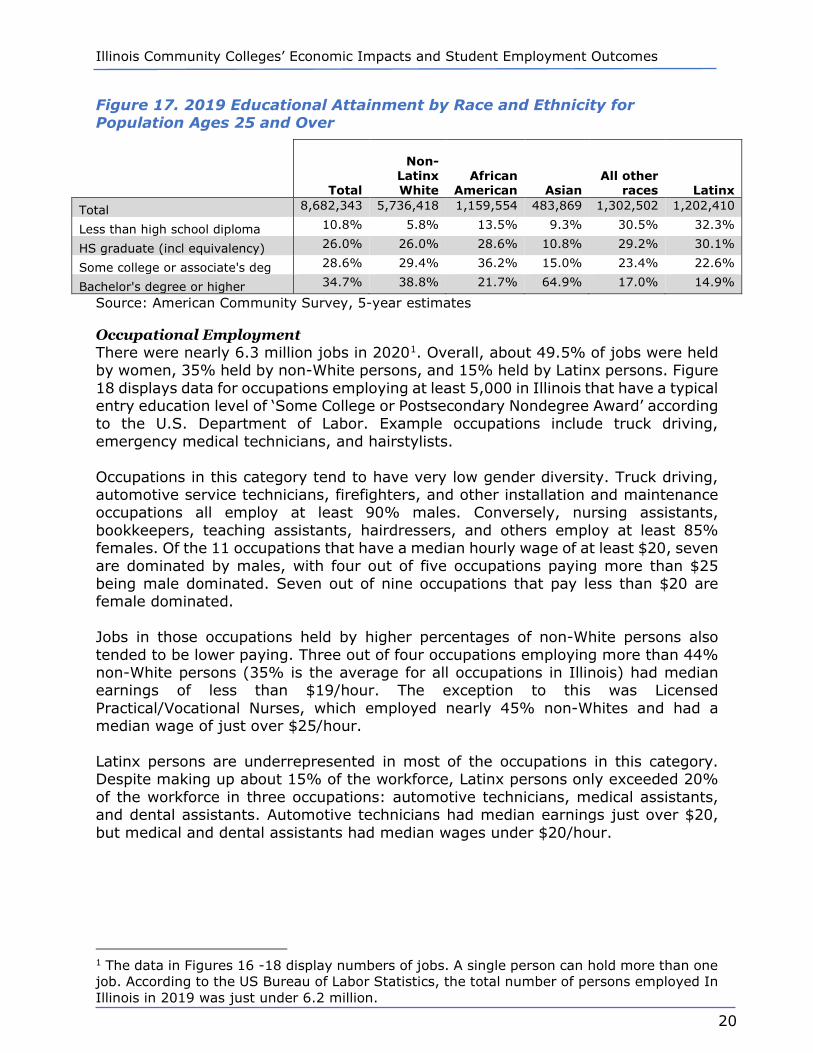
Source: American Community Survey, 5-year estimates While all racial and ethnic groups had improved their attainment rates by 2019, their relative rates remained similar (Figure 17). For all Illinoisans over 25 years old, the percentage at least completing high school improved by over 2 percentage points and the percentage of those obtaining a bachelor’s degree or higher improved by about 4 percentage points. More than 63% had furthered their education beyond high school. Despite increasing attainment rates, African American persons still lagged non-Latinx Whites and Asians in 2019. About 86% of African American persons had at least completed high school, compared with 94% of non-Latinx White persons. Of those that completed high school, non-Latinx Whites were more likely to further their education, and significantly more likely to complete a bachelor’s degree or higher.
Illinois Community Colleges’ Economic Impacts and Student Employment Outcomes
20
Figure 17. 2019 Educational Attainment by Race and Ethnicity for Population Ages 25 and Over
Total
Non-Latinx White
African American Asian
All other races Latinx
Total 8,682,343 5,736,418 1,159,554 483,869 1,302,502 1,202,410
Less than high school diploma 10.8% 5.8% 13.5% 9.3% 30.5% 32.3%
HS graduate (incl equivalency) 26.0% 26.0% 28.6% 10.8% 29.2% 30.1%
Some college or associate's deg 28.6% 29.4% 36.2% 15.0% 23.4% 22.6%
Bachelor's degree or higher 34.7% 38.8% 21.7% 64.9% 17.0% 14.9%
Source: American Community Survey, 5-year estimates
Occupational Employment There were nearly 6.3 million jobs in 20201. Overall, about 49.5% of jobs were held by women, 35% held by non-White persons, and 15% held by Latinx persons. Figure 18 displays data for occupations employing at least 5,000 in Illinois that have a typical entry education level of ‘Some College or Postsecondary Nondegree Award’ according to the U.S. Department of Labor. Example occupations include truck driving, emergency medical technicians, and hairstylists. Occupations in this category tend to have very low gender diversity. Truck driving, automotive service technicians, firefighters, and other installation and maintenance occupations all employ at least 90% males. Conversely, nursing assistants, bookkeepers, teaching assistants, hairdressers, and others employ at least 85% females. Of the 11 occupations that have a median hourly wage of at least $20, seven are dominated by males, with four out of five occupations paying more than $25 being male dominated. Seven out of nine occupations that pay less than $20 are female dominated. Jobs in those occupations held by higher percentages of non-White persons also tended to be lower paying. Three out of four occupations employing more than 44% non-White persons (35% is the average for all occupations in Illinois) had median earnings of less than $19/hour. The exception to this was Licensed Practical/Vocational Nurses, which employed nearly 45% non-Whites and had a median wage of just over $25/hour. Latinx persons are underrepresented in most of the occupations in this category. Despite making up about 15% of the workforce, Latinx persons only exceeded 20% of the workforce in three occupations: automotive technicians, medical assistants, and dental assistants. Automotive technicians had median earnings just over $20, but medical and dental assistants had median wages under $20/hour.
1 The data in Figures 16 -18 display numbers of jobs. A single person can hold more than one job. According to the US Bureau of Labor Statistics, the total number of persons employed In Illinois in 2019 was just under 6.2 million.

Illinois Community Colleges’ Economic Impacts and Student Employment Outcomes
21
Figure 18. Employment for Occupations Often Require a Certificate and/or License
SOC Description 2020 Jobs
Avg. Annual
Openings Pct
Female
Pct Non-
White Pct
Latinx
Median Hourly
Earnings
Total All Occupations
6,280,088 661,141 49.5% 35.3% 15.0%
53-3032 Heavy Truck Drivers 80,642 8,920 5.8% 32.2% 16.2% $23.94
43-3031 Bookkeeping, Accounting, and Auditing Clerks
64,840 6,646 87.9% 23.3% 9.9% $20.89
25-9045 Teaching Assistants, Except Postsecondary
59,901 6,030 91.0% 32.2% 14.5% $13.70
31-1131 Nursing Assistants 59,070 6,448 88.5% 56.7% 11.1% $14.49 49-3023 Automotive Service
Technicians and Mechanics
29,942 2,691 1.5% 31.2% 21.6% $20.66
39-5012 Hairdressers, Hairstylists, and Cosmetologists
23,953 2,494 92.2% 26.8% 12.8% $12.92
31-9092 Medical Assistants 22,900 2,767 92.4% 44.5% 23.8% $17.58 15-1232 Computer Support
Specialists 21,801 1,662 27.2% 34.0% 9.4% $24.66
29-2061 Licensed Practical and Licensed Vocational Nurses
20,844 1,674 90.9% 45.0% 8.5% $25.74
33-2011 Firefighters 14,338 903 5.3% 22.9% 8.2% $27.68 29-2041 Emergency Medical
Technicians and Paramedics
12,666 851 41.8% 24.9% 11.0% $16.86
31-9091 Dental Assistants 12,245 1,266 94.2% 37.7% 25.9% $19.24 29-2098 Medical
Dosimetrists, Medical Records Specialists, and Health Technicians, All Other
10,944 850 85.4% 38.6% 11.8% $22.37
49-9021 Heating, AC, and Refrigeration Mechanics and Installers
10,003 893 1.3% 20.2% 12.5% $26.18
49-2022 Telecommunications Equipment Installers and Repairers
8,911 838 10.8% 31.8% 12.2% $34.64
25-4031 Library Technicians 6,625 896 78.1% 27.5% 8.2% $15.26 49-3011 Aircraft Mechanics
and Service Technicians
6,217 552 5.5% 35.6% 16.9% $33.72
Source: EMSI, 2020. Figure 19 displays employment for occupations that typically require an associate degree. Diversity is generally more balanced for these occupations relative to the

Illinois Community Colleges’ Economic Impacts and Student Employment Outcomes
22
lower skilled occupations in Figure 18. However, significant challenges remain in some occupations to increase diversity. Of the seven occupations in this category that have median hourly earnings below $25, five are dominated by women and one has about two-thirds males, and the other is balanced at about 50% female. Nine occupations in this category have median earnings greater than $30. Five of those are male dominated and four female. Only one occupation in this category employs greater than 40% non-Whites. This occupation, human resources assistant, is among the lowest paying in this category. Non-White persons make up less than 25% of employment in four occupations, all but one of which have median earnings of greater than $29. Latinx persons are underrepresented in nearly every occupation in this category. This reflects the fact that Latinx persons trail the rest of the population in educational attainment. Figure 19. Occupational Employment, Associate Degree Typical Entry Level Education
SOC Description 2020 Jobs
Avg. Annual
Openings Pct
Female
Pct Non-
White Pct
Latinx
Median Hourly
Earnings Total All Occupations 6,280,088 661,141 49.5% 35.3% 15.0%
25-2011 Preschool Teachers, Except Special Education
24,140 2,364 97.2% 38.7% 15.2% $14.82
23-2011 Paralegals and Legal Assistants
13,912 1,474 83.5% 29.1% 15.4% $27.50
15-1231 Computer Network Support Specialists
13,178 903 27.3% 35.1% 9.9% $30.05
29-2034 Radiologic Technicians 8,639 456 73.7% 27.9% 10.8% $29.99 29-1292 Dental Hygienists 7,507 466 95.7% 19.1% 11.1% $35.89 15-1257 Web Developers and
Digital Interface Designers
6,714 515 33.1% 28.1% 7.8% $34.80
29-1126 Respiratory Therapists 4,398 263 66.9% 33.4% 9.3% $28.92 17-3098 Calibration and
Engineering Technicians
4,320 371 19.7% 30.3% 11.8% $32.65
29-2056 Veterinary Technicians
3,950 379 75.7% 22.5% 9.5% $17.86
43-4161 Human Resources Assistants
3,913 387 83.4% 44.1% 16.4% $21.03
31-2021 Physical Therapist Assistants
3,895 559 73.4% 24.2% 8.0% $29.39
19-4031 Chemical Technicians 3,376 306 35.3% 32.4% 11.0% $24.37 17-3023 Electrical and
Electronic Engineering Technicians
3,317 294 16.7% 32.2% 12.8% $32.32
17-3011 Architectural and Civil Drafters
3,192 273 21.4% 22.9% 11.2% $29.87
29-2032 Diagnostic Medical Sonographers
3,081 192 75.2% 28.1% 10.7% $37.87

Illinois Community Colleges’ Economic Impacts and Student Employment Outcomes
23
SOC Description 2020 Jobs
Avg. Annual
Openings Pct
Female
Pct Non-
White Pct
Latinx
Median Hourly
Earnings 17-3022 Civil Engineering
Technicians 2,805 240 20.9% 28.0% 10.5% $30.33
29-2031 Cardiovascular Technicians
2,768 143 72.3% 30.2% 10.8% $23.41
19-4099 Life, Physical, and Social Science Technicians, All Other
2,461 282 50.3% 34.3% 9.7% $23.49
31-2011 Occupational Therapy Assistants
2,354 312 85.5% 25.9% 6.3% $30.74
29-2035 Magnetic Resonance Imaging Technologists
2,352 125 71.5% 27.0% 9.6% $35.87
29-2051 Dietetic Technicians 2,093 158 80.5% 38.8% 9.1% $12.73 49-9062 Medical Equipment
Repairers 2,036 211 11.1% 28.3% 12.7% $25.23
Source: EMSI, 2020. Information about occupations employing more than 15,000 in Illinois that typically require a bachelor’s degree for entry are displayed in Figure 20. It should be noted that while U.S. Department of Labor identifies a bachelor’s degree as the ‘typical’ entry level education required, there are pathways to occupations on this list that do not require a bachelor’s degree. For example, it is possible to become a registered nurse without earning a bachelor’s degree. Figure 20. Occupational Employment, Bachelor's Degree Typical Entry Level Education
SOC Description 2020 Jobs
Avg. Annual
Openings Pct
Female
Pct Non-
White Pct
Latinx
Median Hourly
Earnings Totals 6,280,088 661,141 49.5% 35.3% 15.0%
29-1141 Registered Nurses 130,444 6,829 90.8% 32.8% 6.7% $34.90 11-1021 General and
Operations Managers 126,074 9,625 31.2% 21.9% 9.8% $49.40
13-1198 Project Management and Business Operations Specialists
57,529 5,223 58.2% 34.1% 10.7% $40.00
15-1256 Software Developers and Quality Assurance Analysts
57,055 4,652 20.0% 47.4% 4.5% $50.74
25-2021 Elementary School Teachers
56,709 4,031 81.2% 17.8% 7.0% $30.13
13-2011 Accountants and Auditors
55,071 4,764 56.5% 28.5% 7.6% $34.48
11-3031 Financial Managers 43,278 3,275 53.0% 26.3% 10.2% $63.40 13-1111 Management
Analysts 42,639 4,087 43.9% 29.0% 6.5% $43.70
25-2031 Secondary School Teachers
41,982 2,853 61.9% 17.3% 6.9% $33.93

Illinois Community Colleges’ Economic Impacts and Student Employment Outcomes
24
SOC Description 2020 Jobs
Avg. Annual
Openings Pct
Female
Pct Non-
White Pct
Latinx
Median Hourly
Earnings 13-1161 Market Research
Analysts and Marketing Specialists
36,749 3,929 59.4% 27.2% 8.9% $30.66
11-9198 Personal Service, Entertainment and Recreation Managers
36,028 2,442 34.1% 26.0% 11.0% $43.31
15-1211 Computer Systems Analysts
31,388 2,107 36.2% 36.8% 6.5% $44.35
13-1071 Human Resources Specialists
30,703 2,891 72.2% 35.2% 12.5% $29.58
41-3031 Securities, Commodities, and Financial Services Sales Agents
24,027 2,030 29.2% 23.3% 9.6% $32.35
13-2098 Fin’l and Investment Analysts
23,066 1,748 41.8% 33.1% 8.4% $41.06
11-2021 Marketing Managers 22,423 1,765 48.6% 22.3% 9.0% $60.71 25-2022 Middle School
Teachers 21,593 1,542 81.3% 17.6% 6.8% $29.67
25-3031 Substitute Teachers, Short-Term
21,560 2,363 72.6% 30.9% 12.8% $14.57
21-1021 Child, Family, and School Social Workers
15,799 1,568 84.1% 48.0% 11.3% $26.18
29-2018 Clinical Laboratory Technicians
15,142 931 75.2% 43.7% 10.5% $24.90
Source: EMSI, 2020. As with the lower skilled occupations, those with higher pay tend to be male dominated. Of the seven occupations with median wages above $45/hour, three employ 65% or more males. None of those higher paying occupations are majority females. Only one of the occupations in this category have higher percentages of non-White persons than the average of all occupations (35%). This occupation, Software Developers, is among the highest paying occupation in the category. However, African Americans make up less than 4% of incumbents in this occupation, compared to about 13% in all occupations. Asians comprise 38% of workers in this occupation. The occupation with the highest percentage of Latinx persons in this category is substitute teachers. This occupation has by far the lowest median earnings in this category.
CORONAVIRUS PANDEMIC In early 2020 the Coronavirus pandemic disrupted the social and economic structures of communities worldwide. Government regulations such as stay-at-home orders and restrictions on business operations changed the way many businesses could operate. In addition, individuals changed their spending habits to avoid contracting the virus. The impact on employment was rapid and severe, with many businesses laying off
Illinois Community Colleges’ Economic Impacts and Student Employment Outcomes
25
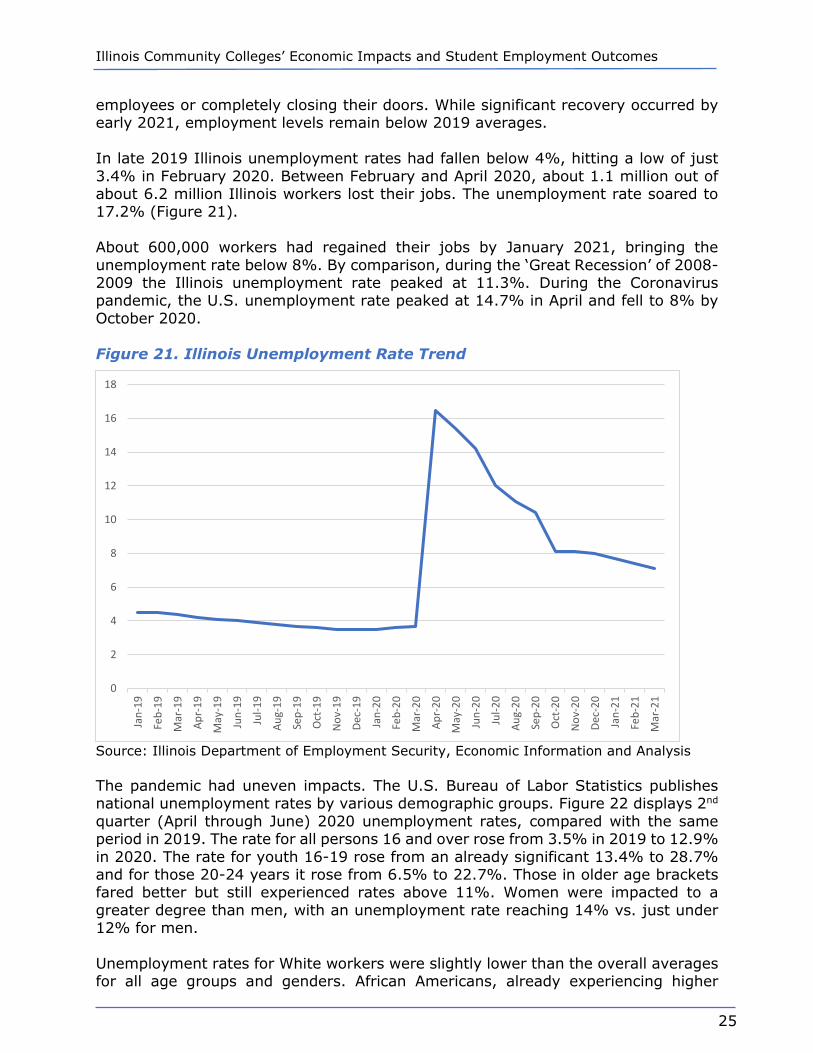
employees or completely closing their doors. While significant recovery occurred by early 2021, employment levels remain below 2019 averages. In late 2019 Illinois unemployment rates had fallen below 4%, hitting a low of just 3.4% in February 2020. Between February and April 2020, about 1.1 million out of about 6.2 million Illinois workers lost their jobs. The unemployment rate soared to 17.2% (Figure 21). About 600,000 workers had regained their jobs by January 2021, bringing the unemployment rate below 8%. By comparison, during the ‘Great Recession’ of 2008-2009 the Illinois unemployment rate peaked at 11.3%. During the Coronavirus pandemic, the U.S. unemployment rate peaked at 14.7% in April and fell to 8% by October 2020. Figure 21. Illinois Unemployment Rate Trend
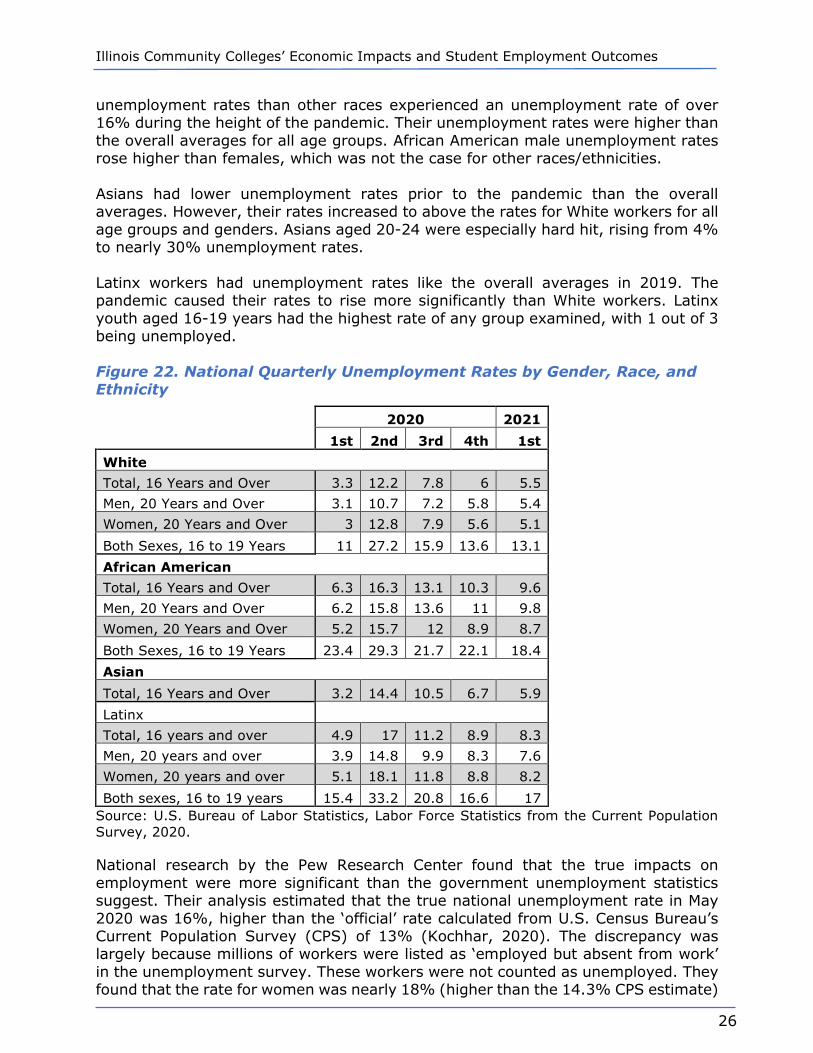
Source: Illinois Department of Employment Security, Economic Information and Analysis The pandemic had uneven impacts. The U.S. Bureau of Labor Statistics publishes national unemployment rates by various demographic groups. Figure 22 displays 2nd quarter (April through June) 2020 unemployment rates, compared with the same period in 2019. The rate for all persons 16 and over rose from 3.5% in 2019 to 12.9% in 2020. The rate for youth 16-19 rose from an already significant 13.4% to 28.7% and for those 20-24 years it rose from 6.5% to 22.7%. Those in older age brackets fared better but still experienced rates above 11%. Women were impacted to a greater degree than men, with an unemployment rate reaching 14% vs. just under 12% for men. Unemployment rates for White workers were slightly lower than the overall averages for all age groups and genders. African Americans, already experiencing higher
0
2
4
6
8
10
12
14
16
18
Jan-
19
Feb-
19
Mar
-19
Apr-
19
May
-19
Jun-
19
Jul-1
9
Aug-
19
Sep-
19
Oct
-19
Nov
-19
Dec-
19
Jan-
20
Feb-
20
Mar
-20
Apr-
20
May
-20
Jun-
20
Jul-2
0
Aug-
20
Sep-
20
Oct
-20
Nov
-20
Dec-
20
Jan-
21
Feb-
21
Mar
-21
Illinois Community Colleges’ Economic Impacts and Student Employment Outcomes
26
unemployment rates than other races experienced an unemployment rate of over 16% during the height of the pandemic. Their unemployment rates were higher than the overall averages for all age groups. African American male unemployment rates rose higher than females, which was not the case for other races/ethnicities. Asians had lower unemployment rates prior to the pandemic than the overall averages. However, their rates increased to above the rates for White workers for all age groups and genders. Asians aged 20-24 were especially hard hit, rising from 4% to nearly 30% unemployment rates. Latinx workers had unemployment rates like the overall averages in 2019. The pandemic caused their rates to rise more significantly than White workers. Latinx youth aged 16-19 years had the highest rate of any group examined, with 1 out of 3 being unemployed. Figure 22. National Quarterly Unemployment Rates by Gender, Race, and Ethnicity
2020 2021
1st 2nd 3rd 4th 1st White Total, 16 Years and Over 3.3 12.2 7.8 6 5.5 Men, 20 Years and Over 3.1 10.7 7.2 5.8 5.4 Women, 20 Years and Over 3 12.8 7.9 5.6 5.1 Both Sexes, 16 to 19 Years 11 27.2 15.9 13.6 13.1 African American Total, 16 Years and Over 6.3 16.3 13.1 10.3 9.6 Men, 20 Years and Over 6.2 15.8 13.6 11 9.8 Women, 20 Years and Over 5.2 15.7 12 8.9 8.7 Both Sexes, 16 to 19 Years 23.4 29.3 21.7 22.1 18.4 Asian Total, 16 Years and Over 3.2 14.4 10.5 6.7 5.9 Latinx Total, 16 years and over 4.9 17 11.2 8.9 8.3 Men, 20 years and over 3.9 14.8 9.9 8.3 7.6 Women, 20 years and over 5.1 18.1 11.8 8.8 8.2 Both sexes, 16 to 19 years 15.4 33.2 20.8 16.6 17
Source: U.S. Bureau of Labor Statistics, Labor Force Statistics from the Current Population Survey, 2020. National research by the Pew Research Center found that the true impacts on employment were more significant than the government unemployment statistics suggest. Their analysis estimated that the true national unemployment rate in May 2020 was 16%, higher than the ‘official’ rate calculated from U.S. Census Bureau’s Current Population Survey (CPS) of 13% (Kochhar, 2020). The discrepancy was largely because millions of workers were listed as ‘employed but absent from work’ in the unemployment survey. These workers were not counted as unemployed. They found that the rate for women was nearly 18% (higher than the 14.3% CPS estimate)
Illinois Community Colleges’ Economic Impacts and Student Employment Outcomes
27
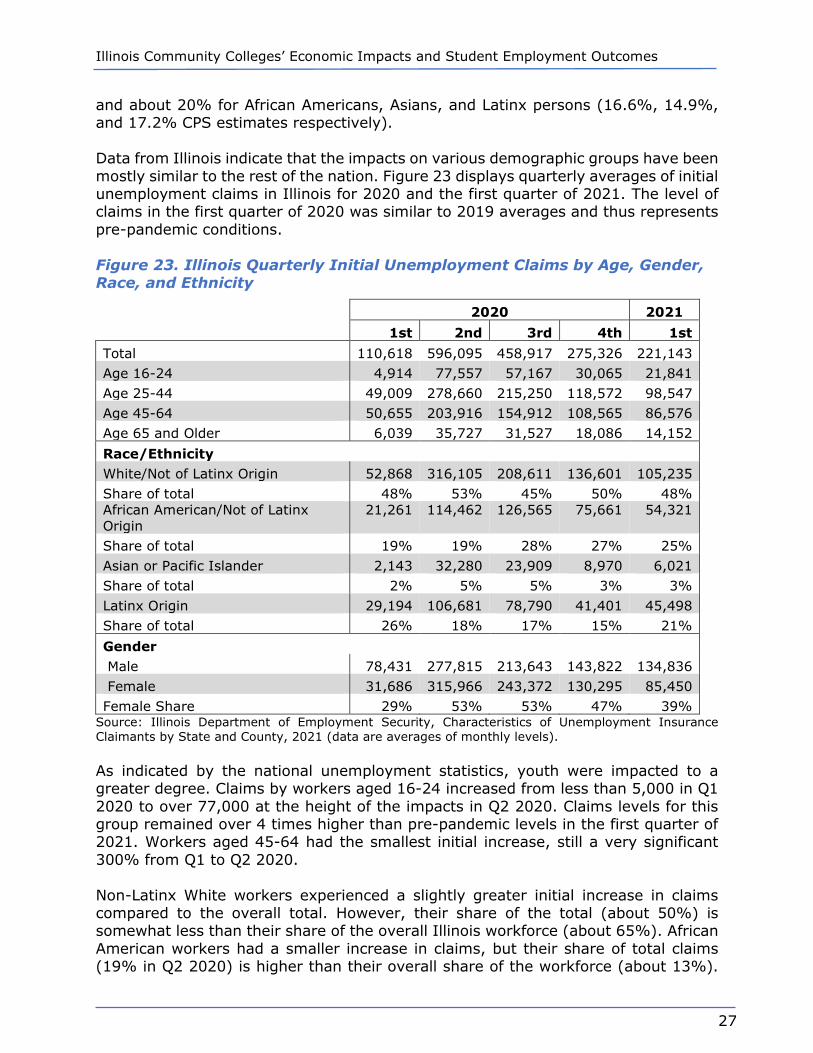
and about 20% for African Americans, Asians, and Latinx persons (16.6%, 14.9%, and 17.2% CPS estimates respectively). Data from Illinois indicate that the impacts on various demographic groups have been mostly similar to the rest of the nation. Figure 23 displays quarterly averages of initial unemployment claims in Illinois for 2020 and the first quarter of 2021. The level of claims in the first quarter of 2020 was similar to 2019 averages and thus represents pre-pandemic conditions. Figure 23. Illinois Quarterly Initial Unemployment Claims by Age, Gender, Race, and Ethnicity
2020 2021
1st 2nd 3rd 4th 1st Total 110,618 596,095 458,917 275,326 221,143 Age 16-24 4,914 77,557 57,167 30,065 21,841 Age 25-44 49,009 278,660 215,250 118,572 98,547 Age 45-64 50,655 203,916 154,912 108,565 86,576 Age 65 and Older 6,039 35,727 31,527 18,086 14,152 Race/Ethnicity White/Not of Latinx Origin 52,868 316,105 208,611 136,601 105,235 Share of total 48% 53% 45% 50% 48% African American/Not of Latinx Origin
21,261 114,462 126,565 75,661 54,321
Share of total 19% 19% 28% 27% 25% Asian or Pacific Islander 2,143 32,280 23,909 8,970 6,021 Share of total 2% 5% 5% 3% 3% Latinx Origin 29,194 106,681 78,790 41,401 45,498 Share of total 26% 18% 17% 15% 21% Gender Male 78,431 277,815 213,643 143,822 134,836 Female 31,686 315,966 243,372 130,295 85,450 Female Share 29% 53% 53% 47% 39%
Source: Illinois Department of Employment Security, Characteristics of Unemployment Insurance Claimants by State and County, 2021 (data are averages of monthly levels). As indicated by the national unemployment statistics, youth were impacted to a greater degree. Claims by workers aged 16-24 increased from less than 5,000 in Q1 2020 to over 77,000 at the height of the impacts in Q2 2020. Claims levels for this group remained over 4 times higher than pre-pandemic levels in the first quarter of 2021. Workers aged 45-64 had the smallest initial increase, still a very significant 300% from Q1 to Q2 2020. Non-Latinx White workers experienced a slightly greater initial increase in claims compared to the overall total. However, their share of the total (about 50%) is somewhat less than their share of the overall Illinois workforce (about 65%). African American workers had a smaller increase in claims, but their share of total claims (19% in Q2 2020) is higher than their overall share of the workforce (about 13%).
Illinois Community Colleges’ Economic Impacts and Student Employment Outcomes
28
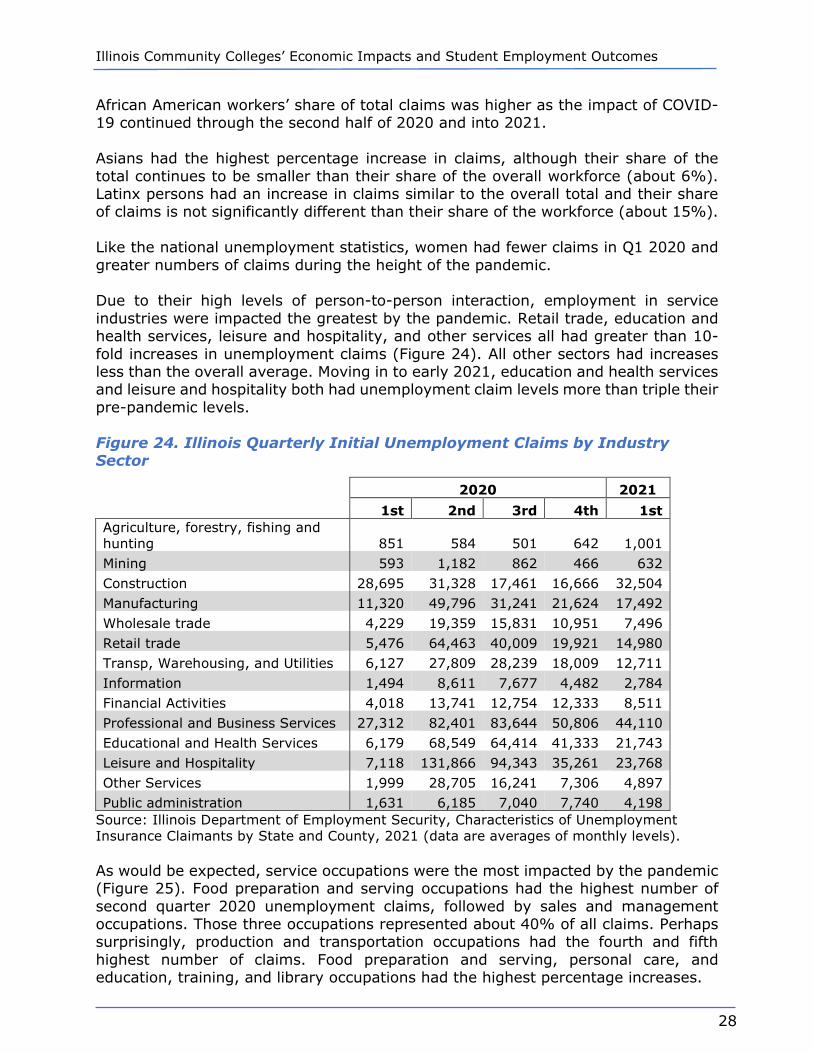
African American workers’ share of total claims was higher as the impact of COVID-19 continued through the second half of 2020 and into 2021. Asians had the highest percentage increase in claims, although their share of the total continues to be smaller than their share of the overall workforce (about 6%). Latinx persons had an increase in claims similar to the overall total and their share of claims is not significantly different than their share of the workforce (about 15%). Like the national unemployment statistics, women had fewer claims in Q1 2020 and greater numbers of claims during the height of the pandemic. Due to their high levels of person-to-person interaction, employment in service industries were impacted the greatest by the pandemic. Retail trade, education and health services, leisure and hospitality, and other services all had greater than 10-fold increases in unemployment claims (Figure 24). All other sectors had increases less than the overall average. Moving in to early 2021, education and health services and leisure and hospitality both had unemployment claim levels more than triple their pre-pandemic levels. Figure 24. Illinois Quarterly Initial Unemployment Claims by Industry Sector
2020 2021
1st 2nd 3rd 4th 1st Agriculture, forestry, fishing and hunting 851 584 501 642 1,001 Mining 593 1,182 862 466 632 Construction 28,695 31,328 17,461 16,666 32,504 Manufacturing 11,320 49,796 31,241 21,624 17,492 Wholesale trade 4,229 19,359 15,831 10,951 7,496 Retail trade 5,476 64,463 40,009 19,921 14,980 Transp, Warehousing, and Utilities 6,127 27,809 28,239 18,009 12,711 Information 1,494 8,611 7,677 4,482 2,784 Financial Activities 4,018 13,741 12,754 12,333 8,511 Professional and Business Services 27,312 82,401 83,644 50,806 44,110 Educational and Health Services 6,179 68,549 64,414 41,333 21,743 Leisure and Hospitality 7,118 131,866 94,343 35,261 23,768 Other Services 1,999 28,705 16,241 7,306 4,897 Public administration 1,631 6,185 7,040 7,740 4,198
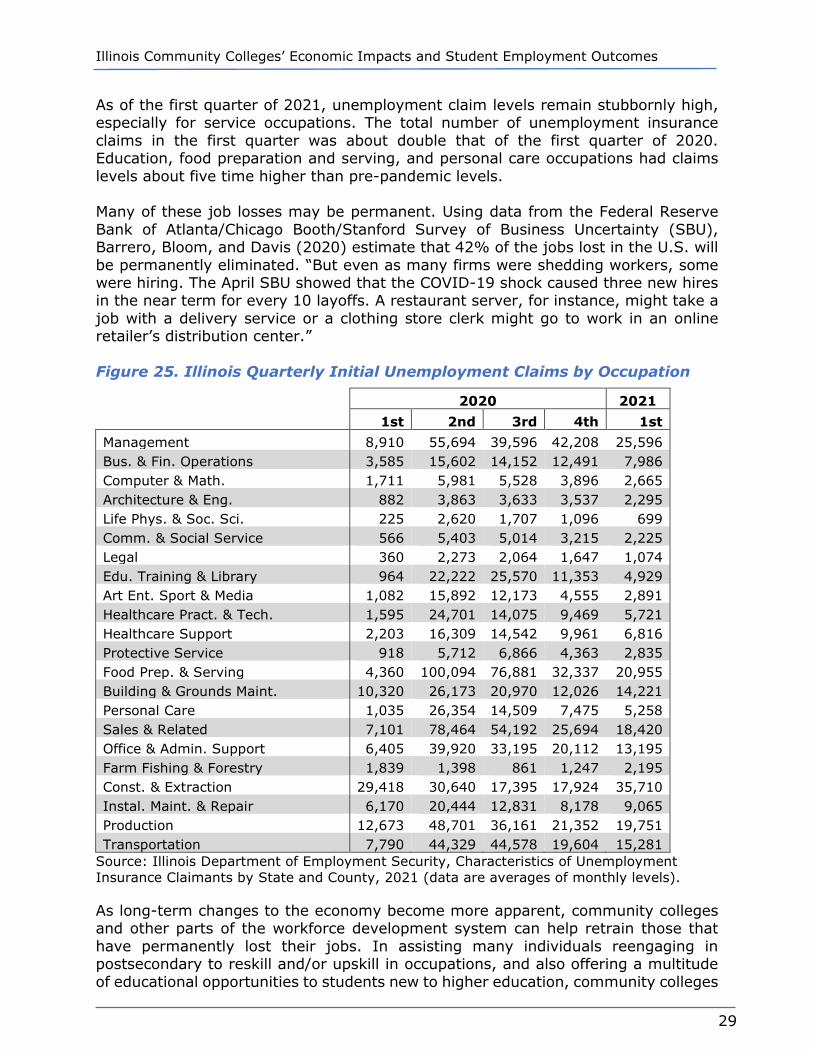
Source: Illinois Department of Employment Security, Characteristics of Unemployment Insurance Claimants by State and County, 2021 (data are averages of monthly levels). As would be expected, service occupations were the most impacted by the pandemic (Figure 25). Food preparation and serving occupations had the highest number of second quarter 2020 unemployment claims, followed by sales and management occupations. Those three occupations represented about 40% of all claims. Perhaps surprisingly, production and transportation occupations had the fourth and fifth highest number of claims. Food preparation and serving, personal care, and education, training, and library occupations had the highest percentage increases.
Illinois Community Colleges’ Economic Impacts and Student Employment Outcomes
29
As of the first quarter of 2021, unemployment claim levels remain stubbornly high, especially for service occupations. The total number of unemployment insurance claims in the first quarter was about double that of the first quarter of 2020. Education, food preparation and serving, and personal care occupations had claims levels about five time higher than pre-pandemic levels. Many of these job losses may be permanent. Using data from the Federal Reserve Bank of Atlanta/Chicago Booth/Stanford Survey of Business Uncertainty (SBU), Barrero, Bloom, and Davis (2020) estimate that 42% of the jobs lost in the U.S. will be permanently eliminated. “But even as many firms were shedding workers, some were hiring. The April SBU showed that the COVID-19 shock caused three new hires in the near term for every 10 layoffs. A restaurant server, for instance, might take a job with a delivery service or a clothing store clerk might go to work in an online retailer’s distribution center.” Figure 25. Illinois Quarterly Initial Unemployment Claims by Occupation
2020 2021
1st 2nd 3rd 4th 1st Management 8,910 55,694 39,596 42,208 25,596 Bus. & Fin. Operations 3,585 15,602 14,152 12,491 7,986 Computer & Math. 1,711 5,981 5,528 3,896 2,665 Architecture & Eng. 882 3,863 3,633 3,537 2,295 Life Phys. & Soc. Sci. 225 2,620 1,707 1,096 699 Comm. & Social Service 566 5,403 5,014 3,215 2,225 Legal 360 2,273 2,064 1,647 1,074 Edu. Training & Library 964 22,222 25,570 11,353 4,929 Art Ent. Sport & Media 1,082 15,892 12,173 4,555 2,891 Healthcare Pract. & Tech. 1,595 24,701 14,075 9,469 5,721 Healthcare Support 2,203 16,309 14,542 9,961 6,816 Protective Service 918 5,712 6,866 4,363 2,835 Food Prep. & Serving 4,360 100,094 76,881 32,337 20,955 Building & Grounds Maint. 10,320 26,173 20,970 12,026 14,221 Personal Care 1,035 26,354 14,509 7,475 5,258 Sales & Related 7,101 78,464 54,192 25,694 18,420 Office & Admin. Support 6,405 39,920 33,195 20,112 13,195 Farm Fishing & Forestry 1,839 1,398 861 1,247 2,195 Const. & Extraction 29,418 30,640 17,395 17,924 35,710 Instal. Maint. & Repair 6,170 20,444 12,831 8,178 9,065 Production 12,673 48,701 36,161 21,352 19,751 Transportation 7,790 44,329 44,578 19,604 15,281
Source: Illinois Department of Employment Security, Characteristics of Unemployment Insurance Claimants by State and County, 2021 (data are averages of monthly levels). As long-term changes to the economy become more apparent, community colleges and other parts of the workforce development system can help retrain those that have permanently lost their jobs. In assisting many individuals reengaging in postsecondary to reskill and/or upskill in occupations, and also offering a multitude of educational opportunities to students new to higher education, community colleges
Illinois Community Colleges’ Economic Impacts and Student Employment Outcomes
30
provide pathways to increased employment and earnings. In the next section, Illinois community college students completing certificates and degrees and the significant economic impact are examined both in longer term credentials (long-term certificate, Associate in Applied Science, and Associate Degree) and short-term certificates (less than 30 credit hours). With a substantial portion of African American and Latinx students being served in the community college sector, investing in a community college both for students and the State is integral in making a recovery from the pandemic an equitable one. The economic returns for community college students in filling gaps for larger and emerging occupations and industries, as well as meeting the population demographic shifts described in the above section are examined below.
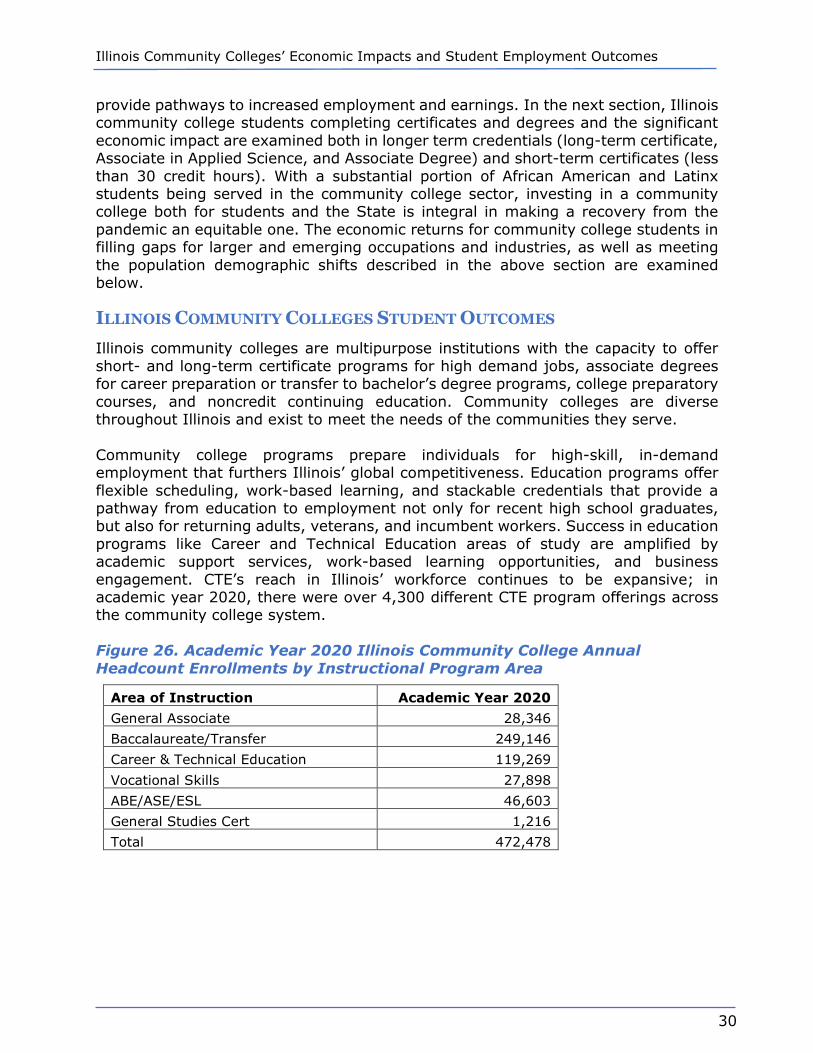
ILLINOIS COMMUNITY COLLEGES STUDENT OUTCOMES Illinois community colleges are multipurpose institutions with the capacity to offer short- and long-term certificate programs for high demand jobs, associate degrees for career preparation or transfer to bachelor’s degree programs, college preparatory courses, and noncredit continuing education. Community colleges are diverse throughout Illinois and exist to meet the needs of the communities they serve. Community college programs prepare individuals for high-skill, in-demand employment that furthers Illinois’ global competitiveness. Education programs offer flexible scheduling, work-based learning, and stackable credentials that provide a pathway from education to employment not only for recent high school graduates, but also for returning adults, veterans, and incumbent workers. Success in education programs like Career and Technical Education areas of study are amplified by academic support services, work-based learning opportunities, and business engagement. CTE’s reach in Illinois’ workforce continues to be expansive; in academic year 2020, there were over 4,300 different CTE program offerings across the community college system. Figure 26. Academic Year 2020 Illinois Community College Annual Headcount Enrollments by Instructional Program Area
Area of Instruction Academic Year 2020 General Associate 28,346 Baccalaureate/Transfer 249,146 Career & Technical Education 119,269 Vocational Skills 27,898 ABE/ASE/ESL 46,603 General Studies Cert 1,216 Total 472,478
Illinois Community Colleges’ Economic Impacts and Student Employment Outcomes
31
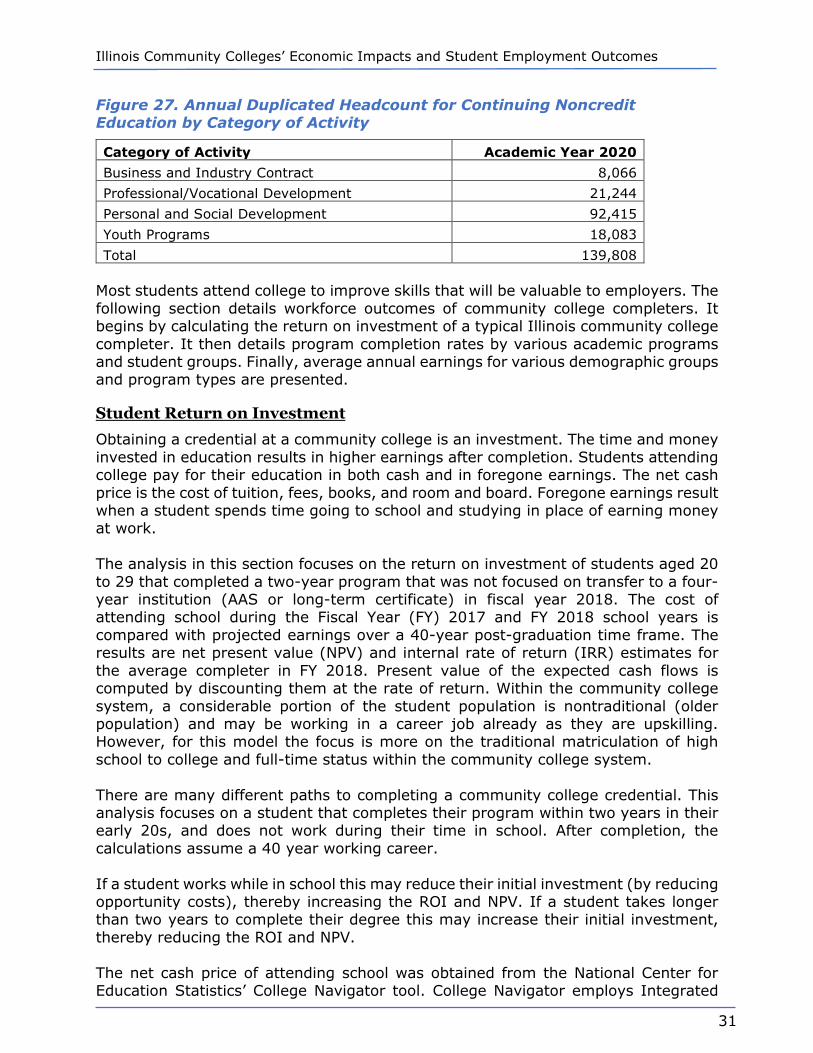
Figure 27. Annual Duplicated Headcount for Continuing Noncredit Education by Category of Activity
Category of Activity Academic Year 2020 Business and Industry Contract 8,066 Professional/Vocational Development 21,244 Personal and Social Development 92,415 Youth Programs 18,083 Total 139,808
Most students attend college to improve skills that will be valuable to employers. The following section details workforce outcomes of community college completers. It begins by calculating the return on investment of a typical Illinois community college completer. It then details program completion rates by various academic programs and student groups. Finally, average annual earnings for various demographic groups and program types are presented.
Student Return on Investment
Obtaining a credential at a community college is an investment. The time and money invested in education results in higher earnings after completion. Students attending college pay for their education in both cash and in foregone earnings. The net cash price is the cost of tuition, fees, books, and room and board. Foregone earnings result when a student spends time going to school and studying in place of earning money at work. The analysis in this section focuses on the return on investment of students aged 20 to 29 that completed a two-year program that was not focused on transfer to a four-year institution (AAS or long-term certificate) in fiscal year 2018. The cost of attending school during the Fiscal Year (FY) 2017 and FY 2018 school years is compared with projected earnings over a 40-year post-graduation time frame. The results are net present value (NPV) and internal rate of return (IRR) estimates for the average completer in FY 2018. Present value of the expected cash flows is computed by discounting them at the rate of return. Within the community college system, a considerable portion of the student population is nontraditional (older population) and may be working in a career job already as they are upskilling. However, for this model the focus is more on the traditional matriculation of high school to college and full-time status within the community college system. There are many different paths to completing a community college credential. This analysis focuses on a student that completes their program within two years in their early 20s, and does not work during their time in school. After completion, the calculations assume a 40 year working career. If a student works while in school this may reduce their initial investment (by reducing opportunity costs), thereby increasing the ROI and NPV. If a student takes longer than two years to complete their degree this may increase their initial investment, thereby reducing the ROI and NPV. The net cash price of attending school was obtained from the National Center for Education Statistics’ College Navigator tool. College Navigator employs Integrated

Illinois Community Colleges’ Economic Impacts and Student Employment Outcomes
32
Postsecondary Education Data System (IPEDS) data from the National Center for Education Statistics to calculate the average net price2 for annual attendance at each school. The statewide figure is the average (weighted by student enrollment counts) of individual Illinois community colleges. The other major cost for college attendees is their foregone earnings, often referred to as the ‘opportunity cost’ of attending college. The estimate for foregone earnings is based on average high school graduate earnings levels. In Illinois, average earnings for a 20-year old high school graduate is $9,7513, increasing to $10,919 for a 21-year old. These values are used as the estimates for the opportunity costs of attending a community college in the ROI calculations. The major benefit of completing college is the resulting increased earnings. Earnings data for ICCS students in a 2014 study showed that earnings gains for statewide completers totaled about 31% of post-completion earnings. This is very similar to the earnings difference between associate degree holders and high school graduates for persons in their early 20s. Thus, first year earnings gains are estimated as 31% of post-completion earnings of $31,260, or $9,691. Other studies4, as well as Census data on earnings by age, indicate that earnings gains from educational attainment grow significantly in the first decade of a worker’s career, and subsequently flatten. Based on these data, earnings gains from credential attainment are assumed to grow by 7% per year in the 10 years following completion then remain stable. Figure 28 presents the net return analysis based on the calculations noted above. The total cost during the two years the student is in school, including out of pocket expenses and foregone earnings is $31,883. The return on investment occurs over a 40-year working life, where increased earnings for a degree completer are estimated to total nearly $600,000 (compared to someone not attending community college).
2 “Average net price is generated by subtracting the average amount of federal, state/local government, or institutional grant or scholarship aid from the total cost of attendance. Total cost of attendance is the sum of published tuition and required fees (lower of in-district or in-state), books and supplies, and the weighted average for room and board and other expenses.” (Source: National Center for College Statistics, COLLEGENavigator. https://nces.ed.gov/collegenavigator/ ) 3 Source: U.S. Census Bureau, 2014-2018 American Community Survey. 4 See for example Ranking ROI Of 4,500 US Colleges And Universities from the Georgetown Center on Education and the Workforce.
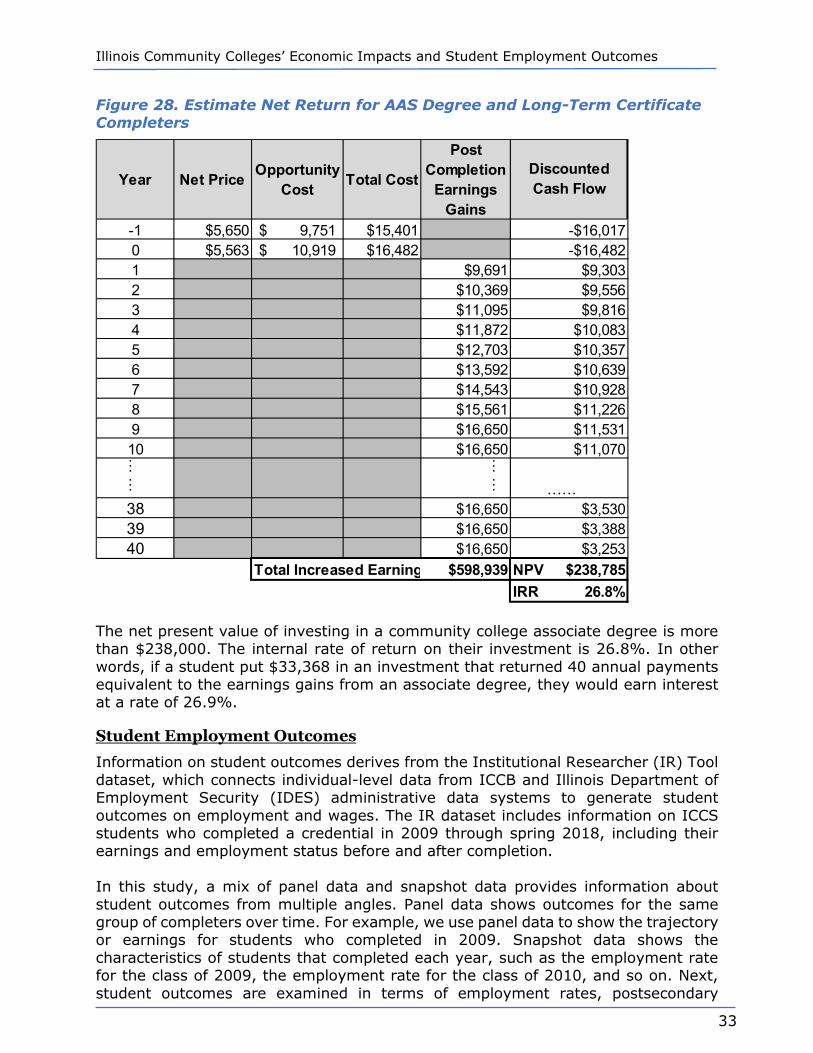
Illinois Community Colleges’ Economic Impacts and Student Employment Outcomes
33
Figure 28. Estimate Net Return for AAS Degree and Long-Term Certificate Completers
The net present value of investing in a community college associate degree is more than $238,000. The internal rate of return on their investment is 26.8%. In other words, if a student put $33,368 in an investment that returned 40 annual payments equivalent to the earnings gains from an associate degree, they would earn interest at a rate of 26.9%.
Student Employment Outcomes
Information on student outcomes derives from the Institutional Researcher (IR) Tool dataset, which connects individual-level data from ICCB and Illinois Department of Employment Security (IDES) administrative data systems to generate student outcomes on employment and wages. The IR dataset includes information on ICCS students who completed a credential in 2009 through spring 2018, including their earnings and employment status before and after completion. In this study, a mix of panel data and snapshot data provides information about student outcomes from multiple angles. Panel data shows outcomes for the same group of completers over time. For example, we use panel data to show the trajectory or earnings for students who completed in 2009. Snapshot data shows the characteristics of students that completed each year, such as the employment rate for the class of 2009, the employment rate for the class of 2010, and so on. Next, student outcomes are examined in terms of employment rates, postsecondary
Year Net Price Opportunity Cost Total Cost
Post Completion
Earnings Gains
-1 $5,650 9,751$ $15,401 -$16,0170 $5,563 10,919$ $16,482 -$16,4821 $9,691 $9,3032 $10,369 $9,5563 $11,095 $9,8164 $11,872 $10,0835 $12,703 $10,3576 $13,592 $10,6397 $14,543 $10,9288 $15,561 $11,2269 $16,650 $11,53110 $16,650 $11,070…
…
……
……38 $16,650 $3,53039 $16,650 $3,38840 $16,650 $3,253
Total Increased Earning $598,939 NPV $238,785IRR 26.8%
Discounted Cash Flow
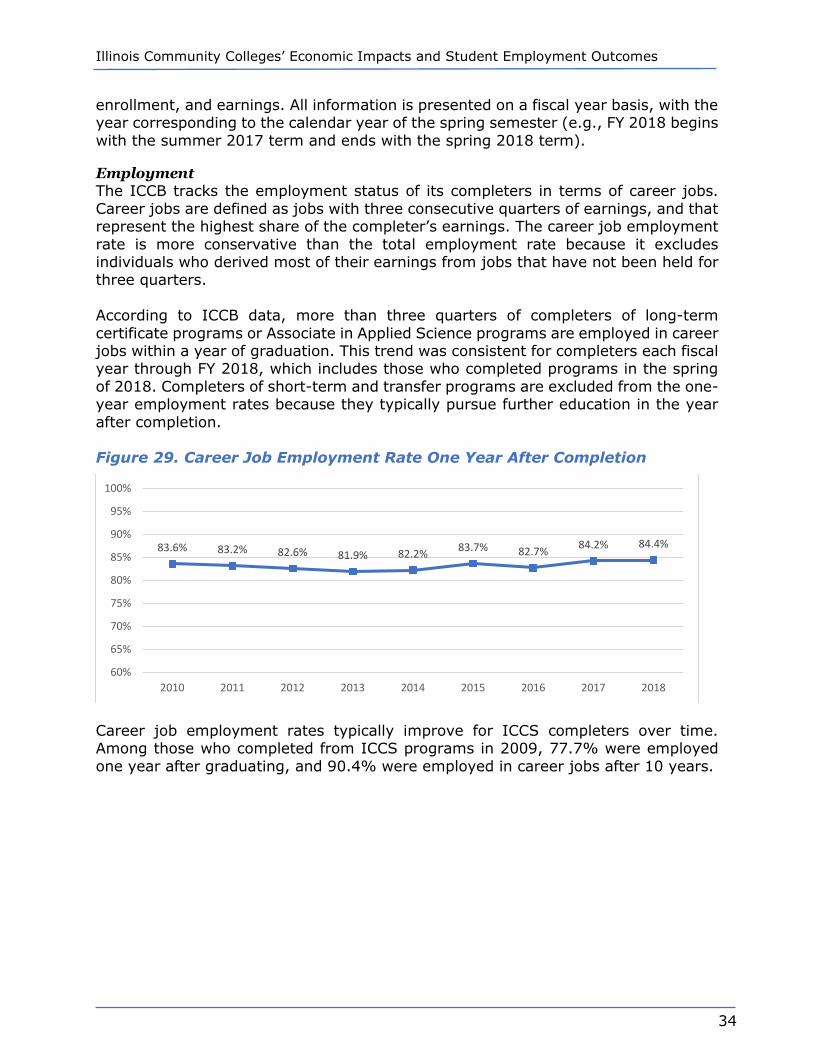
Illinois Community Colleges’ Economic Impacts and Student Employment Outcomes
34
enrollment, and earnings. All information is presented on a fiscal year basis, with the year corresponding to the calendar year of the spring semester (e.g., FY 2018 begins with the summer 2017 term and ends with the spring 2018 term).
Employment The ICCB tracks the employment status of its completers in terms of career jobs. Career jobs are defined as jobs with three consecutive quarters of earnings, and that represent the highest share of the completer’s earnings. The career job employment rate is more conservative than the total employment rate because it excludes individuals who derived most of their earnings from jobs that have not been held for three quarters. According to ICCB data, more than three quarters of completers of long-term certificate programs or Associate in Applied Science programs are employed in career jobs within a year of graduation. This trend was consistent for completers each fiscal year through FY 2018, which includes those who completed programs in the spring of 2018. Completers of short-term and transfer programs are excluded from the one-year employment rates because they typically pursue further education in the year after completion. Figure 29. Career Job Employment Rate One Year After Completion
Career job employment rates typically improve for ICCS completers over time. Among those who completed from ICCS programs in 2009, 77.7% were employed one year after graduating, and 90.4% were employed in career jobs after 10 years.
83.6% 83.2% 82.6% 81.9% 82.2% 83.7% 82.7% 84.2% 84.4%
60%
65%
70%
75%
80%
85%
90%
95%
100%
2010 2011 2012 2013 2014 2015 2016 2017 2018
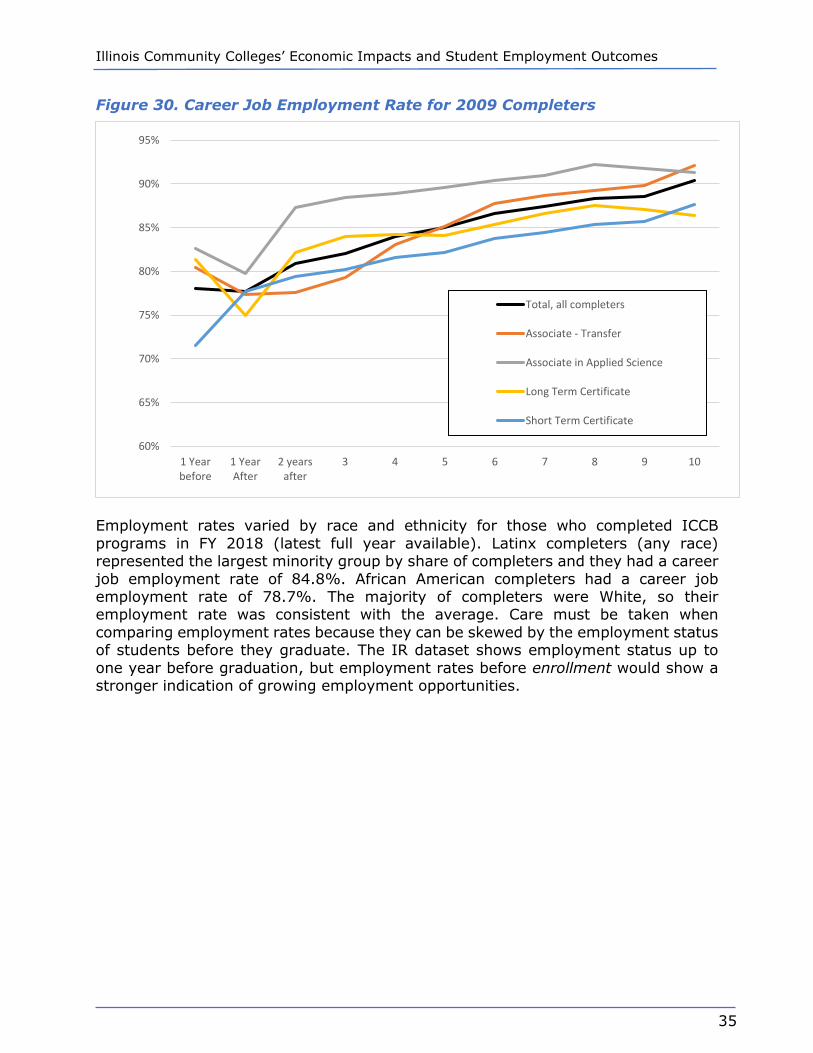
Illinois Community Colleges’ Economic Impacts and Student Employment Outcomes
35
Figure 30. Career Job Employment Rate for 2009 Completers
Employment rates varied by race and ethnicity for those who completed ICCB programs in FY 2018 (latest full year available). Latinx completers (any race) represented the largest minority group by share of completers and they had a career job employment rate of 84.8%. African American completers had a career job employment rate of 78.7%. The majority of completers were White, so their employment rate was consistent with the average. Care must be taken when comparing employment rates because they can be skewed by the employment status of students before they graduate. The IR dataset shows employment status up to one year before graduation, but employment rates before enrollment would show a stronger indication of growing employment opportunities.
60%
65%
70%
75%
80%
85%
90%
95%
1 Yearbefore
1 YearAfter
2 yearsafter
3 4 5 6 7 8 9 10
Total, all completers
Associate - Transfer
Associate in Applied Science
Long Term Certificate
Short Term Certificate

Illinois Community Colleges’ Economic Impacts and Student Employment Outcomes
36
Figure 31. Career Job Employment Rate One Year After Completion by Race/Ethnicity (Long-Term Certificates and Associate in Applied Science Completers)
Unsurprisingly, older students have a higher employment rate when they graduate, usually because they are mid-career. About 81.9% of completers of long-term certificate programs or AAS programs in the traditional college age, under age 25, were employed in career jobs six months after graduating. About 84.2% of completers in the 25-39 age range were employed in career jobs, and completers over age 39 had similar employment rates. In some cases, the employment rate is lower because completers defer working full-time to pursue a university degree. Figure 32. Career Job Employment Rate One Year After Completion by Age (Long-Term Certificates and Associate in Applied Science Completers)
Employment rates also varied considerably by the career clusters that completers studied for. Those who studied for transportation, distribution, and logistics careers
85.2%
78.7%
82.9%
84.8%83.8%
White African American Asian Latinx Other
81.9%
84.2%
83.3%
82.5%
Under 25 25-39 40-54 55+
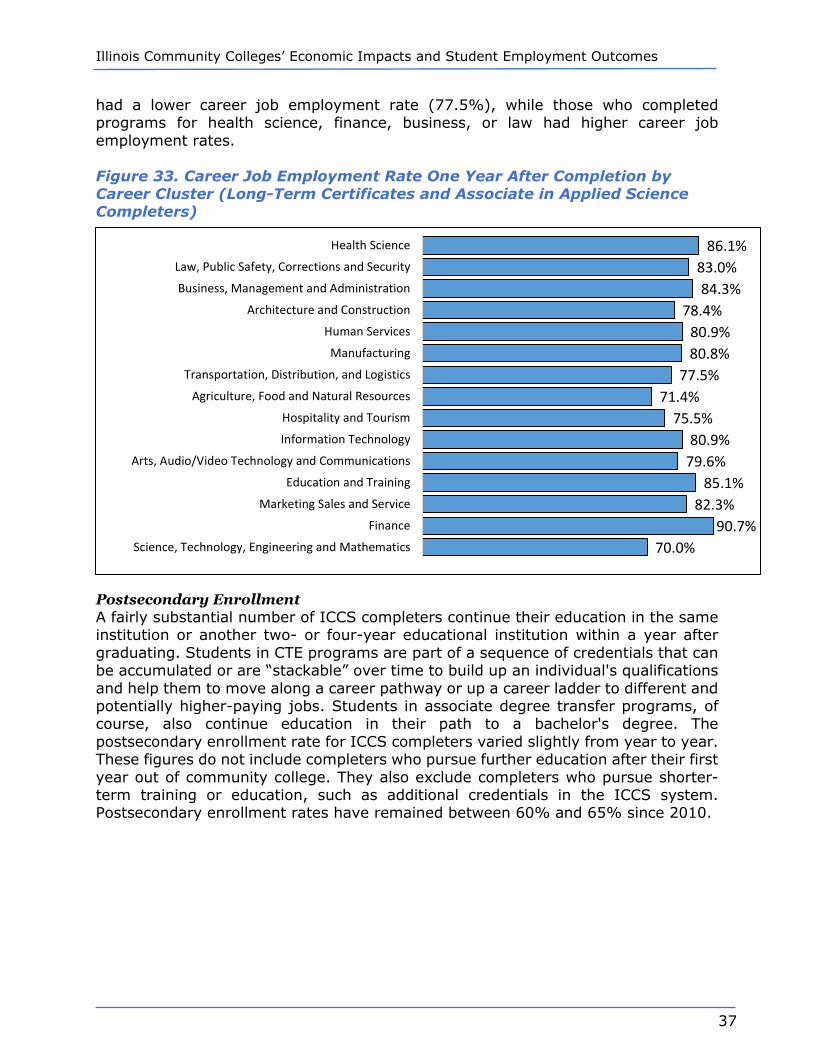
Illinois Community Colleges’ Economic Impacts and Student Employment Outcomes
37
had a lower career job employment rate (77.5%), while those who completed programs for health science, finance, business, or law had higher career job employment rates. Figure 33. Career Job Employment Rate One Year After Completion by Career Cluster (Long-Term Certificates and Associate in Applied Science Completers)
Postsecondary Enrollment A fairly substantial number of ICCS completers continue their education in the same institution or another two- or four-year educational institution within a year after graduating. Students in CTE programs are part of a sequence of credentials that can be accumulated or are “stackable” over time to build up an individual's qualifications and help them to move along a career pathway or up a career ladder to different and potentially higher-paying jobs. Students in associate degree transfer programs, of course, also continue education in their path to a bachelor's degree. The postsecondary enrollment rate for ICCS completers varied slightly from year to year. These figures do not include completers who pursue further education after their first year out of community college. They also exclude completers who pursue shorter-term training or education, such as additional credentials in the ICCS system. Postsecondary enrollment rates have remained between 60% and 65% since 2010.
86.1%83.0%84.3%
78.4%80.9%80.8%
77.5%71.4%
75.5%80.9%
79.6%85.1%
82.3%90.7%
70.0%
Health Science
Law, Public Safety, Corrections and Security
Business, Management and Administration
Architecture and Construction
Human Services
Manufacturing
Transportation, Distribution, and Logistics
Agriculture, Food and Natural Resources
Hospitality and Tourism
Information Technology
Arts, Audio/Video Technology and Communications
Education and Training
Marketing Sales and Service
Finance
Science, Technology, Engineering and Mathematics

Illinois Community Colleges’ Economic Impacts and Student Employment Outcomes
38
Figure 34. Postsecondary Enrollment Rate by Year of Completion
*Spring 2018 only.
Earnings Looking at a longer time horizon, the class of 2009 earned $54,516 ten years after graduating, representing an average annual growth rate of 21.2%. The earnings growth is most significant in the first few years after graduation, and there was an immediate increase of 39.5% for the first year after graduation. Some of the earnings growth in the first year could reflect working additional hours or securing a higher-paying job. Figure 35. Average Earnings Over Time for 2009 Completers (Long-Term Certificates and Associate in Applied Science Completers)
Completers of associate degrees for transfer to other institutions earned a median of $36,972 five years after completing their program in the ICCS. Ten years after
57.5%
65.7% 64.1% 62.6% 61.8% 60.4% 61.8% 64.1% 63.2% 65.3%
0.0%
10.0%
20.0%
30.0%
40.0%
50.0%
60.0%
70.0%
80.0%
90.0%
100.0%
2009 2010 2011 2012 2013 2014 2015 2016 2017 2018*
$17,466
$24,360
$38,040 $40,110 $41,604$43,896
$46,560 $47,868 $48,504 $50,460$54,516
$0
$10,000
$20,000
$30,000
$40,000
$50,000
$60,000
1 yearbefore
1 yearafter
2 yearsafter
3 4 5 6 7 8 9 10

Illinois Community Colleges’ Economic Impacts and Student Employment Outcomes
39
completion, the median earnings were $48,972, which represented a 6.5% increase each year. Earnings for the first five years are excluded because these completers are still finishing their four-year degrees at this time. Figure 36. Median Earnings Over Time for 2009 Completers (Associate - Transfer Completers)
The earnings of ICCS completers varied slightly by year of completion. Those who completed their program in FY 2010 earned a median of $40,110 after three years. For FY 2016, completers earned a median of $42,330 after three years. Median earnings were somewhat lower for completers in FY 2011 and 2012, but they increased for FY 2013 onward. Figure 37. Median Annual Earnings 3 Years After Graduation, by Year of Graduation (Long-Term Certificates and Associate in Applied Science Completers)
$36,972$39,804 $41,496 $43,044 $44,844
$48,972
$0
$10,000
$20,000
$30,000
$40,000
$50,000
$60,000
5 years after 6 7 8 9 10
$40,110
$39,132$39,576
$41,220 $41,106 $41,088
$42,330
$37,000
$38,000
$39,000
$40,000
$41,000
$42,000
$43,000
2010 2011 2012 2013 2014 2015 2016
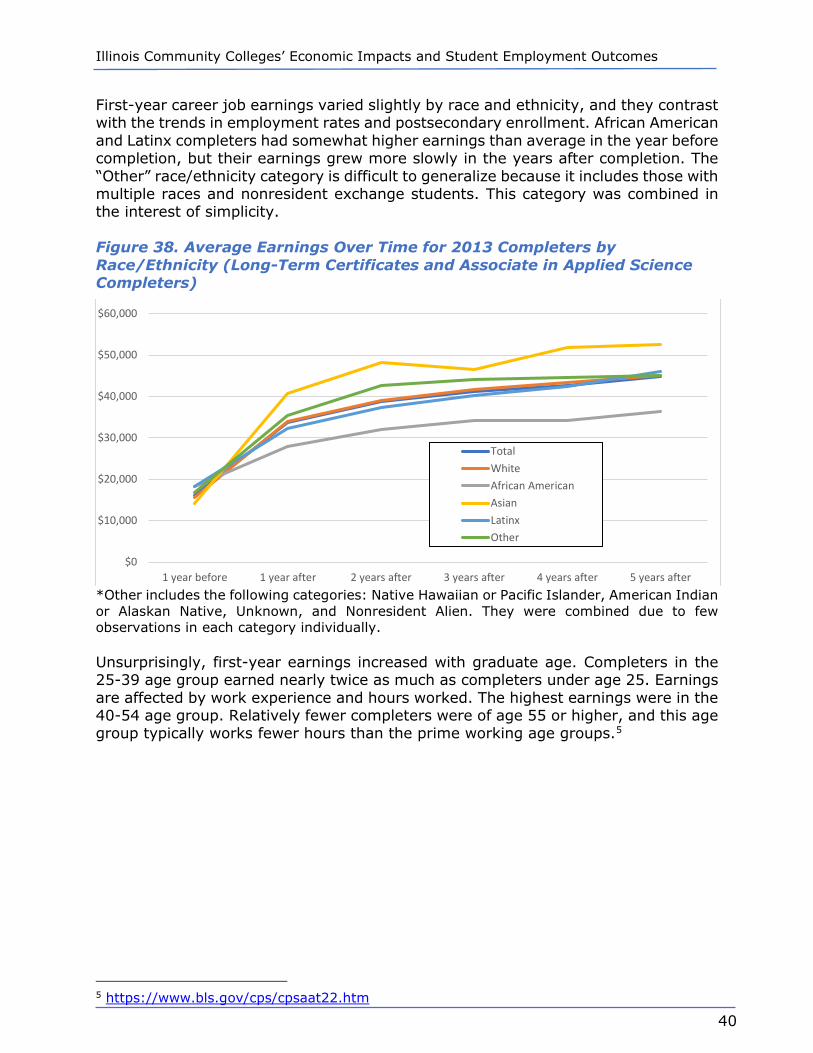
Illinois Community Colleges’ Economic Impacts and Student Employment Outcomes
40
First-year career job earnings varied slightly by race and ethnicity, and they contrast with the trends in employment rates and postsecondary enrollment. African American and Latinx completers had somewhat higher earnings than average in the year before completion, but their earnings grew more slowly in the years after completion. The “Other” race/ethnicity category is difficult to generalize because it includes those with multiple races and nonresident exchange students. This category was combined in the interest of simplicity. Figure 38. Average Earnings Over Time for 2013 Completers by Race/Ethnicity (Long-Term Certificates and Associate in Applied Science Completers)
*Other includes the following categories: Native Hawaiian or Pacific Islander, American Indian or Alaskan Native, Unknown, and Nonresident Alien. They were combined due to few observations in each category individually. Unsurprisingly, first-year earnings increased with graduate age. Completers in the 25-39 age group earned nearly twice as much as completers under age 25. Earnings are affected by work experience and hours worked. The highest earnings were in the 40-54 age group. Relatively fewer completers were of age 55 or higher, and this age group typically works fewer hours than the prime working age groups.5
5 https://www.bls.gov/cps/cpsaat22.htm
$0
$10,000
$20,000
$30,000
$40,000
$50,000
$60,000
1 year before 1 year after 2 years after 3 years after 4 years after 5 years after
TotalWhiteAfrican AmericanAsianLatinxOther

Illinois Community Colleges’ Economic Impacts and Student Employment Outcomes
41
Figure 39. Average Earnings Over Time for 2013 Completers by Age (Long-Term Certificates and Associate in Applied Science Completers)
Earnings for ICCS completers depend on the types of jobs held after completion. Completers of STEM programs had considerably lower earnings than the average for all completers, but more than 75% of them enroll in four-year institutions within a year of completion. For this reason, earnings after one year do not fully reflect the trajectory of earnings for STEM completers. Earnings were substantially higher for completers of manufacturing programs, at $42,384 after one year. Completers of IT programs and programs in transportation/distribution/logistics also had above-average earnings. Figure 40. Average Annual Career Job Earnings for 2017 Completers, 1 Year After Exit
$0
$10,000
$20,000
$30,000
$40,000
$50,000
$60,000
1 year before 1 year after 2 years after 3 years after 4 years after 5 years after
Under 25
25-39
40-54
55+
$0
$10,000
$20,000
$30,000
$40,000
$50,000
$60,000
$70,000
1 year before 1 year after 2 3 4 5
Agriculture, Food and Natural ResourcesArchitecture and ConstructionBusiness, Management and AdministrationFinanceHealth ScienceInformation TechnologyLaw, Public Safety, Corrections and Security

Illinois Community Colleges’ Economic Impacts and Student Employment Outcomes
42
Short-Term Certificate Student Employment Outcomes
To meet student and employer needs, Illinois community colleges offer a variety of certificate and degrees of varying lengths. Short-term certificates (defined as certificates under 30 credit hours) provide students with a quick and focused program of study that can lead to immediate employment. Examples of short-term certificates include Truck Driving, Welding, Web Design, HVAC Technician, Electrician, and Firefighting. Many of the short-term certificates allow students to enter the workforce but then are also embedded in a program of study that allows continued education toward an advanced certificate or full associate degree that allows even further expansion in career opportunities. Illinois community colleges are committed to continuing growth in short-term certificate opportunities particularly in high-need communities focused on specific sectors with identified workforce gaps. The Workforce Equity Initiative (WEI) in particular, is evidence of Illinois community college efforts on short-term certificate expansion in high-demand careers. WEI also targets low-income individuals, those living in high crime and high poverty areas, and unemployed individuals and minorities. Figure 41 illustrates WEI’s evidence-based model of developing short-term certificate programs and student completers in high-demand occupations that provide a salary 30% above a living wage within that region. Figure 41. Illinois Community College Workforce Equity Initiative (WEI) Model
Figure 42 provides the ten short-term certificate programs with at least 100 completers in FY 2016 with the highest median actual earnings. Earnings for completers of short-term certificates can vary widely by program and many programs offer the ability to have substantially higher wages within an occupation depending on the employer and worker experience.
Economic Impact
Communtiy College Short-
Term Certificate Programs
Identify Workforce Gaps
and Fill Job Openings
Jobs Pay 30% Salaries Above
Living Wage

Illinois Community Colleges’ Economic Impacts and Student Employment Outcomes
43
Figure 42. Median Earnings Three Years After Completion, FY 2016 Short-Term Completers (minimum of 100 completers for inclusion)
Curriculum Code
Median Annual Earnings, 3 Years After Completion
Count of completers
4603-Electrical and Power Transmission Installers $69,216 291 4302-Fire Protection $54,108 207 4702-Heating, Air Conditioning, Ventilation and Refrigeration Maintenance Technology/Technician (HAC, HACR, HVAC, HVACR) $48,708 143 4301-Criminal Justice and Corrections $43,902 168 1109-Computer Systems Networking and Telecommunications $43,554 110 4902-Ground Transportation (incl Truck Driving) $42,492 545 5202-Business Administration, Management and Operations $41,742 158 4805-Precision Metal Working $39,792 398 1513-Drafting/Design Engineering Technologies/Technicians $38,112 109 5203-Accounting and Related Services $36,264 161
The Illinois community college system’s commitment to strengthening job creation and workforce development is evident in the alignment of graduates in short-term certificate programs (Figure 42) with many occupations identified as having considerable job openings and/or growth rates projected through 2029 in Figure 43 in such occupations as Heavy and Tractor-Trailer Truck Drivers; Bookkeeping, Accounting, and Auditing Clerks; Computer User Support Specialists; Firefighters; Heating, Air Conditioning, and Refrigeration Mechanics and Installers; First-Line Supervisors of Firefighting and Prevention Workers; and Electrical and Electronics Repairers, Commercial and Industrial Equipment. Figure 43. Job Growth in Occupations that Typically Require a Short-Term Certificate
SOC Description 2019 Jobs
2029 Jobs
Growth rate
Annual Openings
53-3032 Heavy and Tractor-Trailer Truck Drivers
81,624 89,552 9.7% 10,723
43-3031 Bookkeeping, Accounting, and Auditing Clerks
61,828 60,045 -2.9% 7,236
15-1232 Computer User Support Specialists 26,777 29,434 9.9% 2,590 33-2011 Firefighters 17,080 17,343 1.5% 1,218 49-9021 Heating, Air Conditioning, and
Refrigeration Mechanics and Installers
10,026 11,220 11.9% 1,174
33-1021 First-Line Supervisors of Firefighting and Prevention Workers
3,422 3,497 2.2% 228
49-2094 Electrical and Electronics Repairers, Commercial and Industrial Equipment
2,241 2,259 0.8% 208
Source: EMSI, 2020.

Illinois Community Colleges’ Economic Impacts and Student Employment Outcomes
44
ILLINOIS COMMUNITY COLLEGE ECONOMIC IMPACTS Illinois’ 48 community colleges are important sources of expenditures and employment for the communities and regions they serve. As part of their day-to-day operations, each college purchases goods and services, many of them from the local economy. They also pay their employees, who in turn spend their wages and salaries in the local economy. Additionally, the community colleges invest in site improvements, remodeling, and new construction that generate additional expenditures and jobs. Any change in economic activity, such as the purchase of a commodity or a service, has direct and indirect effects. The direct effects are the employment, payroll and purchases of goods and services directly by the colleges. The indirect effects occur through a variety of channels. For example, when a community college hires a local printer to produce its catalogues and brochures, these orders contribute directly to the income of the local printing industry. The printers’ employees spend at least some of their income locally, and these purchases contribute to the employment and the income of other local industries and services. The printers spend part of their income from the community college’s orders on the supplies that they need to run their business. To the extent that these purchases are local, they contribute to the incomes of employees in other industries, who in turn spend their incomes on still other goods and services with these effects again induced by the college’s initial purchase. IMPLAN Pro economic modeling software was used to produce estimates of the indirect economic impacts of Illinois community colleges, based on the direct impacts. Direct impacts are simply the set of expenditures or employment applied to the predictive model for impact analysis. Indirect impacts are then derived as additional effects caused by industries purchasing from other industries. Induced impacts consider the spending in the local economy of the new income generated by the new employment produced from the impact. Data provided by the individual community colleges to the Illinois Community College Board identified about $1.8 billion in operating expenditures during fiscal year 2020 (including wages and salaries) by the colleges. Illinois community colleges paid over $1.3 billion in wages and benefits to their 32,867 employees that lived in the state. These direct impacts rippled through the economy creating additional jobs, payrolls, and other economic activity. These impacts are summarized below in Figure 44. Over 43,000 jobs could be attributed to statewide college operations. These operations were associated with about $3.5 billion in economic output (equivalent to total sales of a business or total spending of a government enterprise). Value added, which is a measure similar to Gross State Product, totaled over $2.4 billion. Figure 44. Illinois Community Colleges' Operational Expenditures Output and Employment Impact - FY2020
Impact Type Direct Effect Indirect Effect Total Effect
Employment 32,867 10,449 43,316 Output $1,781,212,748 $1,700,343,176 $3,481,555,924 Total Value Added $1,382,235,446 $1,040,788,920 $2,423,024,367 Employee Compensation $1,320,815,918 $564,066,234 $1,884,882,152

Illinois Community Colleges’ Economic Impacts and Student Employment Outcomes
45
Beyond the effects of direct spending and employment, the Illinois community college system also strengthens the Illinois economy by addressing employers’ workforce needs. In a survey of the community colleges’ business engagement, in 2019, 10,726 employers were served by credit or noncredit programs. In 2020, during the recession, 9,811 employers were served by ICCS programs. Several community colleges specifically include economic development services through employer and business engagement.

Illinois Community Colleges’ Economic Impacts and Student Employment Outcomes
46
REFERENCES A Plan to Revitalize the Illinois Economy and Build the Workforce of the Future. (2019). Illinois Department of Commerce and Economic Opportunity. An Action Agenda for Workforce Development and Job Creation: Response to Illinois Executive Order 2019-03 (2019). Illinois Department of Commerce and Economic Opportunity. Barrero, José María, Nick Bloom, and Steven J. Davis (2020). COVID-19 Is Also a Reallocation Shock. BPEA Conference Draft, Summer. https://www.brookings.edu/bpea-articles/covid-19-is-also-a-reallocation-shock/ Del Pilar, W. and Berger, K. (2019) Racial Equity & Postsecondary Attainment: An Analysis of the States. The Education Trust. Illinois’ Perkins V State Plan for the Strengthening Career and Technical Education for the 21st Century Act (2020). Illinois State Board of Education and Illinois Community College Board. https://www.iccb.org/cte/wp-content/uploads/2020/06/Illinois-State-Perkins-Plan-approved-by-USDOE-5.21.20.pdf Illinois 2020-2024 WIOA State Unified Plan (2020). Illinois Workforce Innovation Board. https://www.illinoisworknet.com/WIOA/Resources/Documents/Updated%20Final%20Combined%20USP%20Plan%20Document.pdf Kochhar, Rakesh (2020). Unemployment Rate is Higher Than Officially Recorded, More So for Women and Certain Other Groups. Pew Research Center. https://www.pewresearch.org/fact-tank/2020/06/30/unemployment-rate-is-higher-than-officially-recorded-more-so-for-women-and-certain-other-groups/ Making Equity Part of Your State’s Postsecondary Planning (2017). Center for Urban Education, University of Southern California Rossier School of Education. Welton, A. D., Rockey, M., & James-Gallaway, C. (2019). An equity-centered, comprehensive local needs assessment. Champaign, IL: Office of Community College Research and Leadership, University of Illinois at Urbana-Champaign.