iiiimpact of parking maneuvers on mpact of parking maneuvers on
TRANSCRIPT

IIIIMPACT OF PARKING MANEUVERS ON MPACT OF PARKING MANEUVERS ON MPACT OF PARKING MANEUVERS ON MPACT OF PARKING MANEUVERS ON
SPACE MEAN SPEED AND AVERAGE SPACE MEAN SPEED AND AVERAGE SPACE MEAN SPEED AND AVERAGE SPACE MEAN SPEED AND AVERAGE
TRAVEL TIMETRAVEL TIMETRAVEL TIMETRAVEL TIME
Ermias Tesfaye Adula
KTH, May 2011

Impact of Parking Maneuvers on Space Mean Speed
And Average Travel Time
2

Impact of Parking Maneuvers on Space Mean Speed
And Average Travel Time
3
Abstract
Parking maneuver is one among the numerous factors which affect the traffic movement. In
this thesis work the impact of parking maneuvers and double parking on the traffic
performance of urban street segments is studied. In order to analyze the traffic
performance, the impact on the travel time and space mean speed is studied. Two
approaches are used for the study; the Micro analysis and Macro analysis. In the Micro
analysis the study is not time bounded. The impact of individual vehicles is studied against
the event of interest. These events include inbound parking maneuvers, outbound parking
maneuvers, double parking and the load/unload activities. On the other hand for the Macro
study the events in a five minute interval are studied for eight and a half hour for each site.
Each five minute interval is taken as a single data input for the regression analysis. To study
the impact on travel time speed trajectory is used and to study the space mean speed
regression analysis is used. According to this study the parking maneuvers give rise to a
speed reduction of almost 2 Km/hr and double parking 7km/hr. Similarly, the load/unload
maneuvers cause a speed reduction of 3Km/hr.
Normally two basic tasks are included in this thesis work; data reduction and data analysis.
The raw data for this thesis work is a video recording of 8 and half hours for four different
spots. Regression analysis and speed trajectory are the main analysis approaches employed
for the data analysis. Speed trajectory is used for the Micro analysis and regression analysis
is used for the Macro analysis.

Impact of Parking Maneuvers on Space Mean Speed
And Average Travel Time
4

Impact of Parking Maneuvers on Space Mean Speed
And Average Travel Time
5
Acknowledgments
This thesis project is part of the Parking project which is carried out at the traffic and
logistics department of KTH. This Parking study, which is focusing on the selected streets in
the central areas of Stockholm, is carried out by a team of professionals lead by Professor
Karl-lennart Bång.
With all his grace thanks to the Almighty God I finally made it through with the
unexplainable collaboration and assistance of numerous people.
First, I would like to thank and appreciate Professor Karl-lennart Bång for his best guidance
and wisdom sharing. As my supervisor and chairman of the project, his guidance put on the
right alignment to accomplish my work.
Secondly, I would like to thank the project team members Ary-Pezo Silvano (Phd.
Candidate), Dr. Albania Nissan and Dr. Azhar Al-Mudhaffar for their continuous assessment.
They were so perfect in following every move I did. My special thanks go to Professor Harris
Koutsopoulos for his time and best ideas in solving my major problems.
Finally, I would like to thank my wife Tsedey Yeshitila Belayneh for all the caring and
support. Lastly, I would like to mention my family back home. This paper work is dedicated
to my late Dad, whose dream drove me extra miles in my academic life.

Impact of Parking Maneuvers on Space Mean Speed
And Average Travel Time
6

Impact of Parking Maneuvers on Space Mean Speed
And Average Travel Time
7
Table of Contents
1 Introduction .................................................................................................................................... 9
1.1 Background ............................................................................................................................. 9
1.2 Parking Definition.................................................................................................................... 9
1.3 Objective ............................................................................................................................... 10
1.4 Scope and Limitation............................................................................................................. 10
2 Literature Review .......................................................................................................................... 11
3 Methodology ................................................................................................................................. 17
The data used for this project is a video recording which lasts for about eight and half hour for
each site. This data was collected in September 2009 by the division. From this raw data intensive
observation was made to collect all the necessary information. ..................................................... 17
3.1 Micro Study ........................................................................................................................... 17
3.1.1 Free Flow Speed ............................................................................................................ 17
3.1.2 Parking Maneuver ......................................................................................................... 17
3.2 The Macro Study ................................................................................................................... 19
3.2.1 Data Analysis/Processing .............................................................................................. 20
3.2.2 Regression Analysis ....................................................................................................... 21
4 Description of Case Study (Data Analysis) .................................................................................... 27
4.1 Case Study One ........................................................................................................................... 27
4.2 Case study Two ..................................................................................................................... 32
4.3 Case study Three ................................................................................................................... 34
5 Results and Discussion .................................................................................................................. 36
5.1 Micro Analysis ....................................................................................................................... 36
In the Micro analysis the data reduction is not done in a time bound manner. Some of the
interesting events of the same kind are categorized together to see their impact. The
interference of some other disturbing factors than the events of interest was more challenging
to exclude. ..................................................................................................................................... 36
5.1.1 Case Study One ............................................................................................................. 36
5.1.2 Case Study Two ............................................................................................................. 46
5.1.3 Case Study Three ........................................................................................................... 54
5.2 Macro Analysis ...................................................................................................................... 62
5.2.1 Evaluation of the Regression Analysis .......................................................................... 62

Impact of Parking Maneuvers on Space Mean Speed
And Average Travel Time
8
5.2.2 Evaluation of the Initial Hypotheses ............................................................................. 63
6 Discussion ...................................................................................................................................... 66
7 Conclusions ................................................................................................................................... 67
8 Further Study ................................................................................................................................ 68
9 Bibliography .................................................................................................................................. 69

Impact of Parking Maneuvers on Space Mean Speed
And Average Travel Time
9
1 Introduction 1.1 Background
With the fast growth of automobile use in the early 19th
century decision makers and urban
planners visualize the problems associated with the availability of proper parking space. For
this reason it has become one of the major parts of a modern urban set up. In previous
times parking related problems appear to be seen in the city centers and in areas with
higher public movements. But, nowadays it is a concern throughout the urban area, even
with those having moderate public activities. Parking activity gives the cities and suburbs the
picture that they hold; it has impact on the traffic congestion, traffic operation and also
determines the reliability of transit systems. The presence of parking space also puts a great
deal of influence on the mode choice and route selection of travelers. On-street parking in
situations without proper parking space could increase the accident risks and also could
obstruct emergency vehicles. Additionally, in the mid 1930’s it was realized that it will be a
major source of revenue (Childs, 1999).
Many attempts were done to implement and propose different measures in order to create
a better living environment and make people’s interaction so smooth. A well studied and
designed parking policy results in an efficient transport system, lower emissions and
inclusive urban layout (Marsden, 2006). Besides, accessibility and parking suitability are
among the most decisive factors that affect shoppers’ destination choices (Innes D.et al,
1990). Parking policy is a vital issue for economy, sustainability and suitability of cities to live
in.
In Stockholm different policies have been implemented to improve the traffic condition in
the inner city. One of the activities which affect the traffic condition in the innercity is the
parking activity. For this purpose this study is carried out to evaluate the impact of the
parking activities in the traffic performance of the streets in Stockholm.
1.2 Parking Definition
Usually vehicles have an origin and destination. Typically private cars usually have their
origin in residential areas and destination in central city areas. Those cars have to be parked
in the city areas which are flocked with cars. One point that we always have to bear in mind
is that cars are parked for most of their life time.
Various types of designs and facilities have been introduced to park cars. Literally, parking
places can be categorized as:
- Off-street parking indoors
- Off-street parking outdoors
- On-street parking (with fee or no fee)
Off-street parking indoors

Impact of Parking Maneuvers on Space Mean Speed
And Average Travel Time
10
This is a sort of facility which is designed to store cars out of the road network. They can
be in the form of a basement which is built underground, level ground or a multi-story
building is allocated for it. Mostly they are located in central business areas where there
is a high demand for parking and less available space.
Off-street parking outdoors
These are parking lots at the ground level. They are quite common in office areas,
residential areas, and big shopping malls or supermarkets. Despite the fact that they
appear at the ground level they do not have a direct interaction with the traffic stream.
They have typical layout design which can accommodate as many vehicles as possible.
They also have enough drive way and medians.
On-street parking outdoors
This in most literatures is called curb side parking. It is a parking on the roadside
bordering the traffic stream. Mostly these types of parking activities happen to be free
of charge in residential areas. On the other hand in central areas there are parking
meters for the drivers to pay parking fees.
On-street parking outdoors is the type of parking that will be studied in this thesis work.
1.3 Objective
The aim of this study is to analyze the impact of parking maneuvers and double parked
vehicles on the traffic performance of urban roads. Specifically, this thesis work studies the
impact of those mentioned events on the speed and travel time of an urban street segment
in Stockholm. For this purpose two approaches will be employed; Macro analysis and Micro
analysis. In the Micro analysis the impact of individual maneuvers is studied whereas in the
Macro analysis the impact of the events is studied in an aggregated approach. In doing so,
the interference of other types of maneuvers or some other events will be excluded.
1.4 Scope and Limitation
At the start of this project the impact of bicyclists and pedestrians was studied. But in the
preliminary assessment these parameters were not found significant. The bicyclists use their
own lane unless obstructed and the number of pedestrians crossing not on the zebra cross
is very few. For those reasons the two variables are excluded from the study. The
independent variables used in the Macro analysis are flow, maneuvers, double parking,
load/unload and number of lanes. These variables are found significant.
The other limitation is the impact of aggregation and averaging. Due to some constraints the
time segment could not be narrower than five minutes in the Macro study the analysis.
When the events in a five minute interval are average, some events happen to be covered
up and their impact will not be seen more significantly than those without any event.
Usually when events occur like with the red traffic light, bunching of vehicles happen. In this
study the bunching vehicles are not analyzed.

Impact of Parking Maneuvers on Space Mean Speed
And Average Travel Time
11
2 Literature Review There are lots of literatures about parking issues which are related to parking behavior,
parking policies, economic analysis of garages, optimization of garages, etc. However, there
are very few literatures regarding the influences of on-street parking on traffic performance,
traffic safety, logistic (Load-Unload), accessibility and the environment.
The main objective of this literature review is to revise the papers on how on-street parking
activities influence the speed of adjacent traffic stream and capacity of the road where they
are situated. Normally there is a direct relation between speed and capacity in the intercity
roads; as the speed reduces so does the capacity. It has been advocated that on-street
parking affects the capacity and speed of the streets. An intensive search on different
sources on this subject matter is summarized in the following.
In literatures it is stated that on-street parking reduces the capacity for various reasons. To
mention some; the on-street parking lane could have been dedicated to the through traffic
and it also reduces the capacity as it reduces the speed of the vehicles due to the side
friction. This is also called roadside characteristic and is demonstrated by the models
elaborated below.
Bång,_K._L. (1995) developed speed-flow relationships and road capacity (�) in the
Indonesian Highway Capacity Manual. On-street parking was taken in to account in the
estimation process. Capacity was related to explanatory variables such as road function,
roadside friction and road width. For the roadside friction in the urban streets, on-street
parking was considered with the number of parking maneuvers occurring in the road
segment (���/�/��). In order to estimate the parameters of the models linear regression
was applied. The capacity model is:
� � � ��� �� � �� � 1.1
Where
� = Actual capacity
� = Ideal capacity
��� = Road width adjustment factor
�� � = Directional adjustment factor
�� � = Road friction adjustment factor
Different road characteristics were considered in the roadside adjustment factor(�� �);
these include pedestrians(Ped), on-street parking maneuvers(PSV), number of bus stops and
slow moving vehicles (SMV) with different weights. The following equation gives an

Impact of Parking Maneuvers on Space Mean Speed
And Average Travel Time
12
empirical relationship which tells the dependence of road frictional adjustment factor on
the factors mentioned above:
FCsf=Ped*0.6+PSV*0.8+SMV*0.4
According to Bång (1995), the roadside activities significantly affect the speed-flow
relationship of the road links. This will result in the speed and capacity reductions. In the
graph in Figure 2.1 below it can be seen how speed and capacity are reduced due to side
friction events.
Figure 2.1: The relationship of speed and capacity with side friction,
Source: Bång, K.L (1995)
Another approach was made by Highway Capacity Manual (HCM 2010-Chapter 17). For
urban street segments it considers geometry, traffic and control characteristics to compute
urban street segments performance and Level of Service (LOS). Four modes are considered
in the methodology: pedestrian, automobile, bicyclist and transit. In the computation of LOS
for pedestrian and bicyclist modes on-street parking is considered directly; yet the HCM
2010 does not consider on-street parking for automobile mode. It is left to the analyst to
complement the analysis adding typical methodology if available to compute it’s influence
on the traffic performance.

Impact of Parking Maneuvers on Space Mean Speed
And Average Travel Time
13
Ibeas-Portilla, A._et_al (2009) evaluated traffic performance due to on-street parking with a
different approach. To quantify the influence of parking maneuvers and bad parked cars on
average link journey times as a function of the duration of the events and flow the authors
applied M/M/∞ queuing model. To calibrate the model data was collected from the city
Santander in Spain. Validation was done with micro simulation (AIMSUM). Parking
maneuvers and badly parked cars are introduced as events where the lanes do not work or
work at a lower normal rate of service. Parking maneuvers are introduced as high frequency
short duration event (10, 20 and 30 maneuvers per hour) and badly parked cars are
introduced as time events (15 min, 30 min, 45 min and 60 min). The results show an
increase in average journey time up to by 15, 24 and 39% for 10, 20 and 30 maneuvers
respectively; and a reduction in capacity of 6, 10 and 16% for maneuvers of 10, 20 and 30
respectively. Similarly the journey times increase by 57 and 107% for badly parked vehicles
for 15 and 30 min respectively; and capacity reduce by 13 and 27% respectively. When the
event lasted for 60 min the capacity reduction reached 55%.
Studies illustrate that speed reduces with the presence and amount of on-street parking for
urban streets (Shoup 2006, Childs 1999). All of the studies carried out linear regression
analysis to find the average speed on the streets. They took in to account road
characteristics as predictors of the dependant variable (Space mean speed). In all the
studies the presence of on-street parking was found to be an important factor to reduce the
speed of the motor vehicles.
Aronsson(2006) carried out a study to estimate the mean speed on different types of
streets. She applied linear regression model for the analysis. Different types of streets are
categorized according to the service they provide; Arterial, Suburban and Urban streets.
Various street characteristics such as traffic flow, on-street parking, crossing pedestrians,
and number of lanes are tested in a linear regression model to estimate their impacts on the
space mean speed. The result showed that on-street parking has negative impact on the
space mean speed by (-5.54). In a similar study, Nordström (2006) took into account mixed
traffic in the city centers and applied linear regression model to estimate the space mean
speed as dependant variable. According to the study, the presence of on-street parking was
found to reduce the average speed by 3km/h.

Impact of Parking Maneuvers on Space Mean Speed
And Average Travel Time
14
Mean Speed-Urban Streets
Predictors Estimates
Intercept 39.8
Flow -0.202
Pedestrian -0.237
Lanes 5.24
bic_sep 4.73
Parking -5.54
Table 2.1: Mean speed model developed at KTH by Aronsson (2006), coefficients of the
regression analysis.
Mean Speed-Urban Streets
Predictors Estimates
Intercept 45.4
Flow -0.171
bic_sep -6.31
Parking -2.93
Table 2.2: Mean speed model developed at KTH by Nordström (2006), coefficients of the
regression analysis.
A study about speed-flow relationship and roadside characteristic was also carried out by
Aronsson (2006). And it was reported that Wang et al (2006) built a model with which the
operating speed in urban streets is estimated. The author used different roadside
characteristics in the regression analysis to estimate the parameters from second-by-second
in-vehicle GPS data from two hundred randomly selected vehicles in Atlanta, Georgia, USA.
The result shows that on-street parking reduces the speed by 3.19 miles/h. See the Table 2.3
below for the estimates

Impact of Parking Maneuvers on Space Mean Speed
And Average Travel Time
15
Mean Speed-Urban Streets
Intercept 31.56
Number of lanes 6.46
Number of roadside objects/mile -0.1
Number of intersection/mile -0.08
Number of driveways/mile -0.05
Kerb indicator 3.01
Pavement indicator -4.26
Parking indicator -3.19
Land use 1 3.31
Land use 2 3.27
Table 2.3: Operating speed model developed by Wang (miles/hour).
With another approach Tivector(2009) studied the influence of on-street parking on the
average speed of urban street. On the study the streets were evaluated for one-sided and
two-sided on-street parking. The results of the study are consistent with the results of the
studies above showing a higher speed reduction for two-sided on-street parking. For two-
sided parking the speed reduction is 8.9km/h while for one-sided it is 4.5km/h. From the
results it is obvious that the impact is doubled on the two sided on-street parking when
compared to the one-sided on-street parking.
Table 2.4 below shows the speed model developed by Trivector; the effect of one-sided and
two sided on-street parking estimates.
Mean Speed-Urban Streets (50 km/h)
Predictors Estimates
Intercept 38.7
Street type Local 0
Main 7.6
Parking One-sided -4.5
Two-sided -8.9
Table 2.4: Speed Model by Trivector (2009) (speed limit = 50 km/h)
Hansen (2007) conducted a similar study in US to find out the effect of the roadside
environment on the chosen speed. Data was collected from 272 road segments classified by
the urban roads and highways. Linear regression was used to analyze the data; analysis of
Impact of Parking Maneuvers on Space Mean Speed
And Average Travel Time
16
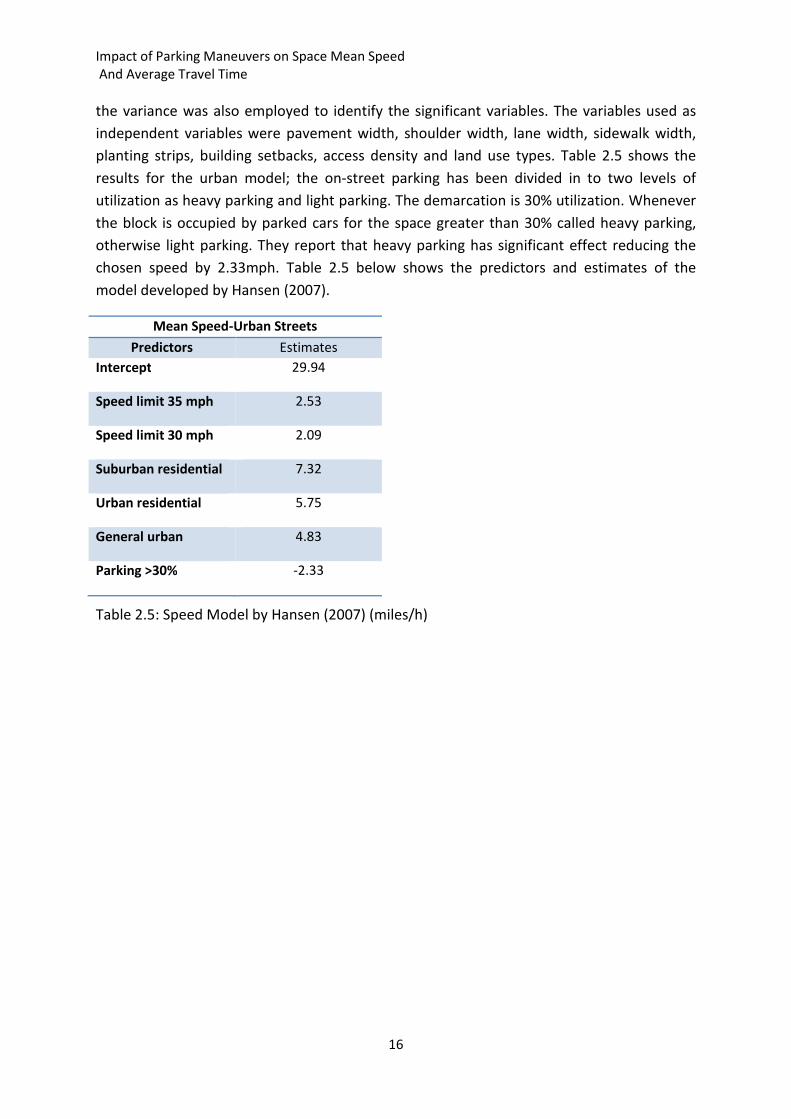
the variance was also employed to identify the significant variables. The variables used as
independent variables were pavement width, shoulder width, lane width, sidewalk width,
planting strips, building setbacks, access density and land use types. Table 2.5 shows the
results for the urban model; the on-street parking has been divided in to two levels of
utilization as heavy parking and light parking. The demarcation is 30% utilization. Whenever
the block is occupied by parked cars for the space greater than 30% called heavy parking,
otherwise light parking. They report that heavy parking has significant effect reducing the
chosen speed by 2.33mph. Table 2.5 below shows the predictors and estimates of the
model developed by Hansen (2007).
Mean Speed-Urban Streets
Predictors Estimates
Intercept 29.94
Speed limit 35 mph 2.53
Speed limit 30 mph 2.09
Suburban residential 7.32
Urban residential 5.75
General urban 4.83
Parking >30% -2.33
Table 2.5: Speed Model by Hansen (2007) (miles/h)

Impact of Parking Maneuvers on Space Mean Speed
And Average Travel Time
17
3 Methodology The data used for this project is a video recording which lasts for about eight and half hour
for each site. This data was collected in September 2009 by the division. From this raw data
intensive observation was made to collect all the necessary information.
3.1 Micro Study
3.1.1 Free Flow Speed
According to the literatures free flow speed is the term used to describe the mean speed of
a vehicles in a segment when there is no congestion or adverse effect,(e.g. bad weather).
For this study the free flow speed is the speed of vehicles without any obstruction of the
parking maneuvers, pedestrians, bicyclists and other events which could disturb the smooth
ride of vehicles.
For this thesis purpose two case studies are carried out. As per the requirements for free
flow speed condition vehicles were selected fairly from all the time periods. A minimum of
20 vehicles were selected for each case study. For the micro study the vehicles that are
under the ideal free flow condition were considered.
In the micro analysis a minimum of 20 vehicles were observed. The average travel time and
space mean speed was calculated. The procedures followed are:
1. The time to travel every 10 meter segments was registered
2. The speed at every 10 meter points was calculated
3. The average travel time at each 10 meter segment was calculated; the average of all
the observations at subsequent 10 meters is calculated for each category.
4. The average speed at each interval was calculated
5. Finally the (time-space) and speed profile graphs for each type of event were plotted
using the free flow condition as a base line.
3.1.2 Parking Maneuver
As it was already explained in the objective part, the main focus of this thesis is to see the
impact of road side events e.g. parking maneuver, double parking and load/unload
maneuver on the traffic performance of the urban street. As it is obvious from experience,
with the occurrence of parking maneuvers the vehicles behind will be held back from their
normal driving condition. Practically, it is not an easy task to isolate whether an impact has
come typically from a parking maneuver or some other events in a flock of vehicles which
are on a dynamic situation. It needs a careful observation for the whole segment. From the
raw data, the video recording which lasts for an eight and half hour duration for each site,
all the events were recorded. For the micro study out of the whole events recorded those
which are affected only by the event of interest are categorized under a specific group. Then

Impact of Parking Maneuvers on Space Mean Speed
And Average Travel Time
18
the average impact of the vehicles was calculated. As the study is to emphasize the impact
of the parking maneuvers on the traffic performance of the street, the data was filtered in
order to exclude the condition in which the traffic is affected by other factors like the traffic
light when it is at the red.
On the streets there are many events which disturb the flowing traffic. These disruptions
make the drivers reduce their speed from their desired driving speed. Some of the
conditions besides the parking maneuver under which the vehicles might also be disturbed:
1. Queue due to signal
Some vehicles make a speed reduction due to the parking maneuvers. But after they
overtake the vehicle which is making the maneuver they will then be held once again
due to the red traffic light at the end of the block. In addition to this, in some cases the
events which involve parking maneuver were also accompanied by a queue which was
developed due to the traffic light. In these situations the drivers will be affected by multi
events, and it will not be an easy exercise to distribute the effects to their particularly
causing event. Thus, reduction in the traffic performance is not a pure impact of the
parking maneuver. For this reason the vehicles in this condition were excluded from the
data set.
2. Pedestrians’ interference
On the zebra cross the pedestrians have the right of way to cross the street. On the
contrary to this, some pedestrians cross the road at locations other than the zebra cross.
Specially half way the block pedestrians mostly prefer to cross directly. Especially when
the vehicles appear to be in a queue and there exists a reasonably higher head-way, it
appears to be inviting.
Similarly, in the course of this study few of the parking maneuvers have pedestrians
crossing the road simultaneously. This condition definitely affects the drivers’
perception. For this reason, the maneuvers under this situation are excluded.
3. Bicyclists
On all of the study sites selected there exists a bicycle lane. But in some cases the
bicyclists jump in to the motorized vehicles lane. This condition is approached in two
ways. When the parking lane is already occupied and vehicles will be forced to make a
double parking and they always block the bicycle lane totally. This will force the bicycles
to mix with the traffic and affect the vehicular movement. The root cause of this event is
double parking. Therefore, these events are considered under double parking. But
vehicles which are affected simply by the interference of bicycles without a double
parking event are excluded.

Impact of Parking Maneuvers on Space Mean Speed
And Average Travel Time
19
4. Isolated parking events
This scenario includes the vehicles which are not disturbed by events other than parking
maneuvers, double parking or load/unload condition maneuvers. If these events were not
there the vehicles would have been on a normal driving condition. Those are the vehicles
which are considered in this study. Out of the whole parking maneuvers happening
throughout the day limited number of vehicles were found in this situation.
For the micro study, using the free flow line as a base, the deviation is measured for each
category of events. These graphs are presented in Chapter 5, results and discussions. They
demonstrate the delay of the vehicles. More discussion could be found on the result part.
Sometimes, maneuvers happen while there is a long distance gap (distance head-way) so
that the maneuvers will not have a significant effect on the smooth flow of the traffic. From
the observation on the video it can easily be observed that drivers take enough time to have
good distance headway when they are making out-bound maneuvers. This happens because
they will have enough time to think about the proper gap acceptance which is not the case
for inbound maneuvers. The presence of bicycle lane also helps for this phenomenon. It
helps as a buffer area for the out bounding vehicles till they get a reasonable distance-head
way. So the out bounding maneuvers appear to have a bit lesser effect on the traffic
stream. In some cases the maneuvers with reasonably higher distance-headway are
excluded as they have negligible impact on the following car.
For the vehicles under Isolated parking maneuver condition the following procedures were
carried out
1. The time to travel every 10 meter segments was registered
2. The speed at every 10 meter points was calculated
3. The average travel time at each 10 meter segment was calculated; the average of all
the observations at subsequent 10 meters is calculated for each category.
4. The average speed at each interval was calculated
5. Finally the (time-space) and speed profile graphs for each type of event were plotted
using the free flow condition as a base line.
3.2 The Macro Study
In this approach all the vehicles are included in the data analysis. In the events where there
happens to be no parking maneuver, double parking or load/unload maneuver, the travel
time was measured excluding the effect of other speed reducing factors like crossing
pedestrians, bicyclists and other unusual events like the over speeding of emergency
Impact of Parking Maneuvers on Space Mean Speed
And Average Travel Time
20
vehicles and police car chase. Sometimes due to the fact that the area is CBD (Central
business district) some drivers happen to be biased to choose their free flow speed. Those
vehicles were excluded from the analysis due to the fact that they will affect the final result.
And for the macro study the travel time was averaged for the vehicles which are not
affected by any event and the traffic light.
For the macro analysis, the ultimate target is to analyze the situation in every five minute
intervals and use each five minute interval as a single data for the regression analysis.
3.2.1 Data Analysis/Processing
For the Macro study all the maneuvers will be considered. In this case all the maneuvers will
be aggregated to five minute time intervals. The observed time segment (eight and half) is
sub-divided in to a five minute interval. Each site will have about 102 intervals. But
sometimes there are intervals with a less suitable condition to be considered as a data.
These types of data were excluded.
The following general procedures were implemented on the data reduction:
- All the vehicles passing through the street segment were counted. With this the flow
for each of the five minute intervals was calculated.
- The average travel time in each five minute time interval was calculated.
- The average speed was calculated using the length of the street segment.
- The maneuvers were summed up under each category; the inbound, reverse
inbound and outbound maneuvers are taken under the category of maneuver, the
presence of double parking and Load/Unload activity was checked under each time
interval.
- In order to analyze the data, regression was applied. In the regression analysis the
impact of different variables on speed was analyzed. In this model building the
dependent and the independent variables need to be selected. Generally a table
containing speed, flow, maneuvers, double parking, the load/unload, lane width, and
number of lanes was developed.
For this analysis the space mean speed was used. In order to calculate the space mean
speed the travel time was measured for all the vehicles which are to be considered for the
study. The travel time was measured using Semi Automated Vehicle Analysis (SAVA),
software developed at KTH by Jeff Archer (2006).
In a similar manner to the micro study the vehicles which are under the impact of the red
traffic light were excluded. In every five minute interval the vehicles were counted in order
to know the flow. Basically, the vehicles under the green light were considered.

Impact of Parking Maneuvers on Space Mean Speed
And Average Travel Time
21
3.2.2 Regression Analysis
3.2.2.1 Steps followed in regression analysis
According to Chatterjee and S.Hadi(2006) in their book ‘Regression Analysis by example’
here are some steps which need to be included in a regression analysis. Most of those steps
are included in the regression analysis of this thesis work and these include:
� Statement of the problem
� Selection of the relevant variables
� Data collection
� Model specification
� Choice of fitting method
� Model fitting
� Model validation and criticism
� Using the chosen model for the solution of the posed problem
The steps mentioned above are explained as follows,
1. Statement of the problem
Usually problem formulation is the first step in regression analysis. Under this step
formulation of the question(s) to be addressed by the analysis is included. Statement of
the problem is the first and the most decisive part in regression analysis. Its significance
comes due to the fact that wrongly defined problem will result in wastage of effort. In
this thesis the main problem which is intended to be addressed is the impact of parking
maneuvers. Normally there are various ways in which performance will be explained.
Typically on this study the speed reduction due to the parking maneuver and related
events will be analyzed. This means, the loss on the potential capacity of the urban
roads due to some activities happening on the road side will be studied. This is a
quantitative analysis on which the travel time is measured and the speed will be
calculated as the distance is known. Travel time of vehicles vary due to various factors
but for this study the situations in which travel time is affected by the factors chosen as
an independent variable are considered.
2. Selection of the relevant variables
Selection of the relevant variables is the next step after defining statement of the
problem. In this study the main aim is to see the impact of parking maneuvers on the
traffic performance, double parked vehicles and the load/unload vehicles. For this
purpose different category of events was developed. This includes the maneuvers,
double parking and load/unload maneuvers. The maneuver embraces front inbound,

Impact of Parking Maneuvers on Space Mean Speed
And Average Travel Time
22
reverse inbound and outbound maneuvers. In addition to these flow, the lane width and
number of lanes are considered as independent variables. Besides these the bicyclists
and pedestrians were included as relevant parameters. But on the preliminary analysis
the two variables happen to be insignificant. Therefore, they are excluded. The
dependent variable is the space mean speed and the independent variables are flow,
maneuver, double parking, load/unload, lane width and number of lanes.
3. Data Collection
After selecting the potentially relevant variables the next step is data collection.
Sometimes data collection needs to be done in a controlled setting in the environment
under the study to be used in the analysis. This is done to hold the effect of those factors
which are not of primary interest. Usually, the data collection is carried out under non-
experimental conditions where very little is controlled by the researcher. In this study
there is a video recording of 4hours and 30minutes in the morning and a 4hour
recording in the afternoon. From this raw data the number of maneuvers under each
category was counted. Besides this with the help of SAVA the travel time of all the
vehicles which are not disturbed by the traffic light was measured. The number of
vehicles using the street in each five minute segment was counted; with this the flow
will be determined.
4. Model Specification
The model that is suitable to analyze cause and effect is regression analysis. In this thesis
the attempt is to evaluate the effect that comes on the speed due to numbers of
variables. Therefore, multiple regression equation will be developed to deal with the
situation. According to Chatterjee and S. Hadi on their book titled Regression by
example, multiple regression equation is an equation containing more than one
predictor variable.
5. Model Parameter Estimation
The next step after the Model specification is model parameter estimation. There are
various estimation methods. The most commons are ordinary least square method,
maximum likelihood, the ridge method and others. Lots of statistical packages do the
analysis. For this study Microsoft Excel will be used to make the model fitting, to
estimate the regression parameters or to fit the model to the collected data. The
estimates of the regression parameters (βo, β1, β2,….) are called the predictors. They
are used to analyze effects of policy that involves changing values of the predictor
variables or to forecast values of the dependent variable for a given predictor set up.
With the help of regression analysis it is possible to understand the interrelationships
among variables in a specific environment or circumstance. Sometimes the effect that
Impact of Parking Maneuvers on Space Mean Speed
And Average Travel Time
23
comes due to some covered values might be more valuable than the predictor variables
on the equation.
Model validation and criticism is done in the result part of the regression analysis.
3.2.2.2 Variable Definition
The regression analysis in this thesis work includes the following variables:
� Space mean speed (dependent variable)
� Flow (Independent variable)
� Maneuvers (Independent variable)
� Double parking (Independent variable)
� Load/unload maneuver (Independent variable)
� Number of lanes (Independent variable)
1. Space Mean Speed
The effect of different variables on traffic performance of an urban street is studied. In
order to see the traffic performance space mean speed is selected as a representative
parameter. In this study the impact of some events on the space mean speed was
analyzed. For this reason space mean speed was selected as a dependent variable. The
travel time which takes to cross a known distance segment was measured. Normally for
this study the vehicles were selected in a controlled way. Vehicles could be disturbed
from their normal driving condition for different reasons. Most of the factors which
could make this delay are considered as independent variables. As it is explained on the
description of the case studies, there is a traffic light at the end of the block. This
condition brought a major challenge to select the proper vehicles for the study. In this
study the delay due to the traffic light is not a major concern. Therefore one of the
major factors to select vehicles is green traffic signal light. But besides this a long queue
sometimes gets developed and a single green cycle will not be enough to dissipate the
queue. Considering the entire mentioned criterion, the travel time was measured for all
the vehicles. Then, an aggregate of five minutes was made for the whole day. All the
measurements in five minutes were averaged to a single value. In this analysis there are
481 different observations. Each of these observations represents events in a five
minute interval. Some vehicles enter the section in one five minute interval and leave
the block in another five minute interval. Those observations are excluded from the data
set to avoid consequent error.

Impact of Parking Maneuvers on Space Mean Speed
And Average Travel Time
24
2. Flow
The flow in an urban road is a dynamic factor which changes in every period of time. In
this study one of the factors which are expected to affect the speed of a vehicle is flow.
As it is an urban street segment, flow varies with time of the day. As it can visually be
observed from the video of the site most of the queuing periods happen when the flow
is high. For this study all the vehicles using the street segment are counted for every five
minute interval. And finally the 481 observations corresponding to the averaged space
mean speed are considered.
3. Parking Maneuvers
The other most important variable which is considered to affect the speed of the
vehicles is parking maneuver. It is the activity of vehicles to leave the drive way to the
parking lane or join the moving traffic from the parking lane. Parking maneuver
embraces various types of events; the forward inbound maneuver, reverse inbound
maneuver, and outbound maneuver. These maneuvers have different impacts on the
travel time or speed of moving vehicles, according to the visual inspection the inbound
maneuvers happen to increase the travel time a bit more than the out bound. The
reverse inbound maneuvers happen to take more time than the forward inbound
maneuvers. For this reason their impact will also be relatively higher. Normally the
presence of the bicycle lane on the street gives a good platoon for out bounding
vehicles. The vehicles leave their position and wait for an acceptable gap on the traffic
stream being at an angular position. Similarly, for inbound maneuvers specially to make
a reverse maneuver some vehicles take aside and double park on the bicycle lane wait
for an acceptable gap. For this study all the mentioned events were counted for every
five minutes corresponding to the measured space mean speed. In some of the five
minute intervals without any of such events a null value was assigned.
4. Double Parking
Sometimes vehicles would like to stop at a specific location which is already occupied.
This happens when delivery vans or trucks have to park in front of a specific store or
sometimes when private cars have to drop passengers. Usually double parking takes
place in the conditions that the driver is not going to leave the vehicle or if he is going to
be in around. Taxis, delivery vans and delivery Lorries are the most common types of
vehicle to make such a parking. Usually this type of parking blocks the bicycle lane so
that the bicycles will be forced to mix with the flowing vehicles. In most of the cases the
vehicles give way to the bicycles by reducing their speed. In such situation the vehicles
will have a higher travel time. Besides this double parked truck or bigger size vans take
some space from the traffic lane in addition to the bicycle lane. This will force the drivers
to have a lower speed so that the travel time will be increased. For this study the
presence of double parked vehicles will be checked and assigned 1 in every five minute

Impact of Parking Maneuvers on Space Mean Speed
And Average Travel Time
25
observation. Some of the vehicles in the study stay in the double parking condition for
more than five minutes; hence they happen to be in two time periods or more. And for
the time periods without a double parking, a null value was assigned. In other words
double parking is analyzed as a dummy variable.
5. Load and Unload Maneuvers
These are maneuver of the vehicles which deliver goods for some stores and groceries.
Normally, there is a special parking space for these vehicles. It is called Last Zone and is a
region restricted only to the delivery trucks and vans. Usually it is a common practice to
put a sign post for the time restriction and destination of the Last Zone. In addition to
this the curb will be painted yellow. Parking other vehicles in this zone is forbidden and a
passenger vehicle doing so is liable to a fine. Despite this fact some passenger vehicles
park at these spots. This forces the delivery vehicles to make a double parking. This will
affect the traffic significantly. In these special cases the load/unload maneuver will be
taken as double parking instead. This event is not significantly different from the normal
parking maneuver. The specialty with load/unload maneuver is that; it takes place at a
specified location and it is an exercise of delivery vans and light trucks only. This
independent variable is taken as a dummy variable.
6. Number of lanes
The data set consists of one lane and two lane streets. Therefore, to capture the impact
that comes due to the increase in the number of lanes, this variable is introduced.
7. Shock wave effect
This variable is introduced to capture the effect of events in successive five minute time
interval. It is introduced as a dummy variable. This means that if any type of events happen
in the previous five minute interval it will be assigned 1 and 0 otherwise. All of the stretches
taken for this study are not longer than 120 meter. So the impact of the events will be
propagated to the adjacent blocks and subsequently to the next five minute interval. This
situation will be captured by the shock wave effect variable.
3.2.2.3 Expected Signs and Initial Hypothesis
From the entire description above, there follow some initial hypotheses which could be
tested with the analysis of the model. These hypotheses are:
1. With the increase of flow the space mean speed is expected to reduce. For this
reason the coefficient of flow is expected to be negative.
2. In the same manner when parking maneuvers happen the following vehicle always
gets slowed down. From this it will be obvious that the parking maneuver is
expected to have a negative coefficient.

Impact of Parking Maneuvers on Space Mean Speed
And Average Travel Time
26
3. As it is explained above usually the double parking events narrow the lane width and
block the bicycle lane. For this and other reasons drivers will be forced to chose a
much lower speed to drive safely in such streets. So double parking is also expected
to have a negative coefficient.
4. Normally the load/unload maneuvers are the same as the other maneuvers except
that they take place at a specified stretch of the street called Last Zone. Therefore,
this variable is also expected to have a negative coefficient.
5. In multi-lane streets when various events happen the following vehicle will have
enough space to escape from the disruption. For this and other reasons drivers will
have a bit higher speed in multi-lane streets. As the number of lanes increase drivers
choose higher speeds. Therefore, the number of lanes variable is expected to have a
positive coefficient.
6. As it was explained in the variable definition, the light truck and vans which double
park at any location along the street for the purpose of delivering goods to stores
and supermarkets fall under the category of double parking. These vehicles are
normally expected to have a higher reductive effect. The double parking variable is
expected to have a higher magnitude than the other variables.
7. Because the dependent variable is space mean speed the intercept is expected to
have a positive coefficient.
3.2.2.4 Semi Automated Vehicle Analysis (SAVA) Software
SAVA software is a video analysis tool that is used for this study. On SAVA it is possible to
measure the travel time and distance. The output from SAVA was used both in the micro
analysis and macro analysis.
Procedures in SAVA
Micro Analysis
- Always the first step when dealing with SAVA is configuring the coordinates. To do
these a known rectangular area is taken in the video. The dimensions and the
diagonal of the rectangle are calibrated. Doing so the software will understand all
the distances in the video. After the calibration it will be possible to measure
distance at any location in the video.
- After calibrating the coordinates virtual lines are drawn with 10 meter interval.
- The time in the software is synchronized with the real time in the video recording.
- The time stamp at every 10 meter interval will be recorded to a text file output by
the software.
Macro analysis
- The coordinates are configured in a similar manner as in the micro study.

Impact of Parking Maneuvers on Space Mean Speed
And Average Travel Time
27
- The time is also synchronized in the same way.
- Here the virtual lines are drawn at the entry and exit points. It is drawn at two
locations (at the start and end of the specified segment which is the interest of
study).
- The time stamp at the location was recorded for the vehicles of interest.
4 Description of Case Study (Data Analysis) Basically three case studies are carried out. As it was already mentioned in the
methodology part in Chapter 3, two approaches are used in this study: the Micro
analysis and the Macro analysis. In the former one, three case studies are carried out.
For the Macro study two different spots are used from each case study except the last
one. For all of the spots an eight and a half hour study period is selected.
4.1 Case Study One
In this case study, two street segments are studied; they are named as Fleminggatan site
one and Fleminggatan site two.
Fleminggatan site one is the street segment which is found between Inedalsgatan and
Polhemsgatan. This site has different activities and it incorporates special zones which are
dedicated to the parking activity of specific vehicles. These include the last zone which is
dedicated to only delivery vehicles and a restricted parking area for handicap cars. There is a
hospital in this area and there are also many stores which increase the road side activity.
The general road geometry is that it is a two lanes street which is situated between
signalized intersections. The lane width is 3.3 meters and it has a bicycle lane which is 1.5
meter wide and located between the parking lane and traffic. The parking lane is 2.6 meters
wide. On this street a 120 meter stretch was considered for the study. This site is one of the
streets which lead towards the city center and it is a relatively busy street with a higher
flow. On the road side of this street segment around 20 vehicles could be parked excluding
the Last Zone.

Impact of Parking Maneuvers on Space Mean Speed
And Average Travel Time
28
Figure 4.1 Karta of Fleminggatan site one Source: Google map

Impact of Parking Maneuvers on Space Mean Speed
And Average Travel Time
29
Figure 4.2: Road geometry of Fleminggatan site one

Impact of Parking Maneuvers on Space Mean Speed
And Average Travel Time
30
Fleminggatan site two is the segment which is found between Wargentinsgatan and Norra
Agenegatan. This site also has different activities. There is a last zone which is a reserved
area only for delivery trucks and vans.
The general road geometry is not somehow different from site one except that there exist
some differences; it is a two lane street which is situated between signalized intersections.
The lane width is 3.8 meters and it has a bicycle lane which is 1.5 meter wide and located
between the park and the traffic. The parking lane is 2.6 meters wide. On this street a 140
meter stretch was considered for the study. This site is one of the streets which are coming
from the city center and it is a relatively busy street with a higher flow. On the road side of
this street segment around 22 vehicles could be parked excluding the Last Zone.
Figure 4.3: Karta of Fleminggatan site two Source: Google map

Impact of Parking Maneuvers on Space Mean Speed
And Average Travel Time
31
Figure 4.4: Road geometry of Fleminggatan site two

Impact of Parking Maneuvers on Space Mean Speed
And Average Travel Time
32
4.2 Case study Two
In this case study, one street segment with a variable lane width is studied. A street segment
in Hornsgatan was studied. This segment is situated between Torkel Knutssonsgatan and
Timmermansgatan. The specialty of this segment is that it is one lane for the first half of the
stretch and the width increases significantly for the next half so that is will be considered as
a two lane street.
In this case study the first and second half of the street are dealt separately for the Macro
analysis. The first half which is the one lane part incorporates a last zone in which
load/unload activity will be carried out. This area is an active business area so that lots of
parking maneuvers happen. Due to the high demand of the parking space numerous double
parking events are visualized on the video.
The general road geometry is that the first half of the street is one lane street. And it is
situated past a traffic signal. The lane width is 3.0 meters and it has a bicycle lane which is
1.5 meter wide. The parking lane is 2.6 meters wide. A 55 meter segment was taken for the
one lane part of the study. The other half of the segment has an average width of 5.2
meters so that it can be considered as a two lane. Normally a street width more than 5
meters is considered as a two lane street. It has a bicycle lane and parking lane which are
continuations of the first half. This street has a moderate flow than the previous case study.
Figure 4.5: Karta of Hornsgatan Source: Google map

Impact of Parking Maneuvers on Space Mean Speed
And Average Travel Time
33
Figure 4.6: Road geometry of Hornsgatan

Impact of Parking Maneuvers on Space Mean Speed
And Average Travel Time
34
4.3 Case study Three
In this case study, a street segment which is found between Borgmästargatan and Ersta
Trappor is studied. This site has different activities and it incorporates special zones which
are dedicated to the parking activity of specific vehicles. These include the last zones which
are dedicated to only delivery vehicles where the load/unload activities take place.
The general road geometry is that it is a one lane street which is situated between signalized
intersection and a pedestrian priority intersection. The total carriage way width is 5.9
meters. Of this width 2.6 meter is dedicated to the parking vehicles. Therefore, the lane
width will be 3.3 meters and it has a bicycle lane which is 1.5 meter wide. Unlike all the
other case studies the bicycle lane is located between the parking lane and the pedestrian
side walk. For all the other case studies the bicycle lane is located between the traffic
stream and the parking lane. On this street a 110 meter stretch was considered for the
study. This site is one of the streets which lead towards the city center and it is a relatively
busy street with a higher flow.
Figure 4.7: Karta of Folkungagatan Source: Google map

Impact of Parking Maneuvers on Space Mean Speed
And Average Travel Time
35
Figure 4.8: Road geometry of Folkungagatan

Impact of Parking Maneuvers on Space Mean Speed
And Average Travel Time
36
5 Results and Discussion 5.1 Micro Analysis
In the Micro analysis the data reduction is not done in a time bound manner. Some of the
interesting events of the same kind are categorized together to see their impact. The
interference of some other disturbing factors than the events of interest was more
challenging to exclude.
5.1.1 Case Study One
Micro analysis for case study one was carried out in fleminggatan site one. This site was the most
challenging to get the data for this study. This street is highly busy and lots of maneuvers happen
though. The problem is the street is occupied by queuing vehicles for most of the time. It was
difficult to find vehicles which are affected only by a specified event of interest. Due to the fact that
the street is so narrow and also there exists a long queue that generates from the red traffic signal
simultaneous events happen most of the time. For this reason lots of vehicles were excluded from
the data set. The results listed for this case study are somewhat indicative but should not be
conclusive.
5.1.1.1 Free Flow Speed Trajectory
Figure 5.1: Average travel time trajectory for every 10 meter segment
0
2
4
6
8
10
12
0 20 40 60 80 100 120 140
Av
era
ge
tra
ve
l ti
me
(se
con
ds)
Space(meters)
Average Travel time Trajectory
Travel time

Impact of Parking Maneuvers on Space Mean Speed
And Average Travel Time
37
Figure 5.2: The space mean speed at every 10 meter space
The average travel time and space mean speed are tabulated below
space Average
travel time
speed
10 0.98352941 35.32548
20 2.04117647 36.28527
30 3.09411765 36.69526
40 3.94470588 42.05376
50 4.73882353 43.8492
60 5.65176471 41.85049
70 6.52705882 41.01211
80 7.42941176 40.8702
90 8.29882353 41.3971
100 9.17647059 40.99098
110 10.1082353 38.73615
120 11.1023529 38.07602
Table 5.1: Average travel time and space mean speed
The results above give the average of 33 travel time and space speed of vehicles which are
on a free flow condition. The graph for travel time appears to be perfectly linear. This tells
that the time that takes the vehicles to travel every 10 meter segment is nearly equal. From
Figure 5.1 above it can be seen that the space mean speed is around 40 km/h; it gets
progressively increasing to some distance and falls again. This is because of the fact that the
0
5
10
15
20
25
30
35
40
45
50
0 20 40 60 80 100 120 140
Sp
ace
me
an
sp
ee
d(K
m/h
r)
Space(meter)
Space MeanSpeed
speed

Impact of Parking Maneuvers on Space Mean Speed
And Average Travel Time
38
drivers come from a lower speed at the entry to the block and gets decelerated at the exit
of the street. In the graph it can also be seen that the vehicles attain the maximum driving
speed around half way the block and start decelerating. The average of the speeds at the 12
location is 39.76km/hr. So this can be taken as the free flow speed for this street.
5.1.1.2 Impact of Inbound Maneuvers
Figure 5.3: Average travel time trajectory for every 10 meter segment
The inbound maneuvers happen to shift the graph upper than the free flow condition. The
travel times are measured for 10 meter segments. The difference between the cumulated
travel times, which is the average travel time at the 120 meter space, will give us the delay
which comes due to the event; inbound maneuver in this case. As it was already explained
in the methodology in Chapter 3, in the micro analysis the vehicles which are affected only
with the inbound maneuver are considered. So these vehicles are typically affected by the
event of interest. From the above graph, the private cars have an average delay of around
3.2 seconds.
0
2
4
6
8
10
12
14
16
0 20 40 60 80 100 120 140
Av
ere
ag
e t
rav
el
tim
e(s
eco
nd
s)
Space(meter)
Impact of Inbound Manuevers on Travel Time
Free flowing cars
Private cars

Impact of Parking Maneuvers on Space Mean Speed
And Average Travel Time
39
Figure 5.4: The space mean speed at every 10 meter space
In Figure 5.4 above the private cars have an average speed lower than the free flow speed.
As presented earlier, the average free flow speed is 39.76 km/hr. And the average of the
space speed at the 12 locations happens to be 32.38km/hr for private cars when they are
affected by the inbound parking maneuver. The space speed plot for the inbounding event
affected vehicles happens to be in a harmonic way with the free flowing vehicles. As a result
the gap between the graph lines is mostly constant.
0
5
10
15
20
25
30
35
40
45
50
0 20 40 60 80 100 120 140
Sp
ace
me
an
Sp
ee
d(K
m/h
r)
Space(meter)
Impact of Inbound Manuevers on Speed
Free flowing cars
Private cars

Impact of Parking Maneuvers on Space Mean Speed
And Average Travel Time
40
5.1.1.3 Impact of Outbound Maneuvers
Figure 5.5: Average travel time trajectory for every 10 meter segment
As it can be seen from Figure 5.5 above, the outbound maneuvers happen to affect the
traffic in a same way as the inbound maneuver. As it was mentioned in the methodology
part in Chapter 3, out bounding vehicles take enough time to have a good gap acceptance.
This results in a lesser impact on the normal traffic. The average delay is around 4 second
for the private cars.
0
2
4
6
8
10
12
14
16
0 20 40 60 80 100 120 140
Av
era
ge
tra
ve
l ti
me
(se
con
ds)
Space(meter)
Impact of Outbound Manuevers on Travel Time
Free flowing cars
Private cars
Impact of Parking Maneuvers on Space Mean Speed
And Average Travel Time
41
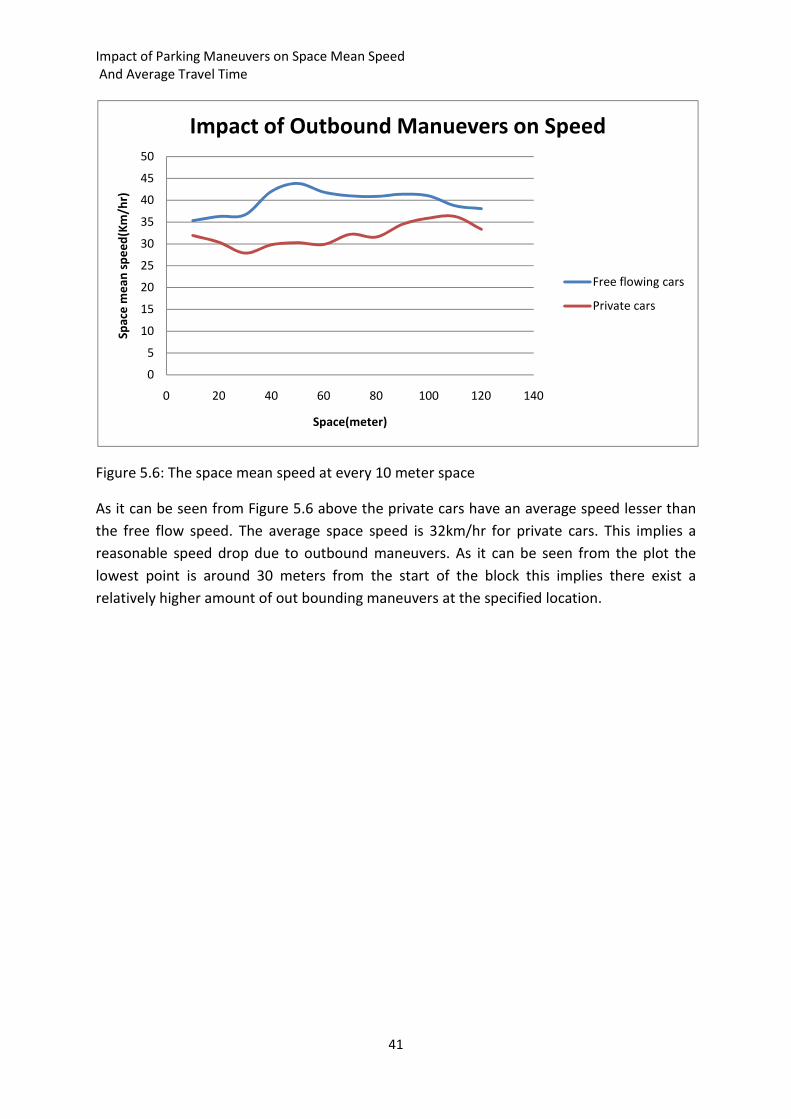
Figure 5.6: The space mean speed at every 10 meter space
As it can be seen from Figure 5.6 above the private cars have an average speed lesser than
the free flow speed. The average space speed is 32km/hr for private cars. This implies a
reasonable speed drop due to outbound maneuvers. As it can be seen from the plot the
lowest point is around 30 meters from the start of the block this implies there exist a
relatively higher amount of out bounding maneuvers at the specified location.
0
5
10
15
20
25
30
35
40
45
50
0 20 40 60 80 100 120 140
Sp
ace
me
an
sp
ee
d(K
m/h
r)
Space(meter)
Impact of Outbound Manuevers on Speed
Free flowing cars
Private cars

Impact of Parking Maneuvers on Space Mean Speed
And Average Travel Time
42
5.1.1.4 Impact of Double Parked Vehicles
Figure 5.7: Average travel time trajectory for every 10 meter segment
As it is shown in Figure 5.7 above, the travel time happens to be increased due to the
double parked vehicles. Thus, the vehicles will be delayed by 2seconds due to the double
parked vehicles. Normally, most of the double parking narrows the lane width. This will
result in a higher travel time of the vehicles because of the fact that they choose a safe
speed which is definitely lower than the normal free flowing speed.
0
2
4
6
8
10
12
14
0 20 40 60 80 100 120 140
Av
era
ge
tra
ve
l ti
me
(se
con
ds)
space(meter)
Impact of Double Parking on Travel Time
Free flowing cars
Private cars

Impact of Parking Maneuvers on Space Mean Speed
And Average Travel Time
43
Figure 5.8: The space mean speed at every 10 meter space
The space mean speed of the vehicles happens to be lower than the space mean speed of
the free flowing vehicles. The space mean speed for private cars is 35.74km/hr. The
difference happens to be a bit lower when it is compared with that of the inbound and
outbound maneuvers. When there is a double parked on the street the drivers choose lower
speed than the free flow speed because the lane will be narrowed. Besides this the bicycle
lane will also be blocked so that the bicycles also get mixed with traffic and the vehicles will
be affected.
0
5
10
15
20
25
30
35
40
45
50
0 20 40 60 80 100 120 140
Sp
ace
me
an
sp
ee
d(K
m/h
r)
Space(meter)
Impact of Double Parking on Speed
Free flowing cars
Private cars
Impact of Parking Maneuvers on Space Mean Speed
And Average Travel Time
44
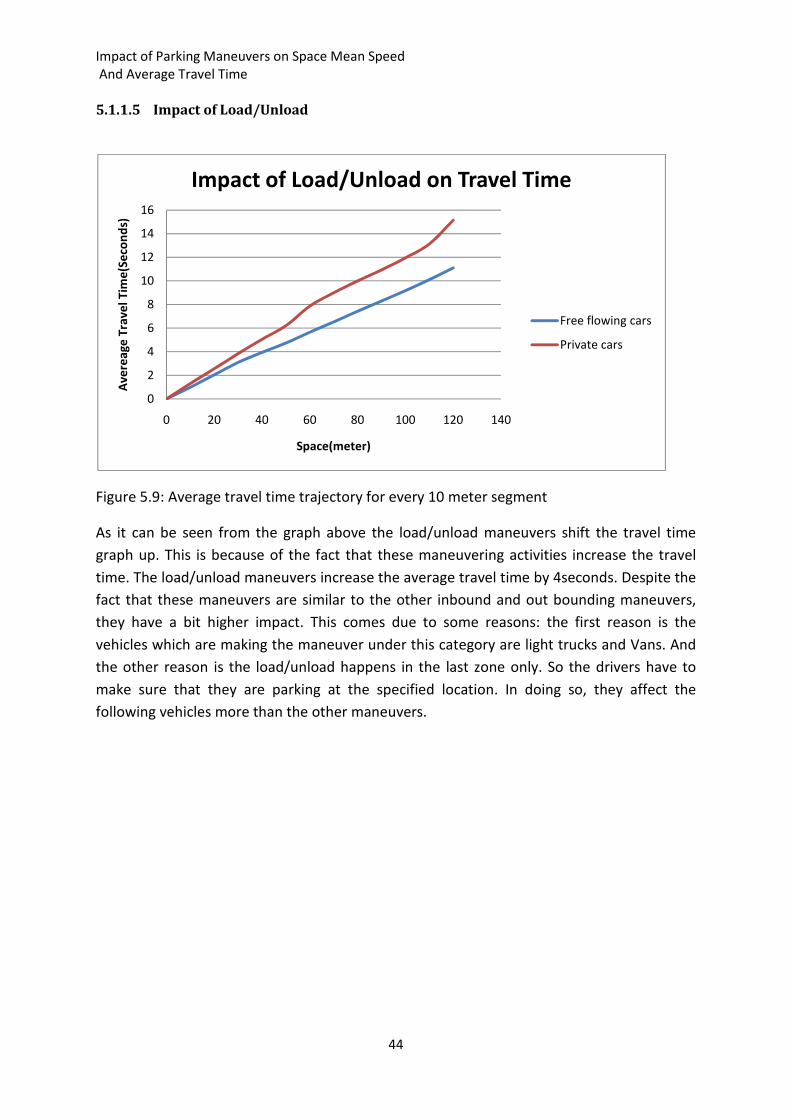
5.1.1.5 Impact of Load/Unload
Figure 5.9: Average travel time trajectory for every 10 meter segment
As it can be seen from the graph above the load/unload maneuvers shift the travel time
graph up. This is because of the fact that these maneuvering activities increase the travel
time. The load/unload maneuvers increase the average travel time by 4seconds. Despite the
fact that these maneuvers are similar to the other inbound and out bounding maneuvers,
they have a bit higher impact. This comes due to some reasons: the first reason is the
vehicles which are making the maneuver under this category are light trucks and Vans. And
the other reason is the load/unload happens in the last zone only. So the drivers have to
make sure that they are parking at the specified location. In doing so, they affect the
following vehicles more than the other maneuvers.
0
2
4
6
8
10
12
14
16
0 20 40 60 80 100 120 140
Av
ere
ag
e T
rav
el
Tim
e(S
eco
nd
s)
Space(meter)
Impact of Load/Unload on Travel Time
Free flowing cars
Private cars

Impact of Parking Maneuvers on Space Mean Speed
And Average Travel Time
45
Figure 5.10: The space mean speed at every 10 meter space
As is it seen in Figure 5.10 above, the space mean speed gets reduced with the load/unload
vehicles. The space mean speed with the presence of load/unload vehicles is 31.7km/hr.
This gives a significant speed reduction due to the load/unload vehicles. One significant
thing that can also be seen from this figure is that, at 60 meter distance the speed drops
significantly. On the road geometry, this location is where the last zone occurs. As it was
already mentioned the specialty of this maneuver is the entire maneuvers take place at a
specific location. Therefore the averages of all the impacts also manifest this fact.
0
5
10
15
20
25
30
35
40
45
50
0 20 40 60 80 100 120 140
Sp
ace
Me
an
Sp
ee
d(K
m/h
r)
Space(meter)
Impact of Load/Unload on Speed
Free flowing cars
Private cars

Impact of Parking Maneuvers on Space Mean Speed
And Average Travel Time
46
5.1.2 Case Study Two
The data for the Micro and Macro analysis of case study two is collected from Hornsgatan. This
street is also busy. As it was already mentioned on the description part this street is single lane with
a lane width of 3 meters and gets wider to 5.2 meters after half way and could be taken as a two
lane street per direction. This street is relatively good site for the study. The interference of red
traffic signal is relatively less. On top of this the number of simultaneous events is less so that it is
easy to take a specific event of interest without the interference of the other events. The draw back
with this site is that there is no last zone in the direction of study. In this site it was easy and enough
data was found to study the reverse inbounding maneuvers.
5.1.2.1 Free Flow Speed
Figure 5.11: Average travel time trajectory for every 10 meter segment
0
2
4
6
8
10
12
0 20 40 60 80 100 120 140
Av
era
ge
tra
ve
l ti
me
(se
con
ds)
Space(meter)
Avereage travel time
Avereage travel time

Impact of Parking Maneuvers on Space Mean Speed
And Average Travel Time
47
Figure 5.12: The space mean speed trajectory at every 10 meter space
Space Average
travel
time
Space mean
speed
0 0
10 0.956 39.11627113
20 1.852 41.38735078
30 2.716 42.48042168
40 3.518 45.99270783
50 4.32 44.60373067
60 5.142 45.39387671
70 5.964 44.42729233
80 6.764 44.7701295
90 7.648 41.35871816
100 8.574 39.97237216
110 9.56 37.63398698
120 10.544 37.41055392
Table 5.2: Average travel time and space mean speed
The result above gives the average cumulated travel time and space mean speed of 25
vehicles. The graph of travel time appears to be perfectly linear. This implies that the time
that every vehicle takes to cover all the 10 meter segments is nearly equal. From figure 5.2 it
can be seen that for most of the time the mean speed stays around 40 km/hr. But it a
similar pattern to case study one the vehicles start accelerating up to half way the block and
start to decelerate. The average of the 12 locations is 42km/hr.
0
5
10
15
20
25
30
35
40
45
50
0 20 40 60 80 100 120 140
Sp
ace
me
an
sp
ee
d(K
m/h
r)
Space(meter)
Space mean Speed
Space mean Speed

Impact of Parking Maneuvers on Space Mean Speed
And Average Travel Time
48
5.1.2.2 Impact of Inbound Maneuvers
Figure 5.13: Average travel time trajectory for every 10 meter segment
The inbound maneuvers happen to shift the graph to the upper left from the free flow
condition. The travel times were measured in the same way as case study one for every 10
meter intervals. The vertical difference at the 120 meter location is taken as delay due to
the event. As per this consideration the delay due to the inbound maneuver is calculated to
be 3.2seconds.
0
2
4
6
8
10
12
14
16
0 50 100 150
Av
era
ge
tra
ve
l ti
me
(se
con
ds)
space (meter)
Impact of Inbound manueveres on travel time
Free flow
Inbound manuever affected

Impact of Parking Maneuvers on Space Mean Speed
And Average Travel Time
49
Figure 5.14: The space mean speed trajectory at every 10 meter space
As it can be seen form Figure 5.14 above the graph for the vehicles affected by inbound
maneuvers lies below the graph for the free flow condition. One interesting fact that can be
seen from the graph is that in both cases the pattern is nearly similar. The gap between both
the graphs is nearly equal. The average of the space speed at the 12 locations is 34.07
km/hr. As it was explained above the average free flow speed is 42km/hr.
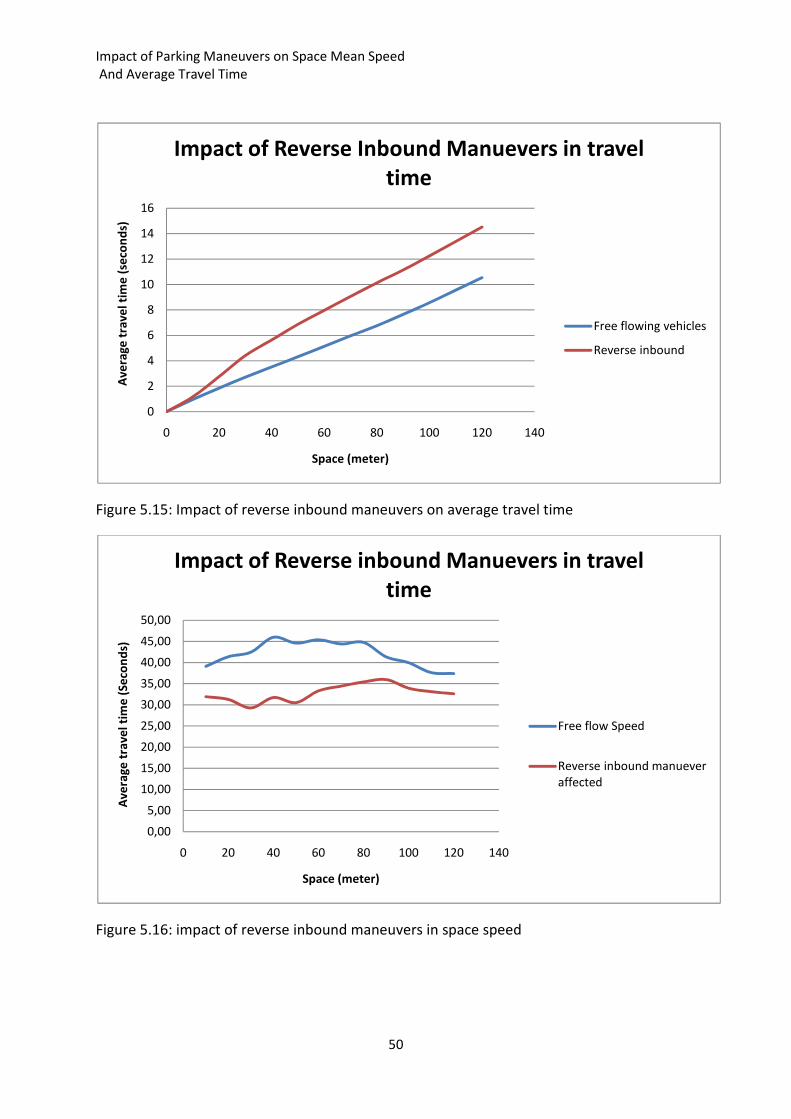
5.1.2.3 Impact of Reverse Inbound Maneuvers
Normally the reverse inbound maneuvers take more time than the front inbound
maneuvers. As it can be seen in the video the vehicles take aside and double park in the
bicycle lane till they find enough headway to make the maneuver. They have a bit higher
impact than the front inbounding maneuvers. The delay due to this event is about 4seconds.
In a similar way the space mean speed is also less than the case for front inbound
maneuvers. The space mean speed for this case is 32.80km/hr.
0,00
5,00
10,00
15,00
20,00
25,00
30,00
35,00
40,00
45,00
50,00
0 50 100 150
Sp
ace
me
an
sp
ee
d(
Km
/hr)
Space (meter)
Impact of Inbound Manuevers on speed
free flow speed
Inbound manuever affected
Impact of Parking Maneuvers on Space Mean Speed
And Average Travel Time
50
Figure 5.15: Impact of reverse inbound maneuvers on average travel time
Figure 5.16: impact of reverse inbound maneuvers in space speed
0
2
4
6
8
10
12
14
16
0 20 40 60 80 100 120 140
Av
era
ge
tra
ve
l ti
me
(se
con
ds)
Space (meter)
Impact of Reverse Inbound Manuevers in travel
time
Free flowing vehicles
Reverse inbound
0,00
5,00
10,00
15,00
20,00
25,00
30,00
35,00
40,00
45,00
50,00
0 20 40 60 80 100 120 140
Av
era
ge
tra
ve
l ti
me
(S
eco
nd
s)
Space (meter)
Impact of Reverse inbound Manuevers in travel
time
Free flow Speed
Reverse inbound manuever
affected
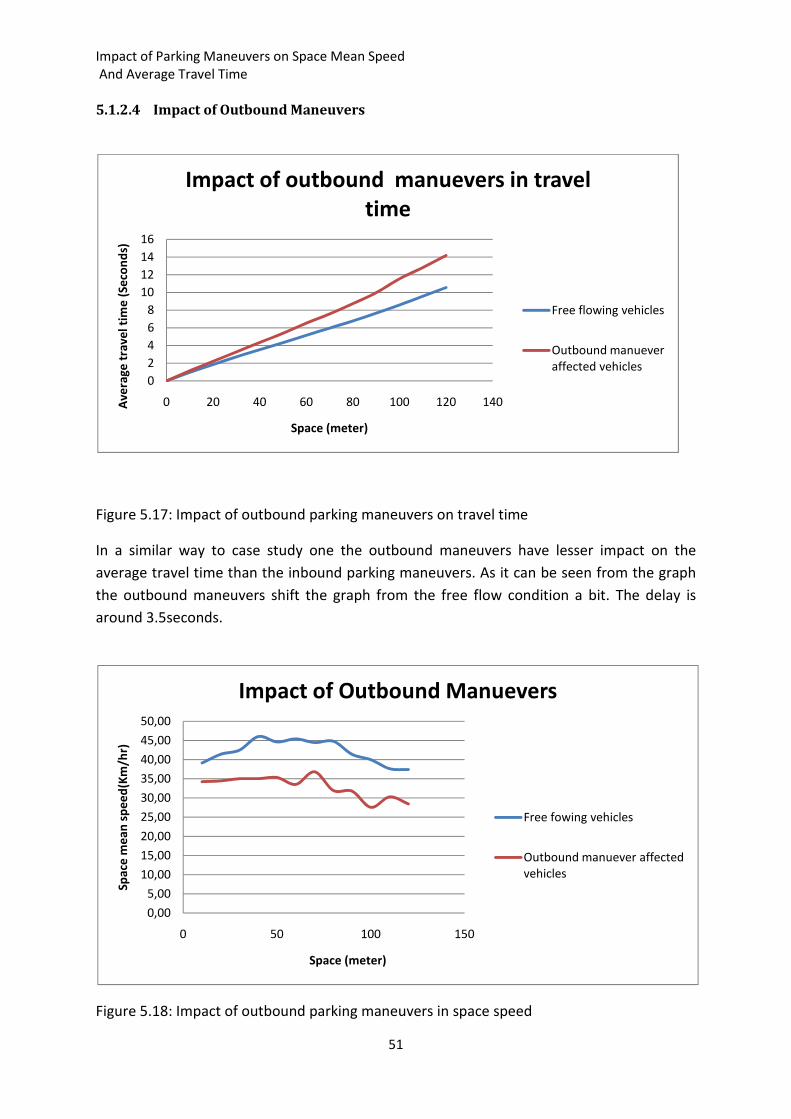
Impact of Parking Maneuvers on Space Mean Speed
And Average Travel Time
51
5.1.2.4 Impact of Outbound Maneuvers
Figure 5.17: Impact of outbound parking maneuvers on travel time
In a similar way to case study one the outbound maneuvers have lesser impact on the
average travel time than the inbound parking maneuvers. As it can be seen from the graph
the outbound maneuvers shift the graph from the free flow condition a bit. The delay is
around 3.5seconds.
Figure 5.18: Impact of outbound parking maneuvers in space speed
0
2
4
6
8
10
12
14
16
0 20 40 60 80 100 120 140Av
era
ge
tra
ve
l ti
me
(S
eco
nd
s)
Space (meter)
Impact of outbound manuevers in travel
time
Free flowing vehicles
Outbound manuever
affected vehicles
0,00
5,00
10,00
15,00
20,00
25,00
30,00
35,00
40,00
45,00
50,00
0 50 100 150
Sp
ace
me
an
sp
ee
d(K
m/h
r)
Space (meter)
Impact of Outbound Manuevers
Free fowing vehicles
Outbound manuever affected
vehicles

Impact of Parking Maneuvers on Space Mean Speed
And Average Travel Time
52
As it can be seen Figure 5.18 above the average space speed of the vehicles affected by the
outbound parking maneuvers happens to lie below the free flow condition. And they are
more or less following the same pattern. The average of the 12 observation is 32.87km/hr.
This speed reduction is less than the one caused by the inbounding parking maneuvers.
5.1.2.5 Impact of Double Parking
Figure 5.19: Impact of double parking on average travel time
As it can be seen from figure 5.19 above, the curve is shifted to the upper left. The double
parking events increase the average travel time of the street. The average delay due to
these events is around 4seconds.
0
2
4
6
8
10
12
14
16
0 20 40 60 80 100 120 140
Av
era
ge
tra
ve
l ti
me
(se
con
ds)
Space (meter)
Impact of double parking on travel time
Free flowing vehicles
Double parking affected
vehicles

Impact of Parking Maneuvers on Space Mean Speed
And Average Travel Time
53
Figure 5.20: Impact of double parking on space mean speed
As can be seen from figure 5.20, the space mean speed line for vehicles is affected by
double parking lies below the free flow line. Throughout the stretch the shift is almost
constant. And like the other mentioned events, the line follow almost similar pattern.
Almost around half way the block the vehicles attain the peak speed. The average of the 12
points is 31.6km/hr. In a similar manner to the case study one the double parking happens
to have significant effect than all the other events.
0,00
5,00
10,00
15,00
20,00
25,00
30,00
35,00
40,00
45,00
50,00
0 20 40 60 80 100 120 140
Sp
ace
me
an
sp
ee
d (
Km
/hr)
space (meter)
Impact of Double parking on space mean speed
Free flowing Vehicles
Double parking affected
vehicles

Impact of Parking Maneuvers on Space Mean Speed
And Average Travel Time
54
5.1.3 Case Study Three
The data for the Micro and Macro analysis of case study three is collected from Folkungagatan. This
street is also busy. This street is also a way for number of bus lines including the blue line. As it was
already mentioned on the description part this street is single lane with a lane width of 3.3meters.
This street is also good site for the study. The interference of red traffic signal is relatively less. The
number of simultaneous events is less so that it is easy to take a specific event of interest without
the interference of the other events. The specialty of this site is the bicycle lane is located between
the outermost lane on which the vehicles make on-street parking and the pedestrians walk way. For
this reason the drivers barley make double parking on this site. Therefore, enough data was not
found for the analysis of the impact of double parking on this site.
5.1.3.1 Free Flow Speed
Figure 5.21: Average travel time trajectory for every 10 meter segment
0
2
4
6
8
10
12
0 20 40 60 80 100 120
Av
ere
ag
e t
rav
el
tim
e(s
eco
nd
s)
Space(meter)
Avereage Travel time
Avereage travel time

Impact of Parking Maneuvers on Space Mean Speed
And Average Travel Time
55
Figure 5.22: The space mean speed at every 10 meter space
space Average
Travel
time
Speed
10 0.956 36.61414
20 1.852 39.22082
30 2.716 40.25884
40 3.518 40.22515
50 4.32 41.53121
60 5.142 41.44147
70 5.964 42.57149
80 6.764 42.93759
90 7.648 43.99609
100 8.574 43.95564
110 9.56 39.8731
Table 5.3: Average travel time and space mean speed
The results above give the average of travel time and space mean speed of 27 vehicles
which are on a free flow condition. The graph for travel time appears to be perfectly linear.
This tells that the time that takes the vehicles to travel every 10 meter segment is nearly
equal. From Figure 5.22 above it can be seen that the space mean speed is around 41 km/h;
0
5
10
15
20
25
30
35
40
45
50
0 20 40 60 80 100 120
Sp
ace
me
an
Sp
ee
d(K
m/h
r)
Space(meter)
Space mean Speed
Space mean speed

Impact of Parking Maneuvers on Space Mean Speed
And Average Travel Time
56
it gets progressively increasing to some distance and falls again. This is because of the fact
that the drivers come from a lower speed at the entry to the block and gets decelerated at
the exit of the street. In the graph it can also be seen that the vehicles attain the maximum
driving speed around half way the block and start decelerating.
5.1.3.2 Impact of Inbound Maneuvers
Figure 5.23: Average travel time trajectory for every 10 meter segment
The inbound maneuvers happen to shift the graph to the upper left from the free flow
condition. The travel times were measured in the same way as case study one and case two
for every 10 meter intervals. The vertical difference at the 110 meter location is taken as
delay due to the event. As per this consideration the delay due to the inbound maneuver is
calculated to be 3seconds.
0
2
4
6
8
10
12
14
0 20 40 60 80 100 120
Av
ere
ag
e t
rav
el
tim
e(s
eco
nd
s)
Space(meter)
Impact of Inbound Manuevers on Travel Time
Free flowing cars
Private cars

Impact of Parking Maneuvers on Space Mean Speed
And Average Travel Time
57
Figure 5.24: The space mean speed trajectory at every 10 meter space
As it can be seen form Figure 5.24 above the graph for the vehicles affected by inbound
maneuvers lies below the graph for the free flow condition. One interesting fact that can be
seen from the graph is that in both cases the pattern is nearly similar. The gap between both
the graphs is nearly equal. The average of the space speed at the 11 locations is 33.06
km/hr. As it was explained above the average free flow speed is 41km/hr.
5.1.3.3 Impact of Reverse Inbound Maneuvers
Normally the reverse inbound maneuvers take more time than the front inbound
maneuvers. As it can be seen in the video the vehicles take aside and double park in the
bicycle lane till they find enough headway to make the maneuver. They have a bit higher
impact than the front inbounding maneuvers. The delay due to this event is about
3.5seconds. In a similar way the space mean speed is also less than the case for front
inbound maneuvers. The space mean speed for this case is 33.4km/hr.
0
5
10
15
20
25
30
35
40
45
50
0 20 40 60 80 100 120
Sp
ace
me
an
Sp
ee
d(K
m/h
r)
Space(meter)
Impact of Inbound Manuevers on Speed
Free flowing cars
Private cars

Impact of Parking Maneuvers on Space Mean Speed
And Average Travel Time
58
Figure 5.25: Impact of reverse inbound maneuvers on average travel time
Figure 5.26: impact of reverse inbound maneuvers in space speed
0
2
4
6
8
10
12
14
16
0 20 40 60 80 100 120
Av
ere
ag
e t
rav
el
tim
e(s
eco
nd
s)
Space(meter)
Impact of Reverse Inbound Manuevers in
travel time
Free flowing cars
Private cars
0
5
10
15
20
25
30
35
40
45
50
0 20 40 60 80 100 120
Sp
ace
me
an
Sp
ee
d(K
m/h
r)
Space(meter)
Impact of Inbound Manuevers on Speed
Free flowing cars
Private cars

Impact of Parking Maneuvers on Space Mean Speed
And Average Travel Time
59
5.1.3.4 Impact of Outbound Maneuvers
Figure 5.27: Impact of outbound parking maneuvers on travel time
In a similar way to case study one the outbound maneuvers have lesser impact on the
average travel time than the inbound parking maneuvers. As it can be seen from the graph
the outbound maneuvers shift the graph from the free flow condition a bit. The delay is
around 3seconds.
0
2
4
6
8
10
12
14
0 20 40 60 80 100 120
Av
era
ge
tra
ve
lti
me
(se
con
ds)
Space(meter)
Impact of Outbound Manuevers on Travel
Time
Free flowing cars
Private cars

Impact of Parking Maneuvers on Space Mean Speed
And Average Travel Time
60
Figure 5.28: Impact of outbound parking maneuvers in space speed
As it can be seen Figure 5.28 above the average space speed of the vehicles affected by the
outbound parking maneuvers happens to lie below the free flow condition. And they are
more or less following the same pattern. The average of the 11 observation is 33.80km/hr.
This speed reduction is less than the one caused by the inbounding parking maneuvers.
5.1.3.5 Impact of Load/Unload
Figure 5.29: Average travel time trajectory for every 10 meter segment
0
5
10
15
20
25
30
35
40
45
50
0 20 40 60 80 100 120
Sp
ace
me
an
sp
ee
d(K
m/h
r)
Space(meter)
Impact of Outbound Manuevers on Speed
Free flowing cars
Private cars
0
2
4
6
8
10
12
14
16
18
0 20 40 60 80 100 120
Av
ere
ag
e T
rav
el
Tim
e(S
eco
nd
s)
Space(meter)
Impact of Load/Unload on Travel Time
Free flowing cars
Private cars

Impact of Parking Maneuvers on Space Mean Speed
And Average Travel Time
61
As it can be seen from the graph above the load/unload maneuvers shift the travel time
graph up. This is because of the fact that these maneuvering activities increase the travel
time. The load/unload maneuvers increase the average travel time by 6.5seconds. Despite
the fact that these maneuvers are similar to the other inbound and out bounding
maneuvers, they have a higher impact in this case study. This comes due to some reasons:
the first reason is the vehicles which are making the maneuver under this category are
heavy trucks and Vans. And the other reason is the load/unload happens in the last zone
only. So the drivers have to make sure that they are parking at the specified location. In
doing so, they affect the following vehicles more than the other maneuvers. On top of this
the percentage of tracks which make the load/unload maneuver in this site is higher and
there exist two last zones.
Figure 5.30: The space mean speed at every 10 meter space
As is it seen in Figure 5.30 above, the space mean speed gets reduced with the load/unload
vehicles. The space mean speed with the presence of load/unload vehicles is 27.65 km/hr.
This gives a significant speed reduction due to the load/unload vehicles. One significant
thing that can also be seen from this figure is that, at 40 meter distance the speed drops
significantly. And at the 90 meter distance also the speed drops for the same reason. On the
road geometry, these locations are where the last zones occur. As it was already mentioned
the specialty of this maneuver is the entire maneuvers take place at a specific location.
Therefore the averages of all the impacts also manifest this fact.
0
5
10
15
20
25
30
35
40
45
50
0 20 40 60 80 100 120
Sp
ace
Me
an
Sp
ee
d(K
m/h
r)
Space(meter)
Impact of Load/Unload on Speed
Free flowing cars
Private cars

Impact of Parking Maneuvers on Space Mean Speed
And Average Travel Time
62
5.2 Macro Analysis
5.2.1 Evaluation of the Regression Analysis
SUMMARY OUTPUT
Regression Statistics
Multiple R 0.72207357
R Square 0.52139025
Adjusted R
Square
0.51533189
Standard Error 6.85785578
Observations 481
ANOVA
df SS MS F Significance F
Regression 6 24284.90412 4047.5 86.061 1.11493E-72
Residual 474 22292.30809 47.03
Total 480 46577.21221
Coefficients Standard
Error
t Stat P-value Lower 95% Upper 95%
Intercept 28.1415368 1.889784371 14.891 2E-41 24.42814589 31.85492771
Flow -0.0920736 0.028586033 -3.221 0.0014 -
0.148244628
-0.03590259
Parking
maneuver
-1.8119706 0.256809859 -7.056 6E-12 -
2.316597189
-
1.307344056
double
parking
-6.7303815 0.898768213 -7.488 3E-13 -8.49644418 -
4.964318751
load/unload
maneuvers
-2.8149148 1.078568394 -2.61 0.0093 -4.93428154 -0.69554813
no. Of lanes 13.5044132 0.823861342 16.392 4E-48 11.88554113 15.12328536
Shock wave
effect
-1.5032005 0.731700258 -2.054 0.0405 -
2.940977815
-
0.065423193
Table 5.3: Results of the regression analysis
According to the summary above, flow reduces the speed by 0.09. Similarly the parking
maneuvers, which comprise the front inbound, the reverse inbound and the out bound,
reduce the average speed by 1.81 km/hr. The double parking condition also reduces the
average speed by 6.73 km/hr. Similarly the load/unload maneuvers which are special
maneuvers at a specified location will also reduce the space mean speed by 2.82km/hr. On
the contrary the number of lanes increases the speed by 13.5Km/hr.

Impact of Parking Maneuvers on Space Mean Speed
And Average Travel Time
63
5.2.2 Evaluation of the Initial Hypotheses
According to the initial hypotheses:
1. The sign of flow, maneuvers, double parking and load/unload maneuvers are
expected to be negative. As it can be seen on the model all the mentioned variables
have a negative coefficient. This validates the initial hypothesis.
2. The sign of number of lanes was expected to be positive. As it can be seen on the
model those variables have a positive coefficient.
3. The coefficient of double parking was expected to be significantly higher than the
parking maneuvers and load /unload maneuvers. And the result affirms this
hypothesis.
4. As per the expectation the intercept has a positive sign.
Besides the initial assumptions there are some statistical parameters which indicate the
goodness of a model developed. One of these tests is t-statistics. According to Wikipedia, t-
statistics is a ratio of the departure of an estimated parameter from its notional value and
it’s standard error. It is used in hypothesis testing. Normally, the analysis was done with a
95% confidence interval. Therefore, the expected minimum t-stat value is ±1.95. Referring
to table 5.3, all the values are above the mentioned minimum value. And the corresponding
p-values are below 0.05.

Impact of Parking Maneuvers on Space Mean Speed
And Average Travel Time
64
Mean 35.94765331
Standard Error 0.449152259
Median 35.69321534
Mode #N/A
Standard
Deviation
9.850678087
Sample Variance 97.03585877
Kurtosis -0.297609726
Skewness 0.180871454
Range 47.70573139
Minimum 11.52409746
Maximum 59.22982885
Sum 17290.82124
Count 481
Table 5.4: Table for descriptive statistics
In most literatures there are some assumptions which lie behind a regression analysis. Some
of these assumptions are:
a. The distribution of the dependent variable should be Normal. There are various ways
to check the normality of a distribution; Jermy Miles and Mark Shevline put some
requirements on their book titled Applying Regression & Correlation; If the value of
skewness and kurtosis (only the magnitude) is greater than twice the standard error,
then the distribution is significantly different from normal distribution. The other
condition they put is that if the skewness statistic is less than 1 there should be low
problem. If the skewness is greater than 1 but less than 2, it should be emphasized
that there will be an effect on the parameter estimates, but it is probably ok. And
lastly if it is greater than 2, we should be concerned. As it can be seen from the
above descriptive statistics table the skewness and kurtosis are 0.1809 and -0.2976
respectively. And ignoring the signs, both these values are less than 1 and they are
also less than twice the standard error which is 0.9. Due to these facts it can be said
that the distribution of the dependent variables is Normal.
b. The other assumption is linearity. In a bivariate situation, the relationship between
the dependent and the independent variables should be linear. In a multivariate case
the value of the R2 is a good indication of the linearity. A value of R
2 very close to 1
indicates that we can make a very accurate (almost precise) prediction. But in
transportation studies it is always a big challenge to capture the impact of different
parameters. In addition to those variables which we assumed to affect the traffic
some other hidden factors could influence the analysis. This will sometimes result in
a deviated output. Due to those mentioned and other reasons an R2 value closely
near to 1 is not easy to attain. As it is given in the table above the R2 for this study is
0.52. There are 481 observations which could give enough variation.

Impact of Parking Maneuvers on Space Mean Speed
And Average Travel Time
65
c. The other assumption is homoscedasticity; the variance at every set of values for
independent variable is equal. The overall variance of the data was evaluated and
found to be more or less homoscedastic.
d. One of the assumptions is that there should be no correlation among the
independent variables. In most studies this assumption is the most difficult to
capture. Sometimes this assumption could be violated without any significant harm.
Most statistical software packages generate the correlation values.
speed Flow Parking
maneuver
double
parking
load/unload
maneuvers
no. Of
lanes
Shock
wave
effect
speed 1
Flow -0.2508 1
Parking
maneuver
-0.3609 0.0809 1
double parking -0.1478 0.0039 -0.03794 1
load/unload
maneuvers
-0.2197 0.0023 0.090865 0.034334 1
no. Of lanes 0.6068 -0.221 -0.19476 0.184765 -0.1717816 1
Shock wave
effect
-0.2126 0.02 0.178716 0.1557 0.1214420 -0.093 1
Table 5.5: Correlation
As it can seen from the above table most of the values are close to Zero except the
correlation between no. of lanes and speed. Normally this condition is a very challenging
phenomenon is many regression studies. It was tried to reduce the correlation, but it is not
easy to remove it.
But generally speaking, it can be said that the data used for the study is in a good shape.

Impact of Parking Maneuvers on Space Mean Speed
And Average Travel Time
66
6 Discussion In most of the studies impact of the presence of parked vehicles on the driving speed is analyzed.
But in this thesis work the impact of each category of parking maneuver and double parked vehicles
is studied. The result from both the micro and macro analysis of this study and the results from
different literatures are compared under this section.
According to Ibeas-Portilla, A._et_al (2009), there will be an increase in average journey time
up to by 15, 24 and 39% for 10, 20 and 30 maneuvers per hour respectively. And a reduction
in capacity of 6, 10 and 16% for maneuvers of 10, 20 and 30 per hour respectively.
According to Aronsson(2006) the presence of on-street parking has negative impact on the
space mean speed by (-5.54Km/hr). In a similar study by Nordström (2006) taking into
account mixed traffic in the city centers and applying linear regression model to estimate
the space mean speed as dependant variable the presence of on-street parking was found
to reduce the average speed by 3km/h. In both of these studies the intercept, which is the
free flow speed was found to be 40 and 45.
According to Wang et al (2006) the presence of on-street parking reduces the speed by 3.19
miles/h and the intercept in this case is 32.
With another approach Tivector(2009) studied the influence of on-street parking on the
average speed of urban street. On the study the streets were evaluated for one-sided and
two-sided on-street parking. For two-sided parking the speed reduction is 8.9km/h while for
one-sided it is 4.5km/h. And the intercept is 39.
The result from the three case studies of the micro analysis is tabulated below. In case study
one the number of reverse maneuvers is so less that it was not possible to get enough data
for the analysis. In the site selected for case study two there is no last zone. Therefore, the
load/unload maneuver for this case study is not included. In the last case study the position
of the bicycle lane is different from the other two case studies. It is situated between the
parking lane and the pedestrian sidewalk way. So the drivers barley double park in this site
and it was not possible to get enough data for the analysis of double parking.
Case study
one
Case study
two
Case study
three
Free flow 39.76 42 41
Inbound 32.38 34.07 33.06
reverse
inbound
- 32.8 33.4
Out bound 32 32.87 33.8
Double
Parking
35.74 31.6 -
Load/Unload 31.7 - 27.65
Table 6.1: The speed at different events

Impact of Parking Maneuvers on Space Mean Speed
And Average Travel Time
67
In the macro analysis, the free flow speed from the model is 41.6Km/hr. The speed
reductions from the parking maneuvers and double parking are 2Km/hr and 7Km/hr
respectively. In the same study the load/unload maneuvers caused a speed reduction of
3Km/hr.
7 Conclusions Many conclusions could be drawn from this study. But to put it in general words
parking maneuver is one of the numerous events that affect the traffic movement. In
relation to this event lots of disruptions could follow. According to this study the
maneuvers give rise to a speed reduction of almost 2Km/hr and double parking 7km/hr.
The load/unload maneuvers reduce the speed by 3Km/hr. This is a significant reduction.
In the course of this action deceleration and reacceleration will be experienced by many
vehicles which will lead to the release of more carbon dioxide and other gases to the
environment. This will have a significant environmental effect. Even though the aim of
this study is not accessing the environmental impact of parking maneuvers, it can be
taken as a lateral concern. Besides this due to the maneuvers the vehicles get delayed
on the average by 3 seconds. This delay is calculated in one block of the street due to a
single event. So for a reasonably long stretch there will be a significantly long delay. If
this delayed time is changed to monetary unit by calculating it with the value of time, it
will be a significant amount of road user cost. Therefore, implementing better parking
management strategies will help in saving the user cost.
The other point captured from this study is that the higher impact came from the
double parked vehicles, so providing alternative parking lots for the long duration
parking vehicles and permitting on-street parking only for short duration and delivery
vehicles could improve the performance of the street.
In the analysis it was also observed that among the inbound maneuvers the reverse
inbound maneuver happens to affect slightly more than the front inbound maneuvers.
And the out bounding maneuvers have a bit lesser impact than the other maneuvers.
The speed model developed is,
� � 28.14 � 0.09 � � 1.81 � � 6.73 �� � 2.81 � ! � 1.5 #$ % 13.5 �&
Where,
� = Space speed

Impact of Parking Maneuvers on Space Mean Speed
And Average Travel Time
68
� = low
� = maneuvers
�� =double parking
� ! =load and unload
#$ �Shock wave effect
�&=number of lanes
From this model it can be seen that flow, maneuvers, double parking, the shock wave
effect and load/ unload have reductive effect with different magnitudes on the space
speed while number of lanes has an increasing effect. The free flow speed of this model
is calculated by keeping all the parameters zero and the number of lanes one. And it is
calculated to be 41Km/hr.
8 Further Study The subject matter which was tried to be covered by this study is so vast. It is not an
easy exercise to evaluate the impact of parking events only with this study. Due to the
limitation of time and data some interesting areas were not covered by this study.
The impact of parking maneuvers and double parking was studied only on the free
flowing vehicles. When there is a double parked vehicle, usually follows a queue which
originates from the double parked point. This phenomenon is called bottle neck. This
will lead to a bunching effect. The bunching vehicles could also be the focus of a study.
As it can be recognized from the moments the presence of bicycle lane helped in
reducing the impact the parking maneuver. Analyzing the impact of bicycle lanes in the
parking maneuver could also be other interesting area of study.
The sites selected are also routs of different buses which are part of the public transport
system. As it was mentioned in the introduction part of this study proper planning of the
parking activity will also help in the reliability of the transit system. So the impact of the
parking maneuvers could also be studied in relation to the public transport system.

Impact of Parking Maneuvers on Space Mean Speed
And Average Travel Time
69
9 Bibliography Childs, M.C (1999), Parking Spaces. A Design, Implementation and Use Manual for
Architects, Planners and Engineers. McGraw-Hill, US
Bång, K.L (1995), Highway Capacity Manual for Asian conditions. The first conference of
Eastern Asia Society for Transport Studies (EASTS). Manila, Philippines.
Bång, K.L (1995), Impact of side friction on speed-flow relationship for rural and urban
highways. SWEROAD, Indonesia.
Marsden, G.R (2006), The evidence base on parking policies-a review. Transport policy,
13(69, pp 447-457
Sisiopiko, V.p., Byrd, J.& Chittoor, A. (2007) Application of Level of Service Method for
the Evaluation of pedestrian Facilities, Paper No. 07-3150, TRB.
Highway Capacity Manual HCM 2010, Urban Street Segments-Chapter 17, National
cooperative Highway Research program, TRB. (Not published)
Ibeas-Portilla, A.el al(2009), Alonso-Orena, B.,Moura-Berodia, J.L, Ruisansanchez/Diaz,
F.J, Using M/M/∞ Queueing Model in On/Street parking Maneuvers, journal of
Transport Engineering, Volume 135, Issue 8, pp 527-535 (August 2009).
Shoup, D.C. (2006), Cruising for parking. Transport policy 13(2006) 479-486. ELSEVIER.
Aronsson, K.F.M (2006), Speed characteristics of urban streets based on driver behavior
studies and simulation. Doctorial Thesis in Infrastructure, Kungliga Tekniska Högskola,
Stockholm, Sweden.
Tivector AB(2009), Självförklarande gator-en pilotstudie. Rapport 2009:38 Version 1.0
AvSamprit Chatterjee, Ali S.Hadi (2006) Regression analysis by example
Marcel Buffat, (August 19, 2010) Perception of Urban Parking Problems, A survey among
parking experts in France (Maters Thesis)
Ibrahim Tunde Yusuf, Journal of American Science, 2010;6(12) The Factors For Free Flow
Speed On Urban Arterials – Empirical Evidences From Nigeria
Jermy Miles and Mark Shevline (2008) Applying Regression & Correlation, A Guide for
Students and Researchers.
Nordström, A.(2006), Hastighets-flödessamband för gator I tätortsmiljiö, Examenarbete,
Kungliga Tekniska Högskola, Stockholm, Sweden

Impact of Parking Maneuvers on Space Mean Speed
And Average Travel Time
70

Impact of Parking Maneuvers on Space Mean Speed
And Average Travel Time
71
Appendix 1: Table used for the Micro Analysis
Appendix 1.1: Table used for Case Study one
Appendix 1.1.1: Table used for the front inbound maneuver
Space Free flow
cum.
Travel time
Cum.
Average
travel time
Free flow
space mean
speed
Space
mean
speed
0 0 0
10 0.98352941 1.14 35.32547523 30.1907644
20 2.04117647 2.432 36.28526721 29.9002242
30 3.09411765 3.788 36.69525567 28.7736225
40 3.94470588 5.008 42.05375604 29.9278666
50 4.73882353 6.172 43.84919601 33.4890026
60 5.65176471 7.5 41.85048631 31.1393745
70 6.52705882 8.712 41.01211129 32.447172
80 7.42941176 9.952 40.87019818 33.2208273
90 8.29882353 11.056 41.39709782 34.7176063
100 9.17647059 12.076 40.99097577 36.4839776
110 10.1082353 13.204 38.73614957 33.6664156
120 11.1023529 14.352 38.07602464 34.5760205
Appendix1.1.2: Table used for out bound maneuver
Space Free flow
cum. Travel
time
Cum.
Average
travel time
Free flow
space mean
speed
Space
mean
speed
0 0 0
10 0.983529412 1.07 35.32547523 31.93384
20 2.041176471 2.34 36.28526721 30.36482
30 3.094117647 3.82 36.69525567 27.8778
40 3.944705882 5.43 42.05375604 29.79866
50 4.738823529 6.83 43.84919601 30.26248
60 5.651764706 8.32 41.85048631 29.88255
70 6.527058824 9.58 41.01211129 32.19764
80 7.429411765 10.83 40.87019818 31.57773
90 8.298823529 11.89 41.39709782 34.52105
100 9.176470588 12.9 40.99097577 35.91683
110 10.10823529 13.91 38.73614957 36.29123
120 11.10235294 15.08 38.07602464 33.34321

Impact of Parking Maneuvers on Space Mean Speed
And Average Travel Time
72
Appendix1.1.3: Table used for Double parking
Space Free flow
cum. Travel
time
Cum.
Average
travel
time
Free flow
space
mean
speed
Space
mean
speed
0 0 0
10 0.983529412 1.328 35.3254752 26.4937559
20 2.041176471 2.7 36.2852672 26.9104501
30 3.094117647 4.008 36.6952557 28.5736425
40 3.944705882 5.12 42.053756 32.1360663
50 4.738823529 6.172 43.849196 34.5734059
60 5.651764706 7.288 41.8504863 33.8147609
70 6.527058824 8.308 41.0121113 35.8123494
80 7.429411765 9.32 40.8701982 35.7687102
90 8.298823529 10.268 41.3970978 37.7927376
100 9.176470588 11.208 40.9909758 38.1090434
110 10.10823529 12.216 38.7361496 35.5115947
120 11.10235294 13.128 38.0760246 38.9373246
Appendix1.1.4: Table used for the Load/unload maneuver
Space Free flow
cum. Travel
time
Cum.
Average
travel time
Free flow
space mean
speed
Space mean
speed
0 0 0
10 0.983529412 1.306666667 35.32547523 26.36018371
20 2.041176471 2.56 36.28526721 30.04223805
30 3.094117647 3.84 36.69525567 29.77941176
40 3.944705882 5.053333333 42.05375604 29.55555556
50 4.738823529 6.213333333 43.84919601 32.47363636
60 5.651764706 7.866666667 41.85048631 28.64166667
70 6.527058824 9 41.01211129 32.36199095
80 7.429411765 10 40.87019818 36.83333333
90 8.298823529 10.93333333 41.39709782 38.6798419
100 9.176470588 11.96 40.99097577 35.38830585
110 10.10823529 13.13333333 38.73614957 32.19230769
120 11.10235294 15.14666667 38.07602464 27.95609962

Impact of Parking Maneuvers on Space Mean Speed
And Average Travel Time
73
Appendix 1.2: Table used for Case Study two
Appendix 1.2.1: Table used for the front inbound maneuver
Space Free flow
cumulative
Time
Cum. Avg
travel time
Free flow
Space
mean
speed
Space
mean
speed
0 0 0
10 0.956 1.34 39.12 28.88
20 1.852 2.56 41.39 31.44
30 2.716 3.73 42.48 32.82
40 3.518 4.78 45.99 36.16
50 4.32 5.82 44.60 35.40
60 5.142 6.81 45.39 38.95
70 5.964 7.84 44.43 36.10
80 6.764 8.92 44.77 35.89
90 7.648 9.99 41.36 34.58
100 8.574 11.32 39.97 31.10
110 9.56 12.35 37.63 35.81
120 10.544 13.57 37.41 31.73
Appendix 1.2.2: Table used for the reverse inbound maneuver
Space Free flow
cumulative
Time
Cum. Avg
travel time
Free flow
Space mean
speed
Space mean
speed
0 0 0
10 0.96 1.17 39.12 31.94
20 1.85 2.76 41.39 31.28
30 2.72 4.41 42.48 29.28
40 3.52 5.64 45.99 31.74
50 4.32 6.87 44.60 30.53
60 5.14 7.97 45.39 33.32
70 5.96 9.06 44.43 34.43
80 6.76 10.13 44.77 35.42
90 7.65 11.14 41.36 35.98
100 8.57 12.24 39.97 33.94
110 9.56 13.38 37.63 33.12
120 10.54 14.51 37.41 32.62

Impact of Parking Maneuvers on Space Mean Speed
And Average Travel Time
74
Appendix 1.2.3: Table used for the outbound maneuver
Space Free flow
cumulative
Time
Cum. Avg
travel time
Free flow
Space
mean
speed
Space
mean
speed
0 0 0
10 0.96 1.14 39.12 34.24
20 1.85 2.20 41.39 34.47
30 2.72 3.28 42.48 35.02
40 3.52 4.34 45.99 35.04
50 4.32 5.38 44.60 35.32
60 5.14 6.52 45.39 33.54
70 5.96 7.57 44.43 36.81
80 6.76 8.73 44.77 31.95
90 7.65 9.97 41.36 31.77
100 8.57 11.53 39.97 27.57
110 9.56 12.81 37.63 30.28
120 10.54 14.17 37.41 28.46
Appendix 1.2.4: Table used for Double parking
Space Free flow
cumulative
Time
Cum. Avg
travel time
Free flow
Space
mean
speed
Space
mean
speed
0 0 0
10 0.96 1.33 39.12 28.50
20 1.85 2.58 41.39 29.68
30 2.72 3.83 42.48 29.33
40 3.52 4.96 45.99 33.07
50 4.32 6.12 44.60 32.05
60 5.14 7.28 45.39 31.87
70 5.96 8.35 44.43 34.09
80 6.76 9.39 44.77 34.93
90 7.65 10.61 41.36 31.49
100 8.57 11.84 39.97 31.64
110 9.56 12.94 37.63 33.35
120 10.54 14.25 37.41 29.17

Impact of Parking Maneuvers on Space Mean Speed
And Average Travel Time
75
Appendix 1.3: Table used for Case Study three
Appendix 1.3.1: Table used for the front inbound maneuver
Space Free flow
cumulative
Time
Cum. Avg
travel
time
Free flow
Space
mean
speed
Space mean
speed
0 0 0
10 0.956 1.1957895 36.6141436 30.59576941
20 1.852 2.3452632 39.2208194 31.62819025
30 2.716 3.4968421 40.2588378 31.84009729
40 3.518 4.7115789 40.225155 30.32607055
50 4.32 5.8252632 41.5312057 31.78189894
60 5.142 7.0252632 41.4414651 32.33888961
70 5.964 8.0315789 42.5714881 34.49305984
80 6.764 9.1389474 42.9375897 34.98713463
90 7.648 10.185263 43.9960881 35.509425
100 8.574 11.162105 43.9556367 36.37331934
110 9.56 12.336842 39.8730979 33.81240505
Appendix 1.3.2: Table used for the reverse inbound maneuver
Space Free flow
cumulative
Time
Cum. Avg
travel
time
Free flow
Space mean
speed
Space
mean
speed
0 0 0
10 0.956 1.116 36.61414362 33.0671584
20 1.852 2.22 39.22081938 33.5850314
30 2.716 3.288 40.25883783 34.4343347
40 3.518 4.404 40.22515496 32.9917563
50 4.32 5.408 41.53120574 35.0447723
60 5.142 6.556 41.44146507 34.2898692
70 5.964 7.652 42.57148811 33.6933121
80 6.764 9.408 42.93758971 33.2860649
90 7.648 11.584 43.99608809 30.8340862
100 8.574 12.8 43.95563674 34.3474603
110 9.56 14.076 39.87309791 32.068775

Impact of Parking Maneuvers on Space Mean Speed
And Average Travel Time
76
Appendix 1.3.3: Table used for the outbound maneuver
Space Free flow
cumulative
Time
Cum. Avg
travel time
Free flow
Space mean
speed
Space
mean
speed
0 0 0
10 0.956 1.24727273 36.61414362 30.30923
20 1.852 2.41090909 39.22081938 32.06269
30 2.716 3.53090909 40.25883783 33.00371
40 3.518 4.67272727 40.22515496 32.37902
50 4.32 5.70909091 41.53120574 33.90502
60 5.142 6.85454545 41.44146507 34.10743
70 5.964 7.88727273 42.57148811 34.43526
80 6.764 8.98545455 42.93758971 36.15187
90 7.648 10.0218182 43.99608809 36.03693
100 8.574 11.0036364 43.95563674 36.75617
110 9.56 12.2218182 39.87309791 32.58933
Appendix1.3.4: Table used for the Load/unload maneuver
Space Free flow
cumulative
Time
Cum.
Avg
travel
time
Free flow
Space mean
speed
Space
mean
speed
0 0 0
10 0.956 1.6 36.61414362 24.4414
20 1.852 3.354545 39.22081938 23.50119
30 2.716 5.434545 40.25883783 21.27325
40 3.518 7.638182 40.22515496 18.55775
50 4.32 9.145455 41.53120574 23.78489
60 5.142 10.53636 41.44146507 27.22008
70 5.964 11.67273 42.57148811 30.03404
80 6.764 12.77636 42.93758971 34.70085
90 7.648 13.88909 43.99608809 32.98195
100 8.574 14.87818 43.95563674 36.25949
110 9.56 16.14364 39.87309791 31.33963

Impact of Parking Maneuvers on Space Mean Speed
And Average Travel Time
77
Appendix 2: the table used for the regression analysis
Start
Time
End
Time
travel
time
speed Flow Parking
maneuver
double
parking
load/unload
maneuvers
no.
Of
lanes
Shock
wave
effect
7:05 7:10 8.782667 57.39 41 0 0 0 1 0
7:10 7:15 10 50.40 46 0 0 0 1 0
7:15 7:20 10.51385 47.94 49 2 0 0 1 0
7:20 7:25 10.7125 47.05 51 1 0 0 1 1
7:25 7:30 10.8575 46.42 52 1 0 0 1 1
7:30 7:35 11.61091 43.41 41 2 0 0 1 1
7:35 7:40 9.756923 51.66 53 0 0 0 1 1
7:40 7:45 10.42 48.37 40 1 0 0 1 0
7:45 7:50 11.16 45.16 51 0 0 0 1 1
7:50 7:55 10.9856 45.88 58 1 0 0 1 0
7:55 8:00 11.38783 44.26 60 1 0 0 1 1
8:00 8:05 12.56 40.13 52 2 0 0 1 1
8:05 8:10 10.50667 47.97 56 1 0 0 1 1
8:10 8:15 12.56267 40.12 56 2 0 0 1 1
8:15 8:20 11.89067 42.39 51 3 0 0 1 1
8:20 8:25 11.22182 44.91 69 1 0 0 1 1
8:25 8:30 11.72 43.00 47 0 0 1 1 1
8:30 8:35 12.87158 39.16 45 0 1 0 1 1
8:35 8:40 10.87714 46.34 64 0 0 0 1 1
8:40 8:45 12.68267 39.74 44 2 0 0 1 0
8:45 8:50 11.86 42.50 45 4 0 0 1 1
8:50 8:55 12.7232 39.61 64 1 0 1 1 1
8:55 9:00 12.21455 41.26 47 2 0 0 1 1
9:00 9:05 12.86154 39.19 52 2 0 0 1 1
9:05 9:10 13.73263 36.70 61 4 0 0 1 1
9:10 9:15 11.11667 45.34 57 0 0 0 1 1
9:15 9:20 12.02667 41.91 47 3 0 0 1 0
9:20 9:25 12.39333 40.67 56 2 0 0 1 1
9:25 9:30 9.588889 52.56 53 0 0 0 1 1
9:30 9:35 12.33714 40.85 48 2 0 0 1 0
9:35 9:40 12.74353 39.55 57 4 0 0 1 1
9:40 9:45 13.592 37.08 47 5 0 0 1 1
9:45 9:50 12.6592 39.81 51 2 0 0 1 1
9:50 9:55 10.97935 45.90 53 0 0 0 1 1
9:55 10:00 9.276 54.33 52 0 0 0 1 0
10:00 10:05 12.398 40.65 36 2 0 0 1 0
10:05 10:10 10.29455 48.96 45 0 0 0 1 1
10:10 10:15 13.56516 37.15 60 1 0 0 1 0
10:15 10:20 13.36148 37.72 46 1 1 0 1 1

Impact of Parking Maneuvers on Space Mean Speed
And Average Travel Time
78
10:20 10:25 12.745 39.54 54 3 0 0 1 1
10:25 10:30 10.395 48.48 63 0 0 0 1 1
10:50 10:55 10.38 48.55 62 0 0 0 1 0
10:55 11:00 13.516 37.29 50 2 0 0 1 0
11:00 11:05 13.0725 38.55 56 2 0 0 1 1
11:05 11:10 13.42364 37.55 45 3 0 0 1 1
11:10 11:15 13.25 38.04 54 2 0 0 1 1
11:15 11:20 12.04 41.86 53 2 0 0 1 1
11:20 11:25 10.288 48.99 37 0 0 0 1 1
11:25 11:30 13.968 36.08 37 2 0 0 1 0
13:30 13:35 10.19385 49.44 47 0 0 0 1 1
13:35 13:40 14.81053 34.03 55 3 0 0 1 0
13:40 13:45 14.1875 35.52 47 2 1 0 1 1
13:45 13:50 14.88 33.87 53 1 1 0 1 1
13:50 13:55 10.25333 49.15 54 0 0 0 1 1
13:55 14:00 12.06909 41.76 54 2 0 0 1 0
14:00 14:05 12.23765 41.18 43 2 0 0 1 1
14:05 14:10 12.546 40.17 50 3 0 0 1 1
14:10 14:15 10.28 49.03 54 0 0 0 1 1
14:15 14:20 11.31333 44.55 47 1 0 0 1 0
14:20 14:25 12.69 39.72 52 0 0 0 1 1
14:25 14:30 12.58 40.06 56 0 0 0 1 0
14:30 14:35 12.3675 40.75 45 1 0 0 1 0
14:35 14:40 15.67636 32.15 48 2 0 0 1 1
14:40 14:45 13.32571 37.82 61 5 0 0 1 1
14:45 14:50 13.4925 37.35 52 3 0 0 1 1
14:50 14:55 10.76727 46.81 51 0 0 0 1 1
14:55 15:00 12.69333 39.71 63 0 0 0 1 0
15:00 15:05 9.766 51.61 41 0 0 0 1 0
15:05 15:10 10.03333 50.23 50 0 0 0 1 0
15:10 15:15 9.285714 54.28 63 0 0 0 1 0
15:15 15:20 12.17 41.41 57 0 1 0 1 0
15:20 15:25 13 38.77 61 1 0 0 1 1
15:25 15:30 12.09667 41.66 69 1 0 0 1 1
15:30 15:35 11.49111 43.86 56 1 0 0 1 1
15:35 15:40 23.13417 21.79 59 3 1 0 1 1
15:40 15:45 29.44 17.12 72 0 0 1 1 1
15:45 15:50 34.2864 14.70 62 3 0 0 1 1
15:55 16:00 21.06667 23.92 55 0 1 0 1 1
16:05 16:10 18.34 27.48 45 6 0 0 1 1
16:10 16:15 30.42667 16.56 60 1 0 0 1 1
16:30 16:35 14.775 34.11 48 3 0 0 1 1
16:40 16:45 28.92857 17.42 65 7 1 1 1 1
16:45 16:50 18.288 27.56 48 2 0 1 1 1
16:50 16:55 12.448 40.49 54 2 0 0 1 1
16:55 17:00 14.595 34.53 68 0 0 0 1 1

Impact of Parking Maneuvers on Space Mean Speed
And Average Travel Time
79
7:05 7:10 10.44 41.39 44 1 0 0 1 0
7:10 7:15 11.31 38.18 37 0 0 0 1 1
7:15 7:20 11.78 36.66 49 1 0 0 1 0
7:20 7:25 13.15 32.85 39 1 0 0 1 1
7:25 7:30 12.07 35.79 42 1 0 0 1 1
7:30 7:35 12.48 34.60 47 3 0 0 1 1
7:35 7:40 14.46 29.87 69 3 0 0 1 1
7:40 7:45 15.09 28.63 49 1 0 0 1 1
7:45 7:50 12.35 34.99 53 5 0 0 1 1
7:50 7:55 13.93 31.00 45 3 0 0 1 1
7:55 8:00 14.45 29.89 46 2 0 0 1 1
8:00 8:05 13.74 31.44 60 5 0 0 1 1
8:05 8:10 18.21 23.73 62 1 0 0 1 1
8:10 8:15 17.65 24.47 62 0 0 0 1 1
8:15 8:20 19.66 21.97 62 3 0 0 1 0
8:20 8:25 19.60 22.04 56 1 1 0 1 1
8:25 8:30 18.64 23.17 64 2 1 0 1 1
8:30 8:35 18.84 22.93 57 0 1 1 1 1
8:35 8:40 18.55 23.29 63 0 0 0 1 1
8:40 8:45 16.59 26.04 48 1 0 0 1 0
8:45 8:50 18.04 23.95 61 1 0 0 1 1
8:50 8:55 15.77 27.40 55 0 0 0 1 1
8:55 9:00 13.93 31.01 51 1 0 1 1 0
9:00 9:05 12.39 34.86 50 0 0 0 1 1
9:05 9:10 19.38 22.29 59 2 0 0 1 0
9:10 9:15 33.89 12.75 47 1 1 0 1 1
9:15 9:20 21.66 19.94 55 0 1 0 1 1
9:20 9:25 20.35 21.23 61 2 1 0 1 1
9:25 9:30 14.01 30.84 58 4 0 1 1 1
9:30 9:35 17.40 24.83 54 1 0 0 1 1
9:35 9:40 21.85 19.77 58 0 0 1 1 1
9:40 9:45 23.53 18.36 70 0 0 0 1 1
9:45 9:50 20.27 21.32 62 0 0 0 1 0
9:50 9:55 17.47 24.73 61 1 0 0 1 0
9:55 10:00 16.87 25.60 67 2 1 1 1 1
10:00 10:05 20.56 21.02 54 3 1 1 1 1
10:05 10:10 18.46 23.40 69 0 0 0 1 1
10:10 10:15 20.88 20.69 55 3 1 1 1 0
10:15 10:20 14.49 29.82 45 3 1 0 1 1
10:20 10:25 20.94 20.63 56 2 1 1 1 1
10:30 10:35 24.21 17.84 67 1 0 0 1 1
10:35 10:40 16.84 25.65 61 1 0 0 1 1
10:40 10:45 14.99 28.82 50 0 0 0 1 1
10:45 10:50 17.30 24.97 60 4 0 0 1 0
10:50 10:55 17.41 24.82 60 2 0 0 1 1
10:55 11:00 16.84 25.66 52 1 0 0 1 1

Impact of Parking Maneuvers on Space Mean Speed
And Average Travel Time
80
11:00 11:05 16.82 25.69 47 1 0 0 1 1
11:05 11:10 15.63 27.64 52 1 0 0 1 1
11:10 11:15 23.38 18.48 62 2 0 0 1 1
11:15 11:20 12.91 33.46 49 3 1 0 1 1
11:20 11:25 16.83 25.67 56 1 1 0 1 1
11:25 11:30 14.17 30.48 45 3 0 0 1 1
13:30 13:35 15.53 27.82 45 1 0 0 1 1
13:35 13:40 18.27 23.64 49 0 0 0 1 1
13:45 13:50 17.37 24.88 53 1 0 0 1 0
13:50 13:55 14.85 29.08 52 1 0 0 1 1
13:55 14:00 11.89 36.33 48 0 0 0 1 1
14:00 14:05 15.51 27.86 50 1 0 0 1 0
14:05 14:10 14.71 29.37 47 1 1 0 1 1
14:10 14:15 19.70 21.93 57 1 0 0 1 1
14:20 14:25 26.47 16.32 57 1 0 0 1 1
14:25 14:30 20.58 21.00 58 2 0 0 1 1
14:35 14:40 14.88 29.03 46 4 1 0 1 1
14:40 14:45 37.49 11.52 48 1 1 0 1 1
14:45 14:50 28.82 14.99 54 2 0 0 1 1
14:55 15:00 16.02 26.96 52 0 0 0 1 1
15:00 15:05 22.36 19.32 50 1 0 0 1 0
15:05 15:10 22.75 18.99 62 1 1 0 1 1
15:10 15:15 20.23 21.35 57 3 0 0 1 1
15:15 15:20 27.73 15.58 58 3 0 0 1 1
15:20 15:25 17.96 24.06 41 1 0 0 1 1
15:25 15:30 17.56 24.61 56 4 0 0 1 1
15:30 15:35 17.06 25.32 49 4 0 0 1 1
15:35 15:40 17.22 25.09 54 3 0 0 1 1
15:40 15:45 21.27 20.32 58 1 0 0 1 1
15:45 15:50 19.59 22.05 58 1 0 0 1 1
15:55 16:00 19.92 21.69 56 0 1 1 1 1
16:00 16:05 19.37 22.31 46 2 1 0 1 1
16:05 16:10 15.06 28.68 56 2 0 1 1 1
16:10 16:15 17.38 24.85 45 2 0 0 1 1
16:15 16:20 17.69 24.42 47 4 0 0 1 1
16:20 16:25 14.96 28.88 47 4 0 0 1 1
16:25 16:30 14.59 29.60 44 1 0 0 1 1
16:30 16:35 15.85 27.25 50 3 0 0 1 1
16:35 16:40 28.43 15.20 57 1 0 0 1 1
16:40 16:45 23.25 18.58 56 2 0 0 1 1
16:45 16:50 36.74 11.76 58 1 0 0 1 1
16:50 16:55 27.35 15.79 47 2 0 0 1 1
16:55 17:00 20.01 21.59 62 3 0 0 1 1
17:00 17:05 29.77 14.51 50 1 0 0 1 1
17:05 17:10 19.19 22.51 52 3 0 0 1 1
17:10 17:15 16.16 26.73 46 1 0 0 1 1

Impact of Parking Maneuvers on Space Mean Speed
And Average Travel Time
81
17:15 17:20 18.45 23.42 46 0 0 0 1 1
17:20 17:25 19.01 22.73 53 2 0 0 1 0
17:25 17:30 17.50 24.69 53 3 0 0 1 1
7:05 7:10 4.89 36.78 40 0 0 0 1 1
7:10 7:15 5.23 34.42 31 0 0 0 1 0
7:15 7:20 4.72 38.14 37 0 0 0 1 0
7:20 7:25 4.80 37.52 23 0 0 0 1 0
7:25 7:30 4.70 38.28 35 0 0 0 1 0
7:30 7:35 4.71 38.23 34 0 0 0 1 0
7:35 7:40 4.51 39.94 44 0 0 0 1 0
7:40 7:45 4.60 39.09 49 0 0 0 1 0
7:45 7:50 4.73 38.08 35 0 0 0 1 0
7:50 7:55 4.52 39.82 46 0 0 0 1 0
7:55 8:00 4.73 38.07 33 0 0 0 1 0
8:00 8:05 5.61 32.06 53 1 0 0 1 0
8:05 8:10 6.27 28.71 30 1 0 0 1 1
8:10 8:15 4.76 37.84 29 0 0 0 1 1
8:15 8:20 5.35 33.62 60 0 0 0 1 0
8:20 8:25 5.94 30.29 55 1 0 0 1 0
8:25 8:30 5.39 33.37 44 0 0 0 1 1
8:30 8:35 4.76 37.82 38 0 0 0 1 0
8:35 8:40 6.47 27.83 45 2 0 0 1 0
8:40 8:45 5.85 30.75 35 1 0 0 1 1
8:45 8:50 6.31 28.53 35 1 0 0 1 1
8:50 8:55 4.87 36.97 33 0 0 0 1 1
8:55 9:00 6.09 29.57 40 1 0 0 1 0
9:00 9:05 6.31 28.52 33 2 0 0 1 1
9:05 9:10 4.54 39.63 39 0 0 0 1 1
9:10 9:15 6.33 28.45 44 2 0 0 1 0
9:15 9:20 5.13 35.10 51 0 0 0 1 1
9:20 9:25 5.97 30.15 40 1 0 0 1 0
9:25 9:30 5.78 31.14 48 1 0 0 1 1
9:30 9:35 4.59 39.22 34 0 0 0 1 1
9:35 9:40 4.47 40.30 44 0 0 0 1 0
9:40 9:45 4.51 39.90 37 0 0 0 1 0
9:45 9:50 5.43 33.14 40 0 0 0 1 0
9:50 9:55 5.18 34.77 32 0 0 0 1 0
9:55 10:00 4.36 41.25 43 0 0 0 1 0
10:00 10:05 6.36 28.32 35 3 0 0 1 0
10:05 10:10 6.53 27.55 23 1 0 0 1 1
10:10 10:15 5.73 31.41 35 1 0 0 1 1
10:15 10:20 4.93 36.52 28 0 0 0 1 1
10:20 10:25 6.47 27.80 36 1 0 0 1 0
10:25 10:30 6.19 29.07 36 1 0 0 1 1
10:30 10:35 5.68 31.69 20 2 1 0 1 1
10:35 10:40 4.66 38.59 44 0 0 0 1 1

Impact of Parking Maneuvers on Space Mean Speed
And Average Travel Time
82
10:40 10:45 7.34 24.51 38 1 1 0 1 0
10:45 10:50 6.24 28.85 33 1 0 0 1 1
10:50 10:55 6.47 27.84 28 0 1 0 1 1
10:55 11:00 6.11 29.46 34 1 1 0 1 1
11:00 11:05 6.27 28.69 33 0 1 0 1 1
11:05 11:10 6.14 29.33 33 0 1 0 1 1
11:10 11:15 7.10 25.34 32 2 0 0 1 1
11:15 11:20 4.60 39.13 27 0 0 0 1 1
11:20 11:25 7.16 25.13 33 3 0 0 1 0
11:25 11:30 4.93 36.49 32 0 0 0 1 1
11:30 11:35 4.79 37.57 32 0 0 0 1 0
13:25 13:30 5.84 30.82 41 1 0 0 1 0
13:30 13:35 6.27 28.69 36 3 0 0 1 1
13:35 13:40 6.36 28.31 46 0 1 1 1 1
13:40 13:45 6.78 26.53 34 3 1 0 1 1
13:45 13:50 6.29 28.63 41 2 0 0 1 1
13:50 13:55 6.36 28.31 40 0 1 0 1 1
13:55 14:00 6.68 26.95 30 1 1 0 1 1
14:00 14:05 6.81 26.43 22 2 0 0 1 1
14:05 14:10 6.08 29.59 33 3 0 0 1 1
14:10 14:15 5.13 35.07 29 0 0 0 1 1
14:15 14:20 6.24 28.85 43 1 1 0 1 0
14:20 14:25 5.89 30.56 43 1 0 0 1 1
14:25 14:30 6.35 28.36 33 2 0 0 1 1
14:30 14:35 7.64 23.57 29 3 0 0 1 1
14:35 14:40 6.61 27.24 41 2 0 0 1 1
14:40 14:45 7.16 25.15 39 4 1 0 1 1
14:45 14:50 6.47 27.83 45 2 1 1 1 1
14:50 14:55 6.98 25.80 39 2 1 0 1 1
14:55 15:00 5.76 31.27 43 1 0 0 1 1
15:00 15:05 4.70 38.34 38 0 0 0 1 1
15:05 15:10 4.82 37.38 31 0 0 0 1 0
15:10 15:15 6.79 26.52 43 1 0 1 1 0
15:15 15:20 6.58 27.35 34 0 0 1 1 1
15:20 15:25 6.28 28.68 40 1 1 0 1 1
15:25 15:30 6.28 28.67 34 1 0 1 1 1
15:30 15:35 4.96 36.30 45 0 0 0 1 1
15:35 15:40 4.69 38.42 48 0 0 0 1 0
15:40 15:45 6.11 29.45 49 2 0 0 1 0
15:45 15:50 6.46 27.87 42 1 0 0 1 1
15:50 15:55 6.38 28.21 46 0 0 1 1 1
15:55 16:00 6.55 27.47 42 3 0 0 1 1
16:00 16:05 5.64 31.90 36 1 0 0 1 1
16:05 16:10 6.12 29.40 33 2 0 0 1 1
16:10 16:15 5.87 30.67 43 1 0 0 1 1
16:15 16:20 6.10 29.49 35 1 0 1 1 1

Impact of Parking Maneuvers on Space Mean Speed
And Average Travel Time
83
16:20 16:25 6.19 29.09 32 2 0 0 1 1
16:25 16:30 4.84 37.19 40 0 0 0 1 1
16:30 16:35 5.13 35.08 48 0 0 0 1 0
16:35 16:40 5.03 35.77 35 0 0 0 1 0
16:40 16:45 4.85 37.14 49 0 0 0 1 0
16:45 16:50 6.63 27.15 40 1 0 0 1 0
16:50 16:55 6.40 28.11 27 1 1 0 1 1
16:55 17:00 4.92 36.61 37 0 0 0 1 1
17:00 17:05 5.42 33.21 43 0 0 0 1 0
17:05 17:10 4.88 36.91 46 0 0 0 1 0
17:10 17:15 4.82 37.31 44 0 0 0 1 0
17:15 17:20 5.85 30.77 35 1 0 0 1 0
17:20 17:25 6.06 29.68 46 0 0 1 1 1
17:25 17:30 6.30 28.55 29 1 0 1 1 1
7:05 7:10 5.168 59.21 40 0 0 0 2 1
7:10 7:15 6.097143 50.19 31 0 0 0 2 0
7:15 7:20 5.166316 59.23 37 0 0 0 2 0
7:20 7:25 5.946667 51.46 23 1 0 0 2 0
7:25 7:30 5.418462 56.47 35 0 0 0 2 1
7:30 7:35 7.08 43.22 34 1 0 0 2 0
7:35 7:40 7.297143 41.93 44 1 0 0 2 1
7:40 7:45 5.903529 51.83 49 1 0 0 2 1
7:45 7:50 6.176842 49.54 35 0 1 0 2 1
7:50 7:55 5.6775 53.90 46 0 0 0 2 1
7:55 8:00 6.857143 44.63 33 1 0 0 2 0
8:00 8:05 6.375 48.00 53 1 0 0 2 1
8:05 8:10 5.466667 55.98 30 0 0 0 2 1
8:10 8:15 5.32 57.52 29 0 0 0 2 0
8:15 8:20 5.54 55.23 60 0 0 0 2 0
8:20 8:25 5.626667 54.38 55 0 0 0 2 0
8:25 8:30 5.868 52.15 44 0 0 0 2 0
8:30 8:35 5.3175 57.55 38 0 0 0 2 0
8:35 8:40 7.634286 40.08 45 0 0 0 2 0
8:40 8:45 6.383333 47.94 35 1 0 0 2 0
8:45 8:50 7.556 40.50 35 1 0 0 2 1
8:50 8:55 7.131429 42.91 33 0 1 0 2 1
8:55 9:00 7.392941 41.39 40 3 0 0 2 1
9:00 9:05 5.793846 52.81 33 0 0 0 2 1
9:05 9:10 5.46 56.04 39 0 0 0 2 0
9:10 9:15 7.522667 40.68 44 1 0 0 2 0
9:15 9:20 6.742222 45.39 51 2 0 0 2 1
9:20 9:25 5.54 55.23 40 0 0 0 2 1
9:25 9:30 5.861333 52.21 48 0 0 0 2 0
9:30 9:35 7.484444 40.88 34 1 0 0 2 0
9:35 9:40 6.944 44.07 44 4 0 0 2 1
9:40 9:45 5.301538 57.72 37 0 0 0 2 1

Impact of Parking Maneuvers on Space Mean Speed
And Average Travel Time
84
9:45 9:50 6.859048 44.61 40 1 0 0 2 0
9:50 9:55 6.966667 43.92 32 2 0 0 2 1
9:55 10:00 7.235789 42.29 43 0 1 0 2 1
10:00 10:05 7.061538 43.33 35 1 1 0 2 1
10:05 10:10 7.526154 40.66 23 5 0 0 2 1
10:10 10:15 6.582857 46.48 35 2 1 0 2 1
10:15 10:20 5.329231 57.42 28 0 0 0 2 1
10:20 10:25 7.4 41.35 36 2 1 0 2 0
10:25 10:30 6.678621 45.82 36 1 0 0 2 1
10:30 10:35 6.733333 45.45 20 1 0 0 2 1
10:35 10:40 6.676364 45.83 44 1 0 0 2 1
10:40 10:45 8.6 35.58 38 0 1 0 2 1
10:45 10:50 7.4575 41.03 33 0 1 0 2 1
10:50 10:55 8.374545 36.54 28 1 1 0 2 1
10:55 11:00 7.7 39.74 34 1 1 0 2 1
11:00 11:05 7.525161 40.66 33 0 1 0 2 1
11:05 11:10 7.395 41.38 33 0 1 0 2 1
11:10 11:15 7.374737 41.49 32 0 1 0 2 1
11:15 11:20 6.713333 45.58 27 0 1 0 2 1
11:20 11:25 7.273333 42.07 33 0 1 0 2 1
11:25 11:30 7.249655 42.21 32 0 1 0 2 1
11:30 11:35 6.98 43.84 32 0 1 0 2 1
13:25 13:30 6.548235 46.73 41 1 0 0 2 1
13:30 13:35 5.384 56.84 36 0 0 0 2 1
13:35 13:40 5.315556 57.57 46 0 0 0 2 0
13:40 13:45 7.004444 43.69 34 0 1 0 2 0
13:45 13:50 6.046667 50.61 41 0 0 0 2 1
13:50 13:55 7.271111 42.08 40 1 0 0 2 0
13:55 14:00 5.985455 51.12 30 0 0 0 2 1
14:00 14:05 5.71 53.59 22 0 0 0 2 0
14:05 14:10 5.773333 53.00 33 0 0 0 2 0
14:10 14:15 7.376842 41.48 29 0 1 0 2 0
14:15 14:20 7.248 42.22 43 2 1 0 2 1
14:20 14:25 7.681333 39.84 43 1 1 0 2 1
14:25 14:30 7.36 41.58 33 2 1 0 2 1
14:30 14:35 6.333333 48.32 29 0 0 0 2 1
14:35 14:40 7.096667 43.12 41 1 0 0 2 0
14:40 14:45 7.742857 39.52 39 2 1 0 2 1
14:45 14:50 7.36 41.58 45 0 1 0 2 1
14:50 14:55 7.330526 41.74 39 1 1 0 2 1
14:55 15:00 7.098571 43.11 43 1 1 0 2 1
15:00 15:05 5.208571 58.75 38 0 0 0 2 1
15:05 15:10 5.4075 56.59 31 0 0 0 2 0
15:10 15:15 7.211429 42.43 43 2 0 0 2 0
15:15 15:20 5.935 51.56 34 0 0 0 2 1
15:20 15:25 7.506667 40.76 40 0 1 0 2 0

Impact of Parking Maneuvers on Space Mean Speed
And Average Travel Time
85
15:25 15:30 7.044 43.44 34 2 0 0 2 1
15:30 15:35 5.36381 57.05 45 0 0 0 2 1
15:35 15:40 6.069412 50.42 48 1 0 0 2 0
15:40 15:45 6.019487 50.83 49 1 0 0 2 1
15:45 15:50 7.332632 41.73 42 1 1 0 2 1
15:50 15:55 7.64 40.05 46 3 0 0 2 1
15:55 16:00 5.61 54.55 42 0 0 0 2 1
16:00 16:05 6.82 44.87 36 2 0 0 2 0
16:05 16:10 5.345 57.25 33 0 0 0 2 1
16:10 16:15 5.315 57.57 43 0 0 0 2 0
16:15 16:20 5.63 54.35 35 0 0 0 2 0
16:20 16:25 6.782222 45.12 32 2 0 0 2 0
16:25 16:30 6.930909 44.15 40 1 0 0 2 1
16:30 16:35 6.694545 45.71 48 1 0 0 2 1
16:35 16:40 6.57 46.58 35 1 0 0 2 1
16:40 16:45 5.36 57.09 49 0 0 0 2 1
16:45 16:50 5.276364 57.99 40 0 0 0 2 0
16:50 16:55 6.779048 45.14 27 1 0 0 2 0
16:55 17:00 7.113333 43.02 37 1 0 0 2 1
17:00 17:05 7.078 43.23 43 1 1 0 2 1
17:05 17:10 7.888 38.79 46 4 0 0 2 1
17:10 17:15 7.013333 43.63 44 1 0 0 2 1
17:15 17:20 5.348571 57.21 35 0 0 0 2 1
17:20 17:25 6.976 43.86 46 3 0 0 2 0
17:25 17:30 7.335385 41.72 29 3 0 0 2 1
7:35 7:40 9.628571 41.127596 28 0 0 0 1 1
7:40 7:45 10.555 37.517764 24 4 0 0 1 0
7:45 7:50 14.62 27.086183 23 2 0 1 1 1
7:50 7:55 10.35 38.26087 21 1 0 0 1 1
7:55 8:00 10.60727 37.332876 20 1 0 0 1 1
8:00 8:05 14.27333 27.744045 21 2 0 0 1 1
8:05 8:10 11.59636 34.148636 22 1 0 0 1 1
8:10 8:15 9.693333 40.85282 31 0 0 0 1 1
8:15 8:20 12.92667 30.634348 24 1 0 1 1 0
8:20 8:25 9.248 42.820069 23 0 0 0 1 1
8:25 8:30 11.92923 33.19577 35 2 0 1 1 0
8:30 8:35 11.992 33.022015 28 3 0 0 1 1
8:35 8:40 11.33231 34.944339 37 3 0 0 1 1
8:40 8:45 11.09455 35.693215 38 1 0 1 1 1
8:45 8:50 10.54 37.571157 21 2 0 0 1 1
8:50 8:55 10.32 38.372093 19 1 0 0 1 1
8:55 9:00 9.668 40.959868 29 0 0 0 1 1
9:00 9:05 11.24 35.231317 22 3 0 0 1 0
9:05 9:10 12.72364 31.123178 24 2 0 0 1 1
9:10 9:15 11.28 35.106383 22 1 0 0 1 1
9:15 9:20 10.97455 36.083499 28 1 0 0 1 1

Impact of Parking Maneuvers on Space Mean Speed
And Average Travel Time
86
9:20 9:25 10.956 36.144578 27 3 0 0 1 1
9:25 9:30 9.36 42.307692 33 0 0 0 1 1
9:30 9:35 9.85 40.203046 35 0 0 0 1 0
9:35 9:40 9.470625 41.813502 33 0 0 0 1 0
9:40 9:45 9.12 43.421053 20 0 0 0 1 0
9:45 9:50 10.456 37.872992 32 1 0 0 1 0
9:50 9:55 13.57231 29.177057 27 1 0 0 1 1
9:55 10:00 11.33455 34.93744 33 2 0 0 1 1
10:00 10:05 12.02 32.945092 33 2 0 0 1 1
10:05 10:10 11.88 33.333333 26 3 0 1 1 1
10:10 10:15 12.16364 32.556054 35 2 0 1 1 1
10:15 10:20 11.95273 33.130514 30 3 0 0 1 1
10:20 10:25 15.65333 25.298126 24 6 0 0 1 1
10:25 10:30 11.945 33.151946 26 1 0 0 1 1
10:30 10:35 11.49333 34.454756 28 0 0 1 1 1
10:35 10:40 12.28 32.247557 29 2 0 0 1 1
10:40 10:45 13.74545 28.809524 33 3 0 1 1 1
10:45 10:50 12.71467 31.145134 29 1 0 1 1 1
10:50 10:55 10.956 36.144578 22 1 0 0 1 1
10:55 11:00 12.37818 31.991774 23 1 0 1 1 1
11:00 11:05 11.19636 35.368626 28 2 0 1 1 1
11:05 11:10 11.67733 33.911852 39 2 0 1 1 1
11:10 11:15 8.916667 44.411215 28 0 0 0 1 1
11:15 11:20 11.56 34.256055 37 1 0 0 1 0
11:20 11:25 15.305 25.873897 39 2 0 1 1 1
11:25 11:30 8.537143 46.385542 26 0 0 1 1 1
11:30 11:35 14.20889 27.869878 29 2 0 0 1 1
11:35 11:40 10.836 36.54485 20 2 0 0 1 1
11:40 11:45 12.28222 32.241722 38 4 0 0 1 1
11:45 11:50 11.58667 34.177215 25 2 0 0 1 1
11:50 11:55 12.34667 32.073434 40 3 0 0 1 1
13:55 14:00 12.12 32.673267 33 3 0 0 1 1
14:00 14:05 9.9 40 29 2 0 0 1 1
14:05 14:10 12.52364 31.620209 35 3 0 1 1 1
14:10 14:15 9.52 41.596639 36 0 0 0 1 1
14:15 14:20 11.66667 33.942857 18 3 0 0 1 0
14:20 14:25 11.44727 34.593393 42 1 0 0 1 1
14:25 14:30 11.2925 35.067523 29 1 0 0 1 1
14:30 14:35 9.403636 42.111369 29 0 0 0 1 1
14:35 14:40 11.352 34.883721 37 2 0 0 1 0
14:40 14:45 12.84286 30.83426 39 1 0 0 1 1
14:45 14:50 14.45 27.404844 42 1 0 1 1 1
14:50 14:55 12.42118 31.881038 43 3 0 1 1 1
14:55 15:00 12.72667 31.115767 38 3 0 0 1 1
15:00 15:05 13.624 29.066353 36 2 0 1 1 1
15:05 15:10 8.636923 45.849662 23 2 0 0 1 1

Impact of Parking Maneuvers on Space Mean Speed
And Average Travel Time
87
15:10 15:15 11.19385 35.376581 44 1 0 1 1 1
15:15 15:20 11.29333 35.064935 36 1 0 0 1 1
15:20 15:25 11.63636 34.03125 44 1 0 1 1 1
15:25 15:30 10.984 36.05244 38 3 0 1 1 1
15:30 15:35 13.55714 29.209694 40 1 0 1 1 1
15:35 15:40 16.884 23.454158 36 5 0 1 1 1
15:40 15:45 13.276 29.828262 39 2 0 0 1 1
15:45 15:50 12.7175 31.138195 41 1 0 0 1 1
15:50 15:55 11.9725 33.075799 49 1 0 0 1 1
15:55 16:00 9.488 41.736931 25 0 0 0 1 1
16:00 16:05 12.40842 31.913811 46 1 0 0 1 0
16:05 16:10 11.485 34.479756 32 2 0 0 1 1
16:10 16:15 11.86571 33.373465 35 2 0 0 1 1
16:15 16:20 11.592 34.161491 48 1 0 0 1 1
16:20 16:25 11.26133 35.164575 39 3 0 0 1 1
16:25 16:30 11.76 33.673469 35 1 0 0 1 1
16:30 16:35 11.14769 35.523047 42 4 0 0 1 1
16:35 16:40 12.80235 30.931814 45 1 0 0 1 1
16:40 16:45 11.696 33.857729 43 2 0 0 1 1
16:45 16:50 12.99294 30.478088 45 2 0 0 1 1
16:50 16:55 13.515 29.300777 47 3 0 0 1 1
16:55 17:00 8.972 44.137316 43 0 0 0 1 1
17:00 17:05 12.11 32.700248 36 3 0 0 1 0
17:05 17:10 11.065 35.788522 33 2 0 0 1 1
17:10 17:15 12.776 30.995617 40 1 1 0 1 1
17:15 17:20 12.58667 31.461864 52 0 1 0 1 1
17:20 17:25 9.38 42.217484 39 0 0 0 1 1
17:25 17:30 13.208 29.981829 55 1 0 0 1 0