igc7 a.17 day1...modeled by geoschem (v913; in red) over the mid2010 2012 time period. we observe an...
TRANSCRIPT
Poster presented at the 7th International GEOS-Chem Meeting, Harvard University, May 4-7, 201 5
ACKNOWLEDGMENTS
The University of Liège contribution to the present work has primari ly been supported by the PRODEXand SSD programs (ACROSAT and AGACC-I I projects, respectively) funded by the Belgian FederalScience Policy Office (BELSPO), Brussels. Laboratory developments and mission expenses werefunded by F.R.S. – FNRS and the Fédération Wallonie-Bruxelles, respectively. We thank theInternational Foundation High Altitude Research Stations Jungfraujoch and Gornergrat (HFSJG, Bern)for supporting the facil ities needed to perform the observations. E. Mahieu is Research Associate withthe F.R.S. – FNRS. We further acknowledge the vital contribution from all col leagues in performing theFTIR observations used here.
CONTACT INFORMATION
[email protected]: //girpas.astro.ulg.ac.be
http: //hdl.handle.net/2268/1 80927
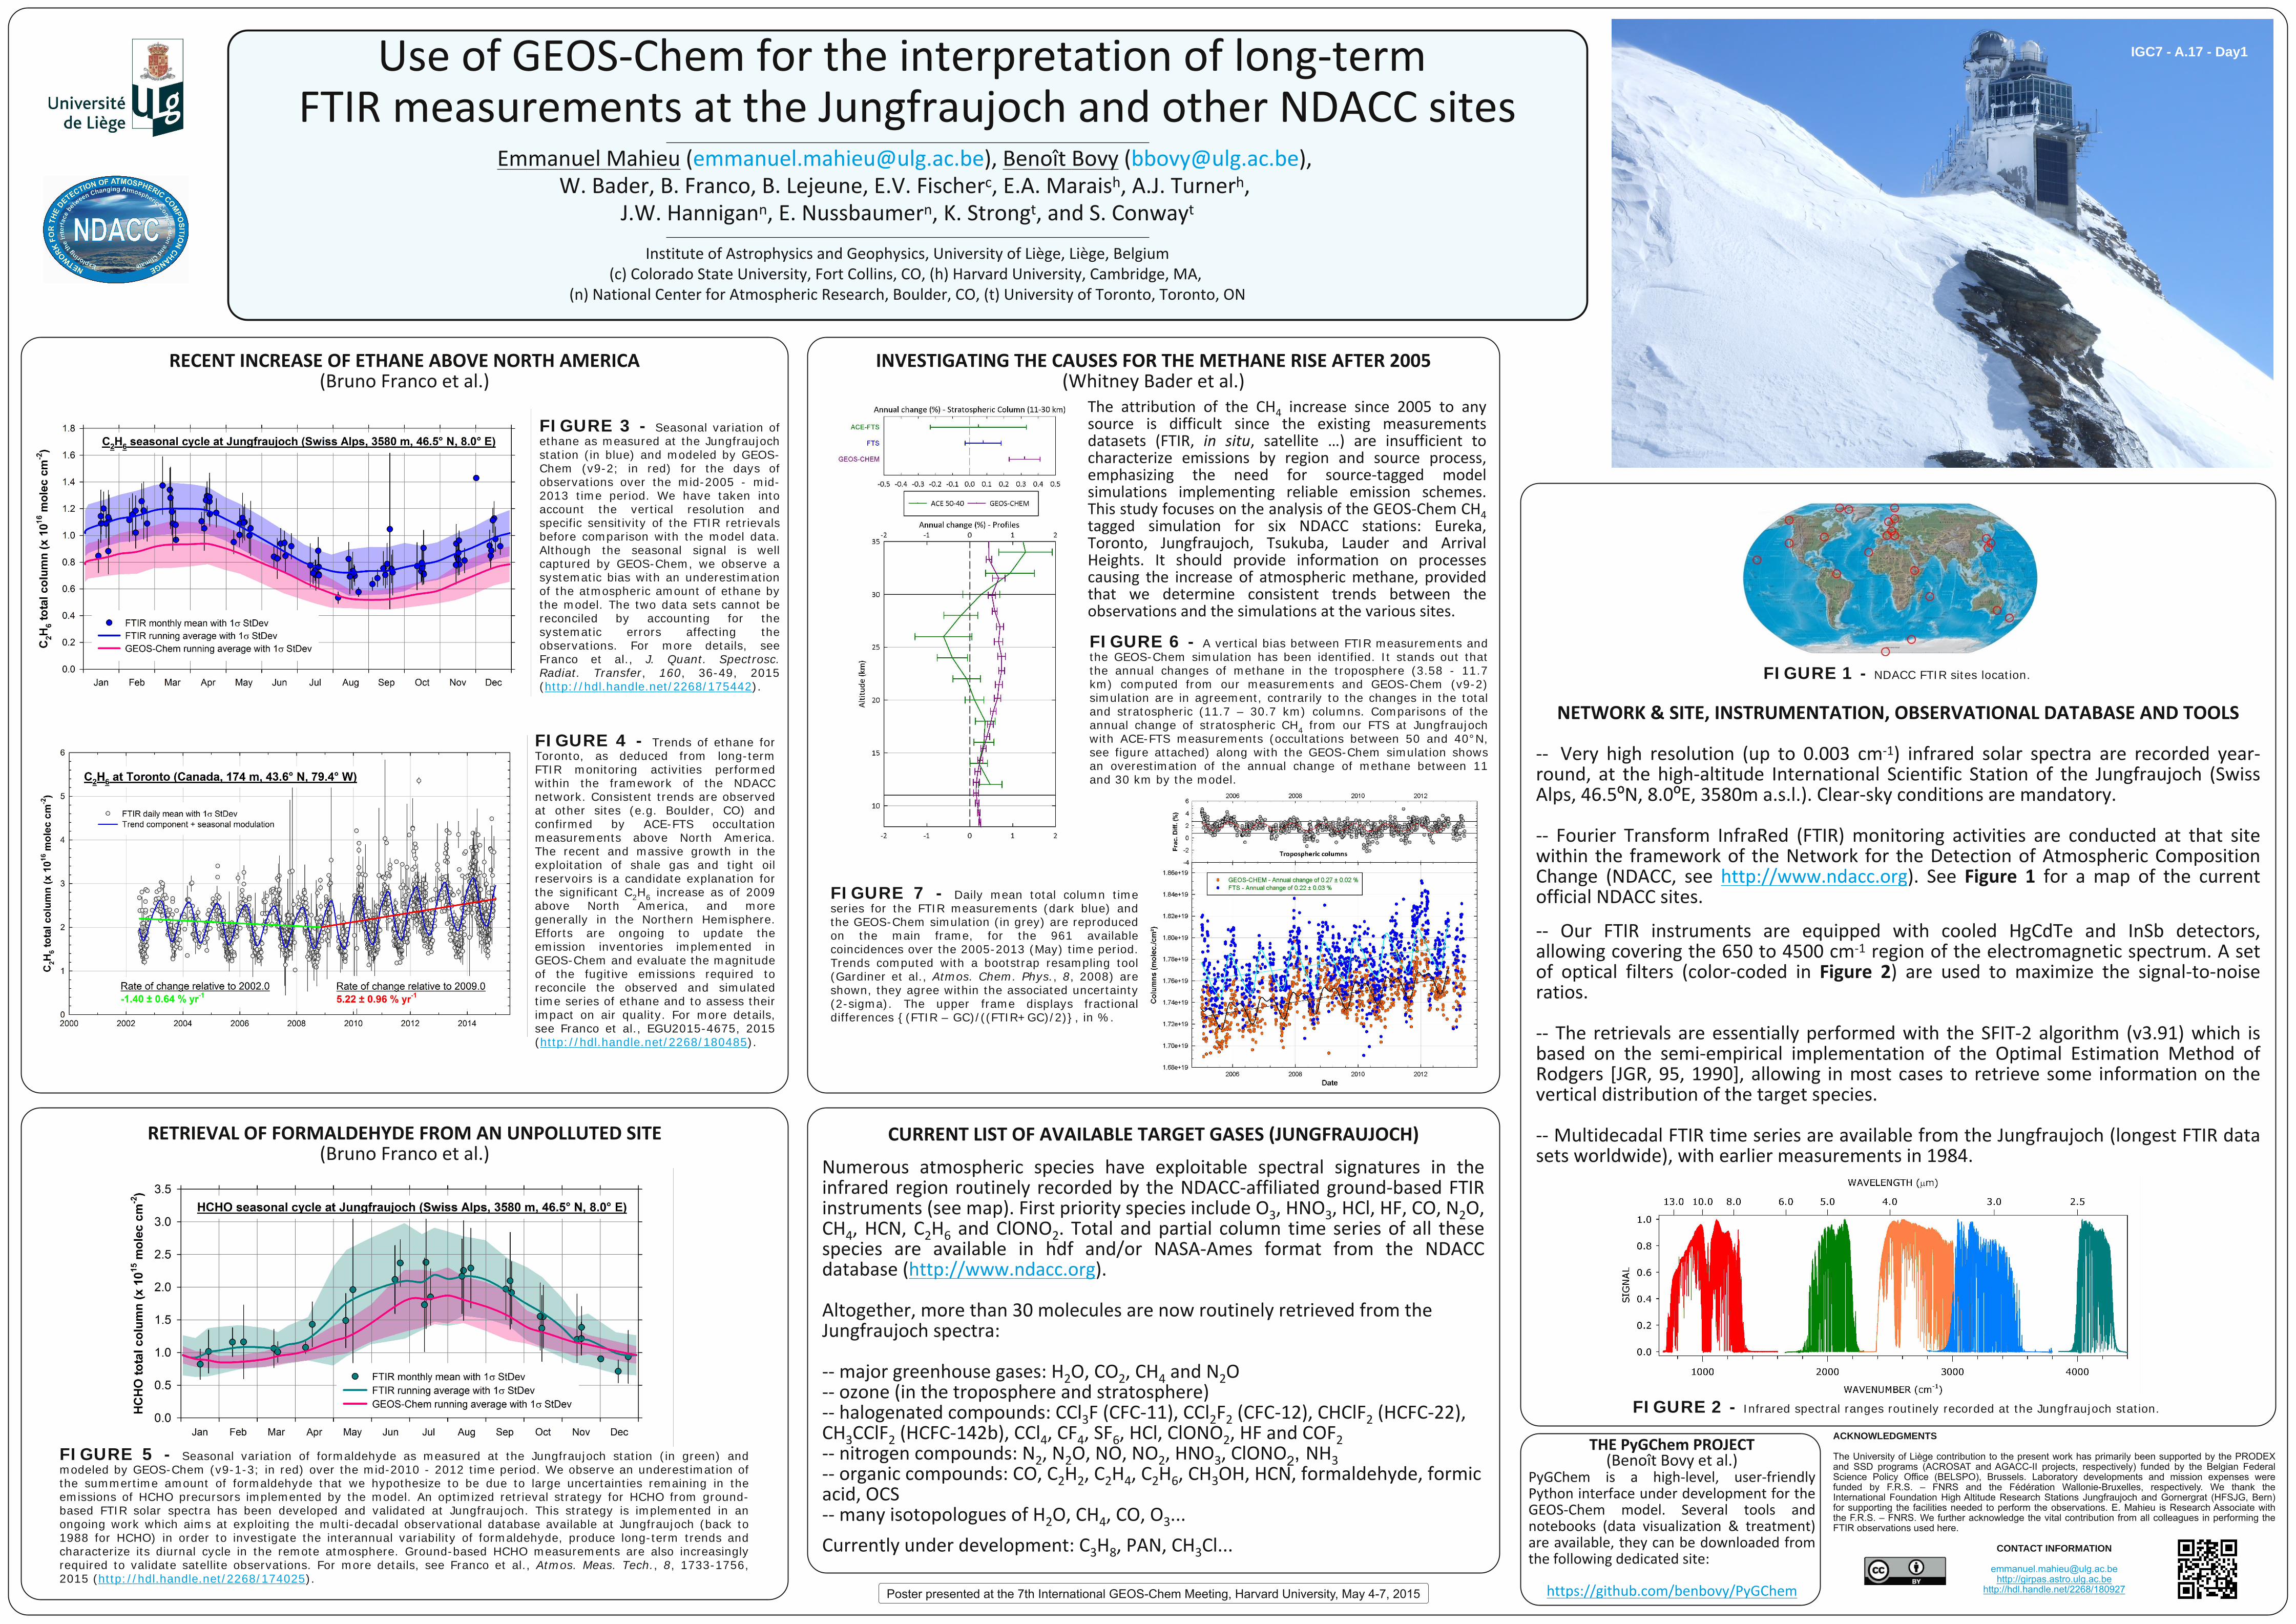
FIGURE 3 Seasonal variation ofethane as measured at the Jungfraujochstation (in blue) and modeled by GEOSChem (v92; in red) for the days ofobservations over the mid2005 mid2013 time period. We have taken intoaccount the vertical resolution andspecific sensitivity of the FTIR retrievalsbefore comparison with the model data.Although the seasonal signal is wellcaptured by GEOSChem, we observe asystematic bias with an underestimationof the atmospheric amount of ethane bythe model. The two data sets cannot bereconciled by accounting for thesystematic errors affecting theobservations. For more details, seeFranco et al., J. Quant. Spectrosc.Radiat. Transfer, 160, 3649, 2015(http://hdl.handle.net/2268/175442).
º º
FIGURE 4 Trends of ethane forToronto, as deduced from longtermFTIR monitoring activities performedwithin the framework of the NDACCnetwork. Consistent trends are observedat other sites (e.g. Boulder, CO) andconfirmed by ACEFTS occultationmeasurements above North America.The recent and massive growth in theexploitation of shale gas and tight oilreservoirs is a candidate explanation forthe significant C2H6 increase as of 2009above North America, and moregenerally in the Northern Hemisphere.Efforts are ongoing to update theemission inventories implemented inGEOSChem and evaluate the magnitudeof the fugitive emissions required toreconcile the observed and simulatedtime series of ethane and to assess theirimpact on air quality. For more details,see Franco et al., EGU20154675, 2015(http://hdl.handle.net/2268/180485).
FIGURE 7 Daily mean total column timeseries for the FTIR measurements (dark blue) andthe GEOSChem simulation (in grey) are reproducedon the main frame, for the 961 availablecoincidences over the 20052013 (May) time period.Trends computed with a bootstrap resampling tool(Gardiner et al., Atmos. Chem. Phys., 8, 2008) areshown, they agree within the associated uncertainty(2sigma). The upper frame displays fractionaldifferences (FTIR – GC)/((FTIR+GC)/2), in %.
FIGURE 1 NDACC FTIR sites location.
FIGURE 2 Infrared spectral ranges routinely recorded at the Jungfraujoch station.
FIGURE 5 Seasonal variation of formaldehyde as measured at the Jungfraujoch station (in green) andmodeled by GEOSChem (v913; in red) over the mid2010 2012 time period. We observe an underestimation ofthe summertime amount of formaldehyde that we hypothesize to be due to large uncertainties remaining in theemissions of HCHO precursors implemented by the model. An optimized retrieval strategy for HCHO from groundbased FTIR solar spectra has been developed and validated at Jungfraujoch. This strategy is implemented in anongoing work which aims at exploiting the multidecadal observational database available at Jungfraujoch (back to1988 for HCHO) in order to investigate the interannual variability of formaldehyde, produce longterm trends andcharacterize its diurnal cycle in the remote atmosphere. Groundbased HCHO measurements are also increasinglyrequired to validate satellite observations. For more details, see Franco et al., Atmos. Meas. Tech., 8, 17331756,2015 (http://hdl.handle.net/2268/174025).
IGC7 A.17 Day1
2,
FIGURE 6 A vertical bias between FTIR measurements andthe GEOSChem simulation has been identified. It stands out thatthe annual changes of methane in the troposphere (3.58 11.7km) computed from our measurements and GEOSChem (v92)simulation are in agreement, contrarily to the changes in the totaland stratospheric (11.7 – 30.7 km) columns. Comparisons of theannual change of stratospheric CH4 from our FTS at Jungfraujochwith ACEFTS measurements (occultations between 50 and 40°N,see figure attached) along with the GEOSChem simulation showsan overestimation of the annual change of methane between 11and 30 km by the model.