ifpri - export of pulses from canada, gordon bacon, pulse canada
Upload: international-food-policy-research-institute-south-asia-office
Post on 15-Apr-2017
169 views
TRANSCRIPT
Export of Pulses from Canada GORDON BACON, CEO
PULSE CANADA
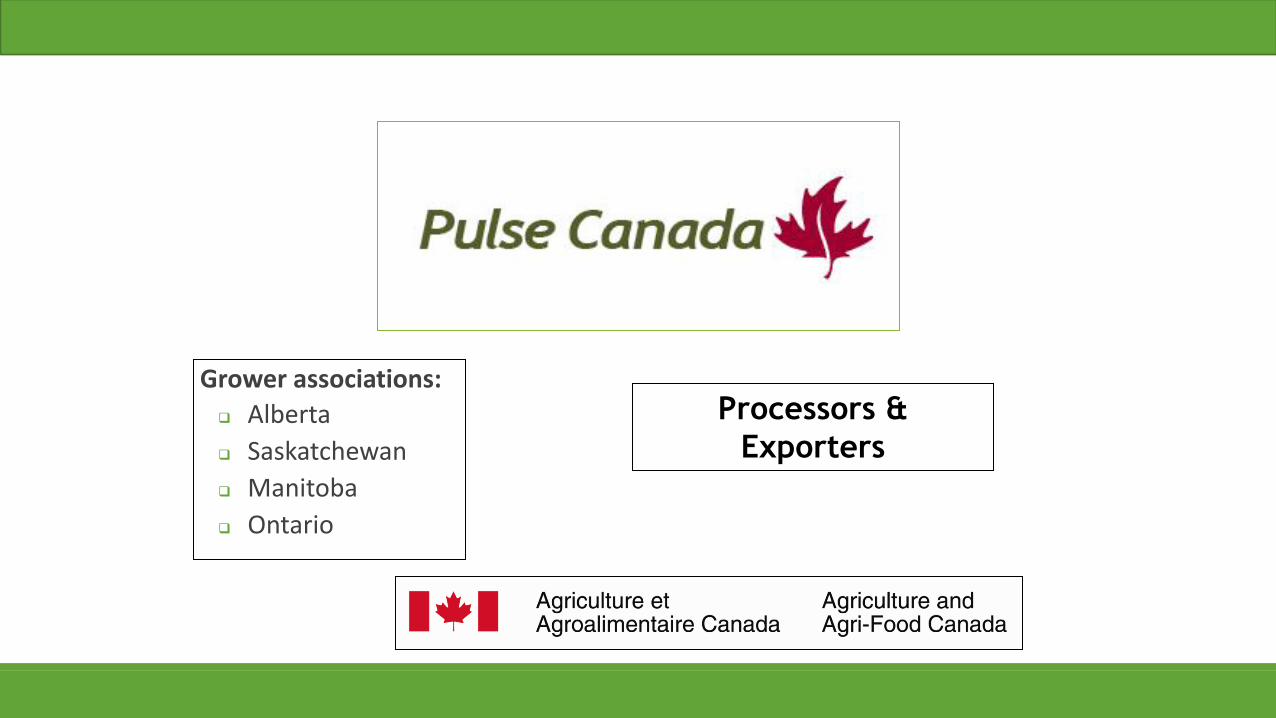
Grower associations:
Alberta
Saskatchewan
Manitoba
Ontario
Processors &
Exporters

Increase Efficiency
Transportation Market Access
Pulse Canada Activities
Add Value
Health Nutrition Sustainability

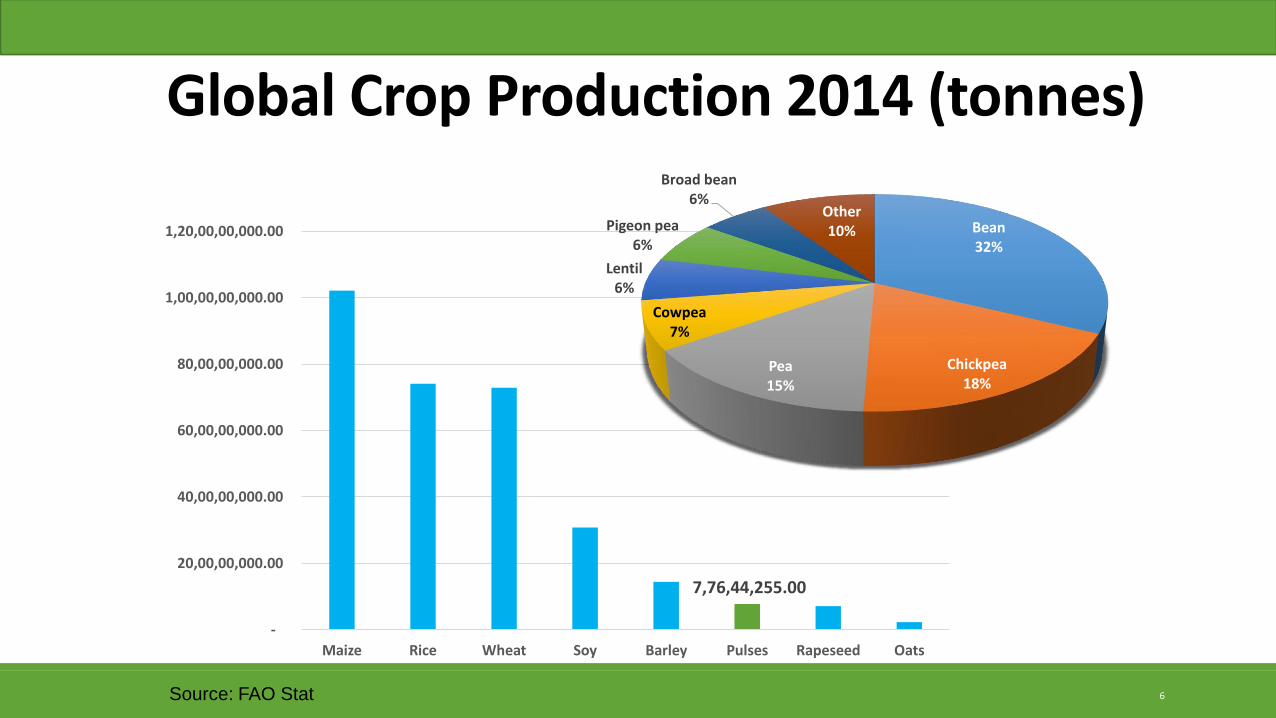
Source: FAO Stat
India, 26%
Canada, 8%
Myanmar, 6%
China, 6%
Brazil, 4% Australia, 4% Nigeria, 3%
USA, 3%
Russia, 3%
Tanzania, 2%
Other, 35%
Top Pulse Producers in 2014

Canada 36%
Australia 10% China
6%
USA 8%
Myanmar 10%
France 3%
Russia 4%
Argentina 1%
UK 2%
Turkey 2%
Other 18%
World Pulse Trade 2014
Source: FAO Stat
6
Global Crop Production 2014 (tonnes)
7,76,44,255.00
-
20,00,00,000.00
40,00,00,000.00
60,00,00,000.00
80,00,00,000.00
1,00,00,00,000.00
1,20,00,00,000.00
Maize Rice Wheat Soy Barley Pulses Rapeseed Oats
Bean 32%
Chickpea 18%
Pea 15%
Cowpea 7%
Lentil 6%
Pigeon pea 6%
Broad bean 6%
Other 10%
Source: FAO Stat
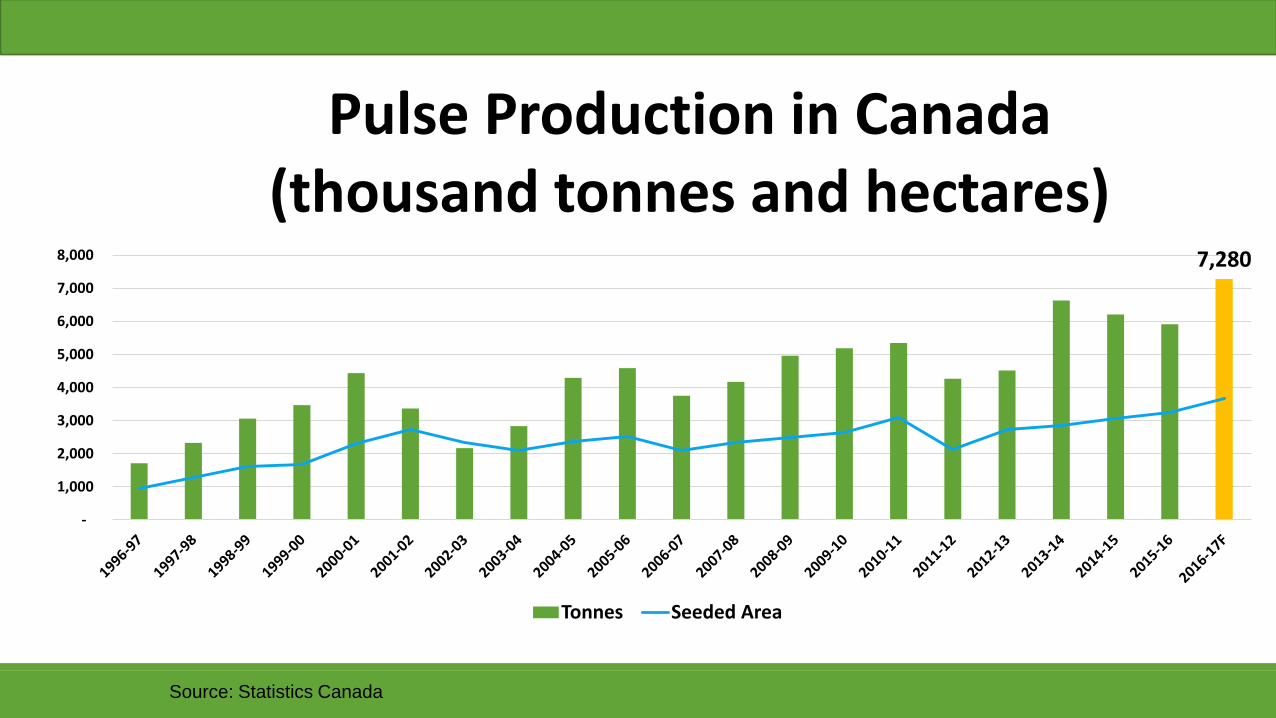
Source: Statistics Canada
7,280
-
1,000
2,000
3,000
4,000
5,000
6,000
7,000
8,000
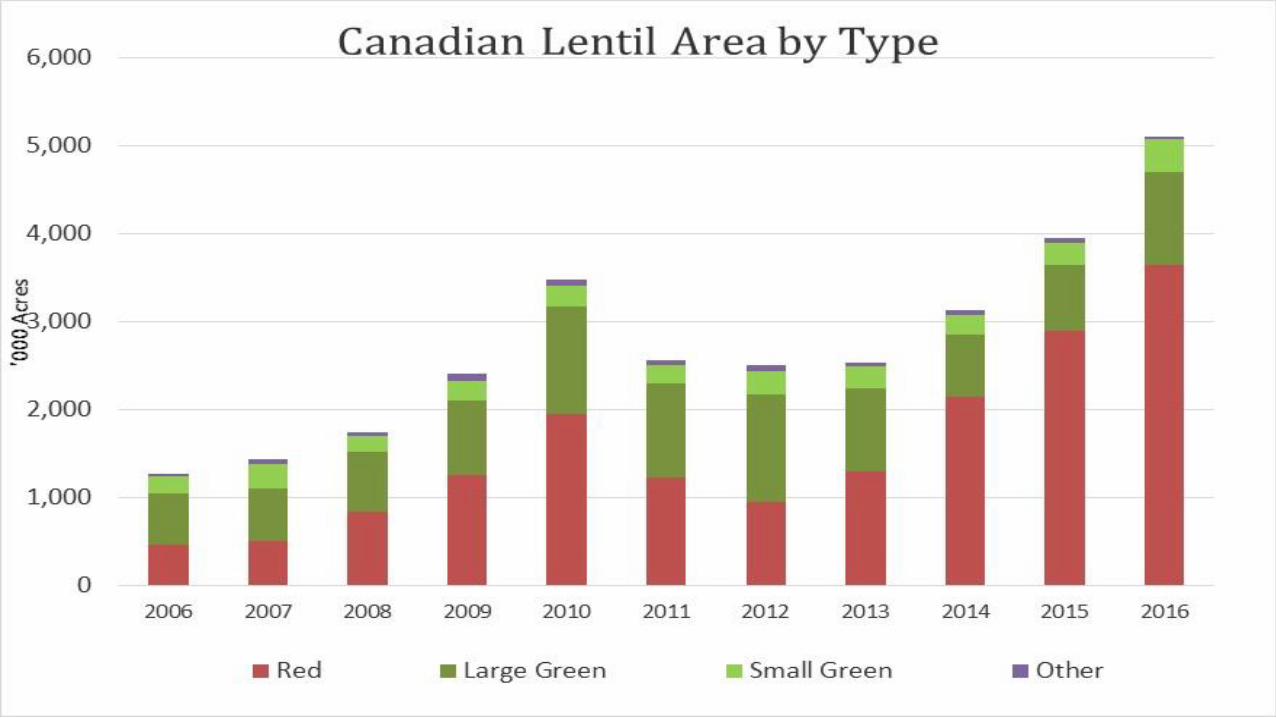
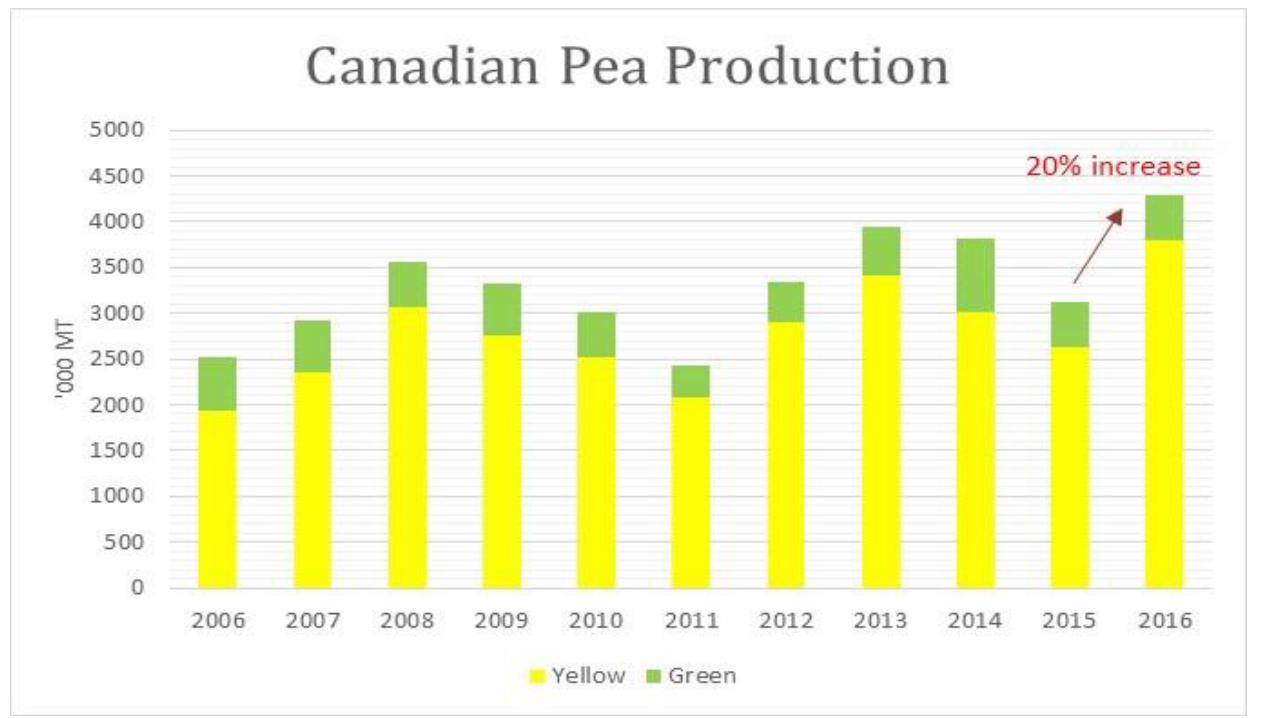
Pulse Production in Canada (thousand tonnes and hectares)
Tonnes Seeded Area
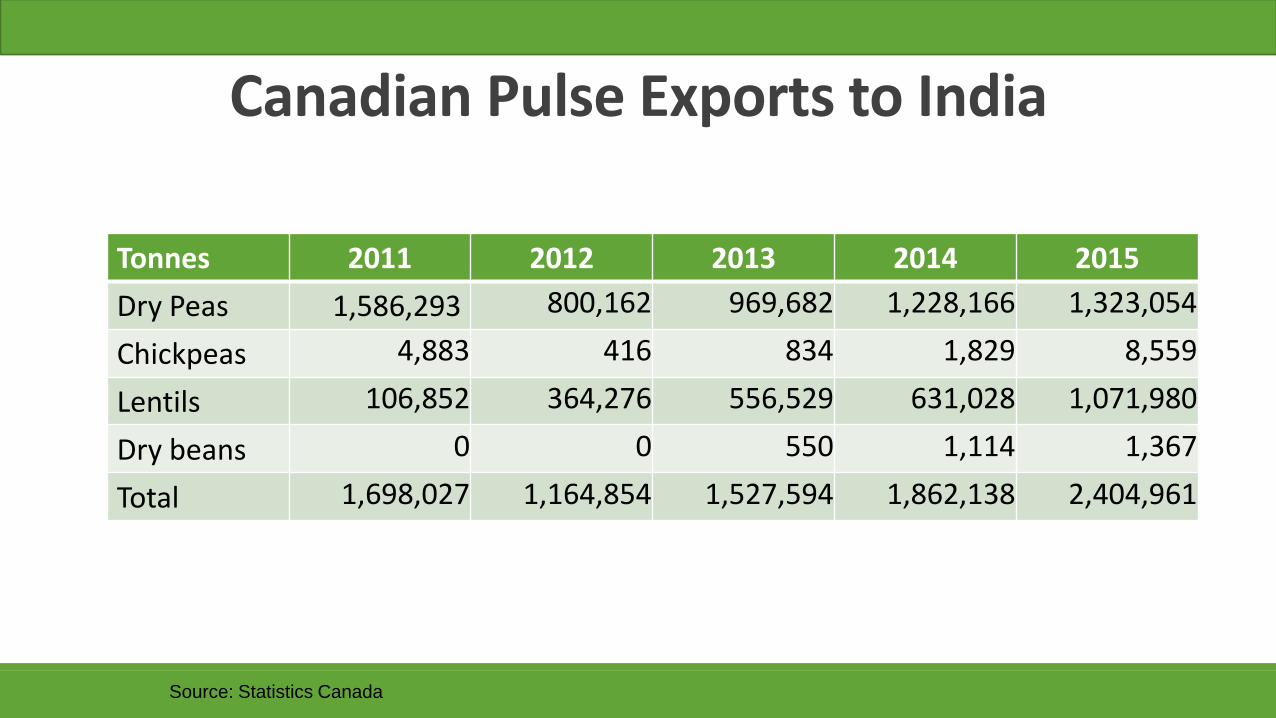
Tonnes 2011 2012 2013 2014 2015
Dry Peas 1,586,293 800,162 969,682 1,228,166 1,323,054
Chickpeas 4,883 416 834 1,829 8,559
Lentils 106,852 364,276 556,529 631,028 1,071,980
Dry beans 0 0 550 1,114 1,367
Total 1,698,027 1,164,854 1,527,594 1,862,138 2,404,961
Canadian Pulse Exports to India
Source: Statistics Canada

• Largest Grain Marketing consulting service in Canada
• Professionally-developed written analysis of grain, oilseed, pulses, special crop and other relevant markets.
• Ongoing recommendations and long-term strategy ideas.
• Know exact cost of production and ROI

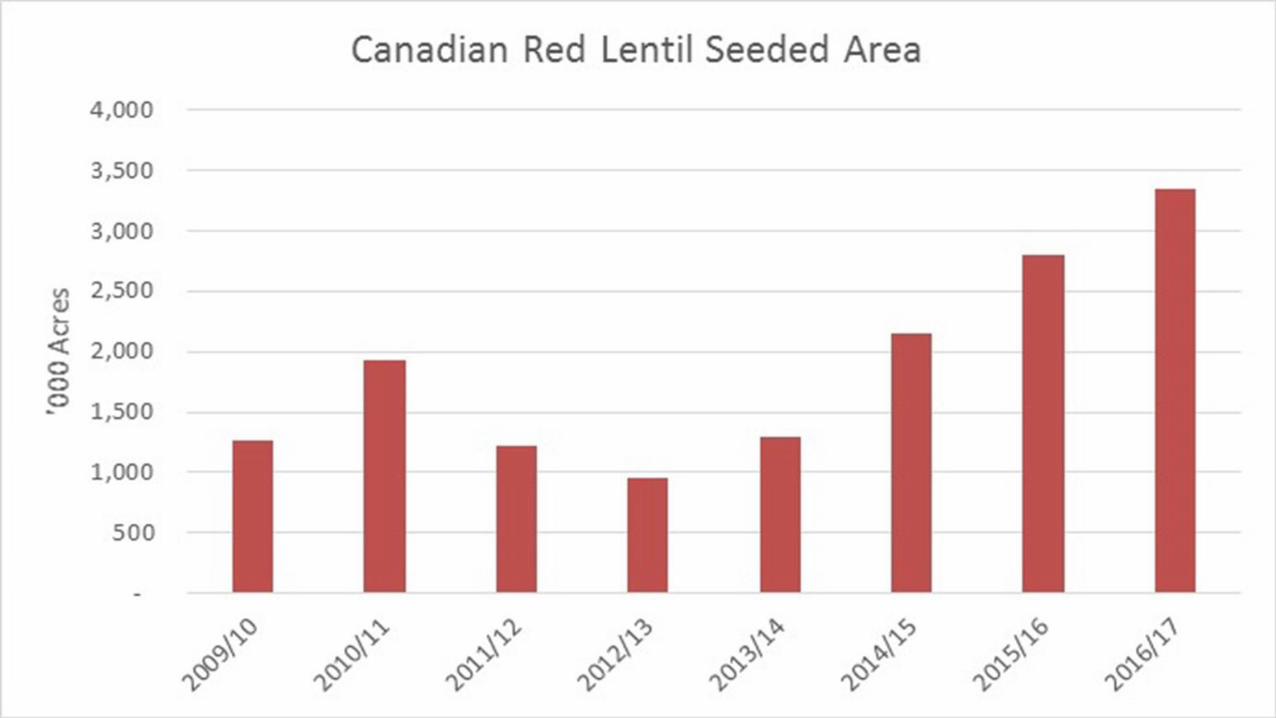

2011/12 2012/13 2013/14 2014/15 2015/16 5 year avg 2016/17
Carry in 503 531 110 240 145 306 64
Seeded Area (acres) 1,228 950 1,300 2,150 2,890 1,704 3,650
Harvested area 1,187 931 1,287 2,129 2,881 1,683 3,577
Harvested % 97% 98% 99% 99% 97% 98% 97%
Average yield (lbs per acre) 1,476 1,374 2,160 1,480 1,350 1,568 1,554
Average yield (tonnes per acre) 25 23 36 25 23 26.1 25.9
Production (MT) 790 580 1,261 1,429 1,764 1,165 2,521
Total Supply 1,293 1,111 1,371 1,669 1,909 1,471 2,586
Exports 582 890 1,026 1,324 1,720 1,108 1,840
Domestic 180 175 105 200 125 157 255
Total Demand 762 1,065 1,131 1,524 1,845 1,265 2,095
Ending Stocks 531 110 240 145 64 218 491
Stocks:Use 70% 10% 21% 10% 3% 23% 23%
Canadian Red Lentil Supply and Demand
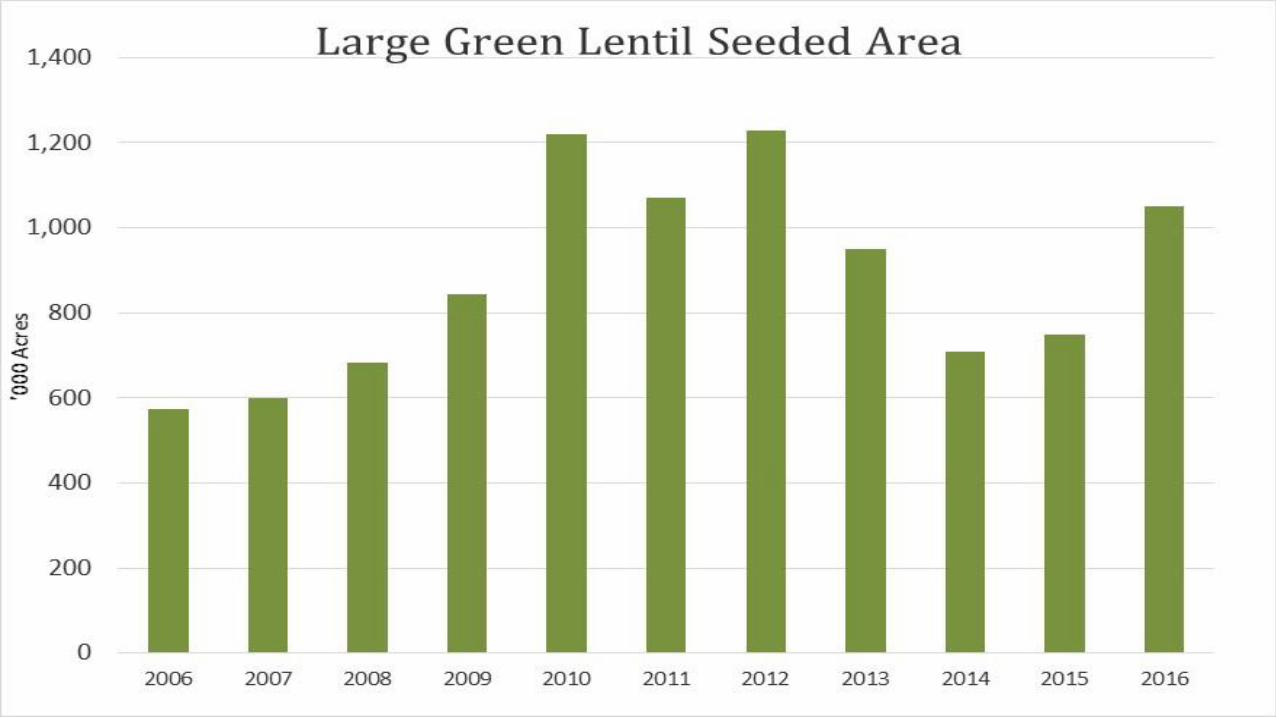
2011/12 2012/13 2013/14 2014/15 2015/16 5 year avg 2016/17
Beginning Stocks 280 287 300 389 136 278 33
Seeded Area (Acres) 1,070 1,230 890 710 750 930 1,050
Harvested Area 1,018 1,205 863 690 735 902 1,019
Harvested % 95% 98% 97% 97% 98% 97% 97%
Average yield (lbs per acre) 1,359 1,306 1,920 1,255 1,290 1,426 1,410
Average yield (tonnes per acre) 23 23 32 21 22 23.3 23.5
Production (MT) 631 748 729 393 430 586 651
Total Supply 911 1,035 1,029 782 566 865 685
Exports 449 605 580 596 495 545 560
Domestic 175 190 60 50 38 103 50
Total Demand 624 795 640 646 533 648 610
Ending Stocks 287 300 389 136 33 229 75
46% 38% 61% 21% 6% 35% 12%
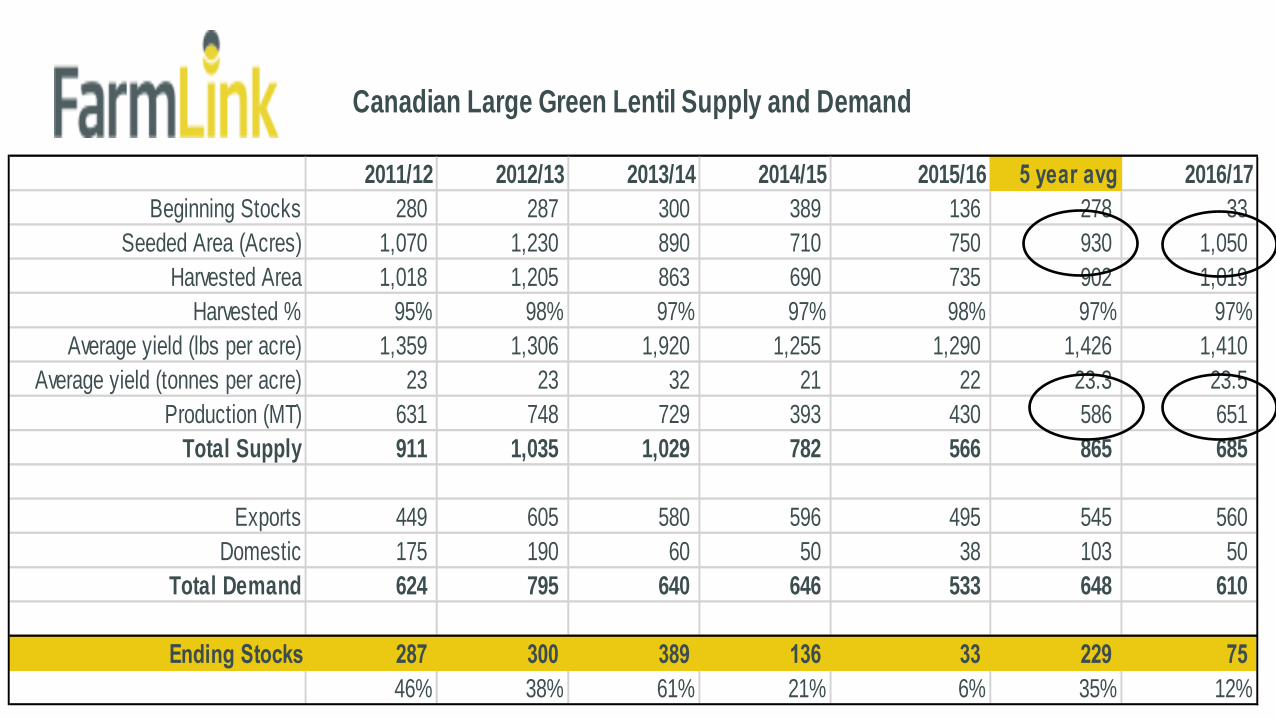
Canadian Large Green Lentil Supply and Demand

2012/2013 2013/2014 2014/2015 2015/2016 5 YEAR AVG 2016/17
Beginning Stocks 171 105 225 275 194 50
Seeded Area (Acres) 2,900 2,775 3,135 3,100 2,978 3,750
Harvested Area (Acres) 2,816 2,747 3,088 3,065 2,929 3,695
Yiled (bu/acre) 37.9 45.6 35.9 31.5 37.7 37.8
Production 2,904 3,409 3,017 2,696 3,007 3,801
Imports 15 20 20 19 19 19
Total Supply 3,091 3,534 3,262 2,990 3,219 3,870
Exports 2,296 2,282 2,794 2,640 2,503 2,850
Domestic Use 690 1,000 193 300 546 500
Total Demand 2,986 3,282 2,987 2,940 3,049 3,350
Yellow Ending Stocks 105 225 275 50 164 520
Canadian Yellow Pea Supply and Demand
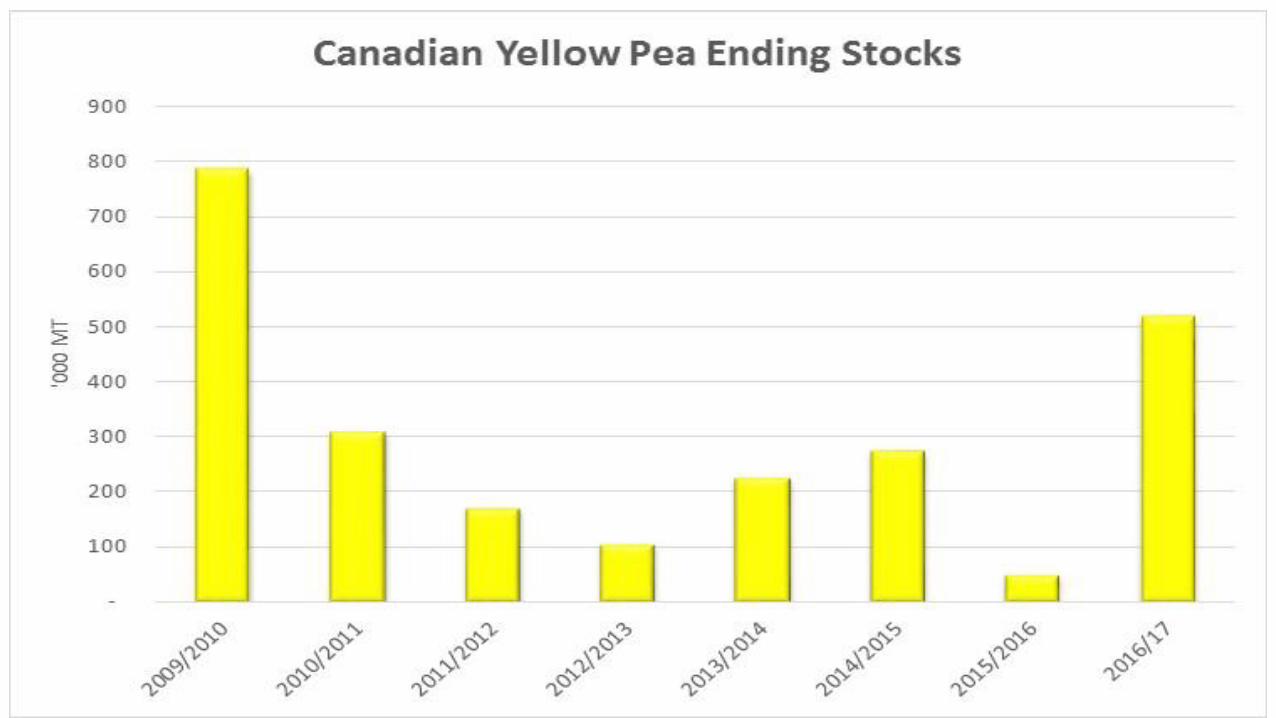

2012/2013 2013/2014 2014/2015 2015/2016 5 YEAR AVG 2016/17
Beginning Stocks 83 69 84 414 162 331
Seeded Area (Acres) 440 515 825 580 590 500
Harvested Area (Acres) 425 497 817 565 576 498
Yiled (bu/acre) 38 40 34 32 36 37
Production 397 540 794 500 558 499
Imports 20 5 16 2 11 1
Total Supply 500 614 894 916 731 830
Exports 251 280 300 360 298 325
Domestic Use 180 250 180 225 209 200
Total Demand 431 530 480 585 507 525
Green Ending Stocks 69 84 414 331 224 305
Canadian Green Pea Supply and Demand

The Global “Pulse Brand”

Pulse Brand Values
21
Health
Nutrition
Sustainability

Benefits of
Pulses
Satiety
Regularity/ Digestive Health
Post-prandial glycemia
Blood Pressure
Cholesterol
Health Benefits of Dietary Pulses

Beans and Cholesterol-Lowering
2012 NDI Review Barley Flax Beans
Health Canada approval date
July, 2012 January, 2014 n/a
# of Studies 13 8 7
“Consistency” of Evidence
100% for TC 94% for LDL-C
100% for TC 100% for LDL-C
83.3% for TC 83.3 % for LDL-C
Strength of Evidence
78% for TC 78% for LDL-C
25% for TC 0% for LDL-C
50% for TC 33.3% for LDL-C

Glycemic Index
Rice 89
Potato 82
Pasta 60
Corn 60
Quinoa 53
Lentils 29
http://www.health.harvard.edu/healthy-eating/glycemic_index_and_glycemic_load_for_100_foods
Pulses have a low glycemic index

25
Life Cycle Analysis of Pulses in Crop Rotation, 2011
Saskatchewan Research Council
Wheat/Oileed Rotation

Arjen Y. Hoekstra and Ashok Chapagain, Globalization of Water, U. of Twente, Waterfootprint.org, National Geographic, April 2010 Mekonnen and Hoekstra, 2012, A global assessment of the water footprint of farm animal products
Beef
216 Gallons/lb
368 Gallons/lb
469 Gallons/lb
756 Gallons/lb
1,857
43 gallons/lb
Pulses
gallons/lb
Pork
Chicken
Peanuts
Soybeans
Pulses
Pulses are an affordable and water efficient source of protein
