iea dsm task 17
TRANSCRIPT

IEA DSM Task 17: Integration of DSM, DG, RES and ES Outcome of Phase 1+2 Introduction to Phase 3
Matthias Stifter (AIT Energy Department, Austria) René Kamphuis (TNO, The Netherlands)
Content
§ Task 17 introduction § Phase 1 (finished: Operating Agent: VTT Finland); 2007-2009 § Phase 2 (finished: Operating Agent: VTT Finland); 2009-2012 § Phase 3 – Currently in the definition phase (Operating Agents: TNO/AIT)
§ Introduction to Phase 3
2 2013-10-18

Introduction (1)
Implementing Agreement on Demand Side Management Task 17 § Objectives
§ Optimal integration of DR, DG and Storage § Mechanisms to ideally support electricity grid and market operation
§ Phase 1 § Inside the IEA DSM Agreement a scope study was carried out:
• Overview of the Situation • Pilot case studies database • Vision and conclusion
§ Phase 2 § A assessment of DER technologies in combination with DSM was carried out:
• Assessment of technologies and penetration scenarios(+ Pilot case studies) • Stakeholders involved and effects on the stakeholders • Assessment of quantitative effects on the power system and stakeholders • Conclusion and recommendations
3 2013-10-18

Phase 1 Ranking technologies: Results of phase 1
Electricity supply
Fossil fuel based technologies § fuel cells § micro chp § conventional chp
Young Existing Mature
Renewables § Wind § pv § small hydro § waves, tidal § biomass
Mature Existing/Mature Mature Young/Mature Young/Mature
Renewable production forecasting Young/Existing
Electrical energy storage § energy management § bridging power § power quality
Young/Mature Existing/Mature Early/Existing
Economic dispatch, SCUC software Mature Resource planning techniques, tools Mature Real-time grid operation tools Mature
Electricity demand
Many DSM techniques Mature Automated DR devices Young Pricing granularity (smart rates) § Small customers § Large customers
Early Existing
Consumer response and production Early
4 2013-10-18
NordPool-2003 APX-2003

Phase 1 (cont’d)
5 2013-10-18
Communication, control and monitoring
Communication networks Mature High-speed digital monitoring § Generation § Transmission (EU) § Transmission () § Distribution
Mature Mature Young Early
Smart meters deployment Young/Existing Cyber-security Young/Existing Interoperability Existing Functional Automation/Monitoring § for large assets § for DER
Mature Young
Intelligence/Smart behaviour Young User/primary process feedback Young/Existing Intelligent agents and distributed controllers Young
Communication semantic and content Young/Existing
Integration analytics
Modelling electricity system impacts Young/Existing
Understanding relative costs and benefits Existing
Controlling and coordinating parts Young Good, real data Early / Young
Regulation, policy and business
How to capture benefits
Young/Existing Incentives and subsidies How to pay for everything Taxation Aggregator business
Ranking technologies: Results of phase 1

Phase 2
Methodology of Phase 2 1. Analyse the status quo of DER penetration at customer’s premises 2. Derive future technology penetration scenarios for 2020 and 2030 3. Estimate the DG and DSM/DR potential based on future scenarios and the project
database 4. Analyse the impact of future penetration scenarios and the benefits of DSM/DR. 5. Estimate of costs which are necessary to facilitate DSM/DR potentials 6. Evaluate the effects on the involved stakeholders.
6 2013-10-18
Phase 2
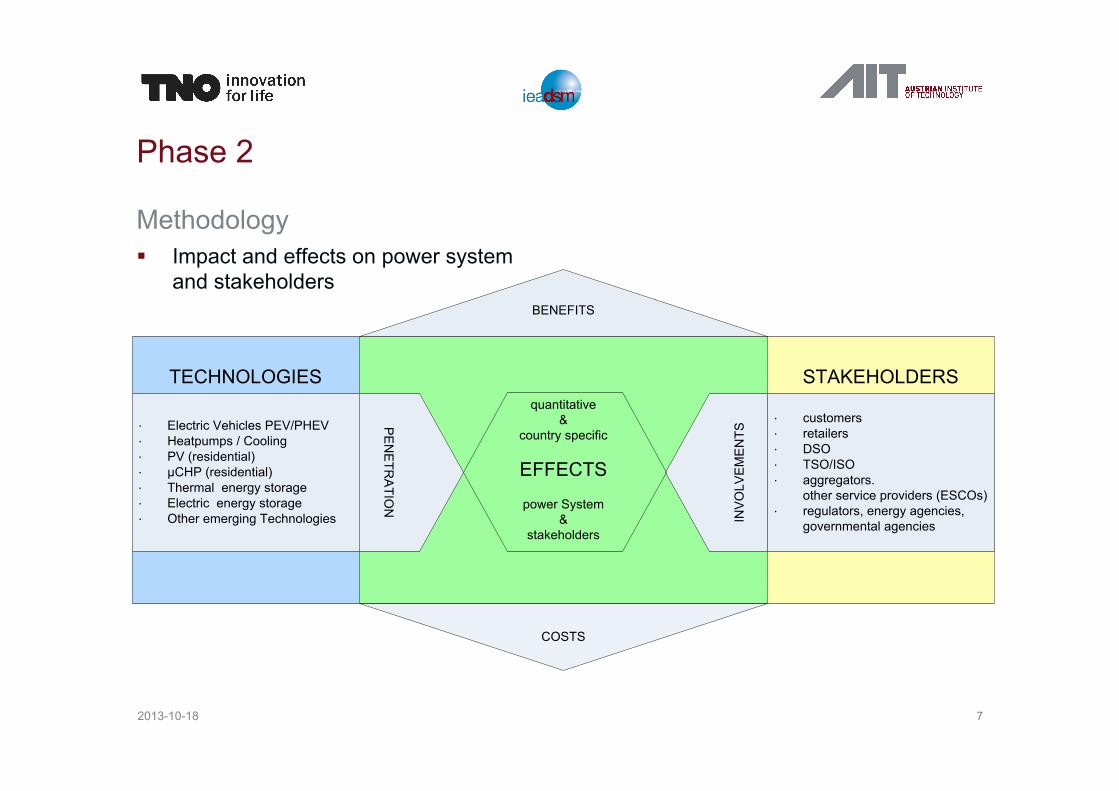
Methodology § Impact and effects on power system
and stakeholders
7 2013-10-18
STAKEHOLDERSTECHNOLOGIESquantitative
&country specific
EFFECTS
power System&
stakeholders
·∙ Electric Vehicles PEV/PHEV·∙ Heatpumps / Cooling·∙ PV (residential)·∙ µCHP (residential)·∙ Thermal energy storage·∙ Electric energy storage·∙ Other emerging Technologies
·∙ customers·∙ retailers·∙ DSO·∙ TSO/ISO·∙ aggregators.
other service providers (ESCOs)·∙ regulators, energy agencies,
governmental agencies
PENETR
ATION
INVO
LVEM
ENTS
BENEFITS
COSTS

Example technology: Heatpumps (1)
Country situation in Austria § Mean and total electrical power consumption (Biermayr 2010)
§ Status quo and future scenarios (Haas 2007)
8 2013-10-18
Use water HP Heating HP Air condition HP Sum
Thermal Power (mean) [kWth / HP a] 2,75 10,8 2,67 Thermal Power (total) [MWth] 224 862 9 1.096 Electrical power (mean / HP) [kWel/ HP a] 1.1 3 1.07 Electrical power (total) [MWel] 90 240 4 333
HP power classification
Percentage on the total share [%]
2009 [MWel] Status quo
2020 [MWel]
2020 [MWel]
2030 [MWel]
2030 [MWel]
B a s e l i n e scenario
Acce le ra ted scenario
Base scenario Acce le ra ted scenario
Installed HP 164.000 250.000 233.000 343.000 455.000 < 20kW 90% 300 457 426 627 831 20kW-80kW 9% 30 46 43 63 83
> 80 kW 1% 3 5 5 7 9 Total [kW] 100% 333 508 473 696 924

Example Technology: Heatpumps (2)
Practical potentials scenario for HPs in Austria
§ Assumptions: § Relative share of HP power classes stay the same § Full load hour from (Biermayr 2010):
1540h à 35-40% from 924MW, availability in 6 month of cold season (full load hour only during 8760h/2 – half of the year)
§ DSM facilitation: § Start with facilitating the big HPs (> 80kW to 20kW class):
approx. 2000 HPs = 92MW in 2030 (Total el. power per class / mean per class)
à Practical potential (2000 biggest heat pumps) would be 36,8MW
(Assuming thermal energy storage and thermal capacity to shift demand)
9 2013-10-18

René Kamphuis IEA
Example project database: Ecogrid Bornholm
Demonstration in a “real”
system with 50 % RES
Operated by the local municipal owned
DSO, Østkraft
Interconnected with the Nordic power Market
High variety of low carbon energy sources
Several active demand & stationary
storage options
Eligible RD&D infrastructure & full
scale test laboratory
Strong political commitment & public support
April 24, 2013
10
René Kamphuis IEA
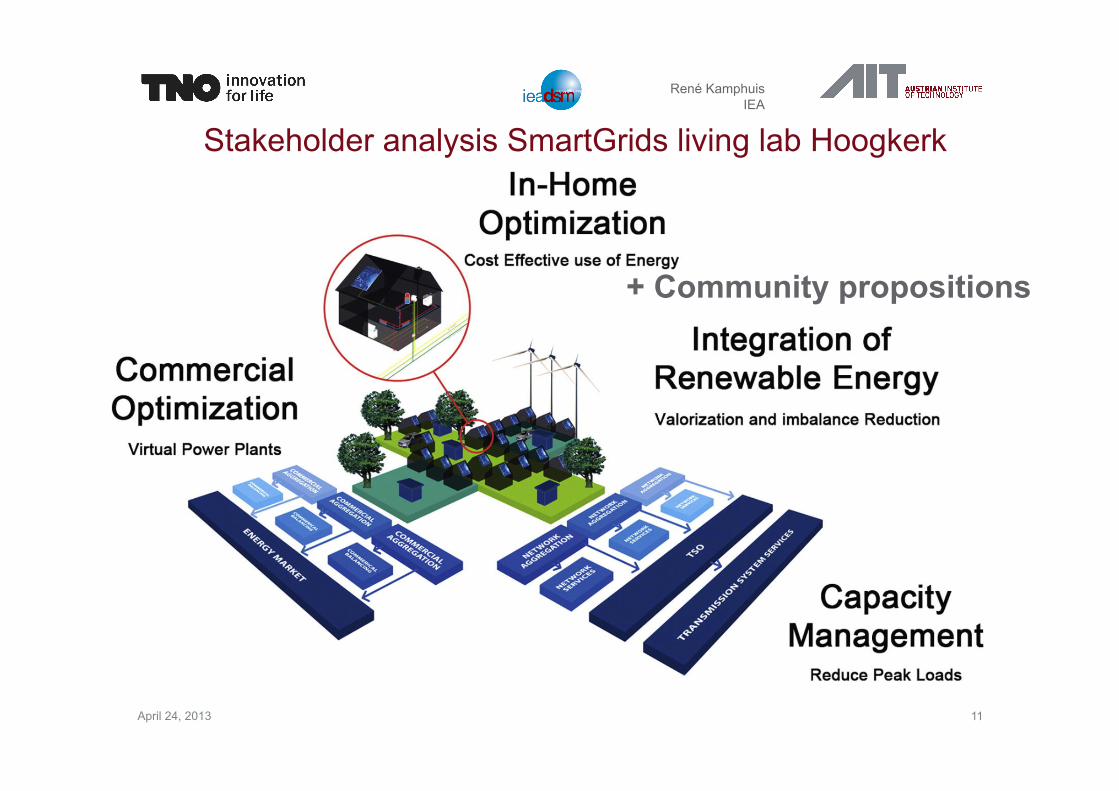
Stakeholder analysis SmartGrids living lab Hoogkerk
+ Community propositions
April 24, 2013 11

René Kamphuis IEA
Example project database heat pumps: Couperus/congestion management
April 24, 2013
12

April 24, 2013 René Kamphuis IEA
13
Intelligent charging infrastructures

Example Project database: Electric vehicles
Pilot projects: Netherlands § Enexis: controlled charging of EVs
14 2013-10-18

Validation of charging management
§ Real and simulated EVs for charging management validation
15 2013-10-18
Charge Controller
Real World
Electric Vehicle Simulation EnvironmentEVSim
Charging StationEV
Data ExchangeInterface(OPC)
Charging Station
Charging Station
EV
ECAR DVCharging
Management
DEMSDistributed Energy
Management System
Charging StationEV
EV
RenewableGeneration
0 50
100 150 200 250 300 350 400 450 500 550
06:0
0
06:3
0
07:0
0
07:3
0
08:0
0
08:3
0
09:0
0
09:3
0
10:0
0
10:3
0
11:0
0
11:3
0
Pow
er [k
W]
time [hh:mm]
Tolerance range Pact Pset
-40
-20
0
20
40
60
06:0
0
06:3
0
07:0
0
07:3
0
08:0
0
08:3
0
09:0
0
09:3
0
10:0
0
10:3
0
11:0
0
11:3
0
Pow
er [k
W]
time [hh:mm]
Level Pset ΔP
Tolerance range, Pset and Pact during simulation and deviation

Temperature dependency
§ Region Lungau (Upper Austria) – approx. 6000 EVs
16 2013-10-18 Charging power for opportunity charging on a winter and summer day
Micro-simulation of region Lungau, generating trip data

Simulation of EVs, control and power system
§ Local supply - demand match in medium voltage networks
17 2013-10-18
Uncontrolled and controlled charging of 306 EVs with 11 kW during two sumer days.
Note: wind is accumulated on top of PV generation
0
100
200
300
400
500
600
700
800
00:0
0
04:0
0
08:0
0
12:0
0
16:0
0
20:0
0
00:0
0
04:0
0
08:0
0
12:0
0
16:0
0
20:0
0
Pow
er [k
W]
time [hh:mm]
Generation from Wind
Generation from PV
Uncontrolled 11kW
Controlled 11kW; SOC-Level: 50%
Controlled 11kW; SOC-Level: 25%
Charging Mode
empty Evs
P-peak [kW]
Charged Energy [kWh]
DER Energy [kWh]
DER Coverage
[%]
uncontrolled 11kW 135 883 12613 3971 26%
controlled 11kW/SOC50 197 552 7267 3971 50%
controlled 11kW/SOC25 218 353 5051 3971 71%
Charging Mode
empty EVs
P-peak [kW]
Charged Energy [kWh]
DER Energy [kWh]
DER Coverage
[%]
uncontrolled 11kW 15 751 9964 8079 54%
controlled 11kW/SOC50 55 366 6832 8079 89%
controlled 11kW/SOC25 66 324 6229 8079 99%
Two days simulation in winter
Two days simulation in summer

Example Building Grid Interaction
Pilot projects: Austria § CoOpt: Model Predicted Control (MPC) in Building Management Systems (BMS)
18 2013-10-18
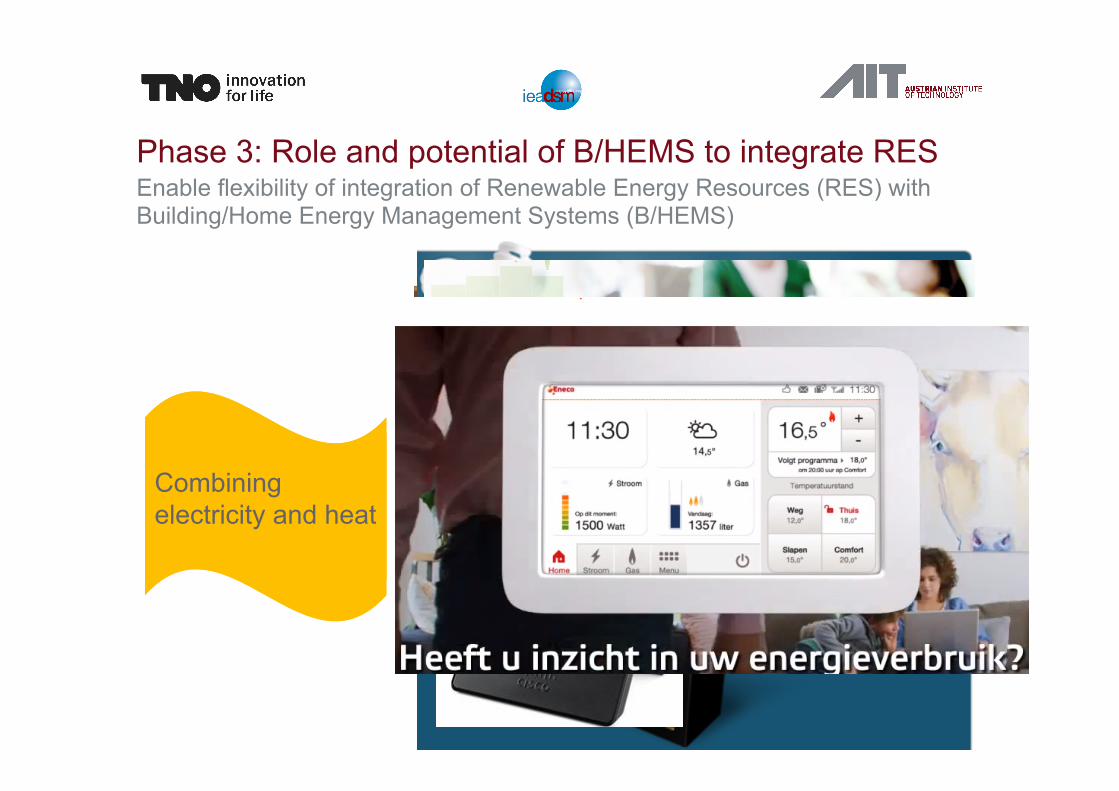
Phase 3: Role and potential of B/HEMS to integrate RES Enable flexibility of integration of Renewable Energy Resources (RES) with Building/Home Energy Management Systems (B/HEMS)
Energy communities Home Energy Management
Linked to generation hardware
Combining electricity and heat
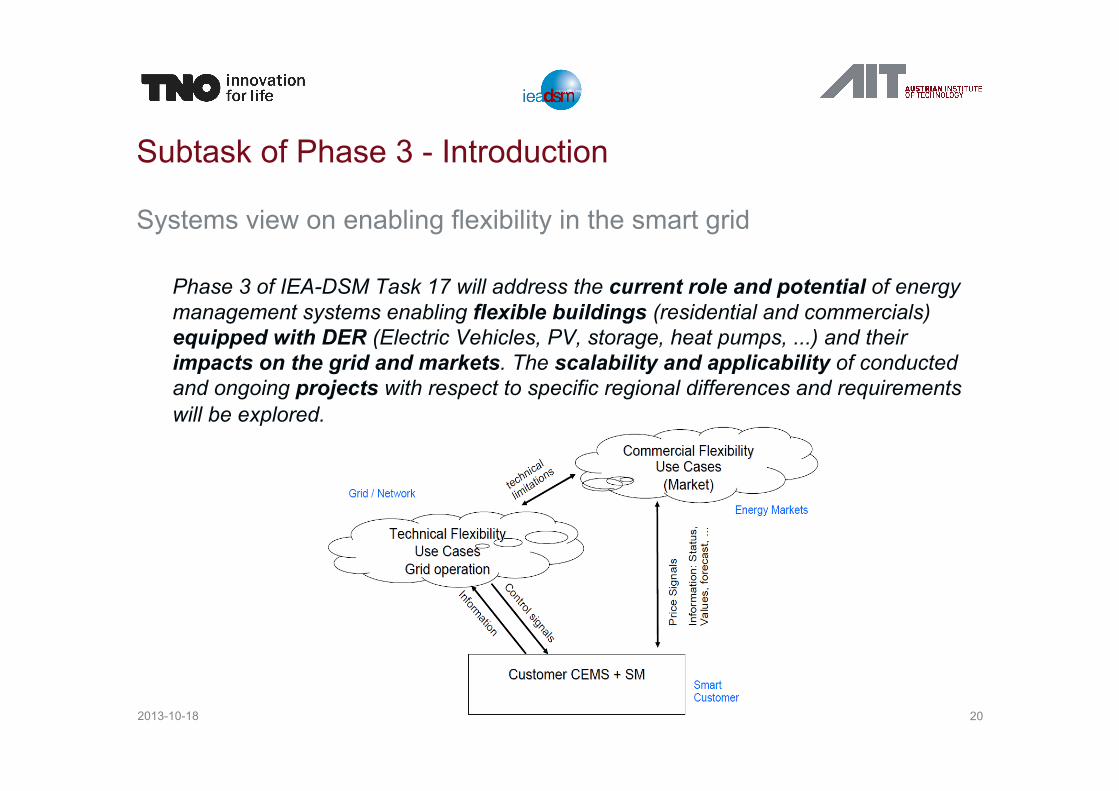
Subtask of Phase 3 - Introduction
Systems view on enabling flexibility in the smart grid
Phase 3 of IEA-DSM Task 17 will address the current role and potential of energy management systems enabling flexible buildings (residential and commercials) equipped with DER (Electric Vehicles, PV, storage, heat pumps, ...) and their impacts on the grid and markets. The scalability and applicability of conducted and ongoing projects with respect to specific regional differences and requirements will be explored.
20 2013-10-18

Subtask of Phase 3 - Introduction
Systems view on enabling flexibility in the smart grid
§ Different views on the Smart Grid: § Technology § Customer § Policy § Market
§ Focus on the enabling of flexibility and the impact of it on the stakeholders: § What are the requirements? § How do we manage it? § How will it effect operation? § What are the benefits?
21 2013-10-18
Homes / Buildings
Customers
Home Energy Management
Systems
-‐ Photovoltaics-‐ Electric Vehicles-‐ Heat Pumps-‐ Smart Meters-‐ CHP
CentralGeneration
T&D Network
Distributed Generation
Flexibility
PolicyTechnology
Customer
Smart Grid
Availability
Volatility
Market
IEA DSM Task 17Phase 3IEA DSM Task 17Phase 3
End of presentation for workshop

Background and Motivation for Task 17 Phase 3
§ „Empower Demand - The potential of smart meter enabled programs to increase energy and systems efficiency: a mass pilot comparison“ vaasaeet for ESMIG, 2011
§ „Shift, not Drift: Towards Active Demand Response and Beyond“ – Think, June 2013
§ IEC/TR 62746-2 (DRAFT), Systems interface between customer energy management system and the power management system – Part 2: Use cases and requirements, June 2013
§ CEN-CENELEC-ETSI Smart Grid Coordination Group – Use Case Management Process – implementation in a standardized way, Nov. 2012
23 2013-10-18

Empower Demand
Results § About 100 pilots studied – structured into 22 variables
§ IHD can save between 3-19% § Good informative billing can save more even IHD is more effective in average
§ Five factors which decide success § Socio-economic factors (surrounding variables) § Participant consumption patterns § Program content/structure § Supportive technology § Household load sources
§ What makes a pilot a success or failure? § Meet the consumer needs with the program § Technology is the enabler § „more is more“: segmentation, feedback, pricing, multiple information § Meet regional market realities § Layered programs
24 2013-10-18

Shift, not Drift
Results § Consumer centered approach – through contract between consumers and
intermediaries § Comments from project advisors, industry and public consultation § Recommendations:
§ Guidlines in form of good practice codes and regulations for customer empowerment and protection
§ Transparency rules for pricing, contracts, etc. § Pilot projects on contracts – engage consumers § Database of pilot studies for dissemination and extrapolation of results § Market entry for new players / market access § access to data § EU wide real time market
25 2013-10-18

CEMS and Power Management System interfaces
Use cases and requirements for the interface between the power management system of the electrical grid and customer energy management systems for residential and commercial buildings and industry.
§ User stories à use cases à data model à information content & structure
§ Examples: § The user wants to get the laundry done
/ EV charged by 8:00pm § Grid recognize stability issues § CEM feeds own battery pack energy
into own network or into the grid § Heat pump and Photovoltaic Operation
with Real-Time Tariff
26 2013-10-18
IEC 62746 Technical Report Objective

Smart Grid Coordination Group – Sustainable Processes
The “Smart Grid Use Case Management Process” essentially describes the implementation of use cases in the standardization environment.
§ Flexibility concept, understand demand response, Smart Grid & EV § à Flexibility functional architecure § à Use Case collection § Examples:
§ Customer Energy Manager (CEM) § Market roles and interaction § Assessing impact of flexible
resources on the grid (traffic light) § Flexibility operator
27 2013-10-18
CEN, CENELEC and ETSI - M/490
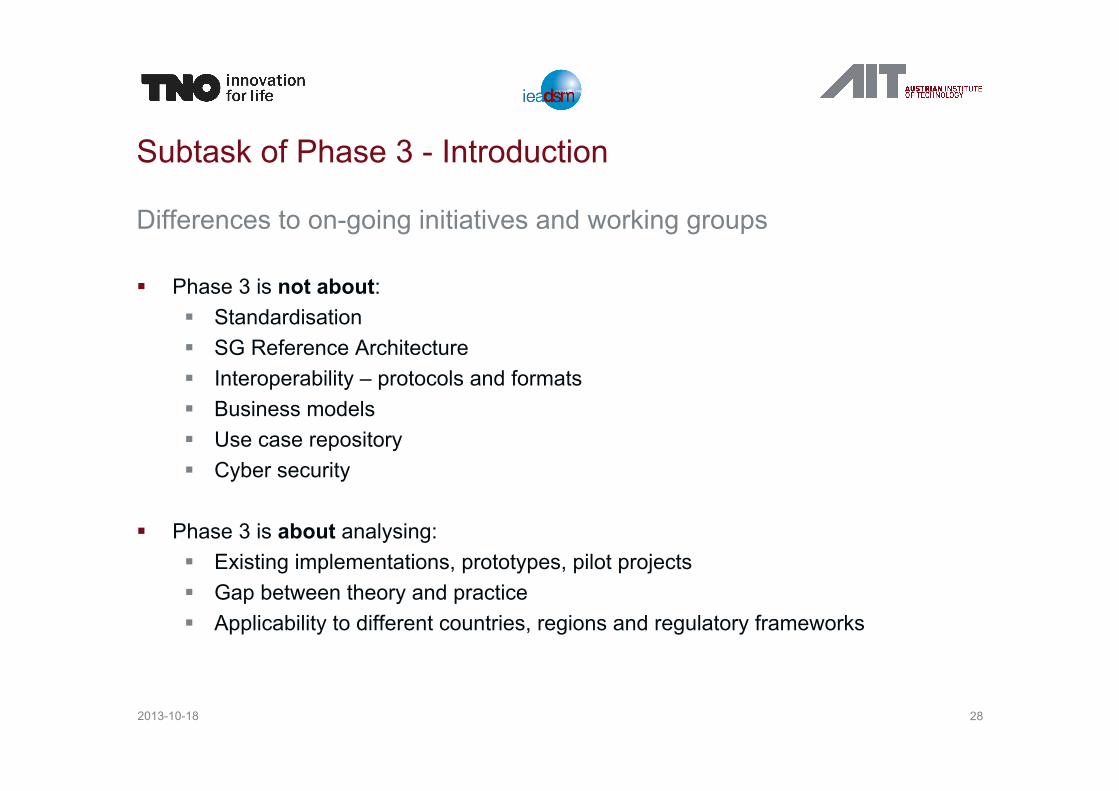
Subtask of Phase 3 - Introduction
Differences to on-going initiatives and working groups
§ Phase 3 is not about: § Standardisation § SG Reference Architecture § Interoperability – protocols and formats § Business models § Use case repository § Cyber security
§ Phase 3 is about analysing: § Existing implementations, prototypes, pilot projects § Gap between theory and practice § Applicability to different countries, regions and regulatory frameworks
28 2013-10-18

Subtask of Phase 3 - Introduction
Systems view on enabling flexibility in the smart grid § Technical Interfaces CEN-CENELEC-ETSI Smart Grid Coordination Group
29 2013-10-18

Subtask of Phase 3 – Overview of the Subtasks
Systems view on enabling flexibility in the smart grid
§ Subtask 10: Role, and potentials of flexible prosumers (households, SMEs, buildings)
§ Subtask 11: Changes and impact on stakeholders operations
§ Subtask 12: Sharing experiences and finding best/worst practices
§ Subtaks 13: Conclusions and recommendations
30 2013-10-18

Subtask of Phase 3 – Subtask 10
Role, and potentials of flexible prosumers (households, SMEs, buildings)
§ Controllability requirements (generation and consumption)
§ Opportunities, challenges and barriers for flexibility services (providers and technologies)
§ Energy and power balancing potentials
§ Smart technologies (SM and Customer Energy MS) § VPPs § EV charging § DG-RES integration and storage § Integrating heat pumps and thermal storages
31 2013-10-18

Subtask of Phase 3 – Subtask 11
Changes and impact on stakeholders operations
§ Methodology development for assessing/quantifying impact
§ Grid, market and customers (prosumer/consumer)
§ Sharing common benefits/losses
§ Optimization potential (eg. DR building audits and customer requirements)
§ Regulatory and legislative requirements
§ Comparison costs vs. delayed investments
32 2013-10-18
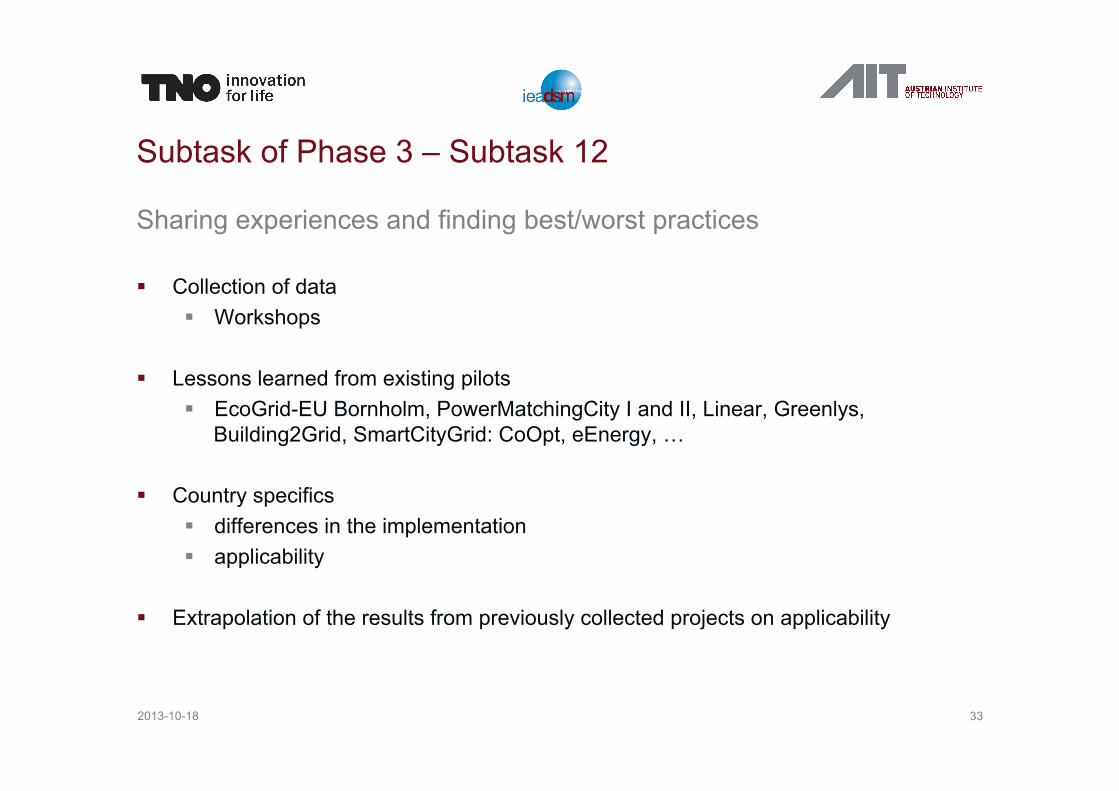
Subtask of Phase 3 – Subtask 12
Sharing experiences and finding best/worst practices
§ Collection of data § Workshops
§ Lessons learned from existing pilots § EcoGrid-EU Bornholm, PowerMatchingCity I and II, Linear, Greenlys,
Building2Grid, SmartCityGrid: CoOpt, eEnergy, …
§ Country specifics § differences in the implementation § applicability
§ Extrapolation of the results from previously collected projects on applicability
33 2013-10-18

Subtask of Phase 3 – Subtask 13
Conclusions and recommendations
§ Based on the experts’ opinion
§ Will provide a ranking based on § Impacts § Costs § Future penetration of the technologies
34 2013-10-18

Experiences from pilots and field tests Sharing best and bad practices and defining use cases

ISGAN
René Kamphuis Workshop Delft

Collaboration with ISGAN
Contributions and exchange of results with focus on DSM technologies Collaborations on DSM specific focus: § Common workshops § Contribute to ISGAN reports
Annex 1: § Requirements for enabling flexibility
Annex 2: § Use Cases and implementation models § Best and bad practices
Annex 3: § Impact on stakeholders § Cost and benefits
Annex 4: § Recommendations
37 2013-10-18
Homes / Buildings
Customers
Home Energy Management
Systems
-‐ Photovoltaics-‐ Electric Vehicles-‐ Heat Pumps-‐ Smart Meters-‐ CHP
CentralGeneration
T&D Network
Distributed Generation
Flexibility
PolicyTechnology
Customer
Smart Grid
Availability
Volatility
Market
IEA DSM Task 17Phase 3IEA DSM Task 17Phase 3

Collaboration with IC-CSHBA
Contributions and Exchange IEEE-Standards Association Industry Connections - Convergence of Smart Home and Building Architectures (IC-CSHBA): § Common workshops
§ Exchange experiences
§ Implementation Guide white paper § Use Cases and implementation models § Best and bad practices § References
§ Recommendations
38 2013-10-18
Outlook
IEA-DSM Task 17 – Phase 3
§ Start: January 2014
§ Collaborations § ISGAN § IEEE IC-CSHBA § EC SG-Expert Group on Interoperability § IEEE IES TC SG
§ Next steps: § Define workplan § Commitment from participating countries § Kick-off
39 2013-10-18

AIT Austrian Institute of Technology TNO Netherlands organization for science and technology
Matthias Stifter René Kamphuis
Energy Department Complex Energy Systems Giefinggasse 2 1210 Vienna Austria T +43(0) 50550-6673 M +43(0) 664 81 57 944 F +43(0) 50550-6613 [email protected] http://www.ait.ac.at
Energy efficiency program Service enabling and management Eemsgolaan 3, 9727 DW Groningen T +31 (0) 621134424 PO Box 1416 9701 BK Groningen The Netherlands [email protected] www.tno.nl