ict sustainability: the global benchmark 2011 · professional services 38...
TRANSCRIPT

ICT Sustainability:
The GlobalBenchmark 2011
1

An International Perspective
This paper contains the findings of a seven country benchmark to determine the maturity of ICT Sustainability practices and technologies in end user organizations. The research utilizes a unique methodology to quantify ICT Sustainability implementation, providing detailed insights across many different components and industry sectors. ICT Sustainability is a vast cross functional subject and has a critical leadership role in enabling sustainable business practices across all sectors.
Cover Image – San Francisco
"San Francisco is rated as one of the most sustainable cities in the world”
June 2011, Siemens Economist
Intelligence Unit Report
2

An InternationalPerspective
Table of Contents
Foreword 4At a Glance 5Key Findings 6Measuring ICT’s Power Consumption 14ICT Sustainability Indices by Country 16
Australia 18Canada 20China 22India 24New Zealand 26United Kingdom 28United States of America 30
ICT Sustainability Indices by Industry 32Financial Services 33Government 34Health/Education/Welfare 35ICT/Communications/Media 36Manufacturing 37Professional Services 38Utilities/Construction/Mining 39Wholesale/Retail/Logistics 40
Methodology 41
3

This report summarizes the findings of a survey of 1,000 CIOs and senior ICT managers from around the globe, conducted in 2011 to determine the maturity of their ICT Sustainability practices and technologies.
ICT is a large consumer of energy, and is globally responsible for 3 per cent of greenhouse gas (GHG) emissions. At current rates of growth in ICT usage, this is forecast to grow to 6 per cent by 2020. More importantly, ICT is responsible for 5 to 10 per cent of the typical economy’s total electricity consumption. In some organizations that rely heavily on ICT, such as banks, government and in many other administrative industries, ICT can account for up to 75 per cent of all energy consumption.
The ICT industry must decarbonize itself to the greatest extent possible and exploit its unique opportunity to build and deploy enabling technologies. The application of ICT in areas such as smart grids, smart logistics, smart transport systems, smart building systems, cloud computing and the supporting societal applications will enable significant reductions in emissions in other industry sectors, and support the transition to a prosperous low carbon economy.
Most ICT-using organizations have attempted to reduce their ICT energy consumption. Typically, initiatives have concentrated on highly visible energy saving techniques and technologies such as server virtualization, phasing out CRT monitors, removing screen savers, duplex printing and turning off PCs when they are not in use. Many other initiatives are being introduced to a lesser extent, including improved disposal of e-waste, increased use of unified communications and collaboration tools, energy visualization, efficient data center design, and management systems of all assets.
Our research demonstrates that comparatively few organizations have made significant inroads into making ICT more sustainable. This is very apparent in the lack of visibility of ICT’s power bill. Very few organizations are effectively measuring the consumption or efficiency of ICT. It is impossible to evaluate the effectiveness of ICT Sustainability activities without understanding the baseline, highlighting the key issue for improvement in ICT Sustainability of accountability and responsibility.
ICT is pervasive in business and extends far beyond the data center or the ICT department. ICT Sustainability is the responsibility of all of us, be it end users, lines of business, the procurement function, senior management or our customers, we all have a role to play.
Alison RoweGlobal Executive Director Sustainability, Fujitsu
Foreword
4

IntroductionAt a Glance
The research provides a number of valuable insights into the comparative ICT Sustainability performance of organizations in each of the countries surveyed, and between industry sectors within countries. As we found in 2010, there is a relative lack of maturity of ICT Sustainability policies, practices and technologies. Although some industries and countries are maturing in ICT Sustainability, the overall performance is relatively low.
Not only is the maturity low, the overall index has declined slightly from 2010, indicating that some of the buzz has gone from Green ICT and that it is not being given priority or initiatives have begun to come unstuck. On the positive side we have seen an increase in ICT solutions that include ICT Sustainability at the core, such as Cloud Computing, the design of sustainable data centers and the increasing use of renewable energy onsite.
14.2%
The average ICT Sustainability Index in 2011, measured across all countries and all industry sectors.
The decline in the Index from 2010 to 2011, indicating that the maturity of ICT Sustainability has decreased over the last 12 months.
The difference in the average index for those organizations that have total control over and responsibility for their ICT power consumption 65.1, and those who have never even thought about it 45.5.
The proportion of ICT departments who include the cost of ICT’s power consumption in their ICT budget.
The highest Index for any industry in any country: Manufacturing in Canada.
The ICT Sustainability Index score considered to be best practice, or close to it.
54.3
2.7
19.6
14.2%
64.6
80.0
5

An International Perspective
Key Findings6
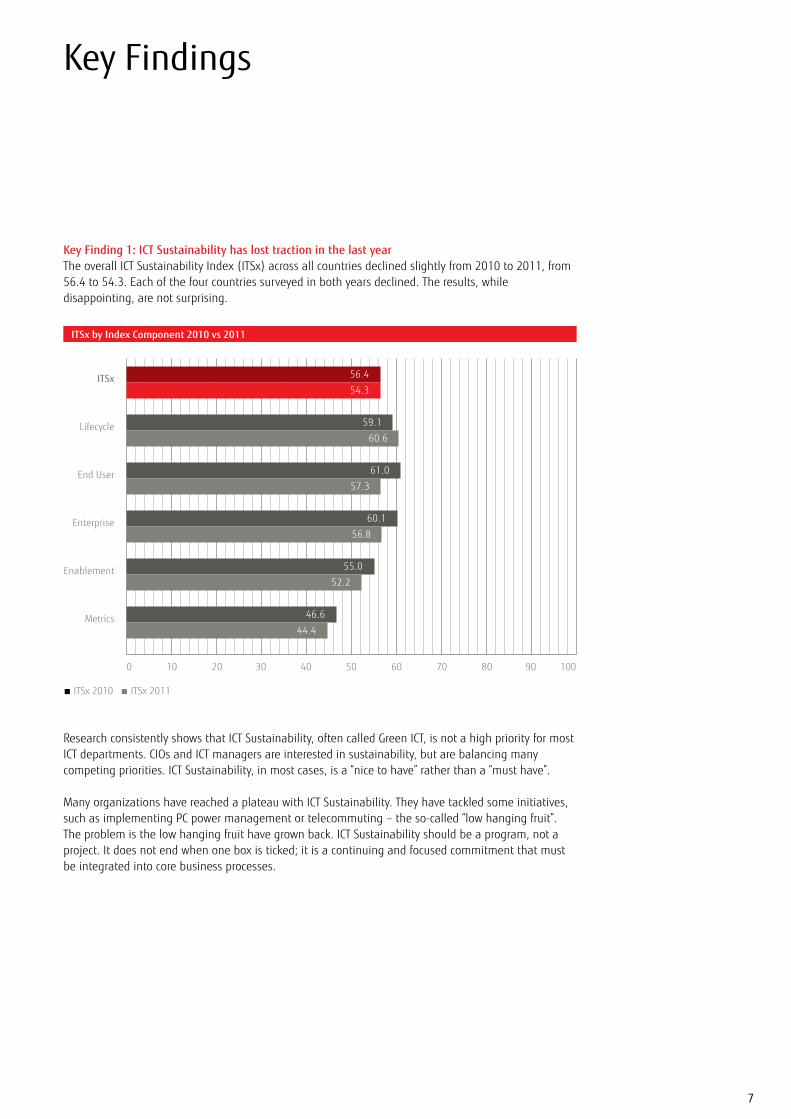
Key Finding 1: ICT Sustainability has lost traction in the last yearThe overall ICT Sustainability Index (ITSx) across all countries declined slightly from 2010 to 2011, from 56.4 to 54.3. Each of the four countries surveyed in both years declined. The results, while disappointing, are not surprising.
Research consistently shows that ICT Sustainability, often called Green ICT, is not a high priority for most ICT departments. CIOs and ICT managers are interested in sustainability, but are balancing many competing priorities. ICT Sustainability, in most cases, is a “nice to have” rather than a “must have”.
Many organizations have reached a plateau with ICT Sustainability. They have tackled some initiatives, such as implementing PC power management or telecommuting – the so-called “low hanging fruit”. The problem is the low hanging fruit have grown back. ICT Sustainability should be a program, not a project. It does not end when one box is ticked; it is a continuing and focused commitment that must be integrated into core business processes.
Key Findings
ITSx
Lifecycle
End User
Enterprise
Enablement
Metrics
ITSx by Index Component 2010 vs 2011
0 10 20 30 40 50 60 70 80 90 100
59.1
61.0
60.1
55.0
46.6
56.4
60.6
57.3
56.8
52.2
44.4
54.3
■ ITSx 2010 ■ ITSx 2011
7

Key Finding 2: Organizations who include ICT’s power consumption within the ICT budget perform bestThe single most important reason ICT departments do not prioritize ICT Sustainability or feel they have a compelling reason to do so, is the lack of visibility of ICT power consumption. More than half of the respondents have no understanding of how much power ICT consumes, only one in seven ICT departments include the cost of ICT’s power consumption in their ICT budgets.
There is a very strong correlation between visibility of and responsibility for the ICT power bill and the ITSx. Those organizations totally responsible for ICT’s power consumption have an average ITSx of 65.1, compared to those organizations with no visibility who have an average rating of only 45.5.
Never thought about it
Never see it - no idea how much we consume
Never see it, but told how much power we consume
Get a seperate bill, but not part of IT budget
Get a seperate bill, is part of IT budget
Totally responsible for IT‘s power consumption
All respondents
Visibility of IT Power Bill (ITSx)
49.7
57.0
62.1
65.1
54.3
59.5
0 20 40 60 80 100
45.5
8

54.3
Key Finding 3: The larger the organization, the stronger the ICT Sustainability performance
Larger organizations have more sophisticated ICT functions, and generally more advanced ICT Sustainability practices. They are more likely to be aware of the cost of ICT’s energy consumption, and to have installed technologies that lead to greater efficiency, such as virtualization.
This translates to a higher average ITSx for larger organizations. Those with more than 5,000 employees have an average ITSx of 61.7, compared with just 50.7 for those with 100 to 499 employees (organizations with less than 100 employees were excluded from the study). There is a strong correlation with size throughout, with ITSx increasing steadily with number of employees.
60.6100 -499
500-999
1000-4999
5000+
All Sizes
ITSx by Size (Employee Numbers)
0 10 20 30 40 50 60 70 80 90 100
50.7
55.9
61.7
54.3
51.9
9

Key Finding 4: The leading country is Canada
The best performing country of the seven surveyed is Canada, with an overall ITSx of 60.3. Canada, the United Kingdom (UK) 58.3 and the United States of America (USA) 56.0 perform above average, while Australia, New Zealand, India and China perform below the average. Canada rates highly in all aspects of ICT Sustainability, and is highest in all components except Lifecycle. Even there it is third after the UK and USA, which have relatively advanced e-waste practices.
ITSx by Country
52.8
50.9
51.9
58.3
56.0
50.9
54.3
46.1
60.3
0 10 20 30 40 50 60 70 80 90 100
Canada
UK
USA
Australia
New Zealand
India
Rest of World
China
All Countries
10

Key Finding 5: ICT/Communications/Media is the best performing industry sectorThe best performing industry sector is ICT/Communications/Media 58.4 and the lowest is Manufacturing 51.2. The relativities between industry sectors are generally consistent across different countries; the same industries tend to do better or worse in all countries. There are exceptions to this rule, such as with Manufacturing’s high Index in Canada.
ITSx by Industry
ICT/Communications/Media
Government
Utilities/Construction/Mining
Financial Services
Wholesale/Retail/Logistics
Professional Services
Health/Education/Welfare
Manufacturing
All Industries
0 10 20 30 40 50 60 70 80 90 100
54.4
53.9
52.5
51.2
54.3
53.0
58.4
55.5
55.4
11

Key Finding 6: Metrics has the lowest indexThe Lifecycle component performs the best with 60.6 as it has in previous years, with most organizations relatively mature when it comes to many practices in this area, particularly in the disposal of consumables and IT equipment. Lifecycle is followed by the two operational components End User 57.3 and Enterprise 56.8, which are under the control of the ICT department, where the techniques and technologies of ICT Sustainability are best understood and most advanced.
The Metrics component has the lowest Index by far 44.4. Few organizations are effective at measuring the effectiveness of ICT Sustainability, and of monitoring improvements in it. The old saying about not being able to manage what you can’t measure is relevant and Metrics should be a key component of ICT Sustainability.
ITSx
Lifecycle
End User
Enterprise
Enablement
Metrics
ITSx by Index Component
0 10 20 30 40 50 60 70 80 90 100
60.6
57.3
52.2
44.4
54.3
56.8
12

Key Finding 7: Best practice is achievableThe highest possible ITSx is 100, not achieved by any organization of the 1,000 surveyed. But many came close, with one wholesaler in the USA achieving 97.0.
The maximum and minimum ITSx in each industry sector, across all countries, is shown in the chart below. An index below 20 indicates an average response (out of 5) to all questions of one or less, meaning the organization has not even started to think about ICT Sustainability.
An ITSx above 80, on the other hand, indicates that the organization is at best practice, or close to it, in many areas of ICT Sustainability. High scorers have control of their ICT power consumption, they measure their performance consistently and they get all parts of the business involved.
Financial Services
Government
Health / Education / Welfare
ICT / Communications / Media
Manufacturing
Professional Services
Utilities / Construction / Mining
Wholesale / Retail / Logistics
All Industries
Maximum and Minimum ITSx by Industry
0 20 40 60 80 100
20.986.3
16.891.6
20.490.6
29.094.9
18.884.0
21.893.5
23.489.6
23.897.0
16.897.0
13

Measuring ICT‘s
Power Consumption14

Measuring ICT‘sPower Consumption
A Metrics question in the survey asked respondents about the visibility of their ICT power bill, and whether it is included in the ICT budget. The chart below shows the percentage of respondents that answered each of the six options, from “Never thought about it” to “We are totally responsible for ICT’s power consumption”.
Only 7 per cent of respondents are totally responsible for ICT’s power consumption, and another 7.2 per cent include ICT’s power bill in the ICT budget. Most have no idea how much power is consumed by ICT, including 10.8 per cent who have never thought of it. Overall visibility is very low. It is highest in the USA, where 27 per cent include the cost of ICT energy in the ICT budget, and lowest in Australia, where it is below 1 per cent.
There is a strong correlation between the visibility of the ICT power bill and an organization’s ICT Sustainability Index. Organizations totally responsible for the ICT power bill have an average ITSx of 65.1; those who have never even thought about it have an ITSx of only 45.5. The higher the visibility and the more responsibility the ICT department has for its power consumption, the higher the ITSx.
The reason for this correlation is if the power consumption of ICT is not included in the ICT budget, the ICT department has no direct interest or performance metrics in lowering its energy consumption, which is central to ICT Sustainability. With responsibility for ICT’s energy consumption comes a realization of the cost of that consumption, and an increased awareness of what needs to be done to reduce that consumption. ICT Sustainability covers other areas than energy consumption; still it’s an important starting point.
Never thought about it
Never see it - no idea how much we consume
Never see it, but told how much power we consume
Get a seperate bill, but not part of IT budget
Get a seperate bill, is part of IT budget
Totally responsible for IT‘s power consumption
Visibility of IT Power Bill (% of Respondents)
0 10 20 30 40 50 60 70 80 90 100
10.8
42.2
15.5
7.2
7.0
17.4
15

ICT Sustainability
Indices by Country
16

ICT Sustainability Indices by Country
The survey was conducted across seven countries: Australia, Canada, China (PRC), India, New Zealand, the UK, and the USA. The country with the highest overall ICT Sustainability Index is Canada 60.3. Canada is highest in all ITSx components except Lifecycle, where it is third after the UK 58.3 and the USA 56.0. Next highest are the UK and the USA. All other countries are below the international average. China has the lowest rating 46.1, and it is lowest in every index component except End User, where Australia is the lowest.
If a country is high in one index component, it is usually high in other components, ICT Sustainability is usually a holistic exercise. As a general rule, the more developed the country the higher its ITSx, but there are exceptions to this rule. Canada and the USA form one ICT market, but the findings show that Canadian users are much more conscious of sustainability issues.
India performs better than China, a function of its relatively sophisticated ICT market. China’s economy is booming, but ICT usage is still relatively basic. Australia and New Zealand are in the middle of the pack, indicating a lower awareness of ICT Sustainability issues than in other advanced economies.
ICT Sustainability is a global issue. Different countries display different levels of maturity, but even for the best performing countries there is substantial room for improvement.
By Country Lifecycle End User Enterprise Enablement Metrics ITSx
Canada 62.9 65.9 60.8 60.7 50.9 60.3UK 65.6 61.8 58.1 59.2 46.9 58.3USA 63.8 57.2 60.0 52.1 47.1 56.0Australia 58.7 51.8 56.7 52.8 43.9 52.8New Zealand 58.0 52.2 55.1 52.4 41.8 51.9Rest of World 55.6 55.1 55.4 46.3 42.3 50.9India 59.3 56.8 54.3 45.0 39.2 50.9China 51.9 52.0 48.7 41.8 36.4 46.1All Countries 60.6 57.3 56.8 52.2 44.4 54.3
Overall Country Comparisons
17

AustraliaAustralia is a midrange ICT Sustainability performer. The overall ITSx of 52.8 is just below the international average. Australia is below Canada, the UK and the USA, but slightly ahead of New Zealand, India and China. Australia’s performance in the End User index component is concerning, as this is where many “quick wins” or “low hanging fruit” can be found. Australia performs close to the average in other index components.
Australia was one of the four countries also surveyed in 2010, when its Index was 53.9. Its marginal decline this year indicates that ICT Sustainability in Australia has lost momentum. There was a significant decline in End User, from 62.3 to 51.8, indicating that many Australian ICT users may be suffering from “green fatigue” or initiatives have failed to become institutionalized. This is further supported by Australia’s very low visibility of the ICT power bill. Less than 1 per cent of ICT departments are responsible for ICT’s power consumption.
The results are disappointing for Australia, but there are some encouraging signs. An important e-waste bill has recently passed the national parliament, and the likelihood of a price on carbon has put sustainability issues back on the agenda for many organizations.
Green ITBenchmarking Comparisons
Australia vs All Countries
58.7
51.8
56.7
52.8
43.9
52.8
60.6
57.3
56.8
52.2
44.4
54.3ITSx
Lifecycle
End User
Enterprise
Enablement
Metrics
0 10 20 30 40 50 60 70 80 90 100
■ Australia ■ All Countries
18

The breakdown by industry sector in Australia is similar to that in other countries. Manufacturing has the lowest ITSx and Metrics in Manufacturing 39.4 the lowest score overall. The highest score is the Lifecycle component in Professional Services 65.1 whilst the ICT/Communications/Media industry performs best. There are no industry sectors where Australia does significantly better or worse than the international average for that industry.
Lifecycle End User Enterprise Enablement Metrics Australia ITSx Global ITSx
Financial Services 54.6 53.6 54.0 48.0 40.6 50.2 54.4Government 62.3 56.3 59.1 53.2 50.9 56.3 55.5Health/Education/Welfare 63.1 48.6 56.0 51.7 43.5 52.6 52.5ICT/Comunications/Media 60.1 53.9 62.9 58.3 48.3 56.7 58.4Manufacturing 51.7 46.3 51.3 51.0 39.4 47.9 51.2Professional Services 65.1 55.9 54.2 53.6 45.1 54.8 53.0Utilities/Construction/Mining 59.8 48.9 62.6 61.1 42.7 55.0 55.4Wholsesale/Retail/Logistics 54.3 51.9 56.8 51.4 39.7 50.8 53.9Australia 58.7 51.8 56.7 52.8 43.9 52.8 54.3
Australia by Industry
19

CanadaCanada with an ITSx of 60.3 is the best performing country by far, testament to the relative sophistication of its ICT industry and the high level of awareness of sustainability in that country. It rates well above average in all industry components, by a consistently high margin. It also leads the other countries surveyed in each index component, except Lifecycle.
This is a very good result for Canada. Its overall ITSx is more than five points above the international average. Whilst the performance is good in relative terms, in absolute terms most Canadian organizations still have a long way to go in achieving best practice ICT Sustainability.
Canada’s strong performance is reflected in every industry sector. It performs well above average even in those industries where it is not the clear leader, such as Government and Financial Services. The relative performance of many industries is different to the global trend, but there is less variation in the industry sector scores in Canada than there is in any country. Canada’s high ICT Sustainability performance is spread across all sectors.
Canada vs All Countries
62.9
65.9
60.8
60.7
50.9
60.3
60.6
57.3
56.8
52.2
44.4
54.3ITSx
Lifecycle
End User
Enterprise
Enablement
Metrics
0 10 20 30 40 50 60 70 80 90 100
■ Canada ■ All Countries
20

The exception is Manufacturing 64.6, which performs the best of any industry in Canada, where it is the lowest performing in most other countries. Manufacturing in Canada has a particularly high rating for Enablement 70.3, a reflection of the high level of environmental awareness amongst manufacturers in that country. The low rating for Metrics in Government is a reflection of an industry where ICT Sustainability policy is emerging.
Lifecycle End User Enterprise Enablement Metrics Canada ITSx Global ITSx
Financial Services 61.0 66.0 60.0 57.9 54.1 59.8 54.4Government 62.9 67.9 56.0 59.8 41.6 57.8 55.5Health/Education/Welfare 63.3 64.7 61.6 59.9 49.3 59.7 52.5ICT/Comunications/Media 62.1 64.9 62.1 57.9 48.0 59.0 58.4Manufacturing 63.9 69.8 65.2 70.3 53.9 64.6 51.2Professional Services 61.9 68.7 59.2 56.3 54.2 60.1 53.0Utilities/Construction/Mining 61.4 64.5 61.7 63.6 53.0 60.8 55.4Wholsesale/Retail/Logistics 66.1 64.6 59.6 61.2 51.4 60.6 53.9Canada 62.9 65.9 60.8 60.7 50.9 60.3 54.3
Canada by Industry
21

ChinaChina’s ITSx of 46.1 is the lowest of the seven countries measured and rates 8 points lower than the international average, well below the leading countries. China’s ICT market is growing at rapid speed; however the general level of ICT sophistication is relatively low.
This performance level is reflected in each component of ICT Sustainability and the ratings are lower than the international averages by a consistent margin. This is the first year China has been surveyed and it is anticipated that there will be a significant improvement in future years as China’s ICT usage continues to develop. The scale of growth in China is massive, and there is ample scope for China to become a leading country in ICT usage and Sustainability.
China is well below average in most industry sectors, though only marginally so in Government 52.2, its best performing sector. Its performance in Utilities/Mining/Construction 36.9 and Health/Education/Welfare 37.1 are particularly low. Chinese industry’s environmental record is improving, however the low ITSx of some industries is a reflection there is still some way to go.
China vs All Countries
51.9
52.0
48.7
41.8
36.4
46.1
60.6
57.3
56.8
52.2
44.4
54.3ITSx
Lifecycle
End User
Enterprise
Enablement
Metrics
0 10 20 30 40 50 60 70 80 90 100
■ China ■ All Countries
22

China does comparatively well in End User ICT Sustainability, and in Manufacturing the End User rating 58.3 is higher than in most other countries. Most Chinese manufacturing companies are relatively small, and rely more on End User ICT than manufacturers in other countries. But many other components in many industries have low indices, Metrics in Health/Education/Welfare 24.6 and Utilities/Construction/Mining 24.9 are very low.
Lifecycle End User Enterprise Enablement Metrics China ITSx Global ITSx
Financial Services 54.4 52.1 51.6 47.7 45.0 50.2 54.4Government 55.2 51.7 54.3 49.3 50.4 52.2 55.5Health/Education/Welfare 47.2 43.3 40.5 30.2 24.6 37.1 52.5ICT/Comunications/Media 54.0 54.8 50.6 41.4 37.5 47.7 58.4Manufacturing 53.5 58.3 50.7 44.8 33.8 48.2 51.2Professional Services 50.5 54.9 50.2 37.8 34.4 45.6 53.0Utilities/Construction/Mining 47.4 42.1 35.7 34.3 24.9 36.9 55.4Wholsesale/Retail/Logistics 48.3 48.6 48.0 38.8 33.4 43.4 53.9China 51.9 52.0 48.7 41.8 36.4 46.1 54.3
China by Industry
23

IndiaIndia’s ITSx rating of 50.9 is slightly above China’s. Like all the countries measured in 2010 its index has dropped from 52.0. India is consistently lower than the international average in all components of the index except End User, where it has substantially improved its performance over 2010 up from 50.3 to 56.8. This is an indication of the growth and increased maturity of End User computing in India.
India is well behind in Enablement and Metrics, non-operational areas where ICT Sustainability generally requires a greater engagement with the wider business.
India performs below the international average in every industry sector except for ICT/Communications/Media, where it is well above average. This is a reflection of the sophistication of India’s ICT industry, which is a major player on the world stage. Health/Education/Welfare is the lowest performing industry in India where many organizations are not big users of ICT.
India vs All Countries
59.3
56.8
54.3
45.0
39.2
50.9
60.6
57.3
56.8
52.2
44.4
54.3ITSx
Lifecycle
End User
Enterprise
Enablement
Metrics
0 10 20 30 40 50 60 70 80 90 100
■ India ■ All Countries
24

The ITSx for Enterprise 66.9 in ICT/Communications/Media rates very highly, there are many sophisticated new data centers in this sector in India, most of them designed with energy efficiency in mind. The very low level of Metrics in Financial Services 28.0 reflects a comparatively underdeveloped sector, and lacks the ICT sophistication in many other countries.
Lifecycle End User Enterprise Enablement Metrics India ITSx Global ITSx
Financial Services 56.2 54.7 49.8 42.4 28.0 46.2 54.4Government 58.0 52.8 56.1 49.7 44.4 52.2 55.5Health/Education/Welfare 57.7 54.4 46.9 37.7 29.9 45.3 52.5ICT/Comunications/Media 65.9 66.5 66.9 55.3 51.7 61.3 58.4Manufacturing 59.8 56.8 52.5 43.0 37.3 49.9 51.2Professional Services 55.8 48.6 51.3 37.8 37.6 46.2 53.0Utilities/Construction/Mining 56.1 62.7 48.2 45.8 35.3 49.6 55.4Wholsesale/Retail/Logistics 61.4 59.7 56.2 45.0 41.9 52.8 53.9India 59.3 56.8 54.3 45.0 39.2 50.9 54.3
India by Industry
25

New ZealandNew Zealand’s overall ICT Sustainability performance 51.9 is below the international average, and just behind its larger neighbor Australia. It is equal to the international average in Enablement, and marginally behind in other areas.
Contributing to New Zealand’s relatively low performance is the below average ICT Sustainability ratings of its few large organizations, which are not generally driving scale ICT efficiencies. New Zealand organizations with 500-999 employees rate the highest 61.9 of any organization group in any country. In New Zealand, at least, there is no correlation between size and ICT Sustainability performance.
New Zealand vs All Countries
58.1
52.2
55.1
52.4
41.8
51.9
60.6
57.3
56.8
52.2
44.4
54.3ITSx
Lifecycle
End User
Enterprise
Enablement
Metrics
0 10 20 30 40 50 60 70 80 90 100
■ New Zealand ■ All Countries
26

New Zealand is close to the international industry average in most industry sectors. It is substantially ahead in Utilities/Construction/Mining in particularly in the Enablement component 70.1, and substantially behind in Wholesale/Retail/Logistics, where the lowest score of all industries and components is Metrics 27.6. New Zealand performs well in the Government sector, where ICT Sustainability policies and implementation are relatively advanced. The New Zealand Government has similar ICT Sustainability policies to the Australian Government, but the unitary nature and smaller size of New Zealand’s government sector means these are easier to apply consistently.
Lifecycle End User Enterprise Enablement Metrics NZ ITSx Global ITSx
Financial Services 60.4 53.0 56.3 53.8 46.8 54.1 54.4Government 66.1 55.6 60.8 60.9 48.8 58.4 55.5Health/Education/Welfare 55.1 56.6 57.9 42.1 37.8 49.9 52.5ICT/Comunications/Media 59.2 53.3 54.8 56.0 43.0 53.2 58.4Manufacturing 56.3 54.7 53.3 56.2 45.7 53.2 51.2Professional Services 51.4 46.1 54.7 52.4 38.0 48.5 53.0Utilities/Construction/Mining 59.7 67.2 62.1 70.1 52.0 62.2 55.4Wholsesale/Retail/Logistics 54.1 37.1 42.8 37.7 27.6 39.9 53.9New Zealand 58.1 52.2 55.1 52.4 41.8 51.9 54.3
New Zealand by Industry
Note that New Zealand had a comparatively low respondent base, and the statistical margin of error is higher.
27

United KingdomThe UK’s ITSx of 58.3 is second overall, just behind Canada’s. It is above the international average in every component of the ITSx. However the ITSx has declined slightly from 2010, when it was 61.0. This decline in performance has happened at a time of economic constraints in the United Kingdom, with investment in ICT and many other areas slowing significantly.
The Lifecycle rating of 65.5 is the highest of any country. As part of the European Union, the UK has some of the most stringent e-waste and procurement regimens in the world. The high level of ICT Sustainability maturity is also shown by the relatively high End User and Enablement ratings, which can be attributed in part to the country’s Carbon Reduction Commitment (CRC) Energy Efficiency Scheme, a mandatory government program aimed at improving energy efficiency and cutting emissions in large organizations.
The UK performs above the international average in every industry sector, by a consistent margin. The best performing sector is Government, where the enormous improvement in the last 12 months (from 50.5 to 64.9) can be largely attributed to the commitment to a greener Government, and more stringent enforcement of policy.
United Kingdom vs All Countries
65.6
61.8
58.1
59.2
46.9
58.3
60.6
57.3
56.8
52.2
44.4
54.3ITSx
Lifecycle
End User
Enterprise
Enablement
Metrics
0 10 20 30 40 50 60 70 80 90 100
■ United Kingdom ■ All Countries
28

The highest score 72.7 is for the Lifecycle component of Utilities/Construction/Mining, indicating mature ICT procurement and disposal practices in the industry (note there were no mining companies in the UK sample).
The lowest score of 38.0 in Metrics in the Manufacturing industry is consistent with the global trend of this ICT Sustainability component and industry sector.
Lifecycle End User Enterprise Enablement Metrics UK ITSx Global ITSx
Financial Services 66.6 60.1 63.7 60.1 48.3 59.7 54.4Government 67.1 69.5 66.6 65.9 55.6 64.9 55.5Health/Education/Welfare 64.2 60.8 53.6 53.8 41.9 54.9 52.5ICT/Comunications/Media 68.1 66.7 62.8 65.5 54.8 63.6 58.4Manufacturing 59.3 54.3 51.8 53.1 38.0 51.3 51.2Professional Services 63.4 59.6 51.1 53.3 42.2 53.9 53.0Utilities/Construction/Mining 72.2 62.9 64.0 67.7 51.9 63.7 55.4Wholsesale/Retail/Logistics 66.4 60.4 58.0 59.3 45.8 58.0 53.9United Kingdom 65.6 61.8 58.1 59.2 46.9 58.3 54.3
United Kingdom by Industry
29

United States of AmericaThe USA’s ITSx of 56.0 is third overall of the countries surveryed however this is a decline since 2010, when it was 58.6. The USA is ahead of the international average in Lifecycle, Enterprise and Metrics, and marginally behind in End User and Enablement.
The USA is only marginally behind Canada, the best performing country, in Enterprise. Many of the responding organizations have large data centers, which tend to have more advanced ICT Sustainability practices. The USA Environmental Protection Authority (EPA) has been particularly proactive in promoting data center energy efficiencies, and the relatively high level of visibility of ICT’s power bill in the USA has also helped deliver a good performance in this area.
The USA performs close to the international average in most industry sectors, and well ahead in Utilities/Construction/Mining. Wholesale/Retail/Logistics also performs relatively well, a reflection of the larger size of organizations in these sectors in the USA and the consequent greater sophistication of their ICT operations. Wal-Mart, for example, is a global sustainability leader.
USA vs All Countries
63.8
57.2
60.0
52.1
47.1
56.0
60.6
57.3
56.8
52.2
44.4
54.3ITSx
Lifecycle
End User
Enterprise
Enablement
Metrics
0 10 20 30 40 50 60 70 80 90 100
■ USA ■ All Countries
30

The highest component index score is 66 .1 for Lifecycle in Utilities/Construction/Mining (this is also the case in the UK). The high rating for Enterprise in many areas is a reflection on the energy efficiency of newly designed data centers. The lowest rating is for Metrics in Health/Education/Welfare 42.0 a sector which rates below average in all areas, because of its comparatively low level of ICT sophistication.
Lifecycle End User Enterprise Enablement Metrics USA ITSx Global ITSx
Financial Services 63.3 56.9 62.8 53.7 48.4 57.0 54.4Government 63.5 58.1 55.8 49.3 45.1 54.4 55.5Health/Education/Welfare 62.5 53.0 59.5 49.7 42.0 53.3 52.5ICT/Comunications/Media 65.7 58.9 64.8 53.5 48.3 58.2 58.4Manufacturing 63.6 55.2 55.2 49.7 48.1 54.4 51.2Professional Services 62.8 58.0 59.5 51.3 46.0 55.5 53.0Utilities/Construction/Mining 66.1 60.3 63.1 61.5 50.3 60.3 55.4Wholsesale/Retail/Logistics 64.3 60.0 60.7 54.4 50.9 58.0 53.9USA 63.8 57.2 60.0 52.1 47.1 56.0 54.3
USA by Industry
31

ICT Sustainability
Indices by Industry
32

ICT Sustainability Indices by Industry
Financial ServicesIn 2010 the Financial Services industry performed well with an ITSx of 57.3 and in 2011 the ITSx is 54.4. It performs very close to the all-industry average and close to the average in most countries. The exceptions are Australia and India were performance falls below average.
ICT Sustainability is particularly important in this industry, which is a major user of ICT in all countries surveyed. ICT’s power consumption is a particularly high proportion of all electricity consumption in this industry sector, with strong usage of data centers. That means improvements in this sector will deliver large scale efficiencies.
Financial Services vs All Industries
50.252.8
59.860.3
50.246.1
46.250.9
54.151.9
59.758.3
57.056.0
51.150.9
54.454.3
0 10 20 30 40 50 60 70 80 90 100
Australia
Canada
China
India
New Zealand
UK
USA
Rest of World
All Countries
■ Financial Services ■ All Industries
33

GovernmentGovernment has a slightly higher ITSx 55.5 than the all-industry average and slightly higher to the ITSx in 2010 of 54.2. It performs above average in Australia, China, India, New Zealand and the UK, and lower in Canada and the USA, where Government spending on government infrastructure has declined in recent years.
Government bodies have a particular responsibility to be effective in their ICT Sustainability practices, because of their purchasing power and the example they often set to private industry. Governments are major purchasers of ICT and also have a role to play in developing and implementing policies that encourage ICT Sustainability.
Government vs All Industries
56.352.8
57.860.3
52.246.1
52.250.9
58.451.9
64.958.3
54.456.0
51.950.9
55.554.3
0 10 20 30 40 50 60 70 80 90 100
Australia
Canada
China
India
New Zealand
UK
USA
Rest of World
All Countries
■ Government ■ All Industries
34

Health/Education/WelfareHealth/Education/ Welfare has a slightly lower ITSx 52.5 than the all-industry average and very similar to the ITSx in 2010 of 52.3. It performs lower than other industries in every country surveyed, though only marginally so in Australia and Canada, which have large government funded organizations in this sector.
In other countries many organizations in this sector are quite small, which lowers the overall ITSx. The sector rates particularly low in China and India, where organizations tend to have smaller budgets and comparatively immature ICT systems.
Health/Education/Welfare vs All Industries
52.652.8
59.760.3
37.146.1
45.350.9
49.951.9
54.958.3
53.356.0
49.950.9
52.554.3
0 10 20 30 40 50 60 70 80 90 100
Australia
Canada
China
India
New Zealand
UK
USA
Rest of World
All Countries
■ Health/Education/Welfare ■ All Industries
35

ICT/Communications/MediaICT/Communications/Media has the highest ITSx 58.4 of all-industry sectors, outperforming the global all-industry average but less than the ITSx in 2010 of 62.6. It also performs better than the country average in every country except Canada, where it is only marginally below that country’s high overall average ITSx of 60.3. But this is relative – the sector still does better in Canada than it does in most other countries.
The ICT/Communications/Media sector rates particularly well in India 61.3, where the ICT industry is large and newly developed. Lowest rated is China 47.7, yet it rates above that country’s average ITSx.
ICT/Communications/Media vs All Industries
56.752.8
59.060.3
47.746.1
61.350.9
53.251.9
63.658.3
58.256.0
51.950.9
58.454.3
0 10 20 30 40 50 60 70 80 90 100
Australia
Canada
China
India
New Zealand
UK
USA
Rest of World
All Countries
■ ICT/Communications/Media ■ All Industries
36

ManufacturingManufacturing has the lowest overall ITSx 51.2, rating below the international all-industry average, below the national average in all countries except Canada, China and New Zealand. The ITSx is lower than in 2010 where it was 58.1.
Most manufacturing is particularly carbon-intensive, and many manufacturers have comparatively small ICT operations in proportion to their total activities. ICT Sustainability is relatively low on their list of priorities. But there are exceptions, such as Canada, and the comparatively high rating in China also indicates the relative maturity of ICT in manufacturing in that country.
Manufacturing vs All Industries
47.952.8
64.660.3
48.246.1
49.950.9
53.251.9
51.358.3
54.456.0
46.650.9
51.254.3
0 10 20 30 40 50 60 70 80 90 100
Australia
Canada
China
India
New Zealand
UK
USA
Rest of World
All Countries
■ Manufacturing ■ All Industries
37

Professional ServicesThe Professional Services ITSx 53.0 performs slightly below the all-industry average globally, and in every country except Australia, Canada and the USA, where this sector is well advanced in its business processes. The ITSx is lower than in 2010 where it was 60.0.
The lowest ITSx rating for Professional Services is in the least developed economies, India 46.2 and China 45.6, where organizations in this sector tend to be comparatively small and immature in their ICT usage.
Professional Services vs All Industries
54.852.8
60.160.3
45.646.1
46.250.9
48.551.9
53.958.3
55.556.0
55.250.9
53.054.3
0 10 20 30 40 50 60 70 80 90 100
Australia
Canada
China
India
New Zealand
UK
USA
Rest of World
All Countries
■ Professional Services ■ All Industries
38

Utilities/Construction/MiningThe Utilities/Construction/Mining ITSx 55.4 is slightly above the international all-industry average and lower than the ITSx in 2010 of 59.6. It does particularly well in New Zealand 62.2 (though the sample size there is small), and lowest in China, a country where organizations generally lack sophistication in their ICT business processes.
The high rating in the UK 63.7 and the USA 60.3 is largely a function of the size of the organizations involved in this sector in those countries (larger organizations tend to have a higher ITSx).
Utilities/Construction/Mining vs All Industries
55.052.8
60.860.3
36.946.1
49.650.9
62.251.9
63.758.3
60.356.0
43.950.9
54.454.3
0 10 20 30 40 50 60 70 80 90 100
Australia
Canada
China
India
New Zealand
UK
USA
Rest of World
All Countries
■ Utilities/Construction/Mining ■ All Industries
39

Wholesale/Retail/LogisticsWholesale/Retail/Logistics has an overall ITSx of 53.9 marginally below the international all-industry average and slightly higher to the ITSx in 2010 of 51.1. It rates just above its national average in most countries, except China 43.4 and the UK 58.0, where it is marginally lower, and New Zealand 39.9, where it is well below the national average.
The New Zealand result is based on a small sample size, and organizations in this industry also tend to be smaller and without significant ICT operations. In most other countries (China excluded) organizations in this sector tend to be large and with significant ICT operations.
Wholesale/Retail/Logistics vs All Industries
50.852.8
60.660.3
43.446.1
52.850.9
39.951.9
58.058.3
58.056.0
54.450.9
53.954.3
0 10 20 30 40 50 60 70 80 90 100
Australia
Canada
China
India
New Zealand
UK
USA
Rest of World
All Countries
■ Wholesale/Retail/Logistics ■ All Industries
40

Attitude
Policy
Practice
Technology
Metrics
Methodology The ICT Sustainability Framework
This report uses the methodology developed by Connection Research and RMIT University (Melbourne, Australia). The results allow the development of a standardized ICT Sustainability Index for ICT-using organizations in any industry or country. The methodology allows separate indices to be calculated for five key areas of ICT Sustainability:
■ Equipment Lifecycle Procurement and Disposal■ End User Computing■ Enterprise and Data Center■ IT as a Low-Carbon Enabler■ Metrics
The Framework takes into consideration the attitude, policy, practice and technology as outlined below.
Once ICT Sustainability is defined in the key areas it becomes possible to measure each component. This is achieved by using the Capability Maturity Model (CMM), a standardized way of quantifying the maturity of a business process, from 0 (no action at all) to 5 (optimized, or best practice). The concept of the CMM is often used in the ICT industry to describe the level of implementation of various systems. First developed by Watts Humphrey at Carnegie Mellon University, a CMM defines five levels of maturity in the use of any system or technology.
Measure Monitor Manage Mitigate
EquipmentLifecycle
Procurement
Recycle & Reuse
Disposal
End User Computing
Personal Computing DesktopMobile
DepartmentalComputing
Printing &Consumables
Enterprise & Data Center
Data CenterICT Equipment
Data Center Environmentals
Networking & Communications
Outsourcing & Cloud
Software Architecture
Government &Compliance
Teleworking & Collaboration
Business Process Management
Business Applications
Carbon Emissions Management
ICT as a Low-Carbon Enabler
ICT Sustainability Framework
41

Respondent Count Australia Canada China India NZ UK USA ROW Total
Financial Services 21 15 13 10 5 22 28 13 127Government 25 8 13 15 9 10 26 12 118Health/Education/Welfare 24 10 7 6 8 50 29 15 149Manufacturing 14 17 12 13 7 49 28 16 156Professional Services 20 9 22 28 6 25 28 13 151Utilities/Construction/Mining 11 16 10 6 3 18 10 7 81Wholesale/Retail/Logistics 15 17 12 10 7 13 26 12 112Total 140 100 100 100 50 210 200 100 1000
Respondents by Country and Industry Sector
The Research ProcessA total of 1,000 responses were collected through an online survey of organizations in most industry sectors across seven countries, which asked CIOs and ICT Managers over 80 questions about their ICT Sustainability policies, behavior and technologies in each area. Surveys were conducted in June and July 2011 in Australia, Canada, China, India, New Zealand, the United Kingdom, and the United States of America. Some other countries were also included, but there were not sufficient responses from any of them to develop a statistically reliable index, and they are aggregated as the Rest of the World (RoW).
The responses were weighted to deliver a score (out of 100) in each of the five ICT Sustainability Index components, which were then combined to determine the overall ICT Sustainability Index for each organization, ensuring quantitative comparisons between respondents.
The results in each area of ICT Sustainability, and overall, are compared between each country surveyed and by industry sector in each country. The table below displays the number of respondents in each industry sector and in each country. The result is what we believe to be the most comprehensive analysis ever undertaken of the relative maturity of ICT Sustainability in a number of important global markets.
Note that the respondent base in New Zealand is comparatively low, with a high margin for error in some industry sectors.
42

43

Fujitsu LiMitEDwww.fujitsu.com/global
AcknowledgementFujitsu would like to thank the many people and organizations involved in the production of this report. We would particularly like to thank the CIOs and senior ICT managers who responded to the survey upon which it is based. We appreciate the many time constraints they face, and without their assistance the exercise would not have been possible.
We would also like to thank our research partners Connection Research (www.connectionresearch.com.au) for providing research expertise, and for analyzing and interpreting the results. Data in Australia was gathered by Connection Research. Data in Canada, China, India, New Zealand, and the United States of America was gathered by ActionEdge (www.action-edge.com). Data in the United Kingdom was gathered by Revolution Events (www.revolution-events.com).
Printed on Mega Recycled, an environmentally responsible paper, 50% Recycled – post consumer waste and 50% FSC
Certified fibre, ISO 14001 EMS Accreditation
About FujitsuFujitsu is a leading global service provider of business, information technology and communications solutions. In more than 50 countries around the world Fujitsu partners with customers to consult, design, build, operate and support business solutions. From strategic consulting to application and infrastructure solutions and services, Fujitsu has earned a reputation as the single supplier of choice for leading corporate and government organizations. Fujitsu is a global leader is sustainability, listed on the Dow Jones Sustainability Index since inception and holds worldwide ISO 14001 certification.
For further information visit www.fujitsu.com/global
About Connection Research Connection Research is a market research and consultancy company specializing in the analysis of sustainability issues. Services are provided in Consumer and Community Sustainability, ICT Sustainability, Building Industry and Trades and Carbon and Compliance. Connection Research undertakes primary research (surveys of users, trades people, suppliers, practitioners), conducts market modeling analyses (combining our primary data with other sources) and consultancy in these fields.
For further information visit: www.connectionresearch.com.au