icrat 2004 airport surface operations analysis tarja kettunen isa software international conference...
TRANSCRIPT
ICRAT 2004
Airport Surface Airport Surface Operations AnalysisOperations Analysis
Tarja KettunenISA Software
International Conference on Research in Air TransportationZilina, Slovakia, 22-24 November, 2004
ICRAT 2004
• Introduction
• Objectives
• Data
• Results– Overall results for all airports
– ATL case study
– Impact of a new runway
• Conclusion and future work
Contents

ICRAT 2004
• Airport capacity– Infrastructure– Weather– Environmental constraints
• Operations at hub airports• Gate-to-Gate ATM
Introduction

ICRAT 2004
• To complement FAA’s Airport Capacity Benchmark Analysis
• To provide parameters for modelling purposes
– Generic and airline-specific operating time distributions for each airport
– Predictability in 4D trajectory modelling
• Not to compare and criticize airports based on their performance
Objectives

ICRAT 2004
• US DOT TranStats database, Airline on-time performance data
– Data reported by all airlines with >1% of domestic scheduled passenger revenues
– Excluded are general aviation, international, military, cargo and non-scheduled flights
• September 2000 data for TOP31 airports, over 600 000 flights
• Taxi-data definitions:– Taxi-out: from gate until wheels-off
– Taxi-in: from wheels-on until at gate
Data

ICRAT 2004
0
100
200
300
400
500
600
700
800
900
1000
AT
L
OR
DD
FW
LA
XP
HX
DT
WD
EN
MS
PL
AS
MIA
BO
S
IAH
ST
L
PH
LIA
D
CV
G
CL
TE
WR
PIT
SE
A
SF
OL
GA
ME
MS
LC
MC
OJ
FK
HN
LD
CA
BW
IT
PA
SA
N
Thousands
Airport
0
5
10
15
20
25
30
35
40
45
50
Thousands
Total operations 2000 Domestic operations Sept 2000
Overall results – Airport activity

ICRAT 2004
Overall results – Taxi-out times
0 5 10 15 20 25 30 35 40
BWITPASANLAS
MCOMEMSEADENPHXPIT
LAXCLTSFODCACVGIAD
SLCSTLHNLMSPATLDFWIAH
DTWMIABOSORDPHLEWRJFK
LGAA
irp
ort
Average taxi-out time (min)

ICRAT 2004
Overall results – Taxi-in times
0 5 10 15 20 25 30 35 40
SANBWITPAHNLDCAMCOMEMLASSEAPHXSFOCLTSTLCVGMSPSLCIADPIT
MIAIAHDENPHLEWRBOSORDLAXATLLGADTWJFK
DFWA
irp
ort
Average taxi-in time (min)
ICRAT 2004
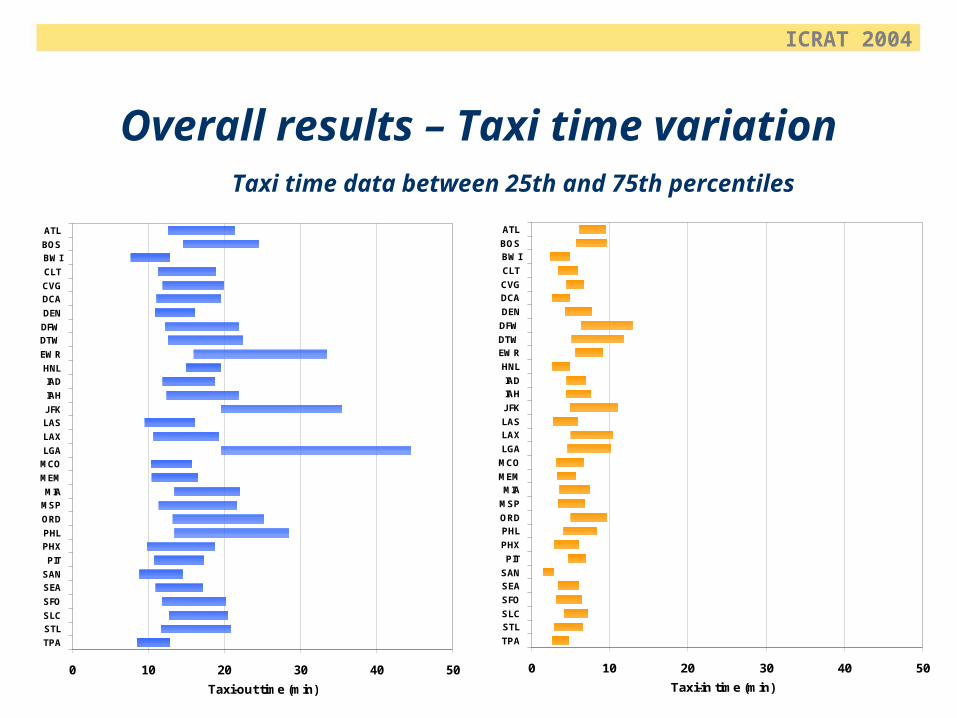
Overall results – Taxi time variationTaxi time data between 25th and 75th percentiles
0 10 20 30 40 50
TPA
STL
SLC
SFO
SEA
SAN
PIT
PHX
PHL
ORD
MSP
MIA
MEM
MCO
LGA
LAX
LAS
JFK
IAH
IAD
HNL
EWR
DTW
DFW
DEN
DCA
CVG
CLT
BWI
BOS
ATL
Taxi-in time (min)
0 10 20 30 40 50
TPA
STL
SLC
SFO
SEA
SAN
PIT
PHX
PHL
ORD
MSP
MIA
MEM
MCO
LGA
LAX
LAS
JFK
IAH
IAD
HNL
EWR
DTW
DFW
DEN
DCA
CVG
CLT
BWI
BOS
ATL
Taxi-out time (min)
ICRAT 2004
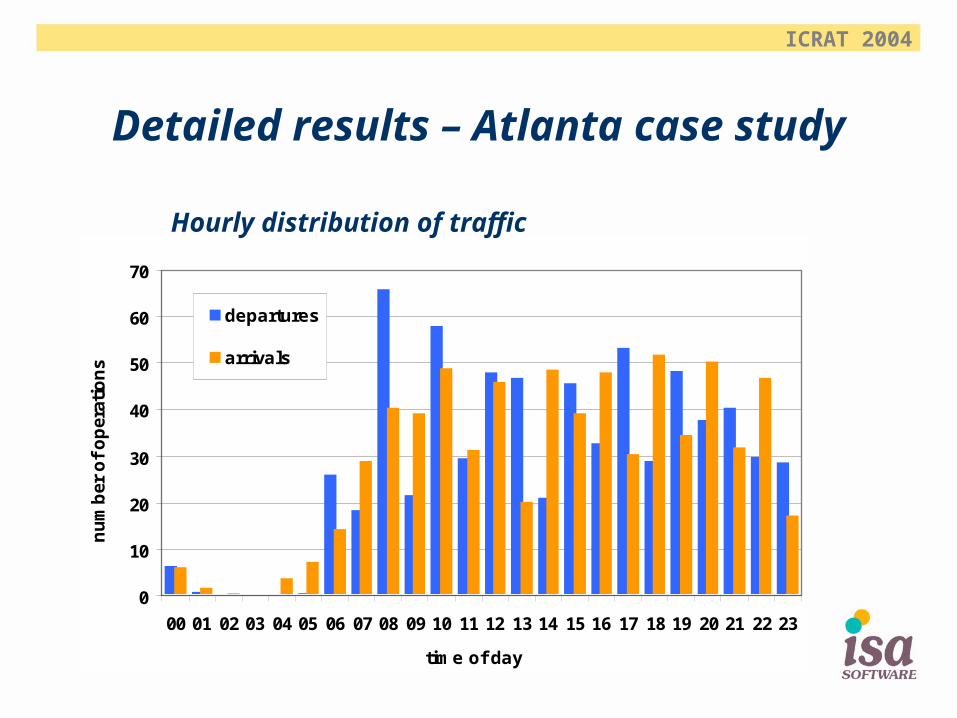
0
10
20
30
40
50
60
70
00 01 02 03 04 05 06 07 08 09 10 11 12 13 14 15 16 17 18 19 20 21 22 23
time of day
nu
mb
er o
f o
per
atio
ns
departures
arrivals
Detailed results – Atlanta case study
Hourly distribution of traffic

ICRAT 2004
02468
1012141618202224262830
00 01 02 03 04 05 06 07 08 09 10 11 12 13 14 15 16 17 18 19 20 21 22 23
Time of day
Ave
rag
e T
axi T
ime
(min
s)
Taxi-out
Taxi-in
ATL – Hourly taxi times • Average taxi-out time 18.6 minutes• Average taxi-in 9.1 minutes
ICRAT 2004
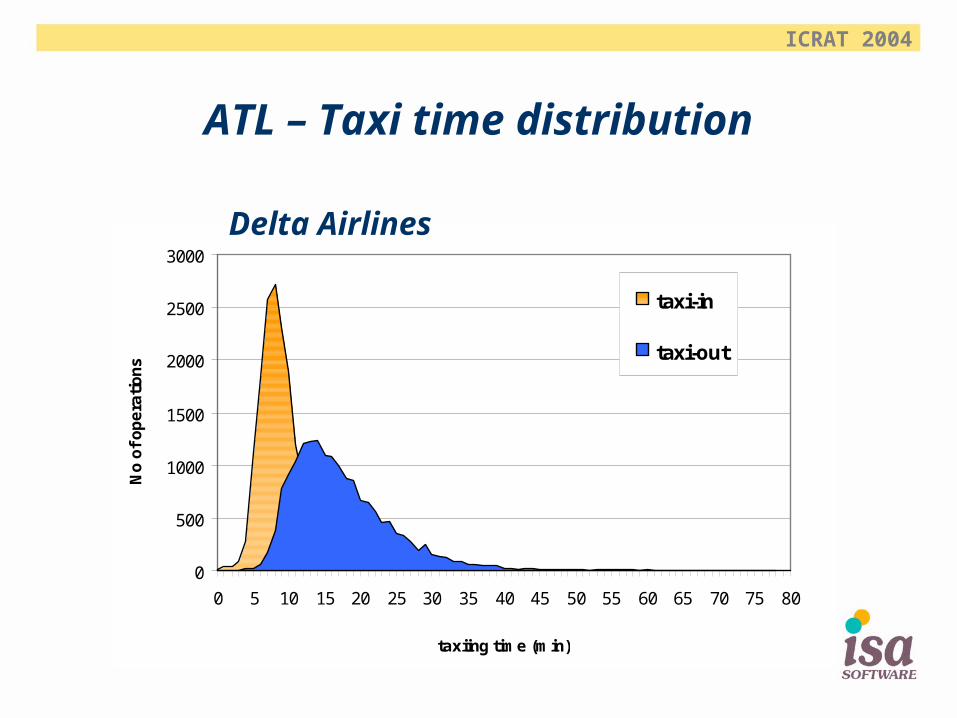
ATL – Taxi time distribution
0
500
1000
1500
2000
2500
3000
0 5 10 15 20 25 30 35 40 45 50 55 60 65 70 75 80
taxiing time (min)
No
of
op
era
tio
ns
taxi-in
taxi-out
Delta Airlines
ICRAT 2004
Impact of new runway on taxiing times
• Target of the analysis:– Airport with new runway after Sept. 2000
– Airport with ground delays
– Airport with identical traffic levels before and after the new runway
Phoenix Sky Harbor Int’l airport – Third runway in October 2000
– Ranked 15th in US taxi-out delays
– Traffic: Sept 47283 ops, Nov 46898 ops
ICRAT 2004
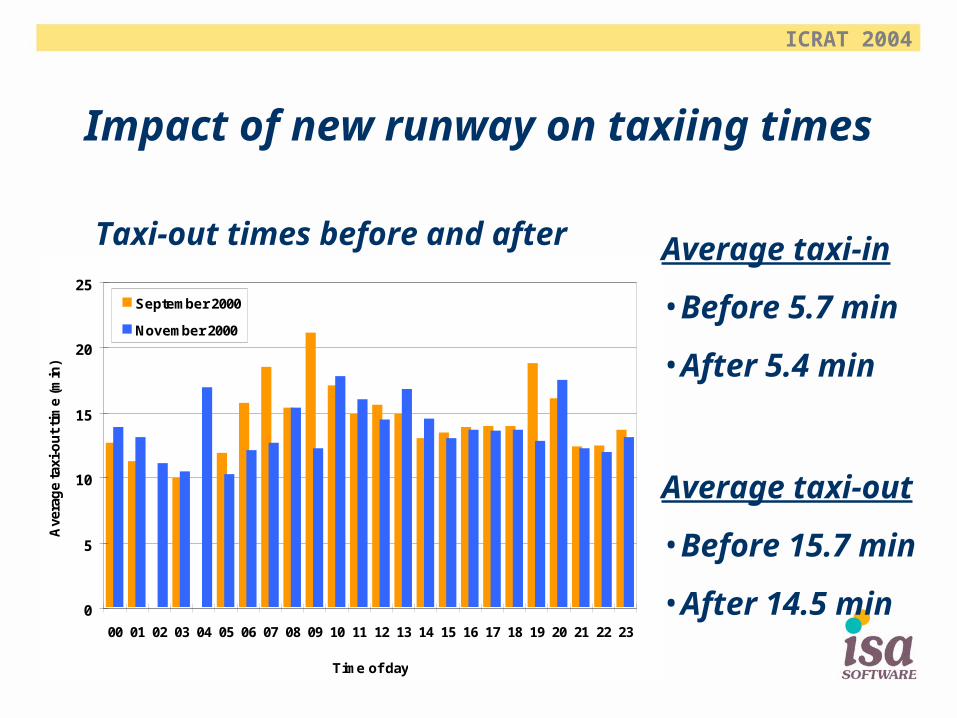
0
5
10
15
20
25
00 01 02 03 04 05 06 07 08 09 10 11 12 13 14 15 16 17 18 19 20 21 22 23
Time of day
Ave
rag
e ta
xi-o
ut
tim
e (m
in)
September 2000
November 2000
Impact of new runway on taxiing times
Taxi-out times before and after Average taxi-in
•Before 5.7 min
•After 5.4 min
Average taxi-out
•Before 15.7 min
•After 14.5 min

ICRAT 2004
Conclusion and future work
• A few airports with distinctive surface operations performance
• Today’s airport surface operations are somewhat unpredictable
– Taxi-out is subject to very large variations
– Taxi-in is less time consuming and much more predictable
• Surface predictability needs to increase to support 4D-contract based management
Weather