iche 2014, hamburg - lehfeldt & kopmann (eds) - 2014
TRANSCRIPT

1 INTRODUCTION
Eutrophication, occurring by primary and secondary production as a result of increased nutrient levels, namely, nitrogen and phosphorus (Vollenweider, 1975), is a serious problem in many lakes and reser-voirs, as it threats the aquatic environment and water quality of the latter (Chin, 2013) such that the water clarity is decreased due to excessive growth of plants, the oxygen content is depleted in bottom layers, es-pecially in deep reservoirs, and the pH is increased which may lead to a subsequent increase of the toxici-ty of certain chemical compounds present in the water body (USEPA, 1986). Eutrophication is a natural process occurring frequently in natural lakes; however, since reservoirs accumulate water from a larger upstream watershed with human activities, they receive more nutrients and sediment loads and, conse-quently, experience more extensive eutrophication than natural lakes (Kennedy et al., 1985; Smith et al., 1999). The resulting growth of summer algal blooms may then impact the reservoirs ecosystem and water quality (WHO, 2004). Eutrophication, together with a large depth of the water column in a reservoir add
Prediction and Analysis of Eutrophication in a Reservoir Using Three-dimensional Modeling: Application to the Planned Abolabbas Reservoir, Iran
B. Zamani & M. Koch Department of Geohydraulics and Engineering Hydrology, University of Kassel, Germany
A. Fakheri-Fard
Department of Water Engineering, Faculty of Agriculture, University of Tabriz, Iran
A. Moridi Faculty of Civil Engineering, Shahid Beheshti University, Tehran, Iran
ABSTRACT: Eutrophication in lakes and reservoirs plays a key role in aquatic environments and water quality management by affecting oxygen and nutrient cycles, especially in very deep and large impound-ments. Prediction of eutrophication will give valuable information to water resources planners on how to control and limit the most effective factors causing eutrophic conditions in reservoirs. The complex bio-chemical processes of eutrophication, as well as the complex hydro- thermodynamic mechanisms of thermal stratification as the most important factors determining eutrophication can only be evaluated by extensive numerical modeling. In this study the 3D hydrodynamic model ELCOM, coupled with a dy-namic ecosystem model CAEDYM is used to simulate the oxygen and nutrient cycles, i.e. the eutrophica-tion processes in a future planned deep reservoir in southwest Iran (Abolabbas reservoir). The effects of three scenarios for normal and drought conditions on the reservoir eutrophication are numerically investi-gated. The first scenario mimics normal operation conditions, and the other two the reservoir's perfor-mance during drought periods. The life, metabolism and settling- re-suspension cycles for two groups of phytoplankton (cyanobacteria and chlorophytes) as the most important biochemical factors causing eu-trophication, as well as the nitrogen-phosphorous-carbon and dissolved oxygen cycles within the water column are simulated. For the analysis of the eutrophication Vollenwieder’s model and the TSI- index are employed. The numerical simulations show that under normal conditions the reservoir will stay in an oli-gotrophic state. In contrast, for the drought scenarios, besides a general lowering of the water quality in-dices, the eutrophic conditions decrease to a mesotrophic-eutrophic or even to a full eutrophic state. The reservoir then suffers from severe oxygen depletion, especially in the hypolimnion. The simulations indi-cate also that phosphorus in the reservoir's inflow is the eutrophication-limiting factor in all scenarios. The sensitivity analysis of some parameters determining the fate of the nutrients and the oxygen cycle in the model demonstrates that the wind drag coefficient, the light intensity and the sediment-oxygen ex-change exhibit the highest sensitivities, which means that these parameters should be well known to have model confidence.
Keywords: Eutrophication, Numerical model, ELCOM, CAEDYM, Abolabbas reservoir, Iran
ICHE 2014, Hamburg - Lehfeldt & Kopmann (eds) - © 2014 Bundesanstalt für Wasserbau ISBN 978-3-939230-32-8
871
then to the summer stratification by reducing the atmospheric oxygen adsorption in the deep layers of the hypolimnion, leading eventually to dead-zones there.
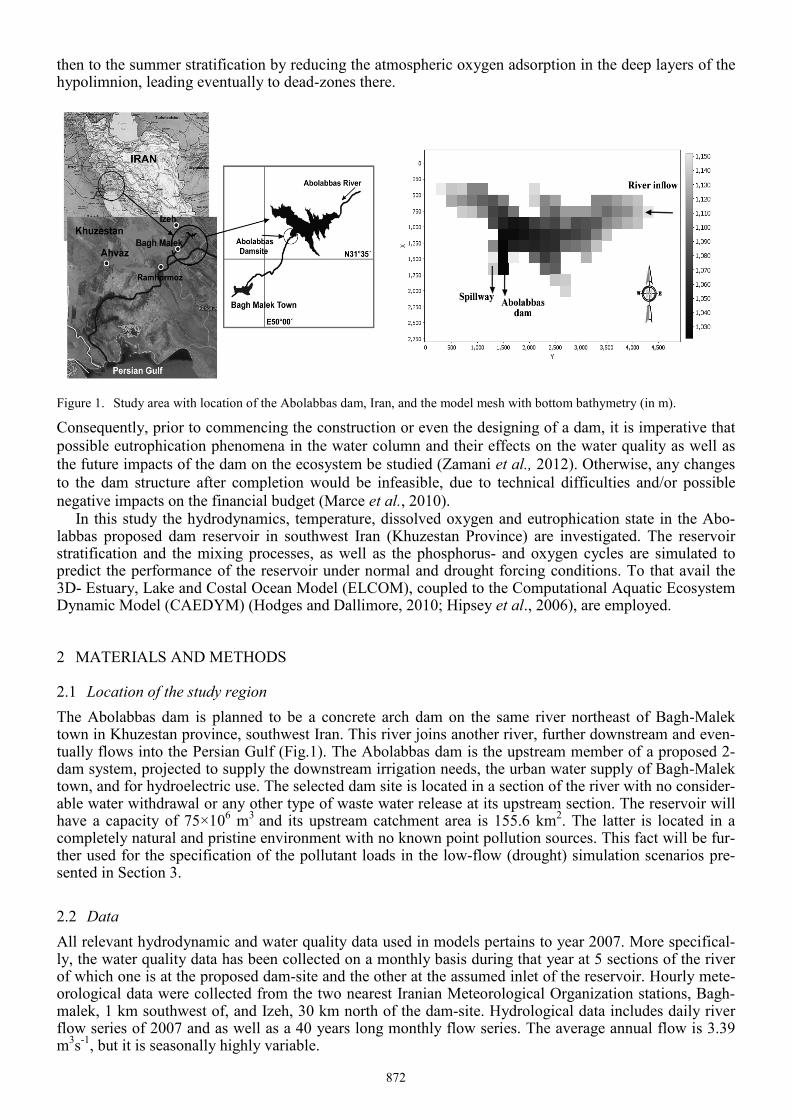
Figure 1. Study area with location of the Abolabbas dam, Iran, and the model mesh with bottom bathymetry (in m).
Consequently, prior to commencing the construction or even the designing of a dam, it is imperative that possible eutrophication phenomena in the water column and their effects on the water quality as well as the future impacts of the dam on the ecosystem be studied (Zamani et al., 2012). Otherwise, any changes to the dam structure after completion would be infeasible, due to technical difficulties and/or possible negative impacts on the financial budget (Marce et al., 2010).
In this study the hydrodynamics, temperature, dissolved oxygen and eutrophication state in the Abo-labbas proposed dam reservoir in southwest Iran (Khuzestan Province) are investigated. The reservoir stratification and the mixing processes, as well as the phosphorus- and oxygen cycles are simulated to predict the performance of the reservoir under normal and drought forcing conditions. To that avail the 3D- Estuary, Lake and Costal Ocean Model (ELCOM), coupled to the Computational Aquatic Ecosystem Dynamic Model (CAEDYM) (Hodges and Dallimore, 2010; Hipsey et al., 2006), are employed.
2 MATERIALS AND METHODS
2.1 Location of the study region The Abolabbas dam is planned to be a concrete arch dam on the same river northeast of Bagh-Malek town in Khuzestan province, southwest Iran. This river joins another river, further downstream and even-tually flows into the Persian Gulf (Fig.1). The Abolabbas dam is the upstream member of a proposed 2-dam system, projected to supply the downstream irrigation needs, the urban water supply of Bagh-Malek town, and for hydroelectric use. The selected dam site is located in a section of the river with no consider-able water withdrawal or any other type of waste water release at its upstream section. The reservoir will have a capacity of 75×106 m3 and its upstream catchment area is 155.6 km2. The latter is located in a completely natural and pristine environment with no known point pollution sources. This fact will be fur-ther used for the specification of the pollutant loads in the low-flow (drought) simulation scenarios pre-sented in Section 3.
2.2 Data All relevant hydrodynamic and water quality data used in models pertains to year 2007. More specifical-ly, the water quality data has been collected on a monthly basis during that year at 5 sections of the river of which one is at the proposed dam-site and the other at the assumed inlet of the reservoir. Hourly mete-orological data were collected from the two nearest Iranian Meteorological Organization stations, Bagh-malek, 1 km southwest of, and Izeh, 30 km north of the dam-site. Hydrological data includes daily river flow series of 2007 and as well as a 40 years long monthly flow series. The average annual flow is 3.39 m3s-1, but it is seasonally highly variable.
872
2.3 Model description and approach ELCOM is a 3D- hydrodynamic flow and transport model for simulating, temporal variations of flow temperatures and densities in thermally (density) stratified lakes and reservoirs with environmental forc-ing (inflows, winds, radiation) by numerically solving the Reynolds-averaged Navier-Stokes (RANS) equation for flow and a scalar transport equation for temperature (or solutes) under the Boussinesq ap-proximation (neglecting non-hydrostatic pressure terms, except in the buoyancy terms) (Cassuli and Cheng, 1992; Hodges and Dallimore, 2010).
CAEDYM is an aquatic ecological model which includes comprehensive process representation of the C, N, P, Si and DO cycles, several size classes of inorganic suspended solids, and phytoplankton dynam-ics with numerous optional biological and other state variables configurations that can resolve species or group specific ecological interactions (Hipsey et al., 2006). For this research, the configuration is set to simulate the two groups of phytoplankton (freshwater cyanobacteria and chlorophytes), nutrients, oxygen, two groups of suspended solids and 14 groups of geochemical components. For the simulation of the sed-iment and benthic exchanges, the diagenesis sub-model is activated.
Since there is no experimental in-lake data for the planned Abolabbas reservoir yet availa-ble, according to Hamilton and Schladow (1997) one should rely in the first phase of such a study on lit-erature values and /or on laboratory or site specific values. Thus, the model has been calibrated based on generic parameters obtained from studies in regions with a similar limnological category (e.g. Hamilton and Schladow, 1997; Romero et al., 2004; Marce et al., 2010) including those from other nearby Iranian studies, however with other models (e.g. Mahab, 2005; 2007).
2.4 Eutrophication analysis Nitrogen (N) and phosphorus (P) as the primary nutrients causing eutrophication are the main controllable nutrients (Chapra, 1997). Although P is often known as the eutrophication limiting nutrient, the N:P ratio is used to identify the former. An N:P ratio more than 7.2 indicates P as the limiting nutrient (Chapra, 1997). The total N and P input loads into the Abolabbas reservoir are 16898 kg/yr and 929 kg/yr, respec-tively, which, obviously, means that P is the limiting nutrient in the reservoir.
For eutrophication analysis, two of the most common trophic state identification models, TSI (trophic state index) (Chin, 2013) and that of Vollenweider (1975) are used in this study.
In lakes that are P-limited the TSI is usually assessed by the water transparency as measured by a Sec-chi disk (Carlson, 1977) and is directly related with total phosphorus (TP) and the concentration of Chlo-rophyll (Chla). Using correlations between Chla, TP and Secchi depth, TSI is estimated by eq. 1. TSI=4.14+14.43*ln(TP) (1) Table 2 shows the categorization of the trophic state of a lake, according to its TSI index. Vollenweider’s eutrophication model also suggests that in P-limited systems the trophic state is correlated with TP. Table 3 indicates the trophic state classification according to Vollenweider’s model. Table 2. Trophic state classification of lakes according to TSI (Chin, 2013).
TSI range <40 35-45 45-60 >60 Trophic state Oligotrophic Mesotrophic Eutrophic Hypertropic
Table 3. Trophic state classification on total phosphorus concentration by Vollenweider’s model (Chapra, 1997).
3 RESULTS AND DISCUSSION
3.1 Simulation scenarios Three different scenarios are simulated: 1) A full reservoir with two open irrigation and power outlets, two outlets in the dam wall, i.e. a hydropower outlet at 1090 m and an irrigation outlet at 1055 m above sea level (masl), corresponding to 63m and 95m below the normal operating level, respectively (coded as
Variable Oligotrophic Mesotrophic Eutrophic Total Phosphorus (μg L-1) <10 10 – 20 >20
Hypolimnion oxygen (% saturation) >80 10 – 80 <10
873

FULRES), 2) a full reservoir with low flow (FULWF), mimicking the beginning of drought conditions, the latter being represented by the minimum inflow series, as computed from the long-term river flow da-ta, and 3) minimum reservoir with low flow (MINLWF ), which is a more extreme case than to 2), but as-suming the reservoir is at its minimum operating level when the drought condition starts.
3.2 Full reservoir (FULRES)-scenario This full reservoir scenario (FULRES) serves as the reference, as it describes normal conditions prevail-ing in a reservoir. As such, its simulation results, shown in Fig.2 and Fig.3, namely, the panel of the monthly temperature (T) in a vertical water column of the reservoir, provides some fundamental infor-mation on the general limnological behavior of a reservoir. In fact, temperature is the key parameter in aquatic ecosystems and, especially, in understanding the eutrophication proces (Ji, 2008). First of all, the thermal state of the reservoir determines the density stratification and, in consequence, the presence or ab-sence of overturn processes in the reservoir, which in turn, are direct indicators of its eutrophic state. For the summer which is the season with the strongest temperature stratification of the reservoir, Fig. 2 indi-cates that T decreases from a high 30 oC at its surface to a low 15 oC at its bottom.
The T-panel of Fig.3 then shows that the main overturn process inside the reservoir starts at the end of December, and is dithering away in the middle of April, when stratification starts with the rising air tem-peratures, reaching its peak time in July/August, when the air temperature in the study region climbs to 45ºC. Depending on the month of the year, the range of depths of the thermocline is between 18 and 48 m, and a maximum temperature difference of nearly 20ºC is observed between epilimnion and hypolim-nion during the summer months.
During the named stratification period, the hourly wind speeds average 3.4 ms-1 and rarely exceed 7.5 ms-1. A further assessment of the computational results showed that the wind-induced turbulence mixing creates some local and temporary mixings in the stratified epilimnion. However, due to the high tempera-ture (up to 45°C) in the region during that summer period, the strong thermal stratification overcomes the mechanical mixing of the wind-driven layers. In addition, since the wind speed on the water surface is of-ten less than 3.8 ms-1, as well as due to the relatively small area of the reservoir, the effects of the wind on the generation of microscale braking waves (Peirson and Banner, 2012) were neglected on the surface al-gae.
Regarding the other three panels of Fig. 3, they show the corresponding simulation results for the dis-solved oxygen (DO) and total P(TP) in a water column for the different months of the year and, finally, the TP-distribution along the vertical longitudinal cross-section of the reservoir. With a simulated P- con-centration of 5 μg L-1, Vollenweider’s model (Table 2) indicates an oligotrophic reservoir which is also corroborated by the TSI = 30 (Table 1) calculated from Eq. (1).
The monthly changes of the three variables T, DO and TP in Fig. 3 show clearly the evolution of the stratification process. Thus during the peak of the stratification period (August), the thermocline isolate the hypolimnion from the layers above causing a turn of the hypolimnetic from hypoxia to anoxia with a depletion of DO, so that the hypolimnion starts to consume phosphorus from the sediments (Chapra, 1997). However, this P-release is not large enough to impact the trophic state of the reservoir.
Figure 2. Temperatures along the longitudinal cross section of the reservoir during the summer stratification period.
874

3.3 Drought starting from full reservoir (FULWF-scenario) As mentioned earlier, because of the absence of upstream pollution sources, the total load of contaminants into the Abolabbas reservoir is due to non-point sources. In such a case, the transport of a pollutant is pos-itively correlated with the flow rate which means, in turn, that low inflows during droughts will carry also a low load of nutrients, so that, eventually, their concentrations remain constant (Zamani, 2012). With this assumption the present and the subsequent drought scenario have been executed.
The results of the FULWF- scenario are illustrated in Fig.4. The first thing to notice is that the water levels experience a 30 m decrease during the entire 1-year simulation period. In contrast to the previous scenario (FULRES), higher TP- concentrations are now observed, accentuated by the drawdown of the reservoir. Also, in this scenario, the sedimentary TP- release starts earlier in the year, reaching its peak during the summer stratification (August). The DO-depletion in the hypolimnion is also more pronounced over the entire year, which is due to the fact that the lower water levels (less surface area) cause less ad-sorption of O from the atmosphere (Wanninkhof, 1992) whose downward transport is further inhibited by the strong thermocline and the absence of outlet water suction. This process, consequently, intensifies the nutrients release from the sediments (Chapra, 1997).
With the general high increase of the TP- concentration, a considerable increase in TSI with a value of 58 is obtained, i.e. the reservoir is categorized as completely eutrophic. On the other hand, with a simulat-ed total P- concentration of 14 μg L-1 Vollenweider’s model would categorize the reservoir as meso-trophic. However, when using Vollenweider’s advanced model (Chapra, 1980; Chapra,1997), which con-siders also the hypolimnetic DO-concentration, (almost 0 mg L-1 here), reservoir’s trophic state can be categorized as mesotrophic-to-eutrophic, i.e. it is more in agreement with the TSI index.
3.4 Drought starting from minimum operation level (MINLWF-scenario) This scenario (MINLWF) simulates the start of a drought period while the reservoir is at the minimum powerplant operation level, i.e. the corresponding outlet is considered to be closed and only a minimum planned environmental river flow of 0.2 m3s-1 is released via the irrigation outlet.
Figure 3. Results of FULRES simulation: Upper left: Water temperature; upper right: Dissolved oxygen; lower left: Total
phosphorus; lower right: TP- distribution along a longitudinal cross section of the during the winter overturn time.
875

Figure 4. Results of FULRES simulation. See Fig. 3 for notations.
Figure 5. Results of FULRES simulation. See Fig. 3 for notations.
Fig. 5 shows the results for this scenario. A very rapid water level dropdown of 40 m can be seen in summer as well as an earlier and strong start of the P- release from sediments (early July). The calculated TSI for this scenario is 66 which means that the reservoir is in a completely eutrophic state. This is also confirmed by Vollenweider’s model (Table 2), as the total simulated P- concentration is 75 mgL-1. Com-pared with the somewhat less extreme previous scenario (FULWF), the eutrophication intensity is obvi-ously increased here. In addition, a permanent O -depletion below the thermocline is detectable during the entire simulation period which, compared with the last scenario, is much more pronounced, so that the thickness of the hypolimnetic anoxic layer varies between a high 25m and 50m over most of the months of the year.
4 SENSITIVITY ANALYSIS OF THE MODEL
A sensitivity analysis on the key parameters affecting the stratification and the phosphorus cycle has also been carried out in order to investigate the uncertainty of the model. To that avail around 60 simulations are performed by changing the values of various input parameter within a certain range. Table 3 shows these parameters and a summary of the sensitivity analysis results. Here sensitivity S for a variable x is defined as the ratio of a change in the normalized model output variable Δy/y0 , i.e. total P, to that of Δx/x0, i.e. S = (Δy/y0)/(Δx/x0), where y0 and x0 are the reference values of the calibration.
Following the order of the parameters as listed in Table 4, the results of sensitivity analysis show that the wind drag coefficient Cwind has one of the highest sensitivities, particularly, in the epilimnion which is more affected by the wind-induced turbulence on the water surface than the bottom layers of the hypo-limnion in deep lakes or deep reservoirs (Ji, 2008).
On the other hand, the model is more sensitive to the changes of the light extinction coefficient η and fraction of light incident I in the hypolimnion. This is due to the fact that, because of the Beer-Bouguer
876

and Beer-Lambert laws (Cole, 1983; Hodges, 2010), the intensity of the light weakens exponentially through the water column, so that the bottom layers of the reservoir will be more affected by any changes of light availability than the surface layers. On the other hand, Table 4 indicates that the bottom drag co-efficient CD has only a very low sensitivity.
In the group of the chemical/biological parameters mutual high sensitivities for changes of the static sediment exchange rate rSOs and of the half-saturation constant for sediment oxygen fluxes KSOs can be seen in the hypolimnion, since both constants pertain to the benthic layer of water, the one immediately above the bottom sediments (Hipsey et al., 2010).
Finally, the model shows some sensitivity to the phosphorus-related parameters, i.e. the half-saturation constant for phosphorus Kp and, less so, the maximum rate of the phosphorus uptake UPmax for the two simulated types of phytoplankton, namely, chlorophytes and cyanobacteria, where for UPmax the sensitivi-ty of the latter is higher than of the former to determine the eutrophication process.
In conclusion of the sensitivity analysis, it can be stated that the parameters describing light and sedi-ment oxygen demand are the most sensitive ones and the bottom drag coefficient is the least sensitive one. A rather high sensitivity is obtained for the half-saturation constant for phosphorus.
Based on these results one may say that the simulation results of the coupled ELCOM/CAEDYM- model for the proposed Abolabbas reservoir can be accepted with some confidence, if the named sensitive parameters of the model are reasonably well known and/or measured properly.
Table 4. Results of the sensitivity analysis for different parameters (see text for meaning). Parameter Specification Assigned value x0 Range of change Δx Sensitivity(%)
Cwind 0.013 0.008-0.018 2.8 η 0.3 0.1-0.9 1.9
I 0.45 0.2-0.9 1.3 CD 0.055 0.025-0.075 0.9
KSOs 5 2 --7 1.3 rSOs 0.3 0.1-0.5 4.4
KP Cyanobacteria 0.008 0.004-0.016 1.8 Chlorophytes 0.005 0.0025-0.01 1.8
UPmax Cyanobacteria 0.1 0.025-0.5 1.4 Chlorophytes 0.3 0.06-1.5 0.8
5 CONCLUSIONS
In this study, the simulations for the Abolabbas reservoir by means of the coupled ELCOM/CAEDYM model have been carried out with three different operational withdrawal strategies for a particular year. These have been simulated by varying the forcing conditions for the reservoir operating levels, outlet lev-els, either open or closed, and different planned inflow/outflows.
The results show the typical “warm monomictic” limnological classification of the reservoir. This is confirmed by both types of lakes categorization, as proposed by Hutchinson and Löffler (1956) and Löf-fler (2004) for which the probability of occurrences of eutrophic conditions is high.
In the first scenario of a full reservoir with normal inflow, no particular problem with eutrophication and dissolved oxygen occurs, so that the reservoir maintains an oligotrophic state. During the stratifica-tion peak period some phosphorus release from the sediments occurs, but, which does not have a particu-lar effect on the eutrophic state of the reservoir. Thus, the full reservoir stays oligotrophic during the en-tire simulation period, with a TSI-index equal to 30.
The analyses of the reservoir for two drought conditions show that the phosphorus is released frim sed-iments, owing to the development of anoxic layers in the hypolimnion. This phosphorus release becomes more intense with increasing drought intensity. The reservoir’s eutrophic state changes to mesotrophic and, eventually, to eutrophic conditions, as indicated by a rise of the TSI-index from 42 to up to 66 which categorizes the reservoir to be in an oligotrophic-to-eutrophic state.
The sensitivity analysis of the model shows an acceptable level of uncertainty of the simulation output (TP-concentration) and provides hints which model parameters require careful identification and should be known well for a reliable prediction in future applications to the completed reservoir. This is the case for the wind drag coefficient and the bottom sediment exchange rate which have high sensitivities.
877

REFERENCES
Carlson, R.E., 1977. A trophic index for lakes. Limnology and Oceanography, 22, 361-369. Chapra, S.C., 1980. Application of the phosphorus loading concept to the Great lakes. In: phosphorus management strategies
for lakes, R. C. Loher et al., eds., Ann Abor Science, Ann Abor, MI. Chapra, S. C., 1997. Surface water quality modeling. McGraw-Hill, New York, NY. Chin, David A., 2013, Water quality engineering in natural systems, John Wiley & Sons Inc., Hoboken, NJ. Cole, G.A. 1983. Textbook of Limnology, 3rd Ed. C.V. Mosby Company, USA. Hamilton, D.P. and Schladow, S.G., 1996. Prediction of water quality in lakes and reservoirs. Part I – Model description. Eco-
logical Modeling, 96, 91-110. Hipsey, M.R., Romero, J.R., Antenucci, J.J. and Hamilton, D., 2006. Computational Aquatic Ecosystem Dynamics Model:
CAEDYM v3.2 Science Manual. Centre for Water Research, University of Western Australia. Hodges,B.R. and Dallimore, C., 2010., Estuary, Lake and Coastal Ocean Model: ELCOM v2.2 User Manual, Centre for Water
Research, University of Western Australia, WA. Hutchinson, G.E. and Löffler. H., 1956. The thermal classification of lakes. Proceedings of the National Academy of Sciences,
42, 84–6. Ji., Z.-G., 2008. Hydrodynamics and water quality: modeling rivers, lakes, and estuaries, John Wiley & Sons, New York, NY Kennedy, R.H., Thornton, K.W., and Ford, D.E., 1985. Characterization of the reservoir ecosystem, in Microbial processes in
reservoirs. D. Gunnison, ed., Junk Publishing, Boston, MA, pp. 27-38. Löffler, H.,. 2004. The origin of lake basins. In: O’Sullivan, P.E., Reynolds, C.S., (editors), The lakes handbook, Vol.1, 2nd
Ed. Blackwell Publishing, Oxford, UK., pp. 8-60. Mahab, Cons. Eng., 2005. Early studies of Abolabbas reservoir, Water resources and water quality report. Technical report (in
Persian). Mahab, Cons. Eng., 2007. Stratification and eutrophication studies of Sazbon reservoir. Technical report (in Persian). Marce, R., Moreno-Ostos,E., Garcı´a-Barcina, J.,M. and Armengol, J., 2010. Tailoring dam structures to water quality predic-
tions in new reservoir projects: Assisting decision-making using numerical modeling. Journal of Environmental Manage-ment, 91, 1255–1267.
Peirson W.L. and Banner M.L., 2003, Aqueous surface layer flows induced by microsale baking waves. J. Fluid Mech., 479, 1–38.
Romero, J.R., Antenucci J.P. and Imberger, J., 2004. One- and three-dimensional biochemical simulations of two differing res-ervoirs. Ecological Modelling, 174, 143-160.
Smith VH, Tilman G.D. and Nekola JC., 1999. Eutrophication: impacts of excess nutrient inputs of freshwater, marine, and terrestrial ecosystems. Environmental Pollution, 100, 179–96.
USEPA, 1986. Quality criteria for water. Office of water regulations and standards, Washington D.C. 20460. Vollenweider, R.A., 1975. Input output models with special reference to the phosphorus loading concept in limnology.
Schweiz. Z. Hydrol., 37, 53-84. Wanninkhof, R., 1992. Relationship between windspeed and gas exchange over the ocean. J. Geophys. Res. (Oceans) 97,
7373-7382. World Health Organization, WHO, 2004. Chapter 10, Accessibility Aspects in Guidelines for Drinking-water Quality. Third
Edition Vol. 1, 218. World Health Organization, Geneva. Zamani, B., 2012. Water Quality Modeling in Dam Reservoirs (Abolabbas Reservoir). MSc thesis. University of Tabriz. Zamani, B., Fakheri-Fard, A. and A., Morid, 2012, A. Three-dimensional hydrodynamic modeling of a future reservoir to
adapt to face global warming effect. The first international conference on dams and hydropower (ICDHP), Iran, Tehran, 2012.
878