iche 2014, hamburg - lehfeldt & kopmann (eds) - 2014 ... river, estuarine and... · as long as...
TRANSCRIPT
1 INTRODUCTION
Estuaries and coastal areas are among the most densely populated areas of the world. They play an im-portant role in terms of industry, agriculture, trade, tourism and settlement to mention some key sectors. Today these areas already suffer from various problems like erosion, flood risk and long-term habitat de-terioration. Since the concentration of people in coastal areas is expected to grow fast in the next decades and economies continue to develop, the asset base of risk will increase.
The Elbe estuary plays an important role for Northern Germany and functions for example as an im-portant federal waterway. The whole Elbe river has undergone several anthropogenic changes since the 16th century like diking and river regulations. These modifications led in combination with natural changes in hydrodynamics to an unfavourable hydro-morphological evolution, namely to an increase of the tidal energy and the tidal pumping further upstream.
2 INVESTIGATION AREA
The investigation area as a whole comprises the Elbe estuary and the inner part of the German bight. The border in the west is defined by the island of Scharhörn and Trischen at the border to the North Sea (Elbe-km 740) and in the east by the city of Hamburg (Elbe-km 610). Politically the investigation area compris-es many responsibilities, i.e. the city of Hamburg and the adjoining federal states Lower Saxony and Schleswig-Holstein.
The river Elbe has its source in the Czech public and reaches the North Sea at Cuxhaven after 1,094km. The entire catchment basin of the Elbe covers 148,268km². The Elbe estuary is comprised of the lower reaches between the weir at Geesthacht (Elbe-km 588) and the transition to the North Sea (El-be-km 760). As long as no storm-tide conditions prevail, the tidal influence of the Elbe estuary is limited by the Geesthacht weir (Freitag et al., 2008).
Influence of Artificial Sandbanks in the Mouth of the Elbe Estuary on Estuarine and Coastal Hydrodynamics and Mitigation of Tidal Energy for a Better Flood Defence
N. Ohle & D. Schuster Hamburg Port Authority, Hamburg, Germany
J. Kappenberg & J. Sothmann Institute for Coastal Research, Helmholtz-Zentrum Geesthacht, Germany
E. Rudolph Federal Waterways Engineering and Research Institute, Hamburg, Germany
ABSTRACT: Within the framework of different EU framework research projects (THESEUS, TIDE) in-vestigations of the efficiency of artificial sandbanks in the mouth of the Elbe estuary for mitigation of tid-al energy and a better storm surge protection were investigated. The efficiency of the artificial sandbanks was analysed by means of two- and three-dimensional hydro- and morphodynamic models. The models calculate the water level and current velocities as well as the transport of dissolved constituents under mean and storm surge conditions. To allow the investigation of the effects of the artificial sandbanks on water level and currents in the inner estuary a high spatial grid resolution was used. Overall results of the investigations are presented and an outlook how those measures can contribute to innovative risk mitigation is shown.
Keywords: Elbe estuary, Sandbanks, Flood protection, Risk mitigation, THESEUS, TIDE, Numerical model, Damping of tidal energy
ICHE 2014, Hamburg - Lehfeldt & Kopmann (eds) - © 2014 Bundesanstalt für Wasserbau ISBN 978-3-939230-32-8
461
The long-term yearly mean freshwater run-off is ~700m³/s in a range from 150m³/s up to 4060m³/s. The most frequently freshwater run-off is in a range of 300 to 400m³/s. Tides are semi-diurnal with a marked diurnal asymmetry. The mean tidal range decreases from 3m at the inlet to 2.7m 50km up-estuary, and rises again towards the port of Hamburg, where it attains its maximum of 3.6m and falls to 2m at the Geesthacht weir. Spring high tides exceed neap high tides by about 0.7m from the inlet to Ham-burg, while the difference between spring and neap low tides can only be felt up to 50km from the mouth. The estuary can be classified as a mesotidal and partially mixed coastal plain estuary. The influence of wind during a storm event with winds from a north-westerly direction leads to considerable increases in the tidal high water levels. While the water level and the salinity in an estuary have a uniform large-scale distribution, the current velocity is a parameter, which varies strongly with space and time. This factor leads to a tidal pumping of sediments from the lower reaches of the Elbe to areas further upstream, result-ing in insufficient water depths in the navigation channel and harbour basins (Boehlich et al., 2008).
3 OBJECTIVES AND MODELLING APPROACH
3.1 General Approach The basic idea within the framework of the European projects THESEUS (Monbaliu et al., 2014) and TIDE (Meine et al., 2013) is the idea to dampen the incoming tidal energy already in the mouth of the es-tuary. This mitigation approach may allow reducing the water levels along the estuary and in Hamburg by introducing artificial sandbanks in the mouth area of the Elbe. Two kinds of layouts were investigated: • Emerged sandbanks (above high water) • Submerged sandbanks (below low water) The criteria for the selection of the several sandbank scenarios (emerged and submerged) were the follow-ing: • Nautical implications • Geo-morphology aspects
• Availability of sandy material for the construction • Stability and sustainability of the layout
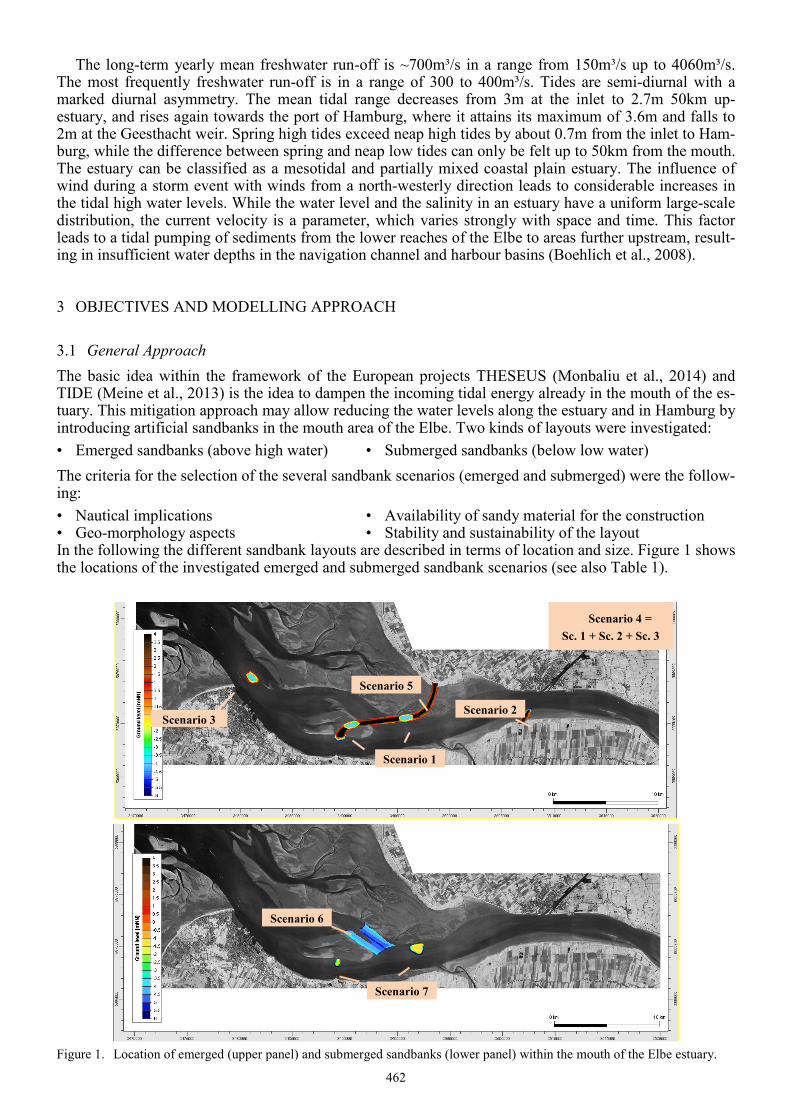
In the following the different sandbank layouts are described in terms of location and size. Figure 1 shows the locations of the investigated emerged and submerged sandbank scenarios (see also Table 1).
Figure 1. Location of emerged (upper panel) and submerged sandbanks (lower panel) within the mouth of the Elbe estuary.
Scenario 2 Scenario 3
Scenario 1
Scenario 5
Scenario 4 = Sc. 1 + Sc. 2 + Sc. 3
Scenario 6
Scenario 7
462
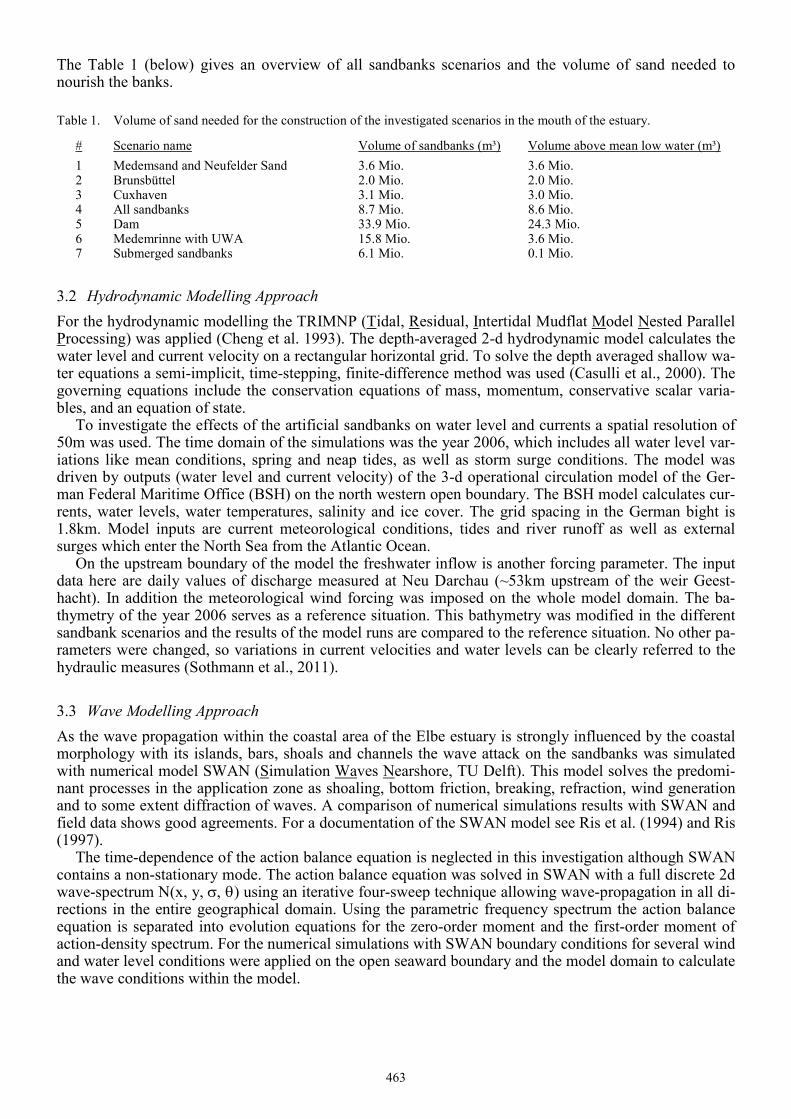
The Table 1 (below) gives an overview of all sandbanks scenarios and the volume of sand needed to nourish the banks.
Table 1. Volume of sand needed for the construction of the investigated scenarios in the mouth of the estuary. # Scenario name Volume of sandbanks (m³) Volume above mean low water (m³) 1 Medemsand and Neufelder Sand 3.6 Mio. 3.6 Mio. 2 Brunsbüttel 2.0 Mio. 2.0 Mio. 3 Cuxhaven 3.1 Mio. 3.0 Mio. 4 All sandbanks 8.7 Mio. 8.6 Mio. 5 Dam 33.9 Mio. 24.3 Mio. 6 Medemrinne with UWA 15.8 Mio. 3.6 Mio. 7 Submerged sandbanks 6.1 Mio. 0.1 Mio.
3.2 Hydrodynamic Modelling Approach For the hydrodynamic modelling the TRIMNP (Tidal, Residual, Intertidal Mudflat Model Nested Parallel Processing) was applied (Cheng et al. 1993). The depth-averaged 2-d hydrodynamic model calculates the water level and current velocity on a rectangular horizontal grid. To solve the depth averaged shallow wa-ter equations a semi-implicit, time-stepping, finite-difference method was used (Casulli et al., 2000). The governing equations include the conservation equations of mass, momentum, conservative scalar varia-bles, and an equation of state.
To investigate the effects of the artificial sandbanks on water level and currents a spatial resolution of 50m was used. The time domain of the simulations was the year 2006, which includes all water level var-iations like mean conditions, spring and neap tides, as well as storm surge conditions. The model was driven by outputs (water level and current velocity) of the 3-d operational circulation model of the Ger-man Federal Maritime Office (BSH) on the north western open boundary. The BSH model calculates cur-rents, water levels, water temperatures, salinity and ice cover. The grid spacing in the German bight is 1.8km. Model inputs are current meteorological conditions, tides and river runoff as well as external surges which enter the North Sea from the Atlantic Ocean.
On the upstream boundary of the model the freshwater inflow is another forcing parameter. The input data here are daily values of discharge measured at Neu Darchau (~53km upstream of the weir Geest-hacht). In addition the meteorological wind forcing was imposed on the whole model domain. The ba-thymetry of the year 2006 serves as a reference situation. This bathymetry was modified in the different sandbank scenarios and the results of the model runs are compared to the reference situation. No other pa-rameters were changed, so variations in current velocities and water levels can be clearly referred to the hydraulic measures (Sothmann et al., 2011).
3.3 Wave Modelling Approach As the wave propagation within the coastal area of the Elbe estuary is strongly influenced by the coastal morphology with its islands, bars, shoals and channels the wave attack on the sandbanks was simulated with numerical model SWAN (Simulation Waves Nearshore, TU Delft). This model solves the predomi-nant processes in the application zone as shoaling, bottom friction, breaking, refraction, wind generation and to some extent diffraction of waves. A comparison of numerical simulations results with SWAN and field data shows good agreements. For a documentation of the SWAN model see Ris et al. (1994) and Ris (1997).
The time-dependence of the action balance equation is neglected in this investigation although SWAN contains a non-stationary mode. The action balance equation was solved in SWAN with a full discrete 2d wave-spectrum N(x, y, σ, θ) using an iterative four-sweep technique allowing wave-propagation in all di-rections in the entire geographical domain. Using the parametric frequency spectrum the action balance equation is separated into evolution equations for the zero-order moment and the first-order moment of action-density spectrum. For the numerical simulations with SWAN boundary conditions for several wind and water level conditions were applied on the open seaward boundary and the model domain to calculate the wave conditions within the model.
463
3.4 Sandbank Design Criteria The stability and sustainability of the sandbank layouts is mainly influenced by the wave and current at-tack in the construction area.
Overall the wave heights depend significantly on the individual location with varying water depth, wind speed, wind direction respectively wind fetch length within the model area. The input wave height turns out as little or non-significant, for the wave height within the study area. The bank slopes and bank protections were designed with the above described wave boundary conditions to be sustainable over a long time period. Nevertheless for the overall sustainability of the sandbanks also the active large-scale morphodynamics in the mouth of the Elbe estuary have to be taken into account.
The model results shows that the tidal flood currents are generally higher than the ebb currents. The maximum flood currents were e.g. ~2m/s in the investigated scenario 1 for both sandbanks. The calculat-ed ebb currents amount up to ~1m/s (also scenario 1) and vary between at the different locations. While the flood current field is almost homogenous in space, the maximum ebb currents occur at the southern tips of the sandbanks. Compared to the wave attack the influence of the tidal currents is of second order importance for the stability of the sandbanks. The analysis also showed that the orbital velocities are neg-ligible and therefore these were not further considered in the analysis.
4 RESULTS
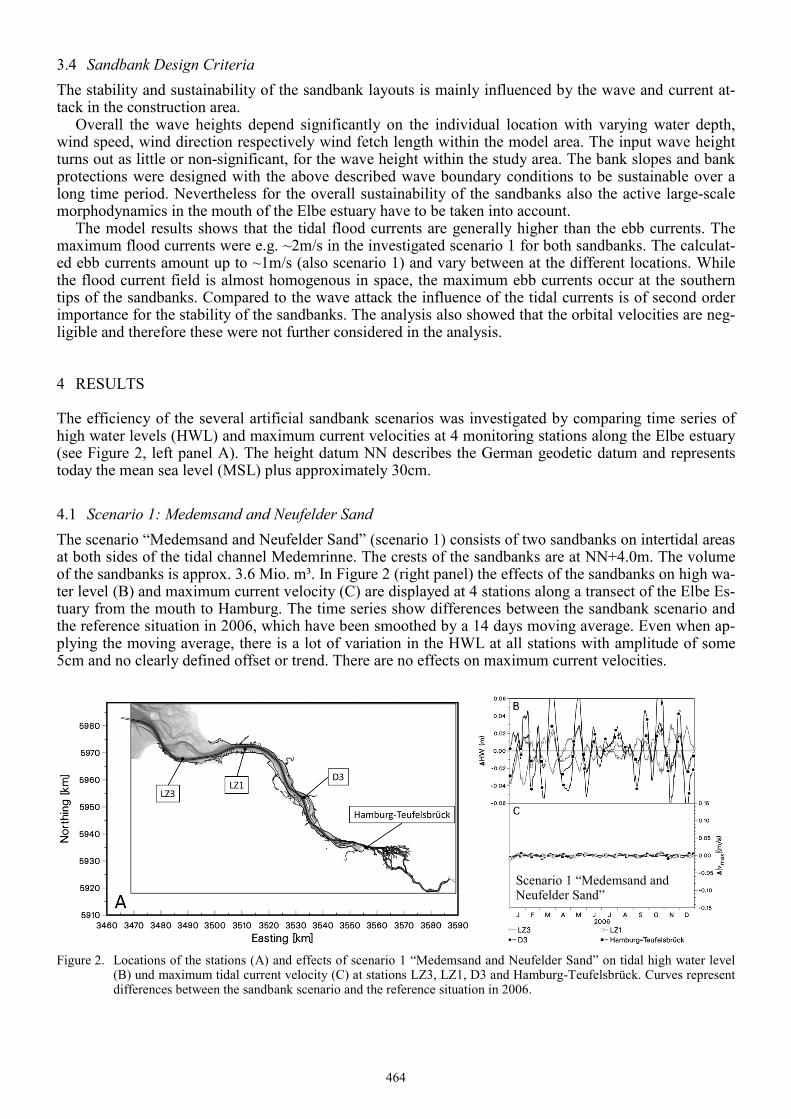
The efficiency of the several artificial sandbank scenarios was investigated by comparing time series of high water levels (HWL) and maximum current velocities at 4 monitoring stations along the Elbe estuary (see Figure 2, left panel A). The height datum NN describes the German geodetic datum and represents today the mean sea level (MSL) plus approximately 30cm.
4.1 Scenario 1: Medemsand and Neufelder Sand The scenario “Medemsand and Neufelder Sand” (scenario 1) consists of two sandbanks on intertidal areas at both sides of the tidal channel Medemrinne. The crests of the sandbanks are at NN+4.0m. The volume of the sandbanks is approx. 3.6 Mio. m³. In Figure 2 (right panel) the effects of the sandbanks on high wa-ter level (B) and maximum current velocity (C) are displayed at 4 stations along a transect of the Elbe Es-tuary from the mouth to Hamburg. The time series show differences between the sandbank scenario and the reference situation in 2006, which have been smoothed by a 14 days moving average. Even when ap-plying the moving average, there is a lot of variation in the HWL at all stations with amplitude of some 5cm and no clearly defined offset or trend. There are no effects on maximum current velocities.
Figure 2. Locations of the stations (A) and effects of scenario 1 “Medemsand and Neufelder Sand” on tidal high water level
(B) und maximum tidal current velocity (C) at stations LZ3, LZ1, D3 and Hamburg-Teufelsbrück. Curves represent differences between the sandbank scenario and the reference situation in 2006.
Scenario 1 “Medemsand and Neufelder Sand”
464
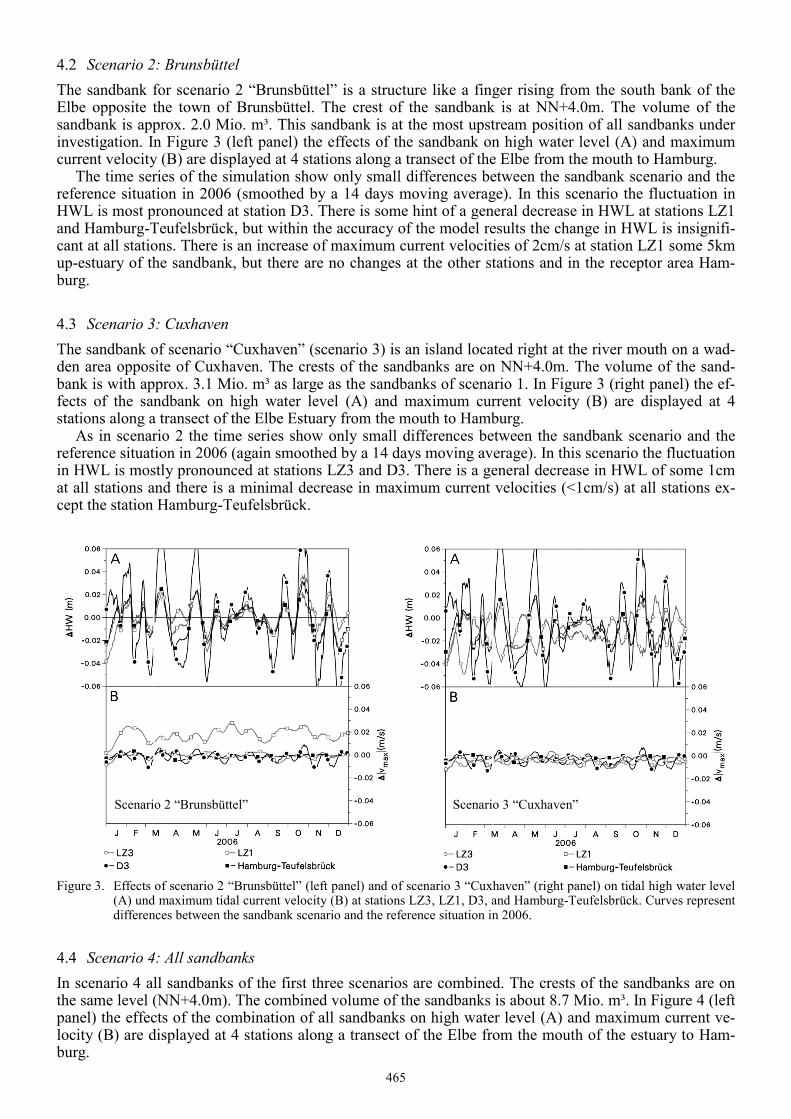
4.2 Scenario 2: Brunsbüttel The sandbank for scenario 2 “Brunsbüttel” is a structure like a finger rising from the south bank of the Elbe opposite the town of Brunsbüttel. The crest of the sandbank is at NN+4.0m. The volume of the sandbank is approx. 2.0 Mio. m³. This sandbank is at the most upstream position of all sandbanks under investigation. In Figure 3 (left panel) the effects of the sandbank on high water level (A) and maximum current velocity (B) are displayed at 4 stations along a transect of the Elbe from the mouth to Hamburg.
The time series of the simulation show only small differences between the sandbank scenario and the reference situation in 2006 (smoothed by a 14 days moving average). In this scenario the fluctuation in HWL is most pronounced at station D3. There is some hint of a general decrease in HWL at stations LZ1 and Hamburg-Teufelsbrück, but within the accuracy of the model results the change in HWL is insignifi-cant at all stations. There is an increase of maximum current velocities of 2cm/s at station LZ1 some 5km up-estuary of the sandbank, but there are no changes at the other stations and in the receptor area Ham-burg.
4.3 Scenario 3: Cuxhaven The sandbank of scenario “Cuxhaven” (scenario 3) is an island located right at the river mouth on a wad-den area opposite of Cuxhaven. The crests of the sandbanks are on NN+4.0m. The volume of the sand-bank is with approx. 3.1 Mio. m³ as large as the sandbanks of scenario 1. In Figure 3 (right panel) the ef-fects of the sandbank on high water level (A) and maximum current velocity (B) are displayed at 4 stations along a transect of the Elbe Estuary from the mouth to Hamburg.
As in scenario 2 the time series show only small differences between the sandbank scenario and the reference situation in 2006 (again smoothed by a 14 days moving average). In this scenario the fluctuation in HWL is mostly pronounced at stations LZ3 and D3. There is a general decrease in HWL of some 1cm at all stations and there is a minimal decrease in maximum current velocities (<1cm/s) at all stations ex-cept the station Hamburg-Teufelsbrück.
Figure 3. Effects of scenario 2 “Brunsbüttel” (left panel) and of scenario 3 “Cuxhaven” (right panel) on tidal high water level
(A) und maximum tidal current velocity (B) at stations LZ3, LZ1, D3, and Hamburg-Teufelsbrück. Curves represent differences between the sandbank scenario and the reference situation in 2006.
4.4 Scenario 4: All sandbanks In scenario 4 all sandbanks of the first three scenarios are combined. The crests of the sandbanks are on the same level (NN+4.0m). The combined volume of the sandbanks is about 8.7 Mio. m³. In Figure 4 (left panel) the effects of the combination of all sandbanks on high water level (A) and maximum current ve-locity (B) are displayed at 4 stations along a transect of the Elbe from the mouth of the estuary to Ham-burg.
Scenario 2 “Brunsbüttel” Scenario 3 “Cuxhaven”
465

The time series of this scenario show a change in the differences between all sandbanks and the refer-ence situation in 2006, which was again smoothed by a 14 days moving average. In this scenario the fluc-tuation in HWL is mostly pronounced at the outer stations LZ3 and LZ1. There is a general decrease in HWL of some 2-3cm at all stations. This is attended by an increase in maximum current velocities at the outer stations (1 to 3cm/s) and a decrease of 1 to 2cm/s at the inner stations D3 and Hamburg-Teufelsbrück.
4.5 Scenario 5: Dam The scenario 5 is the most extreme and a strongly hypothetical one. The intention of such a scenario is to explore the limits of what can be gained by the construction of artificial sandbanks to affect the tidal en-ergy. The dam scenario closes more or less the mouth of the Elbe with the exception of the navigation channel. Starting from a position on Medemgrund just opposite of LZ3, the dam incorporates the sand-banks of scenario 1, obstructs the Medemrinne and ends at the northern bank. The crest of the dam is again at NN+4.0m and the total volume of the dam is about 33.9 Mio. m³. In Figure 4 (right panel) the ef-fects of the dam on high water level (A) and maximum current velocity (B) are displayed at 4 stations along a transect of the Elbe Estuary from the mouth to Hamburg.
The time series show higher differences between the sandbank scenario and the reference situation in 2006 (smoothed by a 14 days moving average). Since in this scenario the effects on HWL are an order of magnitude greater than in the previous ones, the scale of Figure 4 (right panel, A) has been modified. There are large fluctuations in HWL at all stations and a decrease of HWL of 10 to 13cm. The most sig-nificant reduction in HWL is achieved in the receptor area Hamburg. For the maximum current velocities there is also a small decrease at all stations up-estuary of the dam, while at station LZ3 an increase of some 3 to 4cm/s (e.g. 3%) is observed.
Figure 4. Effects of scenario 4 “All sandbanks” (left panel) and of scenario 5 “Dam” (right panel) on tidal high water level (A)
und maximum tidal current velocity (B) at stations LZ3, LZ1, D3, and Hamburg-Teufelsbrück. Curves represent dif-ferences between the sandbank scenario and the reference situation in 2006.
4.6 Scenario 6: Medemrinne with UWA The scenario “Medemrinne with UWA” (scenario 6) includes the sandbanks of the scenario “Medemsand and Neufelder Sand” (scenario 1) and an underwater deposition area, called UWA in the Medemrinne. The UWA is a planned structure of the next channel adaption, in which some of the dredged material will be permanently deposited. Since the effect of the islands in the scenarios 1 to 4 on HWL in Hamburg (<3cm) resulted in a very limited improvement of flood protection, this scenario was also chosen to inves-tigate the possible better performance of submerged sandbanks. The surface of the UWA has at a water depth between NN-3.6m and NN-5.1m and its volume is approx. 12 Mio. m³. Together with the 2 sand-banks this results in some 15.8 Mio. m³ artificial sandbank volume. In Figure 5 (left panel) the effects of
Scenario 4 “All sandbanks” Scenario 5 “Dam”
466
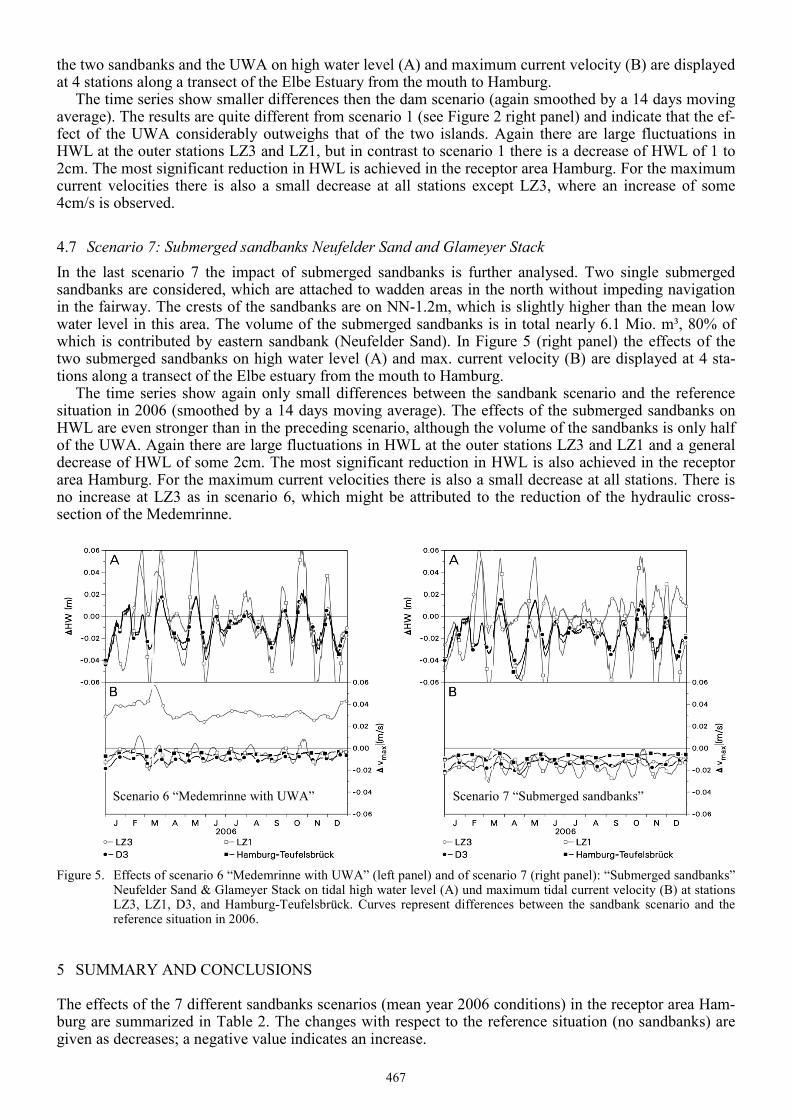
the two sandbanks and the UWA on high water level (A) and maximum current velocity (B) are displayed at 4 stations along a transect of the Elbe Estuary from the mouth to Hamburg.
The time series show smaller differences then the dam scenario (again smoothed by a 14 days moving average). The results are quite different from scenario 1 (see Figure 2 right panel) and indicate that the ef-fect of the UWA considerably outweighs that of the two islands. Again there are large fluctuations in HWL at the outer stations LZ3 and LZ1, but in contrast to scenario 1 there is a decrease of HWL of 1 to 2cm. The most significant reduction in HWL is achieved in the receptor area Hamburg. For the maximum current velocities there is also a small decrease at all stations except LZ3, where an increase of some 4cm/s is observed.
4.7 Scenario 7: Submerged sandbanks Neufelder Sand and Glameyer Stack In the last scenario 7 the impact of submerged sandbanks is further analysed. Two single submerged sandbanks are considered, which are attached to wadden areas in the north without impeding navigation in the fairway. The crests of the sandbanks are on NN-1.2m, which is slightly higher than the mean low water level in this area. The volume of the submerged sandbanks is in total nearly 6.1 Mio. m³, 80% of which is contributed by eastern sandbank (Neufelder Sand). In Figure 5 (right panel) the effects of the two submerged sandbanks on high water level (A) and max. current velocity (B) are displayed at 4 sta-tions along a transect of the Elbe estuary from the mouth to Hamburg.
The time series show again only small differences between the sandbank scenario and the reference situation in 2006 (smoothed by a 14 days moving average). The effects of the submerged sandbanks on HWL are even stronger than in the preceding scenario, although the volume of the sandbanks is only half of the UWA. Again there are large fluctuations in HWL at the outer stations LZ3 and LZ1 and a general decrease of HWL of some 2cm. The most significant reduction in HWL is also achieved in the receptor area Hamburg. For the maximum current velocities there is also a small decrease at all stations. There is no increase at LZ3 as in scenario 6, which might be attributed to the reduction of the hydraulic cross-section of the Medemrinne.
Figure 5. Effects of scenario 6 “Medemrinne with UWA” (left panel) and of scenario 7 (right panel): “Submerged sandbanks”
Neufelder Sand & Glameyer Stack on tidal high water level (A) und maximum tidal current velocity (B) at stations LZ3, LZ1, D3, and Hamburg-Teufelsbrück. Curves represent differences between the sandbank scenario and the reference situation in 2006.
5 SUMMARY AND CONCLUSIONS
The effects of the 7 different sandbanks scenarios (mean year 2006 conditions) in the receptor area Ham-burg are summarized in Table 2. The changes with respect to the reference situation (no sandbanks) are given as decreases; a negative value indicates an increase.
Scenario 6 “Medemrinne with UWA” Scenario 7 “Submerged sandbanks”
467
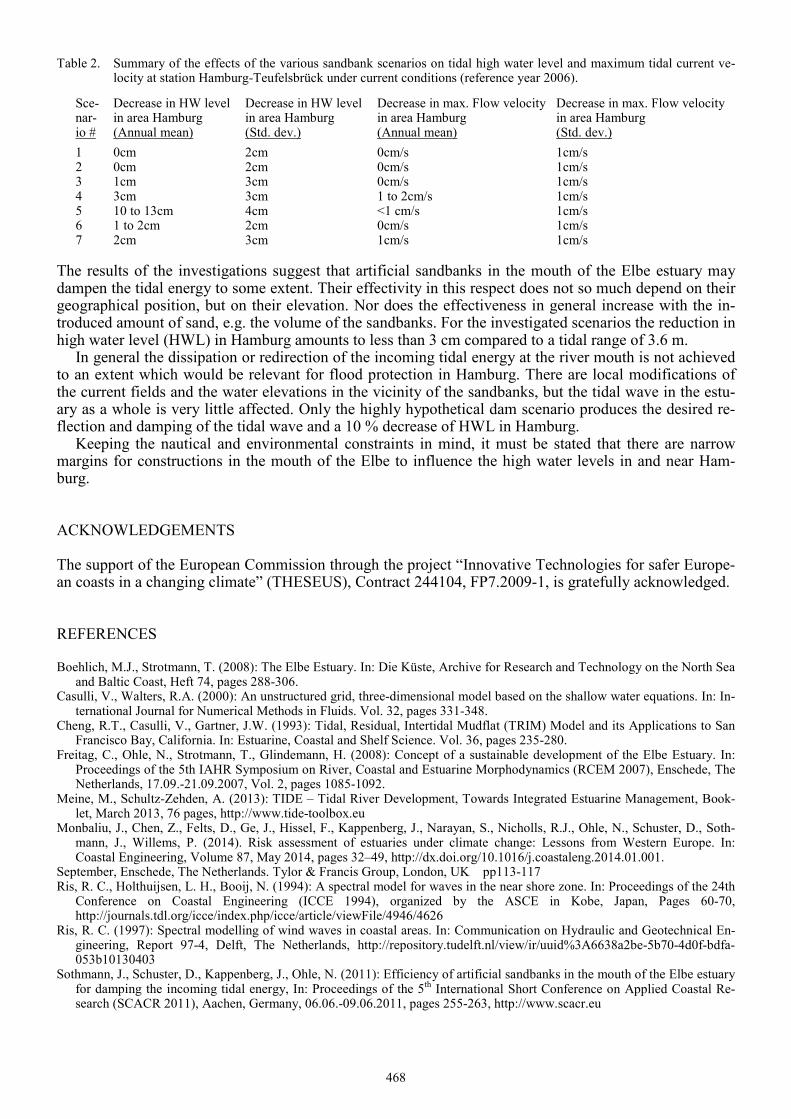
Table 2. Summary of the effects of the various sandbank scenarios on tidal high water level and maximum tidal current ve-locity at station Hamburg-Teufelsbrück under current conditions (reference year 2006).
Sce- Decrease in HW level Decrease in HW level Decrease in max. Flow velocity Decrease in max. Flow velocity nar- in area Hamburg in area Hamburg in area Hamburg in area Hamburg io # (Annual mean) (Std. dev.) (Annual mean) (Std. dev.) 1 0cm 2cm 0cm/s 1cm/s 2 0cm 2cm 0cm/s 1cm/s 3 1cm 3cm 0cm/s 1cm/s 4 3cm 3cm 1 to 2cm/s 1cm/s 5 10 to 13cm 4cm <1 cm/s 1cm/s 6 1 to 2cm 2cm 0cm/s 1cm/s 7 2cm 3cm 1cm/s 1cm/s The results of the investigations suggest that artificial sandbanks in the mouth of the Elbe estuary may dampen the tidal energy to some extent. Their effectivity in this respect does not so much depend on their geographical position, but on their elevation. Nor does the effectiveness in general increase with the in-troduced amount of sand, e.g. the volume of the sandbanks. For the investigated scenarios the reduction in high water level (HWL) in Hamburg amounts to less than 3 cm compared to a tidal range of 3.6 m.
In general the dissipation or redirection of the incoming tidal energy at the river mouth is not achieved to an extent which would be relevant for flood protection in Hamburg. There are local modifications of the current fields and the water elevations in the vicinity of the sandbanks, but the tidal wave in the estu-ary as a whole is very little affected. Only the highly hypothetical dam scenario produces the desired re-flection and damping of the tidal wave and a 10 % decrease of HWL in Hamburg.
Keeping the nautical and environmental constraints in mind, it must be stated that there are narrow margins for constructions in the mouth of the Elbe to influence the high water levels in and near Ham-burg.
ACKNOWLEDGEMENTS
The support of the European Commission through the project “Innovative Technologies for safer Europe-an coasts in a changing climate” (THESEUS), Contract 244104, FP7.2009-1, is gratefully acknowledged.
REFERENCES
Boehlich, M.J., Strotmann, T. (2008): The Elbe Estuary. In: Die Küste, Archive for Research and Technology on the North Sea and Baltic Coast, Heft 74, pages 288-306.
Casulli, V., Walters, R.A. (2000): An unstructured grid, three-dimensional model based on the shallow water equations. In: In-ternational Journal for Numerical Methods in Fluids. Vol. 32, pages 331-348.
Cheng, R.T., Casulli, V., Gartner, J.W. (1993): Tidal, Residual, Intertidal Mudflat (TRIM) Model and its Applications to San Francisco Bay, California. In: Estuarine, Coastal and Shelf Science. Vol. 36, pages 235-280.
Freitag, C., Ohle, N., Strotmann, T., Glindemann, H. (2008): Concept of a sustainable development of the Elbe Estuary. In: Proceedings of the 5th IAHR Symposium on River, Coastal and Estuarine Morphodynamics (RCEM 2007), Enschede, The Netherlands, 17.09.-21.09.2007, Vol. 2, pages 1085-1092.
Meine, M., Schultz-Zehden, A. (2013): TIDE – Tidal River Development, Towards Integrated Estuarine Management, Book-let, March 2013, 76 pages, http://www.tide-toolbox.eu
Monbaliu, J., Chen, Z., Felts, D., Ge, J., Hissel, F., Kappenberg, J., Narayan, S., Nicholls, R.J., Ohle, N., Schuster, D., Soth-mann, J., Willems, P. (2014). Risk assessment of estuaries under climate change: Lessons from Western Europe. In: Coastal Engineering, Volume 87, May 2014, pages 32–49, http://dx.doi.org/10.1016/j.coastaleng.2014.01.001.
September, Enschede, The Netherlands. Tylor & Francis Group, London, UK pp113-117 Ris, R. C., Holthuijsen, L. H., Booij, N. (1994): A spectral model for waves in the near shore zone. In: Proceedings of the 24th
Conference on Coastal Engineering (ICCE 1994), organized by the ASCE in Kobe, Japan, Pages 60-70, http://journals.tdl.org/icce/index.php/icce/article/viewFile/4946/4626
Ris, R. C. (1997): Spectral modelling of wind waves in coastal areas. In: Communication on Hydraulic and Geotechnical En-gineering, Report 97-4, Delft, The Netherlands, http://repository.tudelft.nl/view/ir/uuid%3A6638a2be-5b70-4d0f-bdfa-053b10130403
Sothmann, J., Schuster, D., Kappenberg, J., Ohle, N. (2011): Efficiency of artificial sandbanks in the mouth of the Elbe estuary for damping the incoming tidal energy, In: Proceedings of the 5th International Short Conference on Applied Coastal Re-search (SCACR 2011), Aachen, Germany, 06.06.-09.06.2011, pages 255-263, http://www.scacr.eu
468