hypothesis testing introduction what is a hypothesis test a hypothesis test is a statistical test...
TRANSCRIPT

Hypothesis TestingIntroduction
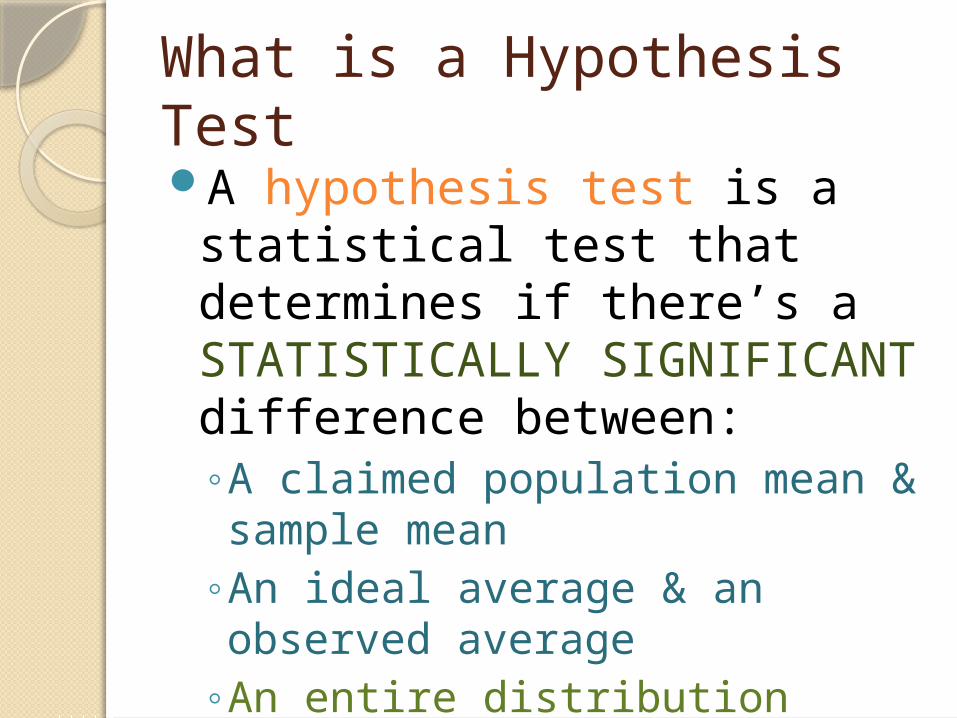
What is a Hypothesis Test A hypothesis test is a statistical test that determines if there’s a STATISTICALLY SIGNIFICANT difference between:◦A claimed population mean & sample mean
◦An ideal average & an observed average
◦An entire distribution◦Or a significant relationship between 2 variables.

So What’s Statistically Significant?
Say the average tiger shark is supposed to weigh 1250 lbs. When weigh a random sample of tiger sharks, their average isn’t likely to be 1250 lbs. A hypothesis test will help you decide if you’re sample is too wacky for the average of 1250 to be correct.
Statistically Significant means the
SAMPLE data you obtained is SOO
ABNORMAL it couldn’t have
just happened by random chance.
Think about it…
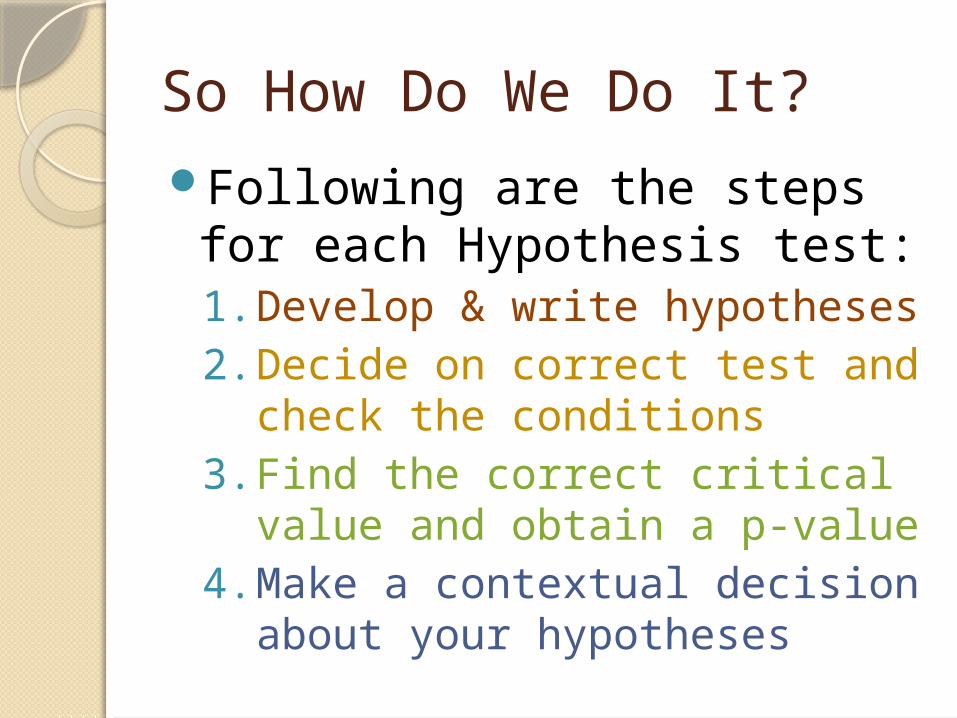
So How Do We Do It?Following are the steps for each Hypothesis test:1. Develop & write hypotheses2. Decide on correct test and
check the conditions3. Find the correct critical value
and obtain a p-value4. Make a contextual decision
about your hypotheses
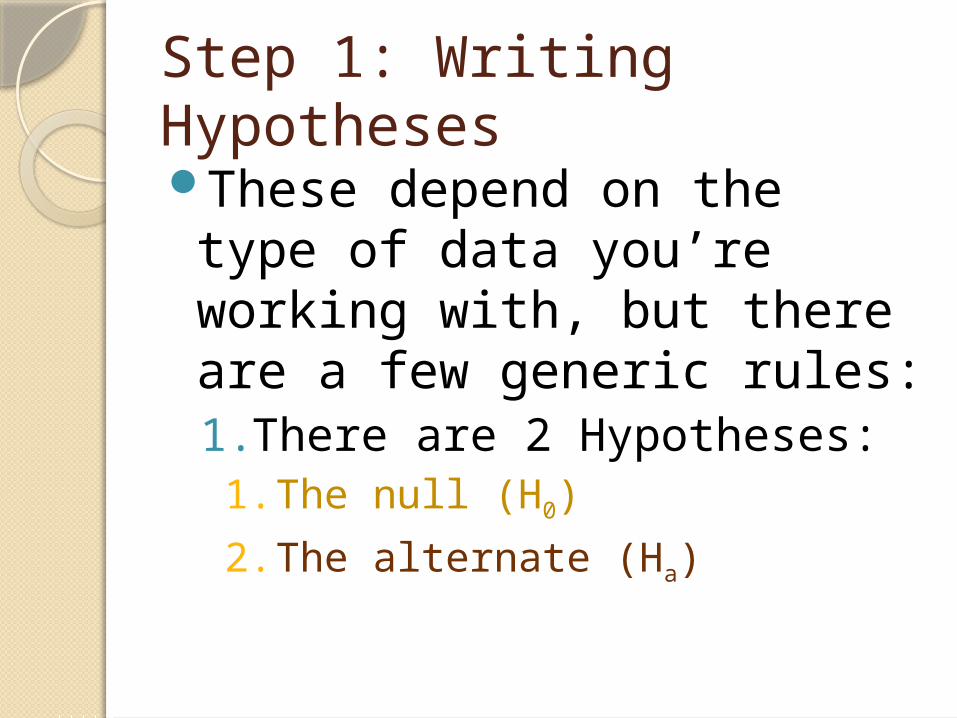
Step 1: Writing HypothesesThese depend on the type of data you’re working with, but there are a few generic rules:1. There are 2 Hypotheses:1. The null (H0)
2. The alternate (Ha)
Quick Glance at the Hypotheses
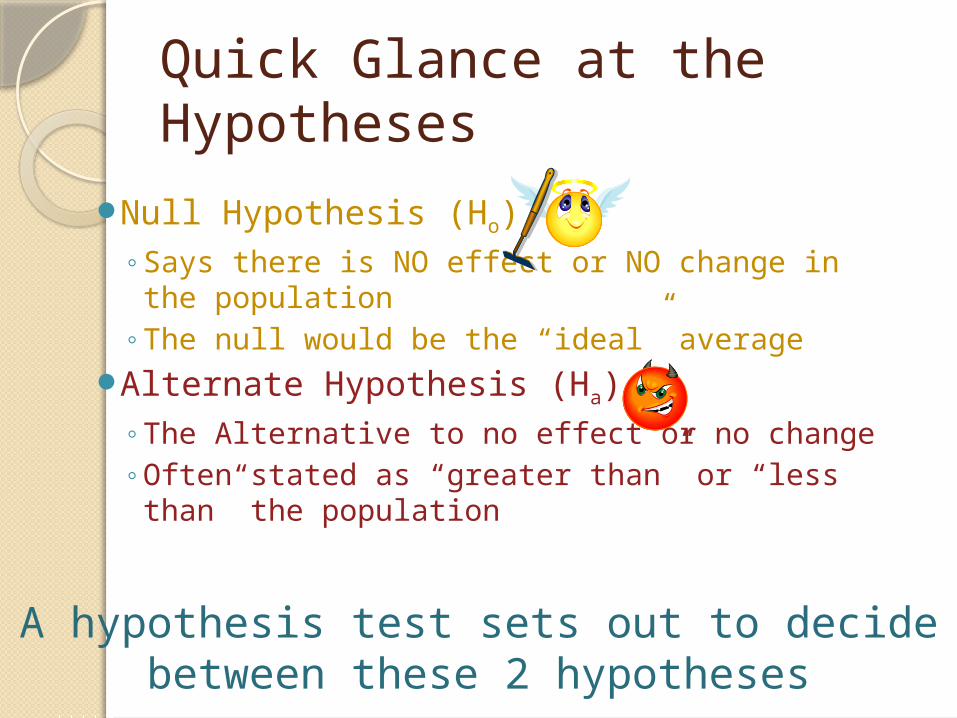
Null Hypothesis (Ho)◦Says there is NO effect or NO change in
the population◦The null would be the “ideal” average
Alternate Hypothesis (Ha)◦The Alternative to no effect or no change◦Often stated as “greater than” or “less
than” the population
A hypothesis test sets out to decide between these 2 hypotheses

Stating Hypotheses
The Null Hypothesis (Ho)◦The statement being tested in a test of
significance◦Statement of “no effect” or “no difference” We are testing the strength of the evidence
AGAINST the Ho
Billy Blanks claims anyone that uses his program will lose 10 lbs in 3 weeks, with a standard deviation of 2.35lbs. As the founder of BaeToe, you are out to
prove that Billy’s customers lose less poundage than his claim. If you can prove that, you feel like more
people will buy your DVD’s!!Ho: = 10 lbs.(The pop mean lbs lost to a BB DVD is 10 lbs.)

Stating Hypotheses
The Alternative Hypothesis (Ha)◦The part of the claim you are investigating◦Statement varies depending on problem Either 1-sided (≥,≤,<,>) or 2-sided (≠) The way you are trying to disprove the H0
Billy Blanks claims anyone that uses his program will lose 10 lbs in 3 weeks, with a standard
deviation of 2.35lbs. As the founder of BaeToe, you are out to prove that Billy’s customers lose less poundage than his claim. If you can prove
that, you feel like more people will buy your DVD’s!!
Ha: < 2.35 lbs (The pop mean of pounds lost to Billy Blanks’ DVDs is
less than 10 lbs.)
Flow Rate
The Association for Fish Growers Anonymous claims the ideal flow rate in a large tank for growing fish is 22.5 Liters/min. To test his tank’s effectiveness, Frankie takes an SRS of 50 flow rates from the last two days. He calculates an average flow rate of 19.2 Liters/min with a standard deviation of 1.3 L/m. Is Frankie’s flow rate significantly less than the ideal rate?
Ho: Jake’s average flow rate is the ideal flow rate of 22.5 L/m. μ = 22.5Ha: Jake’s average flow rate is significantly less than the ideal flow rate of 22.5 L/m. μ < 22.5
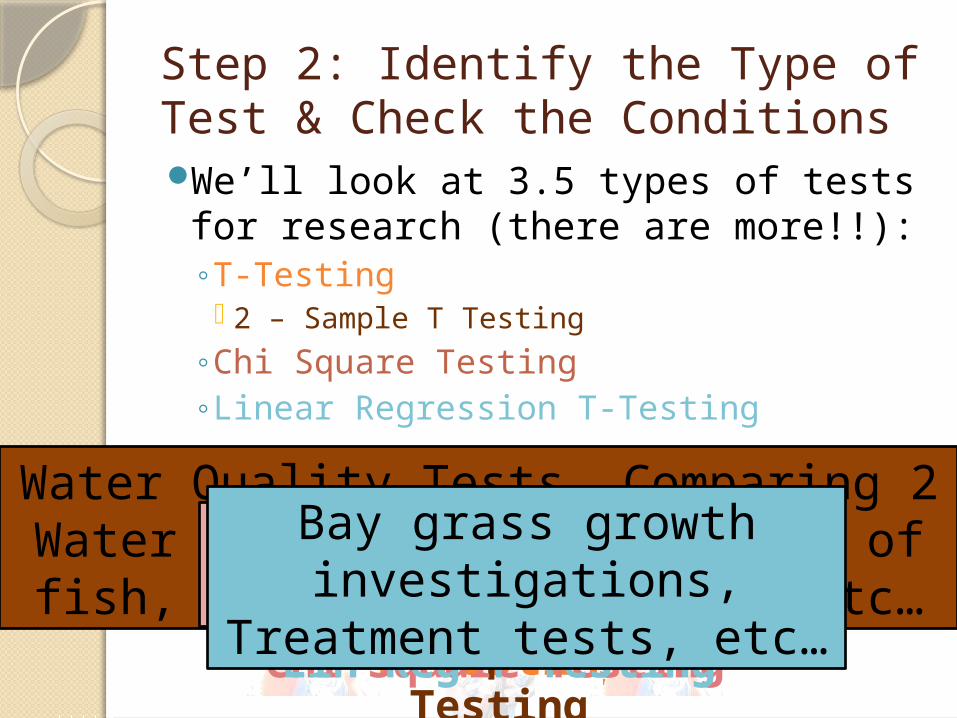
Step 2: Identify the Type of Test & Check the ConditionsWe’ll look at 3.5 types of tests
for research (there are more!!):◦T-Testing 2 – Sample T Testing
◦Chi Square Testing◦Linear Regression T-Testing
Flow Rates, Fish Masses, Other Avgs…
T-Testing2-Sample T-Testing
Water Quality Tests, Comparing 2 Water Tanks, Comparing types of fish,
treatments, seasons, etc…Chi Square Testing
Genetics, Punnett Squares
Lin Reg T-Testing
Bay grass growth investigations, Treatment
tests, etc…
Step 3: Finding the Critical # and the p-valueThe critical # leads to the decision value and varies depending on the type of test.
The critical values are:◦T for t-tests◦Χ2 for Chi Square Tests◦T for Linear Regression tests
P-ValueThis value is the basis for our conclusions
about the Null Hypothesis (found on charts)This value is the probability to the right of
the observed x-bar value for > and left for <
The p-value is the probability of getting our result (sample) if the
hypothesized mean is true.The smaller the p-value, the stronger
the evidence AGAINST the Ho.
Why?
The less likely your sample is to
occur given Ho

2 Types of Tests
One Sided◦Examination (stated in problem) is
looking for greater than, less than, or some specific side of the Ho (<,>)
Two Sided◦Examination (stated in problem) is
vague; just looking at not equal to the mean, but not mentioning a specific side of the Ho (≠)
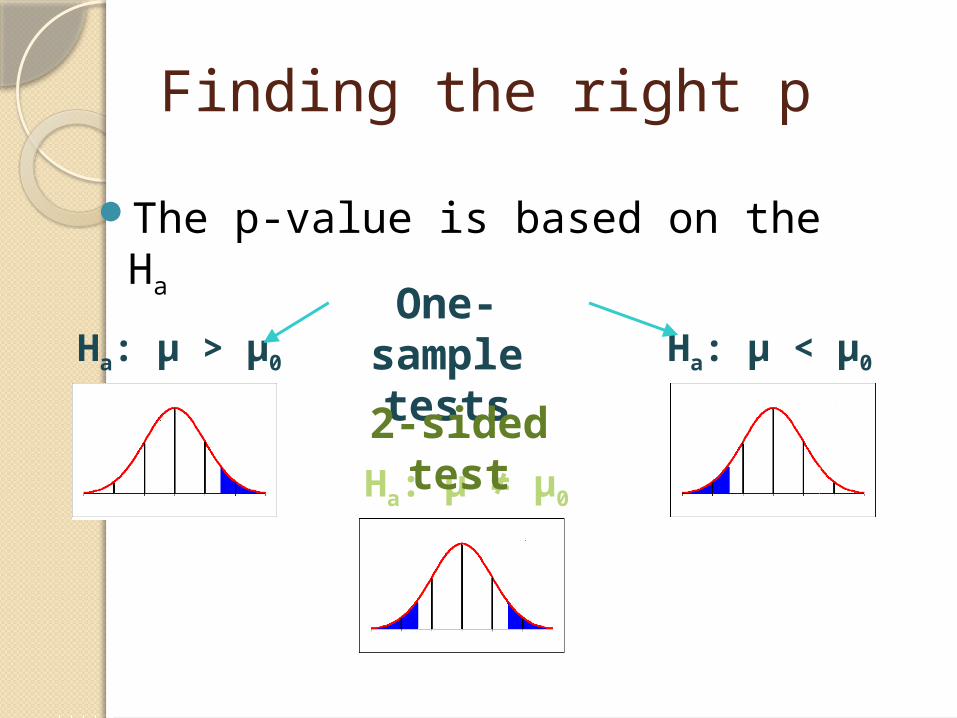
Finding the right p
The p-value is based on the Ha
Ha: µ > µ0 Ha: µ < µ0
Ha: µ ≠ µ0
One-sample tests2-sided test
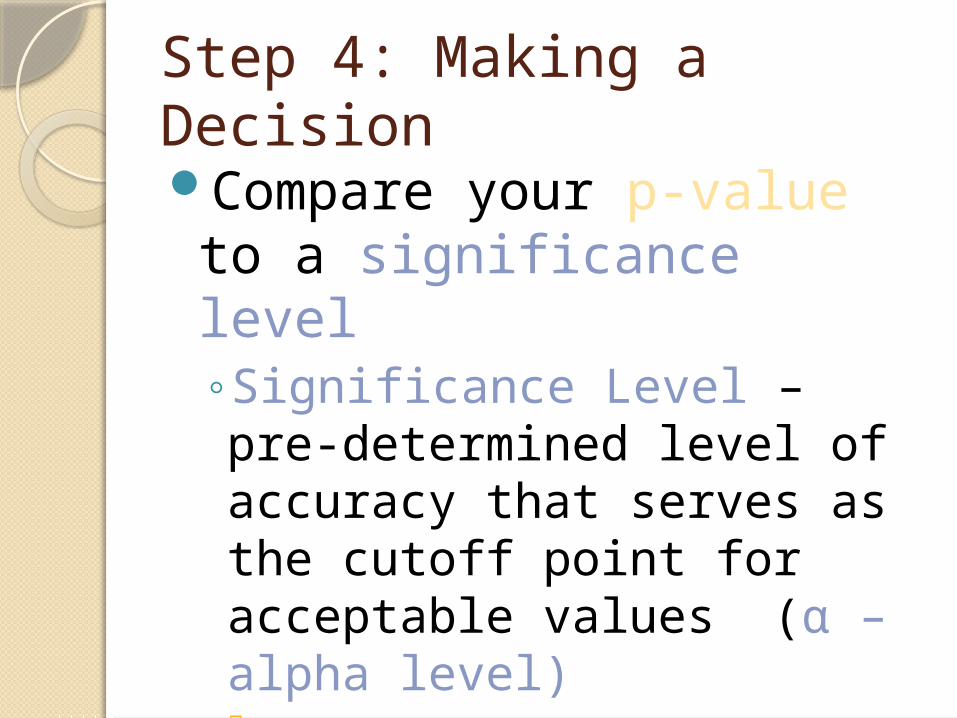
Step 4: Making a Decision
Compare your p-value to a significance level◦Significance Level – pre-determined level of accuracy that serves as the cutoff point for acceptable values (α – alpha level) Typically α = .05, but another value
may be given/used
More About P
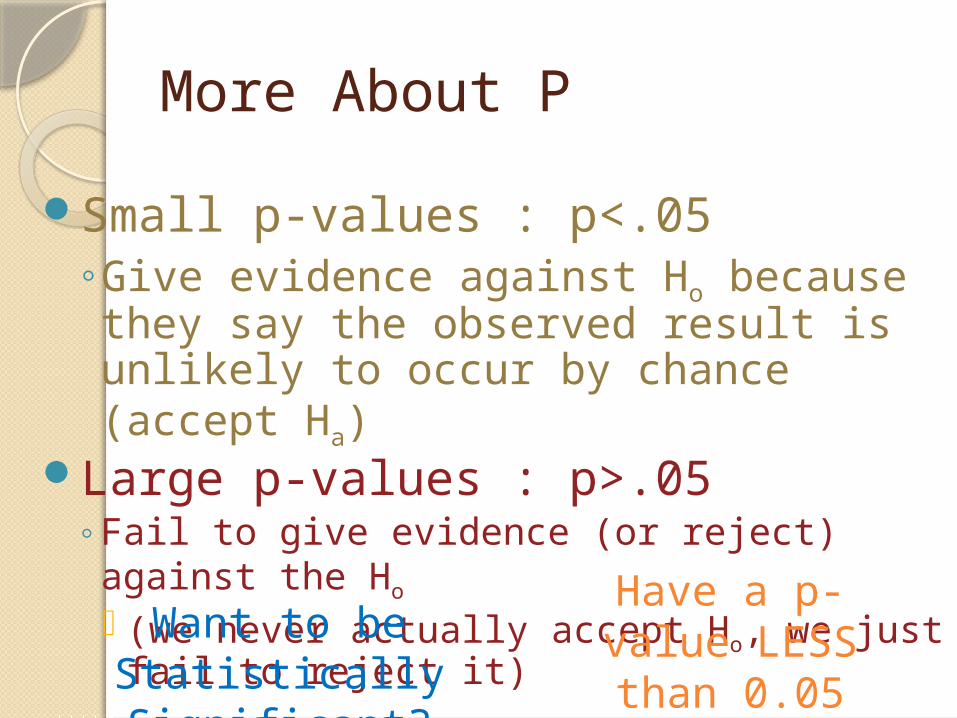
Small p-values : p<.05◦Give evidence against Ho because they say the observed result is unlikely to occur by chance (accept Ha)
Large p-values : p>.05◦Fail to give evidence (or reject) against the
Ho
(we never actually accept Ho, we just fail to reject it)Want to be
Statistically Significant?
Have a p-value LESS than 0.05
Significance Level & Decisions
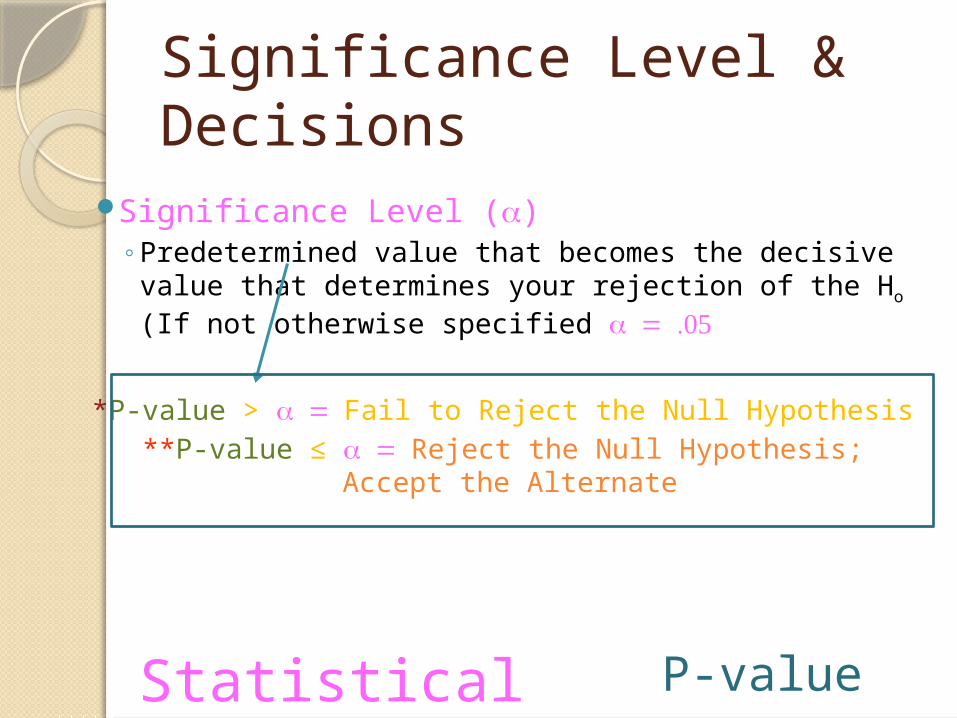
Significance Level (a)◦Predetermined value that becomes the decisive
value that determines your rejection of the Ho (If not otherwise specified = .05a
*P-value > = a Fail to Reject the Null Hypothesis**P-value ≤ = a Reject the Null Hypothesis; Accept
the Alternate
Statistical SignificanceP-value ≤ a

What’s a Test Look Like?
Duracell claims the average lifespan of their Ultra Coppertop C Batteries is 22.3 hours with a standard deviation of 23 minutes. You take a SRS of 200 batteries and find the mean to be 22.22 hours. At a 5% significance level, is there enough evidence to show the average is less than Duracell’s claim? Ho: µ =
22.3hrsHa: µ ≤ 22.3hrs
200
3833.3.2222.22
z
p = .0016 What
does this mean?
z = -2.95
There’s only a .16% chance that our sample would happen if their population
mean is correct. Since p is less than alpha, we reject the Null Hypothesis and
accept that the average battery lasts less than 22.3 hours.

P-Decision Chart
P-value vs. α-level
Decision
p < α Reject Ho : Accept Ha
p > α Fail to Reject Ho
Since we never know the TRUE ideal value or population value we NEVER accept the
Ha. We only say we don’t have statistically significant evidence to reject it.
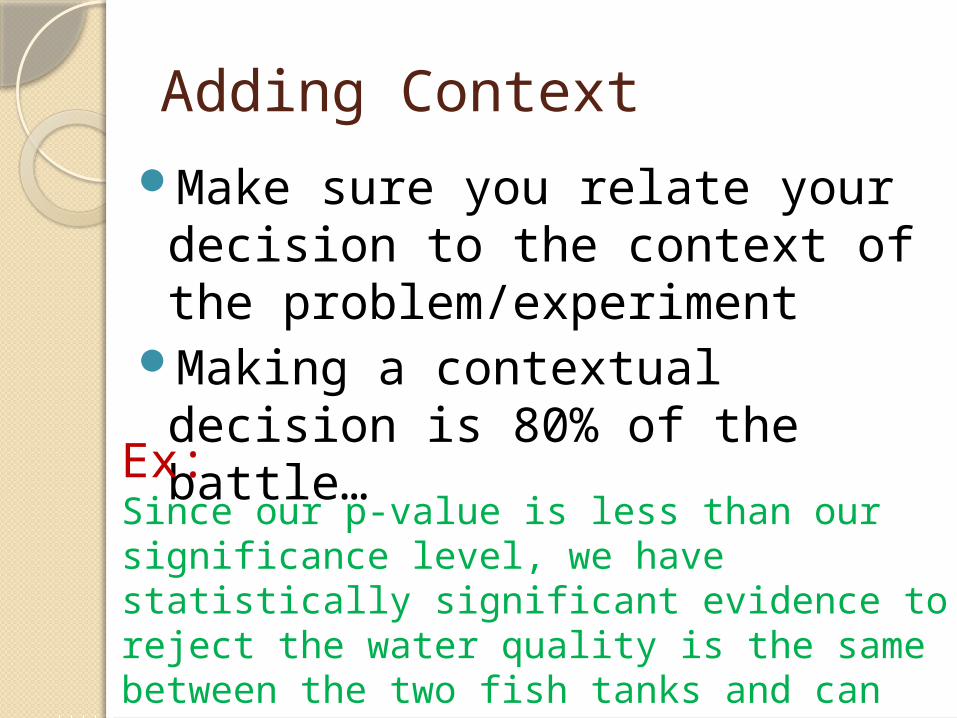
Adding ContextMake sure you relate your decision to the context of the problem/experiment
Making a contextual decision is 80% of the battle…
Ex: Since our p-value is less than our significance level, we have statistically significant evidence to reject the water quality is the same between the two fish tanks and can accept that the treatment tank has a higher water quality.

Hypothesis Test Steps Review
1. Develop & write hypotheses
2. Decide on correct test and check the conditions
3. Find the correct critical value and obtain a p-value
4. Make a contextual decision about your hypotheses