hydspin dec14 visual story telling
TRANSCRIPT

MAKING SENSE OF BIG DATA: VISUAL STORY TELLING
B GANES KESARI,
VP, GRAMENER

We handle terabyte-size data via non-traditional analytics and visualise it in real-time.
Gramener visualises
your data
Gramener transforms your data into concise dashboardsthat make your business problem & solution visually obvious.We help you find insights quickly, based on cognitive research,and our visualisations guide you towards actionable decisions.
A data visualisation and analytics company

Transaction data
Increasing volumes of data being churned out by systems
20
00
20
01
20
02
20
03
20
04
20
05
20
06
20
07
20
08
20
09
20
10
20
11
20
00
20
01
20
02
20
03
20
04
20
05
20
06
20
07
20
08
20
09
20
10
20
11
Social network data
Consumers embracing Web 2.0 & social media lifestyle
20
00
20
01
20
02
20
03
20
04
20
05
20
06
20
07
20
08
20
09
20
10
20
11
M2M data
Devices generating & logging data from every activity
Big data…
McKinsey Global Institute, Big Data, June 2011
Generation Analysis Consumption
creates opportunities
Volume of data
The larger the volume of data, the more likely it is that a firm will benefit from increasing use of data.
Variability
Greater fluctuations in performance offer more potential for a data-driven organisation to improve results.
Customer intensity
More customers (or stakeholders of any kind) offer greater potential for segmentation and tailored action.
Transaction intensity
This permits greater automation of decision making, allowing processing power to replace human judgement.
Turbulence
Frequency at which leaders and laggards change place in a sector indicates potential for disruption.
Each industry is poised to take advantage of big data to varying degrees. Some factors that increase the relevance of big data to an industry are:
… but at a high cost
Technology
Collection, storage, analysis and visualisation of data – all require investments in modern technology.
Talent
The deeper the analysis & data expertise a firm has, the better it can leverage data. But such talent is rare.
Organisational change
A shift in mind-set from experience-driven decision making to data driven decision making is required.
Data access
Collecting relevant data, storing it, and making it available to analysts in an easy manner requires investment.
Supplier ecosystem
A mature vendor ecosystem providing end-to-end or piece-wise solutions to these is not yet a reality.
Investments of various kinds are required to make the data actionable. It is not enough that the data just exists, or is collected. Some challenges are:

A DATA VISUALISATION
CHALLENGE…
You will see 3 questions.You have 30 seconds.
Try it!
Your timerstarts now
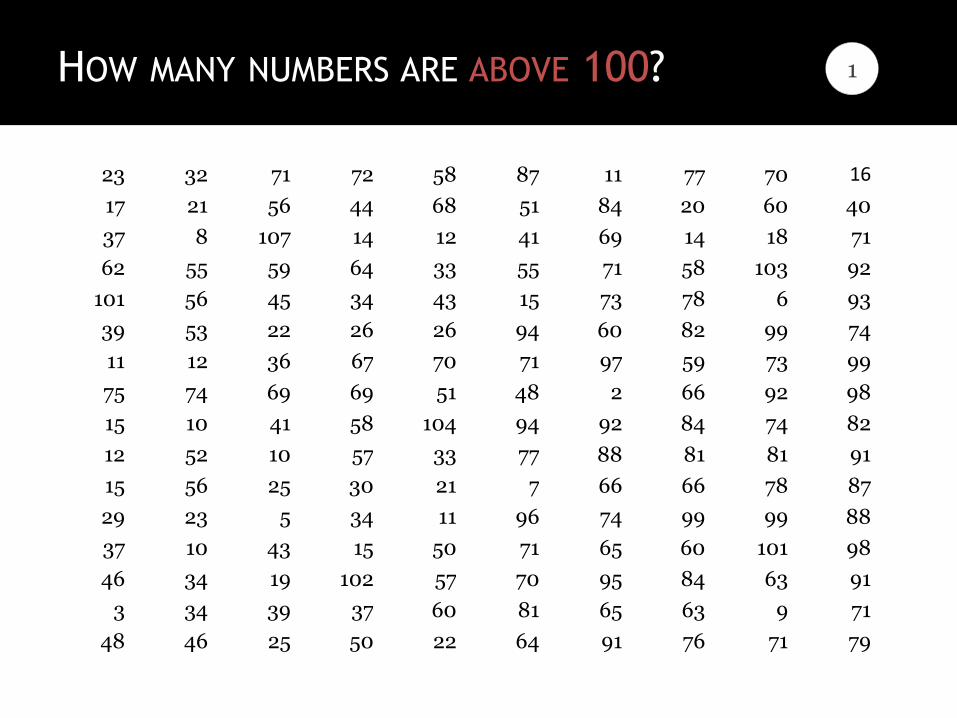
HOW MANY NUMBERS ARE ABOVE 100? 1
23 32 71 72 58 87 11 77 70 16
17 21 56 44 68 51 84 20 60 40
37 8 107 14 12 41 69 14 18 71
62 55 59 64 33 55 71 58 103 92
101 56 45 34 43 15 73 78 6 93
39 53 22 26 26 94 60 82 99 74
11 12 36 67 70 71 97 59 73 99
75 74 69 69 51 48 2 66 92 98
15 10 41 58 104 94 92 84 74 82
12 52 10 57 33 77 88 81 81 91
15 56 25 30 21 7 66 66 78 87
29 23 5 34 11 96 74 99 99 88
37 10 43 15 50 71 65 60 101 98
46 34 19 102 57 70 95 84 63 91
3 34 39 37 60 81 65 63 9 71
48 46 25 50 22 64 91 76 71 79

HOW MANY NUMBERS ARE BELOW 10? 2
23 32 71 72 58 87 11 77 70 16
17 21 56 44 68 51 84 20 60 40
37 8 107 14 12 41 69 14 18 71
62 55 59 64 33 55 71 58 103 92
101 56 45 34 43 15 73 78 6 93
39 53 22 26 26 94 60 82 99 74
11 12 36 67 70 71 97 59 73 99
75 74 69 69 51 48 2 66 92 98
15 10 41 58 104 94 92 84 74 82
12 52 10 57 33 77 88 81 81 91
15 56 25 30 21 7 66 66 78 87
29 23 5 34 11 96 74 99 99 88
37 10 43 15 50 71 65 60 101 98
46 34 19 102 57 70 95 84 63 91
3 34 39 37 60 81 65 63 9 71
48 46 25 50 22 64 91 76 71 79

WHICH QUADRANT HAS THE HIGHEST TOTAL?
23 32 71 72 58 87 11 77 70 16
17 21 56 44 68 51 84 20 60 40
37 8 107 14 12 41 69 14 18 71
62 55 59 64 33 55 71 58 103 92
101 56 45 34 43 15 73 78 6 93
39 53 22 26 26 94 60 82 99 74
11 12 36 67 70 71 97 59 73 99
75 74 69 69 51 48 2 66 92 98
15 10 41 58 104 94 92 84 74 82
12 52 10 57 33 77 88 81 81 91
15 56 25 30 21 7 66 66 78 87
29 23 5 34 11 96 74 99 99 88
37 10 43 15 50 71 65 60 101 98
46 34 19 102 57 70 95 84 63 91
3 34 39 37 60 81 65 63 9 71
48 46 25 50 22 64 91 76 71 79
3

A DATA VISUALISATION
CHALLENGE…
We’ll answer the same questions again.But with simple visual cues.
See how long it takes.
Your timerstarts now

23 32 71 72 58 87 11 77 70 16
17 21 56 44 68 51 84 20 60 40
37 8 107 14 12 41 69 14 18 71
62 55 59 64 33 55 71 58 103 92
101 56 45 34 43 15 73 78 6 93
39 53 22 26 26 94 60 82 99 74
11 12 36 67 70 71 97 59 73 99
75 74 69 69 51 48 2 66 92 98
15 10 41 58 104 94 92 84 74 82
12 52 10 57 33 77 88 81 81 91
15 56 25 30 21 7 66 66 78 87
29 23 5 34 11 96 74 99 99 88
37 10 43 15 50 71 65 60 101 98
46 34 19 102 57 70 95 84 63 91
3 34 39 37 60 81 65 63 9 71
48 46 25 50 22 64 91 76 71 79
HOW MANY NUMBERS ARE ABOVE 100? 1

HOW MANY NUMBERS ARE BELOW 10? 2
23 32 71 72 58 87 11 77 70 16
17 21 56 44 68 51 84 20 60 40
37 8 107 14 12 41 69 14 18 71
62 55 59 64 33 55 71 58 103 92
101 56 45 34 43 15 73 78 6 93
39 53 22 26 26 94 60 82 99 74
11 12 36 67 70 71 97 59 73 99
75 74 69 69 51 48 2 66 92 98
15 10 41 58 104 94 92 84 74 82
12 52 10 57 33 77 88 81 81 91
15 56 25 30 21 7 66 66 78 87
29 23 5 34 11 96 74 99 99 88
37 10 43 15 50 71 65 60 101 98
46 34 19 102 57 70 95 84 63 91
3 34 39 37 60 81 65 63 9 71
48 46 25 50 22 64 91 76 71 79

WHICH QUADRANT HAS THE HIGHEST TOTAL? 3
23 32 71 72 58 87 11 77 70 16
17 21 56 44 68 51 84 20 60 40
37 8 107 14 12 41 69 14 18 71
62 55 59 64 33 55 71 58 103 92
101 56 45 34 43 15 73 78 6 93
39 53 22 26 26 94 60 82 99 74
11 12 36 67 70 71 97 59 73 99
75 74 69 69 51 48 2 66 92 98
15 10 41 58 104 94 92 84 74 82
12 52 10 57 33 77 88 81 81 91
15 56 25 30 21 7 66 66 78 87
29 23 5 34 11 96 74 99 99 88
37 10 43 15 50 71 65 60 101 98
46 34 19 102 57 70 95 84 63 91
3 34 39 37 60 81 65 63 9 71
48 46 25 50 22 64 91 76 71 79
Humans are
pattern-seeking
story-telling
animals.

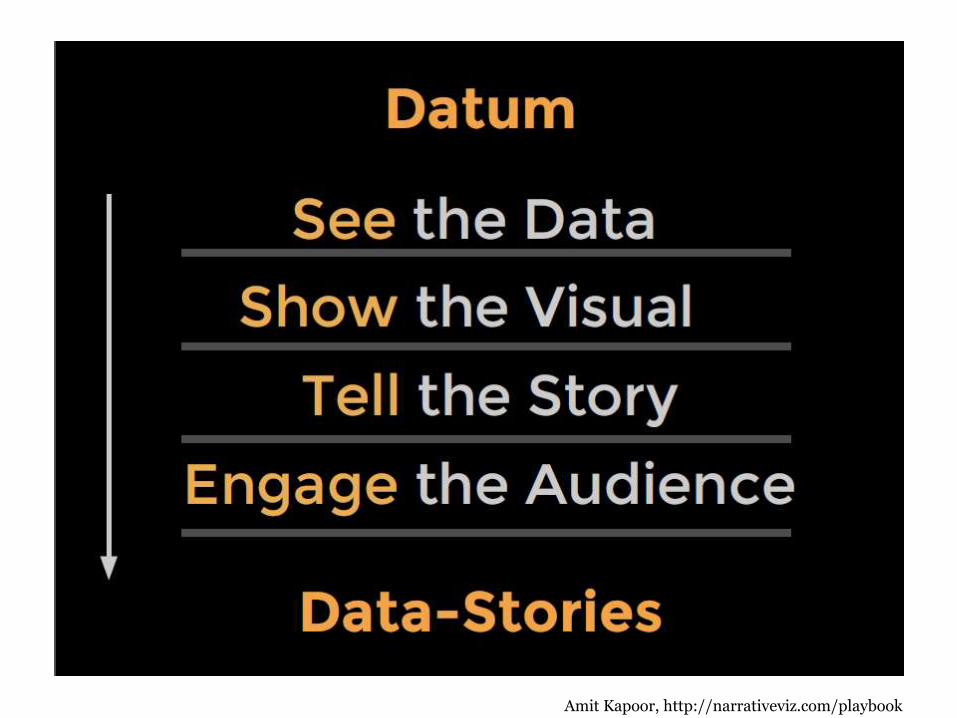
Amit Kapoor, http://narrativeviz.com/playbook
Amit Kapoor, http://narrativeviz.com/playbook

Amit Kapoor, http://narrativeviz.com/playbook

Can we understand the brief history of elections in India?
How have the political fortunes changed over time?
How did the biggest election of them all unfold in 2014?
VISUALIZING THEGENERAL ELECTIONS
EXPLORATORY | INTERACTIVE

~300 Parties fielding 8000 candidates
~800 Mn Registered Voters
~1 Mn booths served by 20 Mn people
~21,000 Votes/sec of live results
Varied data on several parameters
A Big Data problem… in every sense
India’s General Elections landscape…

https://gramener.com/election/parliament

LIVE ELECTION ANALYSIS
Our CNN-IBN Microsoft Election Analytics Canter, which you can see at www.bing.com/elections or election-results.ibnlive.in.com, served over 10 million requests on 16th May 2014 — the day of India election results.
This is one of the largest real-time visualisations that we (and perhaps many others) have attempted
http://ibn.gramener.com/live

<<Video recreating
how the Election results unfolded>>

Does any party hold a consistent 100% failure rate?
Which party holds record for being most persistent in adversity?
Which party’s candidates have lost deposits for nearly a decade?
INDIA’S MOST PERSISTENT PARTY
EXPLANATORY| STATIC

https://gramener.com/election/parliament#story.ddp

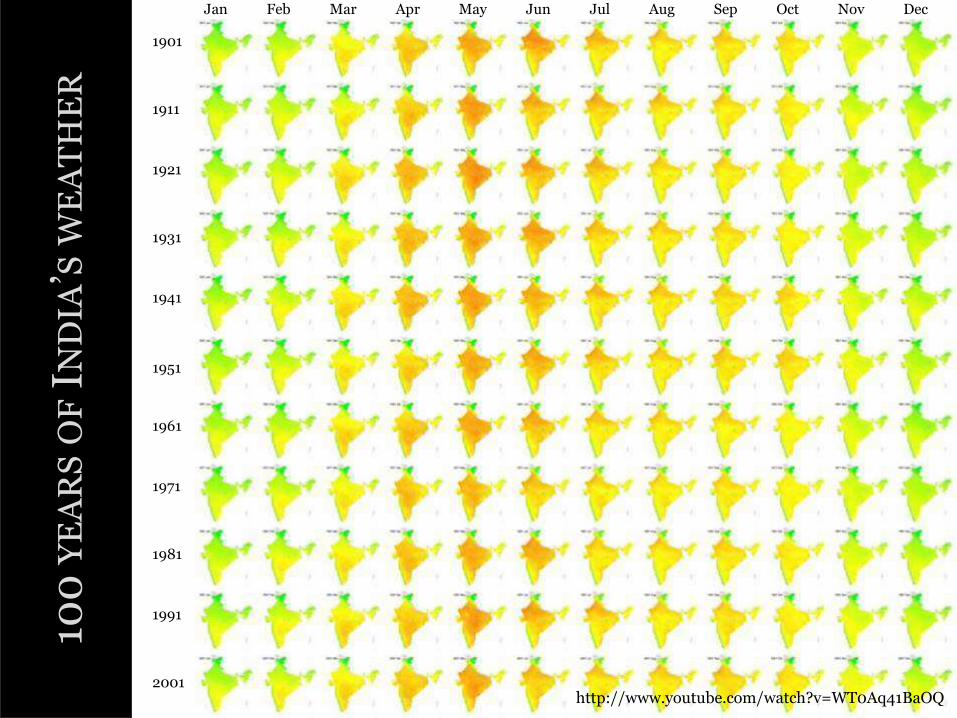
VISUALIZING WEATHER
How did weather change in India over the past century?
What were the hottest and coldest places?
Are there places that exhibit some interesting patterns?
EXPLANATORY| VIDEO
Image credit: https://www.flickr.com/photos/vesiaphotography/11627471004
100
YE
AR
SO
FIN
DIA
’SW
EA
TH
ER
1901
1911
1921
1931
1941
1951
1961
1971
1981
1991
2001
Jan Feb Mar Apr May Jun Jul Aug Sep Oct Nov Dec
http://www.youtube.com/watch?v=WT0Aq41BaOQ
STORIES FROM TEXT
Can business impacting stories be mined from large bodies of text?
Can investors better read companies by studying Investor earning calls?
Can companies understand what analysts want & be better prepared?
EXPLANATORY| INTERACTIVE
Image credit: ttps://www.flickr.com/photos/a_mason/3009985823

Web Scraping Tokenization Part-of-Speech tagging
TransformEntity detection
Text Analytics Engine
HOW IS THE TEXT PROCESSED?
Analytics Engine
Compute
Visualization Engine
Ticker Qtr #Qns
AAPL 53% 3
AAPL 51% 7
GS 52% 6
MSFT 53% 4
... ... ...
MS 54% 9
JP 53% 6
... ... ...
Data Extraction
Ticker Qtr %Gr
AAPL 53% 23%
AAPL 51% -35%
GS 52% 95%
MSFT 53% 101%
... ... ...
MS 54% 14%
JP 53% 20%
... ... ...

https://gramener.com/transcriptanalysis/

VISUALIZING MOVIES
What are the popular, critically acclaimed ones?
Where do my preferences figure?
Which one should I watch next?
EXPLORATORY| INTERACTIVE

The Shawshank
Redepmption
The Godfather
The Dark Knight
Titanic
The Phantom
Menace
Twilight
New Moon
Wild Wild West
Transformers
The Good, The
Bad, The Ugly
12 Angry
Men
7 Samurai
Taare Zameen
Par
Rang De
Basanti
Yojinbo
MORE VOTES
BETTER RATED
Many unwatched movies
Few unwatched movies
Mix of watched & unwatched
Few watched movies
Many watched movies
Movies on the IMDb
3 Idiots
https://gramener.com/imdb/
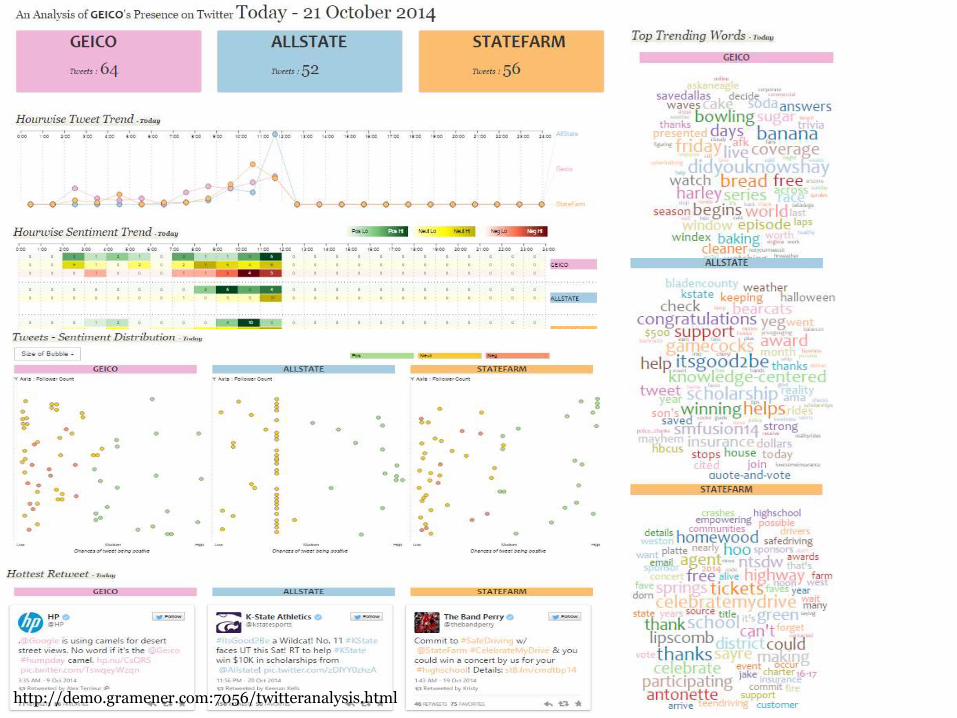
http://demo.gramener.com:7056/twitteranalysis.html

BEST PLACES TO LIVE
FINDING ‘BEST PLACES’ TO LIVE IN
Can we plug into public data to better understand cities?
Can we identify the best places to live?
Can this be customized to an individual level?
EXPLORATORY| INTERACTIVE
Image credit: https://www.flickr.com/photos/dynamosquito/2431025077
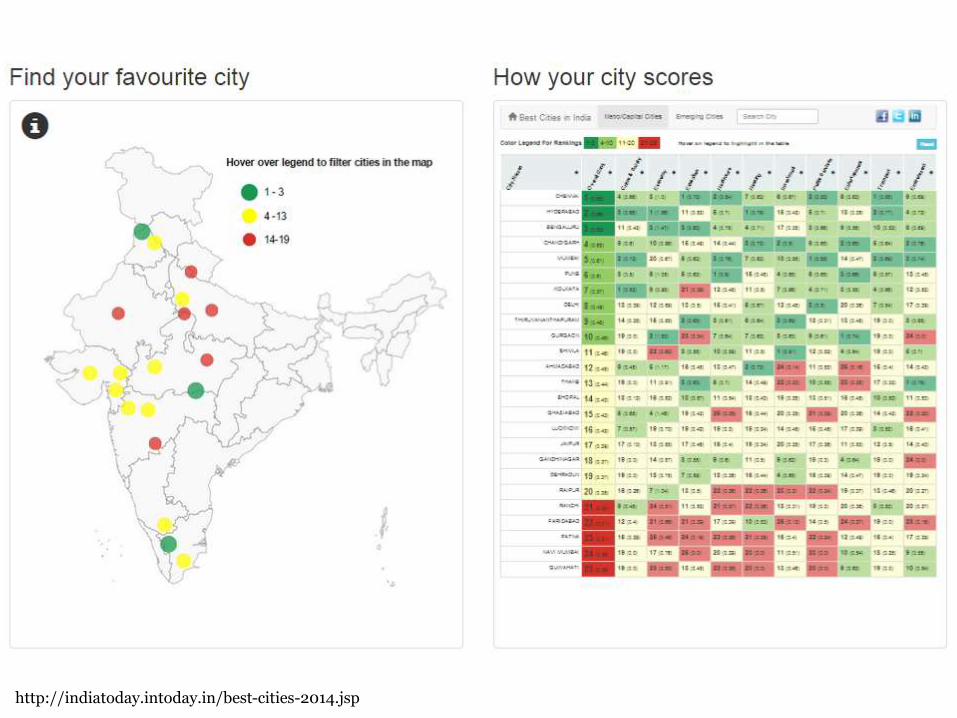
http://indiatoday.intoday.in/best-cities-2014.jsp
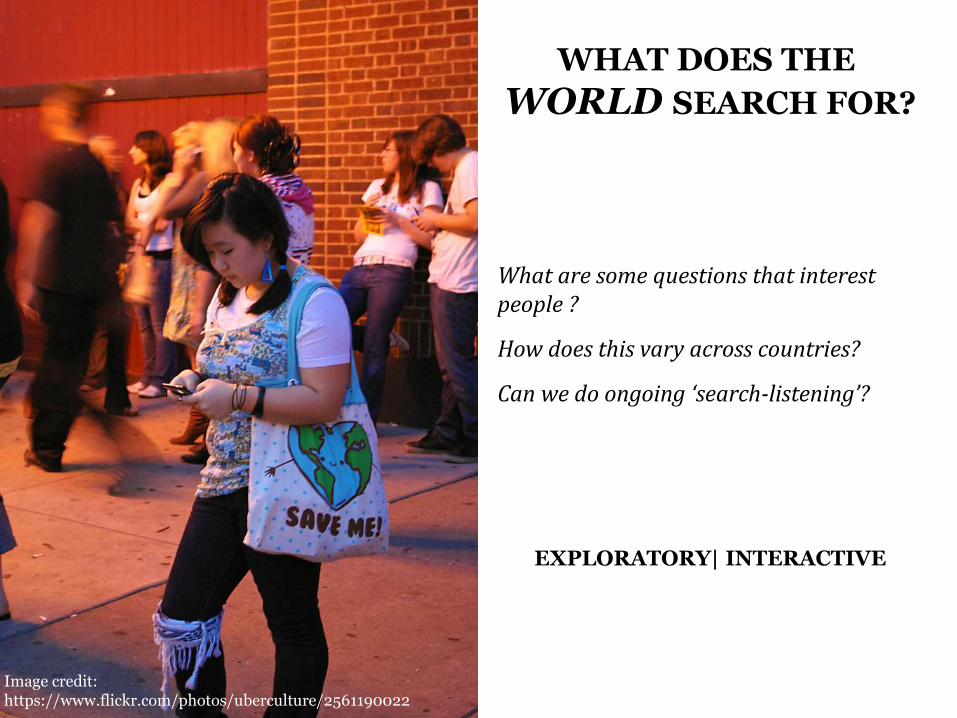
WHAT DOES THE
WORLD SEARCH FOR?
What are some questions that interest people ?
How does this vary across countries?
Can we do ongoing ‘search-listening’?
EXPLORATORY| INTERACTIVE
Image credit: https://www.flickr.com/photos/uberculture/2561190022


https://gramener.com/search/#questions/how-to-

Amit Kapoor, http://narrativeviz.com/playbook

gramener.com blog.gramener.com http://slideshare.net/gramener
Ganes KesariTwitter: @kesaritweetsEmail: [email protected]
Session Slides available on Slideshare at:http://www.slideshare.net/gramener/hydspin-dec14-visual-story-telling