hydraulic characteristics of, and ground-water flow in
TRANSCRIPT

Hydraulic Characteristics of, and Ground-Water Flow in, Coal-Bearing Rocks of Southwestern Virginia
United States Geological Survey Water-Supply Paper 2388
Prepared in cooperation with the Virginia Department of Mines, Minerals, and Energy, Division of Mined Land Reclamation, and the Powell River Project

�
that the potentiometric head for the test interval was lower than the pressure head exerted by the column of water in the open corehole . Equilibration at a transducer reading higher than the reading recorded prior to inflation indicated that the potentiometric head for the test interval was higher than the pressure head exerted by the column of water in the open corehole . The transducer reading prior to inflation was subtracted from the equilibrated reading after inflation, and this value was multiplied by the transducer calibration . The resulting value (with sign) was added to the altitude of the water level in the corehole to derive the potentiometric head of the test interval . Values for all the test intervals in a corehole provided a vertical profile of potentiometric heads that was referenced to the composite water level in the open corehole .
Potentiometric-head measurements were generally obtained for only permeable test intervals . In tight test intervals the transducer readings indicated the inflation surge and usually stayed high . Because of time constraints and the goal of acquiring data on as many test intervals as possible, the packers were deflated after a few minutes and moved to a new test interval . Thus, some permeable test intervals with high potentiometric heads may have been overlooked ; however, most of these test intervals probably were tight .
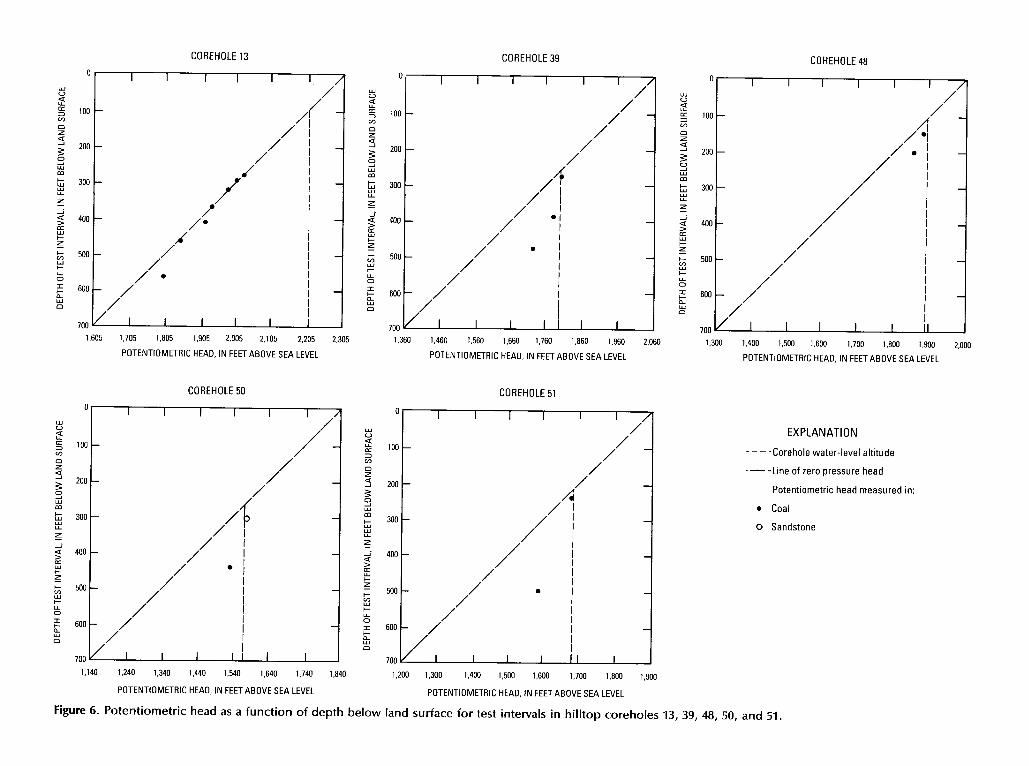
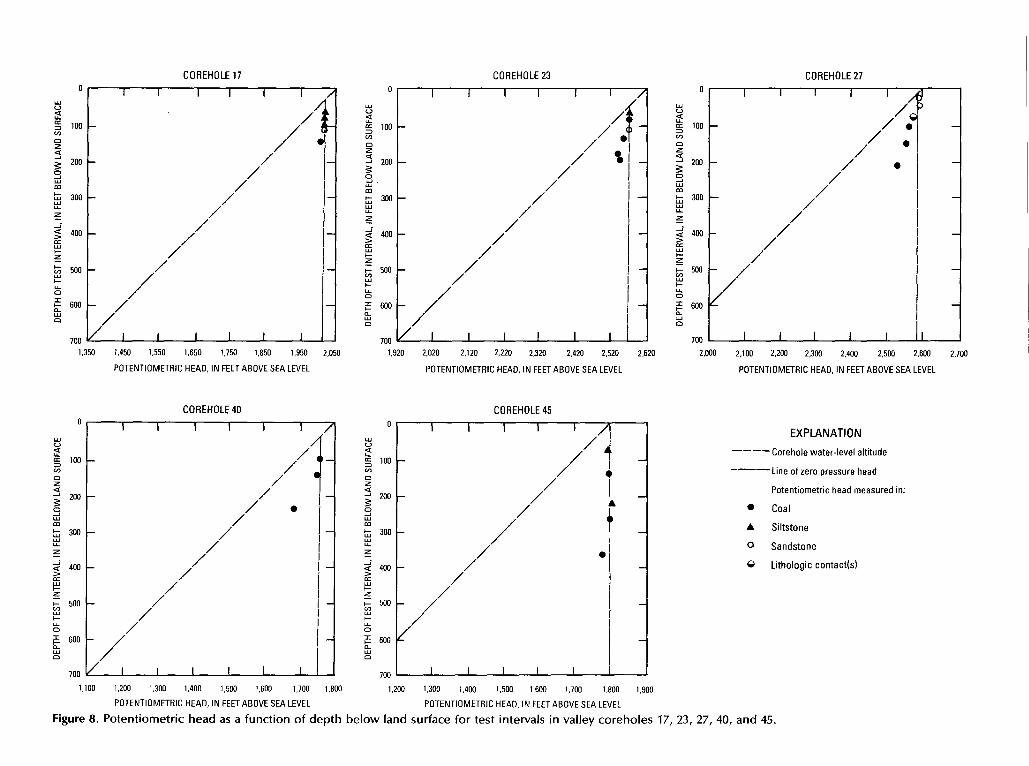
A total of 52 coal-exploration coreholes were visited during this investigation . Hydraulic testing was conducted in 43 coreholes, and potentiometric-head measurements were made in 34 . Representative plots of potentiometric head as a function of depth of the tested intervals for coreholes located on hilltops, on hillslopes, and in valleys are shown in figures 6, 7, and 8, respectively . The water level in each corehole is indicated along with the predominant lithology present in each interval tested in the core-hole . The diagonal line in each graph represents the line of zero pressure head . All points that plot to the right of this line represent artesian test intervals, and all points that plot on this line represent test intervals with heads that are equal to their altitude .
Corehole water levels do not necessarily correspond to water tables . In an open corehole, a water level is a composite water level that represents the combined effect of the heads in each water-bearing interval intersected by the corehole . In coreholes where the potentiometric gradients are downward, the water table should be higher than the corehole water level; thus, water will drain into the core-hole-cascading or dripping . In addition, if transmissivity is low, the water table could be nearly drained, and water leaking in could run down the corehole wall and not be audible . Cascading water was heard in coreholes 15 and 16, both of which were located on hillslopes .
The potentiometric heads of test intervals in hilltop coreholes generally were less than the corehole water levels (fig . 6) . The depth to water for the eight coreholes on hilltops ranged from 100 to 376 ft below land surface,
having a mean depth of 221 ft . In addition, two coreholes of 150- and 200-ft depth were dry . Potentiometric heads only were measured for a few test intervals in most hilltop coreholes because a large percentage of corehole depths were through unsaturated rock . The heads that were measured indicate a decrease in potentiometric head with increasing depth . A downward gradient also was indicated by the potentiometric-head data for coal seams in corehole 13 ; however, this hole was different from the other hilltop holes in that many of the test intervals indicate water-table conditions . The potentiometric heads of these coal seams coupled with the presence of lower transmissivity intervals between them indicate that some of the coal seams could be partially saturated, confined, or semiconfined and that water is probably perched in these coal seams. The steep hydraulic gradient probably indicates a partially unsaturated drain horizon at depth.
The potentiometric heads of test intervals in hillslope coreholes generally were less than the corehole water levels (fig . 7) . The depth to water for the 30 coreholes on hillslopes ranged from 1 to 447 ft below land surface, having a mean depth of 109 ft . The potentiometric gradient generally was downward . Exceptions to the downward gradient were observed in coreholes 10, 28, and 36 . Corehole 10 exhibited a split gradient-heads in a lithologic contact and a coal-seam test interval approximately 300 ft deep were higher than heads in adjacent test intervals . In addition, potentiometric head in a sandstone approximately 500 ft deep was 80-100 ft higher than heads in coal seams above and below it . Corehole 28 also exhibited a split gradient-head in a shale test interval approximately 200 ft deep was higher than that in the sandstone and coal-seam test intervals above and below it, respectively . Finally, in corehole 36, which intersected a coal seam at a depth of approximately 460 ft, head was substantially higher than those of the intervals tested above and below it . These split gradients were probably the result of a rapid drop in the corehole water level, the effects of drilling, or the effect of other nearby uncased coreholes that connected test intervals at depth with high head test intervals above. In either instance, some potentiometric heads in these test intervals probably had not equilibrated .
The potentiometric heads of test intervals in valley coreholes generally were similar to or less than the corehole water levels (fig . 8) . The depth to water for the seven coreholes in valleys ranged from 10 to 76 ft below land surface with a mean depth of 39 ft . The potentiometric gradient generally was downward, but several test intervals at shallow depths usually exhibited equivalent heads that were often equal to the water level in the corehole .
GROUND-WATER FLOW
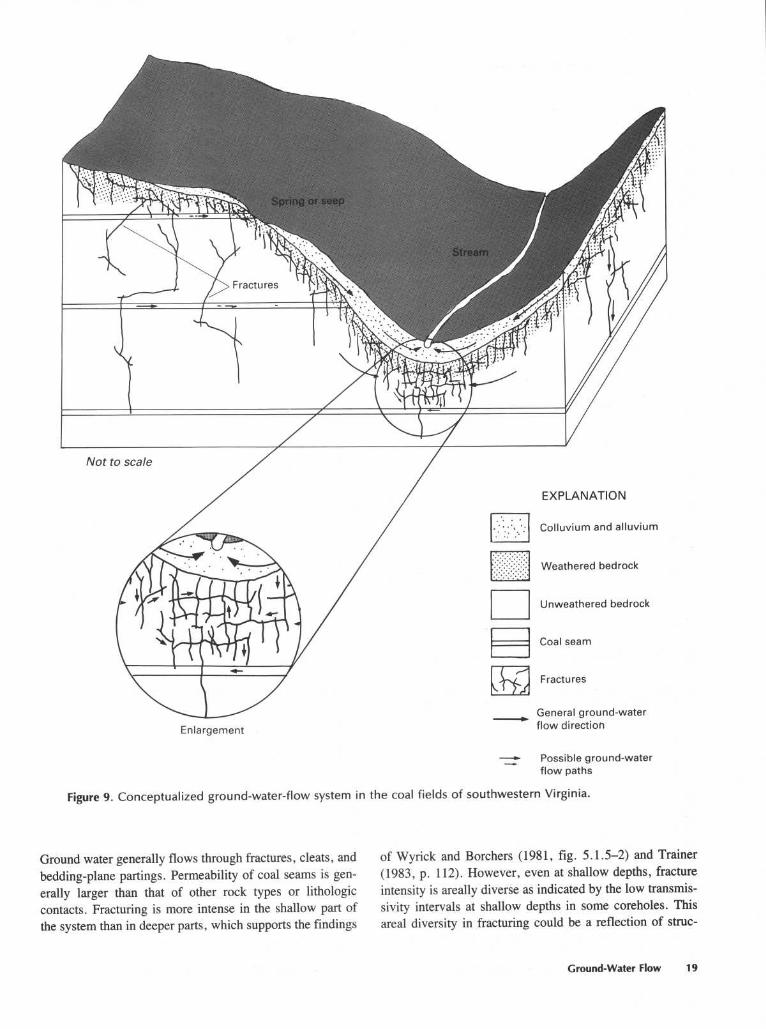
A conceptual ground-water-flow model of the coal fields of southwestern Virginia is presented in figure 9 .
Ground-Water Flow 1 5
��������
COREHOLE 13 COREHOLE 39 COREHOLE 48 0 0 0
a a Uw 100 100
NO Z ZQ Q
200 200 Q 200
0 0 0 m m
300 m w w 300 w 300 z z z a 400 400 w
z 500 500
w w
0 0x 600 600 600 0 O w
O
700 700 700 1,605 1,705 1,805 1,905 2,005 2,105 2,205 2,305 1,360 1,460 1,560 1,660 1,760 1,860 1,960 2,060 1,300 1,400 1,500 1,600 1,700 1,800 1,900 2,000
POTENTIOMETRIC HEAD, IN FEET ABOVE SEA LEVEL POTENTIOMETRIC HEAD, IN FEET ABOVE SEA LEVEL POTENTIOMETRIC HEAD, IN FEET ABOVE SEA LEVEL
COREHOLE 50 COREHOLE 51
w a EXPLANATION
----Corehole water-level altitude z a ---Line of zero pressure head
0 Potentiometric head measured in : m " Coal
o Sandstone z
mw
HNwH wO
W0
1,140 1,240 1,340 1,440 1,540 1,640 1,740 1,840 1,200 1,300 1,400 1,500 1,600 1,700 1,800 1,900
POTENTIOMETRIC HEAD, IN FEET ABOVE SEA LEVEL POTENTIOMETRIC HEAD, IN FEETABOVE SEA LEVEL
Figure 6. Potentionnetric head as a function of depth below land surface for test intervals in hilltop coreholes 13, 39, 48, 50, and 51 .

�
COREHOLE 10 COREHOLE 28 COREHOLE 36 0 - I 00
wU a a i N
/100 100 100
N N 0Z Z I Z
l 0 200J 200 0200
Q
0 0 I
m m w 300w 300 IG w 300 / I-I
z / z z
/ 400 /a 400 400 m
w w w Z zz
500 500 ti 500 w w w
0 0 /x 600 J 600 J 600
I 0 00 I I I I I II I I I I I I 700 /~ I I I I I V/
700 700
1,809 1,909 2,009 2,109 2,209 2,309 2,409 2,509 1,200 1,300 1,400 1,500 1,600 1,700 1,800 1,900 1,260 1,360 1,460 1,560 1,660 1,760 1,860 1,960
POTENTIOMETRIC HEAD, IN FEETABOVE SEA LEVEL POTENTIOMETRIC HEAD, IN FEET ABOVE SEA LEVEL POTENTIOMETRIC HEAD, IN FEET ABOVE SEA LEVEL
COREHOLE 42 COREHOLE 44
0 I 0 EXPLANATION
w /U a -----Corehole water-level altitude
100 100
0 I O --- Line of zero pressure head zz g Potentiometric head measured in :J 200 200
0 i " Coal
ww Im Siltstone w 300 w 300
o SandstoneZ
I J 400 > 400 O Shale
I m w G Lithologic contact(s)w
zz F- 500 I 500
Iw I
0 a x 600 - / I r 600 a 0 I 0
I
700 f I t I I I I 700 V I I I I I I I
1,220 1,320 1,420 1,520 1,620 1,720 1,820 1,920 1,720 1,820 1,920 2,020 2,120 2,220 2,320 2,420
POTENTIOMETRIC HEAD, IN FEET ABOVE SEALEVEL POTENTIOMETRIC HEAD, IN FEET ABOVE SEA LEVEL
Figure 7. Potentiometric head as a function of depth below land surface for test intervals in hillslope coreholes 10, 28, 36, 42, and 44 .
���������������������������
COREHOLE 17 COREHOLE 23 COREHOLE 27 0 0
UW W
U LLaCC LL
100 a
100 N
Z Z Z g 200 g 200 200
0 O 0
m m m w 300 300 w 300W w WwZ Z I Z
J 400> 400 400 a W Z Z
500 500 500 W
0
a 600 600 - / 600 jII0 0
I 0
700 700 V/ I I I I I I I 700 I I I I I I I
1,350 1,450 1,550 1,650 1,750 1,850 1,950 2,050 1,920 2,020 2,120 2,220 2,320 2,420 2,520 2,620 2,000 2,100 2,200 2,300 2,400 2,500 2,600 2,700
POTENTIOMETRIC HEAD, IN FEETABOVE SEA LEVEL POTENTIOMETRIC HEAD, IN FEETABOVE SEA LEVEL POTENTIOMETRIC HEAD, IN FEET ABOVE SEA LEVEL
COREHOLE40 COREHOLE45 0 0
EXPLANATIONW W U U
---- Corehole water-level altitude s 100 CC 100
---Line of zero pressure head ca 0 Z Za Potentiometric head measured in :
0200
0 200
o CoalJ WG7 Cn Siltstone w 300
o Sandstonez J
400 400 G Lithologic contact(s) I
W z z
500 ti
500 r I w
wO O
I a 600 600
O O I i
1 I t700 700 -A
1,100 1,200 1,300 1,400 1,500 1,600 1,700 1,800 1,200 1,300 1,400 1,500 1,600 1,700 1,800 1,900
POTENTIOMETRIC HEAD, IN FEETABOVE SEA LEVEL POTENTIOMETRIC HEAD, IN FEET ABOVE SEA LEVEL
Figure 8 . Potentiometric head as a function of depth below land surface for test intervals in valley coreholes 17, 23, 27, 40, and 45 .
�
Notto scale
EXPLANATION
Colluvium and alluviumEl Weathered bedrock
Unweathered bedrockEl Coal seam
Fractures
General ground-water
Enlargement flow direction
Possible ground-water flow paths
Figure 9. Conceptualized ground-water-flow system in the coal fields of southwestern Virginia .
Ground water generally flows through fractures, cleats, and of Wyrick and Borchers (1981, fig . 5 .1 .5-2) and Trainer
bedding-plane partings . Permeability of coal seams is gen- (1983, p. 112) . However, even at shallow depths, fracture
erally larger than that of other rock types or lithologic intensity is areally diverse as indicated by the low transmis
contacts . Fracturing is more intense in the shallow part of sivity intervals at shallow depths in some coreholes. This
the system than in deeper parts, which supports the findings areal diversity in fracturing could be a reflection of struc-
Ground-Water Flow 1 9

tural features or other local conditions . The transmissivity of all rock types generally decreases with depth (fig . 5) as fracture size and number decrease . The transmissivities generally are similar for coal seams, sandstone, and lithologic contacts at depths less than 100 ft . However, siltstone and shale generally have the lowest transmissivities . Because of the high topographic relief in the area, ground-water-flow systems are limited in areal extent . Ground water beneath ridges and hills probably discharges to local springs and streams or flows downgradient as underflow in valleys .
The water level in the uncased coreholes (which may or may not be the water table) is influenced by topography . The average depth to water beneath hilltops was 221 ft ; beneath hillslopes, 109 ft ; and beneath valleys, 39 ft . Regardless of whether these water levels equate to the water table, the water-table aquifer generally is thin because of the interbedding of low-permeability and high-permeability rocks . Although a thick interval of strata at shallow depths can be saturated and have zones with similar heads, the interval does not necessarily represent one water-table aquifer. In many instances, the zones of high permeability that exhibit equal heads are separated by zones of much lower permeability . Thus, such a zone is a thin water-table aquifer, underlain by semiconfined and confined water-bearing zones.
Potentiometric-head measurements provide clues to the general ground-water-flow system in the area . A vertical profile of head measurements for a corehole situated on a hilltop usually indicated a sharp downward gradient (see fig . 6, corehole 39) . A downward gradient is also observed in hillslope wells, although shallow zones commonly exhibited intervals of equal head (as previously discussed; see fig . 7, corehole 28) . Finally, valley wells in the area usually exhibited shallow intervals of equal head below which head measurements indicated a downward gradient (see fig. 8, corehole 23) . These head relations indicate that the high-relief areas function as recharge areas ; water infiltrates the surface, percolates into the regolith, and flows downward and laterally through fractures in the shallow bedrock . Hydraulic conductivity decreases with increasing depth, and ground water flows primarily in the lateral direction along fractures or through coal seams. If vertical hydraulic conductivity is negligible, ground water continues to flow laterally, discharging as springs or seeps on hillslopes . Valleys function as discharge areas for the flow system, although upward gradients were usually not observed in wells located in this topographic setting . However, the few wells tested that indicated an upward gradient were adjacent to streams, possibly indicating that upward gradients are associated with the streams and will probably only be detected in close proximity to them . In general, water probably follows a stairstep flow path (Kipp and others, 1983), discharging to streams and (or) flowing downward into coal seams and old mine workings .
Permeable coal seams probably underlie valleys in the region ; however, aquifer-test data indicate that the horizontal hydraulic conductivity of coal is a function of depth and probably decreases under ridges because of increased overburden pressures. Wahler and Associates (1979), in their studies of mine-dewatering problems, concluded that with increasing depth, soft rocks, such as shale, may seal deep fractures . Topographic relief in the area creates high heads for the ground-water-flow system . However, transmissivity data from the range of depths tested indicate that ground water primarily flows at moderate depths (<300 ft, see fig. 5), and deep regional groundwater flow is probably minimal. Trainer (1983, p . 112) stated that the depth and intensity of fracturing, lithology, and topographic relief influence the depth of active circulation of fresh ground water in horizontally bedded sedimentary rocks . He also concluded that, in this type of setting, ground-water circulation is typically restricted to modest depths .
SUMMARY AND CONCLUSIONS
Borehole geophysical logging, water-quality sampling, and hydraulic testing with a pneumatic straddle-packer assembly were used in coal-exploration coreholes to evaluate the aquifers in the coal fields of southwestern Virginia . Potentiometric-head relations in the coreholes were more complex than originally thought. Flow between test intervals in the coreholes made collection of samples representative of water quality in the tested intervals unfeasible . In addition, time constraints established to allow the retrieval of data on as many test intervals as possible made constant-head injection testing the predominant method of analysis used . Standard and modified slug-test methods are applicable to ground-water studies in terranes similar to the study area, particularly when resolution is needed for low values of transmissivity and (or) hydraulic conductivity . For such studies, the modified slug test, which is designed for tight formations, is a valid aquifer-test method .
Results from straddle-packer testing of 9-ft-long intervals in the predominantly clastic rocks of the coal fields indicate that transmissivity decreases with depth. Transmis sivity values calculated from constant-head injection testing ranged from less than 0.001 to 60 ft`/d in coal seams, from less than 0.001 to greater than 160 ft2/d in sandstone, from less than 0.001 to greater than 170 ft 2/d in siltstone and shale, and from less than 0.001 to greater than 20 ft`/d at lithologic contacts . Coal seams had a median transmissivity of 0 .15 ft2/d, whereas other rock types and lithologic contacts had median transmissivities less than or equal to 0.001 ft 2/d . All rock types tested usually were permeable to a depth of approximately 100 ft ; however, at depths greater than 200 ft only coal seams consistently had measurable permeability (transmissivity greater than 0 .001 ft'`/d) . Injec
20 Hydraulic Characteristics of, and Ground-Water Flow in, Coal-Bearing Rocks of Southwestern Virginia

�
tion testing of intervals immediately adjacent to coal seams usually indicated lower transmissivity than that obtained when the coal seams were isolated within the test interval, indicating that most lateral ground-water flow is associated with the coal seams. Potentiometric-head measurements for these coal seams coupled with the presence of low-transmissivity intervals between the seams indicate that some of the coal seams could be partly saturated, confined, or semiconfined and, in some instances, that water could be perched above these coal seams .
The mean depth to standing water below land surface was 221 ft in coreholes located on hilltops, 109 ft in coreholes located on hillslopes, and 39 ft in coreholes located in valleys. Potentiometric-head measurements indicate downward flow on hilltops, lateral and downward flow on hillslopes, and upward, lateral, and downward flow in valleys . Because of the high topographic relief (600-1,000 ft) in the area, ground-water-flow systems are of small areal extent . Head relations indicate that high topographic areas function as recharge areas; water infiltrates through the surface, percolates into the regolith, and moves downward and laterally through the fractures in the shallow bedrock. Permeability decreases with increasing depth, and most water may move laterally along fractures or bedding planes or through coal seams until encountering more permeable rock through which to move downward . If more permeable rocks are not encountered, water continues to move later-ally, discharging as a spring or seep on the hillslope. Where vertical permeability is appreciable, water follows a stairstep path through the regolith, fractures and bedding planes, and coal seams, discharging to streams and (or) recharging permeable coal seams at depth. Although permeable coal seams may underlie valleys in the region, data from this study indicate that the permeability of coal is a function of depth and may decrease under adjacent hills because of increased overburden pressures. Therefore, ground water beneath valleys that does not discharge to streams probably flows downgradient as underflow beneath the streams .
REFERENCES CITED
Bates, R.L ., and Jackson, J.A ., eds., 1987, Glossary of geology (3d ed .) : Falls Church, Va., American Geological Institute, 788 p.
Bredehoeft, J.D ., and Papadopulos, S.S ., 1980, A method for determining the hydraulic properties of tight formations: Water Resources Research, v. 16, no . 1, p. 233-238 .
Campbell, M.R ., 1893, Geology of the Big Stone Gap coal field of Virginia and Kentucky : U.S . Geological Survey Bulletin 111, 106 p.
1894, Description of the Estillville quadrangle [Kentucky-Virginia-Tennessee] : U.S . Geological Survey Geologic Atlas, Folio 12, 7 p.
1896, Description of the Pocahontas quadrangle [Virginia-West Virginia] : U.S . Geological Survey Geologic Atlas, Folio 26, 7 p.
Cooper, H.H., Bredehoeft, J.D ., and Papadopulos, I.S ., 1967, Response of a finite-diameter well to an instantaneous charge of water: Water Resources Research, v. 3, no . 1, p. 263-269.
Diffenbach, R.N ., 1988, Geology of the Virginia portion of the Clintwood and Jenkins East quadrangles : Virginia Division of Mineral Resources, Publication 86, scale 1:24,000 .
Englund, K.J ., 1979, The Mississippian and Pennsylvanian (Car-boniferous) systems in the United States-Virginia : U .S . Geological Survey Professional Paper 1110-C, p. C1-C21 .
Ferguson, H.F ., 1967, Valley stress relief in the Allegheny Plateau : Association of Engineering Geologists Bulletin, v . 4, p . 63-68 .
Ferris, J.G ., and Knowles, D.B ., 1954, The slug test for estimat-ing transmissibility : U.S . Geological Survey Ground Water Note 26, p. 1-7.
Fontaine, W.M., 1874, The "great conglomerate" on New River, West Virginia : American Journal of Science (3d ed .), v. 7, p. 459-465,573-579.
Heath, R.C ., 1983, Basic ground-water hydrology: U.S . Geolog-ical Survey Water-Supply Paper 2220, 84 p.
Hessley, R.K ., Reasoner, J.W., and Riley, J.T ., 1986, Coal science: New York, Wiley, 269 p.
Hvorslev, M.J ., 1951, Time lag and soil permeability in ground water observations : U.S . Army Corps of Engineers, Waterways Experiment Station, Bulletin 36, 50 p.
Jacob, C .E ., and Lohman, S .W., 1952, Nonsteady flow to a well of constant drawdown in an extensive aquifer: American Geophysical Union Transactions, v . 33, no . 4, p. 559-569.
Jillson, W.R ., 1919, The Kendrick shale ; a new calcareous fossil horizon in the coal measures of eastern Kentucky : Kentucky Department of Geology and Forestry, ser . 5, v . 1, no. 2, p. 96-104 .
Keys, W.S ., 1988, Borehole geophysics applied to ground-water investigations : U.S . Geological Survey Open-File Report 87-539, 305 p.
Kipp, J.A ., Lawrence, F.W., and Dinger, J.S ., 1983, A concep-tual model of ground-water flow in the eastern Kentucky coal field : 1983 Symposium on Surface Mining, Hydrology, Sedimentology, and Reclamation, University of Kentucky, Lexington, Kentucky [Proceedings], p. 543-549.
Larson, J.D ., and Powell, J.D ., 1986, Hydrology and effects of mining in the upper Russell Fork Basin, Buchanan and Dickenson Counties, Virginia : U.S . Geological Survey Water-Resources Investigations Report 85-4238, 63 p.
Lohman, S.W., 1979, Ground-water hydraulics : U.S . Geological Survey Professional Paper 708, 70 p.
McLoughlin, T.F ., 1986, Explanation of the regional tectonic map of the southwestern coal field of Virginia : U.S . Department of Labor, Mine Safety and Health Administration, Informational Report IR 1177, 17 p.
Miller, M.S ., 1974, Stratigraphy and coal beds of upper Missis-sippian and lower Pennsylvanian rocks in southwest Virginia : Virginia Division of Mineral Resources, Bulletin 84, 211 p.
Morse, W.C ., 1931, Pennsylvanian invertebrate fauna: Kentucky Geological Survey, ser. 6, v. 36, p. 293-348 .
National Oceanic and Atmospheric Administration (NOAA), 1986, Climatological data annual summary-Virginia: National Climatic Data Center, Asheville, North Carolina, v. 96, no . 13, 27 p.
References Cited 2 1

Neuzil, C.E ., 1982, On conducting the modified "slug" test in tight formations : Water Resources Research, v. 18, no . 2, p. 439-441.
Nolde, J.E ., and Mitchell, M.L ., 1984, Geology of the Prater and Vansant quadrangles, Virginia: Virginia Division of Mineral Resources, Publication 52, 28 p.
Papadopulos, S.S ., Bredehoeft, J .D ., and Cooper, H.H., Jr ., 1973, On the analysis of "slug test" data : Water Resources Research, v. 9, no . 4, p. 1087-1089.
Schubert, J.P ., 1980, Fracture flow of groundwater in coal-bearing strata-1980 Symposium on Surface Mining Hydrol-ogy, University ofKentucky, Lexington, Kentucky [Proceedings], p. 61-73.
Steam, C.W., Carroll, R.L ., and Clark, T.H ., 1979, Geological evolution of North America: New York, Wiley, 566 p.
Trainer, F.W., 1983, Some perspectives on near-surface fractured-rock aquifers-Proceedings of the 14th Biannual Conference on Ground Water, Sacramento, Calif., Septem
ber 19-20, 1983 ; California Water Research Center, University of California-Davis . Report no . 56, p. 104-122.
U.S . Department of Commerce, 1980, Bureau of the Census, 1980 census of population and housing: PHC80-U-48, Virginia, 17 p.
Wahler, W.A., and Associates, 1979, Dewatering active under-ground coal mines-Technical aspects and cost-effec-tiveness : Cincinnati, Office of Research and Development, Industrial Environmental Research Laboratory, U.S . Envi-ronmental Protection Agency, EPA-600/7-79-124, 124 p.
Wright, W.G ., 1985, Effects of fracturing on well yields in the coalfield areas of Wise and Dickenson Counties, southwestern Virginia: U.S . Geological Survey Water-Resources Investigations Report 85-4061, 21 p .
Wyrick, G.G ., and Borchers, J.W., 1981, Hydrologic effects of stress-relief fracturing in an Appalachian Valley : U.S . Geological Survey Water-Supply Paper 2177, 51 p.
22 Hydraulic Characteristics of, and Ground-Water Flow in, Coal-Bearing Rocks of Southwestern Virginia

TABLE 3
---- --
----
-- ---- ---- ----
-- ---- --
-- ----
-- ---- --
---- ----
-- ---- --
---- --
---- ---- --
---- --
-- ---- --
---- --
--
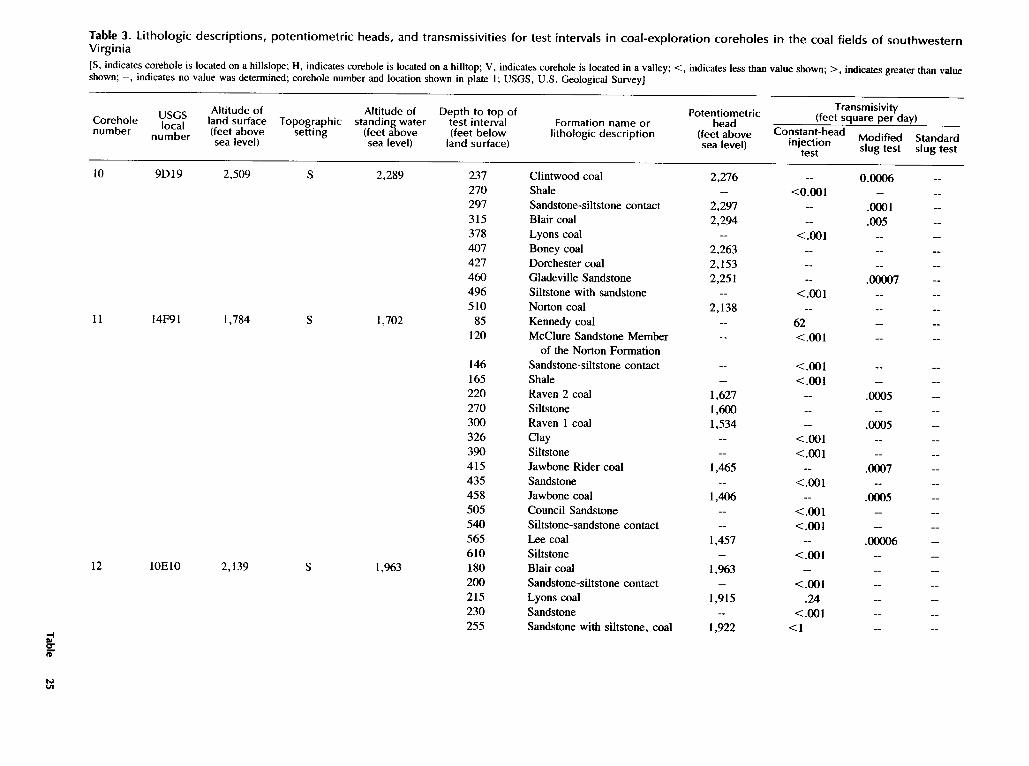
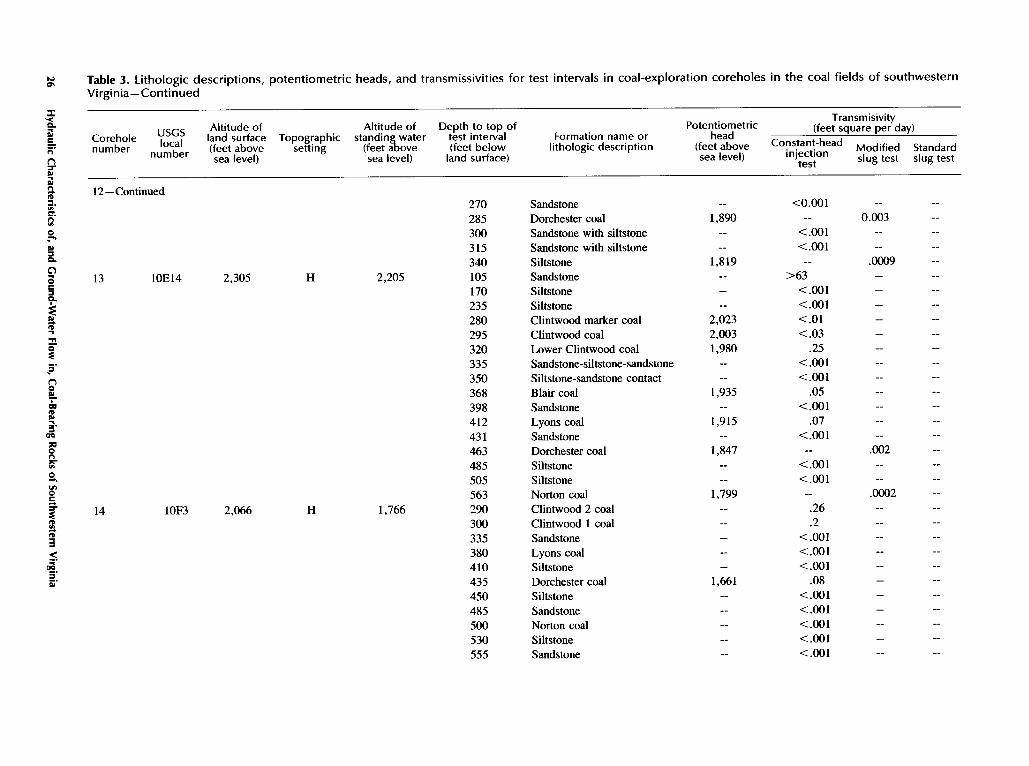
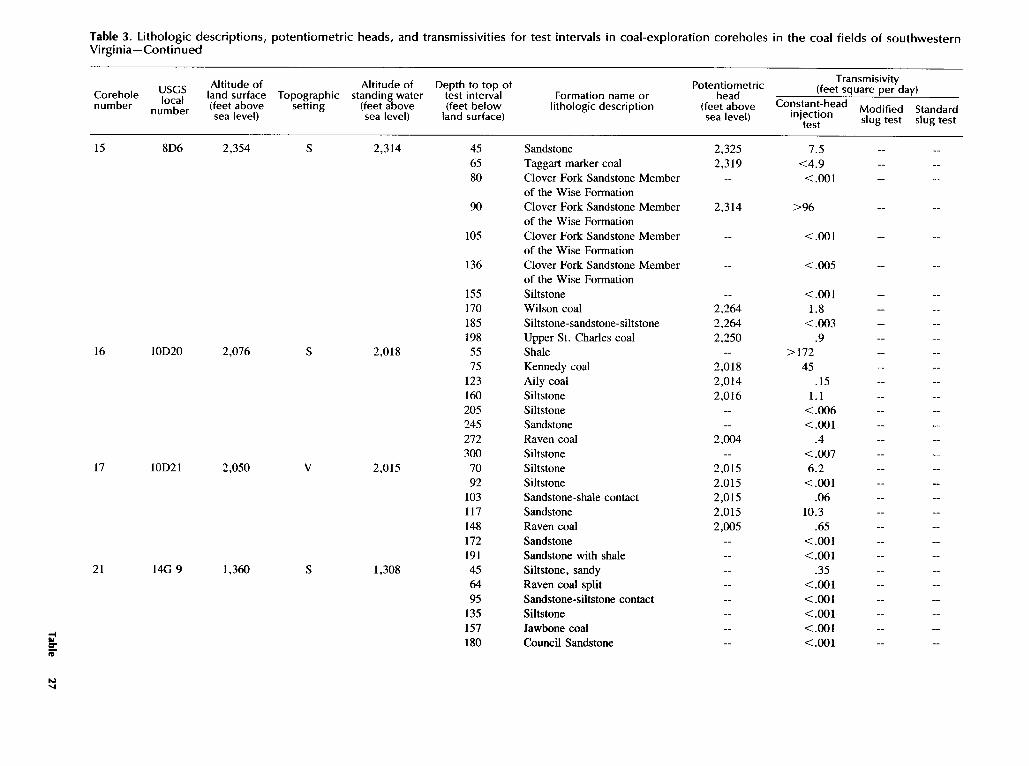
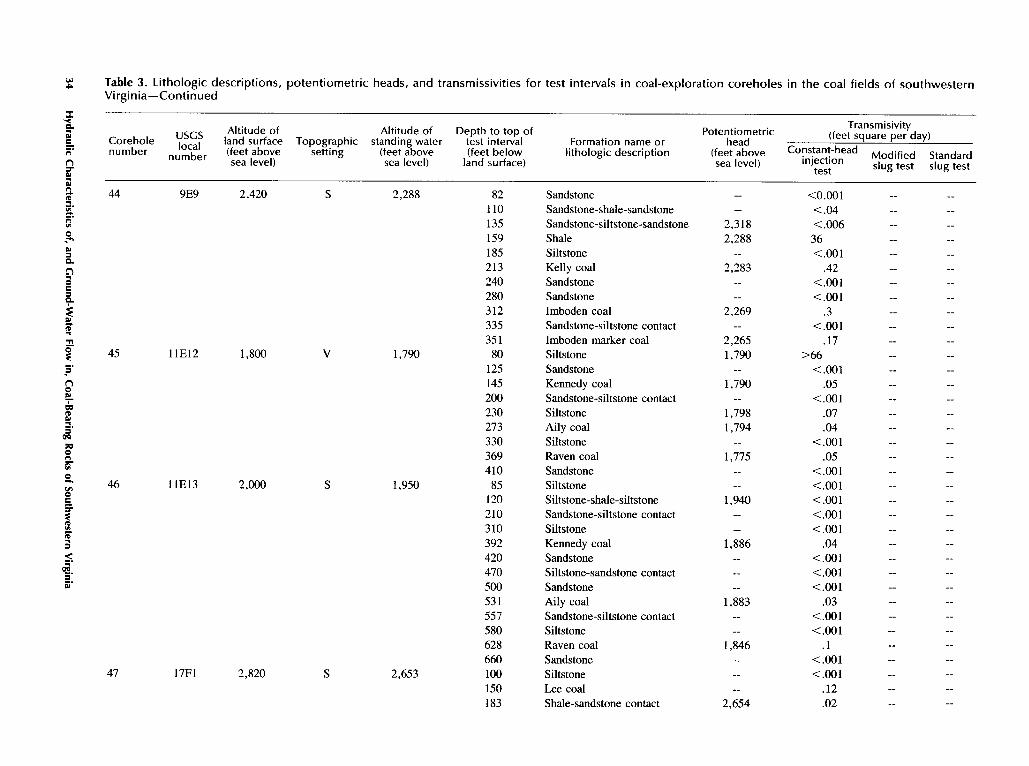
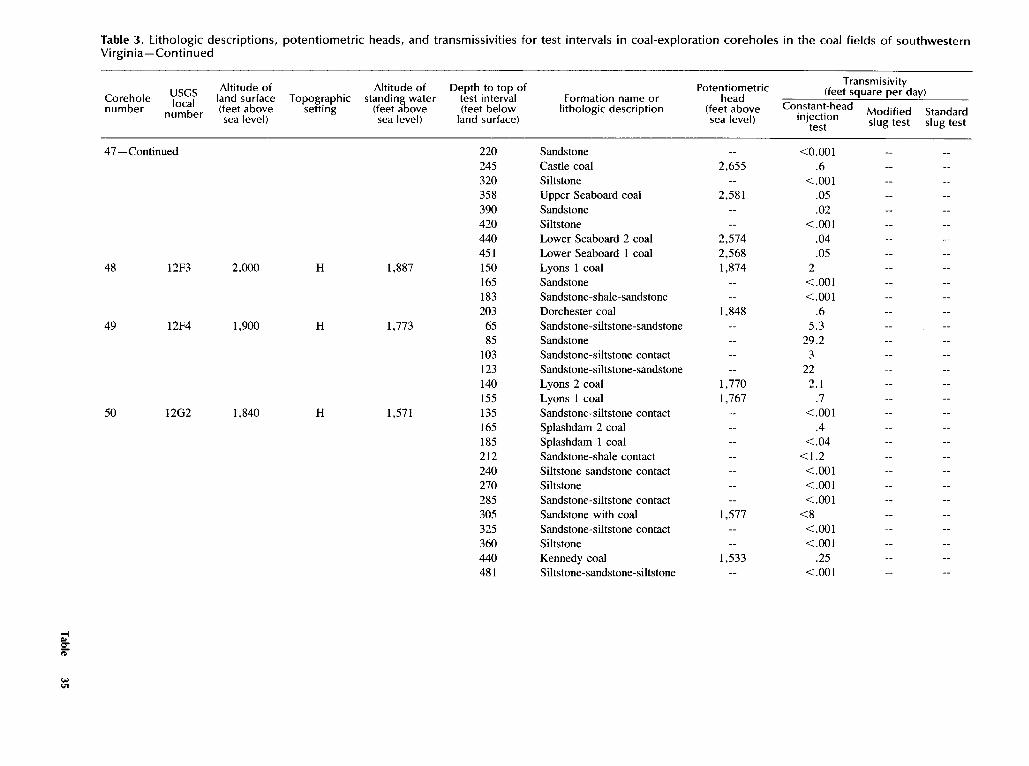
Table 3. Lithologic descriptions, potentiometric heads, and transmissivities for test intervals in coal-exploration coreholes in the coal fields of southwesternVirginia [S, indicates corehole is located on a hillslope ; H, indicates corehole is located on a hilltop; V, indicates corehole is located in a valley ; <, indicates less than value shown; >, indicates greater than valueshown; --, indicates no value was determined; corehole number and location shown in plate 1 ; USGS, U.S . Geological Survey]
Corehole number
USGS local
number
Altitude of land surface (feet above sea level)
Topographicsetting
Altitude of standing water
(feet above sea level)
Depth to top of test interval (feet below land surface)
Formation name or lithologic description
Potentiometric head
(feet above sea level) Standard
slug test
(feetTransmisivity square per day)
Constant-head injection Modified
test slug test
10 91319 2,509 S 2,289 237 Clintwood coal 2,276 0,0006 270 Shale <0.001 297 Sandstone-siltstone contact 2,297 .0001 315 Blair coal 2,294 .005 378 Lyons coal <.001 407 Boney coal 2,263 427 Dorchester coal 2,153 460 Gladeville Sandstone 2,251 .00007 496 Siltstone with sandstone <.001 510 Norton coal 2,138
11 141F91 1,784 S 1,702 85 Kennedy coal 62 120 McClure Sandstone Member <.001
of the Norton Formation 146 Sandstone-siltstone contact < .001 165 Shale < .001 220 Raven 2 coal 1,627 .0005 270 Siltstone 1,600 300 Raven 1 coal 1,534 .0005 326 Clay <.001 390 Siltstone < .001 415 Jawbone Rider coal 1,465 .0007 435 Sandstone <.001 458 Jawbone coal 1,406 .0005 505 Council Sandstone <.001 540 Siltstone-sandstone contact <.001 565 Lee coal 1,457 .00006 610 Siltstone <.001
12 10E10 2,139 S 1,963 180 Blaircoal 1,963 200 Sandstone-siltstone contact <.001 215 Lyons coal 1,915 .24 230 Sandstone < .001 255 Sandstone with siltstone, coal 1,922 <1
�����������������������������������������������������������������������������������
Table 3. Lithologic descriptions, potentiometric heads, and transmissivities for test intervals in coal-exploration coreholes in the coal fields of southwestern Virginia-Continued
x Transmisivityn Altitude of Altitude of Depth to top of heada+ Corehole USGS land surface Topographic standin water test interval Formation name or
Potentiometric (feet square per day) localn' number number (feet above setting (feet move (feet below lithologic description (feet above Constant-head modified Standard
n sea level) sea level) land surface) sea level) injection slug test slug test z test a a
12-Continued y. 270 Sandstone -- <0.001 -H 285 Dorchester coal 1,890 -- 0.003 o , 300 Sandstone with siltstone -- <.001 -
315 Sandstone with siltstone -- <.001 --°- 340 Siltstone 1,819 -- .0009 n '0 13 10E14 2,305 H 2,205 105 Sandstone -- >63 -
170 Siltstone -- <.001 -a
235 Siltstone -- <.001 -a 280 Clintwood marker coal 2,023 <.O1 -
295 Clintwood coal 2,003 <.03 -320 Lower Clintwood coal 1,980 .25
F 335 Sandstone-siltstone-sandstone -- <.001
n 350 Siltstone-sandstone contact -- <.001 w 368 Blair coal 1,935 .05 00 398 Sandstone -- <.001 °' 412 Lyons coal 1,915 .07
431 Sandstone -- <.001 -e 463 Dorchester coal 1,847 -- .002
485 Siltstone -- <.001 -°" 505 Siltstone -- <.001 -
563 Norton coal 1,799 -- .0002
F 14 IOF3 2,066 H 1,766 290 Clintwood 2 coal -- .26 -300 Clintwood 1 coal -- .2 -335 Sandstone -- <.001 -380 Lyons coal -- <.001 -
ao 410 Siltstone -- < .001 -.a 435 Dorchester coal 1,661 .08 -
450 Siltstone -- <.001 -485 Sandstone -- <.001 -500 Norton coal -- <.001 -530 Siltstone -- <.001 -555 Sandstone -- <.001 -
--
--
--
--
--
----
--
----------------
Table 3 . Lithologic descriptions, potentiometric heads, and transmissivities for test intervals in coal-exploration coreholes in the coal fields of southwestern Virginia-Continued
Corehole number local
number
IJSGS land surface (feet above sea level)
Altitude of Topographic
setting standing water
(feet above sea level)
Altitude of test interval (feet below land surface)
Depth to top of Formation name or litholo ic descriptiong
head (feet above sea level)
Potentiometric
tandard lug test
Constant-head injection Modified
Stestslug test
Transmisivity(feet square per day)
8D6 2,354 S 2,314 45 Sandstone 2,325 7.5 s15 65 Taggart marker coal 2,319 <4.9 80 Clover Fork Sandstone Member < .001
of the Wise Formation 90 Clover Fork Sandstone Member 2,314 >96
of the Wise Formation 105 Clover Fork Sandstone Member < .001
of the Wise Formation 136 Clover Fork Sandstone Member < .005
of the Wise Formation 155 Siltstone < .001 170 Wilson coal 2,264 1 .8 185 Siltstone-sandstone-siltstone 2,264 < .003 198 Upper St . Charles coal 2,250 .9
16 1OD20 2,076 S 2,018 55 Shale >172 75 Kennedy coal 2,018 45 123 Aily coal 2,014 .15 160 Siltstone 2,016 1 .1 205 Siltstone <.006 245 Sandstone <.001 272 Raven coal 2,004 .4 300 Siltstone <.007
17 1OD21 2,050 V 2,015 70 Siltstone 2,015 6.2 92 Siltstone 2,015 <.001 103 Sandstone-shale contact 2,015 .06 117 Sandstone 2,015 10.3 148 Raven coal 2,005 .65 172 Sandstone <.001 191 Sandstone with shale <.001
21 14G 9 1,360 S 1,308 45 Siltstone, sandy .35 64 Raven coal split <.001 95 Sandstone-siltstone contact <.001 135 Siltstone <.001 157 Jawbone coal <.001 180 Council Sandstone <.001

������������������������������������������������������������������������������������������������������
N Table 3. Lithologic descriptions, potentiometric heads, and transmissivities for test intervals in coal-exploration coreholes in the coal fields of southwestern Virginia-Continued
x Transmisivitya Altitude of Altitude of Depth to top of (feet square per day) c Corehole USGS land surface Topographic standing water test interval Formation name or
Potentiometric m head ;; local (feet above setting (feet above (feet below lithologic description (feet above Constant-head Modified Standard n
number number sea level) sea level) land surface) sea level) injection slug test slug testT test
21-Continued 217 Tiller coal -- <0.001 254 Siltstone with sandstone -- <.001 280 Siltstone with sandstone -- <.001 340 Siltstone with sandstone -- <.001
°' 360 Upper Seaboard coal -- <.001n 415 Sandstone with siltstone -- <.001e
a 440 Sandstone with siltstone -- <.001 480 Sandstone -- <.001
°' 530 Sandstone -- <.001 540 Seaboard coal -- <.001 557 Siltstone with coal -- <.001f
9' 580 Siltstone with coal -- <.001 n 22 8D 7 2,582 S 2,462 35 Shale -- <.001 a° 67 Low Splint A coal -- .1 °° 115 Sandstone -- <.001A °' 147 Low Splint C and D coal 2,455 4.53 °° 180 Sandstone -- <.001
202 Sandstone -- <.001 23 1OD23 2,620 V 2,568 70 Siltstone with coal 2,568 .84
87 Blair coal 2,568 1 .6 $ 115 Sandstone 2,568 >85
F 140 Lyons coal 2,554 .46 155 Sandstone -- <.001 184 Upper Dorchester coal 2,538 .9
< 200 Lower Dorchester coal 2,542 4.0 a9 " 24 1OD22 2,580 S 2,562 53 Sandstone 2,562 1 .4 a' 80 Blair coal 2,543 2
100 Sandstone -- <.001 135 Lyons coal 2,536 1 .1 155 Siltstone -- <.001 173 Upper Dorchester coal 2,514 .2 193 Lower Dorchester coal 2,513 .06

----
----
----
--
--
------
----
------
--
Table 3 . Lithologic descriptions, potentiometric heads, and transmissivities for test intervals in coal-exploration coreholes in the coal fields of southwestern Virginia-Continued
Transmisivity Corehole number
USGS local
number
Altitude ofland surface (feet above sea level)
Topographicsetting
Altitude of water
(feetstanding
above sea level)
Depth to top of test interval (feet below land surface)
Formation name orlithologic description
Potentiometric head
(feet above sea level)
Standard slug test
(feet square per day) Constant-head
injection Modified test slug test
26 10E11 2,010 V 1,934 24 Clintwood marker coal 2.3 55 Sandstone 1 89 Blair coal 1,934 .14
121 Lyons coal 1,932 .37 138 Sandstone-siltstone contact <.001 165 Sandstone <.001 183 Dorchester coal 1,908 .02 205 Siltstone <.001 222 Siltstone <.001
27 10E12 2,600 V 2,585 25 Sandstone 2,585 .2 45 Sandstone with siltstone 2,588 .1 80 Siltstone-sandstone-siltstone 2,575 .2 106 Blair coal 2,560 .6 125 Sandstone <.001 152 Lyons coal 2,552 .4 180 Sandstone <.001 215 Dorchester coal 2,527 .3 245 Sandstone with siltstone <.001 285 Sandstone <.001
28 8D 8 1,900 S 1,840 32 Sandstone >118 60 Sandstone 1,840 >118 80 Sandstone 1,840 >168 107 Sandstone with coal 1,840 >101 140 175
Shale, sandy Shale with sandstone
.06 <.001
205 Shale, sandy 1,865 <.001 245 Shale <.001 285 Sandstone with shale <.001 310 Shale, sandy <.001 343 Clintwood coal 1,759 <.005 370 Sandstone with shale and coal <.001 418 Blair marker coal 1,758 <.007

w0 Table 3 . Lithologic descriptions, potentiometric heads, and transmissivities for test intervals in coal-exploration coreholes in the coal fields of southwestern Virginia-Continued
Transmisivityc Altitude of Altitude of Depth to top of Potentiometric (feet square per day)dc Corehole USGS land surface Topographic standing water test interval Formation name or headlocal (feet above setting (feet above (feet below lithologis description (feet above Constant-head Modified Standardnumbernumber number sea level) sea level) land surface) sea level) injection slug test slug testc1 testTa a
29 14F92 2,160 S 2,140 15 Siltstone -- 50 H 35 Splashdam coal 2,140 2 .6
50 Siltstone -- < .001 65 Sandstone -- < .001 80 Upper Banner coal 2,132 .05
°- 115 Siltstone-sandstone-Siltstone -- < .001 n c 130 Siltstone -- < .001 3 157 Lower Banner coal 2,110 .02 a
185 Siltstone -- < .001 °.: 220 Big Fork coal 2,090 .01
270 Siltstone-sandstone-Siltstone -- < .001 286 Bearwallow coal -- < .001 315 Sandstone with coal -- < .001
n 335 Siltstone -- < .001 °a 373 Kennedy coal 2,020 .02 °° 32 13G15 1,920 S 1,557 153 Sandstone -- .02
198 Lyons coal -- .15 310 Sandstone with coal -- .37
c 445 Siltstone -- < .001 495 Hagy coal 1,542 .15 515 Sandstone <.001
c 565 Siltstone -- <.001 590 Splashdam 2 coal 1,498 .5F 605 Sandstone -- <.001 621 Splashdam 1 coal 1,479 <.05 -- -
< 33 16F 1 2,340 S 2,229 65 Sandstone with Siltstone -- <.001 -- --a'a 130 Siltstone -- <.001 -- -a. 168 Jawbone coal 2,243 .05 -- 0.25
195 Siltstone with coal 2,219 <.001 -- -215 Tiller coal 2,197 .05 -- -235 Sandstone -- <.001 -- -

---- -- ---- -- ---- -- --
-- ---- -- ---- -- ---- -- --
-- ---- --
-- -- ---- -- --
-- ---- -- ---- -- ---- -- --
-- ---- --
-- -- ---- -- ---- -- ---- -- ---- -- --
-- ---- -- ---- -- ---- -- ---- -- ---- -- ---- -- ---- -- --
Table 3. Lithologic descriptions, potentiometric heads, and transmissivities for test intervals in coal-exploration coreholes in the coal fields of southwesternVirginia-Continued
Corehole number
USGS local
number
Altitude of land surface (feet above sea level)
Topographicsetting
Altitude of standing water (feet above sea level)
Depth to top of test interval (feet below land surface)
Formation name orlithologic description
Potentiometric head
(feet above sea level)
(feet Constant-head
injectiontest
Transmisivitysquare per day)
Modified slug test
Standard slug test
35 15F25 2,327 S 2,305 264 Raven 1 coal 2,230 0.46 0.26 300 Sandstone 0.005 335 Sandstone <.001 400 Siltstone <.001
36 13G16 1,940 S 1,928 447 35
Jawbone A and B coal Sandstone
2,164 .01 <.001
70 Sandstone <.001 100 Siltstone-sandstone contact <.001 129 Lyons 2 coal 1,901 .25 154 Lyons 1 coal 1,856 .2 169 Siltstone <.001 234 Sandstone-siltstone-sandstone <.001 255 Norton coal 1,773 <.07 309 Sandstone with shale <.001 341 Sandstone <.001 399 Siltstone <.001 464 Hagy 2 coal 1,950 <.001 489 Hagy coal 1,621 .15 529 Siltstone-sandstone contact <.001 564 Siltstone <.001
37 13D 3 2,423 S 2,257 110 Siltstone with sandstone <.001 190 Siltstone <.001 220 Siltstone-sandstone contact <.001 250 Kennedy coal 2,273 .17 280 Sandstone <.001 335 Siltstone <.001 385 Sandstone <.001 430 Raven 2 coal <.001 470 Siltstone <.001 547 Raven 1 coal <.001 610 Sandstone <.001

w Table 3. Lithologic descriptions, potentiometric heads, and transmissivities for test intervals in coal-exploration coreholes in the coal fields of southwestern N Virginia-Continued
s Transmisivitya Altitude of Altitude of Depth to top of
headCorehole USGS land surface Topographic standing water test interval Formation name or Potentiometric (feet square per day)
localnumber number (feet above setting (feet above (feet below lithologic description (feet above Constant-head Modified Standard A sea level) sea level) land surface) sea level) injection slug test slug testtestz
-- <0.00138 13D 4 2,415 S 2,326 100 Siltstone 160 Siltstone -- <.001
n 200 Sandstone-siltstone-sandstone 2,314 <.0p1 245 Kennedy coal 2,293 .22
a 280 Sandstone -- < .0013
312 Sandstone-siltstone contact -- < .001 n 330 Siltstone -- <.001 c 3 380 coal -- <.001 -- _
c 427 Raven 2 coal -- <.001 -- -460 coal -- <.001 -- -
'` 505 Siltstone-sandstone contact -- <.001 -- -530 Sandstone -- <.001 -- -F 555 Raven 1 coal -- <.001 -- -
n 600 Sandstone -- <.001 -- -
39 IOF 4 2,060 H 1,795 277 Clintwood coal 1,801 .2 -- 0.06 305 Siltstone -- <.001 330 Lyons coal -- <.001 388 Dorchester coal 1,779 <.001
0 410 Siltstone -- < .001 450 Sandstone -- < .001 -- -
°. 477 Norton coal 1,721 .42 -- .27
40 IOF 5 1,800 V 1,759 65 Sandstone -- <5.7 -- -s 100 Lyons coal 1,759 <4.7
120 Siltstone 148 Dorchester coal 1,752 .04
< 165 Siltstone -- <.001 oro 185 Siltstone-shale-siltstone -- <.001
210 Sandstone-siltstone contact -- <.001 237 Norton coal 1,689 1 .8
41 11F 7 1,980 H 1,604 120 Clintwood coal -- .16 185 Sandstone -- <.001 230 Sandstone-siltstone contact -- <.001 255 Lyons coal -- .15 310 Siltstone -- .28

��������������������������������������������������������������������������������
--------------
--
--
--
--
--
--
--------
Table 3. Lithologic descriptions, potentiometric heads, and transmissivities for test intervals in coal-exploration coreholes in the coal fields of southwestern Virginia-Continued
Corehole number
USGS local
number
Altitude of land surface (feet above sea level)
Topographicsetting
Altitude of standing water
(feet above sea level)
Depth to top of test interval (feet below land surface)
Formation name or lithologic description
Potentiometric head
(feet above sea level)
Transmisivity(feet square per day)
Constant-head Modified Standardinjectiontest slug test slug test
41-Continued 377 Norton coal 1,604 0.26 400 Sandstone-siltstone contact 1,604 .37 425 Sandstone <.001 470 Siltstone <.001 505 Sandstone-siltstone contact <.001 540 Sandstone <.001
42 10E15 1,920 S 1,864 585 30
Hagy coal Siltstone
<.001 3.45
70 Siltstone <.001 88 Lyons coal 1,852 .8 105 Siltstone-sandstone-siltstone 1,847 .98 113 Siltstone <.001 133 Dorchester coal 1,831 1.2 150 Siltstone <.001 170 Siltstone 1,822 .01 190 Siltstone 1,805 .77 210 Sandstone-siltstone contact <.001 226 Norton coal 1,821 .31
43 10E16 1,920 S 1,871 42 Sandstone-siltstone contact 18 .9 60 Sandstone-siltstone-sandstone 1,871 3 75 Siltstone <.001 90 Lyons coal 1,859 .18 115 Siltstone <.001 132 Dorchester coal 1,846 .11 150 Siltstone <.001 170 Sandstone-siltstone contact <.001 190 Siltstone <.001 212 Sandstone-siltstone contact <.001 225 Norton coal 1,806 .14
w Table 3 . Lithologic descriptions, potentiometric heads, and transmissivities for test intervals in coal-exploration coreholes in the coal fields of southwesternA
Virginia-Continued
Transmisivitya Altitude of Altitude of Depth to top ofd Corehole USGS land surface Topographic standing water test interval Formation name or Potentiometric (feet square per day)
local headnumber number (feet above setting (feet above (feet below lithologic description (feet above Constant-head Modified Standard n sea level) sea level) land surface) sea level) injection slug test slug testT a test
an A 44 9E9 2,420 S 2,288 82 Sandstone -- <0.001 V1 " 110 Sandstone-shale-sandstone -- <.04 y 135 Sandstone-siltstone-sandstone 2,318 <.0060 159 Shale 2,288 36 ar 185 Siltstone -- < .001a n 213 Kelly coal 2,283 .42 0 240 Sandstone -- < .001c0 c 280 Sandstone -- < .001
312 Imboden coal 2,269 .3 aA 335 Sandstone-siltstone contact -- <001 T 351 Imboden marker coal 2,265 .170 45 11E12 1,800 V 1,790 80 Siltstone 1,790 >66F
125 Sandstone -- <001 n 145 Kennedy coal 1,790 .050 w 200 Sandstone-siltstone contact -- <.00100 230 Siltstone 1,798 .07w
273 Aily coal 1,794 .04 oa 330 Siltstone -- <0010a n 369 Raven coal 1,775 .05 H 410 Sandstone -- <.0010 y 46 11E13 2,000 S 1,950 85 Siltstone -- <.0010c 120 Siltstone-shale-siltstone 1,940 <.001s F 210 Sandstone-siltstone contact -- <.001
310 Siltstone -- <.001 3 392 Kennedy coal 1,886 .04
420 Sandstone -- <.001 as 470 Siltstone-sandstone contact -- <.001
500 Sandstone -- <.001 531 Aily coal 1,883 .03 557 Sandstone-siltstone contact -- <.001 580 Siltstone -- <.001 628 Raven coal 1,846 .1 660 Sandstone -- < .001
47 17F1 2,820 S 2,653 100 Siltstone -- < .001 150 Lee coal -- .12 183 Shale-sandstone contact 2,654 .02
--
--
----
----
--------
--------------
----
--
Table 3. Lithologic descriptions, potentiometric heads, and transmissivities for test intervals in coal-exploration coreholes in the coal fields of southwestern Virginia-Continued
Corehole number
USGS local
number
Altitude of land surface (feet above sea level)
Topographicsetting
Altitude of standing water (feet above sea level)
Depth to top of test interval (feet below land surface)
Formation name or lithologic description
Potentiometric head
(feet above sea level)
Standard slug test
(feetTransmisivity square per day)
Constant-headinjection Modified
test slug test
47-Continued 220 Sandstone <0.001 245 Castle coal 2,655 .6 320 Siltstone <.001 358 Upper Seaboard coal 2,581 .05 390 Sandstone .02 420 Siltstone < .001 440 Lower Seaboard 2 coal 2,574 .04 451 Lower Seaboard 1 coal 2,568 .05
48 12F3 2,000 H 1,887 150 Lyons 1 coal 1,874 2 165 Sandstone <.001 183 Sandstone-shale-sandstone <.001 203 Dorchester coal 1,848 .6
49 12F4 1,900 H 1,773 65 Sandstone-siltstone-sandstone 5 .3 85 Sandstone 29.2 103 Sandstone-siltstone contact 3 123 Sandstone-siltstone-sandstone 22 140 Lyons 2 coal 1,770 2.1
50 12G2 1,840 H 1,571 155 135
Lyons 1 coal Sandstone-siltstone contact
1,767 .7 <.001
165 Splashdam 2 coal .4 185 212
Splashdam 1 coal Sandstone-shale contact
<.04 <1 .2
240 Siltstone-sandstone contact <.001 270 Siltstone <.001 285 Sandstone-siltstone contact < .001 305 Sandstone with coal 1,577 <8 325 Sandstone-siltstone contact <.001 360 Siltstone < .001 440 481
Kennedy coal Siltstone-sandstone-siltstone
1,533 .25 <.001

------
----------
------------------
w Table 3. Lithologic descriptions, potentiometric heads, and transmissivities for test intervals in coal-exploration coreholes in the coal fields of southwestern Virginia-Continued
a w c n nSfUtN
Corehole number
USGS local
number
Altitude of land surface (feet above sea level)
Topographic setting
Altitude of standing water
(feet above sea level)
Depth to top of test interval (feet below land surface)
Formation name or lithologic description
Potentiometric head
(feet above sea level)
Standard slug test
(feet Transmisivity square per day)
Constant-head injection Modified
test slug test
51 12G3 1,900 H 1,681 135 Ha9y coal 8 .9 160 Sandstone .09 215 Siltstone >59
°. 242 Splashdam coal 1,676 .96 270 Sandstone <.001
°' n 320 Siltstone <.001 0 365 Sandstone <.001 0 a 420 Siltstone <.001
472 Siltstone <.001 500 Kennedy coal 1,585 .14
;, 535 Sandstone-siltstone contact <.001
F 580 Sandstone <.001 52 15G18 2,160 S 1,713 280 Kennedy coal .14
n 320 Sandstone <.001 438 Sandstone .33
a+ 449 Raven 2 coal <.001 460 Sandstone <.001
°° a 490 Siltstone <.001 ° n 570 Siltstone <.001 Vl
HMA
C Z 03.