soil characteristics and ground damage
TRANSCRIPT
SPECIAL ISSUE OF SOILS AND FOUNDATIONS 109-118, Jan. 1996
Japanese Geotechnical Society
SOIL CHARACTERISTICS AND GROUND DAMAGE
KENJI ISHIHARA'), SUSUMU YASUDAii) and HIDEO NAGASEiii)
ABSTRACT
Soil conditions in reclaimed islands which were devastated by extensive liquefaction during the Kobe earthquake are described together with the soil strength which was obtained from the laboratory tests on undisturbed samples.Interpretation of this soil strength is given in the light of back-calculated shear strength based on accelerations recorded on the ground surface.
Observed settlements of the ground surface resulting from liquefaction are described and evaluated in terms of the values estimated based on existing methodology. Finally, the outcome of an in-situ survey on permanent deformations of the land areas behind a quaywall or revetment is presented. As a result it was possible to identify the characteristic patterns of the displacements which vary with the distance from the waterfront inland.
Key words: coarse-grained soil, earthquake, liquefaction, settlement (IGC: D7/E8)
INTRODUCTION
The violent ground shaking during the Hyogoken-
Nambu earthquake caused landfills in the port area to li-
quefy leading to widespread occurrence of ground defor-mation including settlement and lateral spreading. As a
result of the ground distortion, various types of damage
were incurred by infrastructure such as lateral shifting of
quaywalls, breakage of gas and water mains. The landfills in the several affected areas were first reclaimed
around 1953 by transporting soil from borrow areas at
the foothill of the Rokko Mountains. Large amount of
the soils was transported by a long-distance belt conveyer
system to the sites of reclamation along the old shoreline.
Several islands north of Rokko Island were constructed
during this period. The second phase of land reclamation
began in 1968 to construct two large man-made islands
further offshore to the south. Port Island with an area of
436 hectare was constructed during the period from 1966
to 1980 by transporting soils from Suma which were car-ried in bottom dump-barges and placed under water at
the site of reclamation. The 580 hectare-Rokko Island
was constructed between 1972 and 1990 by excavating
soil materials from Suma and also from other sites in the
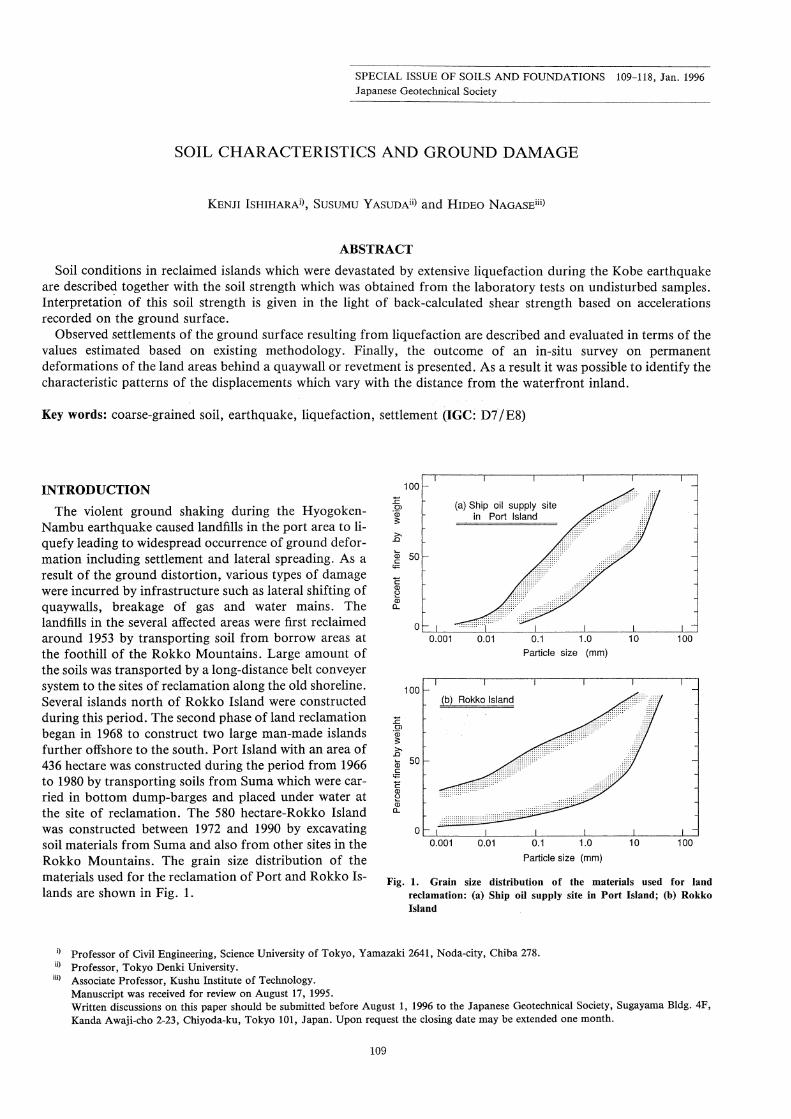
Rokko Mountains. The grain size distribution of the
materials used for the reclamation of Port and Rokko Is-lands are shown in Fig. 1.
(a) Ship oil supply site in Port Island
(b) Rokko Island
i) Professor of Civil Engineering, Science University of Tokyo, Yamazaki 2641, Noda-city, Chiba 278.ii)
Professor, Tokyo Denki University.iii) Associate Professor, Kushu Institute of Technology.
Manuscript was received for review on August 17, 1995.Written discussions on this paper should be submitted before August 1, 1996 to the Japanese Geotechnical Society, Sugayama Bldg. 4F, Kanda Awaji-cho 2-23, Chiyoda-ku, Tokyo 101, Japan. Upon request the closing date may be extended one month.
Fig. 1. Grain size distribution of the materials used for land
reclamation: (a) Ship oil supply site in Port Island; (b) Rokko
Island
109

110 ISHIHARA ET AL.
LABORATORY TESTS
Prior to the earthquake a series of cyclic triaxial tests was performed by Nagase et al. (1995) on undisturbed samples of Masado soils recovered from the bottom of a cut. The location of the excavation is shown in Fig. 2. The reclaimed site in the northern section of Port Island was excavated to provide an approach to the gate of a freeway tunnel which was under construction. Un-disturbed samples were recovered in block and frozen in the field before they were brought to the laboratory. Af-ter carefully trimming into specimens 7.5 cm in diameter and 15 cm in height, they were placed in the triaxial cham-ber and consolidated to varying effective ambient pres-sures. In some tests, the consolidation pressure was reduced to produce a state of overconsolidation with the OCR-value of 2 and 4.
The grain size distribution curves of the samples tested are shown in Fig. 3 where it can be seen that the soil con-
〓ists of about 5% fines, 55% gravel and 40% sand. The
gravel is defined here as a material having a grain size larg-
er than 2 mm, and the fines as the soil having a particle
size smaller than 0.074 mm. It should be noted that the
Masado soil prevailing in the coastal area of Kobe is well-
graded, containing a fairly large proportion of gravel.Such a soil has generally been considered as a material
practically "immune to liquefaction" and not been specified for detailed studies in the laboratory as well as
in the field.
The results of the cyclic loading tests are presented in
Fig. 4 in terms of the cyclic stress ratio plotted versus the
Fig. 3. Grain size distribution curve for the Masado soil tested
Fig. 4. Cyclic stress ratio versus number of cycles (Nagase et al. 1995)
Fig. 2. Locations of the recording house and displacement measurements behind a quaywall in Port Island

SOIL CHARACTERISTICS AND GROUND DAMAGE 111
number of cycles required to produce cyclic softening with development of 5% double-amplitude axial strain in the sample. Figure 4 indicates that the cyclic strength, de-fined as the cyclic stress ratio causing 5% D.A. axial
strain in 20 cycles of load application, is about 0.18 for normally consolidated samples, which is a value common-ly encountered in a loose to medium loose sand in a nor-mally consolidated state. It can also be seen in Fig. 4 that the cyclic strength increases significantly with increasing ratio of overconsolidation, taking on a value of 0.3 and 0.4, respectively, for the OCR of 2 and 4. The influence of OCR as stated above may be put in an empirical for-mula,
(1)
where (a di I 26 0')N and (6dr/2600cR denote respectively the cyclic strength of normally and overconsolidated specimens. The exponent n was shown to have a value of 0.5 by Ishihara and Takatsu (1978) based on cyclic triaxi-al tests on clean sand. Nagase et al. (1995) showed a value of n= 0.40-0.45 for the undisturbed samples obtained from the site in Port Island.
Another set of triaxial test results on undisturbed sam-
ples from Port Island was performed by Yasuda (1990).The samples were recovered by what is called triple-tube sampling and tested using the cyclic triaxial test appara-tus. The outcome of these tests is presented in Fig. 7, together with data for the case of OCR= 1 and 2 by Nagase et al. (1995) quoted from Fig. 4. It may be seen that the test data from Yasuda (1990) shows a cyclic strength of about 0.25 for 20 cycles of load application which is a value larger than the data obtained by Nagase et al. (1995) for the case of OCR =1.0.
RELATIVE DENSITY INTERPRETATION
According to the method of JSSMFE (Japanese Soci-ety of Soil Mechanics and Foundation Engineering), it is stipulated that the maximum and minimum void ratio emax and ernin be determined for the predominantly sand
portion having particle size smaller than 2 mm while keep-ing its fines passing #200 mesh less than 5%. For the Masado soil, emax and emin were determined by Nagase et al. (1995) in accordance with these requirements, yielding values of ern.=1.098 and emin = 0.526. These values may well be taken as the limiting void ratios for the sand por-tion contained in the Masado soil.
The void ratio of the sand portion in the undisturbed samples can be determined without difficulty as follows.Suppose the gross void ratio of an undisturbed sample is assumed to be e= 0.48, for example. If the gravel frac-tion having particle size larger than 2 mm is 42% in weight, then the void ratio for the silt-sand portion e, can be readily calculated as es= 0.48/ (1-0.42) = 0.828. The void ratio thus determined for the silt-sand portion may be considered to represent the state of packing of the major constituent of soil which was responsible for the in-ducement of liquefaction during the Kobe earthquake.
The limiting void ratios determined above by the method of JSSMFE are thus taken as the upper and lower bounds of the possible values of void ratio es for which the relative density of the silt-sand portion can be most logically defined. In the particular example stated above, the relative density is determined as 47% for the silt-sand portion. The relative density thus obtained is indicated in Fig. 4 for the specimens used in the cyclic triaxial tests on the undisturbed specimens from the site of Port Island. It may be seen that the cyclic strength as correlated with the relative density for the gravel containing silty sand is about the same as the correlation between these quanti-ties that have been _established for clean sand or silty sand. It should be noted therefore that if the relative den-sity is determined for the silt-sand matrix by scalping the oversized gravel portion, it may be used as an index
property to identify the liquefiability of a composite soil containing silt, sand and gravel. This concept is applica-ble only for the case of gravel content probably less then about 50% where gravel particles exist not in contact with each other in the matrix of silt and sand. For this condition, the presence of gravel may be assumed not to exert any influence on the overall resistance of the soil.
BACK CALCULATION OF CYCLIC STRENGTH OF SOIL
As described in the report by Toki (1995), a set of records was monitored by four accelerometers in a verti-cal array installed at a site in the northern part of Port Is-land. The soil profile and the time histories for two horizontal components obtained by Toki (1995) is repro-duced in Figs. 5 and 6. The manmade fill to the depth of 18 m is composed basically of the same Masado soil as that at the tunnel site where undisturbed samples for the laboratory testing were recovered. In view of the low SPT N-value, about 5 to 10, the cyclic softening due to li-quefaction appears to have taken place mainly in this near-surface deposit. In fact, the second thrust of acceler-ation in the south direction was shown to decline sig-nificantly at the surface (341 cm/sec) and at the depth of 16 m (340 cm/ see). A similar decrease in acceleration was also observed in the E-W component. It is, there-fore, highly likely that the cyclic softening due to li-
quefaction occurred during one to two cycles of seismic load application. In addition, it may be reasonable to as-sume that the peak acceleration at the onset of liquefac-tion was a= a.= 340 cm/ sec'. The cyclic stress ratio
ti ay' at any instant of seismic shaking is estimated by the equation
(2)
where a denotes the acceleration and cy, and a,' are the total and effective overburden pressures acting on a soil element located at a depth of Z (in meter). The depth of the ground water table at this location was estimated to be approximately 3 m. Introducing the value of a=
wainax= 340 cm/ see and g = 980 cm/ see, the maximum

112 ISHIHARA ET AL.
stress ratio that must have been applied to soil elements
at varying depths can be calculated. The maximum stress
ratio thus computed from field observations was found
to increase with increasing depth, to magnitudes of about
0.5 to 0.7 at shallow depths. This cyclic stress ratio is plot-
ted in Fig. 7 versus the number of cycles which are as-
sumed to be one to two as mentioned above. It should be
noted that the cyclic stress ratio plotted is expressed in
terms of the maximum stress divided by the mean
confining stress co instead of the effective overburden
stress ay'. The conversion from az,' to a was made simply
through the use of the following relationship
(3)
where K0 is the coefficient of earth presure at rest. This conversion represents the computed data in a way that
permits direct comparison with the laboratory test data.While an estimate of an exact KJ-value is somewhat difficult, an assumed value between 0.5 and 0.75 is consi-dered reasonable. Based on these values, the cyclic stress ratio Tmax / Go was calculated and is shown in Fig. 7.
Comparing the two sets of data, one from the laborato-ry and the other from the computation based on field measurements, it can be mentioned that the laboratory cyclic strength is almost coincident with the value of cyclic strength computed from the observed acceleration at the time of strong shaking during the Kobe earth-quake.
Fig. 5. Soil profile at the site of vertical array of seismograph (Toki,
1995)
Fig. 6. Accelerations recorded at the site on Port Island (Told, 1995)

SOIL CHARACTERISTICS AND GROUND DAMAGE 113
GROUND SETTLEMENT FOLLOWING LIQUEFACTION
Following the earthquake, a large amount of silt- or sand-laden water spurted through pavement joints and in the shrubbery zone along the roads and spread over on the roads and paved areas. Figure 8 shows a mud puddle about 50 cm deep covering a wide area in Port Island.The shrubbery on the roadside is seen being splashed by the mud. Figure 9 shows the top of cast-in-place concrete
piles that had protruded about 50 cm above the ground surface as a result of overall settlement of the surround-ing ground due to extensive liquefaction. The settlement of the ground surface sufficiently far from the waterfront was estimated by surveying the difference in elevation be-tween supposedly subsided flat ground areas and objects
such as pile-supported buildings which were apparently free from any settlement. The results of such surveys made at many locations in the flat area of Port Island and Rokko Island are presented in Fig. 10. It may be seen that the settlements observed varied in a wide range with a maximum of 90 cm on Port Island. The average value of settlements was 50 cm on Port Island and 40 cm on Rokko Island.
The procedures for estimating ground settlements resulting from liquefaction have been developed by vari-ous researchers. Figure 11 shows a chart prepared by Ishihara and Yoshimine (1991) for estimating the post-li-
quefaction settlements of sand deposits. In this proce-dure, the volumetric strain is estimated as a function of the factor of safety Fi if the density of a deposit is made known in terms of SPT N-value or CPT qcvalue. If the
Fig. 7. Summary plot of cyclic strength from laboratory tests and from compution
Fig. 8. Photo at a location on Port Island taken one day after the
earthquake
Fig. 9. Top of cast-in-place piles protruding above the ground surface

114 ISHIHARA ET AL.
near-surface soil deposit is assumed to have developed li-
quefaction with the development of single-amplitude
shear strain of about Tn.= 3.5%, the factor of safety is
estimated from the chart as having been near unity at the
onset of liquefaction. SPT Nrvalue is estimated from the
boring data in Fig. 5 as being N1=6-10. Entering the
chart with these values, the post-liquefaction volumetric
strain is estimated to be approximately ev = 2 4%. Since
the liquefaction appears to have penetrated to a depth of
about 15 m below the ground water table, the settlement
is calculated as (0.02•`0.04) x 15 m = 30 60 cm. This
value is approximately in the range of observed settle-
ments shown in Fig. 10. It should be noted, however,
that the chart in Fig. 11 has been established based on the
laboratory test data on clean sands and a more exact
chart like the one in Fig. 11 should be established for the
gravel-containing silty sand such as that encountered in
the area affected by the earthquake in Kobe.
LATERAL DISPLACEMENT
It has been known that a soil deposit which softens as a
result of liquefaction starts to move laterally if the
ground is sloped or if there is a difference in elevation on the surface. The most conspicuous lateral displacement in the Kobe earthquake took place in the ground surface
which is located behind the revetment line in the Kobe
harbour area. Actually, about 25 km of quaywall line
suffered damage involving outward displacement of
about 1--- 3 m as a result of liquefaction having taken
place in the soil behind or possibly underneath the wall.The caisson blocks used for the quaywall construction
sank and moved extensively towards the sea, accompa-
nied by equally large movements of soil backfills behind
the wall. This movement successively propagated rear-
wards, bringing about varying degrees of damage to in-
dustrial facilities and storage tanks located there. The
lateral displacements were generally large near the water-
front and decreased with distance inland.
In order to identify the pattern of the retrogressive dis-
placements, measurements of lateral movement were made on the ground by surveying openings of ground
cracks starting from a point which is located sufficiently
inland where there are no cracks observed. By summing
up successively the width of the crack openings from the
fixed inland point, the lateral displacements in the direc-
tion perpendicular to the revetment line were obtained as
a function of the distance from the waterfront. Measure-
ments were also made of vertical offsets of the crack open-ings and local slope between two successive cracks by
means of an inclinometer. By summing up successively
the local settlements thus obtained, it became possible to
obtain a pattern of settlement distribution as it varies in-
land in the direction perpendicular to the revetment line.
An example of such measurements is presented in Fig. 12
for a cross section of the northern wharf in Port Island.
As indicated in the inset, the quaywall at this location
was constructed by placing concrete caissons 6 m high
and 4 m wide on top of a mound composed of dumped
Fig. 10. Settlements observed on the ground surface at Port and
Rokko Islands
Fig. 11. Post-liquefaction volumetric strain as functions of factor of
safety against liquefaction

SOIL CHARACTERISTICS AND GROUND DAMAGE 115
stone. The soft silty soil in the original seabed was initial-
ly removed down to a depth of 11 m from the mudline
and replaced with Masado soil up to an elevation of 7 m
below the sea water level. Stones were then hauled to the
site and placed in open water to construct the mound. Be-
hind the caissons, the Masado soil was placed directly
over the soft seabed deposit. In the particular example
shown in Fig. 12, the lateral displacement was found to
have propagated backward for a distance of 74 m. The
lateral displacement at the quaywall is shown to be 3.05
m and a settlement of 1.99 m occurred. Apparently,
these settlements do not include the overall land subsi-
dence due to liquefaction which must have occurred
almost equally over the waterfront area surveyed in this investigation.
A similar survey of the ground distortion was made at
several locations along the quaywall line in the area of Port Island. The exact locations are shown in Fig. 2. The
results of such in-situ survey are summarized in Fig. 13
where the lateral displacements are plotted versus the in-
Fig. 12. Ground deformation behind a quaywall in Port Island
Fig. 13. Distribution of lateral displacement behind the quaywall

116 ISHIHARA ET AL.
land distance from the waterfront. It may be seen that
the lateral displacement decreases with increasing dis-
tance from the waterfront, but in some instances it propa-
gated as far back as 150 m from the revetment line. A dis-
placement of about 50 cm still existed at a location 50 m behind the waterfront, if the quaywall was displaced sea-
wards by 2.0 to 3.0 m as a result of liquefaction in the sur-
rounding soil deposit. The lateral displacements at any
distance inland are divided by the displacement at the
revetment line and shown in Fig. 14. The curves normal-
ized in this way indicate a general pattern in which the
lateral displacement is distributed.
The distribution of ground settlements in the direction
perpendicular to the quaywall line is shown in Fig. 15 in a summary form where it is also seen that the ground subsi-
dence tends to decrease with increasing distance from the
waterfront. The measured displacements as stated above
are apparently associated with the ground distortion
Fig. 14. Normalized distribution of lateral displacement behind the quaywall
Fig. 15. Settlement of the ground surface behind the quaywall
SOIL CHARACTERISTICS AND GROUND DAMAGE 117
which is manifested on the surface as differential settle-ment or uneven movements.
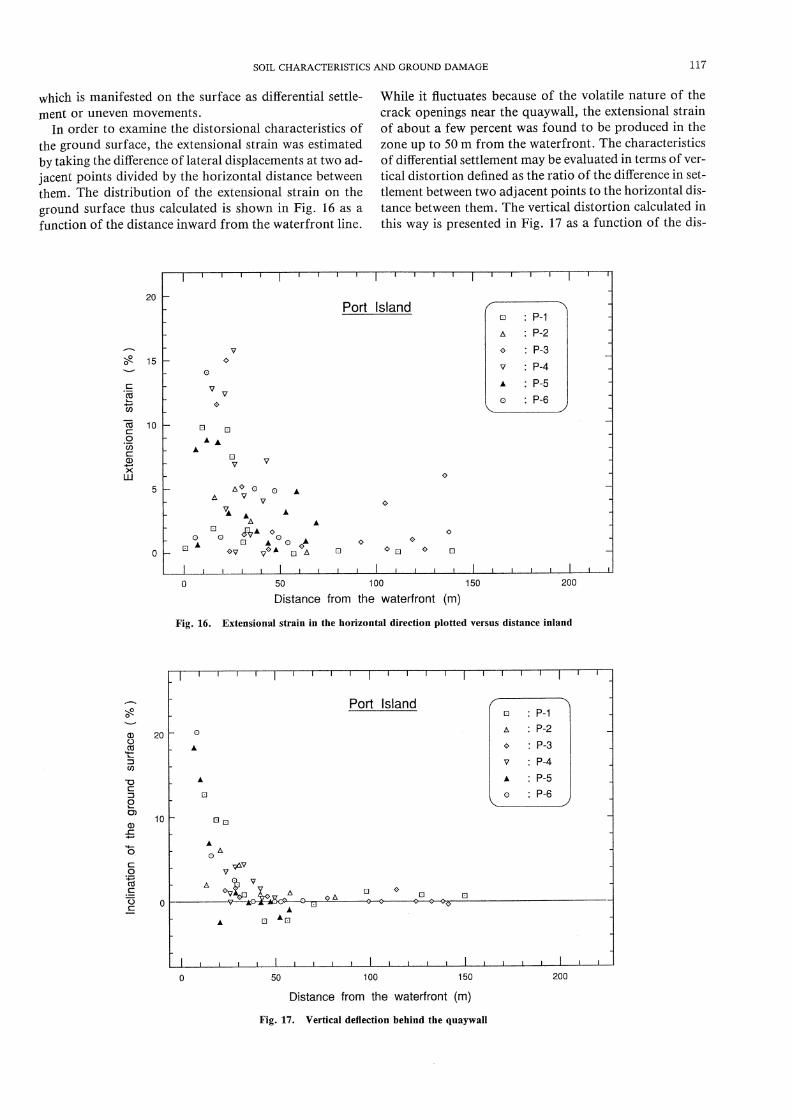
In order to examine the distorsional characteristics of
the ground surface, the extensional strain was estimated by taking the difference of lateral displacements at two ad-
jacent points divided by the horizontal distance between them. The distribution of the extensional strain on the
ground surface thus calculated is shown in Fig. 16 as a function of the distance inward from the waterfront line.
While it fluctuates because of the volatile nature of the crack openings near the quaywall, the extensional strain of about a few percent was found to be produced in the zone up to 50 m from the waterfront. The characteristics of differential settlement may be evaluated in terms of ver-tical distortion defined as the ratio of the difference in set-tlement between two adjacent points to the horizontal dis-tance between them. The vertical distortion calculated in this way is presented in Fig. 17 as a function of the dis-
Fig. 16. Extensional strain in the horizontal direction plotted versus distance inland
Fig. 17. Vertical deflection behind the quaywall

118 ISHIHARA ET AL.
tance inward from the waterfront line. It should be noted that the vertical distortion defined above is equal to the lo-cal inclination of the ground surface. While it could fluc-tuate locally, the maximum value of aligned inclination was shown to be about 5% in the belt zone in close prox-imity to the quaywall line.
CONCLUSIONS
As a result of the cyclic triaxial tests made on un-
disturbed samples, the Masado soil used for landfilling in
the Kobe area was shown to exhibit resistance to liquefac-
tion which is mostly equivalent to that for loose to medi-
um loose clean sand. This cyclic strength was also shown
to coincide approximately with the value estimated from
computations based on recorded accelerations at the
ground surface.The settlements surveyed at Port and Rokko Islands in-
dicated values as high as 40 to 50 cm on the average.
These values were also shown to be approximately coinci-
〓nt with those estimated from a current analytical
method.
Measurements were made of both lateral and vertical
displacement of the ground surface behind the revetment
line which were devastated by the earthquake. As a
result, the patterns of distribution of lateral and vertical
displacement were made known to be functions of the dis-
tance inward from the waterfront. It was shown that if
the quaywall is displaced seawards by an amount of the
order of 2 m, the displacement can progress successively
for a distance of 150 m from the revetment line.
ACKNOWLEDGMENTS
The measurements of displacements behind the quay-
wall were made by Dr. K. Ito of Konoike Co. with the as-
sistance of the Kobe city office. Their cooperation and as-
sistance are gratefully acknowledged. The acceleration
records obtained at Port Island were provided through
the courtesy of Dr. Y. Iwasaki of Geo- Research Institute
Osaka.
REFERENCES
1) Ishihara, K. and Takatsu, H. (1979): "Effects of overconsolidation and Ko conditions on the liquefaction characteristics of sand", Soils and Foundations, Vol. 19, No. 4, PP. 59-68.
2) Nagase, H., Shinji, R., Kimura, K. and Tsujino, S. (1995): "Li-
quefaction strength of undisturbed sand subjected to overconsoli-dation", Proc. 1995 Annual Convention of Japanese Society of Soil Mechanics and Foundation Engineering.
3) Yasuda, S. (1990): from private file.4) Ishihara, K. and Yoshimine, M. (1991): "Evaluation of settlements
in sand deposits following liquefaction during earthquakes", Soils and Foundations, Vol. 32, No. 1, PP. 173-188.
5) Toki, K. (1995): Committee of Earthquake Observation and Research in the Kansai Area.