hunter douglas annual report 2013 - nasdaq omx...
TRANSCRIPT

2013Annual Report
Operational Headquarters
• Rotterdam, The Netherlands World Headquarters and European Operations
• Lucerne, Switzerland Management Office
• Pearl River, NY, USA North American Operations
• São Paulo, Brazil Latin American Operations
• Kuala Lumpur, Malaysia Asian Operations
1
Financial highlightsTwo-year summary 2
Directors’ ReportChairman’s letter 3
History 4
Innovations 5
Window Coverings 10
Architectural Products 12
Research and Development 15
Manufacturing 15
Worldwide distribution system 16
Marketing 16
Education, Corporate Citizenship and Employment 18
Strategy 18
Corporate Governance 19
Financial Risk Management 20
Objectives 20
Sensitivity to External Factors 20
Worldwide sales 21
Financial information by region 21Europe 22North America 24 Latin America 26Asia 27
Financial statements 30
Additional informationIndependent auditor’s report 64Appropriation of profits 64Shareholders’ meetings 64Dividends 64Audit and Compensation Committees 64
Five-year summary 65
Operating companies 66
Directors and Officers 68
Contents
Hunter Douglas Annual Report 2013 ❯ Contents
Hunter Douglas is the world market leader in window coverings and a major manufacturer of architectural products.
Hunter Douglas has its Head Office in Rotterdam, the Netherlands, and a Management Office in Lucerne, Switzerland.
The Group is comprised of 169 companies with 68 manufacturing and 101 assembly operations and marketing organizations in more than 100 countries.
Hunter Douglas employs about 17,000 people withsales in 2013 of USD 2.6 billion.
Operating Style
Hunter Douglas is professionally managed by entrepreneurial managerswho run our business as their own.
Dynamic and performance oriented
Decentralized organization structure- Global federation of small and medium-sized companies- Guiding principle: ‘Maximum accountability with minimum interference’
Innovative proprietary products
Creative marketing and promotional programs
Strong brands: HunterDouglas® in North America and Asia, and for Architectural Products worldwideLuxaflex® for residential window coverings in the rest of the world

2
Financial highlightsTwo-year summary
USD millions EUR per common share
Notes | 2013 | | 2012* | Notes | 2013 | | 2012* |
Net Sales 2,636 2,588
Earnings before interest, tax, depreciation and
amortization
(before non-recurring restructuring expenses) 261 257 3 5.65 5.69
Income from Operations
(before non-recurring restructuring expenses) 170 165
Net Profit from Operations
(before non-recurring restructuring expenses) 118 131 3 2.55 2.90
Non-recurring restructuring expenses -12 -45
Net Profit from Operations
(after non-recurring restructuring expenses) 106 86 3 2.30 1.91
Net Result Investment Portfolio 1 15
Total Net Result 1 107 101 3 2.32 2.24
Operating Cash flow 220 154 3 4.75 3.40
Investments in tangible fixed assets 69 77
Depreciation property, plant and equipment 83 86
Net Assets Employed 2 1,619 1,832
Shareholders’ equity 1,124 1,075 4 23.46 23.45
Return on equity 9.7% 9.5%
Dividend 5 1.25 1.25
RONAE:
(Return before interest/net assets employed) 10.4% 9.9%
Employees (at year-end) 16,932 17,012
1 Net Result attributable to equity shareholders2 Total assets (excl. Investment Portfolio) minus non-interest-bearing current liabilities3 Based on the average number of shares outstanding during the affected year4 Based on the number of shares outstanding at year-end, adjusted for treasury shares5 Proposed for 2013
* restated, see note 2.
Hunter Douglas Annual Report 2013 ❯ Financial highlights

3
2013 was a better year for Hunter Douglas.
❯ Consumer demand and housing markets improved in the US, were good in Latin America, but remained weak in Europe; while in Asia sales were higher but results continued to be affected by project delays.
❯ Our European and Australian operations have, with further restructurings, been adjusted to current conditions, so that they are now well positioned for the future. We also expect better results from our China operations and their new factories.
Sales: were USD 2.636 bln; 1.9% higher than in 2012.
Sales volumes (excluding acquisi-tions and currency effects) were 5% lower in Europe, 5% higher in North America, 5% higher in Asia, 10% higher in Latin America and 5% higher in Australia.
Earnings before interest, tax, depreciation and amortization – EBITDA (before non-recurring restructuring expenses): were USD 261 mln, 1.4% higher than USD 257 mln in 2012.
Income from Operations (before non-recurring restructuring expenses): was 3.5% higher at USD 170 mln compared with USD 165 mln in 2012; higher in all areas.
Non-recurring restructuring expenses: were USD 12 mln compared with USD 45 mln in 2012. These relate to the European and Australian operations.
Net profit from Operations (after non-recurring restructuring expenses): USD 106 mln com-pared with USD 86 mln in 2012.
Total Net Result: USD 107 mln (per share EUR 2.32), compared with USD 101 mln in 2012 (per share EUR 2.24).
AcquisitionsWe have been marketing our Hunter Douglas branded window coverings in the US through both independent licensed fabricators and our own Fabrication Division. Due to changed industry condi-tions, we made a strategic decision to move to a one-step distribution model for our Hunter Douglas branded products. Towards that objective, we acquired 2 additional fabricators in 2013 with combined sales of USD 12 mln and merged their businesses with our Fabrication Division. Plans have also been made to absorb the Hunter Douglas branded sales of the remaining 3 independent fabricators into our Fabrication Division during 2014. This change in strategy is expected to enhance the fabrication and marketing efficiencies of our US operations.
Capital Expenditures in 2013 were USD 69 mln, while deprecia-tion was USD 83 mln.Investments were focused on new products and efficiency improve-ments as well as the completion of two new plants in Asia.In 2014, capital expenditures will be about USD 70 mln and depreciation USD 80 mln.
Operating Cash flow in 2013 was USD 220 mln compared with USD 154 mln in 2012.
Dividend: The Directors propose a Dividend for 2013 of EUR 1.25 per Common share, the same as in 2012.
Financing: All borrowings are covered by committed long term facilities.
Outlook: We expect improving economic conditions in the US and Asia, stable conditions in Latin America, but an ongoing challeng-ing environment in Europe until consumer confidence and housing markets recover.
Hunter Douglas is in a strong position in terms of its products, distribution, finances and management.
The people of Hunter Douglas are our most important and valuable asset. They create, make and market our products and are responsible for our continuing success. The Board and I express our sincere thanks and appreciation for their contributions, dedication and support.
Chairman’s letterTo our shareholders
Hunter Douglas Annual Report 2013 ❯ Chairman’s letter
Ralph SonnenbergChairman & Chief Executive Officer
Ralph Sonnenberg – Chairman & CEODavid & Marko Sonnenberg –Co-Presidents & COO’s

4
1919-1946In 1919 Henry Sonnenberg founded a machine tool distribution and subsequently manufacturing company in Düsseldorf, Germany.
In 1933 he moved to the Netherlands and established a machine tool operation.
In 1940, he moved to the United States where he founded the Douglas Machinery Company.
In 1946 Henry Sonnenberg established a joint venture with Joe Hunter which developed new technology and equipment for the continuous casting and fabrication of aluminium. This led to the production of lightweight aluminium slats for Venetian Blinds.
Hunter Douglas, as we know it today, was born.
1946-1960Hunter Douglas aluminium blinds quickly gained leadership in the American market. As innovative as the product was the busi-ness model for its distribution. Hunter Douglas developed a vast network of more than 1,000 independent fabricators in the United States and Canada. They sold blinds during the day and custom assembled them in their workrooms at night.
In 1956, policy differences led to the sale of the US business.Henry Sonnenberg moved Hunter Douglas’ headquarters to Montreal, Canada and, using the European machinery business as a base, concentrated on building the window covering business outside the United States.
1960-1980Hunter Douglas expanded its operations in Europe and into Australia and Latin America.
In 1969 the Hunter Douglas Group went public, and its shares were listed on the Montreal and Amsterdam Stock Exchanges.In 1971, Hunter Douglas’ Group headquarters were moved to Rotterdam, the Netherlands, and Hunter Douglas N.V., became the worldwide Group parent Company.
In 1976, Hunter Douglas reacquired its former US business.
1980-2000Hunter Douglas continued its global growth and expanded into Asia. The innovative spirit of the Company led to the development of revolutionary new products to meet the increasing demand for fashion and functionality.
1985 - Duette® Honeycomb Shades1991 - Silhouette® Window Shadings1994 - Vignette® Modern Roman Shades1996 - Luminette® Privacy Sheers and PowerRise®
battery-powered remote control system1999 - UltraGlide® retractable cord system
2000-20132000 - LiteRise® cordless system, EOS® hardware
system 2003 - Techstyle® Acoustical Ceilings 2004 - Facette® Shades,
The Alustra® Collection 2006 - Duette® Architella® Shades, Skyline™ Panels 2007 - Pirouette® Shadings, Platinum™ Technology
Motorization 2008 - Nano Roller Blinds 2010 - Vignette® Architella® Shades, RB 500 Roller
Shade System 2011 - Silhouette® Shadings with LiteRise®
2012 - Duette® Architella® Trielle™ Shades, Platinum™ App, Solera™ Soft Shades
2013 – Silhouette® A Deux™ Window Shadings
Hunter Douglas Annual Report 2013 ❯ History
HistoryGlobal time line 1919 - 2013

5
❯ Silhouette® A Deux™ Window Shadings
Innovations About envisioning what comes next
Ever since we created the aluminium blind in 1946, we have defined our industry with products that deliver revolutionary style and functionality. What’s more, our expertise in customization helps keep our customers around the world at the forefront of design.
Hunter Douglas Annual Report 2013 ❯ Innovations
❯ Screen Nature
Silhouette® A Deux™ Window ShadingsFurther enhancing the variable light control benefit that is at the core of all Silhouette® window shadings is the new Silhouette® A Deux™ option. It introduces a separate roller shade that sits behind the shading and operates indepen-dently to allow increased room darkening and privacy when called for. Both are integrated into one headrail to maintain a low profile and streamlined appearance.
UltraGlide® Retractable Cord SystemMerging streamlined beauty and enhanced safety together, our proprietary UltraGlide® retractable cord system is newly available on Hunter Douglas wood blinds and
roller shades. Its unique design provides a host of benefits includ-ing especially easy operation and enhanced child and pet safety.
Screen NatureThe only glass fibre fabric on the “green” market, Screen Nature 3% by Mermet® is highly efficient for solar protection and nonetheless an elegant fabric that is highly decora-tive thanks to the fineness of its 3% open weave. Screen Nature offers an array of environmental assets, 100% PVC-free, 100% polyester-free and 100% halogen-free. Light rays are filtered up to 96%. Its unique glass fibre structure makes it superb fire-resistant.
❯ UltraGlide® System on Wood Blinds & Roller Shades

❯ Pirouette® Window Shadings6
7
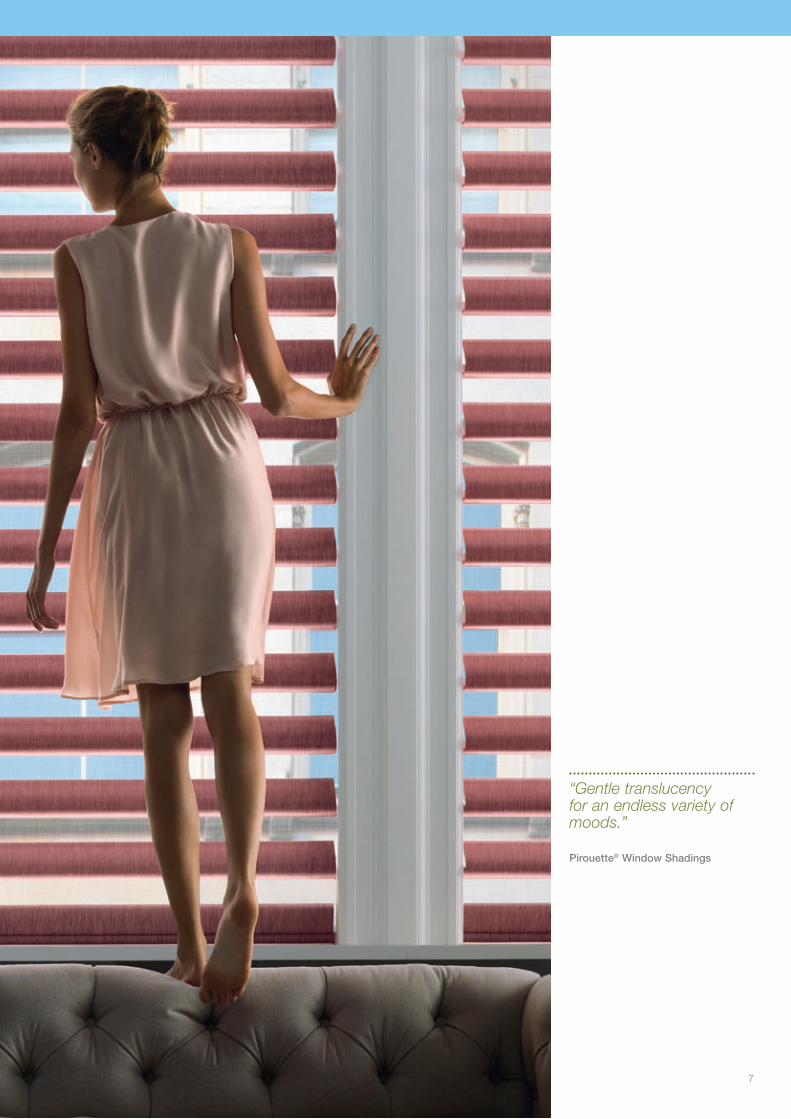
“Gentle translucency for an endless variety of moods.” Pirouette® Window Shadings

❯ Silhouette® Window Shadings8
9
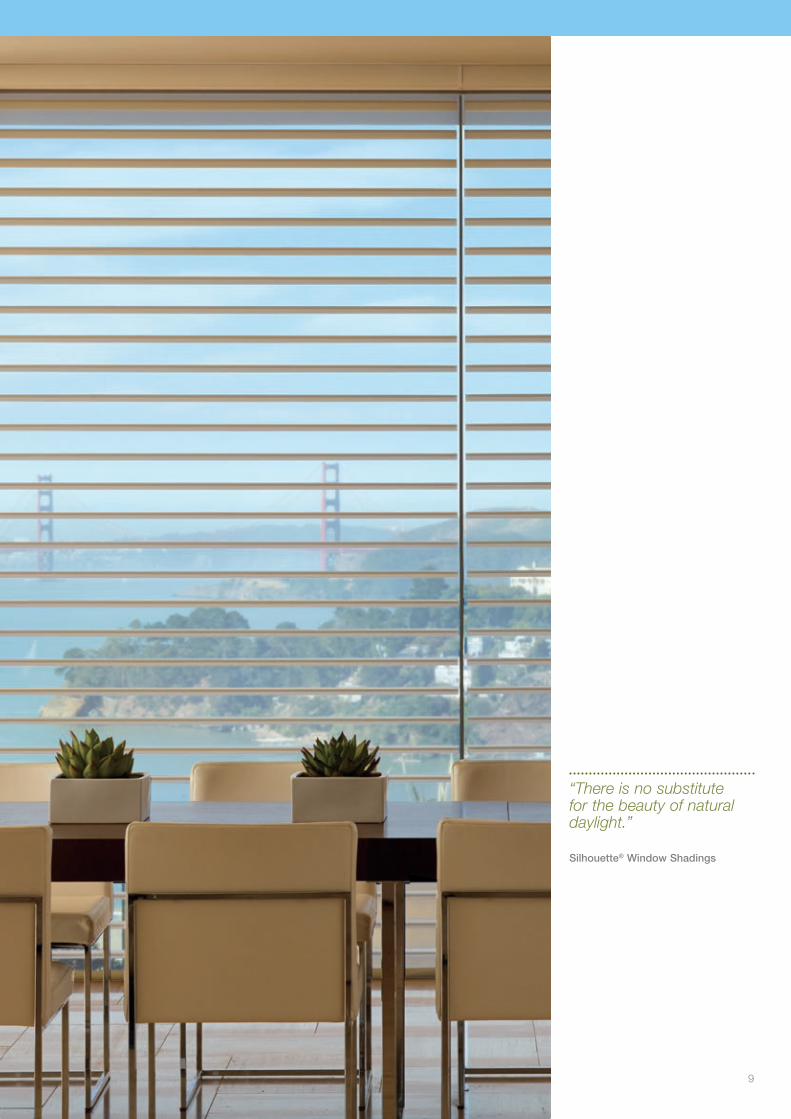
“There is no substitute for the beauty of natural daylight.” Silhouette® Window Shadings

10 Hunter Douglas Annual Report 2013 ❯ Window Coverings
Window Coverings
›❯ Our strength is our ability to develop and market innovative, high quality, proprietary products, targeted primarily at upscale consumers.
›❯ ›Our success is based upon trusted brand names recognized around the world: HunterDouglas®, Luxaflex®, Duette®, Silhouette® and Vignette®.
›❯ Our proprietary fabric shades are consistently recognized for excel-lence in design, styling, features, quality and breadth of selection: Duette® Honeycomb Shades, Silhouette® and Pirouette® Window Shadings, Luminette® Privacy Sheers, Vignette® Modern Roman Shades and Facette® Shades.
›❯ In addition to our proprietary design innovations, we offer a fully integrated and premium line of standard window covering
styles. These include Venetian and Vertical Blinds, Roman, Roller, Pleated and Woven Wood Shades, Wood and Alternative Wood Blinds and Custom Shutters. And Exterior Venetian Blinds, Screen Products, Shutters and Awnings.
›❯ We customize each window cov-ering to the individual consumer’s specific needs, and deliver that unique product typically within a week of ordering.
›❯ Our proprietary operating systems are equally innovative and unique. They offer ease of use, reliable performance, convenience and improved safety features, identi-fied by our ‘Designed with Safety in Mind’ logo. They also include the EOS® modular hardware system.
Silhouette® Window Shadings with UltraGlide® 2 Click and Walk Away™
A new take on UltraGlide™ retract-able cord operation on Silhouette® shadings, this enhanced version smoothly lowers and opens the shading with just a gentle pull on the cord. It also decreases the pull force needed to raise the shading by 50%. The retractable cord is designed to maintain a constant length that is out of reach of most young children for enhanced safety at the window.
Hunter Douglas is the world market
leader in window coverings.
❯ Solera™ Soft Shades
❯ Silhouette® Window Shadings with UltraGlide® 2 Click and Walk Away™

❯ Duette® Shades 11

12 Hunter Douglas Annual Report 2013 ❯ Architectural Products
Architectural Products
›❯ We focus on high-performance architectural materials with pro-prietary characteristics in design, comfort, and sustainability.
›❯ Our strength is our ability to develop customizable product systems, which assure reliable installation and enable design flexibility with minimal custom engineering.
›❯ Our success is based on giving architects a high degree of technical and design assistance in applying our products. We collaborate with architects and owners to realize their design objectives while also meeting functional needs such as light control, energy efficiency, and acoustics.
›❯ Our global network of specialized manufacturing facilities lets us deliver a broad, consistent range of solutions that can be adapted to local design requirements.
Sun-Control SolutionsHunter Douglas offers an unparal-leled breadth of solutions and expertise to manage heat and light inside and outside windowed walls. We are at the forefront of the emerging field of architectural solar-control products.
Ventilated Façade SystemsOur QuadroClad® ventilated façade system features lightweight skins fused to a honeycomb aluminium core that provides extreme strength and flatness. QuadroClad® panels are available in many specialty shapes and curves, as well as a wide range of colours.In 2007 the Group acquired NBK, a pioneering manufacturer of ter-racotta façades. NBK is today the market and quality leader in size, flatness, and design options for large terracotta panels.
Suspended CeilingsOur Luxalon® metal ceiling systems enable a wide variety of designs and applications, including curved and specialty shapes.
Our revolutionary Techstyle® acous-tical panels deliver superior noise reduction; a clean, monolithic look; and easy access to the plenum.
3form®
In 2007, Hunter Douglas acquired 3form®, the leading manufacturer of translucent architectural materials. 3form® panels in resin and glass give architects and interior design-ers the flexibility to play with colour, shape, texture, and transparency in a wide range of interior and exterior applications, including back-lit wall features, partitions, ceiling elements, horizontal surfaces, canopies, building accents and signage. Through its LightArt® division, the company also manu-factures a range of lighting fixtures based on these materials.
3form expanded its signature Full Circle program, a highly regarded and popular collection of products, which brings to life handcrafted materials from artisans around the world. These materials are designed and produced in collabo-ration with artisan communities and encapsulated in Varia Ecoresin.
Hunter Douglas is a world-leading
manufacturer of sun-control
solutions, suspended ceilings,
ventilated façade systems, and
translucent materials.
❯ Full Circle Itimba design

❯ Linear Ceiling 13
14 ❯ Manufacturing

15
Our Company
Hunter Douglas Annual Report 2013 ❯ Our Company
Research & Development
Hunter Douglas was founded on a tradition of bringing breakthrough products to market. At the beginning of the 21st century, our new product development has accelerated with the introduction of a number of innovative products, including Facette® Shades, EOS® Hardware systems, LiteRise® cord-less operating systems, Techstyle® Acoustical Ceilings and Duette® Architella® Shades.
›❯ We have specialized R & D Centres in the United States, the Netherlands, Germany, China and South Korea where products are currently under development for introduction in 2014, 2015 and beyond.
›❯ Around the world, our subsidiaries adapt products to respond to local market needs.
›❯ We are continually seeking, testing and developing new ideas and concepts that will enable Hunter Douglas to serve and grow our markets in future years.
›❯ Top priorities are the comfort and safety of the end users, the functionality and durability of our products and the evolving fashion and style needs of the marketplace.
›❯ We strive to simplify assembly, improve production processes, eliminate waste and reduce maintenance.
›❯ In 2014 we expect our R & D activities to remain at approxi-mately the same level as in 2013.
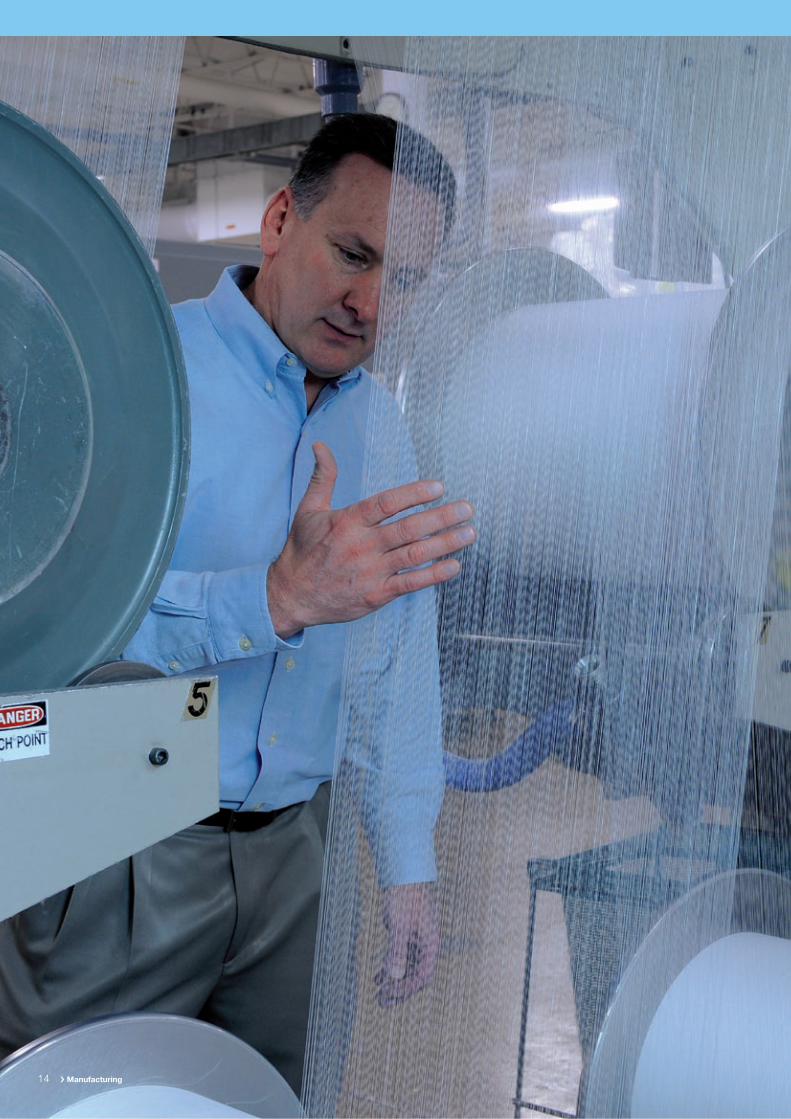
Manufacturing
Almost 70 years ago, Hunter Douglas pioneered a unique, continuous casting and integrated manufacturing process for aluminium, to produce painted aluminium strip, and from that the basic materials for many of our products. That innovative thinking has been applied to all aspects of our operation.
›❯ We have applied the lessons learned in manufacturing metal products to our fabric shades and have set the industry standard for forming fabrics into innovative designs that trap air in cellular pockets for superior insulation, softly diffuse harsh incoming light, provide privacy while preserving outside views and help protect furnishings from damaging UV rays.
›❯ Our proprietary innovations include the energy-efficient cells used in Duette® and Vignette® Architella® Shades; translucent sheer fabrics used in shades, sheers and shading systems; and the process for bonding diverse fabrics to yield products like Silhouette® and Pirouette® Window Shadings, Vignette® Modern Roman Shades and Luminette® Privacy Sheers.
›❯ We concentrate production of our principal products in a few efficient manufacturing locations around the world.
›❯ Process re-engineering and automation is a critical concept in a custom business, allowing us to better manage inventory and our other assets, lower costs, and serve our customers more quickly and efficiently.

16
Worldwide distribution system
Our distribution system is key to our business and an essential element in our marketing strategy. It is as distinctive as it is efficient.
›❯ We rely upon a worldwide network of several thousand independent and 101 company-owned fabricators to sell, assem-ble and distribute our products in local markets.
›❯ We closely support fabricators to ensure they consistently offer the best quality and service.
›❯ We provide sophisticated sampling, merchandising and training programs to enable our fabricators to establish strong dealer networks.
›❯ We provide support to over 100,000 retail dealers - the second tier in our distribution network. They rely upon us for sales and marketing programs; advertising and promotional campaigns; sampling, displays and signage; product education and business-building programs; technical service and assistance in computer-supported adminis-trative areas.
›❯ Proper installation of our products is key to lifetime performance and customer satisfac tion. We have expanded our training to assist the thousands of professional Hunter Douglas installers around the world.
›❯ Strong and enduring relationships have been forged between Hunter Douglas, our fabricators and our dealers. We consider them to be our strategic partners and the principal sales and marketing arms for our products.
Marketing
We want consumers who purchase Hunter Douglas products to have a thoroughly satisfying experience throughout their process of selecting, buying and living with our products. We have built an additive-process marketing program that builds awareness of and desire for our products and creates strong brand loyalty.
›❯ Brand awareness is built through many channels: print, broadcast and online advertising campaigns; a comprehensive consumer website; branded social media programs, retail merchandising and displays; relationship building with the trade and consumer press, as well as interior design-ers and architects; newspaper and magazine articles and editorials; sponsorship of special events and worthy charitable causes at the local, national and international levels.
›❯ Our messages are based upon extensive research into consumer needs, motivations and regional differences, enabling us to better understand what consumers most desire from our products and what dealers need to support and sell them.
›❯ Once in a retail store, the consumer will find a wealth of materials that help simplify the purchase decision: brochures, design books, sampling of the full range of colours and options, and displays that show how actual products look and function.
›❯ We actively support our com-mercial clients with products that meet their needs and specifications, and with technical information concerning light
control, motorization and climate control.
Our internet sites enable us to:›❯ Give consumers the information and interactive design tools they need to help narrow their product selections and make appropriate buying decisions when visiting our dealers’ showrooms.
›❯ Educate and support our dealers and installers; including online learning modules and interactive features to select, measure, order and install products.
Hunter Douglas Annual Report 2013 ❯ Our Company

17❯ Hunter Douglas Gallery®

18
Education, Corporate Citizenship and Employment
EducationWe have developed multi-level training and education programs for our fabricators, retail dealers, professional designers and installers.
›❯ We hold consumer seminars to help prospective buyers under-stand the importance of window coverings for home fashions and for light control and energy efficiency.
›❯ We provide training seminars and hands-on workshops for retailers, designers and installers - includ-ing CD-Roms, movies, and web-based instructions - throughout the world.
›❯ We have created the industry’s first and only formal Retail Alliance Program, offering our very best dealers a choice of tiered partnership options that reward their brand loyalty with lucrative business-building benefits, including financial incentives and exclusive products and programs.
›❯ Through our exclusive partnership with Archiprix International, we build relationships with the next generation of architects as they begin their careers after college. With our support, Archiprix organ-izes a biennial international com-petition for the best graduation projects in architecture. Finalists travel to a host city with hundreds of architects from around the world, where an independent jury evaluates the student entries and recognizes the most outstanding work with the Hunter Douglas award.
›❯ Our ‘Windows of Opportunity’ seminar on the use of window fashions in interior design reaches more than 2,500 design school students and designers in major United States’ markets each year.
›❯ At the Fashions Institute of Technology in New York and other leading design schools, we provide design students with industry overviews and a business perspective through teaching opportunities.
›❯ At the renowned Pratt School of Architecture, we have sponsored design studio projects that challenge students to envision new and novel ways to integrate our products and materials into architectural structures.
Corporate Citizenship›❯ We actively support the com-munities in which we live, work and do business. Decisions about which causes to support and the form that support takes are made locally by our management in each country.
›❯ We provide window coverings to hospitals, research centres and healthcare facilities around the world.
›❯ We support educational opportu-nities for the families of our staff and less privileged members of our communities.
›❯ In the United States and Canada, we sponsor Habitat for Humanity, donating custom window cover-ings for the homes they have built for low-income families since 1993. Our employees have also contributed thousands of hours in sweat equity assisting with the building of these homes at the local level.
›❯ We stimulate students’ awareness of our products and encourage their creativity through competi-tions in which they are judged upon the innovative application of our products in their design projects.
›❯ Hunter Green™ and Keen on Green are important company-wide environmental initiatives being undertaken by our Hunter Douglas branded compa-nies to reduce energy consump-tion, water usage and our overall carbon-footprint. It also includes an ongoing consumer marketing effort to increase awareness of our corporate commitment to the cause as well as the superior energy-saving benefits of our products.
EmploymentEmployment levels decreased from 17,012 to 16,932. This is not expected to materially change in 2014.
Strategy
Our strategy remains unchanged: to grow the market and our market share by continuing to introduce innovative and proprietary products and by expanding our presence in key geographic markets.
Hunter Douglas Annual Report 2013 ❯ Our Company

19
Corporate Governance
Hunter Douglas N.V. has its statutory seat in Curaçao. Hunter Douglas is therefore not subject to the Netherlands Corporate Governance Code. However, Hunter Douglas adheres to good Corporate Governance and follows many of these recommendations.
Corporate structure
Board of DirectorsHunter Douglas has a one-tier corporate structure. Under its Charter the Board of Directors is responsible for the overall management and control of the Company. The Board is appointed by the shareholders at the annual General Meeting. The Board has four regular meetings per year and additional meetings as required. Board members may not be members of more than five boards of public companies.
IndependenceThe Board has five members, of whom three are independent. It acts collectively by majority resolution.
FunctionsThe Board reviews the overall strategy, financial objectives, budgets, acquisitions, divestments, capital expenditures, currency and aluminium hedging, portfolio com-position and returns, results and risks in the Company’s business.
Audit and Compensation CommitteesThe Board has an Audit and a Compensation Committee, whosemembers are independent. The Audit Committee reviews the Company’s accounts, internal controls and meets with the Company’s external Auditors at least once a year.
The Compensation Committee reviews the Directors’ and Officers’ compensation and stock options.
Chairman & CEOMr. Ralph Sonnenberg is Chairman of the Board of Directors and Chief Executive Officer.
OfficersThe Board annually appoints the Officers of the Company – the Co-Presidents, four regionally responsible Vice Presidents and two Staff Vice Presidents.
Financial reportingTo the best of our knowledge, and in accordance with the applicable reporting principles, the consoli-dated financial statements give a true and fair view of the assets, liabilities, financial position and profit or loss of the Group. The annual report includes a fair review of the development and performance of the business and the position of the Group, together with a description of the principal opportunities and risks associated with the expected development of the Group.
Internal Controls
The Company has the following key internal controls.
Conflicts of Interest PolicyThe Company has a ‘Conflicts of Interest Policy’ applicable to all key employees which covers relations with customers, suppliers and other third parties.
Insider Trading PolicyThe Company has an ‘Insider Trading Policy’, as prescribed by the Authority Financial Markets (‘AFM’), restricting trading in the Company’s shares by Directors, Officers, key employees and related persons.
Internal Audit FunctionHunter Douglas’ principal Operating Companies have an Internal Audit Program.
Authority limitsEvery Manager, including the Regional Vice Presidents, has clearly defined Authority Limits.
Whistleblower PolicyHunter Douglas has a ‘Whistleblower’ Policy in each Company.
Compensation
Compensation is reviewed by the Compensation Committee of the Board. The Company also follows the ‘best practices’.
Stock optionsStock options are granted for five years with vesting starting after two years.
StockThe Company does not provide stock at no cost.
LoansLoans to Directors, Officers or other employees bear market interest. There is no forgiveness of principal or interest.
Investor Relations
Hunter Douglas has an Investor Relations Website, regularly issues press releases and holds analysts’ and investor meetings.
Hunter Douglas Annual Report 2013 ❯ Corporate Governance

20
›❯ Prices for raw materials, in particular: aluminium, steel, fabric, synthetics and other oil based products;
›❯ Exchange rates: rates of non US dollar currencies can affect the Company’s results. Hunter Douglas’ policy is to generally hedge transactional exposures, to selectively hedge translation of earnings, and generally not to hedge balance sheet exposures.
Rotterdam, 11 March 2014
Board of Directors
Financial Risk Management
For risk management objectives and policies in relation to the financial instruments reference is made to note 24 of the financial statements.
Objectives
The Company’s objectives are to:
›❯ Expand its Window Coverings and Architectural Products businesses at a growth rate exceeding that of the market while continuing to be the best Company in the industry;
›❯ Develop and introduce innovative new products;
›❯ Seek acquisitions that add to the Company’s organic growth by expanding product lines or distribution and that meet its return targets;
›❯ Continue with an efficient decen-tralized entrepreneurial organiza-tion, based on the principle of ‘maximum accountability with minimum interference’.
Sensitivity to External Factors
The Company’s results are sensitive to external factors of which the following are most influential:
›❯ Overall economic activity and particularly consumer confidence which affects demand for consumer durables;
Hunter Douglas Annual Report 2013 ❯ Corporate Governance
21Hunter Douglas Annual Report 2013 ❯ Worldwide sales
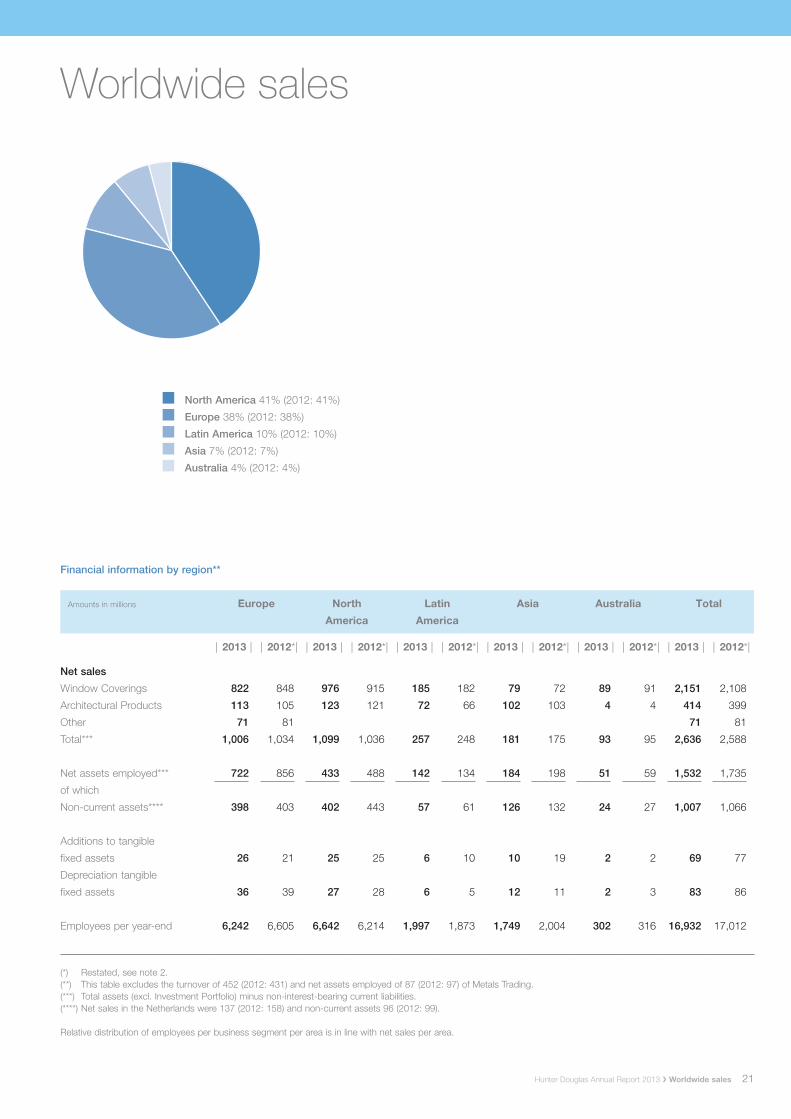
Worldwide sales
Financial information by region**
Amounts in millions Europe North
America
Latin
America
Asia Australia Total
| 2013 | | 2012*| | 2013 | | 2012*| | 2013 | | 2012*| | 2013 | | 2012*| | 2013 | | 2012*| | 2013 | | 2012*|
Net sales
Window Coverings 822 848 976 915 185 182 79 72 89 91 2,151 2,108
Architectural Products 113 105 123 121 72 66 102 103 4 4 414 399
Other 71 81 71 81
Total*** 1,006 1,034 1,099 1,036 257 248 181 175 93 95 2,636 2,588
Net assets employed*** 722 856 433 488 142 134 184 198 51 59 1,532 1,735
of which
Non-current assets**** 398 403 402 443 57 61 126 132 24 27 1,007 1,066
Additions to tangible
fixed assets 26 21 25 25 6 10 10 19 2 2 69 77
Depreciation tangible
fixed assets 36 39 27 28 6 5 12 11 2 3 83 86
Employees per year-end 6,242 6,605 6,642 6,214 1,997 1,873 1,749 2,004 302 316 16,932 17,012
(*) Restated, see note 2.(**) This table excludes the turnover of 452 (2012: 431) and net assets employed of 87 (2012: 97) of Metals Trading.(***) Total assets (excl. Investment Portfolio) minus non-interest-bearing current liabilities.(****) Net sales in the Netherlands were 137 (2012: 158) and non-current assets 96 (2012: 99).
Relative distribution of employees per business segment per area is in line with net sales per area.
n North America 41% (2012: 41%)
n Europe 38% (2012: 38%)
n Latin America 10% (2012: 10%)
n Asia 7% (2012: 7%)
n Australia 4% (2012: 4%)

22
Europe
European Operations: lower sales,
but improved results. Aad KuiperPresident & CEOEuropean Operations
Hunter Douglas EuropeHunter Douglas Europe continued to face economic headwinds. Consumer confidence and demand remained weak across Europe, except in Germany and Scandinavia. Our commercial busi-nesses faced a challenging building market. In response, we continued to streamline and consolidate our operations.
Window Covering Products›❯ Our company-owned blindmakers had slightly lower sales and profits, whereby improved perfor-mance in the UK, Scandinavia, Belgium, Denmark and Portugal was offset by weaker results in our other main markets, espe-cially in the Netherlands. Despite difficult market conditions, we were able to consolidate and grow our market position in key product groups including roller blinds, pleated blinds and Duette® shades.›❯ Component sales to independent blindmakers slightly decreased. We continued to strengthen our position in Germany, where Duette® is becoming increasingly popular.
›❯ Turnils, our secondary branded component supplier, was consoli-dated into our Scandinavian sales organization to streamline our distribution in this region.›❯ Eclipse, our leading UK manufac-turer and distributor of fabrics and window covering components, had lower sales but higher profits.›❯ Benthin, the leading Germany based developer and supplier of vertical, roller blind and pleated systems, continued to perform well.›❯ Blöcker, our market-leading sup-plier of pleated blind systems and fabrics, achieved strong results.›❯ Diflex, the leading blindmaker in Portugal with an efficient, low-cost assembly operation, performed well and continued to add assembly volumes from our Spanish blindmaker where
assembly operations are being closed down. We acquired and integrated Louverdrape, a small Spanish competitor.›❯ Sunflex/Integra, our UK packaged drapery hardware company, achieved good, albeit somewhat lower results.›❯ Gardinia, the leading distributor of packaged window coverings in Germany and Eastern Europe, had a difficult year, with lower sales and significantly lower results. A major customer filed for bankruptcy. Gardinia’s Eastern European business experienced difficult market conditions and is being reorganized.
Luxaflex® Window Coverings›❯ Our main brand in Europe continued to gain share in a chal-lenging market as our leadership
Hunter Douglas Annual Report 2013 ❯ Europe
EUR
Amounts in millions | 2013 | | 2012 |
Net sales
Window coverings 619 656
Architectural products 85 81
Other 53 63
Total 757 800
Net assets employed 524 650
Employees per year-end 6,242 6,605 ❯ Plissé Shades

23
in distribution, product innovation and trade support programs continues to attract dealers to the brand.›❯ We rolled out a complete brand refresh for Luxaflex®, resulting in a contemporary look&feel for all communications items, including collections books, website and brochures. ›❯ We continued to expand our on-line marketing by launching a new Luxaflex® website in 15 countries. Traffic to our website increased by more than 25% for the 4th consecutive year to more than 1.3 million visitors.›❯ Duette® shades realized another year of double digit growth. ›❯ We grew our market share in the important roller blind market with the launch of our latest collection. ›❯ We added 13 dealers to our top tier Luxaflex® Gallery program, which now numbers 81 in five countries.›❯ We grew the number of dealers in our Alliance program by
almost 100 to 3,124 dealers, and significantly upgraded another 125 dealers with our Inspiration Shop displays.
Architectural and Project Market›❯ In challenging market circum-stances we were able to stabilize our commercial sales, with growth in Russia and the Middle East, offset by continued weakness in Eastern Europe. ›❯ We continued to grow our roller blind business for commercial interiors, based on the increas-ing popularity of our EOS® hardware. Our external roller blind business remained strong in the Netherlands, but faced headwinds in Denmark, the UK and the Middle East.›❯ Margins stabilized in our linear metal ceilings. We introduced a new multi panel ceiling system, which enables architects to design more creative 3D ceilings.›❯ Our NBK ceramic façades, metal façades and sun control
businesses all had lower results, in the face of difficult market conditions.
Operations/Manufacturing›❯ Our main manufacturing facilities in the Netherlands had improved performance, despite lower volumes.›❯ Artex, our textile development and production center based in Aarle-Rixtel, the Netherlands, continued to perform well.›❯ Our Fabrication plants in Czechia and Poland added assembly volumes from several of our Western European plants.›❯ Significant quality and delivery improvements were achieved through the continued roll-out of “Lean Manufacturing” processes at our main assembly operations.
NedalOur Dutch based aluminium extru-sion operation had lower sales and results.
Hunter Douglas Annual Report 2013 ❯ Europe
❯ Duette® Shades
24
USD
Amounts in millions | 2013 | | 2012 |
Net sales
Window coverings 976 915
Architectural products 123 121
Other
Total 1,099 1,036
Net assets employed 433 488
Employees per year-end 6,642 6,214
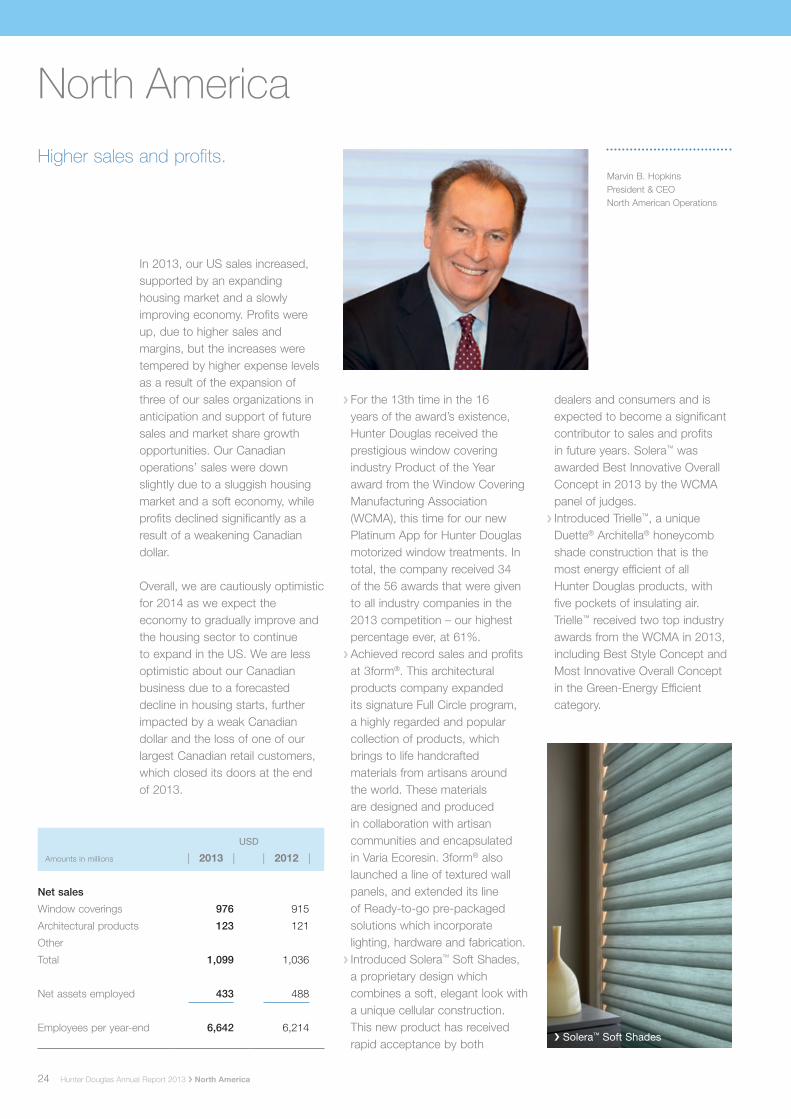
In 2013, our US sales increased, supported by an expanding housing market and a slowly improving economy. Profits were up, due to higher sales and margins, but the increases were tempered by higher expense levels as a result of the expansion of three of our sales organizations in anticipation and support of future sales and market share growth opportunities. Our Canadian operations’ sales were down slightly due to a sluggish housing market and a soft economy, while profits declined significantly as a result of a weakening Canadian dollar.
Overall, we are cautiously optimistic for 2014 as we expect the economy to gradually improve and the housing sector to continue to expand in the US. We are less optimistic about our Canadian business due to a forecasted decline in housing starts, further impacted by a weak Canadian dollar and the loss of one of our largest Canadian retail customers, which closed its doors at the end of 2013.
›❯ For the 13th time in the 16 years of the award’s existence, Hunter Douglas received the prestigious window covering industry Product of the Year award from the Window Covering Manufacturing Association (WCMA), this time for our new Platinum App for Hunter Douglas motorized window treatments. In total, the company received 34 of the 56 awards that were given to all industry companies in the 2013 competition – our highest percentage ever, at 61%.›❯ Achieved record sales and profits at 3form®. This architectural products company expanded its signature Full Circle program, a highly regarded and popular collection of products, which brings to life handcrafted materials from artisans around the world. These materials are designed and produced in collaboration with artisan communities and encapsulated in Varia Ecoresin. 3form® also launched a line of textured wall panels, and extended its line of Ready-to-go pre-packaged solutions which incorporate lighting, hardware and fabrication.›❯ Introduced Solera™ Soft Shades, a proprietary design which combines a soft, elegant look with a unique cellular construction. This new product has received rapid acceptance by both
dealers and consumers and is expected to become a significant contributor to sales and profits in future years. Solera™ was awarded Best Innovative Overall Concept in 2013 by the WCMA panel of judges.›❯ Introduced Trielle™, a unique Duette® Architella® honeycomb shade construction that is the most energy efficient of all Hunter Douglas products, with five pockets of insulating air. Trielle™ received two top industry awards from the WCMA in 2013, including Best Style Concept and Most Innovative Overall Concept in the Green-Energy Efficient category.
North America
Higher sales and profits.
❯ Solera™ Soft Shades
Hunter Douglas Annual Report 2013 ❯ North America
Marvin B. HopkinsPresident & CEONorth American Operations

25
›❯ Launched Echelon™, a premium ceiling system for Techstyle®, our line of upscale acoustical ceiling panels.›❯ Introduced eight new Hunter Douglas brand product collections, including Duette® honeycomb shades, Nantucket™ window shadings, Solera® Soft Shades and Parkland™ wood blinds and placed more than 90,000 sample books with our retail dealers throughout US and Canada.›❯ Placed our new, lighted product floor display systems, which effectively showcase up to 21 different Hunter Douglas products, in more than 900 of our best dealers’ showrooms throughout the US and Canada.›❯ Increased the number of Centurion Club® and Exclusive-At-Home™ dealers to 1,163 in the US and Canada. These are our most loyal dealers who commit to purchasing 100% of their window covering blinds, shades and shutters from Hunter Douglas.›❯ Grew our total sales to our 525 Hunter Douglas Gallery® alliance dealers by 17% and increased the number of Showcase alliance dealers by 214 to 1,690. These are our two highest alliance levels, requiring significant commitments in display space, training and investment by participating dealers.›❯ Professionally trained more than 15,000 of our best dealers throughout North America in 95 formal, full-day and half-day sessions to introduce them to our new products and programs for 2013 – all within an eight-week period in early spring.›❯ Increased the number of visits to our hunterdouglas.com consumer website by 14%, to 4.4 million.›❯ Successfully installed the Salesforce customer relationship management software at our
sales and customer service organizations for the Hunter Douglas brand business. This is a productivity improvement software program that enables our employees to receive, send and analyze sales and marketing data from anywhere on their mobile iPad devices.›❯ Established a separate national sales force focused on servicing and growing our private label business at home centers.›❯ Acquired two additional US independent fabricator companies (Beauti-Vue Products and Kaleidoscope Industries) in 2013, and fully merged their businesses with our Hunter Douglas Fabrication Division. Also, we announced our intentions and laid plans with each of the three remaining Hunter Douglas independent fabricators in the US to merge and absorb all their Hunter Douglas business into our Fabrication Division during 2014.›❯ Improved the Return on Net Assets Employed (RONAE) for North American operations and increased operating cash flow
Hunter Douglas Annual Report 2013 ❯ North America
and inventory turnover while reducing the receivables to sales ratio. Hunter Douglas also continued to improve its safety and environmental record and reduced workers’ compensation claims for the 5th consecutive year.›❯ Provided free Hunter Douglas custom blinds for all Habitat for Humanity homes built in the US and Canada for the 21st consecutive year. Hunter Douglas, together with its employees, donated USD 525,000 to aid the victims of two natural disasters: the Philippines typhoon and the Colorado flood. In addition, Hunter Douglas supported many other charitable programs and causes throughout the year.
We are confident that our North American operations are well positioned for the future as we continue to build our brands, strengthen our customer relations, develop innovative new products and improve operational efficiencies.
❯ Luminette® Privacy Sheers

26
Our Latin American operations had slightly higher sales and significantly higher operational profits; with lower total profits due to currency devaluations.
Our Window Coverings business had slightly lower sales and profits mainly due to the devaluation of the Brazilian currency. We continue to grow the market for our products through a core network of well merchandised dealers, focused on serving an upscale clientele with our main HunterDouglas® and Luxaflex® brands. Our secondary brands, tailored to the fast develop-ing middle class segment, continue to grow sharply.
Architectural Products had record sales and significantly higher profits.
Stock window covering products continued to be affected by import restrictions in Venezuela. Nevertheless, sales were flat with significantly higher operational profits.
Brazil›❯ Slightly higher sales and signifi-cantly higher operational profits.›❯ Architectural Products had record sales and profits benefiting from expanded local production and new product launches.›❯ Window Coverings had higher sales but lower results; mainly
due to currency devaluation.›❯ We acquired our independent Window Covering licensees in Parana and Santa Catarina.
Mexico›❯ Sales were flat and profits lower.›❯ In Window Coverings we are establishing a second brand network.›❯ Operations were streamlined over the past two years and will benefit from the improving economy.
Chile›❯ Record sales and profits.›❯ Architectural Products were the main contributor to the good performance. ›❯ While the economy is slowing, we continue to have a large order backlog.
Colombia›❯ Slightly lower sales and profits. ›❯ In Window Coverings we con-tinued our strategy to recapture market share with our opening
price point products.›❯ We started to build a new larger manufacturing plant on the outskirts of Bogota.
Argentina›❯ Higher sales and profits.›❯ Our strong results are under threat of import restrictions and currency devaluation.
Venezuela›❯ Lower sales and higher opera-tional profits. ›❯ Our operations continue to be severely constrained by the ongoing difficulty in obtaining US dollars to finance imports.›❯ Our stock window covering products business was moved to Panama.
Peru & Panama›❯ Peru had higher sales and results, while Panama had slightly lower sales and results.
Latin America
USD
Amounts in millions | 2013 | | 2012 |
Net sales
Window coverings 185 182
Architectural products 72 66
Other
Total 257 248
Net assets employed 142 134
Employees per year-end 1,997 1,873
Higher sales and operational profits.
Hunter Douglas Annual Report 2013 ❯ Latin America
Renato RochaPresident & CEOLatin American Operations
❯ Screenpanel XL
27
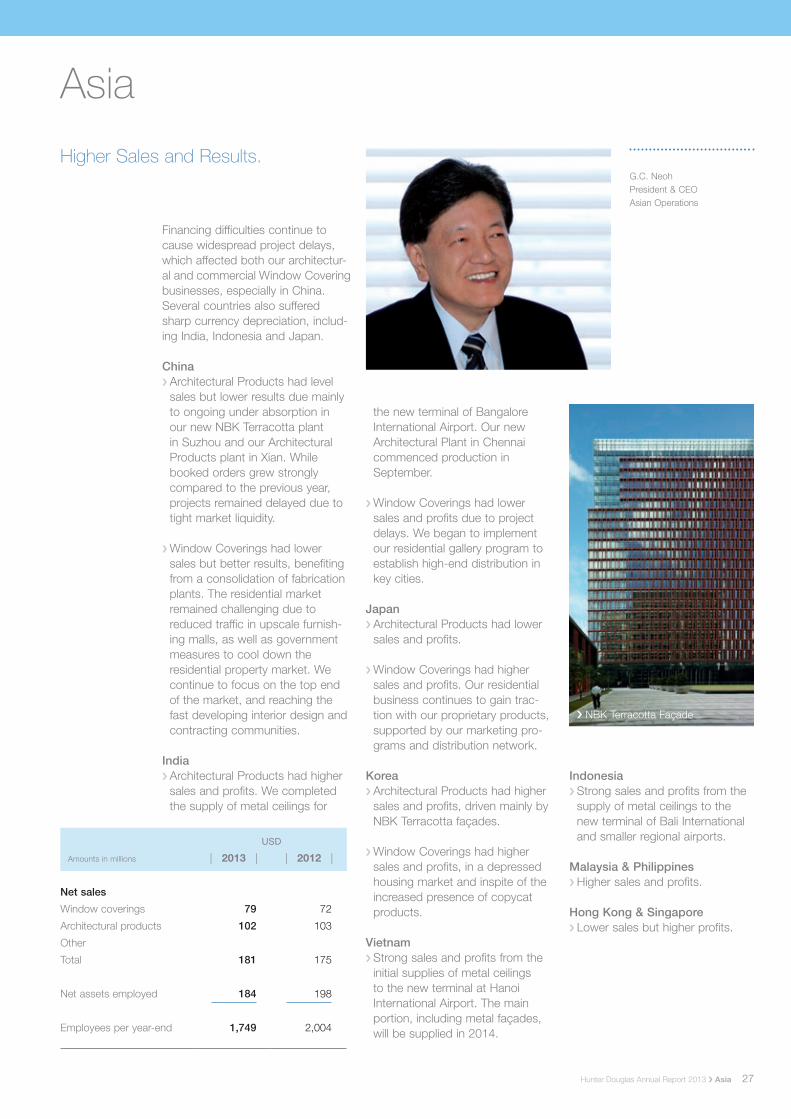
Financing difficulties continue to cause widespread project delays, which affected both our architectur-al and commercial Window Covering businesses, especially in China. Several countries also suffered sharp currency depreciation, includ-ing India, Indonesia and Japan.
China›❯ Architectural Products had level sales but lower results due mainly to ongoing under absorption in our new NBK Terracotta plant in Suzhou and our Architectural Products plant in Xian. While booked orders grew strongly compared to the previous year, projects remained delayed due to tight market liquidity.
›❯ Window Coverings had lower sales but better results, benefiting from a consolidation of fabrication plants. The residential market remained challenging due to reduced traffic in upscale furnish-ing malls, as well as government measures to cool down the residential property market. We continue to focus on the top end of the market, and reaching the fast developing interior design and contracting communities.
India›❯ Architectural Products had higher sales and profits. We completed the supply of metal ceilings for
the new terminal of Bangalore International Airport. Our new Architectural Plant in Chennai commenced production in September.
›❯ Window Coverings had lower sales and profits due to project delays. We began to implement our residential gallery program to establish high-end distribution in key cities.
Japan›❯ Architectural Products had lower sales and profits.
›❯ Window Coverings had higher sales and profits. Our residential business continues to gain trac-tion with our proprietary products, supported by our marketing pro-grams and distribution network.
Korea›❯ Architectural Products had higher sales and profits, driven mainly by NBK Terracotta façades.
›❯ Window Coverings had higher sales and profits, in a depressed housing market and inspite of the increased presence of copycat products.
Vietnam›❯ Strong sales and profits from the initial supplies of metal ceilings to the new terminal at Hanoi International Airport. The main portion, including metal façades, will be supplied in 2014.
Indonesia›❯ Strong sales and profits from the supply of metal ceilings to the new terminal of Bali International and smaller regional airports.
Malaysia & Philippines›❯ Higher sales and profits.
Hong Kong & Singapore›❯ Lower sales but higher profits.
Asia
USD
Amounts in millions | 2013 | | 2012 |
Net sales
Window coverings 79 72
Architectural products 102 103
Other
Total 181 175
Net assets employed 184 198
Employees per year-end 1,749 2,004
Higher Sales and Results.
Hunter Douglas Annual Report 2013 ❯ Asia
G.C. NeohPresident & CEOAsian Operations
❯ NBK Terracotta Façade

28 Hunter Douglas Annual Report 2013
1 2
3
4

29
1 | NBK Terracotta Façade
2 | 3D QuadroClad® façade
3 | Linear ceiling
4 | 3form® textured wall panel
5 | QuadroClad® façade
6 | Linear ceiling
7 | NBK Terracotta Façade
8 | 3form® Exterior Chroma Fins
5
8
6
7

30
Consolidated statement of income for the year
Consolidated statement of comprehensive income for the year
Hunter Douglas Annual Report 2013 ❯ Consolidated statement of income for the year
USD
Amounts in millions Notes | 2013 | | 2012* |
Net sales 3 2,636 2,588
Cost of sales 4 -1,596 -1,580
Gross profit 1,040 1,008
Gross profit metals trading 3 16 18
Total gross profit 1,056 1,026
Selling and marketing expense 3 -543 -543
General and administrative expense 3 -354 -363
Income from operations (EBIT) 159 120
Finance costs 4 -25 -20
Finance income 4 2 21
Income before taxes 136 121
Taxes on income 18 -29 -19
Net profit for the year 107 102
Net profit attributable to non-controlling interest 1
Net profit attributable to equity shareholders 107 101
Earnings per share attributable to equity shareholders 19
- basic for profit for the year 3.08 2.90
- fully diluted for profit for the year 3.08 2.90
USD
Amounts in millions | 2013 | | 2012* |
Net profit for the year 107 102
Other comprehensive income
Actuarial gains (losses) 44 -17
Currency translation differences** -13 11
Net movement in cash flow hedges** 5 -7
Tax effect on other comprehensive income -34 3
Total comprehensive income for the year, net of tax 109 92
Attributable to equity shareholders 108 91
Attributable to non-controlling interest 1 1
* restated, see note 2.** These items will be recycled thru statement of income at a future point in time. The tax effect of these items
amounts to -15.The accounting policies and explanatory notes on pages 35 through 60 form an integral part of the financial statements.
Leen Reijtenbagh
Vice President, CFO & Secretary
Chris King
Vice President General Counsel
31
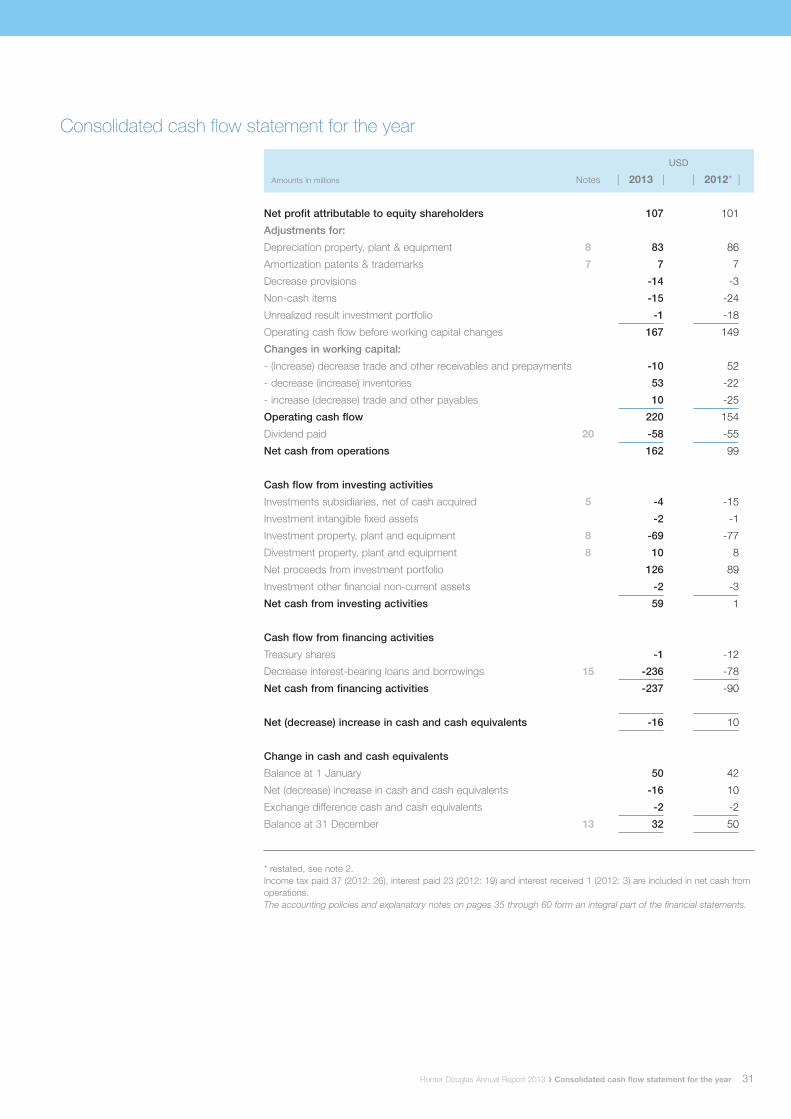
Consolidated cash flow statement for the year
Hunter Douglas Annual Report 2013 ❯ Consolidated cash flow statement for the year
USD
Amounts in millions Notes | 2013 | | 2012* |
Net profit attributable to equity shareholders 107 101
Adjustments for:
Depreciation property, plant & equipment 8 83 86
Amortization patents & trademarks 7 7 7
Decrease provisions -14 -3
Non-cash items -15 -24
Unrealized result investment portfolio -1 -18
Operating cash flow before working capital changes 167 149
Changes in working capital:
- (increase) decrease trade and other receivables and prepayments -10 52
- decrease (increase) inventories 53 -22
- increase (decrease) trade and other payables 10 -25
Operating cash flow 220 154
Dividend paid 20 -58 -55
Net cash from operations 162 99
Cash flow from investing activities
Investments subsidiaries, net of cash acquired 5 -4 -15
Investment intangible fixed assets -2 -1
Investment property, plant and equipment 8 -69 -77
Divestment property, plant and equipment 8 10 8
Net proceeds from investment portfolio 126 89
Investment other financial non-current assets -2 -3
Net cash from investing activities 59 1
Cash flow from financing activities
Treasury shares -1 -12
Decrease interest-bearing loans and borrowings 15 -236 -78
Net cash from financing activities -237 -90
Net (decrease) increase in cash and cash equivalents -16 10
Change in cash and cash equivalents
Balance at 1 January 50 42
Net (decrease) increase in cash and cash equivalents -16 10
Exchange difference cash and cash equivalents -2 -2
Balance at 31 December 13 32 50
* restated, see note 2.Income tax paid 37 (2012: 26), interest paid 23 (2012: 19) and interest received 1 (2012: 3) are included in net cash from operations.The accounting policies and explanatory notes on pages 35 through 60 form an integral part of the financial statements.

32
Consolidated balance sheet as per 31 December
Assets
Hunter Douglas Annual Report 2013 ❯ Consolidated balance sheet as per 31 December
USD
Amounts in millions Notes | 2013 | | 2012* |
Non-current assets
Intangible fixed assets 7 315 316
Property, plant and equipment 8 560 584
Deferred income tax assets 18 109 147
Other financial non-current assets 9 25 20
Total non-current assets 1,009 1,067
Current assets
Inventories 10 632 685
Trade and other receivables 11 407 489
Prepaid income tax 32 29
Prepayments 12 85 100
Currency derivatives 25 7 2
Metal derivatives 25 7 5
Investment portfolio 2 25
Cash and short-term deposits 13 32 50
Total current assets 1,204 1,385
TOTAL ASSETS 2,213 2,452
* restated, see note 2.
The accounting policies and explanatory notes on pages 35 through 60 form an integral part of the financial statements.

33
Consolidated balance sheet as per 31 December
Shareholders’ equity and liabilities
Hunter Douglas Annual Report 2013 ❯ Consolidated balance sheet as per 31 December
USD
Amounts in millions Notes | 2013 | | 2012* |
Equity attributable to equity shareholders
Issued capital 14 12 11
Share premium 97 93
Treasury shares -29 -28
Cash flow hedge reserve -16 -21
Foreign currency translation -35 -25
Retained earnings 1,095 1,045
Total equity attributable to equity shareholders of the parent 1,124 1,075
Non-controlling interest 17 16
Total equity 1,141 1,091
Non-current liabilities
Interest-bearing loans and borrowings 15 295 393
Preferred shares 15 11 11
Provisions 16 103 155
Deferred income tax liabilities 18 2 3
Total non-current liabilities 411 562
Current liabilities
Trade and other payables 17 562 558
Income tax payable 16 15
Restructuring provisions 11 18
Currency derivatives 25 3 4
Interest-bearing loans and borrowings 15 69 204
Total current liabilities 661 799
TOTAL LIABILITIES 1,072 1,361
TOTAL SHAREHOLDERS’ EQUITY AND LIABILITIES 2,213 2,452
* restated, see note 2.
The accounting policies and explanatory notes on pages 35 through 60 form an integral part of the financial statements.

34
Consolidated statement of changes in equity for the year
Hunter Douglas Annual Report 2013 ❯ Consolidated statement of changes in equity for the year
Amounts in millions Attributable to equity shareholders of the parent
Issuedcapital
Sharepremium
Treasuryshares
Cash flowhedgereserve
Foreigncurrency
translationRetainedearnings Total
Non-controlling
interestTotal
equity
At 1 January 2012 11 91 -16 -14 -33 1,030 1,069 3 1,072
Restatements (see note 2) -18 -18 12 -6
At 1 January 2012 (restated) 11 91 -16 -14 -33 1,012 1,051 15 1,066
Net profit 101 101 1 102
Other comprehensive income (expense) 2 -7 8 -13 -10 -10
Total comprehensive income (expense) 0 2 0 -7 8 88 91 1 92
Purchase shares -12 -12 -12
Equity dividends -55 -55 -55
At 31 December 2012 (restated) 11 93 -28 -21 -25 1,045 1,075 16 1,091
Net profit 107 107 107
Other comprehensive income (expense) 1 4 5 -10 1 1 1 2
Total comprehensive income (expense) 1 4 0 5 -10 108 108 1 109
Purchase shares -1 -1 -1
Equity dividends -58 -58 -58
At 31 December 2013 12 97 -29 -16 -35 1,095 1,124 17 1,141
The accounting policies and explanatory notes on pages 35 through 60 form an integral part of the financial statements.

35
Notes to consolidated financial statements
Hunter Douglas Annual Report 2013 ❯ Notes to consolidated financial statements
1. Corporate informationThe consolidated financial statements of Hunter Douglas N.V. for the year ended 31 December 2013 were authorized for issue on 11 March 2014. These financial statements will be adopted by the Annual General Meeting of Shareholders on 10 June 2014.
Hunter Douglas N.V has its statutory seat in Curaçao. Common shares are publicly traded at Amsterdam (HDG) and Frankfurt (HUD) for the common shares; the preferred shares are traded at Amsterdam (HUNDP).
The principal activities of the Group are described in note 3.
2. Summary of significant accounting policies
Basis of presentationThe consolidated financial statements have been prepared on a historical cost basis, except for the investment portfolio and derivative financial instru-ments which have been measured at fair value. The consolidated financial statements are presented in US dollars and all values are rounded to the nearest million except when otherwise indicated.
Statement of complianceThe consolidated financial statements of Hunter Douglas N.V. and all its subsidiaries have been prepared in accordance with International Financial Reporting Standards as adopted by the European Union and International Financial Reporting Standards as issued by the IASB.
In accordance with Article 2:402 of the Civil Code, an abbreviated version of the income statement is presented in the Company’s financial statements.
Basis of consolidationThe consolidated financial statements comprise the financial statements of Hunter Douglas N.V. and its subsidiaries as at 31 December each year. The financial statements of subsidiaries are prepared for the same reporting year as the parent Company, using consistent accounting policies.All intercompany balances and trans actions, including unrealized profits arising from intra-group transac-tions, have been eliminated upon consolidation.
Subsidiaries are consolidated from the date on which control is transferred to the Group and cease to be consolidated from the date on which control is transferred out of the Group, in which case the consolidated financial statements include the results for the part of the reporting year during which Hunter Douglas N.V. had control.
Acquisitions have been included in the consolidated financial statements using the acquisition accounting method. The purchase method of accounting involves allocating the costs of the busi-ness combination to the fair value of the assets acquired and liabilities assumed at the date of acquisition.
Accordingly, the consolidated financial statements include the results from the new acquisitions from the date of their acquisition.
Non-controlling interest represents the portion of profit or loss and net assets in Gardinia, Germany and in some Latin American subsidiaries not held by Hunter Douglas N.V. and are presented separately in the statement of income and within equity in the consolidated balance sheet, separately from share-holders’ equity.
Foreign currency translationThe consolidated financial statements are presented in US dollars, which is the Company’s presentation and functional currency. Each entity in the Group determines its own functional currency and items included in the financial statements of each entity are measured using that functional cur-rency. Transactions in foreign currencies are initially recorded at the functional currency rate on the date of the trans-action. Monetary assets and liabilities denominated in foreign currencies are retranslated at the functional currency rate of exchange on the balance sheet dates. All differences are taken to the income statement with the exception of differences on foreign currency borrow-ings that provide a hedge against a net investment in a foreign entity. These are taken directly to other comprehensive income until the disposal of the net investment, at which time they are recognized in the income statement. Tax charges and credits attributable to exchange differences on those borrowings are also dealt with in other comprehensive income. Non-monetary items that are measured in terms of historical cost in a foreign currency are translated using the exchange rates as at the dates of the initial transactions. Non-monetary items measured at fair value in a foreign currency are translated using the exchange rates at the date the fair value was determined.
As at the reporting date, the assets and liabilities of the subsidiaries are trans-lated into the presentation currency of the Group (US dollar) at the rate of exchange on the balance sheet date and their income statements are trans-lated at the weighted average exchange rates for the year. The exchange differences arising on the translation are taken directly to a separate component of equity. On disposal of a foreign entity, the deferred cumulative amount recognized in other comprehensive
income relating to that particular foreign operation is recognized in the income statement.
Intangible fixed assets Intangible assets with finite lives are amortized over the useful economic life and assessed for impairment whenever there is an indication that the intangible asset may be impaired. The amor-tization period and the amortization method for an intangible asset with a finite useful life is reviewed at least at each financial year-end. Changes in the expected useful life or the expected pattern of consumption of future economic benefits embodied in the asset is accounted for by changing the amortization period or method, as appropriate, and treated as changes in accounting estimates. The amortization expense on intangible assets with finite lives is recognized in the income statement in the expense category consistent with the function of the intangible asset.
Business Combinations and GoodwillBusiness Combinations are accounted for using the acquisition accounting method. This involves recognizing identifiable assets (including previously unrecognized intangible assets) and liabilities (including contingent liabilities and excluding future restructuring) of the acquired business at fair value. Goodwill on acquisition is initially measured at cost being the excess of the cost of the business combination over the acquirer’s interest in the net fair value of the identifiable assets, liabilities and contingent liabilities. Following initial recognition, goodwill is measured at cost less any accumulated impairment losses. Goodwill on acquisitions after 1 January 2004 is not amortized and goodwill already carried in the balance sheet is not amortized after 1 January 2004. Goodwill is reviewed for impair-ment annually or more frequently if events or changes in circumstances indicate that the carrying value may be impaired.If the acquirer’s interest in the net fair value of the identifiable assets and liabilities and contingent liabilities is higher than the cost of the busi-ness combination, the difference is recognized as a gain in the income statement. This gain is classified as cost of sales.
As at the acquisition date, any goodwill acquired is allocated to each of the cash-generating units expected to benefit from the combination’s synergies. Impairment is determined by assessing the recoverable amount of the cash-generating unit, to which the goodwill relates. Where the recoverable amount of the cash-generating unit is less than the carrying amount, an impairment loss is recognized.

36
Where goodwill forms part of a cash-generating unit and part of the operation within that unit is disposed of, the goodwill associated with the operation disposed of is included in the carrying amount of the operation when determining the gain or loss on disposal of the operation. Goodwill disposed of in this circumstance is measured on the basis of the relative values of the opera-tion disposed of and the portion of the cash-generating unit retained.
Significant accounting judgement and estimatesThe preparation of financial statements requires management to make estimates and assumptions that affect amounts reported in the consolidated financial statements in order to conform to IFRS. These estimates and assump-tions affect the reported amounts of assets and liabilities, the disclosure of contingent liabilities at the date of the consolidated financial statements, and the reported amounts of revenues and expenses during the reporting period. We evaluate these estimates and judgements on an ongoing basis and base our estimates on experience, current and expected future conditions, third-party evaluations and various other assumptions that we believe are reasonable under the circumstances. The results of these estimates form the basis for making judgements about the carrying values of assets and liabilities as well as identifying and assessing the accounting treatment with respect to commitments and contingencies. Actual results could differ from the estimates and assumptions.
Estimates significantly impact goodwill and other intangibles acquired, impair-ments, fair value of the investment portfolio, liabilities from employee benefit plans, other provisions and tax and other contingencies. The fair values of acquired identifiable intangibles are based on an assessment of future cash flows. Impairment analyses of goodwill are performed annually and whenever a triggering event has occurred to determine whether the carrying value exceeds the recoverable amount. These analyses are based on estimates of future cash flows.
Assumptions used to determine pension liabilities include the interest rate and discount rate. Assumptions used to determine the fair value of the investment portfolio relate to credit risk and liquidity risk of the fund.
In various countries the Company has taken standpoints regarding its tax position which may at any time be chal-lenged by the tax authorities because the authorities in question interpret the law differently. In determining the probability of realization of deferred tax assets and liabilities these uncertainties are taken into account.
Property, plant and equipmentProperty, plant and equipment are carried at cost less accumulated depreciation and any accumulated impairment in value. Fixed assets are depreciated over the expected useful lives, using the straight-line method. An indication of the expected useful life is as follows:
Buildings 20 - 40 yearsMachinery & equipment 5 - 10 yearsOther property, plantand equipment 3 - 10 yearsLand is not depreciated
The carrying values of property, plant and equipment are reviewed for impairment when events or changes in circumstances indicate that the carrying value may not be recoverable. If any such indication exists and where the carrying values exceed the estimated recoverable amounts, the assets of cash-generating units are written down to their recoverable amount.
Other financial non-current assetsOther financial non-current assets are recorded at amortized costs.
InventoriesInventories are valued at the lower of production cost and net realizable value. Costs incurred in bringing each product to its present location and conditions are accounted for as follows:- Raw materials are stated principally at
the lower of cost (first-in/first-out) or net realizable value;
- Finished goods and work-in-progress are stated at cost of direct materials and labor and a proportion of manu-facturing overheads based on normal operating capacity.
Net realizable value is the estimated selling price in the ordinary course of business, less estimated costs of completion and the estimated costs necessary to make the sale.
Trade and other receivablesTrade receivables, which generally have 30-60 day terms, are recognized and carried at original invoice amount less an allowance for any uncollectible amounts. An estimate for doubtful debts is made when collection of the full amount is not longer probable.
Cash and cash equivalentsCash and short-term deposits in the balance sheet comprise cash at bank and in hand and short-term deposits with an original maturity of less than one year. For the purpose of the consolidated cash flow statement, cash and cash equivalents consist of cash and cash equivalents as defined above.
Interest-bearing loans and borrowingsAll loans and borrowings are initially recognized at cost, being the fair value
of the consideration received net of issue costs associated with the bor-rowing. After initial recognition, interest-bearing loans and borrowings are subsequently measured at amortized cost using the effective interest method. Amortized cost is calculated by taking into account any issue costs, and any discount or premium on settlement. Gains and losses are recognized in net profit or loss when the liabilities are derecognized, as well as through the amortization process.
The revised IAS 23 requires capitaliza-tion of borrowing costs that are directly attributable to the acquisition, construc-tion or production of a qualifying asset. Borrowing costs are capitalized on qualifying assets with a commencement date on or after 1 January 2009. During the 12 months to 31 December 2013, no borrowing costs have been capital-ized on qualifying assets included in construction in progress.
ProvisionsProvisions are recognized when the Group has a present obligation (legal or constructive) as a result of a past event. It is probable that an outflow of resources embodying economic benefits will be required to settle the obligation and a reliable estimate can be made of the amount of the obliga-tion. Where the Group expects some or all of a provision to be reimbursed, for example under an insurance contract, the reimbursement is recognized as a separate asset but only when the reimbursement is virtually certain. The expense relating to any provision is presented in the income statement net of any reimbursement. If the effect of the time value of money is material, provisions are determined by discounting the expected future cash flows at a pre-tax rate that reflects current market assessments of the time value of money and, where appropriate, the risks specific to the liability. Where discounting is used, the increase in the provision due to the passage of time is recognized as a borrowing cost.
Pensions and other post-employment benefitsThe Group operates three defined benefit pension schemes, all of which require contributions to be made to separately administered funds.
The cost of providing benefits under the plans is determined separately for each plan using the projected unit credit actuarial valuation method. Actuarial gains and losses for the defined benefit plans are recognized in full in the period in which they occur in other comprehensive income. Such actuarial gains and losses are also immediately recognized in retained earnings and are not reclassified to profit or loss in subsequent periods.
Notes to consolidated financial statements
Hunter Douglas Annual Report 2013 ❯ Notes to consolidated financial statements

37
The defined benefit asset or liability comprises the present value of the defined benefit obligation less the fair value of plan assets out of which the obligations are to be settled. Plan assets are assets that are held by a long-term employee benefit fund or qualifying insurance policies. Plan assets are not available to the creditors of the Group, nor can they be paid directly to the Group. Fair value is based on market price information and, in the case of quoted securities, it is the published bid price. The value of any defined benefit asset recognized is restricted to the present value of any economic benefits available in the form of refunds from the plan or reductions in the future contributions to the plan.
The Group also operates a number of defined contribution pension plans. The cost of providing contributions under the plans is charged to the income statement in the period to which the contributions relate.
Share-based payments/option plansShare-based payments are expensed on the basis of their value determined by using option pricing models. The share-based payments qualify as cash-settled transactions and are measured initially at fair value at the grant date using the Black-Scholes formula, taking into account the terms and conditions upon which the instruments were granted (see Note 22 employee ben-efits). This fair value is expensed over the period until vesting with recognition of a corresponding liability. The liability is remeasured at each balance sheet date up to and including the settlement date with changes in fair value recognized in the income statement.
Treasury sharesOwn equity instruments which are reacquired (treasury shares) are deducted from equity. No gain or loss is recognized in the income statement on the purchase, sale, issue or cancellation of the Group’s own equity instruments.
LeasesLeases which do not transfer to the Group substantially all the risks and benefits of ownership of the asset are classified as operating leases. Operating lease payments are recog-nized as an expense in the income statement on a straight-line basis over the lease term.
Net salesNet sales are recognized to the extent that it is probable that the economic benefits will flow to the Group and the net sales can be reliably measured.Net sales represent the invoiced value of manufactured products delivered to customers net of freight, returns, allowances and sales tax. Net sales are recognized when the significant risks and rewards of ownership of the goods
have passed to the buyer and can be reliably measured. Cost of sales are recorded in the same period as sales are recognized. Other revenues and expenses are recorded in the period in which they originate.
Metals tradingMetals trading is presented on a net basis as these activities classify as broker/trader activities. Metals trading sales are excluded from net sales. Gross profit on metals trading represents the margin earned on bulk aluminium delivered to clients net of direct acquisition and trading costs.
Research and developmentResearch costs are expensed as incurred. Development costs are capitalized if it is probable that the expected future economic benefits that are attributable to the asset will flow to the entity; and the cost of the asset can be measured reliably.
Income taxCurrent tax assets and liabilities for the current and prior years are measured at the amount expected to be recovered from or paid to the taxation authorities. The tax rates and tax laws used to compute the amount are those that are enacted or substantively enacted at the balance sheet date.
Deferred income tax is provided, using the liability method, on all temporary differences at the balance sheet date between the tax basis of assets and liabilities and their carrying amounts for financial reporting purposes. Deferred income tax liabilities are recognized for all taxable temporary differences such as the value of inventories, fixed assets and provisions for tax purposes which differ from the value used for financial reporting purposes, except where the deferred income tax liability arises from the initial recognition of goodwill or the initial recognition of an asset or liability in a transaction that is not a business combination and, at the time of the transaction, affects neither the account-ing profit nor taxable profit or loss; and in respect of taxable temporary differences associated with investments in subsidiaries, associates and interests in joint ventures, except where the timing of the reversal of the temporary differences can be controlled and it is probable that the temporary differences will not reverse in the foreseeable future.
Deferred income tax assets are recognized for all deductible temporary differences, carry-forward of unused tax assets and unused tax losses, to the extent that it is probable that taxable profit will be available against which the deductible temporary differences, and the carry-forward of unused tax assets and unused tax losses can be utilized, except where the deferred income tax asset relating to the deductible
temporary difference arises from the initial recognition of an asset or liability in a transaction that is not a business combination and, at the time of the transaction, affects neither the account-ing profit nor taxable profit or loss; and in respect of deductible temporary differences associated with investments in subsidiaries, associates and interests in joint ventures, deferred tax assets are only recognized to the extent that it is probable that the temporary differences will reverse in the foreseeable future and taxable profit will be available against which the temporary differences can be utilized.
The carrying amount of deferred income tax assets is reviewed at each balance sheet date and reduced to the extent that it is no longer probable that suf-ficient taxable profit will be available to allow all or part of the deferred income tax asset to be utilized.
Deferred income tax assets and liabilities are measured at the tax rates that are expected to apply to the year when the asset is realized or the liability is settled, based on tax rates (and tax laws) that have been enacted or substantively enacted at the balance sheet date.
Income taxes relating to items recog-nized directly in equity or other compre-hensive income are recognized in equity or other comprehensive income and not in the income statement.
Sales taxRevenues, expenses and assets are recognized net of the amount of sales tax except:- where the sales tax incurred on a
purchase of goods and services is not recoverable from the taxation authority, in which case the sales tax is recognized as part of the cost of acquisition of the asset or as part of the expense item as applicable; and
- receivables and payables are stated with the amount of sales tax included.
The net amount of sales tax recoverable from, or payable to, the taxation author-ity is included as part of receivables or payables in the balance sheet.
Derecognition of financial instrumentsThe derecognition of a financial instru-ment takes place when the Group no longer controls the contractual rights that comprise the financial instrument, which is normally the case when the instrument is sold, or all the cash flows attributable to the instrument are passed through to an independent third party.
Derivative financial instrumentsThe Group uses derivative financial instruments such as foreign currency contracts, interest rate swaps and
Notes to consolidated financial statements
Hunter Douglas Annual Report 2013 ❯ Notes to consolidated financial statements

38
metals futures to hedge its risks associated with interest rate, metal commodities and foreign currency fluctuations. Such derivative financial instruments are stated at fair value. Derivatives are carried as assets when the fair value is positive and as liabilities when the fair value is negative. The fair value of a financial instrument is the amount for which an asset could be exchanged, or a liability settled, between knowledgeable, willing parties in an arm’s length transaction. Fair values are determined from listed market prices, price quotations from banks or from pricing models. Any gains or losses arising from changes in fair value on derivatives are taken directly to the income statement. No hedge accounting is applied except for cash flow hedges, which are recognized in other comprehensive income. For the purpose of hedge accounting, hedges are classified as cash flow hedges when hedging exposure to variability in cash flows that is either attributable to a particular risk associated with a recognized asset or liability or a highly probable forecast transaction or the foreign currency risk in an unrecognized firm commitment.Foreign currency differences arising on the retranslation of a financial liability designated as a hedge of a net investment in a foreign operation are recognized directly as a separate component of equity, to the extent that the hedge is effective. To the extent that the hedge is ineffective, such differ-ences are recognized in the statement of income.
Investment portfolioThe investment portfolio is reported separately on the balance sheet at fair value. Net results of the investment portfolio are reported separately. Third parties participating in the investment portfolio are presented separately under trade and other payables. The individual investments held by the various invest-ment funds are valued at fair value by the funds. The net asset values reported by the fund managers are adjusted (discounted) by management as management expects that it may not be able to fully realize the underlying fair values of the investments held by the investment funds. This assessment is made by individual funds and the valuation is adjusted accordingly.
RestatementsUntil financial year 2012, the Company’s joint venture Gardinia was proportion-ately consolidated under IAS 27/31. As of financial year 2013, the joint venture Gardinia is fully consolidated based on the additional guidance on protective versus substantive rights under the new IFRS 10 applicable as per 1 January 2013. The impact on the balance sheet, statement of income and equity is not material. The impact on total equity/non-controlling interest
is USD 6 million negative. The 2012 comparative figures have been restated accordingly. In addition, the Company identified two immaterial errors in the Company’s financial statements issued prior to 2013 and assessed that they had no material impact on the financial statements issued in prior periods. These errors related to the valuation of pension assets (USD 9.3 million) and property plant and equipment (USD 8.5 million), resulting in a net overstatement of total equity/retained earnings in the prior periods of USD 17.8 million. The company has adjusted these matters in line with IAS 8. The impact on the balance sheet, statement of income and equity is not material. The 2012 comparative figures have been restated accordingly.
IFRS accounting standards effective as from 2013The accounting policies as set out above have been applied consist-ently to all periods presented in the consolidated financial statements, with the exception of the application of IFRS 10 (Consolidated financial statements). IFRS 11 (Joint arrangements, IFRS 12 (Disclosures of interests in other companies) and IFRS 13 (Fair value measurement) and IAS 36R (Impairment of assets). The application of these standards had, other than mentioned in the preceding paragraph, no material impact on the financial statements.
IFRS accounting standards effective as from 2014There are no standards applicable as from 2014 which are likely to materi-ally impact the Company’s financial statements.
Notes to consolidated financial statements
Hunter Douglas Annual Report 2013 ❯ Notes to consolidated financial statements

39
Notes to consolidated financial statements
Hunter Douglas Annual Report 2013 ❯ Notes to consolidated financial statements
3. Segment information
The Company has determined its reportable segments based on its internal reporting practices and on how the Company’s management evaluates the performance of operations and allocates resources. The segments are organized and managed separately according to the nature of the products and services provided, with each segment representing a strategic business unit that offers different products and serves different markets. The window coverings products segment relates to sales and manufacturing of window coverings for commercial and residential use. The architectural products segment relates to sales and manufacturing of architectural products mainly for commercial use. The metal trading segment represents trading in metals mainly in contracts on bulk aluminium. No operating segments have been aggregated to form the above reportable business seg-ments. Management monitors the operating results of its business segments separately for the purpose of making decisions about resource allocation and performance assessment. Segment performance is evaluated based on net profit and is measured consistently with net profit in the consolidated financial statements. Transfer prices between business segments are set on an arm’s length basis in a manner similar to transactions with third parties. The Group’s geographical segments are determined by the location of the Group’s assets and operations. In comparison with last year, the operating segments “window covering products” and “architectural products” are now shown as separate reportable segments, after the reduction of activities in the investment portfolio. Last year’s reportable segment “investment portfolio” is now mainly included in “window covering products”.
Business segmentsThe following table presents revenue and income information and certain asset and liability information regarding the Group’s business segments for the years ended 31 December 2013 and 2012.
Amounts in millions
WindowCoverings
Architectural
Products
Metals
Trading
Total
| 2013 | | 2012 | | 2013 | | 2012 | | 2013 | | 2012 | | 2013 | | 2012 |
Revenue
Sales to external customers 2,151 2,108 485 480 2,636 2,588
Segment revenue 2,151 2,108 485 480 2,636 2,588
Total gross profit 872 841 168 167 16 18 1,056 1,026
Selling and marketing expense -451 -450 -92 -93 -543 -543
General and administrative expense -302 -302 -47 -55 -5 -6 -354 -363
Income from operations 119 89 29 19 11 12 159 120
Finance costs -23 -18 -2 -2 -25 -20
Finance income 2 17 4 2 21
Income before taxes 98 88 29 23 9 10 136 121
Taxes on income -9 -1 -17 -15 -3 -3 -29 -19
Net profit 89 87 12 8 6 7 107 102
Net profit attributable to non-controlling interest 1 1
Net profit attributable to equity shareholders 89 86 12 8 6 7 107 101
Assets and liabilities
Segment assets 1,579 1,753 480 522 149 175 2,208 2,450
Investment in an associate 4 1 1 1 5 2
Total assets 1,583 1,754 481 523 149 175 2,213 2,452
Segment liabilities 800 1,015 211 267 61 79 1,072 1,361
Total liabilities 800 1,015 211 267 61 79 1,072 1,361
Net assets employed 1,163 1,333 369 402 87 97 1,619 1,832
Other segment information
Capital expenditure
Property, plant and equipment 49 45 20 30 2 69 77
Depreciation property, plant and equipment 60 63 23 23 83 86
Intangibles 262 262 53 54 315 316
Amortization patents and trademarks 4 4 3 3 7 7
Non-recurring restructuring expenses 12 45 12 45
The financial information by region is reported separately on page 21.

40
Notes to consolidated financial statements
Hunter Douglas Annual Report 2013 ❯ Notes to consolidated financial statements
4. Revenues and expenses
Amounts in millions | 2013 | | 2012 |
Finance costs
Bank loans and overdraft -22 -15
Other loans (including non-cumulative redeemable preference shares) -3 -5
Total finance costs -25 -20
Finance income
Bank interest receivable 1 3
Net result investment portfolio 1 15
Non-operational exchange result 2
Other financial income 1
Total finance income 2 21
Non-recurring restructuring expenses are included
in the consolidated income statement as follows:
Cost of sales 8 27
Selling and marketing expense 2 9
General and administrative expense 2 9
12 45
Non-recurring restructuring expenses relate to Window Coverings and
consist mainly of reduction of employees
Depreciation, amortization and costs of inventories included
in consolidated income statement
Included in cost of sales:
Depreciation of property, plant and equipment 58 61
Costs of inventories recognized as an expense 1,538 1,519
1,596 1,580
Included in general and administrative expenses:
Minimum lease payments recognized as an operating lease expense 6 7
Amortization other intangibles 7 7
Employee benefits expense
Wages and salaries 690 687
Social security costs 149 131
Pension costs 42 18
Expense of share-based payments 5 1
886 837
Research costs
Research costs consist of 35 (2012: 32) charged directly to general and administrative expense in the
income statement.

41
Notes to consolidated financial statements
Hunter Douglas Annual Report 2013 ❯ Notes to consolidated financial statements
5. Business combination
In 2013 Hunter Douglas acquired the following companies:- 100% of Kaleidoscope, a Howell, Michigan based fabricator of window covering products since
December. Kaleidoscope has annual sales of about USD 6 million and employs 25 people.- 100% of Beauti-Vue, a Bristol, Wisconsin based fabricator of window covering products since
December. Beauti-Vue has annual sales of about USD 6 million and employs 18 people.
In 2012 Hunter Douglas acquired the following companies:- 100% of W.H. Produkter, a leading Danish manufacturer of made-to-measure window covering products
since April. W.H. Produkter has annual sales of about EUR 8 million and employs 60 people.- 100% of Gulf Coast Window Coverings, a Houston, Texas based fabricator of window covering products
since October. Gulf Coast Window Coverings has annual sales of USD 24 million and employs 130 people.
- 100% of Designer Blinds, an Omaha Nebraska based fabricator of window covering products since December. Designer Blinds has annual sales of USD 27 million and employs 103 people.
The fair value of the identifiable assets and liabilities of these companies determined as at the date of acquisition are:
Amounts in millions
Recognized
on acquisitions
| 2013 | | 2012 |
Inventories 2 5
Trade and other receivables 6
Cash and short-term deposits 1
Trade and other payables -5
Fair value of net assets 2 7
Goodwill arising on acquisitions 2 9
Total consideration 4 16
Cash outflow on acquisitions:
Cash paid -4 -16
Net cash acquired with acquisitions 0 1
-4 -15
Relative profitability of the acquisitions is in line with the business segments.

42
Notes to consolidated financial statements
Hunter Douglas Annual Report 2013 ❯ Notes to consolidated financial statements
6. Impairment testing of indefinitely lived goodwill, patents and licenses
The carrying amount of goodwill is allocated to the cash-generating units within the window coverings or architectural products segment.The recoverable amount of the units is based on value-in-use calculations. Those calculations use cash flow projections based on the budget for the coming year extrapolated with no growth to determine the termination value. A pre-tax Weighted Average Cost of Capital (WACC) of 9.6% (2012: 9.7%) has been used as a basis to discount the projected cash flows. Per unit local market conditions are accounted for in determining next year’s budget. The budgets are founded on achieved results in the preceding years and expectations on local industry developments going forward. With regard to the assessment of value in use, management believes that, considering the assumptions used, no reasonably expected change in any of the above key assumptions would cause the carrying value of the goodwill to materially exceed its recoverable amount.
7. Intangible fixed assets
Amounts in millions Goodwill Patents & Trademarks Total
| 2013 | | 2012 | | 2013 | | 2012 | | 2013 | | 2012 |
At 1 January 265 251 51 58 316 309
Acquisitions 4 9 4 9
Amortization -7 -7 -7 -7
Exchange 2 5 2 5
At 31 December 271 265 44 51 315 316
At 1 January
Cost 265 251 90 90 355 341
Accumulated amortization -39 -32 -39 -32
Net carrying amount 265 251 51 58 316 309
At 31 December
Cost 271 265 90 90 361 355
Accumulated amortization -46 -39 -46 -39
Net carrying amount 271 265 44 51 315 316
Goodwill is not amortized but is subject to annual impairment testing (see note 6). Patents and trademarks are amortized between 10 and 20 years. For the 2012 acquisitions the fair value amounts were provisional. These have been finalized in 2013 with no changes to the provisional amounts. For the 2013 acquisitions the fair value amounts are provisional. These will be finalized in 2014.

43
Notes to consolidated financial statements
Hunter Douglas Annual Report 2013 ❯ Notes to consolidated financial statements
8. Property, plant and equipment
Land &
Buildings
Machinery &
Equipment
Other fixed
assets
Total
Amounts in millions
| 2013 | | 2012 | | 2013 | | 2012 | | 2013 | | 2012 | | 2013 | | 2012 |
At 1 January, net of accumulated depreciation 331 336 228 226 25 23 584 585
Restatement (see note 2) 1 3 2 6
At 1 January (restated) 331 337 228 229 25 25 584 591
Additions 9 15 57 59 3 3 69 77
Disposals -5 -5 -4 -2 -1 -1 -10 -8
Depreciation charge for the year -20 -21 -60 -62 -3 -3 -83 -86
Exchange 5 4 1 10
At 31 December, net of accumulated depreciation 315 331 221 228 24 25 560 584
At 1 January
Cost 573 564 1,073 1,035 64 63 1,710 1,662
Accumulated depreciation -242 -227 -845 -806 -39 -38 -1,126 -1,071
Net carrying amount 331 337 228 229 25 25 584 591
At 31 December
Cost 568 573 1,089 1,073 64 64 1,721 1,710
Accumulated depreciation -253 -242 -868 -845 -40 -39 -1,161 -1,126
Net carrying amount 315 331 221 228 24 25 560 584
Included in Property, plant and equipment at 31 December 2013 is an amount of 24 (2012: 22) relating to expenditure in construction.
9. Other financial non-current assets
Amounts in millions | 2013 | | 2012 |
Receivables from key management employees 4 5
Other long-term receivables 11 7
Other 10 8
25 20
10. Inventories
Amounts in millions | 2013 | | 2012 |
Raw materials (at cost) 404 445
Work-in-progress (at cost) 47 48
Finished goods:
- At cost 321 330
- Provision -140 -138
632 685
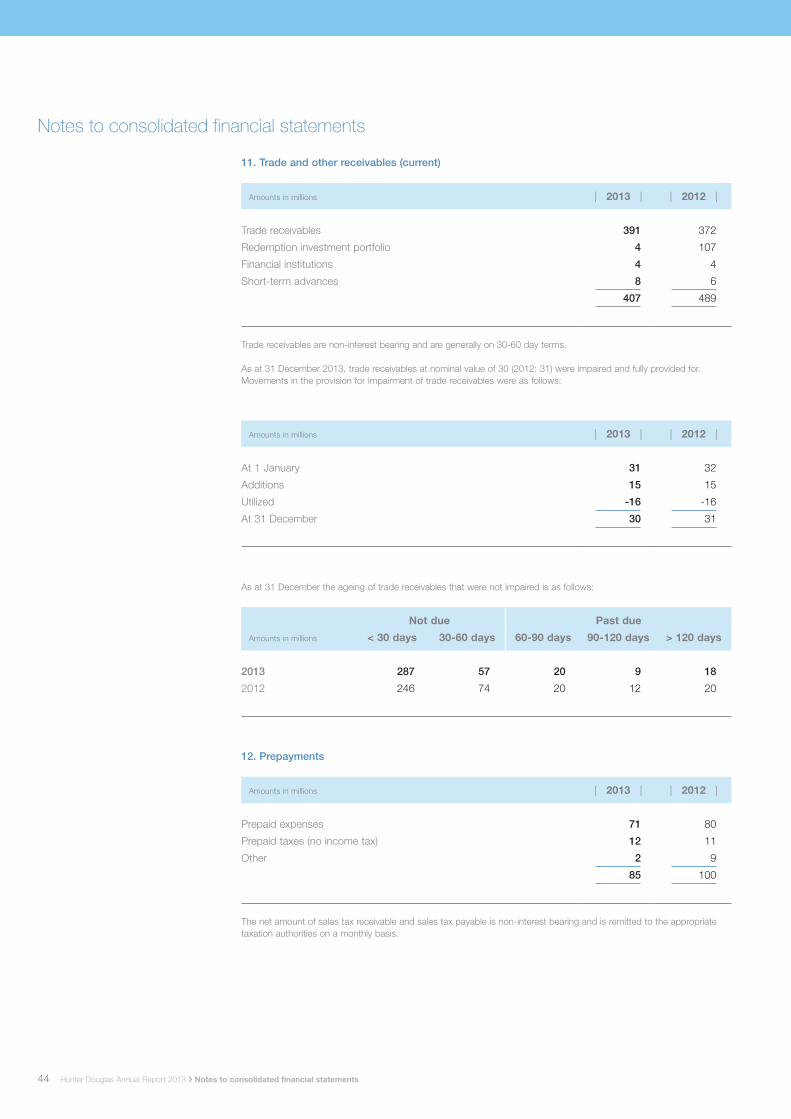
44
Notes to consolidated financial statements
Hunter Douglas Annual Report 2013 ❯ Notes to consolidated financial statements
11. Trade and other receivables (current)
Amounts in millions | 2013 | | 2012 |
Trade receivables 391 372
Redemption investment portfolio 4 107
Financial institutions 4 4
Short-term advances 8 6
407 489
Trade receivables are non-interest bearing and are generally on 30-60 day terms.
As at 31 December 2013, trade receivables at nominal value of 30 (2012: 31) were impaired and fully provided for.Movements in the provision for impairment of trade receivables were as follows:
Amounts in millions | 2013 | | 2012 |
At 1 January 31 32
Additions 15 15
Utilized -16 -16
At 31 December 30 31
As at 31 December the ageing of trade receivables that were not impaired is as follows:
Not due Past due
Amounts in millions < 30 days 30-60 days 60-90 days 90-120 days > 120 days
2013 287 57 20 9 18
2012 246 74 20 12 20
12. Prepayments
Amounts in millions | 2013 | | 2012 |
Prepaid expenses 71 80
Prepaid taxes (no income tax) 12 11
Other 2 9
85 100
The net amount of sales tax receivable and sales tax payable is non-interest bearing and is remitted to the appropriate taxation authorities on a monthly basis.

45Hunter Douglas Annual Report 2013 ❯ Notes to consolidated financial statements
Notes to consolidated financial statements
13. Cash and short-term deposits
Cash at bank and in hand earns interest at floating rates based on market conditions. Short-term deposits are made for varying periods of between one day and 3 months depending on the immediate cash requirements of the Group, and earn interest at the respective short-term deposit rates. At 31 December 2013 the fair value of cash and cash equivalents is 32 (2012: 50).
At 31 December 2013, the Group had available 345 (2012: 222) of undrawn committed borrowing facili-ties in respect of which all conditions precedent had been met. For the purposes of the consolidated cash flow statement, cash and cash equivalents comprise the following at 31 December:
Amounts in millions | 2013 | | 2012 |
Cash at bank and in hand 28 45
Short-term deposits 4 5
32 50
Funds in certain countries in which the Group operates are subject to varying exchange regulations. No material restrictions exist for transfers of a current nature, such as dividends from subsidiaries. A few countries have more severe restrictions on remittances of a capital nature, which are immaterial to the Group.
14. Issued capital and reserves
Ordinary shares
Numbers x 1,000 | 2013 | | 2012 |
E 0.24 each E 0.24 each
Issued and fully paid-in
At 1 January 35,432 35,432
At 31 December 35,432 35,432
Treasury shares
At 1 January 649 366
At 31 December 646 649
The Sonnenberg Family owns at year-end 2013 28,764,039 (2012: 28,764,039) common shares of Hunter Douglas N.V. representing 81.18% (2012: 81.18%) of the common shares of the Company.
The Company has two share option schemes under which options to subscribe for the Company’s shares have been granted to certain executives and senior employees (note 21).
Share premium: under present Dutch Law, substantially all share premium may be distributed as stock dividend free from Dutch dividend withholding tax.
The foreign currency translation reserve and the cash flow hedge reserve are legal reserves and when negative the retained earnings cannot be distributed for this amount.
Retained earnings: this reserve is freely distributable.
There are no external capital requirements.

46
Notes to consolidated financial statements
15. Interest-bearing loans and borrowings
Amounts in millions
Currency Interest
rate
Maturity
date
| 2013 | | 2012 |
Current
Bank overdraft Various * N/A 32 50
Short-term bank loans Various * N/A 36 32
Current Portion of long-term debt EUR Various * N/A 22
Current Portion of long-term debt USD 4.70 N/A 1
Current Portion of long-term debt USD 5.01 N/A 100
69 204
Non-current
LB Lux EUR Various * 2015 55
RBS USD Various * 2015 90 90
NIBC EUR Various * 2016 41 33
RABO EUR Various * 2016 69 66
ABN AMRO EUR Various * 2017 79
ING EUR Various * 2017 40 124
Long-term loans (fixed) USD 4.70 2014 1
295 393
Preferred shares
Preferred shares EUR Various * N/A 11 11
* Mostly at Interbank rates plus a margin
Average life of long-term loans is 2.15 years (2012: 3.70 years); all loans are at variable rates of interest. The balance consists mainly of multi-currency lines of credit at Interbank interest rates with varying spreads. All loans are unsecured.
Hunter Douglas N.V.’s Articles of Association fix the annual dividend on each preferred share at a percentage of the par value. This percentage amounts to 2.25% per annum over the European Central Bank’s deposit rate on the last working day of May of the affected year.
Hunter Douglas Annual Report 2013 ❯ Notes to consolidated financial statements
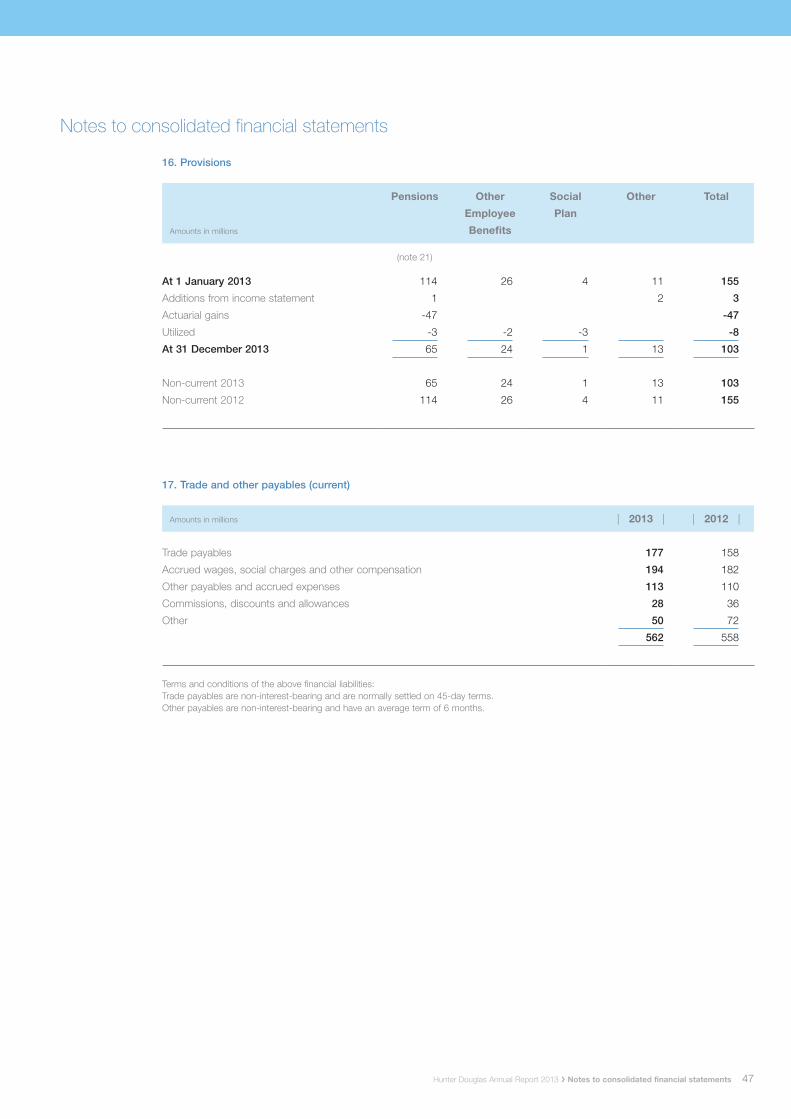
47Hunter Douglas Annual Report 2013 ❯ Notes to consolidated financial statements
Notes to consolidated financial statements
16. Provisions
Amounts in millions
Pensions Other
Employee
Benefits
Social
Plan
Other Total
(note 21)
At 1 January 2013 114 26 4 11 155
Additions from income statement 1 2 3
Actuarial gains -47 -47
Utilized -3 -2 -3 -8
At 31 December 2013 65 24 1 13 103
Non-current 2013 65 24 1 13 103
Non-current 2012 114 26 4 11 155
17. Trade and other payables (current)
Amounts in millions | 2013 | | 2012 |
Trade payables 177 158
Accrued wages, social charges and other compensation 194 182
Other payables and accrued expenses 113 110
Commissions, discounts and allowances 28 36
Other 50 72
562 558
Terms and conditions of the above financial liabilities:Trade payables are non-interest-bearing and are normally settled on 45-day terms.Other payables are non-interest-bearing and have an average term of 6 months.

48
Notes to consolidated financial statements
18. Income tax
Major components of income tax expense for the years ended 31 December 2013 and 2012 are:
Amounts in millions | 2013 | | 2012 |
Consolidated income statement
Current income tax
Current income tax charge 29 30
Adjustments in respect of current income tax of previous years -3 9
Deferred income tax
Relating to origination and reversal of temporary differences and
recognition of tax losses 3 -20
29 19
A reconciliation of income tax expense applicable to accounting profit before income tax at the statutory income tax rate to income tax expense at the Group’s effective income tax rate for the years ended 31 December 2013 and 2012 is as follows:
Amounts in millions | 2013 | | 2012 |
Accounting profit before income tax 136 121
At Dutch statutory income tax rate of 25% (2012: 25%) 34 30
Tax loss carry forward not valued in prior years -5 -1
Adjustments in respect of current income tax of previous years 2
Impact different tax rates per country -2 -10
At effective income tax rate of 21.3% (2012: 15.7%) 29 19
Income tax expense reported in consolidated income statement 29 19
Hunter Douglas Annual Report 2013 ❯ Notes to consolidated financial statements

49Hunter Douglas Annual Report 2013 ❯ Notes to consolidated financial statements
Notes to consolidated financial statements
Deferred income tax at 31 December relates to the following:
Consolidated
Balance Sheet
Consolidated
Income Statement
Via
O.C.I.Amounts in millions
| 2013 | | 2012 | | 2013 | | 2012 | | 2013 | | 2012 |
Deferred income tax assets
Losses available for offset against
future taxable income 84 100 -16 21
Temporary valuation differences 25 47 12 -1 -34 3
109 147
Deferred income tax liabilities
Other 2 3 1
2 3
Deferred income tax income (expense) -3 20 -34 3
The Group has unused tax losses of 46 (2012: 61), of which 19 expires within 5 years, that are available for offset against future taxable profits of the companies in which the losses arose.
19. Earnings per share
Basic earnings per share amounts are calculated by dividing net profit for the year attributable to ordinary equity holders of the parent by the weighted average number of ordinary shares outstanding during the year.
Diluted earnings per share amounts are calculated by dividing the net profit attributable to ordinary shareholders by the weighted average number of ordinary shares outstanding during the year (adjusted for the effects of dilutive options).
The income and share data used in the basic and diluted earnings per share computations is as follows:
Amounts in millions | 2013 | | 2012 |
Net profit attributable to equity shareholders 107 101
Numbers x 1,000 | 2013 | | 2012 |
Weighted average number of ordinary shares for basic earnings per share 34,785 34,917
Effect of dilution:
Adjusted weighted average number of ordinary shares for diluted earnings per share 34,785 34,917
There have been no other transactions involving ordinary shares or potential ordinary shares since the reporting date and before the completion of these financial statements.

50
Notes to consolidated financial statements
20. Dividends paid and proposed
Amounts in millions | 2013 | | 2012 |
Declared and paid during the year:
Equity dividends on ordinary shares:
Final dividend for 2012: EUR 1.25 (2011: EUR 1.25) 58 55
58 55
Proposed for approval at AGM
(not recognized as a liability as at 31 December):
Equity dividends on ordinary shares:
Final dividend for 2013: EUR 1.25 (2012: EUR 1.25) 60 57
60 57
21. Employee benefits
Employee share incentive plansAt year-end, directors and employees of the Hunter Douglas Group had the following options to buy common shares of Hunter Douglas N.V. The table below illustrates the number and prices of share options:
Issued
in
Number of
share options
Price per
share (EUR)*
Year of
expiration
| 2013 | | 2012 |
2008 523,334 17.00 2013
2013 500,000 31.00 2018
500,000 523,334
* These prices equal the trading price of the common shares of Hunter Douglas N.V. on the Amsterdam Stock Exchange on the dates when these options were granted. One option represents the right to buy one common share.
Hunter Douglas has for many years operated a stock option plan. The purpose of the plan and of the stock options granted under it is to foster long-term employment of valued executives and employees of the Hunter Douglas Group, to associate them with the financial results of the Group and to interest them in the development of the public market for the shares of the Company. Under the plan, stock options are granted in each case for a period of five years with vesting starting after two years. Options granted which have vested are exercisable as long as the beneficiary of the option remains in the employment of the Hunter Douglas Group. In the event of death, the option remains exercisable by the executor of the decedent within a period of three months. Balance treasury shares at year-end 2013: 646,089 (2012: 649,423). The carrying amount of the liability relating to the cash-settled options at 31 December 2013 is 6 (2012: 9). During 2013 an amount of 5 is added to the provision and charged to the statement of income.
Hunter Douglas Annual Report 2013 ❯ Notes to consolidated financial statements
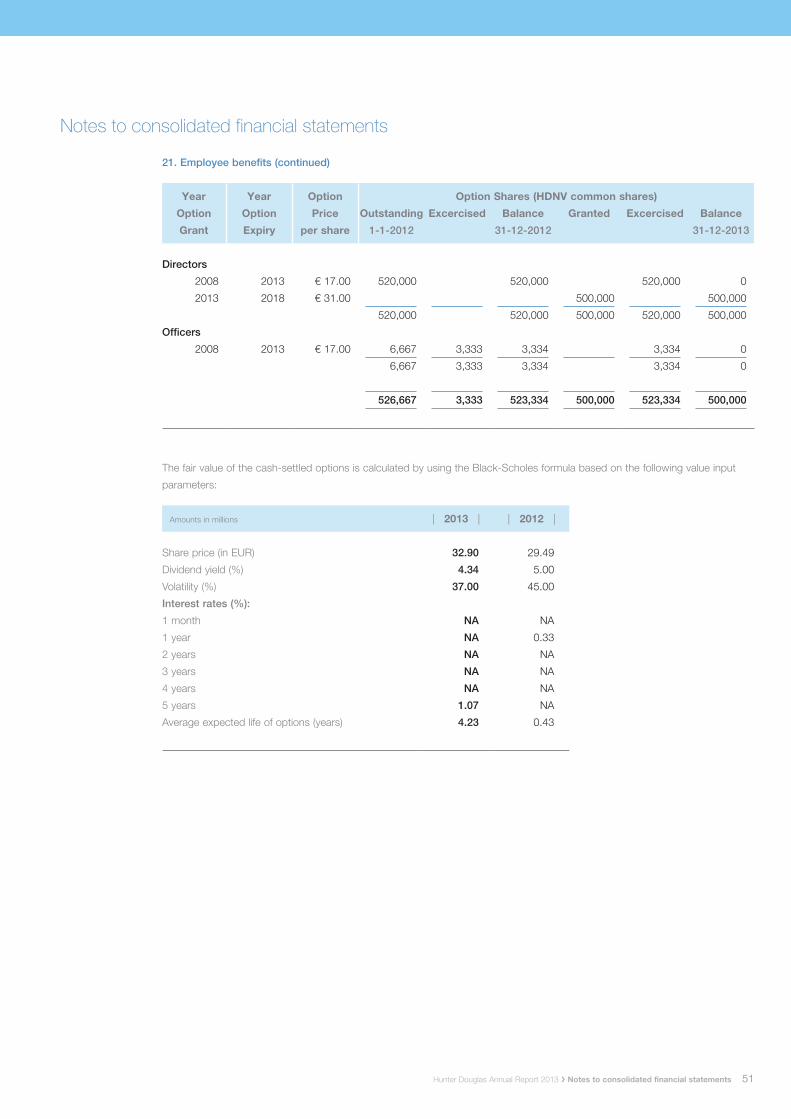
51Hunter Douglas Annual Report 2013 ❯ Notes to consolidated financial statements
Notes to consolidated financial statements
21. Employee benefits (continued)
Year
Option
Grant
Year
Option
Expiry
Option
Price
per share
Option Shares (HDNV common shares)
Outstanding
1-1-2012
Excercised Balance
31-12-2012
Granted Excercised Balance
31-12-2013
Directors
2008 2013 € 17.00 520,000 520,000 520,000 0
2013 2018 € 31.00 500,000 500,000
520,000 520,000 500,000 520,000 500,000
Officers
2008 2013 € 17.00 6,667 3,333 3,334 3,334 0
6,667 3,333 3,334 3,334 0
526,667 3,333 523,334 500,000 523,334 500,000
›
The fair value of the cash-settled options is calculated by using the Black-Scholes formula based on the following value input
parameters:
Amounts in millions | 2013 | | 2012 |
Share price (in EUR) 32.90 29.49
Dividend yield (%) 4.34 5.00
Volatility (%) 37.00 45.00
Interest rates (%):
1 month NA NA
1 year NA 0.33
2 years NA NA
3 years NA NA
4 years NA NA
5 years 1.07 NA
Average expected life of options (years) 4.23 0.43

52
Notes to consolidated financial statements
21. Employee benefits (continued)
Pension plans
Defined benefit plansEmployee pension plans have been established in many countries in accordance with the legal requirements, customs and the local situation in the countries involved. The majority of employees in the Netherlands, United Kingdom and North America are covered by defined benefit plans. The defined benefit plans in the Netherlands and North America are based on average wage earned, in the United Kingdom is the defined benefit plan based on last wage earned. The benefits provided by these plans are based on employees’ years of service and compensation levels. The measurement date for defined benefit plans is 31 December.
Contributions are made by the Company, except for the Netherlands, as necessary, to provide assets sufficient to meet the benefits payable to defined benefit pension plan participants. These contributions are determined based upon various factors, including funded status, legal and tax considerations as well as local customs. For the Netherlands the annual contribution is limited to a maximum of 35% of the pension basis combined for the employer and employees and with no obligations to make up a deficit. The US pension plan was frozen as of 31 December 2012. No future benefits accruals and no new participants are allowed.
The following tables summarize the components of the net benefit expense recognized in the consolidated income statement and the funded status and amounts recognized in the consolidated balance sheet, as well as the principal assumptions applied.
The principal assumptions used for the purpose of the actuarial valuation are as follows:
Pension plans
% NL US UK
| 2013 | | 2012 | | 2013 | | 2012 | | 2013 | | 2012 |
Discount rate 3.00 2.83 5.25 4.50 4.50 4.50
Future salary increase 2.00 2.00 4.00 4.00 3.30 2.90
Inflation assumption 0.75 0.00 3.00 3.00 3.30 2.90
Sensitivity analysis: If the discount rate in the US increases (decreases) with 0.25% the pension provision will decrease (increase) with around 13, for the other plans changes are not expected to have a material effect on equity or profit-and-loss.
The amount recognized in the balance sheet in respect of the Group’s defined benefit retirement plans is as follows:
Amounts in millions NL Pension plan
| 2013 | | 2012 | | 2011 | | 2010 | | 2009 |
Defined benefit obligations -391 -338 -290 -308 -313
Fair value of plan assets 386 332 290 308 313
Funded status -5 -6 0 0 0
Net liability in balance sheet -5 -6 0 0 0
No economic benefits are available to the Company in the form of refunds from the NL pension plan or reduction in future contributions to the NL pension plan.
Hunter Douglas Annual Report 2013 ❯›Notes to consolidated financial statements

53Hunter Douglas Annual Report 2013 ❯ Notes to consolidated financial statements
Notes to consolidated financial statements
21. Employee benefits (continued)
Amounts in millions US Pension plan
| 2013 | | 2012 | | 2011 | | 2010 | | 2009 |
Defined benefit obligations -249 -274 -266 -217 -191
Fair value of plan assets 202 183 170 178 171
Funded status -47 -91 -96 -39 -20
Net liability in balance sheet -47 -91 -96 -39 -20
Amounts in millions UK Pension plan
| 2013 | | 2012 | | 2011 | | 2010 | | 2009 |
Defined benefit obligations -63 -62 -55 -51 -52
Fair value of plan assets 50 45 42 44 43
Funded status -13 -17 -13 -7 -9
Net liability in balance sheet -13 -17 -13 -7 -9
Amounts recognized in profit or loss in respect of the defined benefit plans are as follows:
Pension plans
Amounts in millions NL US UK
| 2013 | | 2012 | | 2013 | | 2012 | | 2013 | | 2012 |
Current service cost 1 5 9 1 1
Curtailment gain -22
Interest cost on benefit obligation 10 13 11 10 2 3
Interest return on plan assets -10 -13 -8 -9 -2 -3
Net benefit expense 1 5 3 -12 1 1
Actual return on plan assets 40 42 25 18 7 3

54
Notes to consolidated financial statements
21. Employee benefits (continued)
Changes in the fair value of the defined benefit obligations are as follows:
Pension plans
Amounts in millions NL US UK
| 2013 | | 2012 | | 2013 | | 2012 | | 2013 | | 2012 |
Opening defined benefit obligations 338 290 274 266 62 55
Current service cost 5 5 9 1 1
Curtailment gain -22
Employee contribution 4
Interest cost on benefit obligation 10 13 11 10 2 3
Benefits paid -14 -14 -6 -5 -2 -2
Actuarial (gain) loss 36 36 -30 16 -1 3
Exchange differences on plans 16 4 1 2
Closing defined benefit obligations 391 338 249 274 63 62
The liability in respect of the pension obligations of Hunter Douglas Europe (NL) is based on and calculated pursuant to IAS 19. Pursuant to the Dutch Pension and Savings Law (Pensioen- en Spaarfondsenwet), Hunter Douglas Europe is required to provide all pension benefits through a regulated pension fund.Hunter Douglas Europe has contracted with a single-employer fund (Stichting Pensioenfonds Hunter Douglas) to provide these benefits. As of the date of the financial statements, Hunter Douglas Europe has satisfied all its liabilities to the fund and has no further financial obligations to the fund.
Changes in the fair value of the plan assets are as follows:
Pension plans
Amounts in millions NL US UK
| 2013 | | 2012 | | 2013 | | 2012 | | 2013 | | 2012 |
Opening fair value of plan assets 332 290 183 170 45 42
Interest return on plan assets 10 13 8 9 2 3
Contributions 10 9 2 1 1
Benefits paid -14 -14 -6 -5 -2 -2
Actuarial gain (loss) 31 29 15 9 3
Exchange differences 17 5 1 1
Closing fair value of plan assets 386 332 202 183 50 45
Of which:
Bonds 151 149 56 50
Equities 215 158 101 73 47 44
Other 20 25 45 60 3 1
The actual return on plan assets amounts 12.0% 14.5% 13.3% 10.5% 14.5% 6.5%
The plan assets do not include any of the Group’s own financial instruments, nor any property occupied or other assets used by the Group. The Group expects to contribute approximately 5 to its defined benefit plans in 2014. Contribution by employer will not materially differ from previous years.
Defined contribution plansThe expense of the defined contribution plans for 2013 amounts to 37 (2012: 30).
Hunter Douglas Annual Report 2013 ❯›Notes to consolidated financial statements

55Hunter Douglas Annual Report 2013 ❯ Notes to consolidated financial statements
Notes to consolidated financial statements
22. Commitments and contingencies
Operating lease commitments - Group as lesseeThe Group has entered into commercial leases on certain premises, motor vehicles and items of small machinery. These leases have an average life of between 5 and 10 years with renewal terms included in the contracts. Renewals at market conditions are at the option of the specific entity that holds the lease. There are no restrictions placed upon the lessee by entering into these leases.
Future minimum rentals payable under non-cancelable operating leases at 31 December are as follows:
Amounts in millions | 2013 | | 2012 |
Within one year 22 23
After one year but not more than five years 47 43
More than five years 15 3
Capital commitmentsAt 31 December 2013, the Group has commitments for capital expenditures of 11 (2012: 13).
Legal claimsLegal claims have been filed against the Company in the course of its normal business. Management together with their legal counsel have only recognized a provision if it is probable that an outflow of resources embodying economic benefits will be required to settle the obligation.
GuaranteesHunter Douglas N.V. has the following contingent liabilities at 31 December 2013:
- The Company is contingently liable for guarantees given mainly for its subsidiaries (guarantees under article 2:403 of Dutch Civil Code), on which no material losses are expected.
- The Company forms part of a fiscal unity for Dutch corporate income tax purposes, and as such is jointly and severally liable for the liabilities of the whole fiscal unity.
23. Related party disclosure
The consolidated financial statements include the financial statements of Hunter Douglas N.V. and the subsidiaries as listed on page 66 and 67.
Compensation of key management employees (directors and officers) of the Group
Amounts in millions | 2013 | | 2012 |
Short-term employee benefits 17 19
Share-based payments 5 1
Total compensation paid to key management employees 22 20
As per year-end loans and advances to key management employees amounted to 4 (2012: 5), bearing market interest.

56
Notes to consolidated financial statements
24. Capital management and financial risk management objectives and policies
The financing of the Group is based on a conservative capital structure. The Group has procedures and policies in place to control risks related to financial instruments. These policies and procedures include a clear segregation of duties between operating, settlement, accounting and controlling of all financial instruments used. The Group‘s senior management takes an active role in the risk management process. In addition, the geographical spread of the Company’s activities limits the exposures to concentrations of credit or market risk.
The Company attempts to minimize the counterparty credit risk associated with the financial instruments used by selecting counterparties that it assumes to be creditworthy, given their high credit ratings.
The Company does not have significant credit risk exposure to any individual customer or counterparty. A substantial part of trade receivables is covered by securities obtained, credit insurance or letters of credit. The Company invests in an investment portfolio. Also, the Company has concluded netting arrangements with some counterparties to offset financial instruments. Given their credit ratings, the remaining credit exposure with these counterparties is not considered of significance.
The following instruments are used:
a. Interest derivatives Interest derivatives are used to manage exposure to movements in interest rates and to assume trading
positions.
b. Foreign exchange derivatives Foreign exchange derivatives are used to manage the exposure of currency exchange rate risks
resulting from cash flows from (anticipated) business activities and financing arrangements denominated in foreign currencies and to assume trading positions. The Company holds certain foreign currency borrowings which provide a hedge against net investments in subsidiaries.
c. Commodity derivatives Commodity derivatives all relate to aluminum and are used to manage the exposure of the price and
timing risks on underlying (anticipated) business activities and to assume trading positions. The contract amounts of financial instruments are indicative of the Company’s use of derivatives but are not neces-sarily a measure for the exposure to market or credit risk through its use of financial instruments.
Interest, commodity and foreign exchange derivatives are carried at their fair value. The interest, com-modity and foreign exchange derivatives generally mature within one year. All changes in the fair value of derivatives are taken directly to the income statement as no hedge accounting is applied, with the exception of interest derivatives for which cash flow hedge accounting is applied. The cash flow hedges of the expected future interest payments were assessed to be highly effective and a net unrealized loss of 7 (net of taxes) relating to the hedging instruments is included in other comprehensive income. The major part of the cash flow hedges expires in 2017.
The Company also enters into forward sales and purchase contracts for commodities that are settled by physical delivery of receipt of the commodity. These sales and purchases contracts do not qualify as derivatives under IAS 39.
Interest rate risk tableThe following table demonstrates the sensitivity to a reasonably possible change in interest rates, with all other variances held constant, of the Group’s profit before tax (through the impact on floating rate borrow-ings). The effect on equity excludes the effect on profit before tax which ends up in equity.
Amounts in millions
Increase/decrease
in basis points
Effect on
profit before tax
Effect
on equity
2013
Euro 50 1 1
US dollar 50
2012
Euro 50 2 1
US dollar 50
Hunter Douglas Annual Report 2013 ❯ Notes to consolidated financial statements

57Hunter Douglas Annual Report 2013 ❯ Notes to consolidated financial statements
Notes to consolidated financial statements
24. Capital management and financial risk management objectives and policies (continued)
Foreign currency riskAs a result of significant operations in Europe, the Group’s balance sheet can be affected significantly by movements in the US dollar / Euro exchange rates. The Group seeks to mitigate the effect of its structural currency exposure by borrowing in Euros. Between 20% and 50% of the Group’s investment in non-US dollar operations will be hedged in this manner.
The following table demonstrates the sensitivity to a reasonably possible change in the Euro exchange rate, with all other variances held constant, of the Group’s profit before tax (due to changes in the fair value of monetary assets and liabilities) and the Group’s equity (due to changes in the net investment hedges, excluding the effect on profit before tax which ends up in equity).
Amounts in millions
Increase/decrease
Euro exchange rate
Effect on
profit before tax
Effect
on equity
2013 5% 7 11
-5% -8 -11
2012 5% 12 17
-5% -14 -17
25. Financial instruments
Derivative financial instruments
Amounts in millions Face amount Fair value
Currency forward
Buy 241 3
Sell -47
194 3
Currency options
Buy - call 122 1
Buy - put 244 3
Sell - call -290 -2
Sell - put -227 -1
-151 1
Currency forwards are valued at existing forward rates at the balance sheet date.Currency options are valued at their market value at the balance sheet date.
Amounts in millions Tonnage Assets Liabilities
Metal derivatives
Physical forwards 3,870 1
Futures -46,962 6
7 0
The value of the metal derivatives is based on quoted metal market prices. Commodity contracts that are used for trading by Hunter Douglas Metals Inc. are also considered as derivatives and also valued based on quoted metal market prices.
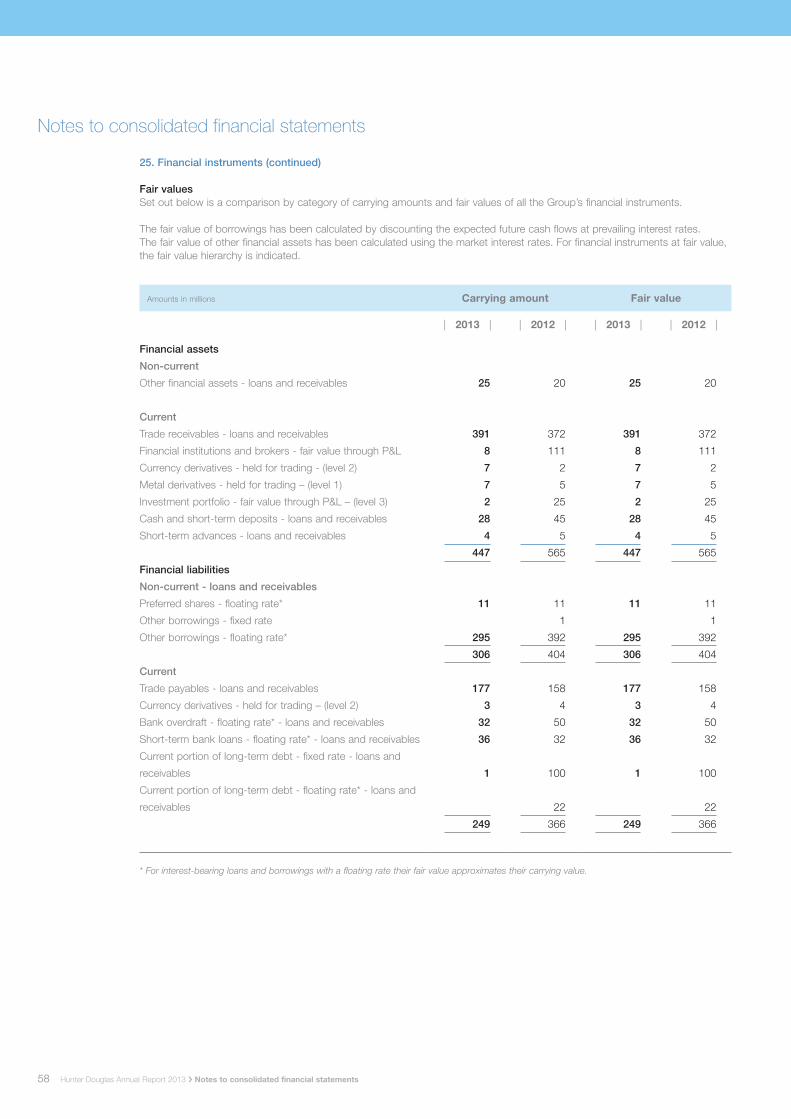
58
Notes to consolidated financial statements
25. Financial instruments (continued)
Fair valuesSet out below is a comparison by category of carrying amounts and fair values of all the Group’s financial instruments.
The fair value of borrowings has been calculated by discounting the expected future cash flows at prevailing interest rates.The fair value of other financial assets has been calculated using the market interest rates. For financial instruments at fair value, the fair value hierarchy is indicated.
Amounts in millions Carrying amount Fair value
| 2013 | | 2012 | | 2013 | | 2012 |
Financial assets
Non-current
Other financial assets - loans and receivables 25 20 25 20
Current
Trade receivables - loans and receivables 391 372 391 372
Financial institutions and brokers - fair value through P&L 8 111 8 111
Currency derivatives - held for trading - (level 2) 7 2 7 2
Metal derivatives - held for trading – (level 1) 7 5 7 5
Investment portfolio - fair value through P&L – (level 3) 2 25 2 25
Cash and short-term deposits - loans and receivables 28 45 28 45
Short-term advances - loans and receivables 4 5 4 5
447 565 447 565
Financial liabilities
Non-current - loans and receivables
Preferred shares - floating rate* 11 11 11 11
Other borrowings - fixed rate 1 1
Other borrowings - floating rate* 295 392 295 392
306 404 306 404
Current
Trade payables - loans and receivables 177 158 177 158
Currency derivatives - held for trading – (level 2) 3 4 3 4
Bank overdraft - floating rate* - loans and receivables 32 50 32 50
Short-term bank loans - floating rate* - loans and receivables 36 32 36 32
Current portion of long-term debt - fixed rate - loans and
receivables 1 100 1 100
Current portion of long-term debt - floating rate* - loans and
receivables 22 22
249 366 249 366
* For interest-bearing loans and borrowings with a floating rate their fair value approximates their carrying value.
Hunter Douglas Annual Report 2013 ❯ Notes to consolidated financial statements
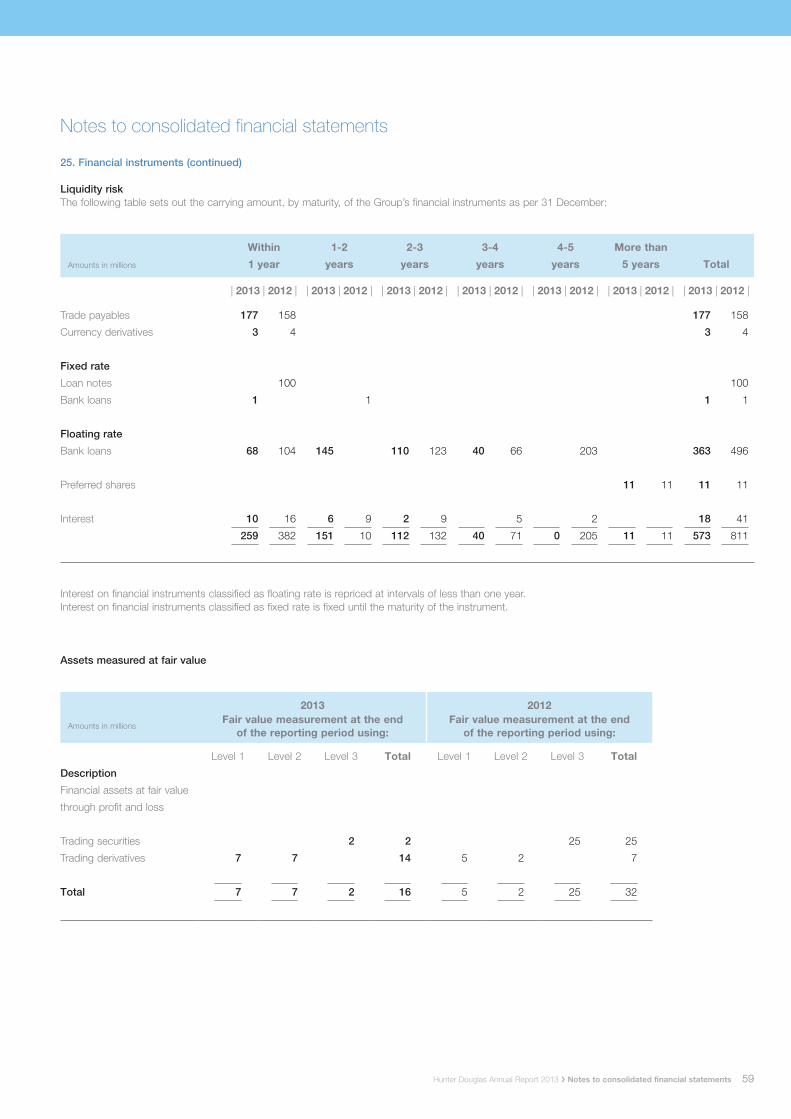
59Hunter Douglas Annual Report 2013 ❯ Notes to consolidated financial statements
25. Financial instruments (continued)
Liquidity riskThe following table sets out the carrying amount, by maturity, of the Group’s financial instruments as per 31 December:
Within
1 year
1-2
years
2-3
years
3-4
years
4-5
years
More than
5 years TotalAmounts in millions
| 2013 | 2012 | | 2013 | 2012 | | 2013 | 2012 | | 2013 | 2012 | | 2013 | 2012 | | 2013 | 2012 | | 2013 | 2012 |
Trade payables 177 158 177 158
Currency derivatives 3 4 3 4
Fixed rate
Loan notes 100 100
Bank loans 1 1 1 1
Floating rate
Bank loans 68 104 145 110 123 40 66 203 363 496
Preferred shares 11 11 11 11
Interest 10 16 6 9 2 9 5 2 18 41
259 382 151 10 112 132 40 71 0 205 11 11 573 811
Interest on financial instruments classified as floating rate is repriced at intervals of less than one year.Interest on financial instruments classified as fixed rate is fixed until the maturity of the instrument.
Assets measured at fair value
2013 2012
Amounts in millionsFair value measurement at the end
of the reporting period using:Fair value measurement at the end
of the reporting period using:
Level 1 Level 2 Level 3 Total Level 1 Level 2 Level 3 Total
Description
Financial assets at fair value
through profit and loss
Trading securities 2 2 25 25
Trading derivatives 7 7 14 5 2 7
Total 7 7 2 16 5 2 25 32
Notes to consolidated financial statements

60
Notes to consolidated financial statements
Hunter Douglas Annual Report 2013 ❯ Notes to consolidated financial statements
25. Financial instruments (continued)
Liabilities measured at fair value
2013 2012
Amounts in millionsFair value measurement at the end
of the reporting period using:Fair value measurement at the end
of the reporting period using:
Level 1 Level 2 Total Level 1 Level 2 Total
Description
Financial liabilities at fair value
through profit and loss
Trading derivatives 3 3 4 4
Interest swap 12 12 17 17
Total 15 15 21 21
Assets measured at fair value based on Level 3
2013 2012
Amounts in millionsFair value measurement at the
end of the reporting periodFair value measurement at the
end of the reporting period
Trading securities Total Trading securities Total
Financial assets at fair value
through profit and loss
Opening balance 25 25 192 192
Total gain in profit or loss 1 1 18 18
Settlements -24 -24 -185 -185
Closing balance 2 2 25 25
Total profit (loss) for the
period included in profit or
loss for assets held at the
end of the reporting period 1 1 18 18
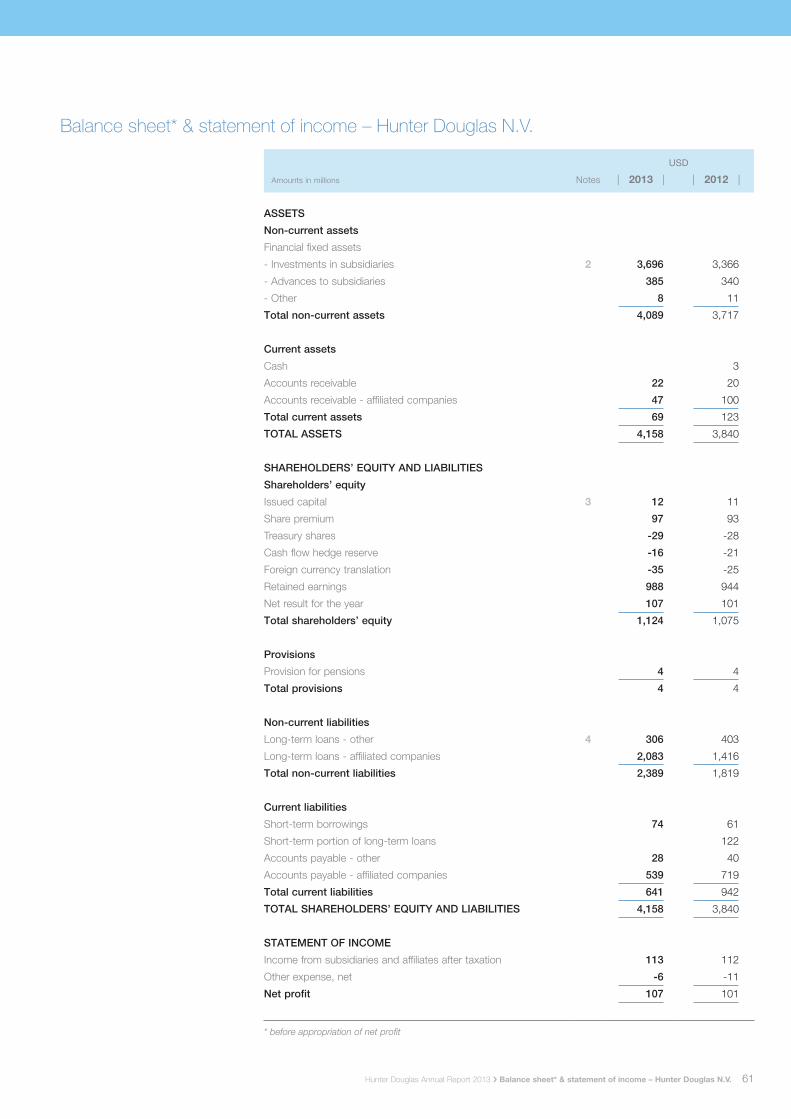
61Hunter Douglas Annual Report 2013 ❯ Balance sheet* & statement of income – Hunter Douglas N.V.
USD
Amounts in millions Notes | 2013 | | 2012 |
ASSETS
Non-current assets
Financial fixed assets
- Investments in subsidiaries 2 3,696 3,366
- Advances to subsidiaries 385 340
- Other 8 11
Total non-current assets 4,089 3,717
Current assets
Cash 3
Accounts receivable 22 20
Accounts receivable - affiliated companies 47 100
Total current assets 69 123
TOTAL ASSETS 4,158 3,840
SHAREHOLDERS’ EQUITY AND LIABILITIES
Shareholders’ equity
Issued capital 3 12 11
Share premium 97 93
Treasury shares -29 -28
Cash flow hedge reserve -16 -21
Foreign currency translation -35 -25
Retained earnings 988 944
Net result for the year 107 101
Total shareholders’ equity 1,124 1,075
Provisions
Provision for pensions 4 4
Total provisions 4 4
Non-current liabilities
Long-term loans - other 4 306 403
Long-term loans - affiliated companies 2,083 1,416
Total non-current liabilities 2,389 1,819
Current liabilities
Short-term borrowings 74 61
Short-term portion of long-term loans 122
Accounts payable - other 28 40
Accounts payable - affiliated companies 539 719
Total current liabilities 641 942
TOTAL SHAREHOLDERS’ EQUITY AND LIABILITIES 4,158 3,840
STATEMENT OF INCOME
Income from subsidiaries and affiliates after taxation 113 112
Other expense, net -6 -11
Net profit 107 101
* before appropriation of net profit
Balance sheet* & statement of income – Hunter Douglas N.V.

62
Notes to financial statements
1. Accounting policies
GeneralThe Company’s financial statements have been prepared in accordance with Title 9 of Book 2 of the Dutch Civil Code. As permitted by Article 2:362 paragraph 8 of this code, the Company’s financial state-ments have been prepared applying the same IFRS accounting policies as used in the consolidated finan-cial statements in order to maintain consistency between the figures in the consolidated and Company’s financial statements. In accordance with Article 2:402 of the Civil Code, an abbreviated version of the income statement is presented. The principal accounting policies adopted are the same as those set out in note 2 to the consolidated financial statements except that investments in subsidiaries are stated at net asset value as the Company effectively exercises influence of significance over the operational and financial activities of these investments. The net asset value is determined on the basis of the accounting principles applied by the Company.
3. Shareholders’ equity
Details are given in note 14 to the consolidated financial statements.
4. Long-term loans - other
Amounts in millions | 2013 | | 2012 |
Unsecured loans maturing in various installments through 2017 295 392
Average life of long-term loans is 2.15 years (2012: 3.71 years); all loans are at variable rates of interest. Maturities until 2017 are 2015: 145, 2016: 110 and 2017: 40.
Amounts in millions | 2013 | | 2012 |
Preferred shares 11 11
For the conditions in respect of preferred shares: see page 64.
2. Financial fixed assets
Investment in subsidiaries
Amounts in millions | 2013 | | 2012 |
Beginning of the year 3,366 3,222
Change during the year
Share in results, net 113 112
Actuarial gains (losses) 23 -11
Received dividends -13 -6
Increase, net 19 5
Exchange differences 188 44
Net change 330 144
End of year 3,696 3,366
Affiliated companies amount to 0.1 (2012: 0.1).
Hunter Douglas Annual Report 2013 ❯›Notes to financial statements

63Hunter Douglas Annual Report 2013 ❯ Notes to financial statements
Notes to financial statements
5. Contingencies
The Company is contingently liable for guarantees given mainly for its subsidiaries, on which no material losses are expected.
The Company forms part of a fiscal unity for Dutch corporate income tax purposes, and as such is jointly and separately liable for the liabilities of the whole fiscal unity.
8. Employees
The number of employees at year-end amounts 18 (2012: 19).
Rotterdam, 11 March 2014
Board of Directors
6. Employee benefits
Year
Option
Grant
Year
Option
Expiry
Option
Price
per share
Option Shares (HDNV common shares)
Outstanding
1 January
Granted Exercised Balance
31 December
see notes 1;2 see note 2
Directors
2013
R. Sonnenberg 2008 2013 € 17.00 500,000 500,000
R. Sonnenberg 2013 2018 € 31.00 500,000 500,000
J.T. Sherwin 2008 2013 € 17.00 20,000 20,000
520,000 500,000 520,000 500,000
2012
R. Sonnenberg 2008 2013 € 17.00 500,000 500,000
J.T. Sherwin 2008 2013 € 17.00 20,000 20,000
520,000 520,000
Compensation* paid to directors was: R. Sonnenberg nil (2012: nil), J.T. Sherwin 888 (2012: 1,351) as compensation and all other directors 53 (2012: 52) as directors fee. No pension contributions were paid. The share option expense for the directors was 5 (2012: 1).
* Amounts in thousands
7. Remuneration of the auditor
The total costs related to the services provided by Ernst & Young in the Netherlands were as follows (amounts in thousands):
| 2013 | | 2012 |
Audit of financial statements 418 419
Other audit services 7 2
Non-audit services 40 22
465 443

64
Additional information
1. Independent auditor’s report
To: The Board of Directors of Hunter Douglas N.V. and General Meeting of Shareholders
Report on the financial statementsWe have audited the financial state-ments 2013 of Hunter Douglas N.V., Curaçao (as set out on pages 30 to 63). The financial statements include the consolidated financial statements and the Company’s financial statements. The consolidated financial statements comprise the consolidated balance sheet as at 31 December 2013, the consolidated statements of income, comprehensive income, changes in equity and cash flows for the year then ended, and the notes, comprising a summary of the significant account-ing policies and other explanatory information. The Company’s financial statements comprise the Company’s balance sheet as at 31 December 2013, the Company’s statement of income for the year then ended and the notes, comprising a summary of the accounting policies and other explana-tory information.
Management’s responsibility Management is responsible for the preparation and fair presentation of these financial statements in accordance with International Financial Reporting Standards as adopted by the European Union and International Financial Reporting Standards as adopted by IASB and with Part 9 of Book 2 of the Dutch Civil Code, and for the preparation of the directors’ report in accordance with Part 9 of Book 2 of the Dutch Civil Code. Furthermore management is responsible for such internal control as it determines is necessary to enable the preparation of the financial statements that are free from material misstatement, whether due to fraud or error.
Auditor’s responsibilityOur responsibility is to express an opinion on these financial statements based on our audit. We conducted our audit in accordance with Dutch law, including the Dutch Standards on Auditing. This requires that we comply with ethical requirements and plan and perform the audit to obtain reasonable assurance about whether the financial statements are free from material misstatement.
An audit involves performing proce-dures to obtain audit evidence about the amounts and disclosures in the financial statements. The procedures selected depend on the auditor’s judgment, including the assessment of the risks of material misstatement of the financial statements, whether due to fraud or error.
In making those risk assessments, the auditor considers internal control rel-evant to the entity’s preparation and fair presentation of the financial statements in order to design audit procedures that are appropriate in the circumstances, but not for the purpose of expressing an opinion on the effectiveness of the entity’s internal control. An audit also includes evaluating the appropriateness of accounting policies used and the reasonableness of accounting estimates made by management, as well as evaluating the overall presentation of the financial statements.
We believe that the audit evidence we have obtained is sufficient and appropriate to provide a basis for our audit opinion.
Opinion with respect to the consolidated financial statements In our opinion, the consolidated financial statements give a true and fair view of the financial position of Hunter Douglas N.V. as at 31 December 2013 its result and its cash flows for the year then ended in accordance with International Financial Reporting Standards as adopted by the European Union and International Financial Reporting Standards as adopted by IASB and with Part 9 of Book 2 of the Dutch Civil Code.
Opinion with respect to the Company’s financial statementsIn our opinion, the Company’s financial statements give a true and fair view of the financial position of Hunter Douglas N.V. as at 31 December 2013 and of its result for the year then ended in accordance with Part 9 of Book 2 of the Dutch Civil Code.
Report on other legal and regulatory requirementsPursuant to the legal requirement under Section 2:393 sub 5 at e and f of the Dutch Civil Code, we have no deficien-cies to report as a result of our exami-nation whether the directors’ report, to the extent we can assess, has been prepared in accordance with Part 9 of Book 2 of this Code, and whether the information as required under Section 2:392 sub 1 at b-h has been annexed. Further we report that the directors’ report, to the extent we can assess, is consistent with the financial statements as required by Section 2:391 sub 4 of the Dutch Civil Code.
Rotterdam, the Netherlands, 11 March 2014
Ernst & Young Accountants LLP
/S/ P.W.J. Laan
2. Appropriation of profits
Common sharesHunter Douglas N.V.’s Articles of Association require the general meeting of common and preferred shareholders to determine the value of the annual common share dividend and the meeting of common shareholders to decide that the dividend will be distrib-uted in cash or, alternatively, shares. The directors recommend a cash dividend of EUR 1.25 per common share.
Preferred sharesHunter Douglas N.V.’s Articles of Association fix the annual dividend on each preferred share at a percentage of the par value. This percentage amounts to 2.25% per annum over the European Central Bank’s deposit rate on the last working day of May of the affected year. The general meeting of preferred shareholders is to decide whether such dividend is distributed in cash or, alternatively, shares.
3. Shareholders’ meetings
The shareholders’ meetings will be held on 10 June 2014 at the Avila Beach Hotel, Penstraat 130, Willemstad, Curaçao, starting at 9.00 a.m. for the common shareholders, 9.30 a.m. for the preferred shareholders and 10.00 a.m. for the common and preferred shareholders.
4. Dividends
Cash dividends will be distributed on all shares. Dividends declared pursuant to the preceding paragraphs will be distributed on 19 June 2014.
5. Audit and Compensation Committees
The members for both committees are:
H.F. van den HovenA. van ToorenF. Wagener
Hunter Douglas Annual Report 2013 ❯ Additional information

65
USD
Millions, except per share data Notes | 2013 | | 2012* | | 2011 | | 2010 | | 2009 |
Net sales 2,636 2,588 2,573 2,445 2,376
Earnings before interest, tax, depreciation and
amortization
(before non-recurring restructuring expenses) 261 257 230 257 213
Income from Operations
(before non-recurring restructuring expenses) 170 165 143 167 120
Net Profit from Operations
(before non-recurring restructuring expenses) 118 131 127 159 114
Non-recurring restructuring expenses -12 -45 -31 -17 -27
Net Profit from Operations
(after non-recurring restructuring expenses) 106 86 96 142 87
Net Result Investment Portfolio 1 15 -18 11 3
Total Net Result 107 101 78 153 90
Operating cash flow 220 154 180 159 234
Investments in tangible fixed assets 69 77 111 71 63
Depreciation of tangible fixed assets 83 86 81 85 88
Net Assets Employed 1,619 1,832 1,719 1,730 1,654
Shareholders’ equity 1,124 1,075 1,069 1,126 1,372
Per common share
- Total Net Result 1 3.08 2.90 2.19 4.31 2.54
- Operating cash flow 1 6.32 4.40 5.10 4.49 6.61
- Shareholders’ equity 2 32.30 30.90 30.50 32.78 38.80
- Dividend in EUR (proposed for 2013) 1.25 1.25 1.25 1.25 1.00
- Extra dividend in EUR 7.00
Average annual exchange rate EUR/USD 1.33 1.29 1.39 1.33 1.40
Year-end exchange rate EUR/USD 1.38 1.32 1.29 1.34 1.44
Average number of outstanding common shares (thousands) 3 34,785 34,917 35,315 35,366 35,366
Year-end number of outstanding common shares (thousands) 3 34,786 34,783 35,066 35,366 35,366
1 Based on average number of shares outstanding during affected year, adjusted for stock dividends and treasury shares, where applicable.2 Based on number of shares outstanding at year-end, adjusted for stock dividends and treasury shares, where applicable.3 Adjusted for stock dividends and treasury shares, where applicable.
* restated, see note 2.
Five-year summary
Hunter Douglas Annual Report 2013 ❯ Five-year summary

66
Hunter Douglas Principal Operating Companies
Hunter Douglas Annual Report 2013 ❯ Hunter Douglas Principal Operating Companies
Europe, Middle East and Africawww.hunterdouglasgroup.com
BelgiumHunter Douglas Belgium, LokerenLuxaflex Belgium, BrugesHelioscreen, Lokeren
BulgariaHunter Douglas Bulgaria, Sofia
CroatiaHunter Douglas Croatia, Zagreb
CzechiaHunter Douglas Czechia, PragueHunter Douglas Kadan, Kadan
DenmarkHunter Douglas Architectural Projects Scandinavia, RyslingeLuxaflex Scandinavia, Risskov, HornumW.H. Produkter, Odense
FinlandLuxaflex Scandinavia, Helsinki
FranceHunter Douglas, ParisLuxalon Plafonds France, Bonneuil, LilleFiltersun, La LoupeLuxaflex France, TourcoingMermet, Veyrins-Thuellin
GermanyBenthin, BremerhavenBlöcker, BremenHunter Douglas, Düsseldorf, Bremerhaven, KasselHunter Douglas Architektur-Systeme, DüsseldorfGardinia, Isny (74%)NBK, Emmerich
HungaryHunter Douglas Hungary, Budapest
IrelandT.M. Blinds, Newcastle
ItalyHunter Douglas Italia, Milan
NetherlandsHunter Douglas, RotterdamHunter Douglas Europe, Rotterdam, Leek, OudenboschHunter Douglas Construction Elements, LeekIndustrie- en Handelsonderneming “Buismetaal”, RotterdamArtex, Aarle-RixtelAsco, RoermondHCI Holland Coating Industries, HoogeveenLuxaflex Nederland, Hardinxveld-Giessendam, TolbertLimelight, RotterdamMado, Eindhoven3form, Schiedam
Multisol Raambekleding, NijmegenNedal, UtrechtSchellekens en Schellekens, BeuningenSunway (Benelux), Nieuwegein
NorwayHunter Douglas Norge, Gjövik, OsloLuxaflex Scandinavia, Oslo
PolandHunter Douglas Fabrication, ChludowoHunter Douglas Polska, WarsawTurnils, Zdunska WolaMagnum Metal, Zdunska Wola
PortugalHunter Douglas Portugal, Albergaria-a-Velha, FajozesNBK, Figueira da Foz
RomaniaHunter Douglas Romania, Bucharest, Cluj
RussiaHunter Douglas, Moscow
SerbiaHunter Douglas, Belgrade
South AfricaHunter Douglas South Africa, Johannesburg
SpainHunter Douglas España, Llagostera, Madrid
SwedenHunter Douglas Scandinavia, Alingsas, Gothenburg, HillerstorpHunter Douglas Assembly Automation, StenungsundAMA Produktions, GothenburgNibrol, AngeredLuxaflex Scandinavia, Helsingborg, Anderstorp, Falköping
SwitzerlandHunter Douglas Management, LucerneHunter Douglas (Schweiz), Root, Wängi
TurkeyHunter Douglas, Istanbul
United Arab EmiratesHunter Douglas Middle East, Dubai
United KingdomAMO Blinds, Liversedge, HartlepoolApollo Blinds, GlasgowEclipse, GlasgowFaber Blinds, NorthamptonHunter Douglas, Sunninghill, Stockport, BirminghamSunflex, CannockThomas Sanderson Blinds, WaterloovilleTurnils, Glasgow
North Americawww.hunterdouglas.com
CanadaEclipse Shutters, TorontoHunter Douglas Canada, BramptonShade-O-Matic, TorontoTurnils, Toronto
U.S.A.Hunter Douglas North America, Pearl River (NJ)Hunter Douglas Window Fashions Division, Broomfield (CO)Hunter Douglas Window Designs Division, Bessemer City (NC)Hunter Douglas R&D Centre, Whitesville (KY)Hunter Douglas Metals and Distribution Centre, Tupelo (MS)Hunter Douglas Plastics and Casting Centre, Owensboro (KY)Hunter Douglas Custom Shutter Divison, Gilbert (AZ)Hunter Douglas Horizontal Blinds Division, Gilbert (AZ)Hunter Douglas Fabrication: Calverton (MD), Cumberland (MD), Milpitas (CA), St. Petersburg (FL), Tukwila (WA), Salt Lake City (UT), West Sacramento (CA), Plymouth Meeting (PA), Minneapolis (MN), Greenwood (CO), Omaha (NE), Houston (TX), St. Louis (MO), Kansas City (KS)3form, Salt Lake City (UT)Architectural Window Shades/Nysan Specialty Shades, Pasadena (CA)Carole Fabrics, Augusta (GA)Century Blinds, Corona (CA)Comfortex Window Fashions, Maplewood (NY)Contract Window Coverings, Poway (CA)Custom Brands Group, Cerritos (CA)Eclipse Shutters, Suwanee (GA)Electronic Solutions, Lafayette (CO)Flexo Solutions, Appleton (WI)HD Hospitality & Coast Drapery Services, Las Vegas (NV)LightArt, Seattle (WA)Luxalon Metal Ceilings, Norcross (GA)Mermet, Cowpens (SC)NBK, Marblehead (MA)Nibrol, Lancaster (SC)Techstyle Ceilings, Thornton (CO)Timber Blinds Manufacturing, McKinney (TX)Turnils, Suwanee (GA)Vista Products, Jacksonville (FL)
Hunter Douglas Metals, Homewood (IL), St. Ann (MO)
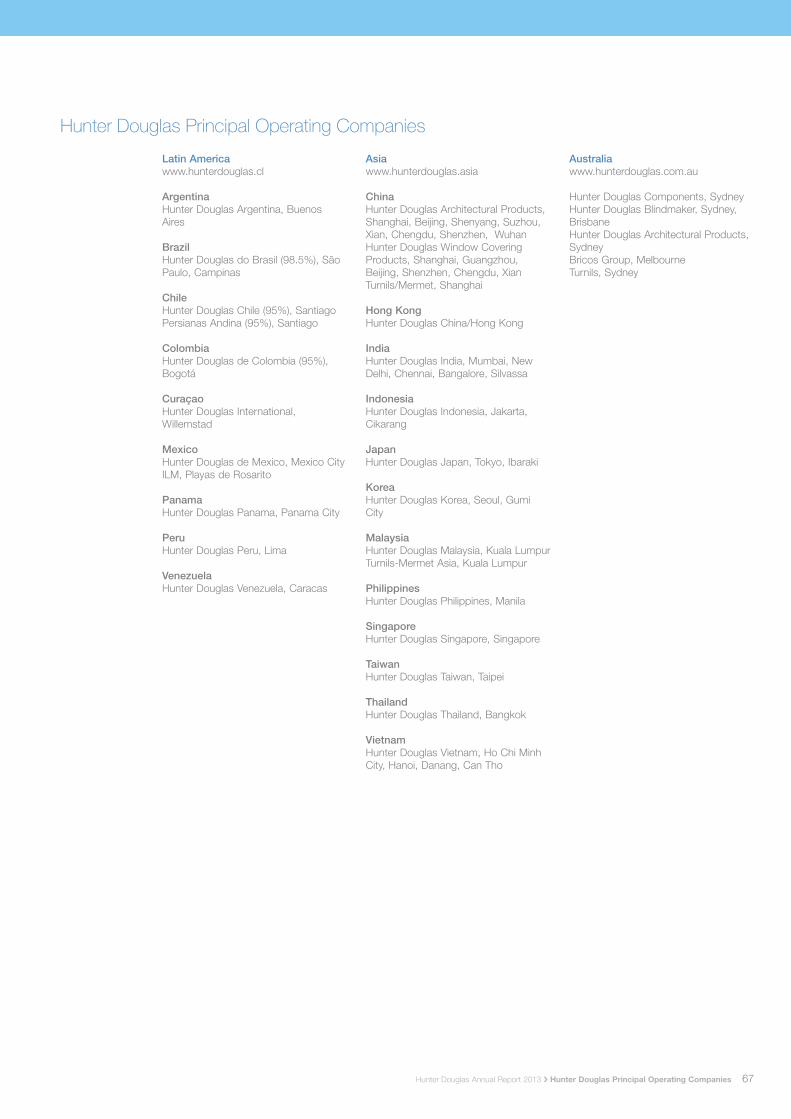
67
Hunter Douglas Principal Operating Companies
Hunter Douglas Annual Report 2013 ❯ Hunter Douglas Principal Operating Companies
Latin Americawww.hunterdouglas.cl
ArgentinaHunter Douglas Argentina, Buenos Aires
BrazilHunter Douglas do Brasil (98.5%), São Paulo, Campinas
ChileHunter Douglas Chile (95%), SantiagoPersianas Andina (95%), Santiago
ColombiaHunter Douglas de Colombia (95%), Bogotá
CuraçaoHunter Douglas International, Willemstad
MexicoHunter Douglas de Mexico, Mexico CityILM, Playas de Rosarito
PanamaHunter Douglas Panama, Panama City
PeruHunter Douglas Peru, Lima
VenezuelaHunter Douglas Venezuela, Caracas
Asiawww.hunterdouglas.asia
ChinaHunter Douglas Architectural Products, Shanghai, Beijing, Shenyang, Suzhou, Xian, Chengdu, Shenzhen, WuhanHunter Douglas Window Covering Products, Shanghai, Guangzhou, Beijing, Shenzhen, Chengdu, XianTurnils/Mermet, Shanghai
Hong KongHunter Douglas China/Hong Kong
IndiaHunter Douglas India, Mumbai, New Delhi, Chennai, Bangalore, Silvassa
IndonesiaHunter Douglas Indonesia, Jakarta, Cikarang
JapanHunter Douglas Japan, Tokyo, Ibaraki
KoreaHunter Douglas Korea, Seoul, Gumi City
MalaysiaHunter Douglas Malaysia, Kuala LumpurTurnils-Mermet Asia, Kuala Lumpur
PhilippinesHunter Douglas Philippines, Manila
SingaporeHunter Douglas Singapore, Singapore
TaiwanHunter Douglas Taiwan, Taipei
ThailandHunter Douglas Thailand, Bangkok
VietnamHunter Douglas Vietnam, Ho Chi Minh City, Hanoi, Danang, Can Tho
Australiawww.hunterdouglas.com.au
Hunter Douglas Components, SydneyHunter Douglas Blindmaker, Sydney, BrisbaneHunter Douglas Architectural Products, SydneyBricos Group, MelbourneTurnils, Sydney
68
Hunter Douglas N.V.
Hunter Douglas Annual Report 2013 ❯ Hunter Douglas N.V.
Directors
R. SonnenbergChairman & CEOHunter Douglas N.V.
H.F. van den HovenChairman Unilever N.V. (retired)
J.T. SherwinExecutive Vice PresidentHunter Douglas N.V. (retired)
A. van ToorenFormer Senior Executive ING Group
F.N. WagenerPresidentBanque Internationale à Luxembourg
Registered officeHunter Douglas N.V.Dokweg 19Maduro PlazaWillemstadCuraçao
Head officeHunter Douglas N.V. 2, Piekstraat3071 EL RotterdamThe NetherlandsPhone: +31-10-486 99 11/484 44 44Fax: +31-10-485 03 55E-mail: [email protected]
Stock listingsCommon shares:›❯ Amsterdam (HDG)›❯ Frankfurt (HUD)
Preferred shares: ›❯ Amsterdam (HUNDP)
Officers
R. SonnenbergChairman & CEO
D.H. SonnenbergCo-President & COO
M.H. SonnenbergCo-President & COO
M.B. HopkinsPresident & CEONorth American Operations
C. KingVice President General Counsel
Hunter Douglas Management AGAdligenswilerstrasse 376006 LucerneSwitzerlandPhone: +41-41-419 27 27Fax: +41-41-419 27 28
R. SonnenbergPresident & CEO
C. KingVice President, General Counsel & Secretary
A. KuiperPresident & CEO European Operations
G.C. NeohPresident & CEO Asian Operations
L. ReijtenbaghVice President, CFO & Secretary
R. RochaPresident & CEO Latin American Operations
Investor relationswww.hunterdouglasgroup.com
L. ReijtenbaghVice President, CFO & SecretaryPhone: +31-10-486 95 82
Depositaries and dividend disbursement agents›❯ ABN AMRO BANK N.V.: Amsterdam, Rotterdam - The Netherlands›❯ ING BANK: Amsterdam, Rotterdam - The Netherlands

® Registered trademark - a HunterDouglas® product
TM Trademark of Hunter Douglas
SM Servicemark of Hunter Douglas
© Copyright Hunter Douglas 2014
Front cover ❯ Silhouette® Window Shadings
Back cover ❯ Vignette® Modern Roman Shades
