human brain evolution an ecological
TRANSCRIPT

FIFTY-SECOND
JAMES ARTHUR LECTURE ONTHE EVOLUTION OF THE HUMAN BRAIN
1982
HUMAN BRAIN EVOLUTIONIN AN ECOLOGICAL CONTEXT^
ROBERT D. MARTIN
AMERICAN MUSEUM OF NATURAL HISTORYNEW YORK : 1983


FIFTY-SECOND
JAMES ARTHUR LECTURE ON
THE EVOLUTION OF THE HUMAN BRAIN

FIFTV-SbXOND
JAMES ARTHUR LEC TURE ONTHE EVOLUTION OF THE HUMAN BRAIN
1982
HUMAN BRAIN EVOLUTIONIN AN ECOLOGICAL CONTEXT
ROBERT D. MARTIN
Professor ofAnthropology
University College, London
AMERICAN MUSEUM OF NATURAL HISTORYNEW YORK : 1983
LIBRARYOF THE
AMERICAN MUSEUM«r MATIlOftl HISTORY


JAMES ARTHUR LECTURES ONTHE EVOLUTION OF THE HUMAN BRAIN
Frederick Tilney, The Brain in Relation to Behavior, March 15, 1932
C. Judson Herrick, Brains as Instruments of Biological Values; April 6, 1933
D. M. S. Watson, The Story of Fossil Brains from Fish to Man: April 24, 1934
C. U. Ariens Kappcrs, Structural Principles in the Nervous System: The Development
of the Forebrain in Animals and Prehistoric Human Races: April 25, 1935
Samuel T. Orton, l^he Language Area of the Human Brain and Some of its Disor-
ders: May 15, 1936
R. W. Gerard, Dynamic Neural Patterns: April 15, 1937
Franz Weidenreich, The Phylogenetic Development of the Hominid Brain and its
Connection with the Transformation of the Skull: May 5, 1938
G. Kingsley Noble, The Neural Basis of Social Behavior of Vertebrates: May 1 1,
1939
John F. Fulton, .-1 F'unctional Approach to the Evolution of the Primate Brain: May2, 1940
Frank A. Beach, Central Nervous Mechanisms Involved in the Reproductive Behavior
of Vertebrates: May 8, 1941
George Pinkley, A History of the Human Brain: May 14, 1942
James W. Papez, Ancient Landmarks of the Human Brain and Their Origin: May27, 1943
James Howard McGregor, The Brain ofPrimates: May 1 1, 1944
K. S. Lashley, Neural Correlates of Intellect: April 30, 1945
Warren S. McCulloch, Finality and Form in Nervous Activity: May 2, 1946
S. R. Detwiler, Structure- Function Correlations in the Developing Nervous System
as Studied by Experimental Methods: May 8, 1947
Tilly Edinger, The Evolution of the Brain: May 20, 1948
Donald O. Hebb, Evolution of Thought and Emotion: April 20, 1949
Ward Campbell Halstead, Brain and Intelligence: April 26, 1950
Harry F. Harlow, The Brain and Learned Behavior, May 10, 1951
Clinton N. Woolsey, Sensory and Motor Systems of the Cerebral Cortex: May 7,
1952
Alfred S. Romer, Brain Evolution in the Light of Vertebrate History, May 21, 1953
Horace W. Magoun, Regulatory Functions of the Brain Stem: May 5, 1954
*Fred A. Mettler, Culture and the Structural Evolution of the Neural System: April
21, 1955
*Pinckney J. Harman, Paleoneurologic, Neoneurologic, and Ontogenetic Aspects of
Brain Phylogeny, April 26, 1956

*Davenport Hooker, Evidence of Prenatal Function of the Central Nervous System
in Man; April 25, 1957
*David P. C. Lloyd, The Discrete and the Diffuse in Nervous Action; May 8, 1958
*Charles R. Noback, The Heritage of the Human Brain; May 6, 1959
*Emst Scharrer, Brain Function and the Evolution of Cerebral Vascularization; May26, 1960
Paul I. Yakovlev, Brain. Body and Behavior. Stereodynamic Organization of the
Brain and of the Motility-Experience in Man Envisaged as a Biological
Action System; May 16, 1961
H. K. Hartline, Principles ofNeural Interaction in the Retina; May 29, 1962
Harry Grundfest, Specialization and Evolution ofBioelectric Activity; May 28, 1963
*Roger W. Sperry, Problems Outstanding in the Evolution of Brain Function; June
3, 1964
*Jose M. R. Delgado, Evolution of Physical Control of the Brain; May 6, 1965
Seymour S. Kety, Adaptive Functions and the Biochemistry of the Brain; May 19,
1966
Dominick P. Purpura, Ontogenesis of Neuronal Organizations in the MammalianBrain; May 25, 1967
*Kenneth D. Roeder, Three Hews of the Nervous System; April 2, 1968
tPhillip V. Tobias, Some Aspects of the Fossil Evidence on the Evolution of the
Hominid Brain; April 2, 1969
*Karl H. Pribram, What Makes Man Human; April 23, 1970
Walle J. H. Nauta, A New View ofthe Evolution ofthe Cerebral Cortex ofMammals;
May 5, 1971
David H. Hubel, Organization of the Monkey Usual Cortex; May 1 1, 1972
Janos Szentagothai, The World ofNerve Nets; January 16, 1973
*Ralph L. Holloway, The Role of Human Social Behavior in the Evolution of the
Brain; May 1, 1973
*Elliot S. Valenstein, Persistent Problems in the Physical Control of the Brain; May16, 1974
Marcel Kinsbourne, Development and Evolution of the Neural Basis of Language;
April 10, 1975
*John Z. Young, l^'hat Squids and Octopuses Tell Us About Brains and Memories;
May 13, 1976
*Berta Scharrer, An Evolutionary Interpretation of the Phenomenon of Neurosecre-
tion; April 12, 1977
Lester R. Aronson, Forebrain Function in I'ertebrate Evolution; April 18, 1978
•Leonard Radinsky, The Fossil Record of rnnnttc Brani I-'.volunoii. March 26. 1979
Norman Geschwind, Anatomical Asymnu'try oj the lirain m lluiuans and Animals:
An Evolutionary Perspective; April 7, 1980
Irving T. Diamond, Evolution of the Primate Neocortex; March 23, 1981
'Robert D. Martm. Human Brum Evolution m an Ecological Context; April 27, 1982
Published versions of these lectures can be obtained from The American Museum
of Natural History, Central Park West at 79th St., New York, N.Y. 10024.
tPublished version: The Brain in Hominid Evolution, New York: Columbia Uni-
versity Press, 1971.


HUMAN BRAIN EVOLUTION IN ANECOLOGICAL CONTEXT
INTRODICTION
Several previous James Arthur Lectures have dealt with ihc ques-
tion of overall brain size and morphology in human evolution (Har-
man. 1956: Tobias. 1971: Holloway. 1973a: Radinsky. 1979). con-
sidering the question from a \ariety of different angles. It is by nowwell established (see Gould. 1966. 1975: Jerison. 1973) that any
discussion of brain size in evolution must be accompanied by ap-
propriate reference to body size, taking into account any effects of
allometric scaling. In overall evolutionary terms, reference to the
absolute size of the brain alone is of little value, and if scaling of
the brain to body size is found to be non-linear (i.e.. allometric. as
opposed to isometric), use of simple ratios is equally uninformalive.
Many studies ha\ e now revealed that various biological parameters
of \ ertebrate groups (e.g.. brain size in mammals) scale allometrically
with body size and there is widespread use ofthe empirical allometric
formula:
Y = kX"
to describe the overall relationship between any given parameter (Y)
and body size (X). In its logarithmic form, this equation becomes
linear:
log "^' = a log X - log k
and it is a relatively simple matter to determine a best-fit straight
line for any set of logarithmically transformed data. This permits
inference of values for the allometric exponent (a) and for the al-
lometric coefficient (k). There is still some controversy over which
line-fitting technique to use for determining allometric relationships
and van-ing use has been made of the three best known techniques:
regression, reduced major axis and major axis. For reasons discussed
elsewhere (Pilbeam and Gould. 1 974: Harvey and Mace. 1 982: Mar-
tin. 1982) the major axis is used throughout the present paper. In
some cases, it is found that logarithmically transformed data for
1
paired values of a given parameter (e.g., brain size and body size)
fit a single straight line fairly closely, and where the correlation
coefficient (r) is high it makes little difference which line-fitting tech-
nique is employed. In other cases, however, it is found that the data
show wide scatter and the choice of best-fit line then affects the
conclusions drawn. Finally, it is commonly found that the data fit
two or more separate lines (characteristically with closely similar
slopes) of differing elevation, as shown in figure 1. In such cases,
one can recognize the existence of different grades in the allometric
relationship between the selected parameter and body size (Martin,
1980). When the data are derived exclusively from living species,
the recognition of distinct grades is relatively unproblematic, though
a certain degree of subjectivity in interpretation may be involved.
However, caution must be exercised when relationships are deter-
mined for fossil forms. As pointed out previously (Martin, 1980),
description of an allometric relationship for a time series of fossil
forms approximating an evolutionary sequence ("phylogenetic al-
lometry"— see Gould, 1966) may be of little value, since this com-
bines the two phenomena of a grade-shift through time and phy-
logenetic change in body size. For instance, in hominid evolution it
happens to be the case that there has been an overall trend toward
increase in body size as well as a trend in increased brain size, and
the high slope value obtained by fitting a best-fit line to brain and
body size data for a time sequence of hominid fossils (e.g., Pilbeam
and Gould, 1974) results from the combination of these two trends
(see fig. 1). If in human evolution the trend toward increased brain
size had been combined instead with a gradual decrease in body size
over time (phyletic dwarfing), a negative slope value would have
been obtained despite the enhancement of relative brain size. Failure
to separate the effects of phyletic size change from allometric scaling
effects has been a major source of confusion in discussions of size-
related characters in human evolution.
Proper application ofallometric analysis to quantifiable characters
such as brain size permits effective comparison of large numbers of
species of widely differing body sizes. This greatly increases the
generality of any conclusions which may be drawn and avoids the
common problem encountered in studies ofhuman evolution where


from an overall trend. Such indices have, for example, been cal-
culated in various ways for mammals to provide a measure of
relative brain size which effectively takes account of body size
differences (e.g., "encephalization index" of Stephan, 1972; "en-
cephalization quotient" of Jerison, 1973 and of Eisenberg, 1981).
3. Testing of specific hypotheses, by predicting scaling relationships
for individual species from consideration of other evidence.
4. Prediction of unknown values (or, simply, "expected" values) for
species where the body size is known but the dimension of a
particular parameter, such as brain size, may not be known in
advance. This application may, of course, fall under the heading
of hypothesis-testing as well.
5. Inference of functional relationships from empirically deter-
mined patterns ofallometric scaling. The manner in which a given
parameter varies with body size, following some recognizable
scaling principle, may suggest underlying functional processes.
However, it must be emphasized that allometric analysis is a
purely empirical procedure and that any hypotheses generated
from the results must be subjected to detailed scrutiny using other
evidence before the correlations recognized can be confidently
linked to underlying causal relationships (see later).
APPLICATION OF ALLOMETRIC ANALYSIS TO THEEVOLUTION OF THE HUMAN BRAIN
In the following discussion, the basic concepts of allometric anal-
ysis are applied in a number of different ways in order to identify
special features of human brain evolution. Wherever possible, the
comparisons involved will be as broad as available data permit in
order to place Homo sapiens in perspective among his closest rel-
atives, the primates, and indeed among the placental mammals gen-
erally. In some cases, the allometric relationships concerned involve
an analysis of the typical adult condition for a wide range of species
{interspecific allometry), whereas in others developmental aspects
within individual species (ontogenetic allometry) are considered. In
all instances, however, the common goal will be to identify what is
so special about the size ofthe human brain (including its ontogenetic
development to reach that size) and to extract clues which indicate
possible ecological factors that have promoted the emergence of a
panicularh large brain during human evolution. In doing this the
evolution of the human brain will be examined from a somewhat
unusual standpoint. Numerous research workers, including a large
proportion of previous lecturers in the James .Arthur Lecture series,
have concerned themselves with determining, at various levels, how
the human brain functions, and spectacular advances have of course
been made in this domain. Other investigators have sought expla-
nations for the large size of the human brain in terms of specific
selection pressures, such as the requirements of increasing com-
plexity of social life (Holloway. 1973a). In other words, they have
asked why human beings should have /zrro'^^ increasingly large brains
in the course of their e\olution. But there is a third approach which
may be taken, which is specifically relevant in ecological terms. It
is well known that the human brain (especially the gray matter-
Thews. 1 960) requires a great deal of energy both for its development
and for its maintenance (e.g.. see .Armstrong. 1982a). For instance,
in the adult human being the brain represents only about 2 percent
ofbody weight, yet it consumes some 1 8 percent of the body's energy
(Lazonhes et al.. 1961— cited m Blinkov and Glezer. 1968). One
might therefore ask how. in energetic terms, human beings can sup-
port such an exceptionally large brain and how. in the course of
human evolution, additional energy was made progressively avail-
able to meet the needs of an ever-increasing brain size. This is the
question that will be asked in the following pages and. as might be
expected from a somewhat unusual approach, some rather unex-
pected answers will be seen to emerge.
SCALING OF BRAIN SIZE IN PRIMATES AND OTHER MAMM.ALS
There is now a substantial literature dealing with allometric anal-
ysis of brain size in mammals generally and in primates in particular
(Bauchot and Stephan. 1966. 1969: Stephan. 1972; Jerison. 1973,
1977: Gould. 1975: Martin. 1981: Passingham, 1975, 1981: Szarski,

1980; Armstrong and Falk, 1982). Considerable success has been
achieved in identifying separate grades of relative brain size amongthe mammals and in examining the brain size of individual species
(such as man) in relation to some common baseline. Bauchot and
Stephan, for instance (see Stephan, 1972) have taken the allometric
relationship for relatively primitive members of the order Insecti-
vora (families Soricidae, Tenrccidae. Erinaceidae) as a baseline against
which to compare other mammals, following the rationale that rel-
ative brain size in these insectivores represents a minimal condition
for modern mammals. The relative enlargement ofthe brain in other
mammals can be expressed as an encephalization index ("index of
progression"), using the empirical formula determined for the al-
lometric relationship between brain size (E, in mg) and body size
(P, in g) in "basal insectivores":
log,oE = 0.63 • log,oP+ 1.63 (1)
Calculation of the index value for any individual mammal species
simply amounts to dividing the actual brain size of that species by
the "expected" value predicted from the basal insectivore equation
for the body size concerned. This can be illustrated (fig. 2) by plotting
best-fit lines for the relationships between cranial capacity and body
weight for the following 4 "grades":
1. "basal" insectivores (hedgehogs, shrews, and tenrecs)
2. "advanced" insectivores (moles, desmans, elephant-shrews,
tree-shrews, etc.)
3. strepsirhine primates (lemurs and lorises)
4. haplorhine primates (tarsiers. monkeys, and apes).
[N.B. Cranial capacity in cc. is approximately equivalent to actual
brain weight in g, at least for insectivores and primates, and the two
measures of brain size are therefore used interchangeably in the
following text, though actual brain weight is used wherever possible.]
As shown by Bauchot and Stephan for actual brain weights (1969:
see also Stephan, 1972), the best-fit fines through these four grades
all have similar slopes. Major axes fitted to the data in figure 2 have
slopes averaging 0.68 (range: 0.62-0.75). Compared with the basal
insectivore line, advanced insectivores typically have brains twice

e-
5-
o HP
£ 3
2-

as big. strepsirhines typically have brains almost four times larger,
and haplorhines as a group have brains seven times larger. Homosapiens has a brain size about 20 times larger than would be expected
for a basal insectivore of the same body size (if such a creature were
to exist) and obviously stands out in relation to haplorhine primates,
having a brain size about three times larger than typical haplorhines
(such as the great apes). Incidentally, figure 2 also shows that the
great apes (chimpanzee, gorilla, orang-utan) follow the common hap-
lorhine pattern; although the great apes do have larger brains than
monkeys, this can be attributed simply to their larger body size.
Homo sapiens, by contrast, clearly is more advanced than both
monkeys and apes in terms of relative brain size.
An alternative approach to calculating an index of relative brain
size has been pioneered by Jerison (1973), who selected as his base-
line the typical condition for modern mammals, rather than the
minimal condition. Jerison's "encephalization quotient" is based
on an overall best-fit line for mammals, which he expressed by the
following formula (converted to the units used throughout this text):
log,„E = 0.671ogH,P + 2.08 (2)
(As before, E = brain weight in mg; P = body weight in g.) On this
basis. Homo sapiens has an encephalization quotient value of 6.3,
indicating that modern man has a brain size just over six times
bigger than would be expected for a "typical" mammal lying directly
on the best-fit line (Jerison. 1 973). In practice, there is little difference
between the encephalization index ofBauchot and Stephan (Stephan,
1972) and Jerison's encephalization quotient, since the values taken
for the allometric exponent {a) are very similar (0.63 vs. 0.67).
Hence. Jerison's quotient values for individual species are approx-
imately one-third ofthe index values given by Bauchot and Stephan's
formula.
Recently, however, a fundamental problem has arisen with respect
to the best-fit line for brain : body size relationships in mammals.
Jerison (1973) followed a long tradition in accepting the value for
the allomiCtric exponent (a) as 0.67 and in fact assumed this value
to be correct in determining his allometric equation for calculating
encephalization quotient values (see also Pilbeam and Gould, 1 974).

Statistical analysis of markedly larger samples of data for mammalspecies has now shown the exponent value to be closer to 0.75
(Bauchot. 1978: Eisenbcrg. 1981: Martin. 1981: Hofman. 1982).
Eiscnberg and Rcdford (see Eisenberg, 1 981 ) determined the follow-
ing empirical formula fora sample of 547 mammal species, including
marsupials:
log,oE = 0.74log,oP+ 1.74 (3)
[Converted to give units as for equation (1) above.]
Similarly, Martin (1981) determined the following formula for a
sample of 309 placental mammals (see fig. 3):
log,oE = 0.761og„P+ 1.77 (4)
In the latter case, the 95 percent confidence limits on the exponent
value obtained from the slope of the major axis (0.73-0.78; r = 0.96)
were found to exclude the previously accepted value of 0.67. This
obviously has implications both for determination of indices derived
from the allometric relationship and for hypotheses regarding the
functional significance of relative brain size. In fact, all the potential
applications of allometric analysis listed above depend upon the
empirical values determined for the relationship between brain size
and body size in mammals. It is therefore important to establish a
fairly conclusive allometric formula for the mammals.
One justification for accepting the higher value of approximately
0.75 for the allometric exponent in the mammalian brain : body size
equation (e.g.. fig. 3) is that all analyses involving really large samples
ofmammal species (N greater than 240) agree in producing exponent
values closer to 0.75 than to 0.67. The data set compiled by Crile
and Quiring ( 1 940). which has been widely used by previous authors
(including Jerison. 1973) and which does actually yield an exponent
value close to 0.67 (Martin. 1 982). included only 97 mammal species
and did not provide a representative selection of mammals (notably
at the upper end of the body size range). Nevertheless, it might be
argued from an examination of figure 3 that the exponent value
determined for the much larger sample of 309 mammal species is
biased b\ the preponderance of relatively small-brained species at
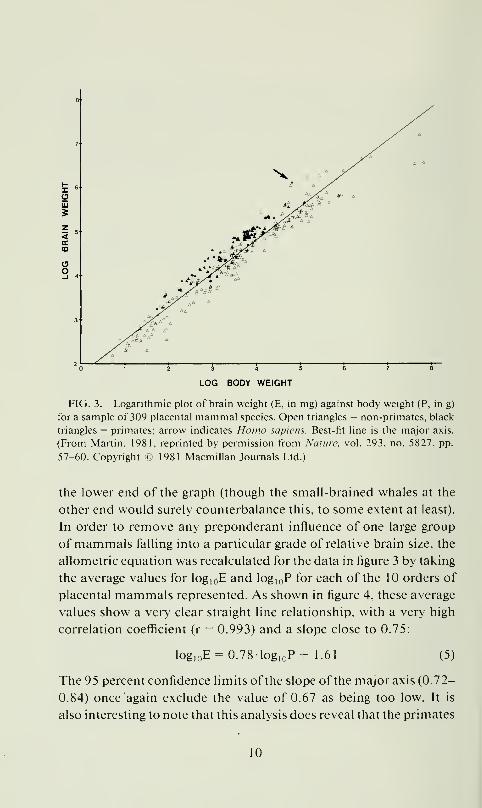

arc soiiK'whal tlisliiKli\ c as an oitlcr in icnns ot'ilic oNX'rall expres-
sion ofrclaliNC brain si/e (fig. 4), whereas this is not ob\ ious from
a plot ofindiNidual species (fig. 3) because ofihe considerable \ari-
abilily within orders ol mammals and oxerlap between them when
\alues for indi\idiial species arc plollcd. In an\ c\cnl. the cn idence
suggests that the correct \alue for the empiricalK determined allo-
mciric exponent go\erning brain : bod\ si/e relationships in placen-
tal mammals is not 0.67 but significantly higher than that, in the
region of 0.75.
There is. however, another major problem involved in identifying
exponent values for brain : body si/e relationships in mammals, it is
a well-known fad (e.g.. see Pilbcam and Gould. 1974: Gould. 1975:
Mace. Harvey, and Clutton-Brock. 1980) that the exponent value
tends to decrease with decreasing level of the taxonomic unit ex-
amined. Whereas a \alue close to 0.75 seems to be appropriate for
the euihcrian mammals o\erall. indi\idual orders or suborders of
mammals tend to \ield lower exponent \alues (e.g.. fig. 2) and a\-
erage exponent \alues usual l\ decrease further as e\en lower taxo-
nomic le\ els (e.g.. families: subfamilies: genera) are considered, with
the lowest values of all obtained with comparisons of adult indi-
viduals of a single species {intraspccific al/onictry). The reasons for
this phenomenon remain obscure, though a theoretical explanation
ma\ ullimatcK emerge (e.g., see Martin and Har\e\. in press). In
practice, this \ ariation in exponent value with taxonomic le\ el means
that the conclusions reached may vary with the le\cl at which al-
lometric analysis is conducted, leading to a certain degree of sub-
jectivity and confusion (as was recently aptly pointed out with respect
to hominid e\olution by Holloway and Post. 1982). Of course, until
we understand why exponent \ alues vary in this way. it will remain
difficult to decide which is the "correct" value to take in a gixen
situation: but two pragmatic guidelines recommend themselves:
1 . The exponent \ alues used should be appropriate to the particular
comparisons involved. For instance, in comparing strepsirhine
primates with haplorhine primates (fig. 2). we should use allo-
melric equations which are deri\ed from analyses of these two
major subgroups of the order primates.

Io
Z 4
<GCCO
-
a choice, in order lo include a maxinuini number of species and
a maximal range of brain and bod\ si/es.
These two guiding principles are used consistenih in the following
discussion.
FUNCTIONAL INTERPRETATION OF BRAIN SIZESCALING IN MAMMALS
.As long as il was generally accepted that brain size scaled to body
size with an exponent value of 0.67 in mammals and in other ver-
tebrates, it was logical to seek some explanation of brain size scaling
in terms of surface : \olume relationships, which are governed by
an exponent of the same \alue. Indeed, Jcrison (1973, p. 49) spe-
cifically comments on this possibility: "We should note that an
exponent of -A implies a surface : volume relationship and may,
therefore, be the basis for theorizing on the significance of brain
size." But now that there is good evidence that the exponent value
for mammals is considerably higher than 0.67, some alternative
explanation of the significance of brain size scaling relationships
must be sought. One immediate possibility that presents itself is a
link between relative brain size and metabolic turnover. It has been
known for some lime (Kleiber. 1932. 1947, 1961: Brody. 1945) that
basal metabolic rate in mammals and other vertebrates (viz.. the
quantity of oxygen consumed, or of calories produced, in a standard
time at rest) scales to body size with an exponent value of approx-
imately 0.75 ("Kleiber's Law"). More recently (Mace and Harvey,
1982), it has been shown for a sample of mammals and birds that
active metabolic rate (i.e., total metabolic turnover, including energy
spent in activity, over a standard time) also scales in a negatively
allometric fashion. The coincidence between the exponent values
for basal metabolic scaling and brain size scaling might, therefore,
reflect some underlying functional relationship between them. In
fact, even in the absence of an adequate sample size for brain and
body weights in mammals, Brody (1945, p. 619-622) had already
suspected the possibility of such a link:
13

for mature mammals of different species, the basal heat production mcreases with
the 0.73 power of body weight; the brain weight increases with the 0.70 power of
body weight, virtually the same as for basal heat production. . . . The most con-
spicuous feature is that the slope of the curve relating brain weight to body weight
is virtually the same as the slope relating basal heat production to body weight.
. . . Does this close statistical correlation imply the presence of a similarly close
causal physiological interrelation between organ weight and metabolism? It maybe so. It is known that the blood supply to the brain — about 13 percent of the
cardiac output (Barcroft and others)— is all out of proportion to the relative weight
of the brain. Kestner (1935, 1936) estimated that under basal metabolism con-
ditions nearly half of the blood passes through the brain. Hence Kestner's conclu-
sion that under basal metabolism conditions the brain probably conditions the
level of basal metabolism. [N.B. Kestner had. in fact, overestimated.]
This prophetic train of thought in fact also underHnes one of the
major problems involved in proceeding from the results ofallometric
analysis to inference of functional relationships. It must first of all
be established that the similarity of exponent values in metabolic
scaling and brain size scaling in mammals is more than a coincidence
and reflects some real causal relationship. But it must also be es-
tablished that this causal relationship operates in a particular direc-
tion. Brody's implied suggestion (above) that control of body me-
tabolism depends upon brain size, which was echoed by other authors,
has now been largely discredited; but Brody did not mention the
alternative interpretation that brain size is instead constrained by
the metabolic turnover of the body. This alternative possibility has
now been explicitly proposed by Martin (1981) and by Armstrong
(1982a, 1982b) and provides an entirely different basis for inter-
preting brain size evolution in the vertebrates. Even here, there are
at least two different hypotheses which can be recognized. The sim-
plest is that an adult mammal requires a particular metabolic turn-
over to permit operation of its brain tissue, which is (as mentioned
above) very expensive in energetic terms. However, this possibility
seems unlikely for a number of reasons (Martin, 1981). An alter-
native hypothesis is that it is the mother's metabolic turnover which,
both in direct terms (through the physiology of gestation) and in
indirect terms (through the partitioning of resources between main-
tenance and reproduction), determines the size ofthe neonate's brain
and hence the ultimate size of the adult brain. This latter hypothesis
has generated a number of testable predictions, some of which are
14
Bl RTH
UTERUS NEST
UTERUS
BIRTH
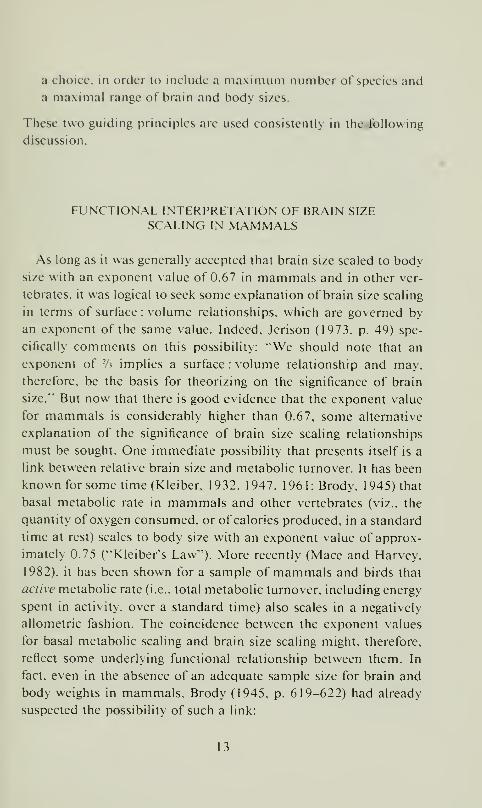
FIG. 5. Contrast between altricial mammals (A) and precocial mammals (B).
adapted from Portmann ( 1 962). The gestation period (indicated by stippling) is mark-
edly longer, relative to body size, in precocial mammals compared to altricial species.
considered below, and provides a promising basis for the interpre-
tation of brain size in mammals.
Obviously, if it is the mother's metabolic turnover which exerts
a major constraining influence on the developing foetal brain, the
size of the neonatal brain will also depend upon the length of the
gestation period. For any given maternal body weight with a given
metabolic turnover, an increase in gestation period should lead to
(or at least permit) an increase in neonatal brain size. This expec-
tation relates directly to a major distinction which can be made
among mammals with respect to the state of the offspring at birth
(Portmann. 1941. 1962). Once various allometric effects ofthe moth-
er's body size (e.g., with respect to gestation period and neonate
weight) have been taken into account, most mammal neonates can
be classified into two major types (fig. 5):
1. Altricial neonates: FairK large litters of small neonates born after
a relatively short gestation period. Both brain and body weight
are relatively small at birth, associated with a generally poor level
ofdevelopment (eyes and ears closed; no hair through; incomplete
development of homeothermy, etc.). They grow into adults with
15

relatively small brains. [Examples: most insectivores, carnivores,
and rodents.]
2. Precocial neonates: Small litters of large young (typically only a
single neonate) born after a relatively long gestation period. Both
brain and body weight are relatively large at birth, associated
with a relatively advanced level of development (eyes and ears
open; hair through; homeothermy established, etc.). They grow
into adults with relatively large brains. [Examples: primates, un-
gulates, and cetaceans.]
Altricial mammals are usually born in some kind of nest, whereas
nests are quite rare among precocial mammals, and postnatal growth
in the relatively sheltered conditions of the nest permits altricial
mammals to ''catch up" to some extent with precocial mammalsdespite the relatively poor initial state of development of altricial
offspring at birth. Nevertheless, there is obviously some limit to this
"catching up" process, since precocial mammals typically have larg-
er brains than altricial mammals when they reach adulthood. Whenclearly precocial mammals (N = 1 59) and clearly altricial mammals(N = 87) are analyzed separately, fitting of lines of fixed slopes 0.75
to logarithmically transformed brain and body size data yields the
following two equations (E^ = adult brain weight):
1. Precocial Mammals: log, oEa = 0.75- logioP + 1.90 (6)
2. Altricial Mammals: logioE^ = 0.75-logioP + 1.74 (7)
(A fixed slope of 0.75 is used to facilitate direct comparison.) What
this means in practical terms is that precocial mammals grow up
into adults which typically have brains some 45 percent bigger than
adults of altricial species. This difference is, however, far less than
the difference in typical neonatal brain weights between precocial
and altricial mammals, as is shown by the tbllowing allometric for-
mulae for the empirical relationships between neonatal brain weight
(En) and maternal body weight (Pm):
1. Precocial Mammals (N = 72):
log.oE^ = 0.70 •log,„PM+ 1.65 (8)
2. Altricial Mammals (N = 24):
log,oEN = 0.741og,oPM + 0.88 (9)
16

M
8*°-*J
o o°.?--' •
log ADULT BODY WEIGHT (g)
FIG. 6. Logarithmic plot of neonatal brain weight (En. in mg) against adult body
weight (P. in g) for altricial mammals (black circles; N = 27) and precocial mammals(open circles: N = 72). Best-fit lines are major axes excluding the following aberrant
species (outliers arrowed in figure):
Thatarctos inariiinius (lethargic during pregnancy)
L'rsus arctos (hibernating during pregnancy)
Mesocricetus auralus
Siis scrofa (unusually large litters)
[Data from Rudder, 1979, and Sacher and Statfeldt, 1974.]
These formulae indicate that precocial mammals have a consider-
able ad\antage at birth in terms of neonatal brain weight, which is
typically some 4.5 times greater than in altricial mammals (fig. 6).
The distinction between precocial and altricial mammals is im-
portant in testing one of the predictions derived from the hypothesis
that maternal metabolic turnover (M^) constrains neonatal brain
size (Ex) and hence adult brain size (E^). For these relationships to
lead to a coincidence between the allometric exponents for maternal
metabolic turnover and adult brain size (both = 0.75). it must follow
that adult brain size scales isometrically (a = 1 ) with respect to neo-
17

natal brain size. In other words, the relationships should be covered
by the following set of formulae (Martin. 1981):
Mm = RPm"-' [Kleiber's Law]
En = Ic'Mm
E^ = k"EN (10)
from which E^ = k"'-P^,"^* [see equation (4)]
But equation (10) can only be tested realistically if precocial and
altricial mammals are examined separately, since the relationships
between E^ and Ev^ are so radically diiferent between these two
groups, primarih because of differences in gestation period not al-
lowed for in the above equations. When adult brain weight is plotted
against neonatal brain weight for precocial and altricial mammalsseparately, the following relationships are found (Martin, 1981):
1. Precocial Mammals (N = 71):
log,oE^ = 0.99-log,oEN + 0.42 (11)
2. Altricial Mammals (N = 24):
log,oEA= 1.01 •log,„EN + 0.85 (12)
In both equations, the \alue determined for the allometric exponent
is very close to unity, so the relationships are indeed virtually iso-
metric (viz.. a = 1) as predicted. In precocial mammals, adult brain
size is typically 2.5 times as big as neonatal brain size, whereas in
altricial mammals it is typically 7.5 times as big. Unfortunately,
neonatal brain weights have only been recorded for relatively few
mammals as yet (Sacher and Staffeldt, 1974; Rudder, 1 979), so much
remains to be done in investigating this key parameter. The best
sample as yet available has been obtained for the order Primates
(N = 27) and for this particular group of mammals the overall re-
lationship is exactly isometric, with a very high correlation coeffi-
cient (r = 0.992):
log,„E^= l.OO-log.oE^ + 0.37 (13)
This equation indicates that in primates the size of the adult brain
is typically 2.3 times as big as the neonatal brain, though there is a
limited range of variation among primate species, with the adult
brain reaching between 1.5 and 3.5 times its neonatal size (fig. 7).

6-
05
E
O 4-
5-
®/
log^^ NEONATAL BRAIN WEIGHT - mg
FIG. 7. Logarithmic plot of adull brain weight (E^. in mg) against neonatal brain
weight (En. in mg) from primates including man (N = 27 species: outlined circle =
Homo sapiens): data from Rudder (1979). The slope of the best-fit line (major axis)
is exactly unity, indicating isometric scaling (viz.. simple proportional si/e increase)
of adult brain relative to neonatal brain. There is a small amount of scatter around
the best-fit line, reflecting differential adaptation of individual species (see fig. 15).
but the point for Homo sapiens shows the greatest upward displacement relati\ e to
the line.
In fact, the greatest degree of postnatal brain growth is found in
Homo sapiens with a value close to 3.5 (see later). This limited
amount of variation indicates that, although the relationship be-
tween adull brain size and neonatal brain size is isometric in primates
overall, there is some permissible indi\ idual variation between pri-
mate species in the partitioning of brain growth between foetal and
postnatal stages. That is to say. indi\idual primate species ma\
follow somewhat different strategies within the general constraint of
simple proportional (isometric) increase in size of the brain after
birth.
It is fairly ob\ ious that a mammal mother's metabolic capacity
19

must be related in some way to the growth of her foetus over a given
gestation period, and one might therefore expect some relationship
to exist between gestation period and the size of the neonate and its
component organs. Sacher and Staffeldt have examined this question
in a seminal paper published in 1 974. They found that a much closer
relationship existed between gestation period and neonatal brain
size than between gestation period and overall neonatal body size.
This provides fairly clear evidence of a particularly intimate con-
nection between gestational processes (including the mother's met-
abolic capacity) and foetal brain growth, thus singling out the brain
as an organ of special significance in the maternal-foetal relationship.
BRAIN GROWTH DURING FOETAL AND POSTNATAL LIFE
There is a particularly interesting relationship between the brain
size of mammal species during foetal life, which has been indepen-
dently recorded by Holt and coworkers (Holt et al., 1975; Holt,
Renfrew, and Cheek, 1981) and by Sacher (1982) (see also Gould,
1977). When brain weight is plotted against body weight for mam-malian foetal stages of any age, using logarithmic coordinates, it is
found that primates are clearly separated from all non-primate mam-mals (fig. 8). In other words, the growth of the primate foetal brain
is found to follow a quite different relationship to total foetal body
weight when compared with non-primate mammals generally, though
odontocete cetaceans (dolphins, etc.) are a special, intermediate case.
Best-fit lines for the available data (fig. 8) yield the following for-
mulae for the relationships between foetal brain weight (Ep) and
foetal body weight (Pp):
1
.
Primates (r = 0.99): log.oEp = 0.95 • log.oPr + 2.25 (14)
2. Non-Primates (r = 0.98): log,„Ep = 0.82-log,„Pp + 1.87 (15)
(excluding cetaceans)
Although the empirically determined values for the slopes are some-
what different (that for primates being almost isometric), thus hin-
dering a direct comparison between the two groups, it can be stated
as a crude approximation that a primate foetus of a given weight
20

/ « X .°
log FOETAL BODY WEIGHT g
FIG. 8. Logarithmic plot of foetal brain weight (Ep) against foetal body weight
(Pp) for primates (black circles), toothed cetaceans (black squares) and other non-
primates (open circles). The best-fit lines (major axes) show a major distinction
between primates and non-primates. Note that the best-fit line for Homo sapiens
(uppermost, thin dotted line) coincides ver> closely with the general best-fit line for
primates. Each point represents a single foetus. Data derived from: Latimer (1938).
Count (1947). Corder and Latimer (1949). Dickerson and Dobbing (1967), Larroche
( 1 967). Dobbmg and Sands ( 1 970). Hendrick.x and Houston (1971). Harel et al. ( 1 972).
Piriot and Bemier ( 1974). Roberts (1975). Holt et al. (1975). Hubert. Stahlheim and
Booth (1975). Piriot and Kamiya (1975). Chambers (1982). These sources yielded
185 points for six primate species (including man) and 305 points for 1 non-primate
Sf)ecies.
will typically have a brain weight twice as large as that of a foetus
of the same body weight from any other mammal species (sec also
Sacher. 1982). As yet. data on brain and body weights of foetal stages
are onl\ a\ ailable for a limited number of mammal species and non-
primates are particular!) poorh represented (fig. 8). For this reason,
the distinction between primates and non-primates noted above
requires further confirmation. In particular, the data represented in
21

figure 8 do not include any strepsirhine primate species and nu-
merous non-primate mammal groups are totally unrepresented. But
there is some confirmation available for the distinction between
primates and non-primates, since the different trajectories shown in
figure 8 must logically lead to a difference in the relationship between
neonatal brain weight and neonatal body weight. Sacher (1982) has
shown, through an analysis of data from 1 3 different orders ofmam-mals (see Sacher and Staffeldt, 1974), that there is indeed the ex-
pected distinction between all primates (including strepsirhine species)
and non-primates in neonatal brain : body weight relationships, with
the exception that neonate odontocete cetaceans are again inter-
mediate. The relationships between neonatal brain weight and neo-
natal body weight for primates and non-primates (fig. 9) are virtually
identical with those for foetal development (fig. 8), as predicted:
1. Primates (r = 0.99): log, oE^ = 0.96 log, qPn + 2.12 (16)
2. Non-Primates (r = 0.99): log,oEN = 0.86- log, ..Pn +1.85 (17)
As Sacher (1982, p. 104) points out, the overall pattern suggests that
an "extraordinary evolutionary event took place" in the origin of
modern primates: "The schedule of primate fetal development was
modified by reducing by half the amount of non-neural somatic
tissue associated with a given amount of neural tissue throughout
the greater part of fetal life."
Apparently, a similar, but less spectacular, change also occurred
in the origin of the odontocete cetaceans.
It must be emphasized that figure 8 conveys no information about
rates of foetal development and that this omission can be a source
of confusion. For example, it might be concluded from the difference
between primates and non-primates that foetal brain growth has
been relatively accelerated in primates. In fact, it is well known that
primates have ver>' slow rates of foetal somatic growth compared
to other mammals (e.g., see Payne and Wheeler, 1968), so the dis-
tinctiveness of primates is doubtless due to a relative deceleration
of foetal body growth rather than to acceleration of foetal brain
growth (Holt, Renfrew, and Cheek, 1981; Sacher, 1982). Again, this
is just what would be expected from the existence of a more intimate
connection between maternal metabolic turnover and foetal brain
22

<zoZ 3
o .o'
.• ep°?-- o
aV
log^^ NEONATAL BODY WEIGHT (g)
FIG. 9. Loganlhmic plot of neonatal brain weight (E^. in mg) against neonatal
body weight (Pn,-, in g) for primates (black circles; N = 27) and non-primates (open
circles; N = 72). Best-fit lines (major axes) are clearly distinct; toothed cetaceans (open
squares; N = 3) are agam intermediate.
groulh than between maternal metabolism and overall foetal body
growth. It should also be noted that different primate species maymove along the brain growth trajectory shown in figure 8 at different
velocities. This is particularly noteworthy in the case of Homo sap-
iens. For instance, the great apes are relatively similar to man in
terms of both adult body size (30-100 kg. compared to 57 kg) and
gestation period (245-270 days, compared to 270 days: taken from
the time of conception in all cases), yet they all produce neonates
with brain and body weights approximately half of the neonatal
weights found v\ith Honjo sapiens (table 1). From this it can be
concluded that human mothers devote a relatively greater quantity
of energy and other resources to foetal brain and body development
over a standard time than do our closest relatives among the pri-
mates, the great apes. But this is achieved by following at a faster
23

TABLE 1
Neonatal Brain and Body Weights for Man and the Great Apes
Species

5 40
AVERAGE ADULT BRAIN WEIGHT
l_r ONE YEAR OLD
1^
/a5^ . Obirt
Homo sapiens
2 4 6 8 10 12 14 16 18
BODY WEIGHT (kg)
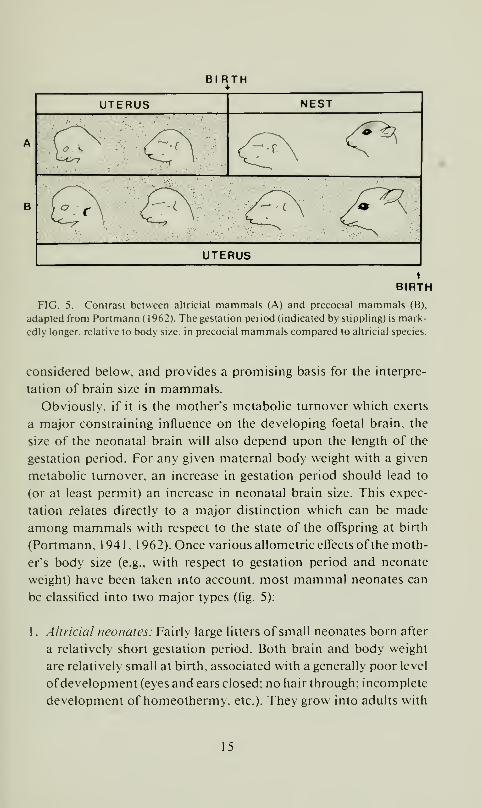
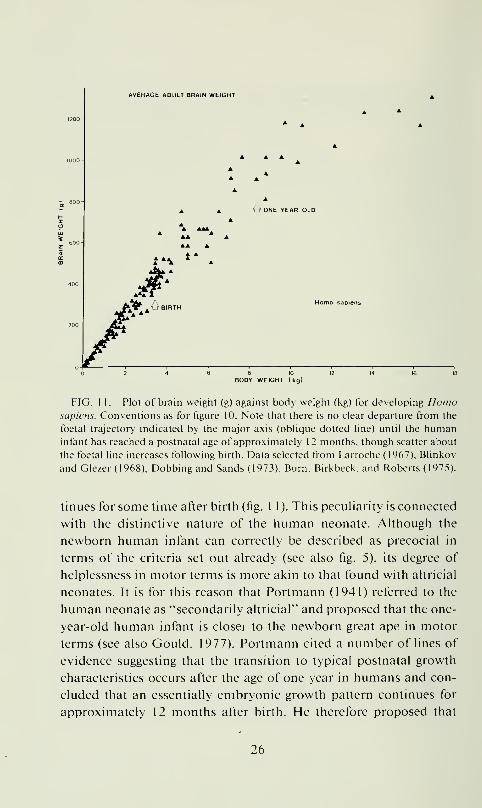
FIG. 1 1. Plot of brain weight (g) against body weight (kg) for developing Homosapiens. Conventions as for figure 10. Note that there is no clear departure from the
foetal trajectory indicated by the major axis (oblique dotted line) until the humaninfant has reached a postnatal age of approximately 12 months, though scatter about
the foetal line increases following birth. Data selected from Larroche (1967), Blinkov
and Glezer ( 1 968), Dobbing and Sands ( 1973), Burn, Birkbeck, and Roberts (1975).
tinues for some time after birth (fig. 1 1 ). This pecuHarity is connected
with the distinctive nature of the human neonate. Ahhough the
newborn human infant can correctly be described as precocial in
terms of the criteria set out ah-eady (see also fig. 5), its degree of
helplessness in motor terms is more akin to that found with altricial
neonates. It is for this reason that Portmann (1941) referred to the
human neonate as "secondarily altricial" and proposed that the one-
year-old human infant is closer to the newborn great ape in motor
terms (see also Gould, 1977). Portmann cited a number of lines of
evidence suggesting that the transition to typical postnatal growth
characteristics occurs after the age of one year in humans and con-
cluded that an essentially embryonic growth pattern continues for
approximately 12 months after birth. He therefore proposed that
26

Homo Mipii'iis has ihc cqui\alcnl ol" a 21-iiionlh gcsialioii period,
di\ idcd into iwo phases: iniraulcrinc (nine nionlhs) and exlraulerinc
(12 monihs). The plol of brain si/e against b()d\ si/e for human
de\ elopmeni (tig. 1 1 ) pro\ ides dianuilie eonliinialion ofl'orlmann's
inlcrprciation. sinee il elearl\ shows that a foclal pallern for brain :
body relationships is maintained in human ontogeny until at least
12 months after birth. On the one hand, this accounts for the help-
lessness of young human infants compared with their primate coun-
terparts, since foetal brain growth postponed to the postnatal period
may well require relatixe immobility. On the other hand, the con-
tinuation of a foetal pattern of brain growth for such a long period
after birth represents a unique feature of flonio sapiens in compar-
ison to all other mammals. It is possible, as suggested by Gould
(1977), that this special feature of human development can be cor-
rectly described as "neotenous'' (i.e.. involves the retention of char-
acteristics from earlier growth stages), but the situation is compli-
cated since in other respects human development from conception
to 12 months after birth is actually accelerated in comparison with,
say. the great apes (see also Leutenegger, 1982).
ECOLOGICAL CORRELATES OF RELATIVE BRAIN SIZE
In recent years, a number of attempts have been made to relate
relative brain size in primates and other mammals to ecological
parameters, notably with respect to feeding ecology (e.g., Eisenberg
and Wilson, 1978: Clutton-Brock and Harvey, 1980; Harvey, Clut-
ton-Brock. and Mace. 1980; Mace. Harvey, and Clutton-Brock. 1980,
1981; Mace and Eisenberg. 1982). Among the primates, a particu-
larly good example is provided by analysis of relative brain size in
Old World monkeys and apes (Cercopithecoidea + Hominoidea) in
relation to differential adaptation for predominant frugivory or pre-
dominant folivory. It has been shown by Clutton-Brock and Harvey
(1980) that in several primate groups the more frugivorous species
lend to have larger brains than related species which can be regarded
as specialized folivores. Following the procedure advocated by these
authors, one can take generic average values for log,,, brain weight
27

A-o-
30log,,
I I
40 4 5
BODY WEIGHT
—1—5
FIG. 12. Plot of average logarithmic values for adult brain weight (E^. in mg)
against adult body weight (P^, in g) for individual genera of Old World monkeys and
apes (Cercopithecoidea + Hominoidea). The best-fit line (major axis) was determined
for all genera excluding Homo.
A>r.' Black triangles = forest-living cercopithecines (most Cercopithecus; Miopithecus;
Allenopithecus; Cercocehus; Cynopithecus; Mandrillus): open triangles = colobines
(Colohiis; Presbytis)\ open squares = transitional (forest/open-country) cercopithe-
cines (Cercopithecus aethiops; Macaca): black squares = open-country cercopithe-
cines (Erythrocebus; Papio; Thewpithecus): open circles = lesser apes (Hylobates;
Symphalangi(s)\ black circles = great apes (Gorilla; Pan: Pongo); white star in black
circle = Homo sapiens.
[N.B. Cercopithecus aethiops has been treated separately from other Cercopithecus
species because of its distinctive ecological features.]
and logio body weight (to avoid bias by species-rich genera) and
obtain a best-fit fine for the data (fig. 12). Following the general rule,
this line has a lower slope value than that for the primates as a whole,
but it can be taken as the appropriate line for comparison amongthe Old World monkeys and apes:
log,„E = 0.601og,oP + 2.68 [r = 0.97] (18)
It is clear from figure 1 2 that two genera other than Homo lie well
28

alxnc Ihc bcsl-til line (.Miopii/icciis; ran), whereas the Iwo eolobine
monkey genera included (( o/ohuv. Prcshyds) lie well below the line.
Taking the best-fit line (major axis) as a reference standard, it is
possible to calculate special encephali/alion quolieni \alues
(EQow = Old World simian encephali/alion quotient) for the indi-
\ idual species for which data are available. These values are plotted
in histogram form in figure 13, which shows that there is no overlap
between eolobine (leaf-monkey) species and the cercopithecine mon-
keys + apes. The colobines. which have specialized sacculated stom-
achs for processing leaf material, all have EQow values of less than
0.8. Among the cercopithecine monkeys, it can be seen that there
is no obvious distinction between forest-living and savanna-living
species (e.g.. indicating larger brains in the latter). Indeed, the largest
EQtnv value ( 1 .38) is found in the forest-living Miopithccus talapoiu,
so a shift to savanna alone does not correlate with increased brain
size. In line with this, the forest-living hylobatids (lesser apes: gib-
bons and siamang) fall within the cercopithecine monkey range.
Finally, the chimpanzee {Pan) has a very large EQow value of 1.35,
whereas the orang (Pongo) and the gorilla {Gorilla) have only mod-
erate values ( 1 .05 and 0.95, respectively). Among the great apes, the
sequence in relative brain size {Pan > Pongo > Gorilla) matches a
dietary spectrum ranging from predominant frugivory to predomi-
nant folivory. once again confirming the correlation between diet
and brain size.
Given these facts, it is possible to frame an explanatory hypothesis
in terms of the differential central nervous processing capacity which
might be required for feeding on relatively scarce fruiting trees, which
lend to be very clumped in both space and time. Feeding upon leaves,
which may be regarded as being both more abundantly available
and more evenly distributed, might be thought to be less demanding
in terms of central nervous processing. This type of explanation has
been explicitly proposed by Clutton-Brock and Harvey (1980) and
by Mace, Harvey, and Clutton-Brock (1980).
A similar correlation between relative brain size and dietary habits
has been found among the bats (Pirlot and Stephan. 1970: Eisenberg
and Wilson. 1978: Stephan. Nelson, and Frahm, 1981). Overall, it
has now been clearly demonstrated that fruit-eating bats have con-
29

10-
6-
6 08—P-10
H.s.=3-6
1-2 14 1-6
EQ
FIG. 13. Histogram of encephalization quotient values (EQow) calculated for
individual Old World monkey and ape species in relation to the best-fit line shown
in figure 12.
Key: Heavy stippling = colobines; medium stippling = forest-living cercopithecines;
light stippling = open-country cercopithecines: hatching = lesser apes: black = great
apes.
Note that the colobines uniformly have the lowest values (EQow less than 0.8) and
that there is no overall distinction between forest-living monkeys and lesser apes and
open-country monkeys.
siderably larger brains than insect-eating bats, by a factor of ap-
proximately two, and that bats with other feeding habits (e.g., nectar-
feeding or fish-eating) have intermediate brain sizes. Once again, it
has been explicitly proposed that fruit-eating bats require larger
brains than other bats, notably the insectivorous forms, because
fruits occur as scattered resources which demand an enhanced central
nervous processing capacity for their exploitation. Insectivorous bats,
it is argued (Eisenberg and Wilson, 1978) do not require such large
brains to locate their insect prey.
Now, while it may seem likely that location of scattered food
sources, such as fruits, may require more central nervous processing
than foraging for relatively abundant food items, such as leaves, it
is by no means obvious that hunting for insects (as in the use of
30

echolocalion in microchiroptcran bats) is comparalivcly unde-
manding in central nervous terms. Further, since it is now widely
recognized that the presence of secondary compounds in many leaf
species may require considerably greater selectivity in leaf-eating
than might be expected at first sight (Freeland and Jan/en. 1974;
McNab. 1978), it seems likely that folivores may well exhibit quite
complex feeding strategics in comparison to frugivores. Once again,
we have a situation where a correlation between two variables (rel-
ative brain si/e: foraging behavior) has been interpreted as a causal
rc/aiionship assumed to operate in a given direction. There is, in
fact, an alternative explanation which can be advanced in terms of
the energy cost of brain development. McNab ( 1 980) has shown that
fruit-eating bats have higher metabolic rates than insect-eating bats,
once scaling to body size is taken into account. Fruit-eating bats
have metabolic rates closely agreeing with the values expected for
mammals generally from Kleiber's standard equation (1961), where-
as insectivorous bats have values some 50 percent lower than ex-
pected. As with relative brain size, bats with other forms of feeding
behavior are intermediate in terms of basal metabolic rate. There-
fore, it can be suggested that insectivorous bats have smaller relative
brain sizes than frugivorous bats because of their lower metabolic
turnover. More precisely, it can be proposed that low metabolic
rates in gestating female insectivorous bats constrain foetal brain
growth such that neonatal brain size is limited in comparison to
frugivorous bats. Given general isometric scaling of adult brain size
with respect to neonatal brain size, it should automatically follow
that adult frugivorous bats would end up with larger brains than
adult insectivorous bats. Indeed, since maternal metabolic turnover
must obviously constrain foetal development, the difference in basal
metabolic rate between frugivorous and insectivorous bats should
inevitably lead to a difference in adult brain size between these two
groups unless there is some systematic difference (e.g., in gestation
period) to offset the limitation imposed by low metabolic rate in
insectivorous bats.
Unfortunately, data are not yet available for basal metabolic rate
in colobine monkeys, so it is not possible to test the prediction that
these monkevs, like insectivorous bats, have relati\el\ low metabolic
31

rates. Nevertheless, McNab (1978, 1980) has shown that in mam-malian folivores generally there is a lowering of basal metabolic rate
relative to Kleiber's equation for mammals, and this effect increases
as the proportion of leaves in the diet increases. It therefore seems
highly likely that colobines will be found to have low metabolic rates
in comparison with other Old World simians, and this would explain
why they have relatively small brains independently of any hypoth-
esis based on the central nervous processing capacity required by
their predominantly leaf-eating foraging strategy.
As yet. it is not possible to decide which of the two competing
hypotheses (requirements of foraging behavior; limitation imposed
by maternal metabolic turnover) best explains differences in relative
brain size between mammal groups with different dietary habits.
However, there is increasing evidence to show that specialization
on leaves or on insect food entails a metabolic cost because of toxic
compounds present in the food items which have been developed
to discourage predation. It follows from this that specialized mam-malian folivores and insectivores will commonly have low metabolic
rates as a mechanism for reducing total food intake and hence the
burden of ingested toxins (McNab, 1978, 1980). Thus, specialized
folivores and insectivores must be expected to have relatively small
brains on straightforward metabolic grounds unless they have de-
veloped special adaptations (e.g., extension of the gestation period)
to offset the limitation imposed by low maternal metabolic turnover
during foetal development.
Thus far, gestation period has been taken into account only in a
very broad sense through the distinction between precocial mam-mals (relatively long gestation periods) and altricial mammals (rel-
atively short gestation periods); but it is possible for this parameter
to be modified in individual species with corresponding conse-
quences for brain development. In fact, gestation period is just one
of the parameters that combine to determine the level of maternal
investment in offspring in any mammalian species. In recent years,
it has become increasingly clear that differential reproductive strat-
egies in mammals, including differential levels of maternal invest-
ment, can be interpreted with respect to the spectrum from r-selec-
tion to K-selection (MacArthur and Wilson, 1967; Pianka, 1970),
32

thus placing nialcnial imosiiiicnl lirniK in a bioad ecological con-
texl. In rclalivcly unstable habitats or in habitats with exlremc sea-
sonal changes man\ animal species are subject to drastic mortality,
and the theoretical carr\ ing capacity (K) oflhe environment is rarely
attained. I'nder such conditions, resources are usualK not limiting
and natural selection will lend to favor maximization ol'the intrinsic
rate of natural increase (r,„.,J and rates of development (r-selcclion).
In relatively stable habitats, by contrast, many animal species will
exist for much oflhe lime at or near carrying capacity and natural
selection will favor increased ell'iciency of utili/alion of environ-
mental resources, including limitation of reproducli\e turnover
(K-selcclion). It is characteristic of K-selecling env ironments that
competition, both within and between species, is intense, and the
relatively few offspring that are produced are typically provided with
enhanced parental investment of some kind. There is obviously a
close correspondence between the r-selection/K-seleclion distinction
and the altricial/precocial neonate difference among mammals, in
thai the reproductive features of altricial mammals (e.g.. large litter-
size) are related to high reproductive turnover, whereas those of
precocial mammals (e.g.. relatively long gestation period) are indic-
ative of increased parental investment in individual offspring. The
primates, with their precocial offspring, fit the K-selection category
very well, as might be expected from the fact that they have typically
been inhabitants of tropical and subtropical forests for the last 50
million years at least. Correspondingly, primates have relatively long
gestation periods compared with other mammals and this relative
extension is found in other key parameters of the life-cycle, such as
age of attainment of sexual maturity and maximum lifespan. But
with the order Primates there is also scope for special adaptation of
reproductive strategies in individual species. The lorisines (lorises,
potto, angwantibo), for example, are characterized by low basal met-
abolic rates and sluggish locomotion to match, yet the adults end
up with relative brain sizes comparable to those of their fast-moving
relatives, the galagines (bushbabies). because the gestation period is
relatively longer in lorisines and allows for more foetal brain growth,
thus offsetting the limiting effect of the mother's low metabolic turn-
over. Such particular adaptations of individual species are common,
33

as is apparent from analysis of the differentia] partitioning of brain
growth between foetal and postnatal life (see later) and it is here that
one might seek special adjustments for specific behavioral require-
ments. Although primates as a group appear to be K-selected com-
pared with certain other mammals (e.g., most rodents and insecti-
vores), some degree of variation is to be expected since some primate
species inhabit relatively K-selecting tropical rainforest while others
occur in drier, more open environments which are likely to exert
some r-selecting effect. The picture is further confused by the fact
that different strategies can be followed within the same environ-
ment, but as far as primates are concerned the situation can be
simplified into four alternative outcomes in terms of overall energy
budgets (fig. 14). In tropical rainforest, which is probably the typical
environment to which most primates have been adapted during their
evolution, K-selection has generally led to restriction of the pro-
portion of the energy budget available for reproduction, but because
of enhanced investment in individual offspring, gestation periods
are long and brain size is therefore usually quite large in both neo-
nates and adults. Under K-selecting conditions, competition is fierce
and this may well explain why certain forest-living primate species
(e.g., lorisines. owi-monkeys, and possibly colobines) have devel-
oped a strategy of lowering basal metabolic rates. This permits them
to feed on certain foods (e.g., some arthropods; leaves) which are
protected by toxic substances, though at the cost of reducing overall
metabolic turnover. (Maximum metabolic turnover is directly re-
lated to basal metabolic rate: McNab. 1980.) Mammals with low
basal metabolic rates are sluggish, at least in part because the pro-
portion of body weight devoted to muscle decreases with decreased
metabolic turnover (McNab, 1978) and the energy available for
reproduction is even more curtailed. Hence, such species can only
possess relatively large brains if gestation periods are extended to
offset the effect oflow maternal metabolic rate on foetal brain growth.
Should a forest-living primate species subsequently become adapt-
ed for living in open country, the relative r-selecting effect of this
environment may have a number of possible outcomes (fig. 14). In
any event, since food availability is not usually a pronounced lim-
iting factor as it is in rainforest, constraints on the overall energy
34

n=
k z^
R

country primates must to some extent respond to the pressure ex-
erted by r-selection toward increased reproductive output. In mam-mals, an increase in reproductive potential can be achieved in var-
ious ways, such as by an increase in litter-size (usually accompanied
by a reduction in gestation period) or through earlier attainment of
sexual maturity, and the latter mechanism seems to be predominant
among open-country primates. Hence, primates exposed to r-se-
lecting conditions can increase their energy budgets (in comparison
to their forest-living counterparts), but they are also constrained to
invest more in reproductive turnover. One of the easiest ways for
the latter to be achieved is through reduction in body size, which is
also likely to entail a reduction in gestation period and other param-
eters, though it is theoretically possible for a species to remain the
same size after shifting from forest to more open country and for
the greater energy budget to allow for increased reproductive output
without requiring any reduction in parameters such as brain size.
Hence, a primate species living under open-country conditions can
have the same brain and body size as a forest-living counterpart,
though it will theoretically have a higher overall metabolic through-
put and a higher reproductive potential. It is clear from figure 13
that open-country cercopithecines do not tend to have larger brains
than their forest-living counterparts and fully overlap with them.
As noted above, the largest relative brain size is found in the forest-
living talapoin among the cercopithecine monkeys.
These considerations present certain problems for the prevailing
theory ofhuman evolution, according to which the definitive changes
are related to a shift from forest to open-country conditions (the so-
called "savanna theory''). In terms of general ecological pressures,
such a shift would not have favored development of the particular
human combination of a very large brain size with extremely slow
reproductive turnover. For. when body size is taken into account,
it is found that all the critical parameters of the human reproductive
life-cycle (age of attainment of sexual maturity; gestation period;
longevity) are greater than in any other primate species (or, indeed,
any other mammal species). In other words, the combination of
large brain size and slow reproductive turnover in Homo sapiens is
indicative of the operation of an extreme form of K-selection, not
36

of exposure lo r-selecling conditions. Ii could, of course, be argued
post hoc that human cultural attributes permit our species to create
relative stability in environments which to other species are unpre-
dictable, but it is dillicull to understand how i^raduul increase in
human brain si/e (see later), and hence gradual increase in the o\ erall
intellectual capacit\ required for cultural dcN elopments, could have
taken place under relatively r-selecting conditions out in the savanna.
Whereas relative brain size may well be maintained in K-selected
species which moNc from forest to open counir\. as seems to have
been the case with sa\anna-li\ ing cercopilhecine monkex species,
it is difficult to see how r-selecting en\ ironmental conditions could
favor any further increase in brain size (see also Rudder. 1979).
THE SPECIAL FEATURES OF HUMAN BRAIN EVOLUTION
The foregoing comparisons have demonstrated that Hodio sapiens
shares a number ofgeneral features of brain size and its development
with the other primates, most notably in producing precocial off-
spring and in the shift to a distinctive relationship between brain
size and body size during foetal de\elopment (tig. 8). But humanbeings also exhibit a number of special features which set them apart
from other primates, or at least from their closest relati\es the great
apes. These ma\ be listed as follows:
(i) The remarkably large size of the adult brain relative to body
size.
(ii) The rapid development of both brain and bod\ during foetal
development, resulting in a distinctively large brain and bod\
size at birth, compared to great apes.
(iii) The greater degree of postnatal growth of the brain, accom-
plished b\ continuation of foetal brain : body relationships
for at least one year after birth and associated with the "sec-
ondary altricial condition."
The distinctiveness of Homo sapiens with respect to the last two
features is somew hat obscured because of variation between primate
species in the partitioning of brain growth between foetal and post-
37

natal stages. For instance, the degree of postnatal brain growth in
humans is greater than in any other primate species, but there is
considerable scatter about the best-fit line in a plot of adult brain
size against neonatal brain size (fig. 7). Similarly, there is some
variation among primate species in the degree to which the brain
develops in iitero. However, it is to be expected that overall there
should be an inverse relationship between the two phenomena, since
species which have a relatively large degree of brain development
in litem are likely to have less postnatal brain growth. This rela-
tionship can be further explored by calculating indices for both foetal
and postnatal brain growth. The foetal brain growth index can be
calculated using the empirical allometric formula determined for the
relationship between neonatal brain size and adult body weight in
primates (N = 30):
log, „En = 0.83Pa + 1.46 (r = 0.96) (19)
For each species, the ''expected'" brain size of the neonate can be
calculated from the adult body weight using this formula and the
ratio of actual to expected neonate brain size provides an index of
the amount of foetal brain growth compared to the norm for pri-
mates. Since total postnatal growth of the brain is isometric relative
to neonatal brain size, the postnatal brain growth index can be cal-
culated by simply dividing adult brain size by neonatal brain size.
As mentioned above, the average value for the ratio of adult to
neonatal brain size is 2.3 in primates (see also fig. 7). These two
indices can then be plotted against one another to examine the
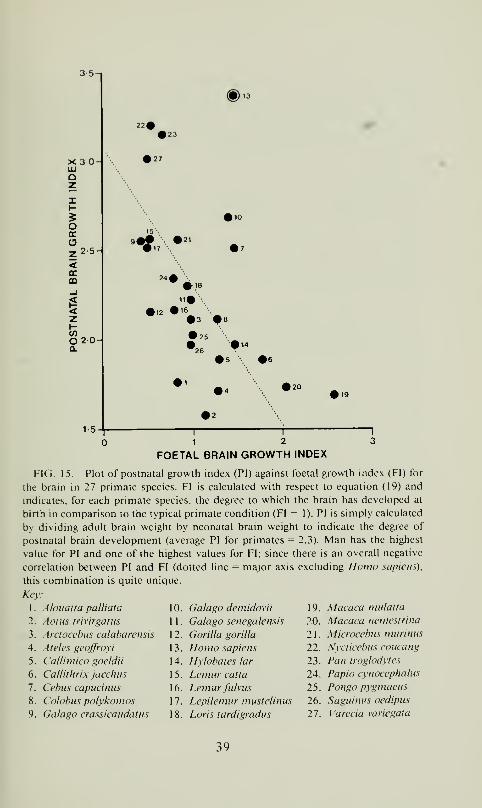
partitioning between foetal and postnatal growth in primates. Whenthis is done (fig. 15) it emerges that there is indeed a negative re-
lationship between the postnatal brain growth index (PI) and the
foetal brain growth index (FI):
PI = 3.07 - 0.78- FI (r=-0.60) (20)
In other words, as expected, species which have a relatively high
degree of foetal brain development typically have relatively little
postnatal brain development and vice versa. When the data are
analyzed in this way, it emerges that Homo sapiens is quite dis-
tinctive in the combination of greater than expected foetal brain
38
35-1
X 3Uoz
2 5-
O 2
1-5
m220
023
• 27
24# -
• 7
• i2 •le• 3 #8
• 25 .
• •1'>26 ^
• 5 \ •&
• 1 020• 19
• 2
1 1
1 2
FOETAL BRAIN GROWTH INDEX
FIG. 15. Plot of postnatal growth index (PI) against foetal growth index (FI) for
the brain in 27 primate species. FI is calculated with respect to equation (19) and
indicates, for each primate species, the degree to which the brain has developed at
birth in comparison to the typical primate condition (FI = 1). PI is simply calculated
by dividing adult brain weight by neonatal brain weight to indicate the degree of
postnatal brain development (average PI for primates = 2.3). Man has the highest
value for PI and one of the highest values for FI; since there is an overall negative
correlation between PI and FI (dotted line = major axis excluding Ilonio sapiens),
this combination is quite unique.
Key:
10. Galago demidovii
1 1
.
Galago senegalensis
1 2. Gorilla gorilla
13. Homo sapiens
14. Hylohates lar
15. Lemur catta
16. Lemur fulvus
17. Lepilemur mustelinus
18. Loris lardigradus
1. Alouatta palliata
2. Aotus trivirgatus
3. Arctocebus calabarensis
4. A teles geoff'royi
5. Callimico goeldii
6. Callithrix jacchus
1
.
Cehus capucinus
8. Colobus polykomos
9. Galago crassicaudatus
19. Macaca mulatta
20. Macaca nemestrina
2 1
.
Microcebus munnus
22. Nycticebus coucang
23. Pan troglodytes
24. Papio cynocephalus
25. Pongo pygmaeus
26. Saguinus oedipus
27. Varecia variegata
39

growth with the maximum observed degree of postnatal brain en-
largement. Homo sapiens, with a foetal brain growth index value of
1.48, is surpassed only by three primate species among those sur-
veyed: Callithrix jacchus, Macaca neniestrina, and Macaca mulatta\
and all of these species exhibit conspicuously low values ( 1 .66-1 .88)
for the postnatal brain growth index. When the human value for the
foetal brain growth index is used to calculate an expected value for
PI from equation (20), it emerges that the human brain grows by a
factor of 1 .8 more than expected for a typical primate species during
the postnatal period. This enhancement of postnatal brain growth
is doubtless attributable largely or exclusively to the special exten-
sion of foetal brain : body relationships through the first year of
postnatal life (fig. 1 1).
As a general rule, it is presumably more efficient in energetic terms
for brain growth to take place during foetal life as far as possible,
since the mother's metabolic capacity is considerably greater than
that of her neonate. Postnatal brain growth requires the developing
infant (operating at a high metabolic rate per unit body weight be-
cause of its small body size) to convert material supplied in the
mother's milk into brain tissue, and this is undoubtedly less efficient.
It is therefore striking that so much of human brain growth takes
place after birth, but this is because of the constraints of pelvic
dimensions in the human female (as was suggested by Portmann,
1941, though he later discarded this interpretation). The human
foetus does in fact grow very rapidly compared with that of a great
ape. reaching approximately twice the size for both brain and body
in a gestation period which is only slightly longer. By that stage,
however, the human infant has reached the limit imposed by the
mother's pelvis and birth must take place. Hence, the extension of
the foetal pattern of postnatal brain growth into the first year of
postnatal life in humans represents a special mechanism to circum-
vent the limitation on neonatal head size imposed by the pelvis.
That this is so is confirmed by examination of the relationships in
odontocete cetaceans, which have very large relative brain sizes (fig.
3) but only a rudimentary pelvis that is unlikely to limit head size
of the neonate at birth. The bottle-nosed dolphin {Tursiops trun-
catus) has an adult body weight of about 155 kg and a gestation
40

period of aboui 1 1 nu)nilis: ii produces a neonate weighing 20 kg
with a brain weight of 770 g. which approximateK doubles through
postnatal growth to reach the adult brain weight of 1600 g (Sacher
and SialVeldt. 1974). Reference to equation (11) shows that this is a
relati\el> small amount of postnatal brain growth for a precocial
mammal, whereas from equation (8) it can be seen that the neonatal
brain si/e is unexpectedly large (by a factor of about 4) for a precocial
mammal. Hence, the evidence is thai Tursiops iriincatiis achieves a
large adult brain size by enhancement of foetal brain growth, rather
than through increased postnatal brain growth, as would be expected
in the absence of an\ maternal pelvic constraint at birth. It therefore
seems reasonable to accept the interpretation that pelvic constraints
require considerable postnatal development of the brain in Homosapiens Uordaan, 1976a: Gould. 1977; Leutencgger. 1982).
Continuation of the foetal pattern of brain and body growth into
the first year of postnatal life in human beings also poses special
problems with respect to lactation, since it is quite clear that a pattern
of early postnatal brain growth that is unique among mammals must
require a unique milk to supply the needs of the developing human
infant. It is. of course, possible that the great degree of postnatal
brain development in human beings merely requires the provision
of standard nutrients in greater quantities. However, it is also pos-
sible that human breast milk contains components which are not
normally present in significant quantities in the milk of other pre-
cocial mammals with a normal pattern of postnatal brain growth,
such as the cow. The widespread use of modified or unmodified
cow's milk formulae as a substitute for human breast milk therefore
deserves special attention from the point of view of early postnatal
brain development. It has been shown that human milk differs from
cow's milk in numerous respects (Gaull. 1979: Gaull et al.. 1982)
and some of the differences may well be specifically relevant to brain
development. In particular, human milk differs markedly in its lipid
constituents in that long-chain unsaturated fatty acids (especially
oleic acid) predominate and there are several differences in amino
acid and protein content. The whey protein : casein ratio is in\ersed
in human milk compared to cow's milk and human milk has a
considerably greater availability of non-protein nitrogen. In human
41
milk free amino acids are present in far greater concentrations and
in quite different proportions, and the free "amino acid" taurine is
particularly noteworthy in that it has been specifically implicated in
brain development (Gaull. 1979) and is more than 30 times more
concentrated in human than in cow's milk.
In view of these pronounced biochemical differences between hu-
man and cow's milk and the special requirements of the developing
human brain, it is pertinent to ask whether substitution of cow's
milk for human milk leads to deficits in early human brain devel-
opment. This question does not seem to have been asked very often
and it is hence significant that there is some evidence for such def-
icits (Menkes. 1977; Rodgers. 1978). Rodgers. in particular, took
great care to exclude the effects of possible confounding variables
(e.g., social class, family size, birth order, etc.) and still detected a
significantly greater degree of intellectual impairment in bottle-fed
children compared with breast-fed children. This is all the more
remarkable in that almost all the children involved (2424 individuals
in the 1946 birth cohort included in the U.K. National Survey of
Health and Development) were weaned from milk before the age of
12 months (82.2 percent of breast-fed children and 57.5 percent of
bottle-fed children in fact received no further milk after 10 months
of age). Such early weaning itself presents problems, since typical
foetal relationships between the growing brain and body weight per-
sist for at least 12 months al\cr birth in human infants (fig. 1 1) and
there was actually a bias against breast-fed infants in the sample,
since they were generally weaned earlier. In addition, some of the
apparent confounding variables identified in Rodgers's analysis may
actually be secondary effects related to breast feeding; for instance,
children that were born first in the birth order were also more likely
to have been breast fed. Overall, it is clear lYom Rodgers's analysis
that there is some link between breast feeding and subsequent in-
tellectual development, though it has not yet been demonstrated that
this link is a direct one between milk biochemistry and brain de-
velopment. Further, it must be remembered that artificial milk for-
mulae have been considerably modified since 1946 (the date of birth
of the cohort studied by Rodgers) and that the present-day situation
could be rather different. Nevertheless, Ounsted (1982) has reported
42

significant dilTercnces between neurobehavioral test scores ofbreast-
led \crsus bottle-fed infants where modern artificial milk formulae
were used and. gi\en the peculiar features of early postnatal brain
development in human beings outlined abo\e, the relationship be-
tween breast feeding and brain maturation obviously deserves more
detailed examination.
THE FOSSIL RECORD OF HUMAN BRAIN SIZE
Even a superficial comparison of modern man and the great apes
reveals that there are three particular features which involve marked
morphological differences in humans: the very large brain, bipedal
striding, and dental restructuring. These three features are all clearly
connected in that locomotion and food processing underlie the pro-
vision of energy for the development and maintenance of a large
brain. In terms of the approach adopted here, it can be argued that
the uniquely large relative size of the human brain (compared with
other primates) requires a relatively high energy flow through the
mother, whereas the relatively slow reproductive turnover of mod-
ern Homo sapiens implies that this strategy required comparative
stability in the availability of food resources for its evolution. Afurther perspective on the evolutionary background to these special
human characteristics is provided by the fossil evidence for human
evolution (Tobias, 1971) and this permits us, in particular, to ask
extremely pertinent questions about the timing and rate of human
brain size evolution.
There are now numerous fossil hominid skulls for which cranial
capacities have been determined (Tobias, 1971; Holloway. 1973a.
1973b. 1978) and it is possible to interpret these in phylogenetic
terms through comparisons with Homo sapiens and other primates.
Because the great apes are man's closest relatives, it has been tra-
ditional to compare hominid fossil cranial capacities particularly
with the great apes and modern humans. However, two problems
have bedeviled attempts to interpret quantitative data on hominid
fossil cranial capacities. In the first place, earlier authors frequently
did not take body size and accompanying scaling effects into account.
43

and this led to an underestimation of the degree of brain develop-
ment in Australopithecus africanus, the earliest well-documented
species in hominid evolution. It is generally accepted that A. afri-
canus was smaller in body size than any of the modern great apes
and man and it is therefore misleading to state, without any proviso,
that cranial capacities of gracile australopithecines fall within the
range of the modern great apes. The scaling effect of body size on
australopithecine brain size has been taken into account only rela-
tively recently (Schaeffer, 1962; Stephan, 1972; Holloway, 1973a;
Jerison, 1973; Pilbeam and Gould, 1974) and there are still manyauthors who continue to imply that the evolutionary expansion of
the human brain postdated the australopithecine level and was con-
fined to the last two million years of human evolution (via Homohabilis and Homo erectus to Homo sapiens). Of course, calculations
which take into account the effect of body size as a factor in hominid
brain evolution depend upon reliable estimates of body weight in
fossil hominids, but increasing attention has now been paid to this
(Schaeffer, 1962; Stephan, 1972; Kinsey, 1972; Jerison, 1973;
McHenry, 1974a, 1974b, 1976; Pilbeam and Gould, 1974; Steudel,
1980; Cronin et al., 1981) and a consensus is slowly emerging. Cer-
tainly, we are now moving away from the previous unsatisfactory
situation where hominid brain size was considered in relation to
geological time with no reference at all to body weight (e.g., see
Lestrel and Read, 1973; Lestrel, 1975). Once estimates of body size
are taken into account for Australopithecus africanus, it emerges that
brain size was, at the very least, 30 percent larger than would be
expected for a modern great ape of the same body size (see later).
But even this is likely to be an underestimate of the evolutionary
advancement of the brain in gracile australopithecines because of a
second problem which has been given virtually no mention in the
literature. Comparison of hominid fossils with modem great apes
(and other primates) involves the hidden assumption that relative
brain size in modern primates can be equated with the ancestral
condition from which great apes and man diverged. Since there has
been a general trend toward brain size expansion throughout the
mammals (Jerison, 1973; Martin, 1973), such a "living fossil" ap-
proach represents no more than a crude approximation to the real
44

situation. In fact, it is quite likely that there has been some expansion
of the brain, relative to body si/e. in all the lineages which diverged
from the common ancestor of the great apes and man (vi/.. the
ancestral hominoid). with the modern forms differing only in the
degree to which this has occurred. Hence, ifwe were able to compare
Australopithecus africanus with the ancestral hominoid. rather than
with modem great apes, its relative brain size would doubtless be
found to be even more advanced. Thus, as recognized by Stephan
( 1972) and by Jerison ( 1973). evolutionary expansion of the humanbrain began prior to the earliest known ausiralopithecines in which
cranial capacity is measurable. Hence, attempted explanations of
human brain size evolution must lake into account the fact that
bram expansion began prior to known dates for the first appearance
of definite stone tools and therefore prior to any hard evidence for
subsistence activities (e.g.. hunting) dependent upon such imple-
ments. Hypotheses which link human brain size expansion directly
to large-scale hunting activities (and perhaps to associated features
of social organization) are accordingly exiremeK suspect.
In searching for an explanatory framework to account for the
remarkable degree of evolutionary expansion of the human brain,
it is also important to determine from the fossil record whether such
expansion has taken place uniformly throughout human evolution
or whether there have been marked discontinuities. All authors whohave taken body size into account in examining the fossil evidence
for human brain size e\olution are agreed that expansion has been
progressive, rather than limited to a short period of geological time,
but the exact pattern of rates of brain expansion over time (e.g..
uniform versus irregular) remains to be clarified. Such an undertak-
ing will require analysis of data on cranial capacity, estimated body
weight and geological age for a large sample of individual hominid
fossil specimens. In the interim, one can at least obtain a general
picture by considering average values for cranial capacity, body
weight and dating for the following taxa: Australopithecus africanus;
Homo habilis: Homo erectus; Homo sapiens (table 2).
.A.S in other cases, any attempt to "eliminate" the effect of body
size through allometric analysis of hominid brain size encounters
the problem of defining which is the appropriate le\el for compar-
45

TABLE 2
Data on Cranial Capacities and Body Weights for Great Apes,
Fossil Hominids and Modern Man

O 3
EQ
A "h
O 2 •
EQ.
3TIME
3 2
TIME mya
FIG. 16. Plot of encephalizalion quotient values against time for hominids. using
the average values listed in table 2 for cranial capacity, body weight and geological
age. EQ values, relating hominid brain sizes to a general placental mammal standard,
are calculated according to equation (4) (see also fig. 3). EQow values, relating hominid
brain sizes to the standard condition among Old World monkeys and apes, are cal-
culated according to equation (18) (see also fig. 12). In both cases, the minimal value
for modem great apes is indicated by a horizontal dotted line, while the general trend
in the hominid values has been extrapolated back along the best-fit line. [N.B. The
lines joining the hominid species need not imply any direct evolutionar> continuity;
they may merely reflect an overall trend.]
Key: Aa = Australopithecus africanus: HhHomo sapiens (modem).
Homo habilis: He = Homo erectus: Hs =
hominids, it can be seen that Australopithecus africanus Hes well
above both the average condition for mammals (for which EQ =
1.0) and the average condition for great apes (EQ = 1.73). showing
a 90 percent increase over the latter. Relative brain size increases
progressively above the gracile australopithecine level, but from this
perspective there is a suggestion that there could have been some
acceleration in brain size expansion following the transition from
Australopithecus to Homo. The plot of EQ^vv values, however, shows
no such evidence of acceleration in brain size expansion: the data
47

yield an almost perfect straight line. Since EQow values take into
account the flatter slope of the Old World simian allometric rela-
tionship (a = 0.60, as opposed to 0.76 for mammals generally), the
quotient value for Australopithecus africanus is not so markedly
different from that for modern pongids (EQ„vv = 1-20), but it is still
significantly above it and shows an increase of 58 percent over the
average great ape value. In both cases (i.e., with EQ and EQow) it
is possible to extrapolate back in time to estimate when hominid
brain size expansion might have started, assuming departure from
the minimal condition for modern pongids and no marked accel-
eration at any stage. The estimates are 5.8 and 4.4 million years
ago, respectively, giving an average of about five million years (as
was suggested by Jerison, 1973, as a rough estimate). Of course, it
is possible that there were in fact significant changes at times in the
rate of human brain size evolution, relative to body size, and only
additional fossil evidence for the earlier stages of human evolution
can resolve this point. For the time being, the following firm con-
clusions may be drawn:
1
.
Relative brain size in the earliest well-documented hominid, Aus-
tralopithecus africanus, was already significantly increased com-
pared with modern great apes and therefore considerably ad-
vanced over the (doubtless) even smaller-brained commonancestor of great apes and man.
2. Expansion of relative brain size in human evolution has been a
progressive phenomenon, though there was possibly some ac-
celeration at the time oftransition from Australopithecus to Homo.
3. Expansion of human brain size, relative to body size, probably
began about five million years ago (if not earlier) and therefore
antedated all the available fossil evidence of any substance (i.e.,
anything more than isolated fragments of dubious affinity).
These observations are particularly important in that it is clear
that any explanatory framework for the evolution of man's remark-
ably large brain must account both for the early onset of brain
expansion and for its progressive nature. Many discussions ofhumanbrain size evolution have been phrased in terms of a direct com-
parison ofmodern great apes and Homo sapiens and the hypothetical
48

explanations advanced ha\ c tended It) impK some relain el\ abrupt
transition associated with the emergence of some special human
characteristic. Further, it must be noted that evolutionary expansion
of human brain size seems to have petered out about 200,000 years
ago, and it has often been noted that classic neandcrthalers {Homosapiens ncandcrthalcnsis) had a larger average cranial capacity than
modern man {Homo sapiens sapiens). Hence, at a time when human
control over environmental resources was presumably moving into
its most impressive phase of development, brain size apparently
stabilized. This provides additional reason for believing that the
progressive expansion in human brain size which look place between
five million and 200,000 years ago was a response to relative pre-
dictability of specific habitat conditions rather than to man's in-
creasing control over them.
As a final point relating to the fossil evidence for human evolution,
it is worth noting that pelvic limitation on increased foetal brain
development was probably reached about one and a half million
years ago, just prior to the emergence oi^ Homo erectus. as currently
recognized in the fossil record. Prior to that time, increase in relative
brain size above the great ape level could probably have been achieved
by modification of the rate and/or extent of foetal growth without
any need for significant postnatal postponement of a foetal brain
growth pattern. However, subsequent to the attainment of a cranial
capacity of about 850 cm\ increasing development of the "second-
arily altricial condition," was probably involved as postnatal con-
tinuation of foetal growth patterns became progressively more nec-
essary. Thus, it seems likely that increasingly elaborate parental care
was required in Homo erectus and then still more in Homo sapiens
to cater for the increasingly helpless condition of the infant during
the first months of postnatal life.
CONCLUSIONS
The approach in this discussion of human brain evolution is es-
sentially dependent upon three basic tenets. Firstly, it is taken as
axiomatic that no understanding ofbrain size can be reached without
49

a consideration of the effects of scaling to body size. Secondly, it is
held that only a broad comparative study of brain size in mammalscan provide an adequate perspective for reliable interpretation of
human brain size evolution. Finally, it is maintained that the ob-
vious heavy energetic cost of brain tissue requires some discussion
of the general ecological background to brain size evolution.
/ Once body size is considered, it emerges that Homo sapiens is
indeed outstanding among mammals in terms of relative brain size
(though the odontocete cetaceans come a close second) and appro-
priate examination of the available fossil evidence shows that man's
very large brain developed progressively over a period of about five
million years. To some extent, the pre-eminent position of Homosapiens in terms of relative brain size can be attributed to our primate
heritage. We belong to an order of mammals which is marked out
by relatively large brains overall, associated with a specific pattern
of foetal development in which the proportion of brain tissue at all
stages has been increased in comparison to all other mammals. This,
in turn, relates to the fact that primates as a group seem to be
relatively K-selected and accordingly have precocial, rather than
altricial, young.
But Homo sapiens has gone far beyond other primates in terms
of brain size evolution over the past five million years or more.
During this period, we developed a particularly rapid pattern of
foetal brain and body development, ultimately complemented by a
one-year extension of foetal growth rates into postnatal life, accom-
panied by the emergence of the "secondarily altriciar' condition of
the human neonate. We are, in this, unique among the mammalsand this should be carefully borne in mind when we consider nu-
trition during pregnancy and during the first year of postnatal life
in comparison with other species. In particular, future improvement
in substitutes for human breast milk could well result from specific
study of the relationship between milk constituents and early de-
velopment of the foetal brain. Evidence of possible deficits in brain
development associated with the use of milk substitutes deserves
particularly close attention.
One enormous question still remains unanswered: Why did this
rapid and far-reaching evolutionary expansion of the human brain
50
lake place at all? There is. at present, widespread acceptance of the
"sa\anna hypothesis" of human e\olution and a common corollary
to this has been the postulate that the large human brain evolved
due to specific selection pressures associated with hunting, tool-use
and or social organization. Holloway (1973a), for example, sees an
important feedback relationship between social organization and
human brain evolution: "The human brain is both the product and
cause of the e\ olution of human social beha\ iour." Yet consider-
ation of the energetic requirements associated with the evolution of
the brain, in terms of both the level and reliability of resource avail-
ability, must surely place particular emphasis on early human sub-
sistence patterns. Homo sapiens, as the most K-selected of the mam-mal species, must have evolved in response to a rather unusual
combination of environmental factors which made available a rel-
atively steady, predictable supply of food lacking in significant toxin
levels. Unfortunately, evolution of all the major distinctive mor-
phological attributes of man (large brain: bipedal adaptation: re-
modeling ofjaws and teeth) was well under w'a\ some time prior to
the earliest known substantial australopithecine remains, so the key
evidence is still lacking. Howe\er. it can at least be said that an
additional, pressing question has now been formulated which will
require an answer in future examination ofthe fossil record ofhumanevolution: "How could hominids afford the energetic cost of devel-
oping such a large brain?"
ACKNOWLEDGMENTS
I particularly thank Ms. Ann MacLarnon. who provided invalu-
able assistance and discussion in the collection and analysis of the
data discussed in this paper. I also thank the following people whose
helpful comments and ad\ice at \arious stages contributed to (but
in no way makes them answerable for) the analyses and interpre-
tations that have been made: Drs. Leslie Aiello, Este Armstrong,
Paul Harvey. Michael Hills. Georgina Mace. Prof. David Pilbeam.
Dr. Ben Rudder. Dr. Henn. k Szarski. I also acknowledge the major
contribution that has been made to the quantitative study of mam-
51

malian brain evolution by the following people: Dr. Roland Bauchot,
Prof. John Eisenberg, Dr. Stephen Gould, Prof. Ralph HoUoway,
Prof. Harry Jerison. Dr. Walter Leutenegger. Dr. Richard Passing-
ham. Prof. Paul Pirlot. Dr. Heinz Stephan. The special contributions
made by Prof. Adolf Portmann, Dr. George Sacher and Dr. Ben
Rudder to our understanding of links between reproduction and
brain development must also be acknowledged. Thanks are due to
Mrs. J. Arnott for typing the manuscript. Finally, I express myconsiderable gratitude to the American Museum of Natural History
for inviting me to give the fifty-second James Arthur Lecture, thus
stimulating me to crystallize the above ideas; and the kind assistance
of Dr. Ian Tattersall, acting on behalf of the American Museum of
Natural History, is gratefully acknowledged.
LITERATURE CITED
Armstrong, E.
1982a. An analysis of brain allometry: consideration of the cerebral metabolic
demand. Amer. Jour. Phys. Anthrop., vol. 52, pp. 167-168.
1982b. A look at relative brain size in mammals. Neurosci. Lett., vol. 34, pp. 101-
104.
Armstrong, E., and D. Falk (eds.)
1982. Primate brain evolution: methods and concepts. New York, Plenum.
Bauchot, R.
1978. Encephalization in vertebrates: a new mode of calculation for allometry
coefficients and isoponderal indices. Brain Behav. Evol., vol. 15, pp. 1-
18.
Bauchot. R.. and H. Stephan
1 966. Donnees nouvelles sur I'encephalisation des insectivores et des prosimiens.
Mammalia, vol. 30, pp. 160-196.
1969. Encephalisation et niveau evolutif chez les simiens. Mammalia, vol. 33,
pp. 225-275.
Blinkov, S. M., and I. I. Glezer
1968. The human brain: a quantitative handbook. New York, Plenum.
Brody, S.
1945. Bioenergetics and growth. New York, Reinhold.
Bum, J., J. A. Birkbeck, and D. F. Roberts
1975. Early fetal brain growth. Hum. Biol., vol. 47. pp. 51 1-522.
Chambers, P. L.
1982. The endocrinology of pregnancy in the marmoset monkey, Callithrix jac-
chus. Ph.D. Thesis, Univ. Edinburgh.
Clutton-Brock, T. H , and P. H. Harvey
1980. Primates, brains and ecology. Jour. Zool., London, vol. 190, pp. 309-323.
52

Corder, R. L., and H. B. lauiiK-r
1949. The prenatal growth of the brain and of its parts and of the spinal cord in
the dog. Jour. Comp. Neurol., vol. 90, pp. 193-212.
Count, E. W.
1947. Brain and body weight in man; their antecedents in growth and evolution.
Ann. N.Y. Acad. Sci., vol. 46. pp. 993-1 122.
Criie. G. W., and D. P. Quiring
1940. A record of the body weight and certain organ and gland weights of 3690
animals. Ohio Jour. Sci., vol. 40. pp. 219-259.
Cronin, J. E., N. T. Boaz. C. B. Stringer, and Y. Rak
1981. Tempo and mode in hominid evolution. Nature, vol. 292, pp. 1 13-122.
Dickerson, J. W. T., and J. Dobbing
1967. Prenatal and postnatal growth and development of the central nervous
system of the pig. Proc. Roy. Soc. London B.. vol. 166, pp. 384-395.
Dobbing. J., and J. Sands
1970. Growth and development of the brain and spinal cord of the guinea pig.
Brain Res., vol. 17, pp. 115-123.
1973. Quantitative growth and development of the human brain. Arch. Dis.
Childhood, vol. 48, pp. 757-767.
Eisenberg, J. F.
1981. The mammalian radiations: a study in evolution and adaptation. Chicago,
University Press.
Eisenberg. J. F.. and D. E. Wilson
1 978. Relative brain size and feeding strategies in the Chiroptera. Evolution, vol.
32. pp. 740-751.
Freeland. W. J., and D. H. Janzen
1974. Strategies in herbivory by mammals: the role of plant secondary com-pounds. Amer. Nat., vol. 108, pp. 269-289.
Gaull. G. E.
1979. What is biochemically special about human milk? In Raphael, D. (ed.).
Breastfeeding and food policy in a hungry world, New York, AcademicPress, pp. 217-227.
Gaull. G. E., R. G. Jensen, D. K. Rassin, and M. H. Malloy
1 982. Human milk as food. In Milunsky, A., E. A. Friedman and L. Gluck (eds.),
.Advances in perinatal medicine. New York, Plenum, vol. 2, pp. 47-120.
Gibson, J. R.. and T. McKeown1952. Observations on all births (23,970) in Birmingham, 1947: VI. Birth weight,
duration of gestation and survival related to sex. Brit. Jour. Soc. Med., vol.
6. pp. 152-158.
Gould. S. J.
1966. Allometry and size in ontogeny and phylogeny. Biol. Rev., vol. 41, pp.
587-640.
1975. Allometry in primates, with emphasis on scaling and the evolution of the
brain. Contrib. Primatol., vol. 5. pp. 244-292.
1977. Ontogeny and phylogeny. Cambridge, Mass., Belknap Press, Harvard Univ.
Press.
53

Groves, C. P.
1971. Pongo pygmaeus. Mammalian Species, vol. 4, pp. 1-6. (Published by the
American Society of Mammalogists.)
Harel, S., K. Watanabe, I. Linke, and R. J. Scham1972. Growth and development of the rabbit brain. Biol. Neonate, vol. 21, pp.
381-399.
Harman, P. J.
1956. Paleoneurologic, neoneurologic and ontogenetic aspects ofbrain phylogeny.
25th James Arthur Lecture on the Evolution of the Human Brain. NewYork, Amer. Mus. Nat. Hist.
Harvey, P. H., T. H. Clutton-Brock, and G. M. Mace1980. Brain size and ecology in small mammals and primates. Proc. Nat. Acad.
Sci., U.S.A., vol. 77, pp. 4387-4389.
Harvey, P. H., and G. M. Mace1 982. Comparisons between taxa and adaptive trends: problems of methodology.
//; Kings College Sociobiology Group (eds.). Current problems in socio-
biology, Cambridge, University Press, pp. 343-36 1
.
Hendrickx, A. G.. and M. L. Houston
1971. Fetal growth. In Hendrickx, A. G. (ed.). Embryology of the baboon, Chi-
cago, University Press, pp. 173-196.
Hofman, M. A.
1982. Encephalization in mammals in relation to the size of the cerebral cortex.
Bram Behav. Evol., vol. 20, pp. 84-96.
Holloway, R. L.
1 973a. The role ofhuman social behavior in the evolution of the brain. 43rd James
Arthur Lecture on the Evolution of the Human Brain. New York, Amer.
Mus. Nat. Hist.
1973b. Endocranial volumes of early African hominids and the role of the brain
in human mosaic evolution. Jour. Human Evol., vol. 2, pp. 449-460.
1978. Problems of brain endocast interpretation and African hominid evolution.
In Jolly, C. J. (ed.). Early hominids of Africa, London, Duckworth, pp.
379-401.
Holloway, R. L., and D. G. Post
1982. The relativity of relative brain measures and hominid mosaic evolution.
In Armstrong, E. and D. Falk (eds.). Primate brain evolution: methods
and concepts. New York, Plenum, pp. 57-76.
Hoh, A. B., D. B. Cheek, E. D. Mellits, and D. E. Hill
1975. Brain size and the relation of the primate to the nonprimate. In Cheek, D.
B. (ed.), Fetal and postnatal cellular growth: hormones and nutrition. NewYork. John Wiley, pp. 23-44.
Hoh, A. B., M. B. Renfrew, and D. B. Cheek
1981. Comparative aspects of brain growth: a critical evaluation of mammalian
species used in brain growth research with emphasis on the Tammar wal-
laby. In Hetzel, B. S. and R. M. Smith (eds.). Fetal brain disorders. NewYork, Elsevier, pp. 17-43.
Hubbert, W. T., O. H. V. Stalheim, and G. D. Booth
1972. Changes in organ weights and fluid volumes during growth of the bovine
foetus. Growth, vol. 36, pp. 217-233.
54

Jerison, H. J.
1973. E\olution otlhc brain and intelligence. New York, Academic Press.
1977. The theory' of encephali/ation. Ann. N.Y. Acad. Sci., vol. 299, pp. 146-
160.
Joines. S.
1977. A training programme designed to induce maternal behaviour in a mul-
tiparous female lowland gorilla. Gorilla g. gorilla, at the San Diego Wild
Animal Park. Int. Zoo. ^'b.. vol. 17. pp. 185-188.
Jordaan, H. V. F.
1976a. New bom : adult brain ratios in hominid evolution. .Amer. Jour. Phys.
Anthrop.. vol. 44. pp. 271-278.
1976b. Newborn brain : body weight ratios. Ihid.. vol. 44, pp. 279-284.
Keeling, M. E., and K. E. Riddle
1 975. Reproductive gestational and newborn physiology of the chimpanzee. Lab.
Anim. Sci.. vol. 25. pp. 822-828.
Kerr, G. R., J. R. Allen, G. Scheffler. and J. Couture
1974. Fetal and postnatal growth of rhesus monkeys (Macaca mulatta). Jour.
Med. Primatol., vol. 3, pp. 221-235.
Kinsey, W. G.
1972. Allometric transposition of brain body size relationships in hominid evo-
lution. Amer. Jour. Phys. Anthrop., vol. 37, pp. 442-443.
Kleiber, M.
1932. Body size and metabolism. Hilgardia. vol. 6. pp. 315-353.
1947. Body size and metabolic rate. Physiol. Rev., vol. 27, pp. 51 1-541.
1961. The fire of life: an introduction to animal energetics. New York, John
Wiley.
Larroche, J. C.
1967. Maturation morphologique du systeme nerveux central: ses rapports avec
le developpement ponderal du foetus et son age gestationel. In Minkowski,
A. (ed.). Regional development of the brain in early life. Oxford, Blackwell,
pp. 247-256.
Latimer, H. B.
1938. The prenatal growth of the cat. VIL The growth of the brain and its parts.
Jour. Comp. Neurol., vol. 68, pp. 381-394.
Lazorthes, G. et al.
1961. Vascularisation et circulation cerebrales. Paris, Masson.
Lestrel, P. E.
1975. Hominid brain size versus time: revised regression estimates. Jour. Hum.Evol., vol. 5, pp. 207-212.
Lestrel. P. E.. and D. W. Read
1973. Hominid cranial capacity versus time: a regression approach. Jour. Hum.Evol.. vol. 2. pp. 405-411.
Leutenegger. W.1982. Encephalization and obstetrics in primates with particular reference to
human evolution. In Armstrong. E. and D. Falk (eds.). Primate brain
evolution: methods and concepts. New York. Plenum, pp. 85-95.
MacArthur. R. H.. and E. O. Wilson
1967. The theory of island biogeography. Princeton. New Jersey. University Press.
55

Mace, G. M., and J. F. Eisenberg
1982. Competition, niche specialization and the evolution of brain size in the
genus Peromyscus. Biol. Jour. Linn. Soc, vol. 17, pp. 243-257.
Mace, G. M., and P. H. Harvey
1982. Energetic constraints on home range size. Amer. Nat., vol. 121, pp. 120-
132.
Mace, G. M., P. H. Harvey, and T. H. Clutton-Brock
1980. Is brain size an ecological variable? Trends Neurosci. 1980, pp. 193-196.
1981. Brain size and ecology in small mammals. Z. Zool. London, vol. 193, pp.
333-354.
Martin, R. D.
1973. Comparative anatomy and primate systematics. Symp. Zool. Soc. London,
vol. 33, pp. 301-337.
1980. Adaptation and body size in primates. Z. Morph. Anthrop., vol. 71, pp.
115-124.
1981. Relative brain size and basal metabolic rate in terrestrial vertebrates. Na-
ture, vol. 293, pp. 57-60.
1982. Allometric approaches to the evolution of the primate nervous system. In
Armstrong, E. and D. Falk (eds.), Primate brain evolution: methods and
concepts. New York, Plenum, pp. 39-56.
Martin, R. D., and P. H. Harvey
[In press] Brain size allometry: ontogeny and phylogeny. //; Jungers, W. L. (ed.).
Size and scaling in primate biology. New York, Plenum Pub. Co.
McHenry, H. M.
1974a. Fossil hominid body weight and brain size. Nature, vol. 254, pp. 686-688.
1974b. How large were the australopithecines? Amer. Jour. Phys. Anthrop., vol.
40, pp. 329-340.
1976. Early hominid body weight and encephalization. Amer. Jour. Phys. An-
throp., vol. 45, pp. 77-84.
McNab, B. K.
1 978. Energetics ofarboreal folivores: physiological problems and ecological con-
sequences of feeding on an ubiquitous food supply. In Montgomery, G.
G. (ed.). The ecology of arboreal folivores, Washington, Smithsonian Inst.
Press, pp. 153-162.
1980. Food habits, energetics and the population biology of mammals. Amer.
Nat., vol. 116, pp. 106-124.
Menkes, J. H.
1977. Early feeding history of children with learning disorders. Dev. Med. Child
Neurol., vol. 19, pp. 169-171.
Nadler, R. D.
1974. Periparturitional behavior of a primiparous lowland gorilla. Primates, vol.
15, pp. 55-73.
Ounsted, M.
1982. Basics: size at birth and its effects on growth and development in the first
year of life. In Apley, J. and M. Ounsted (eds.). One child, London, Hein-
mann Medical, pp. 84-121.
Passingham, R. E.
1975. The brain and intelligence. Brain Behav. Ecol., vol. 1 1, pp. 1-15.
56

198 1. Primate spcciali/ations in brain and inlclligcncc. Symp. Zool. Soc. London,
vol. 46, pp. 361-388.
Payne, P. R.. and E. F. Wheeler
1968. Comparative nutrition in pregnancy and lactation. Proc. Nutr. Soc, vol.
27. pp. 129-138.
Pianka, E. R.
1970. On r- and K-selection. Amer. Nat., vol. 104, pp. 592-597.
Pilbeam, D., and S. Gould1974. Si/e and scaling in human evolution. Science, vol. 186, pp. 892-901.
Pirlot, P., and R. Bernicr
1974. Embryonic brain growth in a fruit bat. Anat. Embryol., vol. 146, pp. 193-
901.
Pirlot, P., and T. Kamiya
1975. Comparison of ontogenetic brain growth in manne and coastal dolphins.
Growth, vol. 39, pp. 507-524.
Pirlot, P., and H. Stephan
1970. Encephalization in Chiroptera. Canadian Jour. Zool., vol. 48, pp. 433-
444.
Portmann, A.
1941. Die Tragzeiten der Primaten und die Dauer der Schwangerschaft beim
Menschen: ein Problem der vergleichenden Biologic. Rev. Suisse Zool.,
vol. 48, pp. 511-518.
1962. Cerebralisation und Ontogenese. Medizin Grundlagenforsch., vol. 4, pp.
1-62.
Radinsky, L.
1979. The fossil record of primate brain evolution. 49th James Arthur Lecture
on the Evolution of the Human Brain. New York, Amer. Mus Nat. Hist.
Rodgers, B.
1978. Feeding in infancy and later ability and attainment: a longitudinal study.
Develop. Med. Child Neurol., vol. 20, pp. 421-426.
Rudder, B. C. C.
1979. The allometry of primate reproductive parameters. Ph.D. Thesis, Univ.
London.
Sacher, G. A.
1982. The role of brain maturation in the evolution of the primates. In Arm-strong, E. and D. Falk (eds.). Primate brain evolution: methods and con-
cepts. New York, Plenum, pp. 97-1 12.
Sacher, G. A., and E. F. Staffeldt
1974. Relation of gestation time to brain weight for placental mammals: impli-
cations for the theory of vertebrate growth. Amer. Nat., vol. 108, pp. 593-
616.
Schaeffer, U.
1962. Gehimschadelkapazitat und Korpergrosse bei Vormenschenfunden in al-
lometrischer Darstellung. Zool. Anz., vol. 168, pp. 149-164.
Schultz, A. H.
1941. The relative size of the cranial capacity in primates. Amer. Jour. Phys.
Anthrop., vol. 28, pp. 273-287.
1965. The cranial capacity and the orbital volume of hominoids according to age
57

and sex. In Homenaje a Juan Comas en su 65 annersano. Mexico City,
Editorial Libros de Mexico, vol. 2. pp. 337-357.
Stephan. H.
1972. Evolution of primate brains: a comparative anatomical investigation. In
Tuttle. R. (ed.). The functional and e\olutionary biology of primates. Chi-
cago. Aldine-Atherton. pp. 155-174.
Stephan. H.. R. Bauchot. and O. J. Andy1970. Data on size of the brain and of various brain parts in insectivores and
primates. In Noback. C. R. and W. Montagna (eds.). The primate brain.
New York. Appleton-Century Crofts, pp. 289-297.
Stephan. H.. J. E. Nelson, and H. D. Frahm
1981. Brain size comparison in Chiroptera. Z. zool. Syst. Evolutionsforsch., vol.
19. pp. 195-222.
Steudel, K.
1980. New estimates of early hominid brain size. .Amer. Jour. Phys. Anthrop.,
vol. 52. pp. 63-70.
Sykora. I.. S. WUdt. and F. Hradil
1965. Veranderungen des Korper- und Organgewichtes der Wistarratte wahrend
der postnatalen Entwicklung. Z. Versuchstierk. vol. 7. pp. 23-34.
Szarski. H.
1980. A functional and evolutionary interpretation of brain size in vertebrates.
In Hecht. M. K.. W. C. Steere and B. Wallace (eds.). Evolutionary biology.
New York. Plenum, vol. 13. pp. 149-174.
Thews. G.
1960. Die Sauerstoffusion im Gehirn. Plliigers Arch. Ges. Physiol., vol. 271. pp.
197-226.
Tobias. P. V.
1971. The brain in hominid evolution. New York. Columbia Universitv Press.