hrug intro to forecasting
TRANSCRIPT

Intro to Forecasting in R Part I
Houston R Users Group Ed Goodwin, CFA

Why Forecast?• Planning and budgeting
• Making timely decisions
• Improving service
• Solving problems
• Optimization

What can you forecast?• How well do we understand the factors that contribute to the
forecast?
• How much data do we have available?
• Does the forecast influence the outcome (complex adaptive systems, reflexivity)
We can forecast when we believe:
• We have data about the past
• We believe that historic patterns will persist in some form

Why use R to forecast?• enhanced graphics capabilities
• tools for summary statistics
• ability to handle time series
• easy to use transformations
• residuals and diagnostics
• ready to run forecasting models built in

A Wealth of Time Series Classes
Class Features
ts vector or matrix representing equally spaced, numeric* time series; has numeric timestamps
mts multivariate time series class
zoo built on ts with added functionality for annual and quarterly observations (yearmon and yearqtr)
xts built on zoo for the quantmod package for added date/timestamp conversion capabilities
timeSeries class with datetime indices
* limited support for non-numeric data

ts - basic time series classSAMPLE TIME SERIES
1949.000 112
1949.083 118
1949.167 132
1949.250 129
use ts( ) function to create a time series

Working with time series
Subsetting a time series with window( )
Lagging a time series with lag( )

Plotting time series
Plotting with plot( ), plot.ts( ), or ts.plot( )
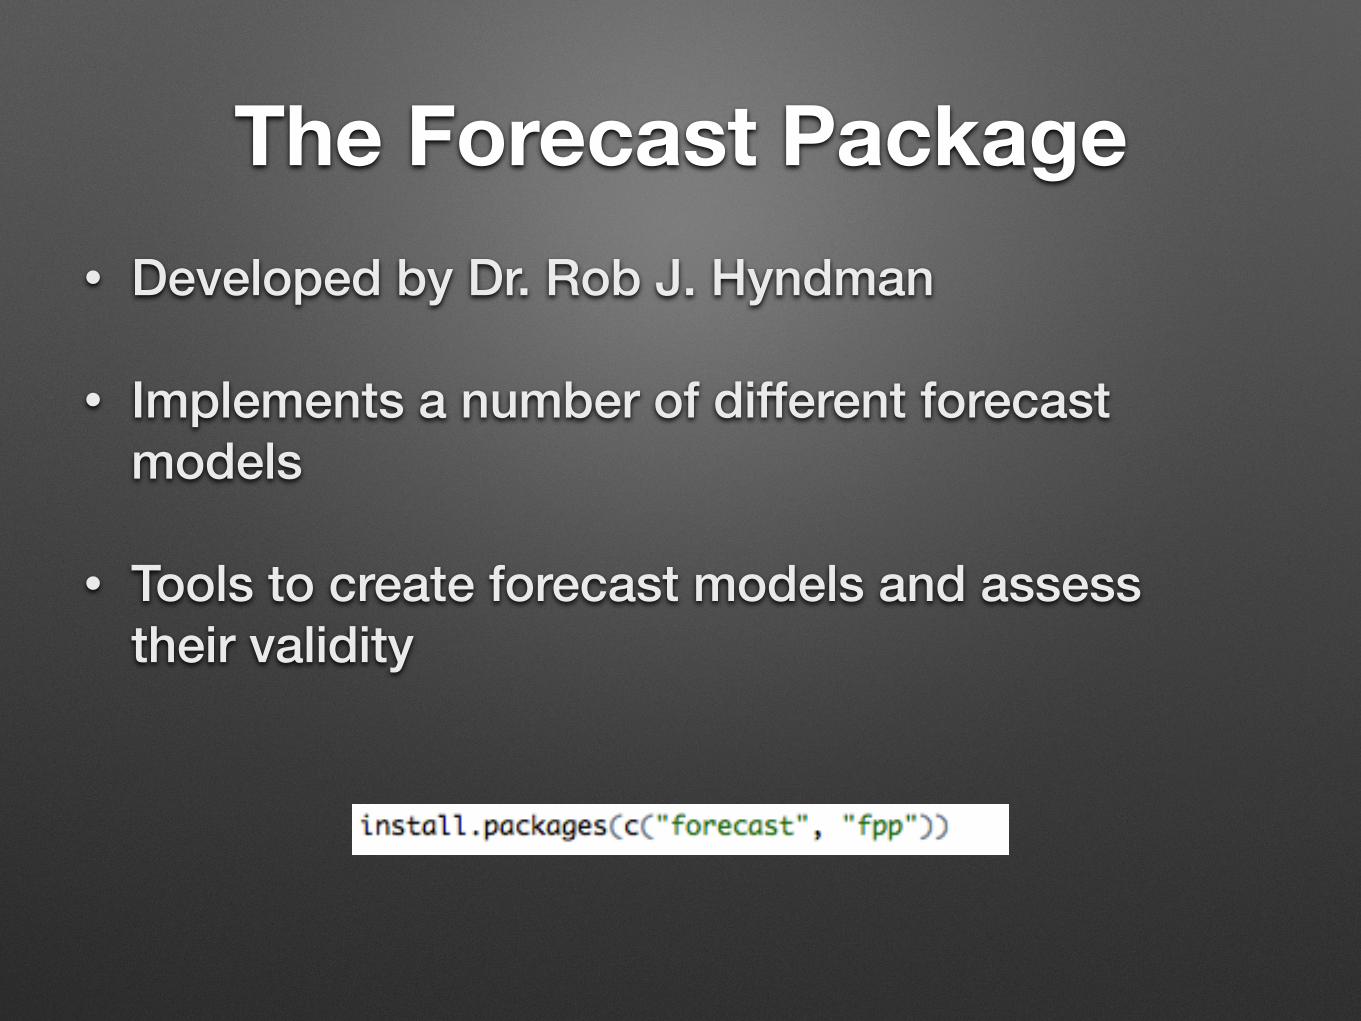
The Forecast Package• Developed by Dr. Rob J. Hyndman
• Implements a number of different forecast models
• Tools to create forecast models and assess their validity

How do we validate a forecast model?
• Does it beat random chance?
• Does it beat a simple model?

Simple Forecasting Methods(Made even simpler with the forecast package)
Mean forecast - predicted values are the mean of the historical time series
Naive forecast - predicted values are equal to the last known predicted value
Seasonal Naive forecast - predicted values are equal to the same values of the prior seasonal period
Drift forecast - naive forecast with a drift factor based on the trend in the historic data set


Error measures of forecasts• Mean Absolute Error
(MAE)
• Root Mean Squared Error (RMSE)
• Mean Absolute Percentage Error (MAPE)
• Symmetric Mean Absolute Percentage Error (sMAPE)
• Mean Absolute Scaled Error (MASE)

How accurate are the simple methods?
RMSE VALUE
MEAN 230.6
NAIVE 99.3
SNAIVE 50.1
DRIFT 90.7
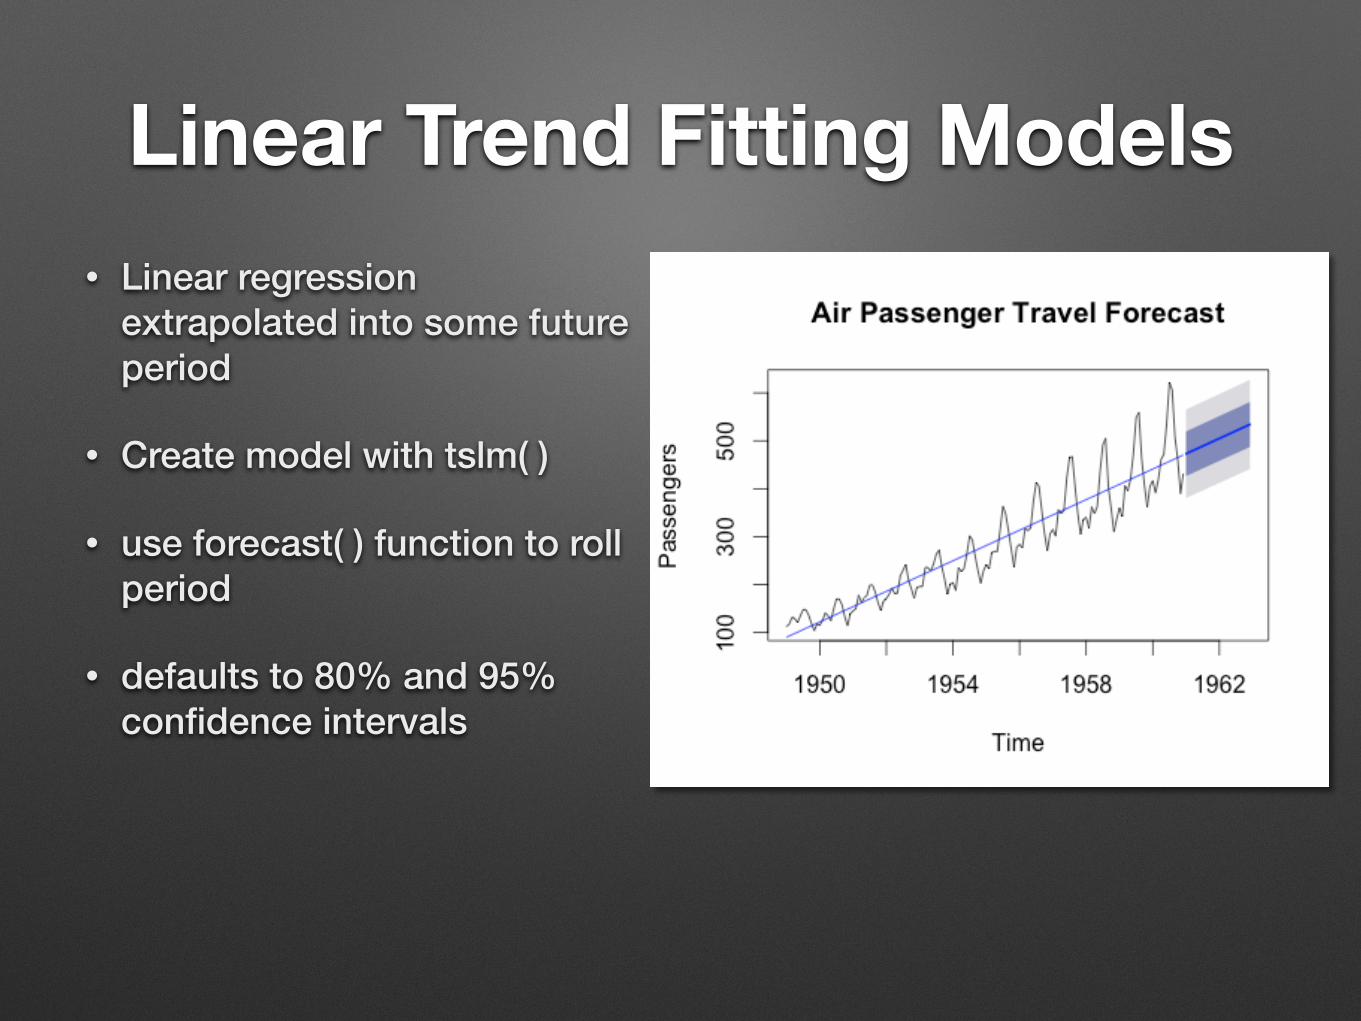
Linear Trend Fitting Models• Linear regression
extrapolated into some future period
• Create model with tslm( )
• use forecast( ) function to roll period
• defaults to 80% and 95% confidence intervals
For next time…• Dummy variables
• Data transforms
• Seasonal decompositions
• Exponential smoothing

Other Resources• TimeSeries task view
• http://cran.r-project.org/web/views/TimeSeries.html
• Good overview of time series packages, classes, and datasets
• Rmetrics ebook on timeseries https://www.rmetrics.org/ebooks-tseries
• "Forecasting: Principles and Practice” Hyndman & Athanasopoulos https://www.otexts.org/fpp/
• “Introductory Time Series with R” Cowpertwait & Metcalfe