intro to forecasting - part 3 - hrug
TRANSCRIPT

Intro to Forecasting in R Part 3
Houston R Users Group Ed Goodwin, CFA

The story so far…• time series classes in R
• simple and naive forecasts
• simple linear regressions
• dummy variables
• data transformations

One more transformation using scale( )
Use the scale function to scale two different matrices. Scale uses the formula (x-mean(x))/sd(x) to make all data sets on same scale.
You can use arguments to set the whether you center on 0 or not and whether to scale by a certain numeric amount or default to standard deviation

Example of Scale in Action• Monthly time series
of pigs slaughtered
• Monthly time series of pounds of milk produced

Unscaled Plot

Scaling code

Scaled plot

Stationarity
Stationarity is a measure of how much a point in a time series is dependent on prior points in the time series. You must know if your data is stationary (or non-stationary) in
order to determine how to forecast.
Certain models only work on stationary time series (e.g. ARIMA)

Stationarity - Examples
Non-Stationary Stationary

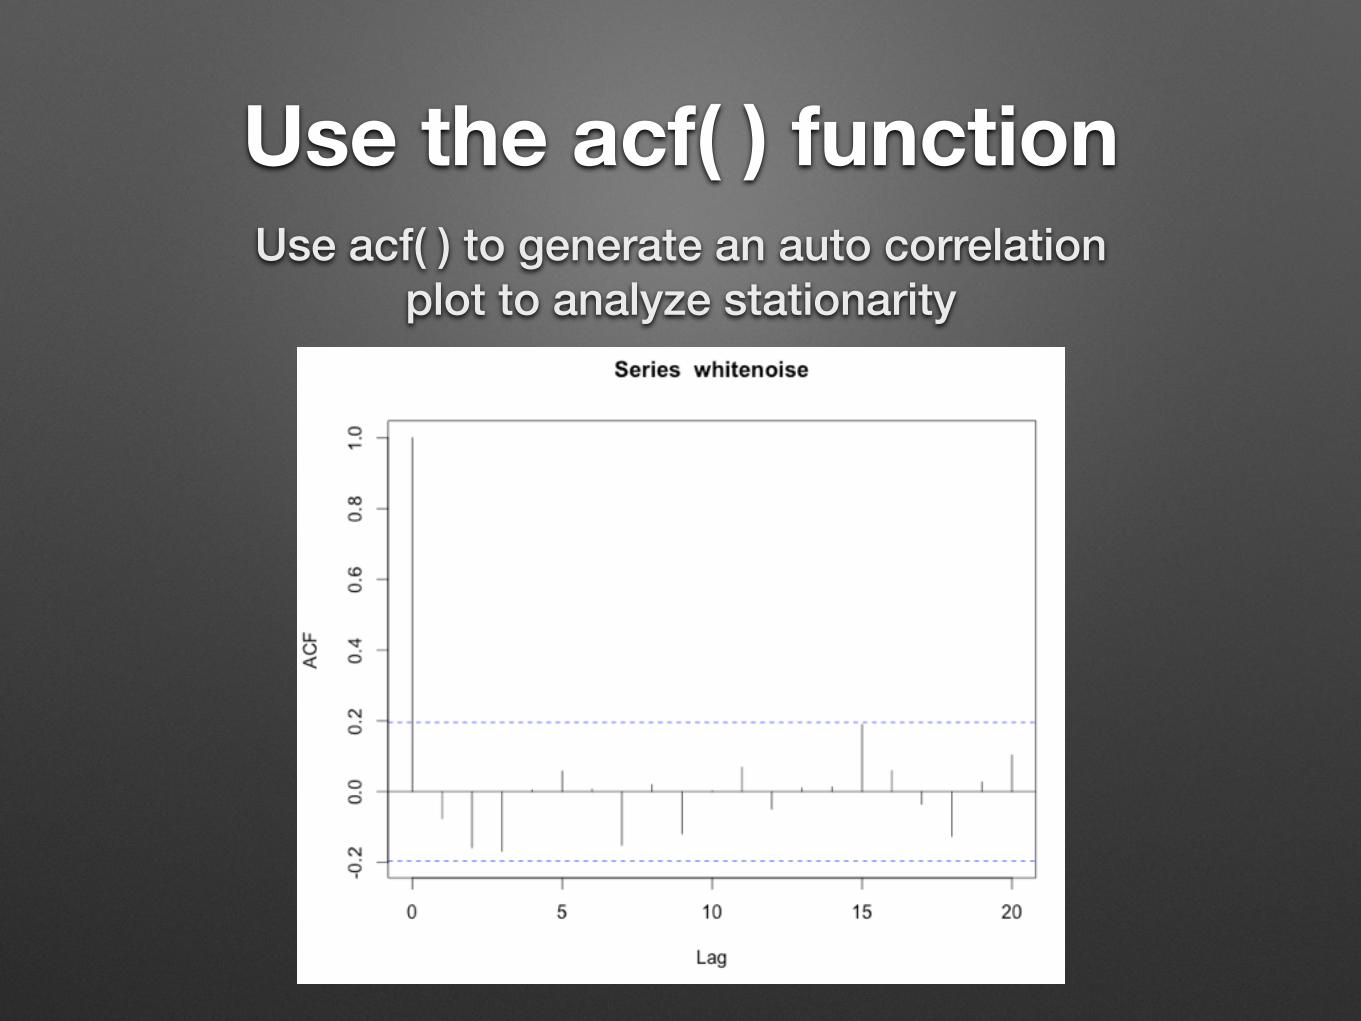
Use the acf( ) functionUse acf( ) to generate an auto correlation
plot to analyze stationarity
Use the acf( ) functionUse acf( ) to generate an auto correlation
plot to analyze stationarity
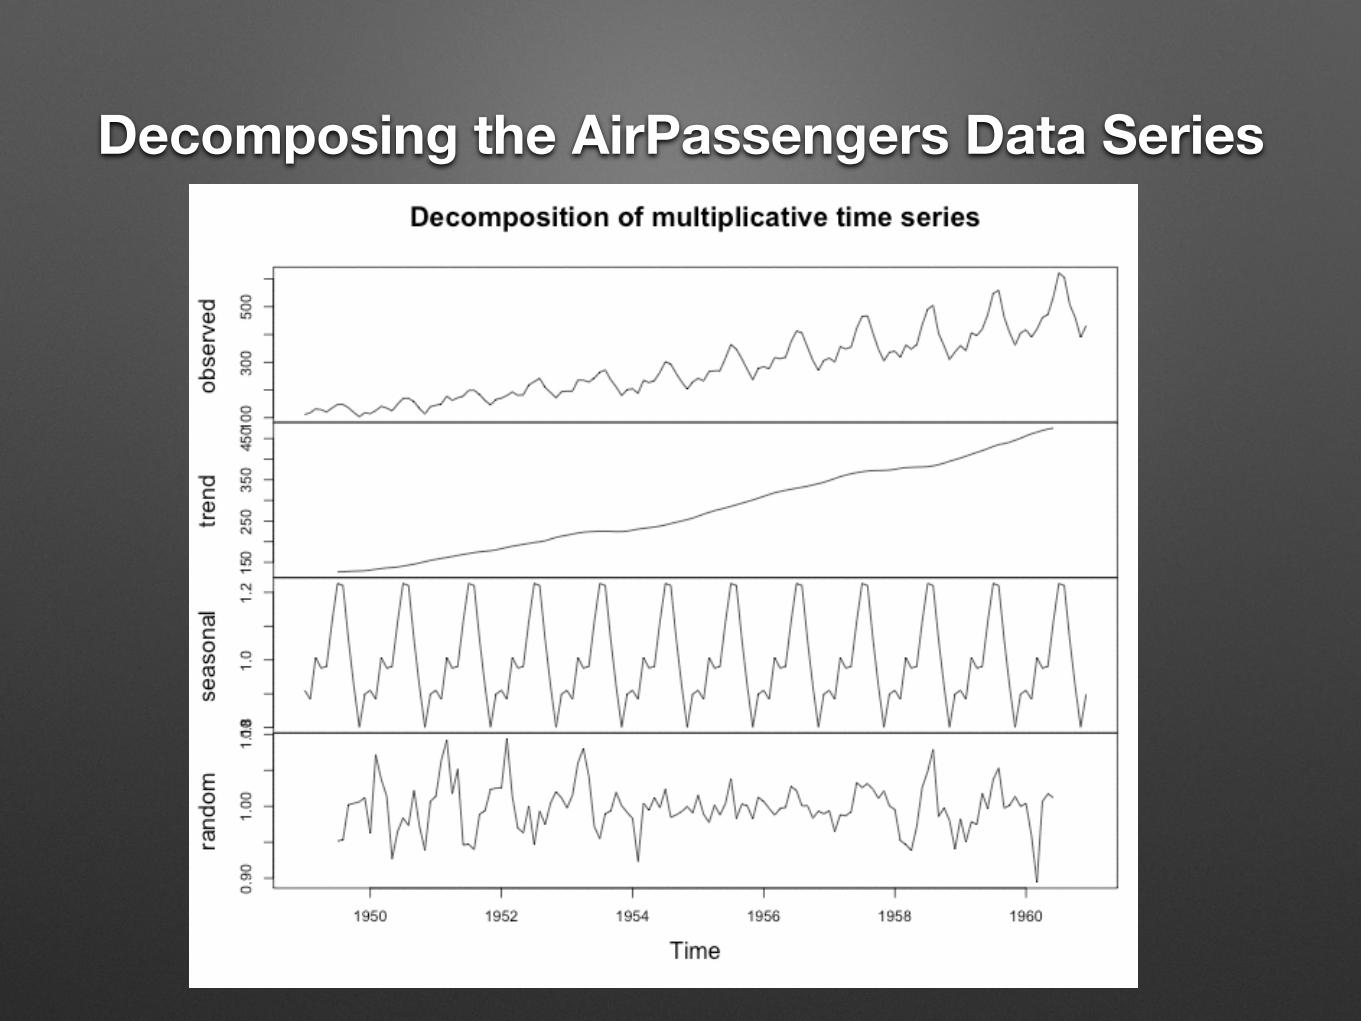
Decomposing the AirPassengers Data Series

It’s easy…just use the decompose( ) function
type can be additive or multiplicative

Exponential Smoothing Using Holt-Winters
Holt-Winters is a seasonal trend forecasting model. It is a simple exponential smoothing model. This means that it predicts the future based on a set of smoothed average
observations about the past, accounting for trend and seasonal variations.

Holt-WintersUse the hw( ) function.

Holt-Winters Forecast of Air Passengers