how sustainable are public debt levels in cee? - wiiw sustainable are public debt levels in cee? ......
TRANSCRIPT
1
How Sustainable are Public Debt Levels in CEE?id f l d i fEvidence for Selected CESEE Countries from a
Stochastic Debt Sustainability Analysis
Markus Eller and Jarmila UrvováOesterreichische Nationalbank (OeNB)Foreign Research Division
wiiw Spring Seminar 2013
Vienna, 21 March 2013
Opinions expressed do not necessarily reflect the official viewpoint of the OeNB or the Eurosystem
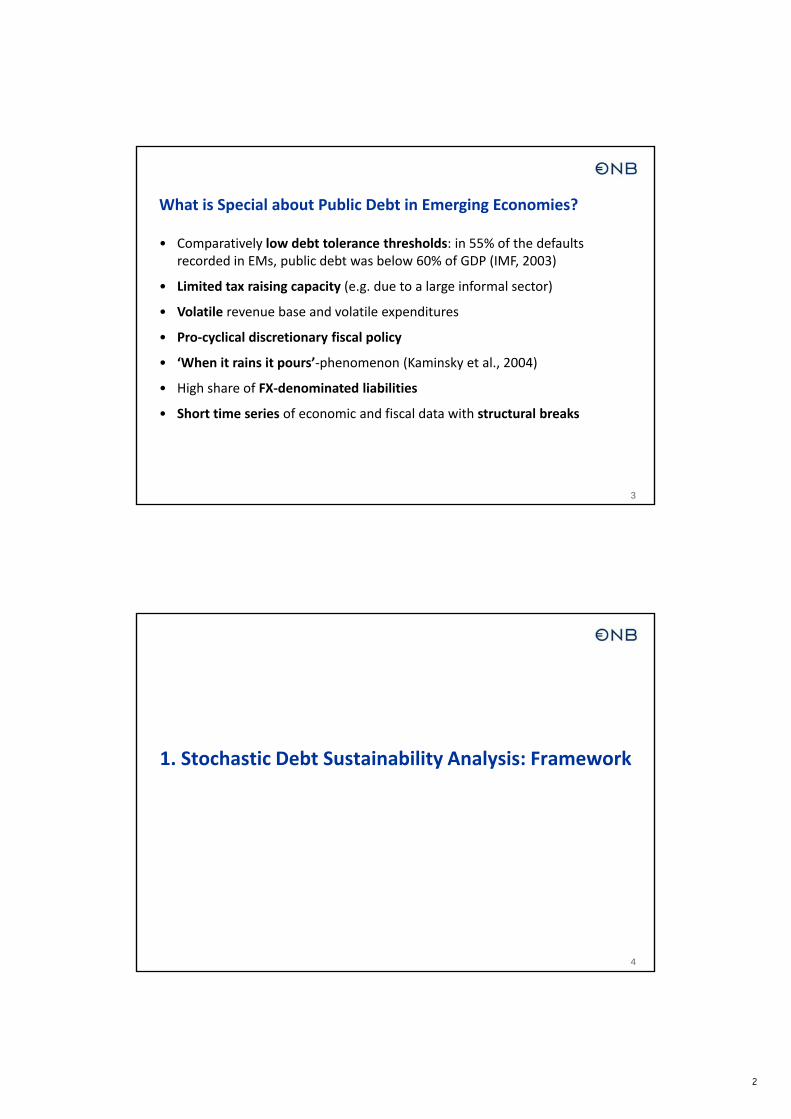
Public Debt: An Issue in CESEE?
2
2
What is Special about Public Debt in Emerging Economies?
• Comparatively low debt tolerance thresholds: in 55% of the defaults recorded in EMs, public debt was below 60% of GDP (IMF, 2003), p ( , )
• Limited tax raising capacity (e.g. due to a large informal sector)
• Volatile revenue base and volatile expenditures
• Pro‐cyclical discretionary fiscal policy
• ‘When it rains it pours’‐phenomenon (Kaminsky et al., 2004)
Hi h h f FX denominated liabilities
3
• High share of FX‐denominated liabilities
• Short time series of economic and fiscal data with structural breaks
1. Stochastic Debt Sustainability Analysis: Framework
4
3
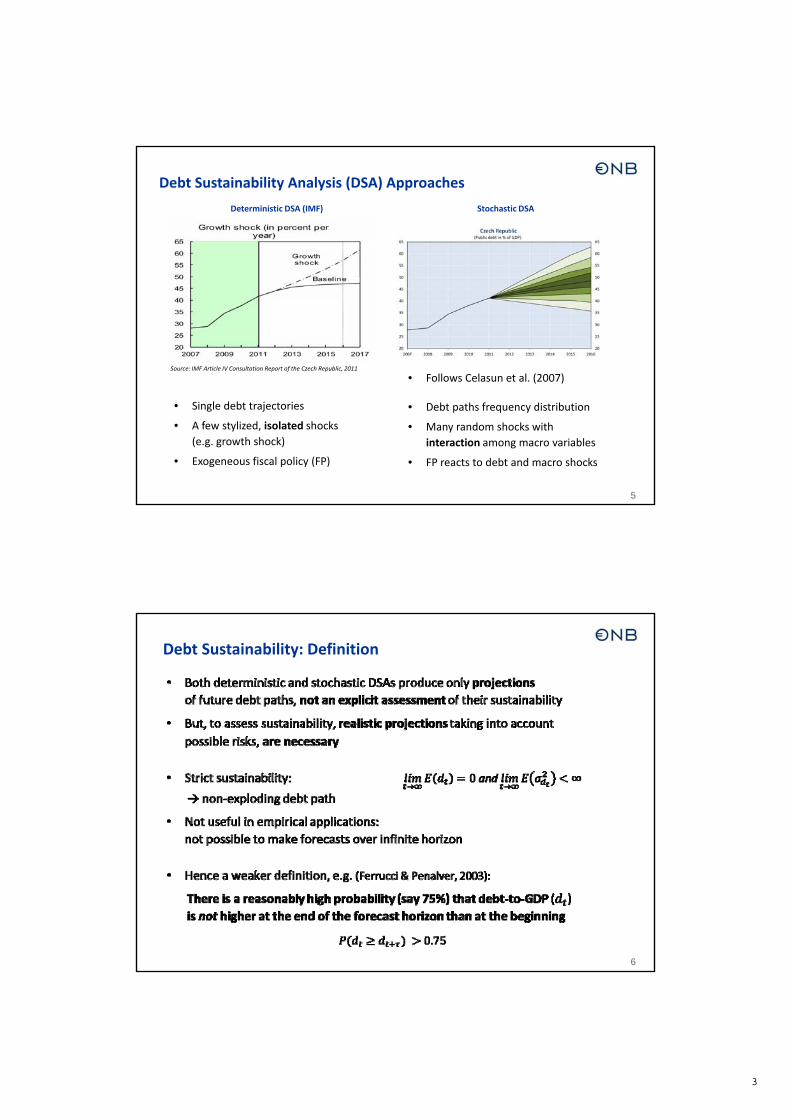
Debt Sustainability Analysis (DSA) Approaches
Deterministic DSA (IMF) Stochastic DSA
• Follows Celasun et al. (2007)Source: IMF Article IV Consultation Report of the Czech Republic, 2011
5
• Debt paths frequency distribution
• Many random shocks with interaction among macro variables
• FP reacts to debt and macro shocks
• Single debt trajectories
• A few stylized, isolated shocks(e.g. growth shock)
• Exogeneous fiscal policy (FP)
Debt Sustainability: Definition
6
4
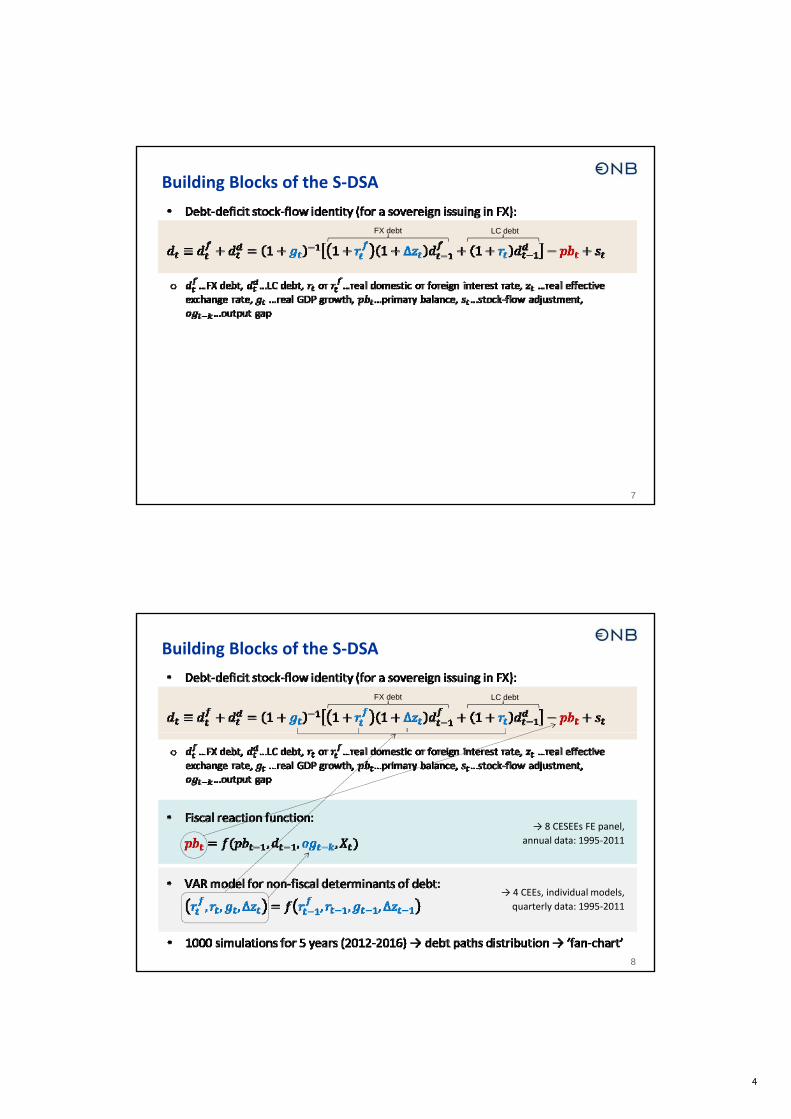
Building Blocks of the S‐DSA
FX debt LC debt
7
Building Blocks of the S‐DSA
FX debt LC debt
→ 8 CESEEs FE panel, annual data: 1995‐2011
8
→ 4 CEEs, individual models, quarterly data: 1995‐2011
5
2. Average Fiscal Policy Patterns: Fiscal Reaction Function
9
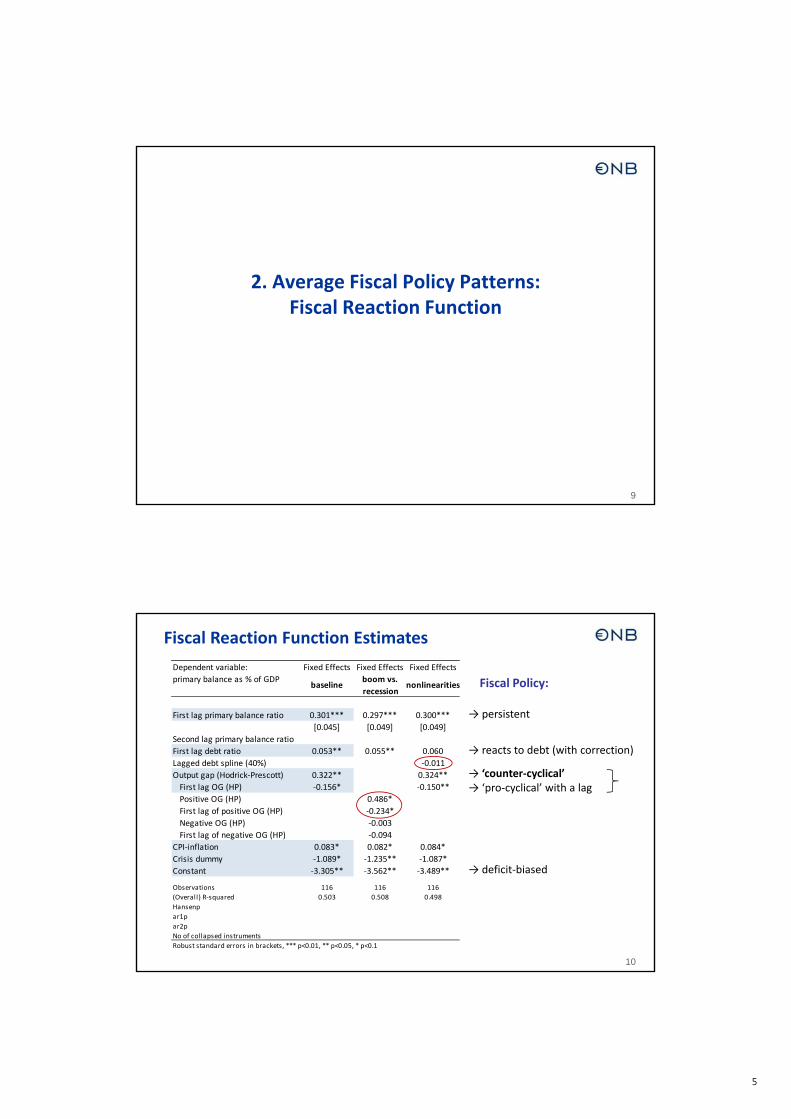
Fiscal Reaction Function Estimates
→ persistent
Fiscal Policy:Dependent variable: Fixed Effects Fixed Effects Fixed Effectsprimary balance as % of GDP
baselineboom vs.recession
nonlinearities
First lag primary balance ratio 0.301*** 0.297*** 0.300***[0.045] [0.049] [0.049]
→ reacts to debt (with correction)
→ ‘counter‐cyclical’→ ‘pro‐cyclical’ with a lag
Second lag primary balance ratioFirst lag debt ratio 0.053** 0.055** 0.060Lagged debt spline (40%) ‐0.011Output gap (Hodrick‐Prescott) 0.322** 0.324** First lag OG (HP) ‐0.156* ‐0.150** Positive OG (HP) 0.486* First lag of positive OG (HP) ‐0.234* Negative OG (HP) ‐0.003 First lag of negative OG (HP) ‐0.094CPI‐inflation 0.083* 0.082* 0.084*
10
→ deficit‐biasedCrisis dummy ‐1.089* ‐1.235** ‐1.087*Constant ‐3.305** ‐3.562** ‐3.489**
Observations 116 116 116(Overall) R‐squared 0.503 0.508 0.498Hansenpar1par2pNo of collapsed instrumentsRobust standard errors in brackets, *** p<0.01, ** p<0.05, * p<0.1
6
3. Baseline Results vs. Alternative Scenarios
11
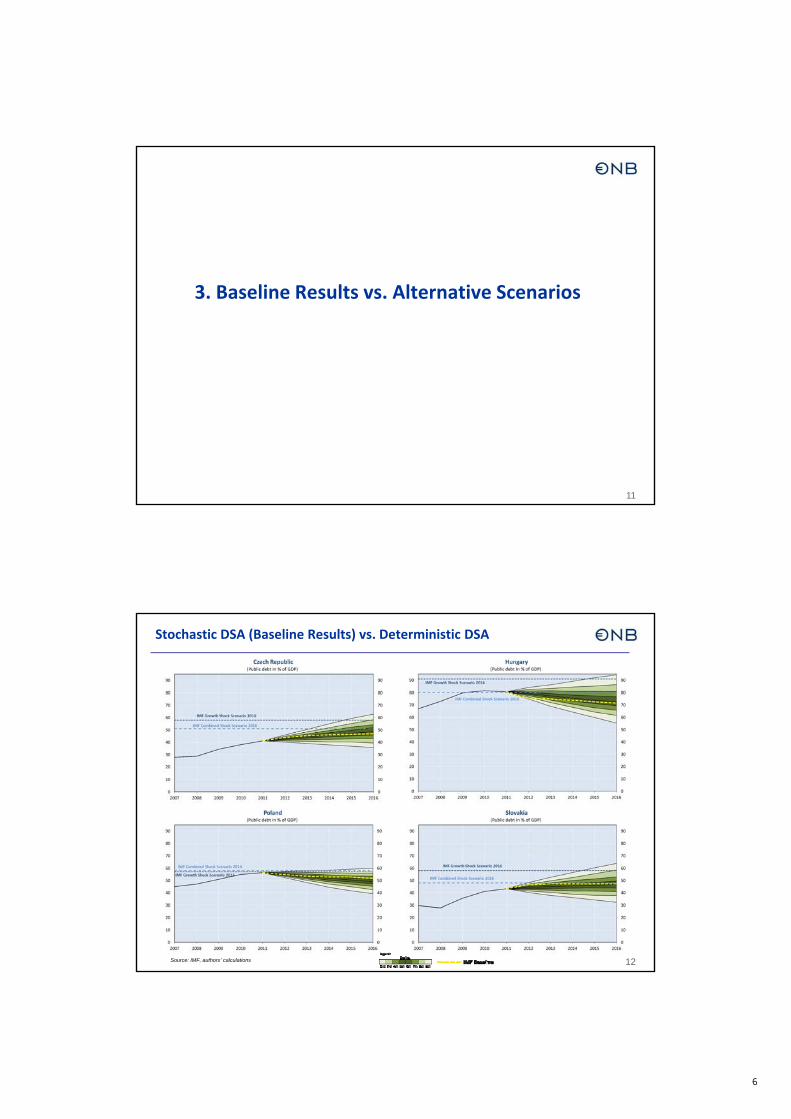
Stochastic DSA (Baseline Results) vs. Deterministic DSA
12Source: IMF, authors’ calculations
7
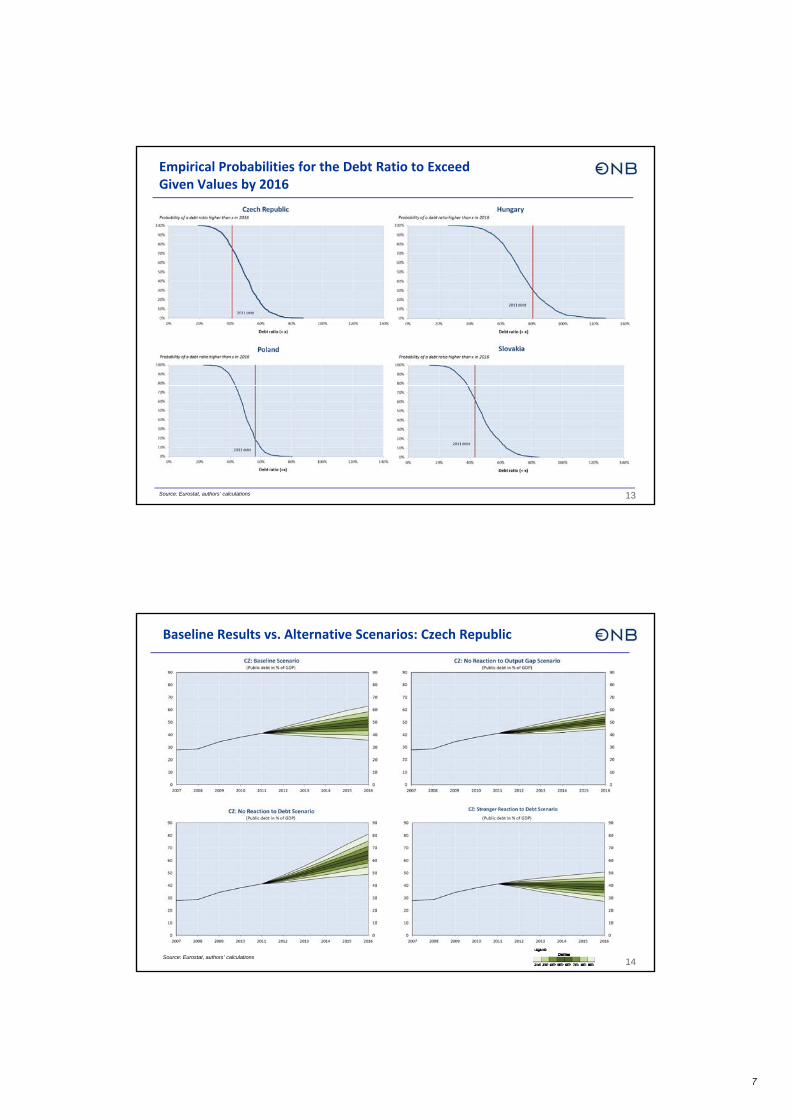
Empirical Probabilities for the Debt Ratio to Exceed Given Values by 2016
13Source: Eurostat, authors’ calculations
Baseline Results vs. Alternative Scenarios: Czech Republic
14Source: Eurostat, authors’ calculations
8
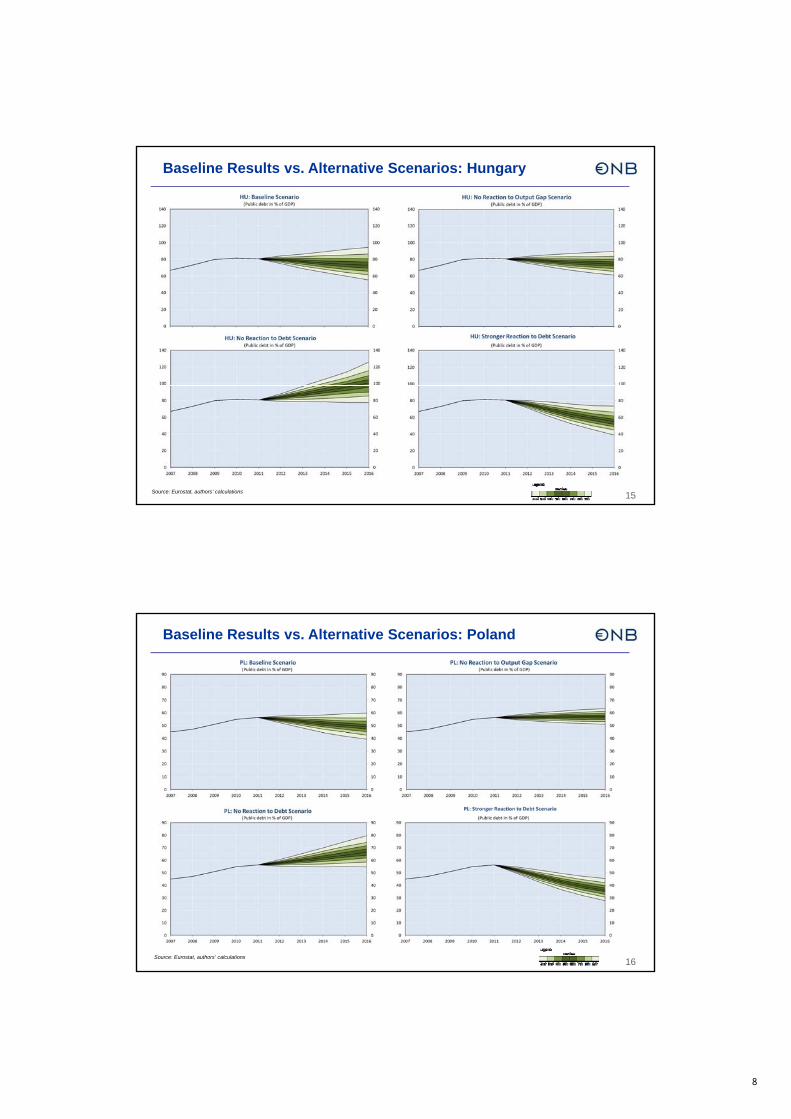
Baseline Results vs. Alternative Scenarios: Hungary
15Source: Eurostat, authors’ calculations
Baseline Results vs. Alternative Scenarios: Poland
16Source: Eurostat, authors’ calculations
9
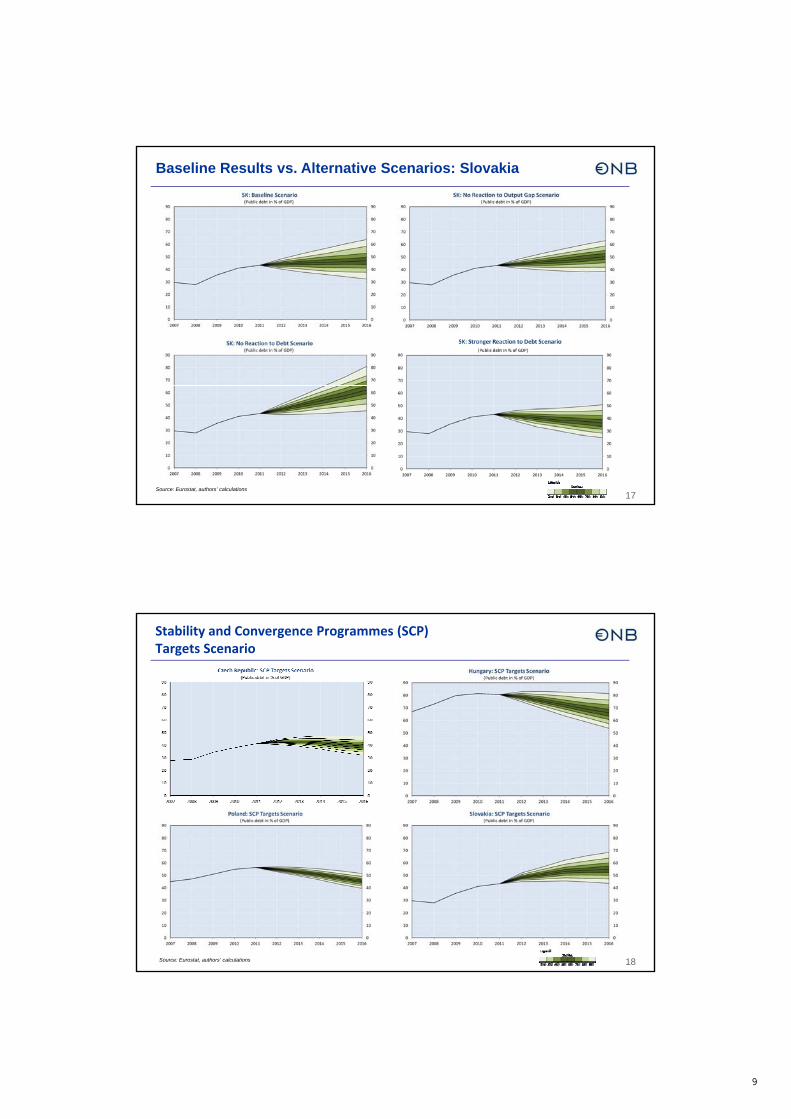
Baseline Results vs. Alternative Scenarios: Slovakia
17Source: Eurostat, authors’ calculations
Stability and Convergence Programmes (SCP) Targets Scenario
18
Source: Eurostat, authors’ calculations
Source: Eurostat, authors’ calculations
10
4. Summary
19
Country Results & Policy Conclusions I.
• In our panel of CESEE countries, the primary balance reacts:
o With persistence
o In a debt correcting mannero In a debt‐correcting manner
o Counter‐cyclically
• Median debt projections suggest sustainability (non‐explosive debt paths). However, its achievement is still subject to notable risks:
o Highest probability of an increasing debt ratio from 2012 until 2016 in the Czech Rep. and Slovakia (but still below 75%)
20
o Although Hungary shows a decreasing median debt path, there is a probability of at least 30% that the debt ratio increases until 2016.
o The probability that Poland surpasses the 60% debt‐to‐GDP threshold until 2016 is rather small (at most 10%)
11
Country Results & Policy Conclusions II.
• Impact of different policy scenarios
o Acyclical fiscal policy reduces uncertainty, but leads to somewhat larger median debt projections (e.g. due to deficit bias).p j ( g )
o A policy that does not take debt developments into account leads to a clearly larger probability of exploding debt paths.
o In turn, if countries put more weight on debt stabilization than in the past, their mean debt ratios can be squeezed rather quickly to moderate levels.
o Complying with the defined Stability and Convergence Programmes targets limits the overall risks to the debt outturns and reduces debt ratios in most countries.
21
• Probability distribution of future debt realizations captures interactions among the macroeconomic and fiscal variables being shocked
o A more plausible range of risks depicted allows for a better‐informed policy reaction should these risks materialize
Concluding Remarks
• Value added
o First S‐DSA explicitly for CESEE countries appropriate to account for intrinsic economic volatilities in emerging market economieseconomic volatilities in emerging market economies
o Augmented approach of Celasun et al. (2007): we account for a wider set of fiscal policy determinants and for possible non‐stationarity of the time series;calibration of Fiscal Reaction Function for alternative scenarios
• Some caveats for the S‐DSA methodology further research necessary
o Lack of feedback from fiscal policy to the macro environment (e.g. fiscal multipliers or reaction of interest rates via risk premia)
22
reaction of interest rates via risk premia)
o Model and parameter uncertainty not yet captured in the fan charts
o Shocks are drawn from a normal distribution: asymmetry or fat tail events not captured
Paper URL: http://www.oenb.at/de/img/feei_2012_q4_studies_eller_urvova_tcm14‐251595.pdf

12
Thank you.
23