how global is globalization? - business and economics · how global is globalization? abstract: ......
TRANSCRIPT
How Global is Globalization?
Jac C. Heckelman Wake Forest University
Winston-Salem, NC 27109 ph: 336 758 5923
Andrew T. Young College of Business and Economics
West Virginia University Morgantown, WV 26506-6025
ph: 304 293 4526 em: [email protected]
Latest Version: December 2013
JEL Codes: E02, F02, F40, F60, O43
Keywords: globalization, institutions, sigma convergence, stochastic convergence, panel unit root tests
1
How Global is Globalization?
Abstract: We examine a balanced panel of globalization indices for 129 countries over the years 1991-2010. We report evidence of cross-country sigma convergence in the overall globalization index. Sigma convergence also holds for each of the economic, political, and social globalization indices, as well as each sub-index within these indices. However, the evidence for stochastic convergence, based on panel unit root tests, is only strong for the political globalization index. Regarding the economic and social dimensions of globalization, respectively, we find evidence for stochastic convergence only in the flows and cultural proximity sub-indices. For the OECD subsample, evidence supports stochastic convergence for the overall, economic and political globalization indices. Evidence to support regional convergence among the non-OECD nations on various globalization dimensions is much more limited. Our findings indicate that globalization convergence is truly global only on the political dimension. JEL Codes: E02, F02, F40, F60, O43 Keywords: globalization, institutions, sigma convergence, stochastic convergence, panel unit root tests
2
1. Introduction
An International Monetary Fund (IMF) website aptly describes globalization as “an extension beyond
national borders of the same market forces that have operated for centuries at all levels of human
economic activity”.1 Such market forces are increasingly evident in the flows of goods, people, and ideas
across countries’ borders. As a result, countries are generally more integrated; more globalized than ever
before.
However, the pace of globalization has not been uniform across countries. As Frankel (2000)
notes, the “two main drivers of economic globalization are reduced costs to transportation and
communication in the private sector, and reduced policy barriers to trade and investment on the part of the
public sector” (p. 2). The latter are constituted by legal institutions and can be extended to include barriers
to migration and to the exchange of information. The evolution of these institutions in any individual
country is a complex process and, undoubtedly, there are also interdependencies across the processes of
different countries.
In this paper we investigate how truly global is globalization. Regarding the extent of integration,
are all or most countries converging towards a common benchmark? Or is convergence only occurring
within certain groups (or clubs) of countries, each with their own benchmark? Alternatively, have some
countries simply stalled in the globalization process? Furthermore, do the answers to these questions
differ depending on the particular dimension of globalization considered? We explore a panel of 129
countries covering the years 1991-2010 and seek to characterize countries’ globalization processes by
utilizing the KOF globalization indices values (Dreher, 2006). These indices include an overall
globalization index, but also constituent economic, social, and political indices; as well as sub-indices
within the economic and social categories.
Our work is related to that of Arribas et al. (2009). These authors propose a standard of perfect
integration (SPII) that “characterizes a world where frontiers and distance do not matter” and “describes
1 http://www.imf.org/external/np/exr/ib/2008/053008.htm
3
the conditions under which the world economy would operate as a global village” (p. 127). They then
analyze, using various measures of globalization, how close the world has approached the SPII.2 The
perspective on globalization explored here is different and complements that of Arribas et al. (2009).
Rather than relative to an ideal, we simply seek evidence of benchmarks towards which countries may be
actually converging. To the extent that the average KOF index values are increasing over time, this
evidence meaningfully characterizes globalization processes.
We consider two related concepts of convergence: sigma convergence and stochastic
convergence. The former is perhaps the most straightforward convergence concept. Based on some index
of globalization, sigma convergence describes a situation where the dispersion of cross-country index
values decreases over time.3 Alternatively, stochastic convergence holds when shocks to a country’s
globalization index value relative to some benchmark (e.g., the world average) have only temporary
effects. Thus, the ratio of a country’s index relative to the benchmark is stationary. While sigma
convergence is what matters in some ultimate sense, looking at cross-country coefficients of variation
neglects the fact that variation over time can arise from temporary shocks. Failing to observe sigma
convergence, a researcher may be overlooking important long-run tendencies towards convergence.
Alternatively, an observation of sigma convergence may be an artifact of a particular history of shocks
rather than systematic forces tending towards long-run convergence.4
2 They report: “The distance to the theoretical potential of trade integration is still considerable, since we have no reached the halfway point [yet] the ground covered over the last forty years is quite remarkable, as it represents advances in international integration of more than 75%” (Arribas et al., 2009, p. 142). 3 The importance of sigma convergence in regards to per capita incomes is highlighted by Friedman (1992) and Quah (1993). In particular, these authors contrast sigma convergence to the alternative concept of beta convergence that is the focus of numerous empirical studies of economic growth (e.g., Barro and Sala-i-Martin (1992), Mankiw et al. (1992), Islam (1995), Sala-i-Martin (1996), Caselli et al. (1996), Evans (1997), and Higgins et al. (2006)). Beta convergence occurs when the partial correlation between a variable’s growth rate and its initial level is negative; likewise, in the context of empirical studies based on the neoclassical growth model, when an economy’s income level grows faster, all else equal, the greater the distance between its initial level and its steady-state level. Importantly, because steady-states can differ across countries and random shocks can occur, beta convergence is not sufficient (though it is necessary) for sigma convergence (Young et al., 2008). (The “beta” and “sigma” terminologies arise from the empirical growth literature and signify, respectively, the coefficient on initial per capita income in a growth regression and the standard notation for a standard deviation.) 4 Using U.S. state level data on per capita income from 1930-2009, Heckelman (2013) explores beta convergence, sigma convergence, and also stochastic convergence.
4
In a broad sense, the extent to which a country is globalized implies the quality of various
institutions. Our study, then, is also related to a small number of existing studies on cross-country
institutional convergence. Nieswiadomy and Strazicich (2004) report sigma convergence during 1972-
2001 for cross-country values of Freedom House’s political rights and civil liberties indices. Testing for
unit roots in the time series for individual countries, these authors report evidence in favor of stochastic
convergence for about half of the 136 countries in their sample. For up to 142 countries covering the
period 1970-2010, Savoia and Sen (2013) analyze scores for legal system quality, corruption, and
bureaucratic quality from the International Country Risk Guide (ICRG) and the Fraser Institute’s
Economic Freedom of the World (EFW) project. They report evidence from 5-year period panel
regressions of so-called beta convergence (see footnote 3). Elert and Halvarsson (2012) also report
evidence of cross-country beta convergence in the EFW index. Heckelman and Mazumder (2013) report
that convergence in financial reforms since the 1970s has been largely a regional (rather than global)
phenomenon.
We report evidence of global sigma-convergence for all KOF indices and sub-indices. However,
strong support for stochastic convergence is only associated with the political dimension of globalization.
In an OECD subsample of countries we report evidence supporting stochastic convergence in the overall
globalization index, as well as the economic globalization index (in addition to the political globalization
index), but not for the social globalization index or any of its sub-indices. For non-OECD countries taken
as a whole, our results match the full sample results, suggesting that non-OECD countries are not a “club”
unto themselves. We also fail to find strong evidence to support regional convergence “clubs” within the
non-OECD subsample for any dimensions of globalization considered.
2. Data
Our measure of globalization is based on the KOF index, which encompasses economic, social, and
political dimensions of globalization. The index is described in Dreher et al. (2008a,b). Drawing on the
5
KOF data, we construct and then analyze a balanced panel of 129 countries with annual coverage of the
years 1991-2010.
Economic globalization is comprised of two component sub-indices: actual flows of trade, FDI,
investment, and income payments to foreign nationals; and policy restrictions on trade and capital flows
measured by hidden import barriers, tariffs, taxes, and capital controls. The former represents “outcomes
of the game” whereas the latter represents “rules of the game”. The latter may therefore be one of many
potential factors which directly influence the former. Social globalization is comprised of three sub-
indices: personal contact representing international telephone traffic, transfers, international tourism,
foreign population, and international letters; information flows captured by internet users, cable television
subscribers, and newspapers; and cultural proximity for which the number of McDonald’s restaurants, the
number of Ikea stores, and trade in books are used as proxies. Each of these sub-indices captures
alternative ways in which individuals may learn of ideas and customs from outside their domestic borders.
Finally, political globalization is measured by the number of embassies, membership in international
organizations, participation in UN Security Council missions, and international treaties. For every
category, each component is normalized on a scale of 0 to 100, where higher values represent greater
degrees of globalization. The indices and sub-indices are weighted averages of their respective sub-
indices or components. The overall index represents a weighted index of the economic, social, and
political indices.
The KOF index has provided a measure of globalization for numerous empirical studies. For
example, higher KOF index values have been empirically linked to higher rates of economic growth
(Dreher 2006); also to increased subjective evaluations of well-being (Hessami 2011) and life
expectancies (Bergh and Nilsson 2010a). While the KOF social globalization index, specifically, has been
positively linked to income inequality, particularly in developing economies (Bergh and Nilsson, 2010b),
6
it has been negatively linked to gender inequality (Potrafke and Ursprung, 2012).5 Furthermore, higher
KOF index values are associated with lower rates of inflation (Samimi et al., 2012).6
The KOF data set begins in 1970 but missing data is an issue, in particular for the earlier years.
We focus on a sample for which each country has complete time series for every sub-index. To limit the
loss of countries, then, we begin the sample period in 1991. In addition to yielding a sample with
substantially more countries than if we started earlier, 1991 also corresponds to the breakup of the Soviet
Union into several independent countries. The breakup also resulted in substantially greater autonomy for
the Soviet Union’s erstwhile satellites. These newly independent and former satellite countries constitute
a considerable part of our “Former Soviet Union & Central and Eastern Europe” regional subsample. Our
final sample includes annual observations on 129 nations from 1991 to 2010.
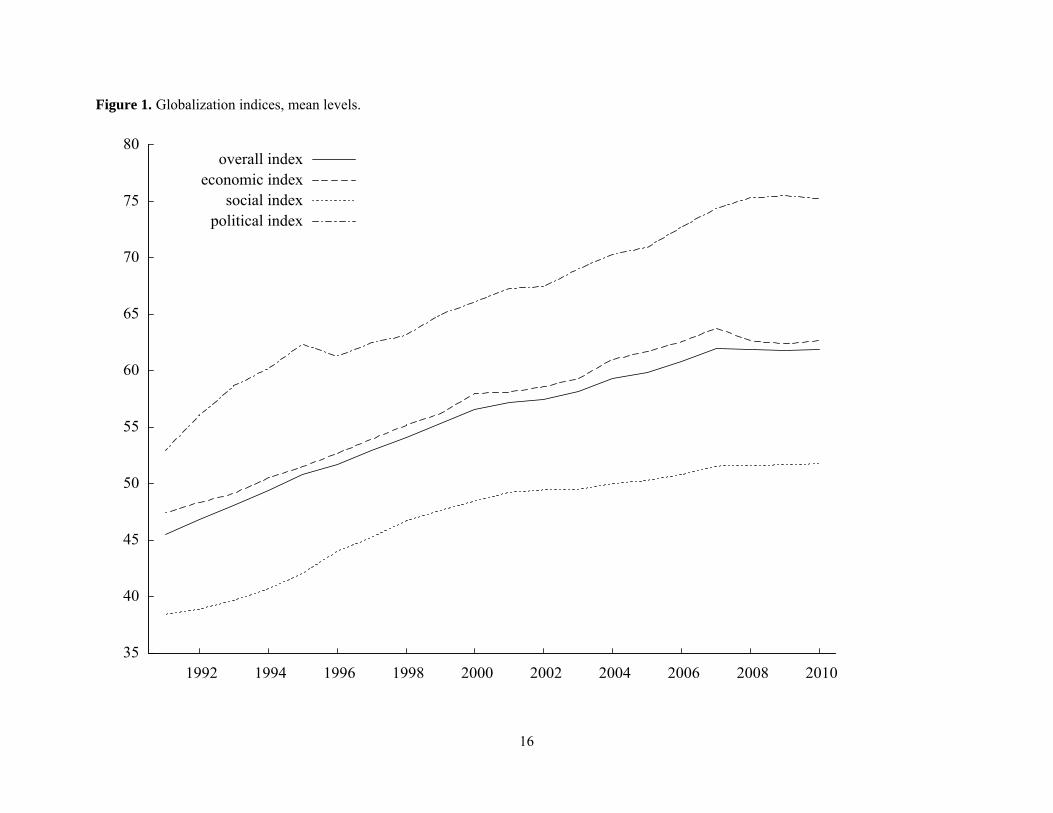
The mean values for the three indices (economic, social, and political) and the overall index are
plotted in Figure 1. Each index has a clear upward trend. However, all three indices have somewhat
leveled off in recent years. (Average economic globalization, as measure by the KOF index, has actually
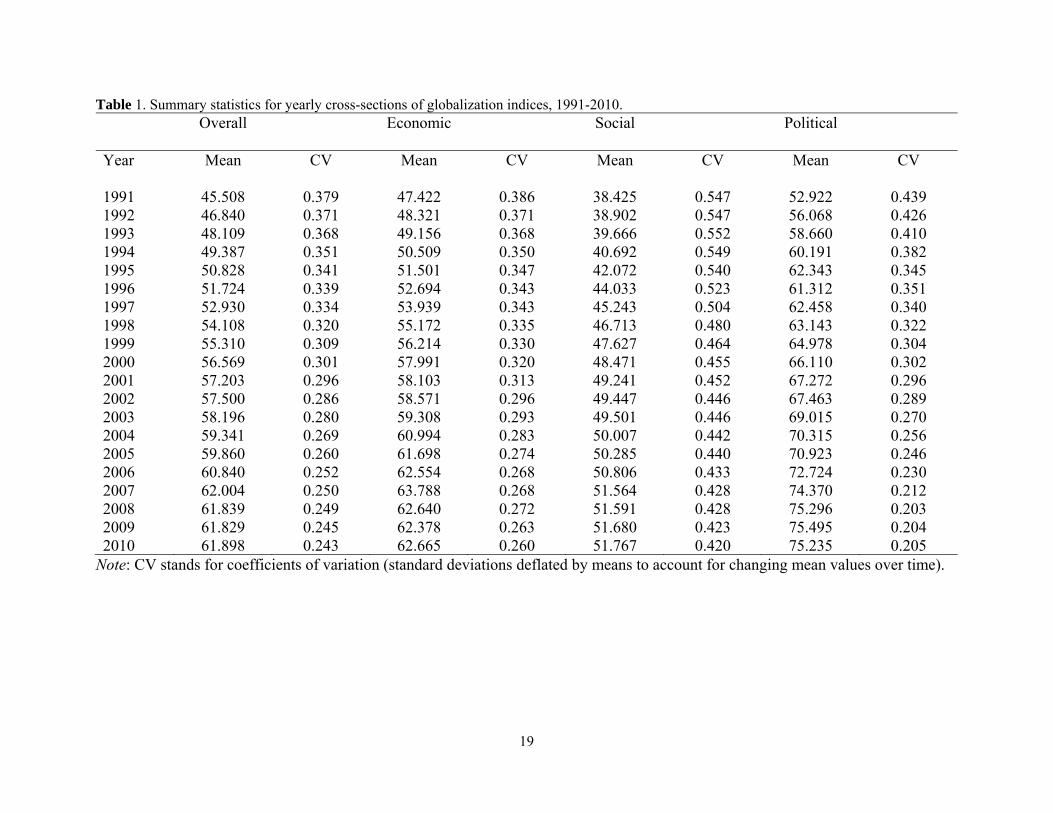
fallen notably since its 2007 high.) In Table 1 we report the mean values of each index for each year,
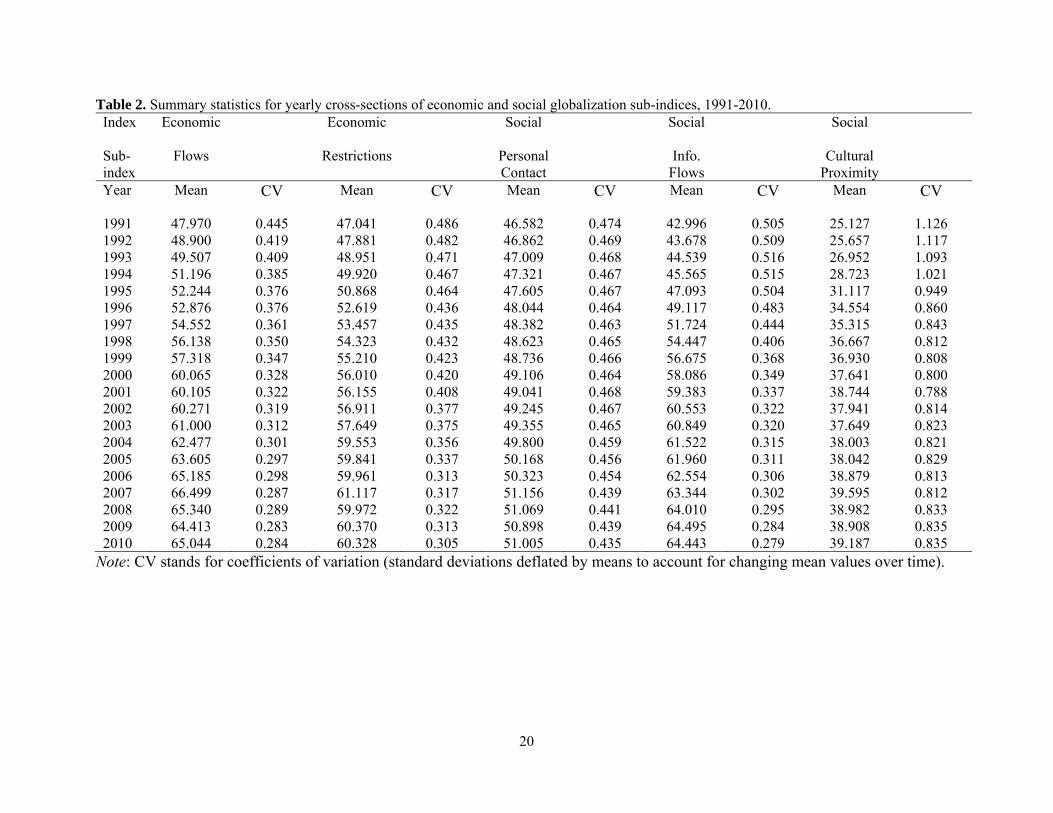
1991-2010, and in Table 2 we report the yearly means for the constituent sub-indices of economic and
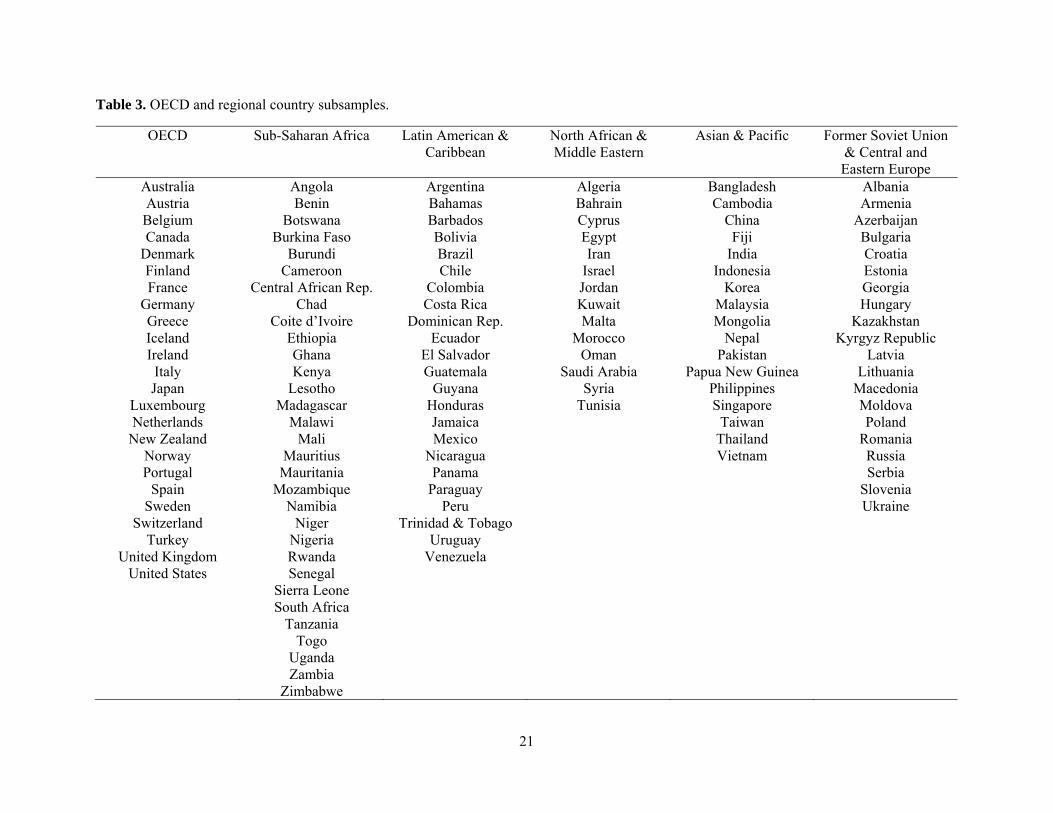
social globalization. In the course of our analysis below we also consider various subsamples of countries.
First, we consider OECD versus non-OECD. Second, from the latter we consider various regional
subsamples. The countries constituting each of these subsamples are reported in Table 3.7
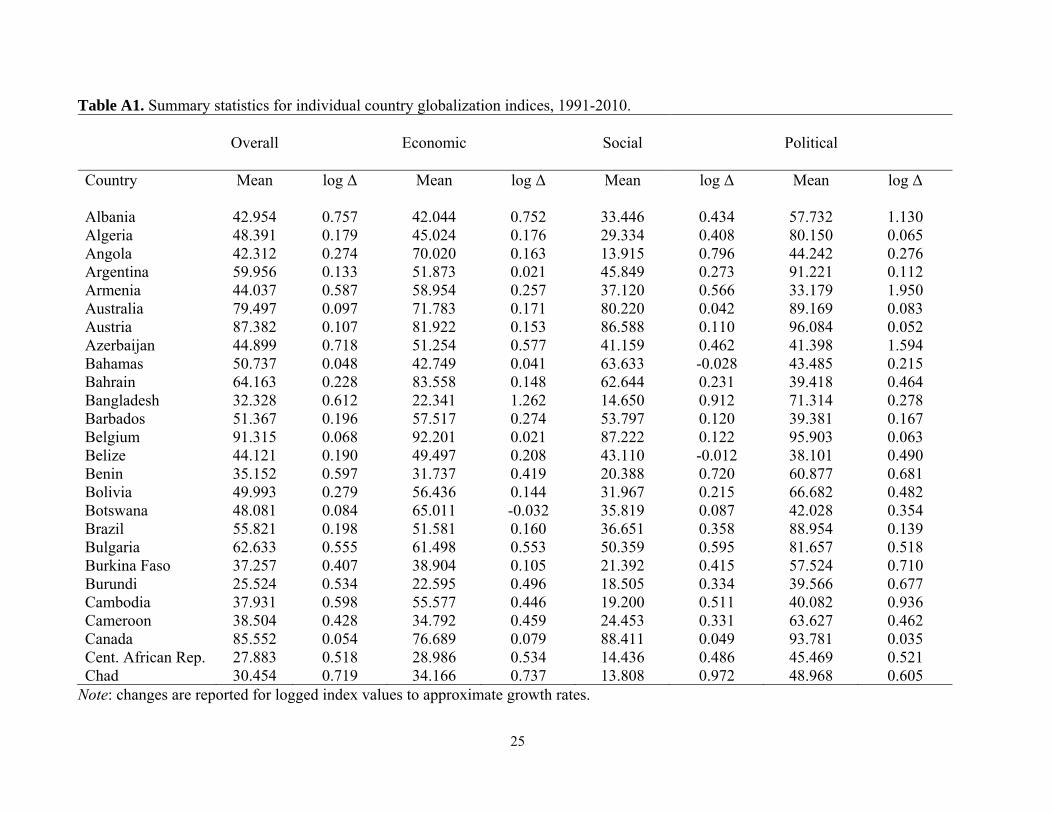
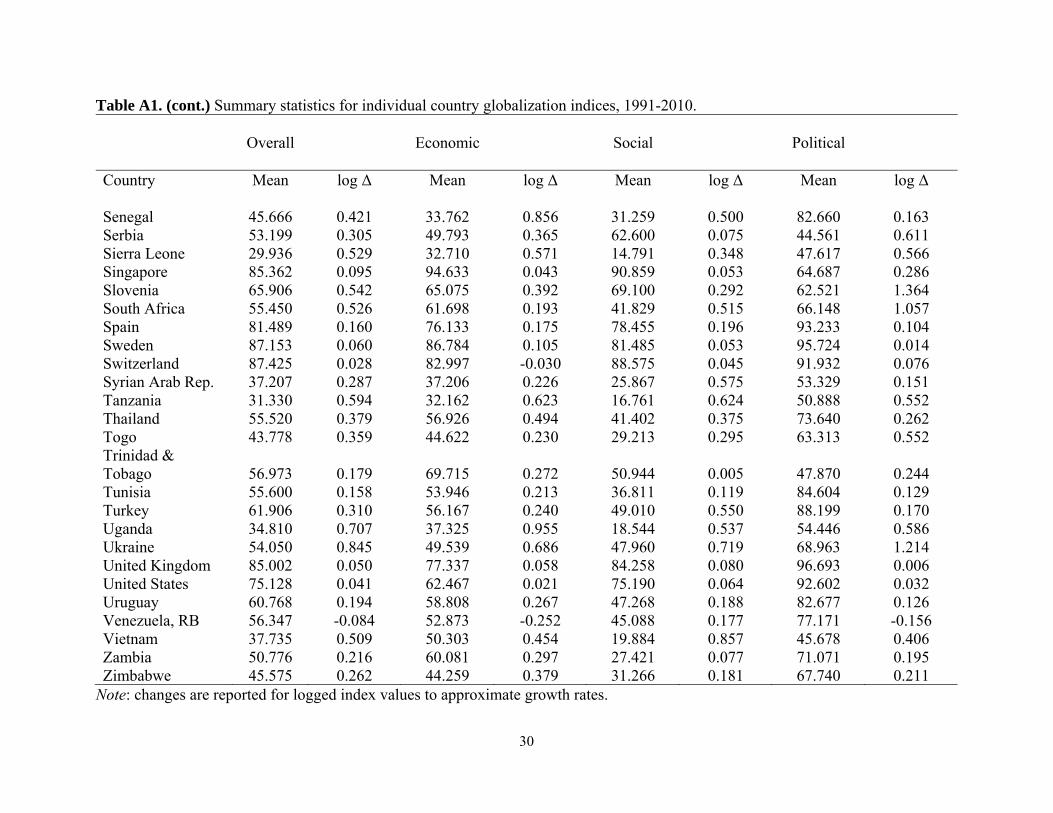
5 Increased globalization has also been hypothesized to fiscally constraint governments by subjecting them to increased budgetary pressures from without. Dreher et al. (2008) report evidence based on the KOF index that fails to confirm this so-called disciplining hypothesis. 6 Samimi et al. (2012), alternatively, fail to find an independent link between a more conventional measure of trade openness and inflation. 7 Summary statistics for individual country overall, economic, political, and social globalization indices are provided in appendix Table A1. Likewise, summary statistics for individual country economic and social globalization sub-indices are provided in appendix Table A2.
7
3. Results
In this section we report the results of our analysis of the KOF indices. Specifically, we report evidence
regarding the hypotheses of sigma convergence and cross-country stochastic convergence in the cross-
country data.
3.1 Sigma Convergence
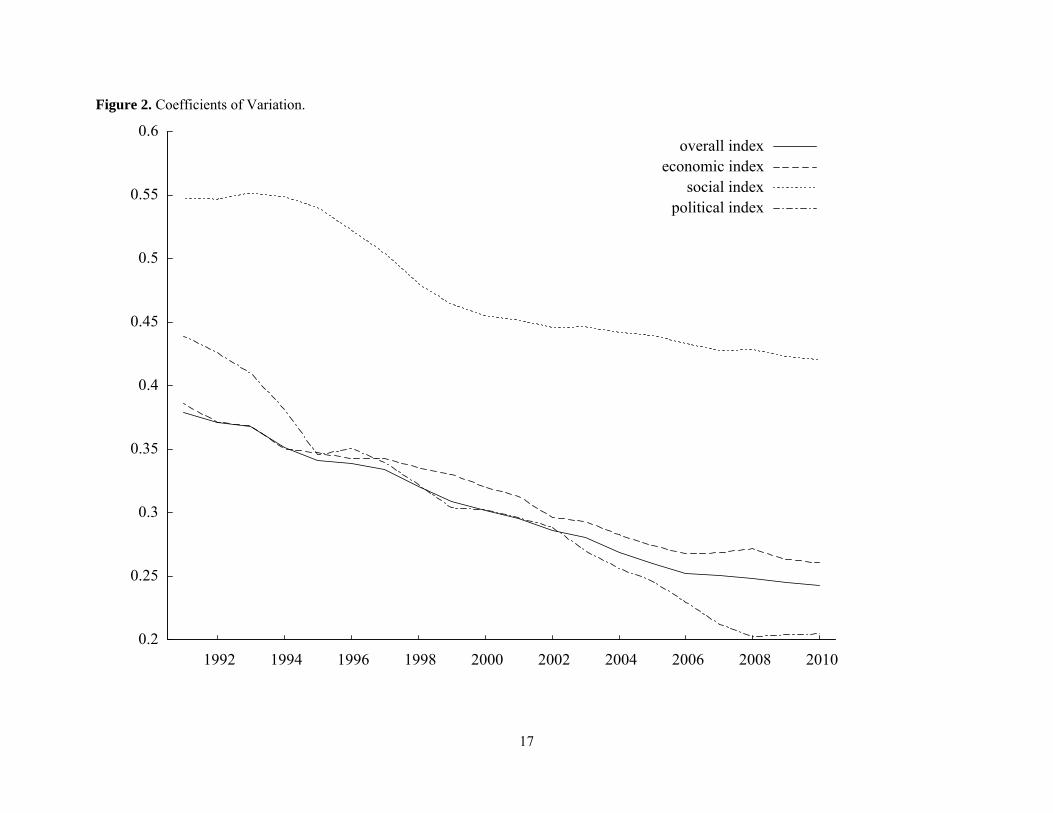
Sigma convergence occurs when the dispersion in globalization index values falls over time. Due
to the increasing levels of globalization documented in Figure 1 and Table 1 our preferred measure of
dispersion is the coefficient of variation, also utilized by Skidmore et al. (2004), Nieswiadomy and
Strazicich (2007), Young et al. (2008) and Aziakpono, et al. (2012). As displayed in Figure 2, the
coefficients of variation (CV) for the overall index and each of the economic, social, and political indices
have all clearly trended downward during our sample period. (Not depicted are the CVs for the
constituent economic and social sub-indices which are also trending downward.) The formal test for
sigma convergence involves regressing the coefficient of variation against a time trend component. A
negative and significant coefficient on the time trend supports sigma convergence.
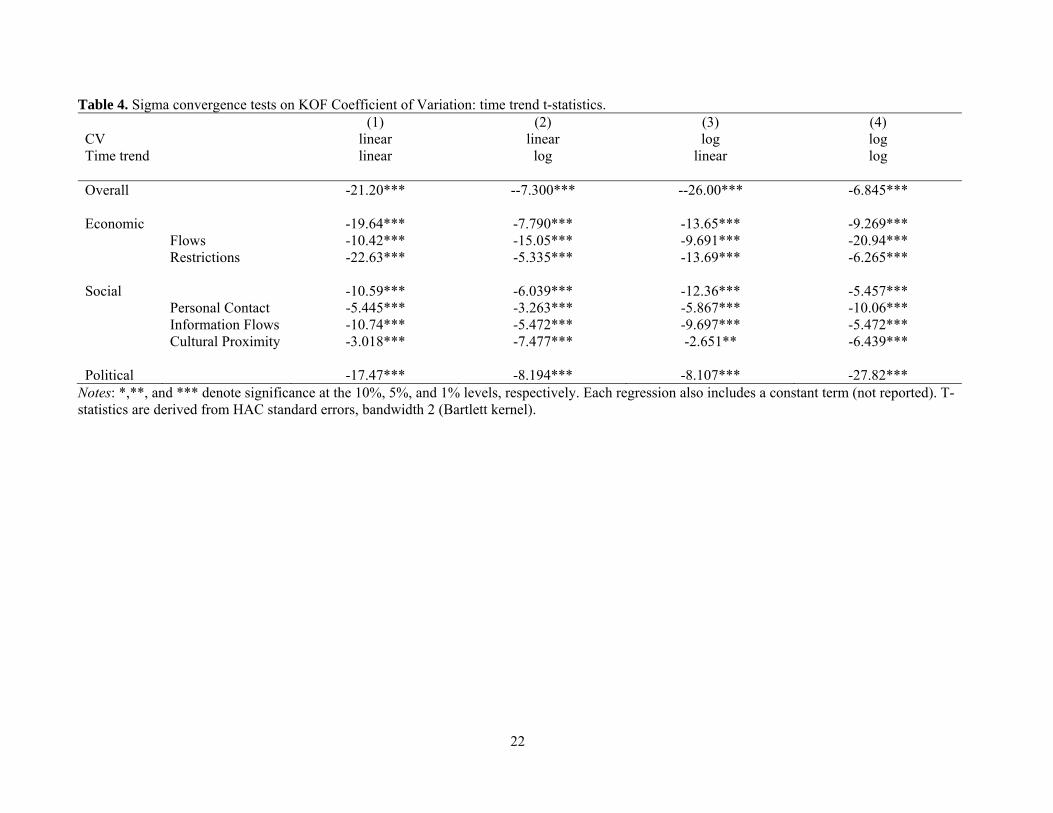
In Table 4 we report the results of several variants of the sigma convergence test. The
specifications corresponding to the (numbered) table columns are:
(1) tt tCV 10 ;
(2) tt tCV log10 ;
(3) tt tCV 10log ;
(4) tt tCV loglog 10 .
Specifications (1)-(4) together cover a range of conceivable ways that a CV may exhibit a decreasing
trend. Rows in Table 4 correspond to the KOF indices as well as the constituent sub-indices for the
8
economic and social dimensions. We report the t-statistics associated with the null hypothesis that β1 = 0,
derived from HAC standard errors that are robust to serial correlation.
As it turns out, the evidence for sigma convergence is quite strong regardless of the particular
specification. In each and every case (specification and index combination) the null hypothesis (which
corresponds to no sigma convergence) is rejected with better than 99% confidence. Our conclusion is that
the decline during 1991-2010 in the dispersion of globalization index values is statistically significant.
This is true for the overall KOF globalization index; for the economic, social, and political globalization
indices; also for the economic sub-indices (flows and restrictions) and social sub-indices (personal
contact, information flows, and cultural proximity). Regarding sigma convergence, then, we conclude that
globalization is occurring globally, and in a very comprehensive sense.
3.2 Stochastic Convergence
Our initial tests indicated strong evidence in support of sigma convergence. However, as argued
by Carlino and Mills (1993), a country cannot be said to be truly converging if it cannot return to its
convergence path following a shock which temporarily pushes it off its previous stochastic path. In other
words, such shocks cannot have permanent effects. In practice, this concept of stochastic convergence is
tested by performing checks for stationarity of countries’ relative positions; in this case, the log of the
ratio of a country’s globalization index value to the sample average for that year.
Simple unit root tests of the Dickey-Fuller variety are notorious for having low power. With our
short sample time period of 20 years, this problem is enhanced. Therefore we instead rely on two panel
unit root tests, one developed by Levin et al. (LLC) (2002) and the other by Im et al. (IPS) (2003). Both
of these tests are widely employed and both are based on the conventional augmented Dickey Fuller
(ADF) test specification:
(5) itjt
jtip
jij
t
ti
t
it
KOF
KOF
KOF
KOF
KOF
KOF
,
11
1, logloglog ,
9
where KOFit is country i’s globalization index value in year t, and tKOF is the cross-country average
index value in t. The null hypothesis of the ADF test is that there is a unit root (α = 0) while the
alternative hypothesis is one-sided (α < 0).
The LLC test replaces
t
it
KOF
KOFlog and
t
it
KOF
KOFlog in (5) with transformed variables.
The transformed variables are constructed by, first, regressing both
t
it
KOF
KOFlog and
t
it
KOF
KOFlog on p lags of
t
it
KOF
KOFlog . Second, the fitted values are subtracted from
t
it
KOF
KOFlog and
t
it
KOF
KOFlog . Third, the two new series – each of which has values
corresponding to particular countries – is divided by the standard error of a regression based on
(5) using data only from that country. The resulting transformed data are free from serial
correlation and deterministic components. The LLC test is then based on specification (5) using
the panel of transformed variables.
The LLC test assumes a common unit root parameter (α). Thus the null of no unit root for any
country is tested against the alternative that every country has a unit root. Alternatively, the IPS test
allows for heterogeneity by simply pooling together individual country ADF tests. A separate regression
of (5) is run for each country, i, resulting in a group of root estimates (αi, i = 1, ..., N). The IPS test
statistic is based on calculating the average of t-statistics associated with unit root null hypotheses across
the N root estimates. Under IPS, the null of no unit roots is tested against the alternative that at least one
country has a unit root. LLC may be more efficient because fewer parameters need to be estimated, but
can also be misspecified if the assumption of parameter homogeneity is overly restrictive.
By construction, the IPS test may fail to reject the null due to one single country having a unit
root when even all the remaining countries are converging. Further, Westerlund and Breitung (2009)
10
demonstrate that LLC has greater local power than does IPS. Thus IPS may be prone to greater false
negatives. Yet, the potential misspecification from requiring a common unit root may lead LLC to false
positive results. Because there is no clear choice, we interpret stochastic convergence to be supported
only if the unit root null is rejected by both tests.
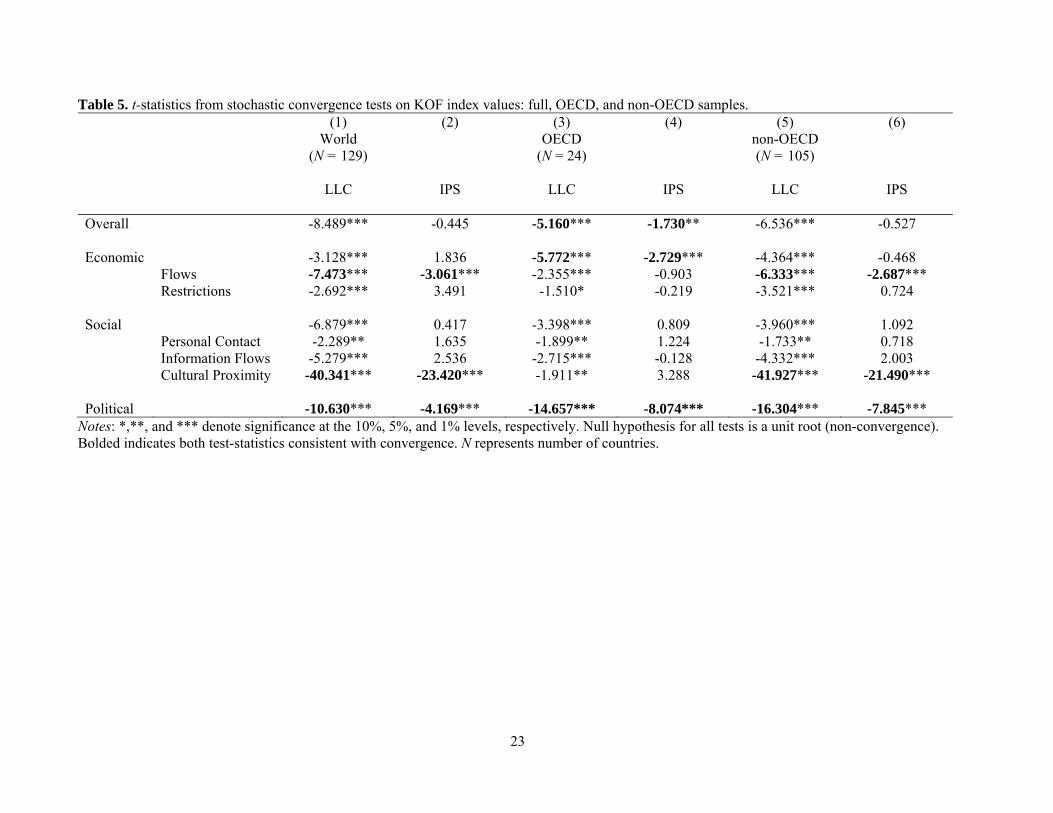
In columns (1) and (2) in Table 5 we present test statistics for the LLC and IPS panel unit root
tests on the full samples of log relative globalization indices.8 Assuming a common unit root parameter,
the LLC test rejects (at better than the 1% level) a unit root for each index and sub-index. , The IPS test,
however, only rejects the unit root null for the political index (among the main indices). While IPS does
not reject a unit root for the economic and social indices, it does reject (at the 1% level) for the economic
flows and social cultural proximity sub-indices. Regarding the economic and social dimensions of
globalization, then, stochastic convergence is only strongly supported for these latter sub-indices. We
note, in particular, that there is not strong evidence (i.e., rejection of the nulls by both the LLC and IPS
tests) of stochastic convergence in economic restrictions. Of the two KOF economic sub-indices, the
restrictions sub-index is the one directly linked to institutional quality. In other words, we are unable to
conclude that the institutional frameworks to facilitate international economic flows are stochastically
converging. We find it interesting that, despite this, the actual international economic flows do seem to be
converging. Thus, countries appear to be overcoming remaining differences in policy openness in the
sense that their economies’ shares of international goods and financial flows are still converging. We
stress that the flows component represents shares rather than total trade and capital movements. Changes
in trade policy would be expected to impact both the numerators and the denominators (GDP) of the share
components. If restrictions hamper trade in general, then it could still be the case that greater restrictions
imposed by the least open economies result in larger trade shares if trade restrictions were to slow the
growth in overall GDP (by also hampering consumption and investment) at a greater rate than just for
8 For all our panel unit root tests we choose the number of lags, up to four maximum, which yields the smallest Modified Akaike value. LLC tests are estimated using Bartlett kernel with Newey-West bandwidth selection.
11
trade. Thus the share of GDP determined by trade could rise, implying convergence in trade flows on a
relative (to GDP) scale, even when total trade is shrinking.
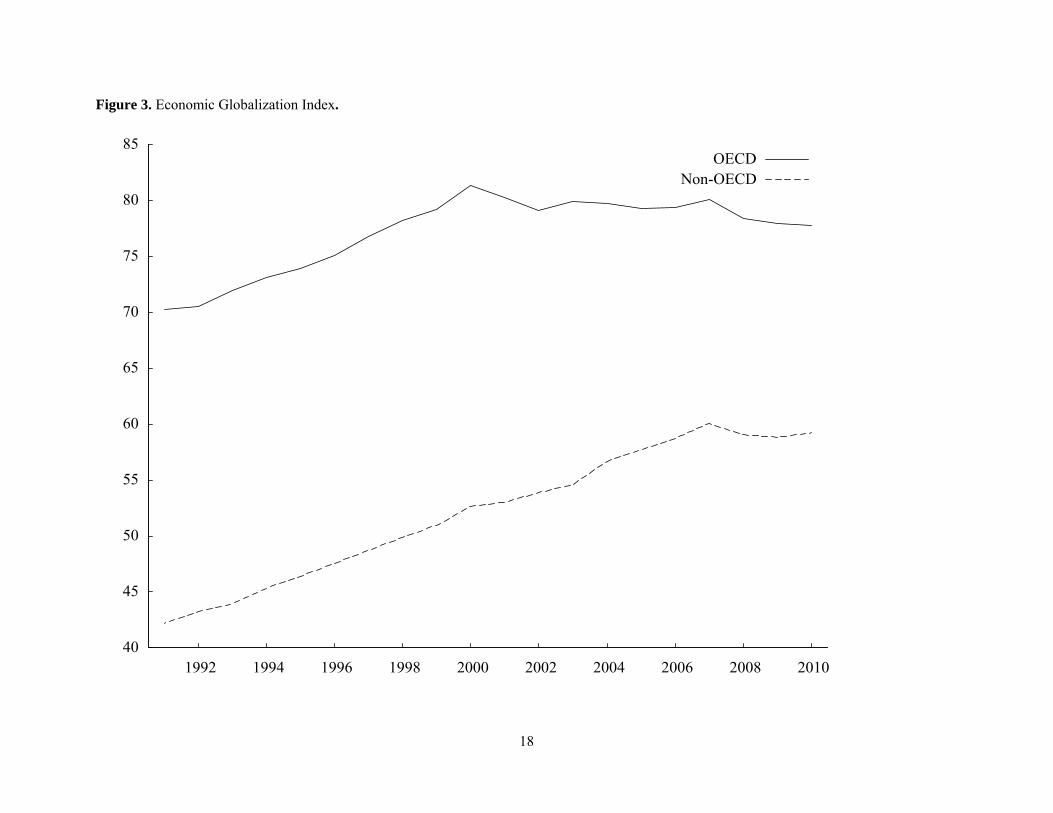
Although we are unable to conclude that stochastic convergence on the economic and social
dimensions of globalization is occurring world-wide, convergence clubs may exist where groups of
nations are converging among themselves. In the remaining columns (3)-(6) of Table 5 we report panel
unit root tests when separating the sample into OECD versus non-OECD countries. For these tests, the
world average tKOF in the IPS and LLC formulations now represents the sub-sample OECD or non-
OECD average for that year.
Comparing across all columns, we see that the test results for the non-OECD sample match the
interpretations from the World sample results. This is not too surprising given that the non-OECD sample
is five times as large as the OECD sample. Differences are found, however, among the OECD subsample
considered in isolation in columns (3) and (4). In particular, we find that OECD nations are forming a
club in terms of overall globalization as well as for economic globalization. Convergence for political
convergence is also strongly supported among the OECD nations but we do not interpret this as a “club”
because we previously supported convergence among all nations in the full sample (columns (1) and (2)).
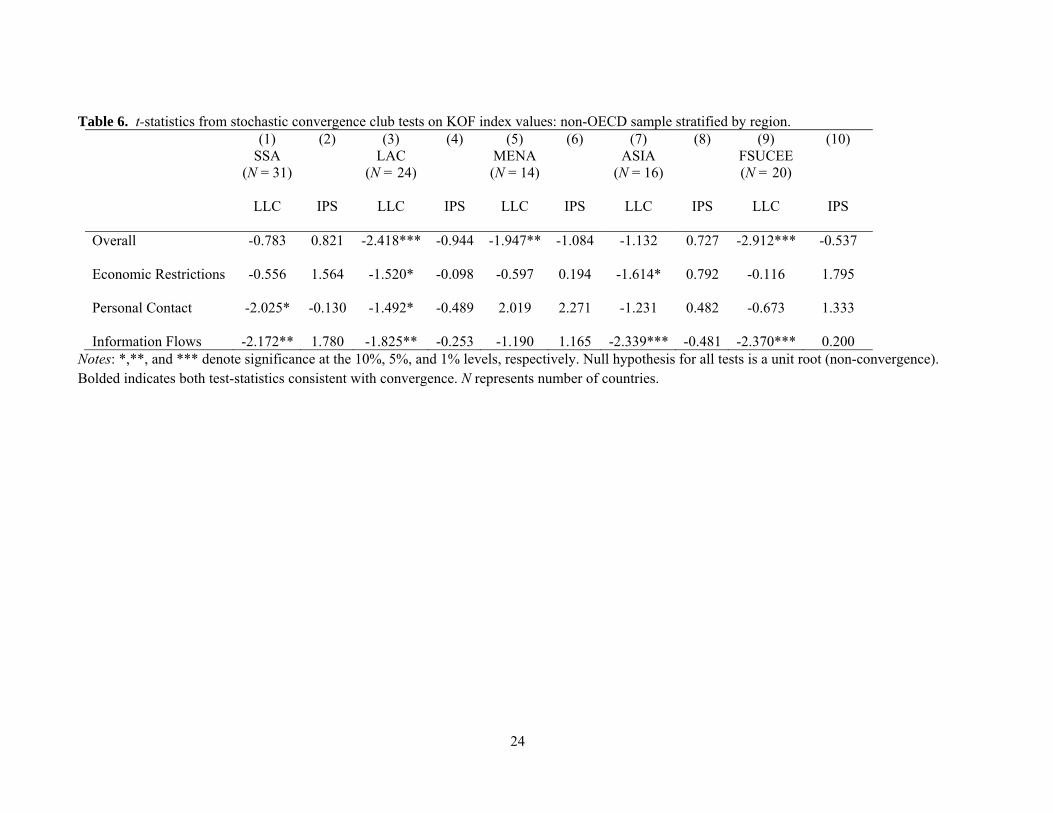
Finally, in Table 6 we further breakdown the non-OECD nations into potential regional clubs for
the sub-indices (and overall index) where we failed to find strong evidence of convergence. The regions
are classified as Sub-Saharan Africa (SSA), Latin America and Caribbean (LAC), Middle East and North
Africa (MENA), Asia and Pacific Rim (ASIA), and Former Soviet Union and Central and Eastern Europe
(FSUCEE).9 As before, the average (sub-)index value in each year used to determine convergence
comparisons is computed separately for each region sub-sample. We do not find strong evidence
consistent with convergence into regional globalization clubs. The IPS test fails to reject the unit root null
for any of the globalization measures, and even the LLC tests fail to reject the null as often as they do
reject the null, in each region except for LAC.
9 Country classifications are presented in Table 3.
12
4. Conclusions
In this study, we test for convergence on globalization. Globalization is measured by indices representing
economic, social, and political globalization. Based on a sample of 129 nations, we find an upward trend
in the average level of each measure of globalization. We also find the global dispersion of each measure
has been significantly declining over time supporting the notion of global convergence of globalization.
Panel unit root tests for stochastic convergence paint a less consistent picture. The full sample of
nations is stochastically converging only for political globalization, and one individual sub-index on each
of the economic, and social, dimensions of globalization. Some critics of globalization express concern
that nations will lose their autonomy and cultural identities. Yet, while we find convergence on the
political dimension (representing integration into multi-national organizations, treaties, and presence of
embassies, etc.) and greater similarity in exposure to other cultures (through trade and capital flows, and
the establishment of McDonald’s and IKEAs) economic policies on trade and capital movement
restrictions, and overall social globalization, are not converging.
We also find limited evidence of convergence clubs, except for an OECD club on the economic
globalization dimension. There is not strong evidence to support non-OECD nations converging on any
aspects of globalization that does not hold for the full world sample, and regional convergence among the
non-OECD nations for any remaining globalization attributes appears weaker still. Thus, when
globalization convergence is occurring, it appears to be global or not at all. As a result, with the exception
of political globalization, the benefits from increased globalization would not be expected to be
manifested equally across the globe. At least along the economic and social dimensions, globalization is
less than fully global.
13
References
M. J. Aziakpono, Kleimeier, S., Sander H. 2012. Banking market integration in the SADC countries:
evidence from interest rate analyses. Applied Economics 44(29): 3857-3876.
Bergh, A., Nilsson, T. 2010. Good for living? on the relationship between globalization and life
expectancy. World Development 38(9): 1191-1203.
Bergh, A., Nilsson, T. 2010. Do liberalization and globalization increase income inequality? European
Journal of Political Economy 26(4): 488-505.
Barro, R. J., Sala-i-Martin, X. X. 1992. Convergence. Journal of Political Economy 100(2): 223-251.
Arribas, I., Pérez, F., Tortosa-Ausina, E. 2009. Measuring globalization of international trade: theory and
evidence. World Development 37(1): 127-145.
Carlino, G. A., Mills, L. O. 1993 Are U.S. regional incomes converging? a time series analysis. Journal of
Monetary Economics 32(2): 335–346.
Caselli, F., Esquivel, G., Lefort, F. 1996. Reopening the convergence debate: a new look at cross-country
growth empirics. Journal of Economic Growth 1(3): 363-390.
Dreher, A. 2006. Does globalization affect growth? Evidence from a new index of globalization. Applied
Economics 38(10): 1091-1110.
Dreher, A., Gaston, N., Martens, P. 2008a. Measuring Globalization – Gauging its Consequences. New
York: Springer.
Dreher, A., Strum, J-E, Ursprung, H. 2008b. The impact of globalization on the composition of
government expenditures: evidence from panel data. Public Choice 134(3): 263-292.
Elert, N., Halvarsson, D. 2012. Economic freedom and institutional convergence. Ratio Working Paper
No. 196: ratio.se/media/.../ne_dh_%20working_paper_196_elert_trippleh.pdf.
Evans, P. 1997. How fast do economies converge? Review of Economics and Statistics 79(2): 219-225.
Frankel, J. A. 2000. Globalization of the economy. NBER Working Paper 7858.
Friedman, M. 1992. Do old fallacies ever die? Journal of Economics Literature 30(4): 2129-2132.
14
Heckelman, J. C. 2013. Income convergence among U.S. states: cross-sectional and time series evidence.
Canadian Journal of Economics 46(3): 1085-1109.
Heckelman, J. C., Mazumder, S. 2013. Are we there yet? On the convergence of financial reforms.
Economics of Governance 14(4): 385-409.
Hessami, Z. 2011. Globalization’s winners and losers – evidence from life satisfaction data, 1975-2001.
Economics Letters 112(3): 250-253.
Higgins, M, Levy, D., Young, A. T. 2006. Growth and convergence across the U.S.: evidence from
county-level data. Review of Economics and Statistics 88(4): 671-681.
Im, K. S., Pesaran, M. H., Shin, Y. (2003). Testing for Unit Roots in Heterogeneous Panels. Journal of
Econometrics 115(1): 53-74
Islam, N. 1995. Growth empirics: a panel data approach. Quarterly Journal of Economics 110(4): 1127-
1170.
Levin, A., Lin, C. F., Chu, C. S. (2002). Unit root tests in panel data: asymptotic and finite-
sample properties. Journal of Econometrics 108(1): 1-24.
Mankiw, N. G., Romer, D. H., Weil, D. N. 1992. A contribution to the empirics of economic growth.
Quarterly Journal of Economics 107(2): 407-437.
Nieswiadomy, M. L., Strazicich, M. C. 2007. Are political freedoms converging? Economic Inquiry
42(2): 323-340.
Potrafke, N., Ursprung, H. 2010. Globalization and gender equality in the course of development.
European Journal of Political Economy 28(4): 399-413.
Quah, D. T. 1993. Galton’s fallacy and the convergence hypothesis. Scandinavian Journal of Economics
95(4): 427-443.
Sala-i-Martin, X. X. 1996. Regional cohesion: evidence and theories of regional growth and convergence.
European Economic Review 40(6): 1325-1352.
15
Samimi, A. J., Ghaderi, S., Hosseinzadeh, R., Nademi, Y. 2012. Openness and inflation: new empirical
panel data evidence. Economics Letters 117(3): 573–577.
Savoia, A., Sen, K. 2013. Do we see convergence in institutions? a cross-country analysis. Working
Paper: dial2013.dauphine.fr/fileadmin/mediatheque/.../43_UK_Savoia_Sen.pdf.
Skidmore, M., Toya, H., Merriman, D. 2004. Convergence in government spending: theory and cross
country evidence. Kyklos 57(4), 587-620.
Westerlung, J., Bretung, J. 2009. Myths and facts about panel unit root tests. University of Gothenburb
Mimeo.
Young, A. T., Higgins, M, Levy, D. 2008. Sigma convergence versus Beta convergence: evidence from
U.S. county-level data. Journal of Money, Credit, and Banking 40(5): 1083-1093.
16
Figure 1. Globalization indices, mean levels.
35
40
45
50
55
60
65
70
75
80
1992 1994 1996 1998 2000 2002 2004 2006 2008 2010
overall indexeconomic index
social indexpolitical index
17
Figure 2. Coefficients of Variation.
0.2
0.25
0.3
0.35
0.4
0.45
0.5
0.55
0.6
1992 1994 1996 1998 2000 2002 2004 2006 2008 2010
overall indexeconomic index
social indexpolitical index
18
Figure 3. Economic Globalization Index.
40
45
50
55
60
65
70
75
80
85
1992 1994 1996 1998 2000 2002 2004 2006 2008 2010
OECDNon-OECD
19
Table 1. Summary statistics for yearly cross-sections of globalization indices, 1991-2010. Overall
Economic Social Political
Year Mean
CV Mean CV Mean CV Mean CV
1991 45.508 0.379 47.422 0.386 38.425 0.547 52.922 0.439 1992 46.840 0.371 48.321 0.371 38.902 0.547 56.068 0.426 1993 48.109 0.368 49.156 0.368 39.666 0.552 58.660 0.410 1994 49.387 0.351 50.509 0.350 40.692 0.549 60.191 0.382 1995 50.828 0.341 51.501 0.347 42.072 0.540 62.343 0.345 1996 51.724 0.339 52.694 0.343 44.033 0.523 61.312 0.351 1997 52.930 0.334 53.939 0.343 45.243 0.504 62.458 0.340 1998 54.108 0.320 55.172 0.335 46.713 0.480 63.143 0.322 1999 55.310 0.309 56.214 0.330 47.627 0.464 64.978 0.304 2000 56.569 0.301 57.991 0.320 48.471 0.455 66.110 0.302 2001 57.203 0.296 58.103 0.313 49.241 0.452 67.272 0.296 2002 57.500 0.286 58.571 0.296 49.447 0.446 67.463 0.289 2003 58.196 0.280 59.308 0.293 49.501 0.446 69.015 0.270 2004 59.341 0.269 60.994 0.283 50.007 0.442 70.315 0.256 2005 59.860 0.260 61.698 0.274 50.285 0.440 70.923 0.246 2006 60.840 0.252 62.554 0.268 50.806 0.433 72.724 0.230 2007 62.004 0.250 63.788 0.268 51.564 0.428 74.370 0.212 2008 61.839 0.249 62.640 0.272 51.591 0.428 75.296 0.203 2009 61.829 0.245 62.378 0.263 51.680 0.423 75.495 0.204 2010 61.898 0.243 62.665 0.260 51.767 0.420 75.235 0.205
Note: CV stands for coefficients of variation (standard deviations deflated by means to account for changing mean values over time).
20
Table 2. Summary statistics for yearly cross-sections of economic and social globalization sub-indices, 1991-2010. Index Economic
Economic Social Social Social
Sub-index
Flows Restrictions Personal Contact
Info. Flows
Cultural Proximity
Year
Mean CV Mean CV Mean CV Mean CV Mean CV
1991 47.970 0.445 47.041 0.486 46.582 0.474 42.996 0.505 25.127 1.126 1992 48.900 0.419 47.881 0.482 46.862 0.469 43.678 0.509 25.657 1.117 1993 49.507 0.409 48.951 0.471 47.009 0.468 44.539 0.516 26.952 1.093 1994 51.196 0.385 49.920 0.467 47.321 0.467 45.565 0.515 28.723 1.021 1995 52.244 0.376 50.868 0.464 47.605 0.467 47.093 0.504 31.117 0.949 1996 52.876 0.376 52.619 0.436 48.044 0.464 49.117 0.483 34.554 0.860 1997 54.552 0.361 53.457 0.435 48.382 0.463 51.724 0.444 35.315 0.843 1998 56.138 0.350 54.323 0.432 48.623 0.465 54.447 0.406 36.667 0.812 1999 57.318 0.347 55.210 0.423 48.736 0.466 56.675 0.368 36.930 0.808 2000 60.065 0.328 56.010 0.420 49.106 0.464 58.086 0.349 37.641 0.800 2001 60.105 0.322 56.155 0.408 49.041 0.468 59.383 0.337 38.744 0.788 2002 60.271 0.319 56.911 0.377 49.245 0.467 60.553 0.322 37.941 0.814 2003 61.000 0.312 57.649 0.375 49.355 0.465 60.849 0.320 37.649 0.823 2004 62.477 0.301 59.553 0.356 49.800 0.459 61.522 0.315 38.003 0.821 2005 63.605 0.297 59.841 0.337 50.168 0.456 61.960 0.311 38.042 0.829 2006 65.185 0.298 59.961 0.313 50.323 0.454 62.554 0.306 38.879 0.813 2007 66.499 0.287 61.117 0.317 51.156 0.439 63.344 0.302 39.595 0.812 2008 65.340 0.289 59.972 0.322 51.069 0.441 64.010 0.295 38.982 0.833 2009 64.413 0.283 60.370 0.313 50.898 0.439 64.495 0.284 38.908 0.835 2010 65.044 0.284 60.328 0.305 51.005 0.435 64.443 0.279 39.187 0.835
Note: CV stands for coefficients of variation (standard deviations deflated by means to account for changing mean values over time).
21
Table 3. OECD and regional country subsamples.
OECD
Sub-Saharan Africa Latin American & Caribbean
North African & Middle Eastern
Asian & Pacific Former Soviet Union & Central and Eastern Europe
Australia Angola Argentina Algeria Bangladesh Albania Austria Benin Bahamas Bahrain Cambodia Armenia
Belgium Botswana Barbados Cyprus China Azerbaijan Canada Burkina Faso Bolivia Egypt Fiji Bulgaria
Denmark Burundi Brazil Iran India Croatia Finland Cameroon Chile Israel Indonesia Estonia France Central African Rep. Colombia Jordan Korea Georgia
Germany Chad Costa Rica Kuwait Malaysia Hungary Greece Coite d’Ivoire Dominican Rep. Malta Mongolia Kazakhstan Iceland Ethiopia Ecuador Morocco Nepal Kyrgyz Republic Ireland Ghana El Salvador Oman Pakistan Latvia
Italy Kenya Guatemala Saudi Arabia Papua New Guinea Lithuania Japan Lesotho Guyana Syria Philippines Macedonia
Luxembourg Madagascar Honduras Tunisia Singapore Moldova Netherlands Malawi Jamaica Taiwan Poland
New Zealand Mali Mexico Thailand Romania Norway Mauritius Nicaragua Vietnam Russia Portugal Mauritania Panama Serbia
Spain Mozambique Paraguay Slovenia Sweden Namibia Peru Ukraine
Switzerland Niger Trinidad & Tobago Turkey Nigeria Uruguay
United Kingdom Rwanda Venezuela United States Senegal
Sierra Leone South Africa Tanzania Togo Uganda Zambia Zimbabwe
22
Table 4. Sigma convergence tests on KOF Coefficient of Variation: time trend t-statistics. CV
(1) linear
(2) linear
(3) log
(4) log
Time trend linear log linear log
Overall -21.20*** --7.300*** --26.00*** -6.845*** Economic -19.64*** -7.790*** -13.65*** -9.269*** Flows -10.42*** -15.05*** -9.691*** -20.94*** Restrictions -22.63*** -5.335*** -13.69*** -6.265*** Social -10.59*** -6.039*** -12.36*** -5.457*** Personal Contact -5.445*** -3.263*** -5.867*** -10.06*** Information Flows -10.74*** -5.472*** -9.697*** -5.472*** Cultural Proximity -3.018*** -7.477*** -2.651** -6.439*** Political -17.47*** -8.194*** -8.107*** -27.82***
Notes: *,**, and *** denote significance at the 10%, 5%, and 1% levels, respectively. Each regression also includes a constant term (not reported). T-statistics are derived from HAC standard errors, bandwidth 2 (Bartlett kernel).
23
Table 5. t-statistics from stochastic convergence tests on KOF index values: full, OECD, and non-OECD samples. (1)
World (N = 129)
(2) (3) OECD
(N = 24)
(4) (5) non-OECD (N = 105)
(6)
LLC
IPS LLC IPS LLC IPS
Overall -8.489*** -0.445 -5.160*** -1.730** -6.536*** -0.527 Economic -3.128*** 1.836 -5.772*** -2.729*** -4.364*** -0.468 Flows -7.473*** -3.061*** -2.355*** -0.903 -6.333*** -2.687*** Restrictions -2.692*** 3.491 -1.510* -0.219 -3.521*** 0.724 Social -6.879*** 0.417 -3.398*** 0.809 -3.960*** 1.092 Personal Contact -2.289** 1.635 -1.899** 1.224 -1.733** 0.718 Information Flows -5.279*** 2.536 -2.715*** -0.128 -4.332*** 2.003 Cultural Proximity -40.341*** -23.420*** -1.911** 3.288 -41.927*** -21.490*** Political -10.630*** -4.169*** -14.657*** -8.074*** -16.304*** -7.845***
Notes: *,**, and *** denote significance at the 10%, 5%, and 1% levels, respectively. Null hypothesis for all tests is a unit root (non-convergence). Bolded indicates both test-statistics consistent with convergence. N represents number of countries.
24
Table 6. t-statistics from stochastic convergence club tests on KOF index values: non-OECD sample stratified by region.
(1) SSA
(N = 31)
(2) (3) LAC
(N = 24)
(4) (5) MENA (N = 14)
(6) (7) ASIA
(N = 16)
(8) (9) FSUCEE (N = 20)
(10)
LLC
IPS LLC IPS LLC IPS LLC IPS LLC IPS
Overall -0.783 0.821 -2.418*** -0.944 -1.947** -1.084 -1.132 0.727 -2.912*** -0.537 Economic Restrictions -0.556 1.564 -1.520* -0.098 -0.597 0.194 -1.614* 0.792 -0.116 1.795 Personal Contact -2.025* -0.130 -1.492* -0.489 2.019 2.271 -1.231 0.482 -0.673 1.333 Information Flows -2.172** 1.780 -1.825** -0.253 -1.190 1.165 -2.339*** -0.481 -2.370*** 0.200
Notes: *,**, and *** denote significance at the 10%, 5%, and 1% levels, respectively. Null hypothesis for all tests is a unit root (non-convergence). Bolded indicates both test-statistics consistent with convergence. N represents number of countries.
25
Table A1. Summary statistics for individual country globalization indices, 1991-2010. Overall
Economic Social Political
Country Mean
log Δ Mean log Δ Mean log Δ Mean log Δ
Albania 42.954 0.757 42.044 0.752 33.446 0.434 57.732 1.130 Algeria 48.391 0.179 45.024 0.176 29.334 0.408 80.150 0.065 Angola 42.312 0.274 70.020 0.163 13.915 0.796 44.242 0.276 Argentina 59.956 0.133 51.873 0.021 45.849 0.273 91.221 0.112 Armenia 44.037 0.587 58.954 0.257 37.120 0.566 33.179 1.950 Australia 79.497 0.097 71.783 0.171 80.220 0.042 89.169 0.083 Austria 87.382 0.107 81.922 0.153 86.588 0.110 96.084 0.052 Azerbaijan 44.899 0.718 51.254 0.577 41.159 0.462 41.398 1.594 Bahamas 50.737 0.048 42.749 0.041 63.633 -0.028 43.485 0.215 Bahrain 64.163 0.228 83.558 0.148 62.644 0.231 39.418 0.464 Bangladesh 32.328 0.612 22.341 1.262 14.650 0.912 71.314 0.278 Barbados 51.367 0.196 57.517 0.274 53.797 0.120 39.381 0.167 Belgium 91.315 0.068 92.201 0.021 87.222 0.122 95.903 0.063 Belize 44.121 0.190 49.497 0.208 43.110 -0.012 38.101 0.490 Benin 35.152 0.597 31.737 0.419 20.388 0.720 60.877 0.681 Bolivia 49.993 0.279 56.436 0.144 31.967 0.215 66.682 0.482 Botswana 48.081 0.084 65.011 -0.032 35.819 0.087 42.028 0.354 Brazil 55.821 0.198 51.581 0.160 36.651 0.358 88.954 0.139 Bulgaria 62.633 0.555 61.498 0.553 50.359 0.595 81.657 0.518 Burkina Faso 37.257 0.407 38.904 0.105 21.392 0.415 57.524 0.710 Burundi 25.524 0.534 22.595 0.496 18.505 0.334 39.566 0.677 Cambodia 37.931 0.598 55.577 0.446 19.200 0.511 40.082 0.936 Cameroon 38.504 0.428 34.792 0.459 24.453 0.331 63.627 0.462 Canada 85.552 0.054 76.689 0.079 88.411 0.049 93.781 0.035 Cent. African Rep. 27.883 0.518 28.986 0.534 14.436 0.486 45.469 0.521 Chad 30.454 0.719 34.166 0.737 13.808 0.972 48.968 0.605
Note: changes are reported for logged index values to approximate growth rates.

Table A1. (cont.) Summary statistics for individual country globalization indices, 1991-2010. Overall
Economic Social Political
Country Mean
log Δ Mean log Δ Mean log Δ Mean log Δ
Chile 67.013 0.231 72.642 0.310 50.201 0.180 83.102 0.179 China 49.903 0.531 44.935 0.466 35.865 1.005 76.749 0.308 Colombia 50.989 0.231 48.548 0.310 40.222 0.280 69.680 0.108 Costa Rica 58.383 0.197 62.583 0.152 55.627 0.266 56.475 0.170 Cote d'Ivoire 44.783 0.393 41.858 0.507 32.701 0.252 66.013 0.394 Croatia 60.864 0.559 60.496 0.246 61.035 0.558 61.133 1.115 Cyprus 67.500 0.508 68.482 0.497 72.252 0.529 59.383 0.492 Denmark 87.194 0.081 86.907 0.064 83.658 0.119 92.620 0.053 Dominican Rep. 47.308 0.609 43.905 0.759 44.019 0.785 56.703 0.245 Ecuador 51.449 0.256 49.934 0.143 39.242 0.635 70.902 0.115 Egypt, Arab Rep. 54.134 0.205 44.910 0.099 37.842 0.508 90.091 0.126 El Salvador 53.928 0.467 54.451 0.550 44.353 0.272 66.814 0.580 Estonia 68.827 0.613 82.004 0.425 66.337 0.395 54.088 1.818 Ethiopia 32.709 0.378 30.068 -0.029 12.725 0.615 64.779 0.557 Fiji 52.001 0.299 51.050 0.067 45.163 0.641 63.043 0.267 Finland 82.475 0.195 82.529 0.217 76.687 0.313 90.629 0.038 France 81.216 0.097 69.394 0.117 81.588 0.136 97.089 0.031 Georgia 46.259 0.602 54.870 0.696 47.256 0.107 32.899 1.933 Germany 78.463 0.148 71.492 0.102 79.527 0.112 86.620 0.250 Ghana 46.855 0.464 41.190 0.915 27.966 0.600 81.567 0.135 Greece 74.651 0.251 70.128 0.187 69.118 0.442 88.791 0.117 Guatemala 51.265 0.401 49.689 0.398 40.446 0.345 68.829 0.451 Guyana 54.507 0.058 72.134 -0.005 42.752 0.062 46.767 0.188 Honduras 53.395 0.473 58.159 0.433 39.939 0.473 65.913 0.526 Hungary 79.380 0.309 77.138 0.514 75.858 0.159 87.498 0.263 Iceland 71.731 0.219 72.063 0.223 79.420 0.041 60.340 0.515
Note: changes are reported for logged index values to approximate growth rates.
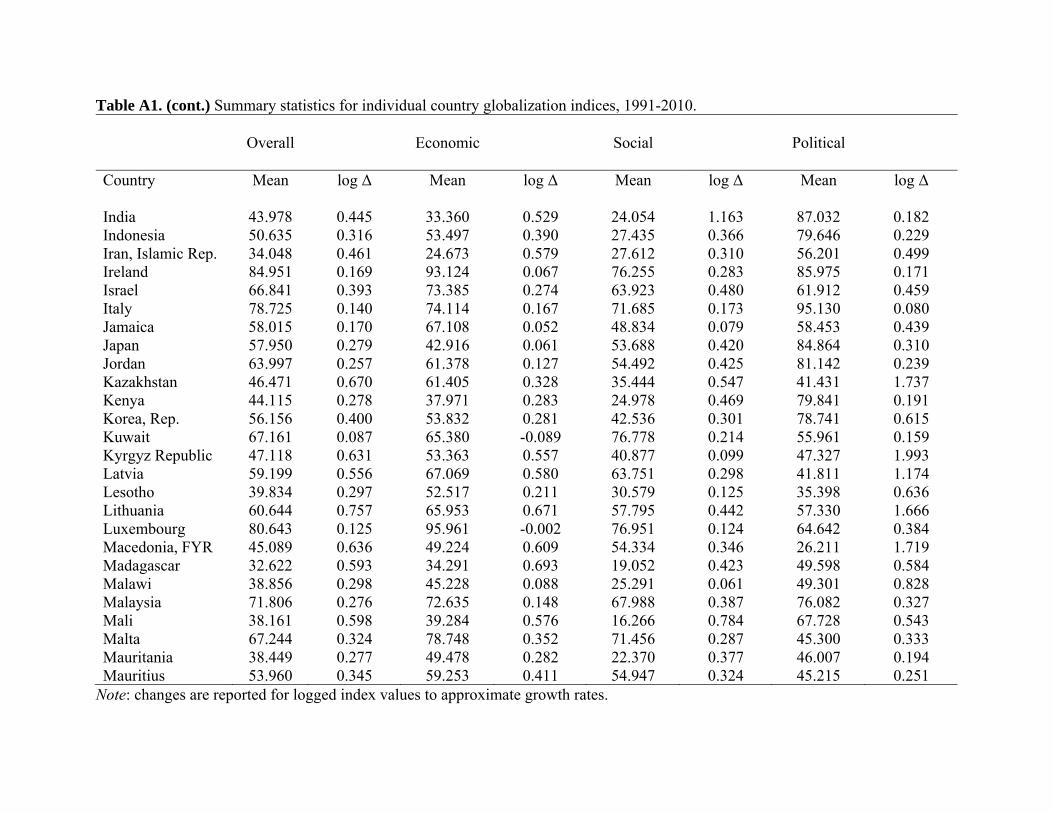
Table A1. (cont.) Summary statistics for individual country globalization indices, 1991-2010. Overall
Economic Social Political
Country Mean
log Δ Mean log Δ Mean log Δ Mean log Δ
India 43.978 0.445 33.360 0.529 24.054 1.163 87.032 0.182 Indonesia 50.635 0.316 53.497 0.390 27.435 0.366 79.646 0.229 Iran, Islamic Rep. 34.048 0.461 24.673 0.579 27.612 0.310 56.201 0.499 Ireland 84.951 0.169 93.124 0.067 76.255 0.283 85.975 0.171 Israel 66.841 0.393 73.385 0.274 63.923 0.480 61.912 0.459 Italy 78.725 0.140 74.114 0.167 71.685 0.173 95.130 0.080 Jamaica 58.015 0.170 67.108 0.052 48.834 0.079 58.453 0.439 Japan 57.950 0.279 42.916 0.061 53.688 0.420 84.864 0.310 Jordan 63.997 0.257 61.378 0.127 54.492 0.425 81.142 0.239 Kazakhstan 46.471 0.670 61.405 0.328 35.444 0.547 41.431 1.737 Kenya 44.115 0.278 37.971 0.283 24.978 0.469 79.841 0.191 Korea, Rep. 56.156 0.400 53.832 0.281 42.536 0.301 78.741 0.615 Kuwait 67.161 0.087 65.380 -0.089 76.778 0.214 55.961 0.159 Kyrgyz Republic 47.118 0.631 53.363 0.557 40.877 0.099 47.327 1.993 Latvia 59.199 0.556 67.069 0.580 63.751 0.298 41.811 1.174 Lesotho 39.834 0.297 52.517 0.211 30.579 0.125 35.398 0.636 Lithuania 60.644 0.757 65.953 0.671 57.795 0.442 57.330 1.666 Luxembourg 80.643 0.125 95.961 -0.002 76.951 0.124 64.642 0.384 Macedonia, FYR 45.089 0.636 49.224 0.609 54.334 0.346 26.211 1.719 Madagascar 32.622 0.593 34.291 0.693 19.052 0.423 49.598 0.584 Malawi 38.856 0.298 45.228 0.088 25.291 0.061 49.301 0.828 Malaysia 71.806 0.276 72.635 0.148 67.988 0.387 76.082 0.327 Mali 38.161 0.598 39.284 0.576 16.266 0.784 67.728 0.543 Malta 67.244 0.324 78.748 0.352 71.456 0.287 45.300 0.333 Mauritania 38.449 0.277 49.478 0.282 22.370 0.377 46.007 0.194 Mauritius 53.960 0.345 59.253 0.411 54.947 0.324 45.215 0.251
Note: changes are reported for logged index values to approximate growth rates.
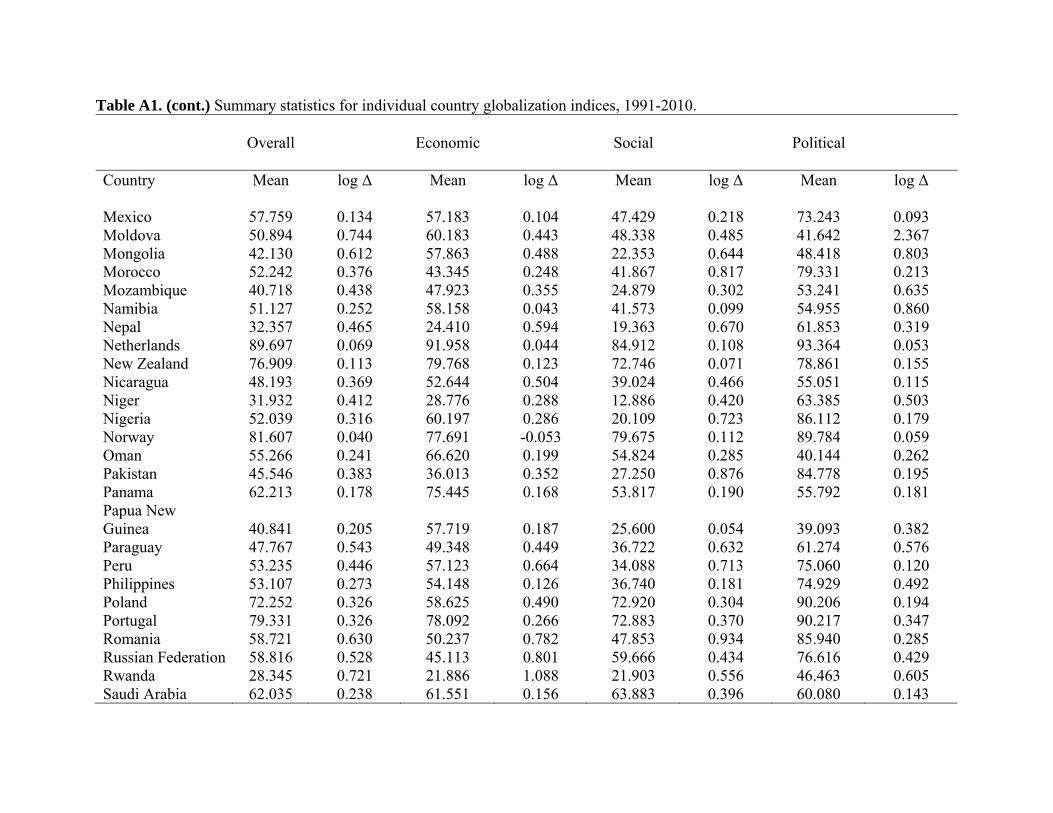
Table A1. (cont.) Summary statistics for individual country globalization indices, 1991-2010. Overall
Economic Social Political
Country Mean
log Δ Mean log Δ Mean log Δ Mean log Δ
Mexico 57.759 0.134 57.183 0.104 47.429 0.218 73.243 0.093 Moldova 50.894 0.744 60.183 0.443 48.338 0.485 41.642 2.367 Mongolia 42.130 0.612 57.863 0.488 22.353 0.644 48.418 0.803 Morocco 52.242 0.376 43.345 0.248 41.867 0.817 79.331 0.213 Mozambique 40.718 0.438 47.923 0.355 24.879 0.302 53.241 0.635 Namibia 51.127 0.252 58.158 0.043 41.573 0.099 54.955 0.860 Nepal 32.357 0.465 24.410 0.594 19.363 0.670 61.853 0.319 Netherlands 89.697 0.069 91.958 0.044 84.912 0.108 93.364 0.053 New Zealand 76.909 0.113 79.768 0.123 72.746 0.071 78.861 0.155 Nicaragua 48.193 0.369 52.644 0.504 39.024 0.466 55.051 0.115 Niger 31.932 0.412 28.776 0.288 12.886 0.420 63.385 0.503 Nigeria 52.039 0.316 60.197 0.286 20.109 0.723 86.112 0.179 Norway 81.607 0.040 77.691 -0.053 79.675 0.112 89.784 0.059 Oman 55.266 0.241 66.620 0.199 54.824 0.285 40.144 0.262 Pakistan 45.546 0.383 36.013 0.352 27.250 0.876 84.778 0.195 Panama 62.213 0.178 75.445 0.168 53.817 0.190 55.792 0.181 Papua New Guinea 40.841 0.205 57.719 0.187 25.600 0.054 39.093 0.382 Paraguay 47.767 0.543 49.348 0.449 36.722 0.632 61.274 0.576 Peru 53.235 0.446 57.123 0.664 34.088 0.713 75.060 0.120 Philippines 53.107 0.273 54.148 0.126 36.740 0.181 74.929 0.492 Poland 72.252 0.326 58.625 0.490 72.920 0.304 90.206 0.194 Portugal 79.331 0.326 78.092 0.266 72.883 0.370 90.217 0.347 Romania 58.721 0.630 50.237 0.782 47.853 0.934 85.940 0.285 Russian Federation 58.816 0.528 45.113 0.801 59.666 0.434 76.616 0.429 Rwanda 28.345 0.721 21.886 1.088 21.903 0.556 46.463 0.605 Saudi Arabia 62.035 0.238 61.551 0.156 63.883 0.396 60.080 0.143
29
Note: changes are reported for logged index values to approximate growth rates.
30
Table A1. (cont.) Summary statistics for individual country globalization indices, 1991-2010. Overall
Economic Social Political
Country Mean
log Δ Mean log Δ Mean log Δ Mean log Δ
Senegal 45.666 0.421 33.762 0.856 31.259 0.500 82.660 0.163 Serbia 53.199 0.305 49.793 0.365 62.600 0.075 44.561 0.611 Sierra Leone 29.936 0.529 32.710 0.571 14.791 0.348 47.617 0.566 Singapore 85.362 0.095 94.633 0.043 90.859 0.053 64.687 0.286 Slovenia 65.906 0.542 65.075 0.392 69.100 0.292 62.521 1.364 South Africa 55.450 0.526 61.698 0.193 41.829 0.515 66.148 1.057 Spain 81.489 0.160 76.133 0.175 78.455 0.196 93.233 0.104 Sweden 87.153 0.060 86.784 0.105 81.485 0.053 95.724 0.014 Switzerland 87.425 0.028 82.997 -0.030 88.575 0.045 91.932 0.076 Syrian Arab Rep. 37.207 0.287 37.206 0.226 25.867 0.575 53.329 0.151 Tanzania 31.330 0.594 32.162 0.623 16.761 0.624 50.888 0.552 Thailand 55.520 0.379 56.926 0.494 41.402 0.375 73.640 0.262 Togo 43.778 0.359 44.622 0.230 29.213 0.295 63.313 0.552 Trinidad & Tobago 56.973 0.179 69.715 0.272 50.944 0.005 47.870 0.244 Tunisia 55.600 0.158 53.946 0.213 36.811 0.119 84.604 0.129 Turkey 61.906 0.310 56.167 0.240 49.010 0.550 88.199 0.170 Uganda 34.810 0.707 37.325 0.955 18.544 0.537 54.446 0.586 Ukraine 54.050 0.845 49.539 0.686 47.960 0.719 68.963 1.214 United Kingdom 85.002 0.050 77.337 0.058 84.258 0.080 96.693 0.006 United States 75.128 0.041 62.467 0.021 75.190 0.064 92.602 0.032 Uruguay 60.768 0.194 58.808 0.267 47.268 0.188 82.677 0.126 Venezuela, RB 56.347 -0.084 52.873 -0.252 45.088 0.177 77.171 -0.156 Vietnam 37.735 0.509 50.303 0.454 19.884 0.857 45.678 0.406 Zambia 50.776 0.216 60.081 0.297 27.421 0.077 71.071 0.195 Zimbabwe 45.575 0.262 44.259 0.379 31.266 0.181 67.740 0.211
Note: changes are reported for logged index values to approximate growth rates.
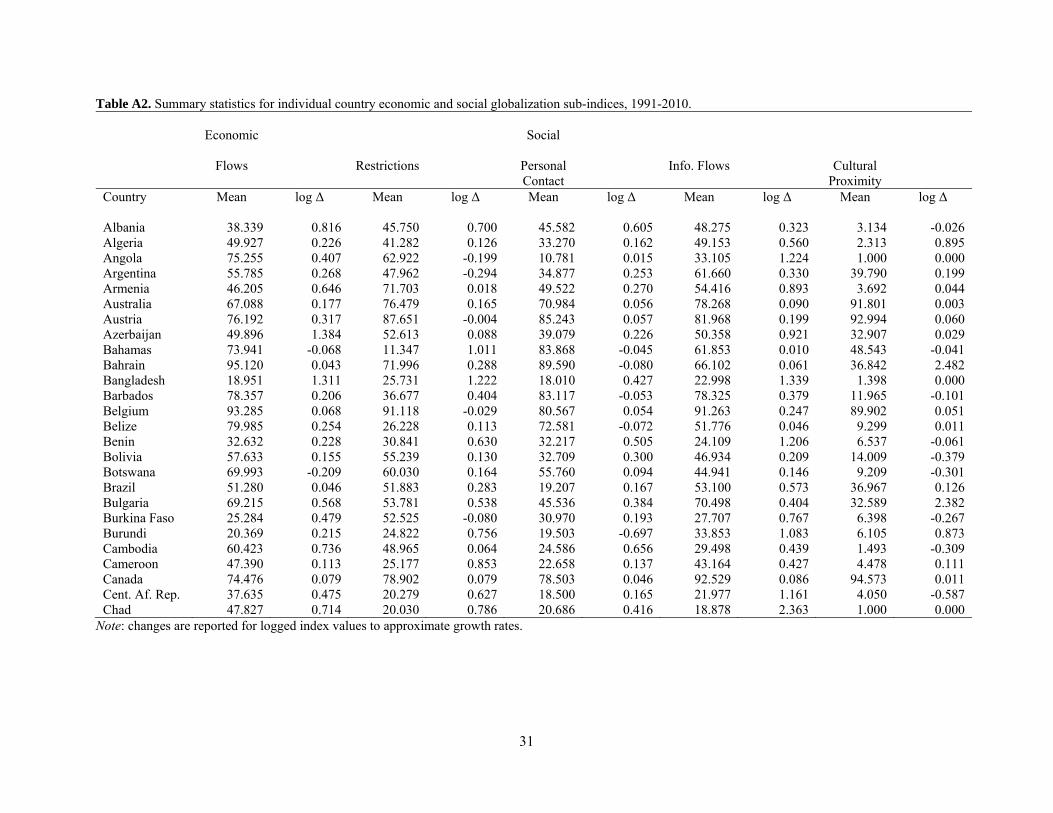
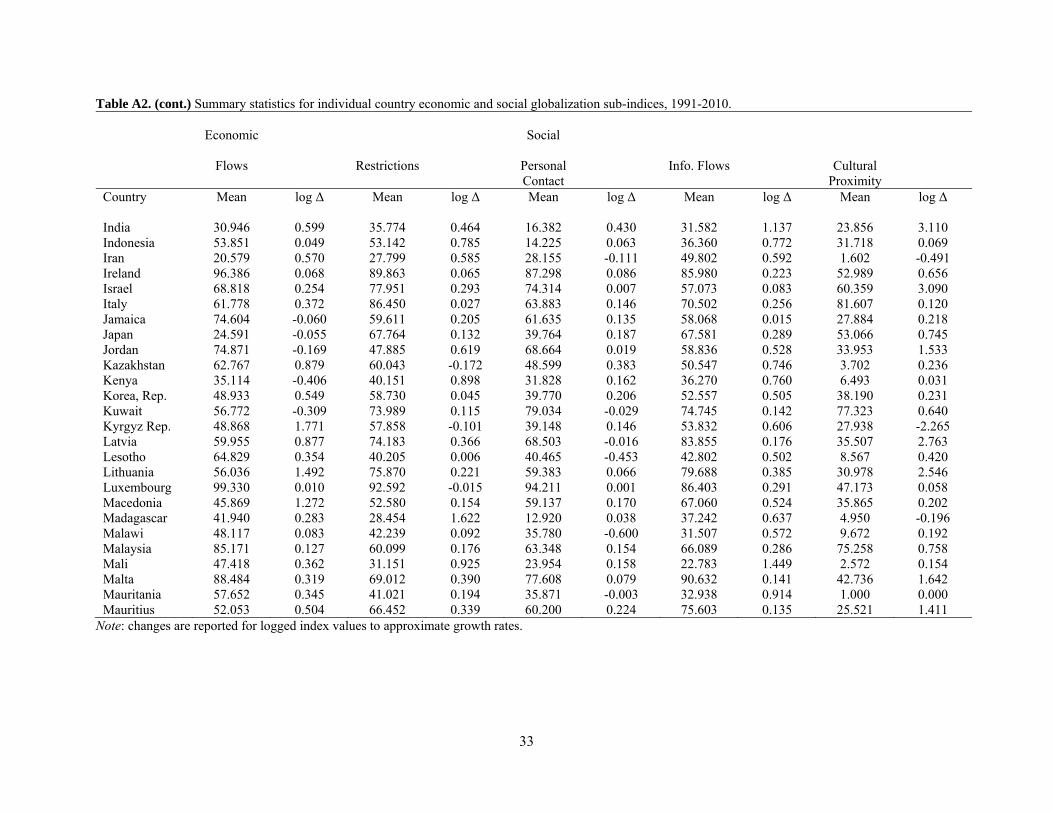
31
Table A2. Summary statistics for individual country economic and social globalization sub-indices, 1991-2010.
Economic
Social
Flows Restrictions Personal Contact
Info. Flows Cultural Proximity
Country Mean
log Δ Mean log Δ Mean log Δ Mean log Δ Mean log Δ
Albania 38.339 0.816 45.750 0.700 45.582 0.605 48.275 0.323 3.134 -0.026 Algeria 49.927 0.226 41.282 0.126 33.270 0.162 49.153 0.560 2.313 0.895 Angola 75.255 0.407 62.922 -0.199 10.781 0.015 33.105 1.224 1.000 0.000 Argentina 55.785 0.268 47.962 -0.294 34.877 0.253 61.660 0.330 39.790 0.199 Armenia 46.205 0.646 71.703 0.018 49.522 0.270 54.416 0.893 3.692 0.044 Australia 67.088 0.177 76.479 0.165 70.984 0.056 78.268 0.090 91.801 0.003 Austria 76.192 0.317 87.651 -0.004 85.243 0.057 81.968 0.199 92.994 0.060 Azerbaijan 49.896 1.384 52.613 0.088 39.079 0.226 50.358 0.921 32.907 0.029 Bahamas 73.941 -0.068 11.347 1.011 83.868 -0.045 61.853 0.010 48.543 -0.041 Bahrain 95.120 0.043 71.996 0.288 89.590 -0.080 66.102 0.061 36.842 2.482 Bangladesh 18.951 1.311 25.731 1.222 18.010 0.427 22.998 1.339 1.398 0.000 Barbados 78.357 0.206 36.677 0.404 83.117 -0.053 78.325 0.379 11.965 -0.101 Belgium 93.285 0.068 91.118 -0.029 80.567 0.054 91.263 0.247 89.902 0.051 Belize 79.985 0.254 26.228 0.113 72.581 -0.072 51.776 0.046 9.299 0.011 Benin 32.632 0.228 30.841 0.630 32.217 0.505 24.109 1.206 6.537 -0.061 Bolivia 57.633 0.155 55.239 0.130 32.709 0.300 46.934 0.209 14.009 -0.379 Botswana 69.993 -0.209 60.030 0.164 55.760 0.094 44.941 0.146 9.209 -0.301 Brazil 51.280 0.046 51.883 0.283 19.207 0.167 53.100 0.573 36.967 0.126 Bulgaria 69.215 0.568 53.781 0.538 45.536 0.384 70.498 0.404 32.589 2.382 Burkina Faso 25.284 0.479 52.525 -0.080 30.970 0.193 27.707 0.767 6.398 -0.267 Burundi 20.369 0.215 24.822 0.756 19.503 -0.697 33.853 1.083 6.105 0.873 Cambodia 60.423 0.736 48.965 0.064 24.586 0.656 29.498 0.439 1.493 -0.309 Cameroon 47.390 0.113 25.177 0.853 22.658 0.137 43.164 0.427 4.478 0.111 Canada 74.476 0.079 78.902 0.079 78.503 0.046 92.529 0.086 94.573 0.011 Cent. Af. Rep. 37.635 0.475 20.279 0.627 18.500 0.165 21.977 1.161 4.050 -0.587 Chad 47.827 0.714 20.030 0.786 20.686 0.416 18.878 2.363 1.000 0.000
Note: changes are reported for logged index values to approximate growth rates.
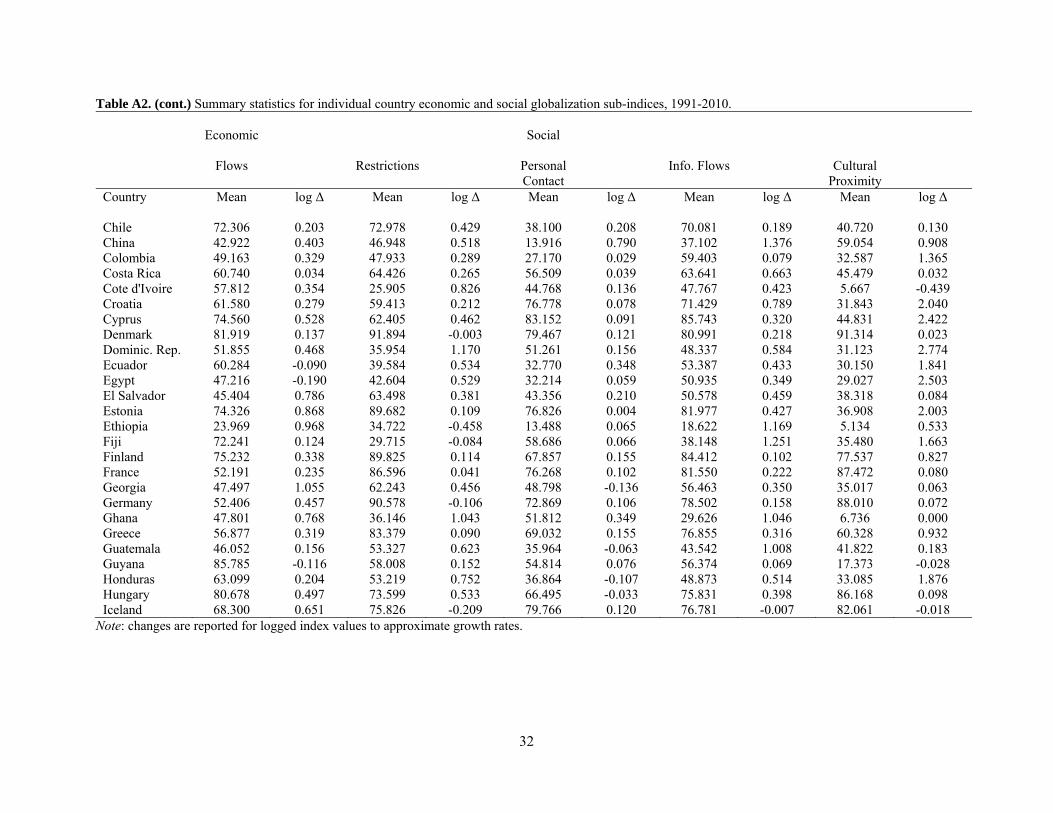
32
Table A2. (cont.) Summary statistics for individual country economic and social globalization sub-indices, 1991-2010.
Economic
Social
Flows Restrictions Personal Contact
Info. Flows Cultural Proximity
Country Mean
log Δ Mean log Δ Mean log Δ Mean log Δ Mean log Δ
Chile 72.306 0.203 72.978 0.429 38.100 0.208 70.081 0.189 40.720 0.130 China 42.922 0.403 46.948 0.518 13.916 0.790 37.102 1.376 59.054 0.908 Colombia 49.163 0.329 47.933 0.289 27.170 0.029 59.403 0.079 32.587 1.365 Costa Rica 60.740 0.034 64.426 0.265 56.509 0.039 63.641 0.663 45.479 0.032 Cote d'Ivoire 57.812 0.354 25.905 0.826 44.768 0.136 47.767 0.423 5.667 -0.439 Croatia 61.580 0.279 59.413 0.212 76.778 0.078 71.429 0.789 31.843 2.040 Cyprus 74.560 0.528 62.405 0.462 83.152 0.091 85.743 0.320 44.831 2.422 Denmark 81.919 0.137 91.894 -0.003 79.467 0.121 80.991 0.218 91.314 0.023 Dominic. Rep. 51.855 0.468 35.954 1.170 51.261 0.156 48.337 0.584 31.123 2.774 Ecuador 60.284 -0.090 39.584 0.534 32.770 0.348 53.387 0.433 30.150 1.841 Egypt 47.216 -0.190 42.604 0.529 32.214 0.059 50.935 0.349 29.027 2.503 El Salvador 45.404 0.786 63.498 0.381 43.356 0.210 50.578 0.459 38.318 0.084 Estonia 74.326 0.868 89.682 0.109 76.826 0.004 81.977 0.427 36.908 2.003 Ethiopia 23.969 0.968 34.722 -0.458 13.488 0.065 18.622 1.169 5.134 0.533 Fiji 72.241 0.124 29.715 -0.084 58.686 0.066 38.148 1.251 35.480 1.663 Finland 75.232 0.338 89.825 0.114 67.857 0.155 84.412 0.102 77.537 0.827 France 52.191 0.235 86.596 0.041 76.268 0.102 81.550 0.222 87.472 0.080 Georgia 47.497 1.055 62.243 0.456 48.798 -0.136 56.463 0.350 35.017 0.063 Germany 52.406 0.457 90.578 -0.106 72.869 0.106 78.502 0.158 88.010 0.072 Ghana 47.801 0.768 36.146 1.043 51.812 0.349 29.626 1.046 6.736 0.000 Greece 56.877 0.319 83.379 0.090 69.032 0.155 76.855 0.316 60.328 0.932 Guatemala 46.052 0.156 53.327 0.623 35.964 -0.063 43.542 1.008 41.822 0.183 Guyana 85.785 -0.116 58.008 0.152 54.814 0.076 56.374 0.069 17.373 -0.028 Honduras 63.099 0.204 53.219 0.752 36.864 -0.107 48.873 0.514 33.085 1.876 Hungary 80.678 0.497 73.599 0.533 66.495 -0.033 75.831 0.398 86.168 0.098 Iceland 68.300 0.651 75.826 -0.209 79.766 0.120 76.781 -0.007 82.061 -0.018
Note: changes are reported for logged index values to approximate growth rates.
33
Table A2. (cont.) Summary statistics for individual country economic and social globalization sub-indices, 1991-2010.
Economic
Social
Flows Restrictions Personal Contact
Info. Flows Cultural Proximity
Country Mean
log Δ Mean log Δ Mean log Δ Mean log Δ Mean log Δ
India 30.946 0.599 35.774 0.464 16.382 0.430 31.582 1.137 23.856 3.110 Indonesia 53.851 0.049 53.142 0.785 14.225 0.063 36.360 0.772 31.718 0.069 Iran 20.579 0.570 27.799 0.585 28.155 -0.111 49.802 0.592 1.602 -0.491 Ireland 96.386 0.068 89.863 0.065 87.298 0.086 85.980 0.223 52.989 0.656 Israel 68.818 0.254 77.951 0.293 74.314 0.007 57.073 0.083 60.359 3.090 Italy 61.778 0.372 86.450 0.027 63.883 0.146 70.502 0.256 81.607 0.120 Jamaica 74.604 -0.060 59.611 0.205 61.635 0.135 58.068 0.015 27.884 0.218 Japan 24.591 -0.055 67.764 0.132 39.764 0.187 67.581 0.289 53.066 0.745 Jordan 74.871 -0.169 47.885 0.619 68.664 0.019 58.836 0.528 33.953 1.533 Kazakhstan 62.767 0.879 60.043 -0.172 48.599 0.383 50.547 0.746 3.702 0.236 Kenya 35.114 -0.406 40.151 0.898 31.828 0.162 36.270 0.760 6.493 0.031 Korea, Rep. 48.933 0.549 58.730 0.045 39.770 0.206 52.557 0.505 38.190 0.231 Kuwait 56.772 -0.309 73.989 0.115 79.034 -0.029 74.745 0.142 77.323 0.640 Kyrgyz Rep. 48.868 1.771 57.858 -0.101 39.148 0.146 53.832 0.606 27.938 -2.265 Latvia 59.955 0.877 74.183 0.366 68.503 -0.016 83.855 0.176 35.507 2.763 Lesotho 64.829 0.354 40.205 0.006 40.465 -0.453 42.802 0.502 8.567 0.420 Lithuania 56.036 1.492 75.870 0.221 59.383 0.066 79.688 0.385 30.978 2.546 Luxembourg 99.330 0.010 92.592 -0.015 94.211 0.001 86.403 0.291 47.173 0.058 Macedonia 45.869 1.272 52.580 0.154 59.137 0.170 67.060 0.524 35.865 0.202 Madagascar 41.940 0.283 28.454 1.622 12.920 0.038 37.242 0.637 4.950 -0.196 Malawi 48.117 0.083 42.239 0.092 35.780 -0.600 31.507 0.572 9.672 0.192 Malaysia 85.171 0.127 60.099 0.176 63.348 0.154 66.089 0.286 75.258 0.758 Mali 47.418 0.362 31.151 0.925 23.954 0.158 22.783 1.449 2.572 0.154 Malta 88.484 0.319 69.012 0.390 77.608 0.079 90.632 0.141 42.736 1.642 Mauritania 57.652 0.345 41.021 0.194 35.871 -0.003 32.938 0.914 1.000 0.000 Mauritius 52.053 0.504 66.452 0.339 60.200 0.224 75.603 0.135 25.521 1.411
Note: changes are reported for logged index values to approximate growth rates.

34
Table A2. (cont.) Summary statistics for individual country economic and social globalization sub-indices, 1991-2010.
Economic
Social
Flows Restrictions Personal Contact
Info. Flows Cultural Proximity
Country Mean
log Δ Mean log Δ Mean log Δ Mean log Δ Mean log Δ
Mexico 55.206 0.177 59.161 0.040 42.399 0.103 59.051 0.358 39.643 0.137 Moldova 58.005 1.162 62.362 0.011 48.028 0.122 55.656 1.344 40.295 -0.071 Mongolia 58.477 0.705 57.249 0.264 19.077 1.120 41.838 0.515 2.692 0.251 Morocco 50.456 0.188 36.234 0.324 37.463 0.443 52.681 0.801 34.318 1.863 Mozambique 56.001 0.352 36.970 0.361 27.914 0.259 37.986 0.262 7.408 0.785 Namibia 73.578 -0.046 42.739 0.211 72.579 0.014 48.940 0.202 8.005 0.048 Nepal 17.735 0.351 29.505 0.679 25.956 0.183 26.513 1.340 3.935 0.067 Netherlands 90.987 0.098 92.929 -0.010 81.971 0.086 82.811 0.200 90.547 0.031 New Zealand 75.015 0.075 84.520 0.164 76.434 0.094 88.230 0.084 50.964 0.008 Nicaragua 52.696 0.180 52.593 0.933 34.870 -0.008 50.792 0.409 30.108 1.477 Niger 34.028 0.377 21.848 0.093 13.716 -0.096 19.178 1.159 4.766 -0.859 Nigeria 70.199 0.010 50.195 0.719 24.137 0.073 30.247 1.069 5.234 0.740 Norway 73.274 0.178 82.109 -0.268 75.186 0.167 76.002 0.122 88.812 0.052 Oman 65.816 0.179 67.233 0.214 74.338 0.072 56.454 0.090 31.529 2.652 Pakistan 36.441 0.166 35.585 0.537 30.653 -0.061 30.467 1.238 20.807 2.904 Panama 93.376 -0.008 57.515 0.465 49.581 -0.003 64.398 0.393 46.350 0.115 Papua N. G. 80.486 -0.080 34.799 0.640 28.162 -0.550 44.932 0.766 8.547 -0.328 Paraguay 49.415 0.380 49.280 0.518 35.004 0.028 43.926 0.647 30.358 2.639 Peru 53.234 0.687 61.012 0.646 26.304 0.434 46.632 0.439 28.269 2.430 Philippines 63.609 -0.059 44.687 0.391 30.219 0.019 41.163 0.375 38.835 0.099 Poland 53.833 0.671 63.418 0.330 55.924 -0.009 82.132 0.311 81.032 0.605 Portugal 69.116 0.572 87.068 0.038 73.467 0.110 86.496 0.268 56.652 0.909 Romania 45.461 0.907 55.013 0.706 41.390 0.368 61.800 0.572 38.978 3.929 Russian Fed. 49.792 1.638 40.434 0.169 41.728 0.217 77.352 0.291 59.107 0.825 Rwanda 17.634 0.882 26.139 1.227 31.430 0.132 29.098 0.898 5.940 0.608 Saudi Arabia 46.650 0.380 76.971 0.000 73.229 -0.012 34.934 1.181 75.295 0.628
Note: changes are reported for logged index values to approximate growth rates.
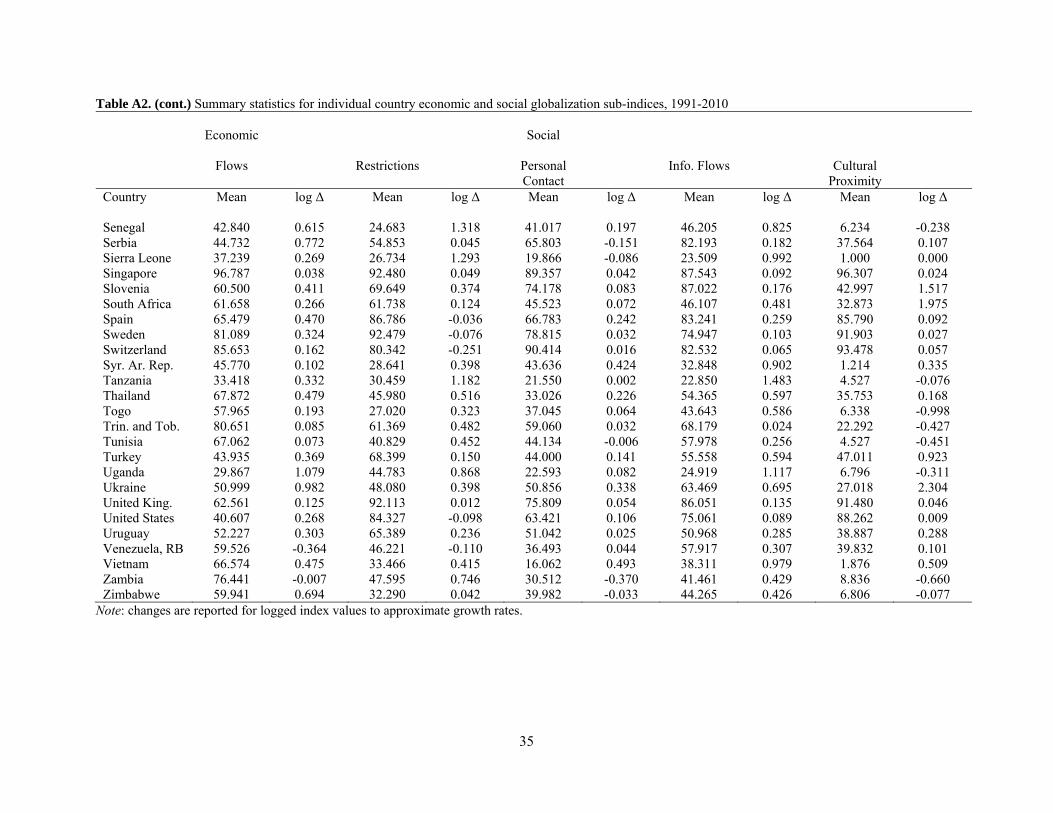
35
Table A2. (cont.) Summary statistics for individual country economic and social globalization sub-indices, 1991-2010
Economic
Social
Flows Restrictions Personal Contact
Info. Flows Cultural Proximity
Country Mean
log Δ Mean log Δ Mean log Δ Mean log Δ Mean log Δ
Senegal 42.840 0.615 24.683 1.318 41.017 0.197 46.205 0.825 6.234 -0.238 Serbia 44.732 0.772 54.853 0.045 65.803 -0.151 82.193 0.182 37.564 0.107 Sierra Leone 37.239 0.269 26.734 1.293 19.866 -0.086 23.509 0.992 1.000 0.000 Singapore 96.787 0.038 92.480 0.049 89.357 0.042 87.543 0.092 96.307 0.024 Slovenia 60.500 0.411 69.649 0.374 74.178 0.083 87.022 0.176 42.997 1.517 South Africa 61.658 0.266 61.738 0.124 45.523 0.072 46.107 0.481 32.873 1.975 Spain 65.479 0.470 86.786 -0.036 66.783 0.242 83.241 0.259 85.790 0.092 Sweden 81.089 0.324 92.479 -0.076 78.815 0.032 74.947 0.103 91.903 0.027 Switzerland 85.653 0.162 80.342 -0.251 90.414 0.016 82.532 0.065 93.478 0.057 Syr. Ar. Rep. 45.770 0.102 28.641 0.398 43.636 0.424 32.848 0.902 1.214 0.335 Tanzania 33.418 0.332 30.459 1.182 21.550 0.002 22.850 1.483 4.527 -0.076 Thailand 67.872 0.479 45.980 0.516 33.026 0.226 54.365 0.597 35.753 0.168 Togo 57.965 0.193 27.020 0.323 37.045 0.064 43.643 0.586 6.338 -0.998 Trin. and Tob. 80.651 0.085 61.369 0.482 59.060 0.032 68.179 0.024 22.292 -0.427 Tunisia 67.062 0.073 40.829 0.452 44.134 -0.006 57.978 0.256 4.527 -0.451 Turkey 43.935 0.369 68.399 0.150 44.000 0.141 55.558 0.594 47.011 0.923 Uganda 29.867 1.079 44.783 0.868 22.593 0.082 24.919 1.117 6.796 -0.311 Ukraine 50.999 0.982 48.080 0.398 50.856 0.338 63.469 0.695 27.018 2.304 United King. 62.561 0.125 92.113 0.012 75.809 0.054 86.051 0.135 91.480 0.046 United States 40.607 0.268 84.327 -0.098 63.421 0.106 75.061 0.089 88.262 0.009 Uruguay 52.227 0.303 65.389 0.236 51.042 0.025 50.968 0.285 38.887 0.288 Venezuela, RB 59.526 -0.364 46.221 -0.110 36.493 0.044 57.917 0.307 39.832 0.101 Vietnam 66.574 0.475 33.466 0.415 16.062 0.493 38.311 0.979 1.876 0.509 Zambia 76.441 -0.007 47.595 0.746 30.512 -0.370 41.461 0.429 8.836 -0.660 Zimbabwe 59.941 0.694 32.290 0.042 39.982 -0.033 44.265 0.426 6.806 -0.077
Note: changes are reported for logged index values to approximate growth rates.