houston, we have beta · · 2014-03-24houston, we have beta from markowitz to free cash flow ......
TRANSCRIPT

HOUSTON, WE HAVE BETA
From Markowitz To Free Cash Flow
Manish Aurora
Rational Investing LLC
212 466 1119

The Clean Room
• Human endeavor is required to make a market efficient, but
• Biased and Noisy
• Even those with real knowledge do not act consistently
• 80% of quantitative finance focuses on market prices. Yet, we did not run a simulation for the first 4 years
• Objective -> automated DCF model -> corporate finance with high Signal / Noise -> No guidance, consensus, or ‘experts’
• Thesis - stock prices revert around a Beta captured by
• Consistent cash flow statement normalization and projection
• Event processing and error reduction
• A risk adjusted forward looking discount rate
• Out of 10 mm DCF models out there, <10 are really predictive 2

Refresher – Modern Portfolio Theory
• Risk Aversion - Public vs. Private Investor - Cost of Information
• Portfolio Diversification - (Maximize) Mean (Minimize) Variance
• Beta - Correlation to Market Portfolio? No Explanatory Power!
• Isolated evidence of un-diversifiable fundamental factors in returns such as size, distress, R&D with unique payoffs
• Technology -> risk structure -> Junk bonds, CDS, CMO’s
• The solution: A comprehensive, integrated discount rate incorporating
• Beta i.e. exposure to Economic Cycle, Size, Product
Cycle, Market Position
• Macro Impact: Credit Conditions, Regulation
3

Existing Quantitative Methodologies
5 Factors for 5 Minutes or 5 Decades
Short Term Anomaly or Multi-Decade Fundamentals
• Statistical Arbitrage – price autocorrelation or mean reversion
• Multi-Factor Models – cross sectional regression on a few factors
• Very short or very long timelines - Most ‘anomalies’ face severe limits of opportunity size
The World is more nuanced:
• Consistent, scalable approach to corporate finance
• Observation with intuition i.e. ‘Why?’
• Cash only - accounting is irrelevant
• Unstable Equilibrium: Macro cycle changes factor weights
• Result: A general purpose solution
4

A New Reformation
• Henry VIII ended the Papal monopoly on talking to God:
• ‘When I speak, the Lord answers’ (and grants him 5 divorces)
• Time to end S&P’s monopoly on defining risk as correlation to its indices
• A capitalization weighted index based on the historical performance of
components => high (late stage) momentum risk and low size risk
• ‘Alpha’ vs. S&P 500 is, to steal a phrase from Eugene Fama, economic
nonsense.
• So what really is Beta, anyway? And what then might alpha be?
5

Building the Perfect Elephant v1.0
6
Defining A Forward Beta
• If only historical correlation mattered, the actuaries would be rich.
• Expected sensitivity of the company’s cash flow to that of
economy => Forward estimate of correlation to market
• What time horizon? Beta for 30 days very different from 3 years.
• Is Harry Markowitz right? The Rational (Investing’s) answer is
(conceptually) Yes
• Published evidence is weak because analysis is backward looking
• Mr. Markowitz begins his presentations with a slide
• ‘In theory, there is no difference between theory and practice.
In practice, there is.’
• In practice, a good DCF estimates Beta a year forward, not back
7

A Whole Truth Made Up of A Lot of
Partial Truths….
• Free Cash Flow normalization that parses hedges, asset
reserves, litigation, mergers, divestitures etc.
• Projection of financial statements using Artificial Intelligence
• Discount Rate impacted by product and economic cycles
• The impact of Leverage, and Monetary Policy
• Swing Analysis – Understand movement of model vs. market
• Marginal Returns and Costs – Relating changes in CapEx
and working capital to revenue change is hard
• Market Neutral Constraint – Must work just as well picking
shorts as longs – destroys 80% of conventional wisdom
8

Artificial Intelligence In One Template
• Parallel intertwined decision trees => nuanced execution
• Mathematics only i.e. without human bias
• A set of ‘Risk Switches’ rather than sector specificity
• eliminates variance, improves noise handling, reduces cost
• Non-linear economic linkages between risks and estimates
• Impact of R&D, economic cycle, product cycle, margins
• Biases ruin human estimates
• Reasonableness and consistency of model fit across sectors => returns are superior to the best analysts’ work over time
• Risk adjusted E(R): risk mismatches => spread volatility
• Forward looking 5-10 year projection; terminal margins reflect barriers to entry
9

Scale Requires Focused Process,
Intuitive Results
• Result is a classic DCF spreadsheet model
• Entire production process is focused on valuation review and
swing analysis – change and consistency in mispricing
• No communication with market actors
• Cross – sectional fit: Complex inter-relationships between
multiple factors are hard to isolate, but an integrated model
can be tested across an entire market 2500+ G7 firms
supported live
• Typical portfolio 500 longs / 500 shorts
• When Momentum Changes - Capture points of Inflection
the Market takes time to react to
10

Version 2.0
11

Feed
12
Average Annual Return 18.6%
SD Annualized 7.5%
Sharpe Ratio 2.46
*Two months

8 years
13
Average Annual Return 16.4%
SD Annualized 5.2%
Sharpe Ratio 2.76
Excluding financials and utilities. Exposure is aggregate of individual buy/sell decisions by Rational Investing model,
10% per sector net limit, 10% monthly stop loss, 25% mis-pricing threshold for initial investment, 10% for exit .
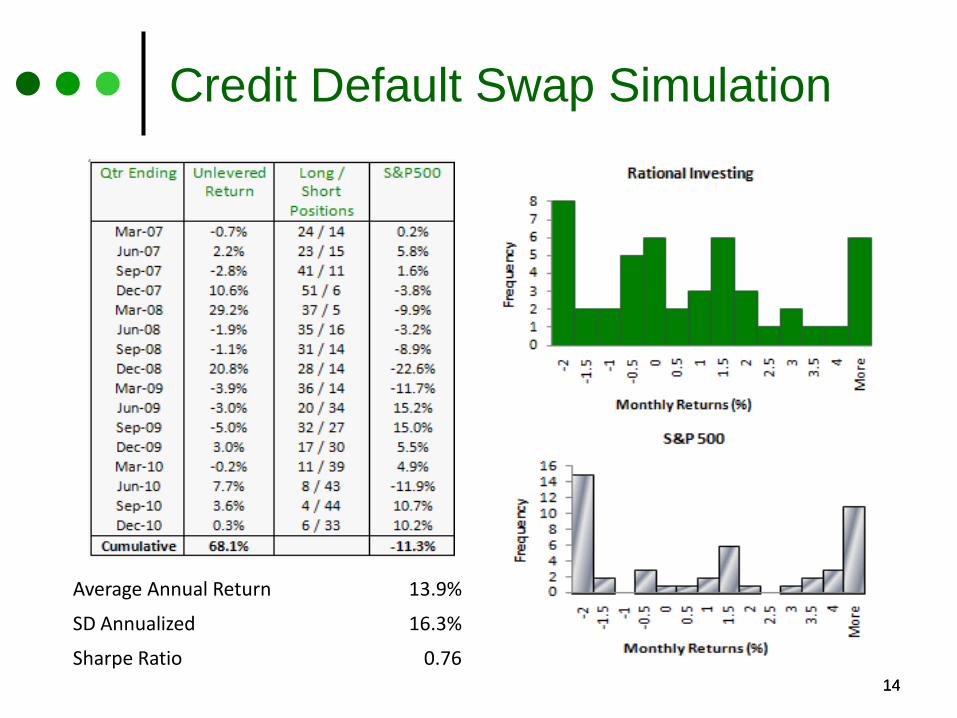
Credit Default Swap Simulation
14 14
Average Annual Return 13.9%
SD Annualized 16.3%
Sharpe Ratio 0.76
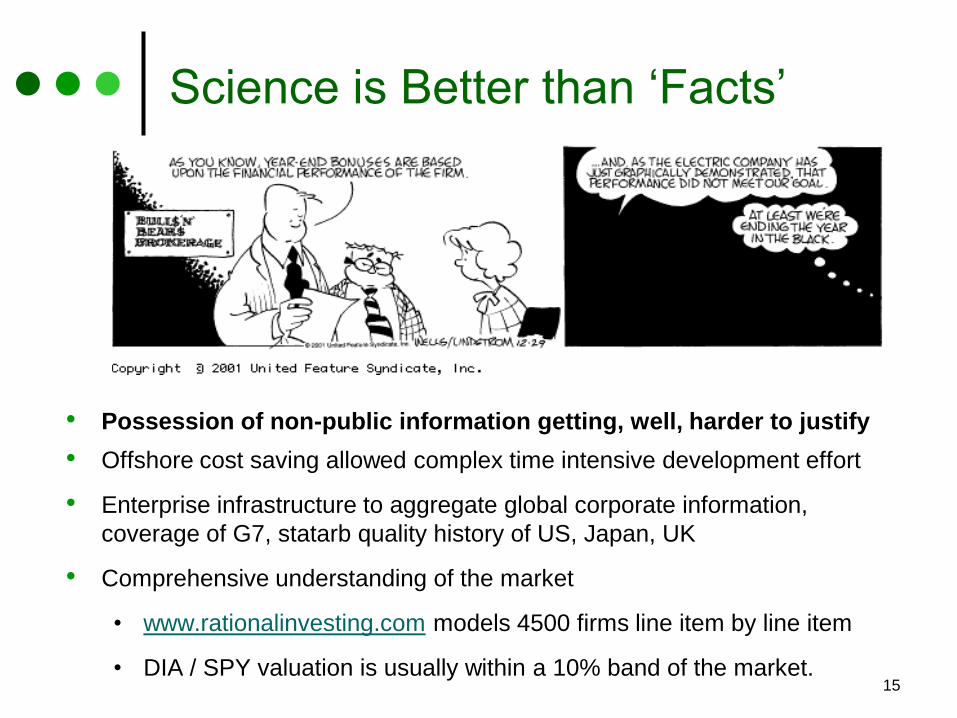
Science is Better than ‘Facts’
• Possession of non-public information getting, well, harder to justify
• Offshore cost saving allowed complex time intensive development effort
• Enterprise infrastructure to aggregate global corporate information,
coverage of G7, statarb quality history of US, Japan, UK
• Comprehensive understanding of the market
• www.rationalinvesting.com models 4500 firms line item by line item
• DIA / SPY valuation is usually within a 10% band of the market.
15

Biography
Manish Aurora, Quantitative Methodology and Product Architecture, New York
• Co-founded Rational Investing LLC and built its first models starting in 1998. Running Distributed Risk LLC, an analytics consulting business, since 1996
• Designed and developed the FX trading platform of www.fxcm.com now supporting 100K+ retail and 1000+ institutional clients. FXCM is now the world’s largest non-bank online FX dealer
• Designed the Value at Risk calculator for the merger of Chase and Chemical, then the biggest ever, under an extremely tight deadline from the Federal Reserve
• Reprogrammed JP Morgan’s global swaps pricing and counterparty credit risk calculation using Massively Parallel Supercomputing technology
• Converted Merrill’s European FX derivatives exposure at NYC, London, Singapore offices to the Euro
• Constructed earliest CMBS and Corporate Bond credit risk models at BlackRock, allowing it to increase its book tenfold at the time.
• Sell-side analyst at Nomura Securities covering real estate equity and debt including CMBS.
• Built the first commercial paper direct issuance and investment management and reporting system for GE Capital, ITT, Ford at Financial Sciences.
• MBA from the University of Chicago, BS from the University of Scranton
16

Appendix: Relationship with Cost of Credit
• The fixed income business has placed its faith in the rating agencies’ historical statistical pooling process to rate creditworthiness.
• Only recently have analysts started paying attention to information in stock prices
• Our system is able to predict stock price movement within a horizon of a few months; in the case of more extreme mis-valuation, a relationship with the price of credit is a fair assumption.
• Merton models could lag severely for illiquid high yield debt issuers or small caps
• Rational Investing uses fundamental information to construct such a linkage, which allows a look at firms with private or illiquid equity.
• We inject the impact of LIBOR, the Treasury curve and the duration of debt
• Context: Rating agency models are tuned to long periods of time, and concerned with timeliness of payment, whereas market prices respond to recent information. For shorter term trades, our model is a superior tool
• Our measures adjust for trends in non-operating income, maintenance CAPEX, charges and restatements; a plain EBITDA multiple is misleading
17
Appendix: Did Fama, French Really
Measure Cross Sectional Expectations?
• To a hedged investor with a monthly reporting cycle, risk is a dynamic concept
• Fama French factors Size and Book / Market (distress) reflect the life cycle of the firm, but are static through an economic cycle
• We drank the Kool-Aid as well, but these are useful as components to construct expectations based risk, not complete explanations. FF might agree.
• Historical correlation vs. S&P, or a ‘multi-factor’ understanding of returns, are fighting this basic fact: risk measurement needs to be dynamic and forward looking.
• Estimate what one cannot measure fully even with hindsight; expectations always differ from subsequent outcomes.
• Mean expectations = an understanding of how information impacts probability assignments and estimates of risk by the market as a whole.
• Alpha = an individual ticker’s deviation from this mean expectation of a risk adjusted return, typically reverses to that mean estimate over the course of a few months.
• Accuracy over years is largely irrelevant. (This also answers why index funds distort markets – they promote momentum by targeting historical success.)
• Has to be built the old fashioned way – trial and error wrt impact of fundamental information on cash flow and discount rate expectations
18

Q&A: Information Content, Data Scrubbing
• Even high quality SEC data can have numerous unresolved accounting issues for the purpose of free cash flow estimation.
• Ignore GAAP – e.g. cash acquisition = CapEx, use EBITDA – maintenance CapEx
• Non-US models: the effort required to scrub data doubles for European firms, triples for Emerging Markets due to cross-checking
• We produce unparalleled data quality and consistency across sectors
• Our offshore analyst team does model review and ‘economic scrubbing’
• Correcting for a variety of accounting irregularities and one-time items
• Incorporating balance sheet changes e.g. option and stock issuance and buybacks
• Integrate financial engineering disclosures in footnotes
• Building a history of M&A activity to understand management behavior and predict liquidity and financing activity
19

Why Automate Cash Flow Projection?
• The answer used to be – just pay an ‘expert’.
• Most equity research groups take the DCF projection process for granted. Yet, they generally build models by hand – at least inconsistent, often irrational
• Software is a powerful and transparent deconstructive tool. Once one gets used to the idea, models can be tweaked rapidly
• Help a discretionary trader get a quick grip on valuation in the face of rapidly changing information on a broad spread portfolio
• Our system and offshore team do the ‘economic scrubbing’ of data, i.e. make adjustments for restatements, spin-offs, strip out non-cash items, etc. Difficult to duplicate overnight, and expensive if done in NYC
• True insight and productivity gains occur when one plays with aggregated data, or can rapidly apply changes to several hundred models. Using a consistent methodology, this produces a strong measure of relative value, and a 1.5+ Sharpe
20

Cash Flow Arbitrage
• Fixed Income Arbitrage – Build a Yield Curve, Interpolate missing pieces, test the fit of a bond, buy or sell (short).
• Knowns – coupon, maturity, rating, benchmark rates. (sometimes) unknown – current price
• Risk – evolution of yield curve, credit spreads
• Result = long and short coupon and principal payments
• Equities – cash flow needs to be estimated
• Unknowns – growth, terminal cash flow
• Our estimation process reduces this to the ‘retention’ parameter
21
• Risk – Rational Investing’s factors, market multiple
• The modeling process often points out issues in data, which are addressed by our analysts. Improved data improves the model, creating a positive feedback loop.
• The current total sample is 4500 firms. Our system usually finds the Dow mildly cheap and the Nasdaq 100 somewhat expensive. The results are available on www.rationalinvesting.com/dowjones30.asp and www.rationalinvesting.com/nasdaq100.asp