households’ use of public and other types of libraries: 2002
TRANSCRIPT

U.S. Department of EducationNCES 2007-327
Households’ Useof Public andOther Types ofLibraries: 2002
E.D. TAB


Households’ Useof Public andOther Types ofLibraries: 2002
E.D. TAB
January 2007
Mark GlanderThuy DamKforce Government Solutions, Inc.
Adrienne ChuteProject OfficerNational Center forEducation Statistics
U.S. Department of EducationNCES 2007-327

U.S. Department of EducationMargaret SpellingsSecretary
Institute of Education SciencesGrover J. WhitehurstDirector
National Center for Education StatisticsMark SchneiderCommissioner
The National Center for Education Statistics (NCES) is the primary federal entity for collecting, analyzing, and reporting data related to education in the United States and other nations. It fulfills a congressional mandate to collect, collate, analyze, and report full and complete statistics on the condition of education in the United States; conduct and publish reports and specialized analyses of the meaning and significance of such statistics; assist state and local education agencies in improving their statistical systems; and review and report on education activities in foreign countries.
NCES activities are designed to address high-priority education data needs; provide consistent, reliable, complete, and accurate indicators of education status and trends; and report timely, useful, and high-quality data to the U.S. Department of Education, the Congress, the states, other education policymakers, practitioners, data users, and the general public. Unless specifically noted, all information contained herein is in the public domain.
We strive to make our products available in a variety of formats and in language that is appropriate to a variety of audiences. You, as our customer, are the best judge of our success in communicating information effectively. If you have any comments or suggestions about this or any other NCES product or report, we would like to hear from you. Please direct your comments to
National Center for Education Statistics Institute of Education Sciences U. S. Department of Education 1990 K Street NW Washington, DC 20006–5651
January 2007
The NCES World Wide Web Home Page address is http://nces.ed.gov. The NCES World Wide Web Electronic Catalog is http://nces.ed.gov/pubsearch. The Library Statistics Programs World Wide Web Welcome Page is http://nces.ed.gov/surveys/libraries/.
This publication is only available online. To download, view, and print the report as a PDF file, go to the NCES World Wide Web Electronic Catalog address shown above.
Suggested CitationGlander, M., and Dam, T. (2006). Households’ Use of Public and Other Types of Libraries: 2002 (NCES 2007-327). U.S. Department of Education. Washington, DC: National Center for Education Statistics. Retrieved [date] from http://nces.ed.gov/pubsearch.
Content ContactAdrienne [email protected]

iii
Acknowledgments Many individuals made important contributions to this report. Stephen Wenck at Synectics for Management Decisions, Inc. created the standard errors tables and provided significance testing of the selected findings. Tai Phan at NCES provided valuable guidance on the presentation and formatting of the data. The reviewers, Chris Chapman, Barbara Holton, and Andrew White of NCES; Kevin Bromer, Alison Slade, and Aparna Sundaram of American Institutes for Research; provided much good advice. Carol Rohr and Joanna Bujard at Kforce Government Solutions, Inc. provided expert help in formatting the tables and the report to NCES standards. Finally, this study would not have been possible without the cooperation of the thousands of households that completed the interviews.


v
Contents
Page
Acknowledgments ....................................................................................................................................... iii
List of Tables ............................................................................................................................................ vii
Introduction .................................................................................................................................................. 1
Selected Findings ......................................................................................................................................... 3
References .................................................................................................................................................... 6
Tables ........................................................................................................................................................... 7
Appendix A: Standard Error Tables .........................................................................................................A-1
Appendix B: Technical Notes—The Current Population Survey ............................................................ B-1
Appendix C: Questionnaire ...................................................................................................................... C-1
Appendix D: Glossary ..............................................................................................................................D-1

vii
List of Tables
Table Page
1. Number and percent of households that used a public library or bookmobile in the past month or year, or that used a school, college, university, or work library in the past month, by state: October 2002 ....................................................................................9
2. Number and percent of households that used a public library or bookmobile in the past year, by distance from library and state: October 2002 ............................................10
3. Number and percent of households that used a public library or bookmobile in the past year, by metropolitan status and state: October 2002 ...............................................12
4. Number and percent of households that used a public library or bookmobile in the past year, by household composition and state: October 2002 .........................................13
5. Number and percent of households with a homemaker that used a public library or bookmobile in the past year, by state: October 2002 ........................................................15
6. Number and percent of households with children under 18 that used a public library or bookmobile in the past year, by state: October 2002 ...................................................16
7. Number and percent of households that used a public library or bookmobile in the past year, by households with a disabled person and state: October 2002 .......................17
8. Number and percent of households that used a public library or bookmobile in the past year, by households with a retired person and state: October 2002 ..........................18
9. Number and percent of households that used a public library or bookmobile in the past year, by household income, or poverty status, and state: October 2002 ...................19
10. Number and percent of households that used a public library or bookmobile in the past year, by highest educational level in household and state: October 2002 .................20
11. Number and percent of households that used a public library or bookmobile in the past year, by presence of high school or college student and state: October 2002 ...........22
12. Number and percent of households that used a public library or bookmobile in the past year, by race/ethnicity and state: October 2002 ........................................................23
13. Number and percent of households that used a public library or bookmobile in the past month to get information for personal use; to borrow books, CD-ROMs, or tapes; to attend a lecture, meeting, or discussion group; or for enjoyment or hobbies, and state: October 2002 ...........................................................................................................24

viii
Table Page
14. Number and percent of households with children under 18 that used a public library or bookmobile in the past month for a program or activity for children under 13, teenagers ages 13 to 18, or for a school or class assignment, or used a school library in the past month, by state: October 2002 ........................................................................25
15. Number and percent of households that used a public library or bookmobile in the past month for a work assignment or to keep up to date at work, or who used a work library in the past month, by state: October 2002 .............................................................26
16. Number and percent of households that used a public library or bookmobile in the past month to use a computer or the Internet, or to learn how to use a computer or the Internet, by state: October 2002 ........................................................................................27
17. Number and percent of households that included a disabled person and that responded that the public library had made access easier, or that reported barriers to their use of the public library, by state: October 2002 .........................................................................28
18. Number and percent of households with members age 55 or older that used a public library or bookmobile in the past month for a program or activity for people age 55 or older, by state: October 2002 ............................................................................................29
19. Number and percent of households that used a public library or bookmobile in the past month to attend a lecture, meeting, or discussion group, by selected household characteristics: October 2002 ............................................................................................30
20. Number and percent of households with children under age 18 that used a public library or bookmobile for an activity for children under age 13, for teenagers ages 13 to 18, or for a school or class assignment, or used a school library in the past month, by selected household characteristics: October 2002 .......................................................31
21. Number and percent of households that used a public library or bookmobile for a school or class assignment in the past month, by selected household characteristics: October 2002 .....................................................................................................................32
22. Number and percent of households that used a public library or bookmobile in the past month to use a computer or the Internet or to learn how to use a computer or the Internet, by selected household characteristics: October 2002 .........................................33
23. Number and percent of households that used a public library or bookmobile in the past month to get information to help find a job, by selected household characteristics: October 2002 ............................................................................................34

ix
Table Page
24. Number and percent of households with employed people that used a public library or bookmobile for a work assignment or to keep up to date at work, or who used a work library, by selected household characteristics: October 2002 ..........................................35
25. Number and percent of households that used a public library or bookmobile in the past month to get information for personal use; or to borrow books, CD-ROMs, or tapes; or for another reason, by selected household characteristics: October 2002 .........36
26. Number and percent of households with members age 55 or older, that used a public library or bookmobile in the past month for an activity for people age 55 or older, by selected household characteristics: October 2002 ............................................................37
27. Number and percent of households with a disabled person that reported barriers to their use of the public library or bookmobile, by selected household characteristics: October 2002 .....................................................................................................................38

x
Appendix A: Standard Error Tables
Table Page
A-1. Standard errors for the number and percent of households that used a public library or bookmobile in the past month or year, or that used a school, college, university, or work library in the past month, by state: October 2002 ................................................. A-3
A-2. Standard errors for the number and percent of households that used a public library or bookmobile in the past year, by distance from library, and state: October 2002 .......... A-4
A-3. Standard errors for the number and percent of households that used a public library or bookmobile in the past year, by metropolitan status and state: October 2002 .............. A-6
A-4. Standard errors for the number and percent of households that used a public library or bookmobile in the past year, by household composition, and state: October 2002 ....... A-7
A-5. Standard errors for the number and percent of households with a homemaker that used a public library or bookmobile in the past year by state: October 2002 ............... A-9
A-6. Standard errors for the number and percent of households with children under 18 that used a public library or bookmobile in the past year, by state: October 2002 ............ A-10
A-7. Standard errors for the number and percent of households that used a public library or bookmobile in the past year, by households with a disabled person and state: October 2002 .............................................................................................................................. A-11
A-8. Standard errors for the number and percent of households that used a public library or bookmobile in the past year, by households with a retired person and state: October 2002 .............................................................................................................................. A-12
A-9. Standard errors for the number and percent of households that used a public library or bookmobile in the past year, by household income, or poverty status, and state: October 2002 ................................................................................................................ A-13
A-10. Standard errors for the number and percent of households that used a public library or bookmobile in the past year, by highest educational level in household and state: October 2002 ................................................................................................................ A-14
A-11. Standard errors for the number and percent of households that used a public library or bookmobile in the past year, by presence of high school or college student and state: October 2002 ................................................................................................................ A-16
A-12. Standard errors for the number and percent of households that used a public library or bookmobile in the past year, by race/ethnicity and state: October 2002 ..................... A-17

xi
Table Page
A-13. Standard errors for the number and percent of households that used a public library or bookmobile in the past month to get information for personal use; to borrow books, CD-ROMs, or tapes; to attend a lecture, meeting, or discussion group; or for enjoyment or hobbies, and state: October 2002 ........................................................... A-18
A-14. Standard errors for the number and percent of households with children under 18 that used a public library or bookmobile in the past month for a program or activity for children under 13, teenagers ages 13 to 18, or for a school or class assignment, or used a school library in the past month, by state: October 2002 ................................. A-19
A-15. Standard errors for the number and percent of households that used a public library or bookmobile in the past month for a work assignment or to keep up to date at work, or who used a work library in the past month, by state: October 2002 ............................ A-20
A-16. Standard errors for the number and percent of households that used a public library or bookmobile in the past month to use a computer or the Internet, or to learn how to use a computer or the Internet, by state: October 2002 ...................................................... A-21
A-17. Standard errors for the number and percent of households that included a disabled person and that responded that the public library had made access easier, or that reported barriers to their use of the public library, by state: October 2002 ................. A-22
A-18. Standard errors for the number and percent of households with members age 55 or older that used a public library or bookmobile in the past month for a program or activity for people age 55 or older, by state: October 2002 ......................................... A-23
A-19. Standard errors for the number and percent of households that used a public library or bookmobile in the past month to attend a lecture, meeting, or discussion group, by selected household characteristics: October 2002 ....................................................... A-24
A-20. Standard errors for the number and percent of households with children under age 18 that used a public library or bookmobile for an activity for children under age 13, for teenagers ages 13 to 18, or for a school or class assignment, or used a school library in the past month, by selected household characteristics: October 2002 .................... A-25
A-21. Standard errors for the number and percent of households that used a public library or bookmobile for a school or class assignment in the past month, by selected household characteristics: October 2002 ....................................................................................... A-26
A-22. Standard errors for the number and percent of households that used a public library or bookmobile in the past month to use a computer or the Internet, or to learn how to use a computer or the Internet, by selected household characteristics: October 2002 ....... A-27

xii
Table Page
A-23. Standard errors for the number and percent of households that used a public library or bookmobile in the past month to get information to help find a job, by selected household characteristics: October 2002 ..................................................................... A-28
A-24. Standard errors for the number and percent of households with employed people that used a public library or bookmobile for a work assignment or to keep up to date at work, or who used a work library, by selected household characteristics: October 2002 ................................................................................................................ A-29
A-25. Standard errors for the number and percent of households that used a public library or bookmobile in the past month to get information for personal use; or to borrow books, CD-ROMs, or tapes; or for another reason, by selected household characteristics: October 2002 ................................................................................................................ A-30
A-26. Standard errors for the number and percent of households with members age 55 or older, that used a public library or bookmobile in the past month for an activity for people age 55 or older, by selected household characteristics: October 2002 ............ A-31
A-27. Standard errors for the number and percent of households with a disabled person that reported barriers to their use of the public library or bookmobile, by selected household characteristics: October 2002 ..................................................................... A-32

1
Introduction
Historical overview of surveys of household use of public libraries
In fiscal year 2002, there were 9,137 public libraries in the 50 states and the District of Columbia, serving 98 percent of the total population in those areas. These libraries spent over $8 billion in FY 2002. They provided access to a wide range of information sources, as well as special programs and services (Chute et al, 2005).
This E.D. TAB provides a variety of measures of households’ use of public libraries and notes some interesting comparisons. It is a product of the Library Statistics Program at the National Center for Education Statistics. The data for this study were collected as part of the October 2002 Current Population Survey (CPS) Library Supplement.
Separately from the CPS supplement, the Library Statistics Program also administers its own annual survey of public libraries, the first of which was conducted in 1989. The results from these surveys are released in an annual report which documents the structure of the nation’s public library system, providing counts of central libraries, branches, and bookmobiles. It includes measures of libraries’ collections, staff, revenues, and expenditures. While the annual survey includes various measures of service (e.g., library visits, circulation, reference transactions), these measure only the traffic through the library; they do not indicate what proportion of the population is actually using the library. The 2002 Library use supplement to the Current Population Survey (CPS), was intended to provide that information.
The last nationwide survey of households’ use of public libraries was conducted as part of the 1996 National Household Education Survey (NHES:96) Program. The findings from that survey are summarized in the NCES report, Use of Public Library Services by Households in the United States: 1996 (NCES 97-446).
Purpose and overview of Current Population Survey fall 2002 data collection and the fall 2002 Library Supplement to the Current Population Survey
The Current Population Survey (CPS) is a monthly survey of households conducted by the Census Bureau for the Bureau of Labor Statistics. It provides a comprehensive body of data on the labor force, including employment, unemployment, and persons not in the labor force. Data are collected monthly from a sample of 50,000 to 60,000 households through personal and telephone interviews. Basic data are gathered monthly; data on special topics are gathered in periodic supplements. NCES works with the Census Bureau to field a school enrollment supplement each October. In October 2002, the Household Use of Public Libraries survey, also sponsored by NCES, was included along with the school enrollment supplement. The Household Use of Public Libraries survey was done only in 2002; it is not scheduled to be repeated.
The CPS interviews were conducted October 13–19, 2002. The core CPS survey questions and parts of the school enrollment supplement were asked about all persons in the household. However, the library use questions were asked of the household in general. Thus, the responses represent public library use by households and not by individuals. To do the analysis reported here, some household characteristics were derived from individual characteristics. For example, if all members of a household were of the same race/ethnicity, the household was described by that same race/ethnicity. If different race/ethnic categories were reported by different members of the household, the household is described here as being of “mixed” race/ethnicity.

2
Summary of data items in this report
Respondents to the survey were asked whether anyone in their household had used a public library or bookmobile in the past month. Those that answered “yes” were asked a series of 17 questions about what particular use was made of the library. Those answering “no” were asked whether anyone in their household had used a public library or bookmobile in the past year. All respondents were asked questions about accessibility to public libraries, and their use of other types of libraries.
Households used libraries in many different ways in 2002. When reading the tables in this report, it is important to remember that the usage categories are not mutually exclusive; the same household may be counted in many different usage categories.
Types of tables in this report
The tables in this report are organized as follows
• Table 1 gives the count and percent of households that have used various types of libraries, by state and type of library used.
• Tables 2–12 provide the number and percent of households that have used public libraries in the past year, by state and various household characteristics.
• Tables 13–18 provide number and percent of households that have used various types of libraries in the month preceding the survey, by state and type of use.
• Tables 19–27 show the number and percent of households that have used various types of libraries in the month preceding the survey, by household characteristics and the uses made of libraries.
Organization of this report
Following this introduction is a section on selected findings from the survey. This is followed by the data tables and appendixes including standard error tables, technical notes, a copy of the library supplement questionnaire, and a glossary.
The selected findings are presented here as illustrations of the information that can be obtained from the extensive set of tables included in this report. All comparisons discussed in the selected findings were tested for significance at the .05 level using two-tailed t-tests. See appendix B for further information on estimating standard errors.

3
Selected Findings
Households’ Use of Libraries
• Almost one-third of households (31 percent) used a public library1 in the month preceding the survey. Almost half (48 percent) used a public library in the year preceding the survey (table 1). In nine states (Alabama, Arkansas, Florida, Georgia, Kentucky Pennsylvania, Tennessee, Texas, West Virginia), household use of public libraries in the past year was significantly lower than the national average; in ten states (Connecticut, Iowa, Kansas, Maryland, Minnesota, New Jersey, Ohio, Utah, Washington, Wisconsin) it was significantly higher.2
• Almost one-fifth of households (19 percent) used a school library in the past month, 10 percent of households used a college or university library in the past month, and 4 percent of households used a work library in the past month (table 1)3.
• The use of public libraries was higher for households that were closer to a library (table 2). In the past year, 52 percent of households less than a mile from a public library used a public library, 50 percent of households 1–2 miles from a public library used a public library, 47 percent of households 3–5 miles from a public library used a public library, 41 percent of households 6–10 miles from a public library used a public library, and one-third (34 percent) of households more than 10 miles from a public library used one.
• A larger proportion of two-parent and single-mother households (69 percent and 60 percent) used a public library in the past year than households consisting of single females (34 percent), single males (28 percent) or other households without children (42 percent) (table 4).
• Nationwide, two-thirds of households with children under 18 (66 percent) used a public library in the past year (table 6). In four states (Alabama, Arkansas, Georgia, Texas) the use of public libraries by these households was significantly lower than the national average; In six states (Connecticut, Indiana, Iowa, Maryland, Minnesota, Ohio) the use of public libraries by these households was significantly higher than the national average.
• Thirty-six percent of households with retired persons used a public library in the past year (table 8).
• Households varied in their use of public libraries by income and education. Sixty-one percent of households with incomes in the top 20 percent used a public library in the past year compared to 33 percent of households with incomes in the lowest 20 percent (table 9).
• Twenty-one percent of households where the highest education level was less than a high school diploma used a public library in the past year; of households where the highest education level was an advanced degree, 66 percent used a public library in the past year (table 10).
1 Public library includes bookmobiles. 2 Not all states can be meaningfully compared to the national average. The reliability of the estimate for any one state depends on several factors, including the number of households sampled within that state. States with larger populations provided larger samples than states with smaller populations, thus yielding more reliable estimates. So while estimates for some states may appear to be very different from the national average, the estimates are not always sufficiently reliable to be statistically significant. Large population states like Florida are more likely to be included in these comparisons than states with small populations. The comparisons listed are only those that are statistically significant. T-tests were used to determine which states were significantly above or below the national average. These t-tests included a Bonferroni adjustment to account for multiple comparisons being made against the national average. 3 Respondents selected type of library from a list provided in the questionnaire. Library types were not specifically defined in the survey. See the glossary (appendix D) and the questionnaire (appendix C) for more details.
4
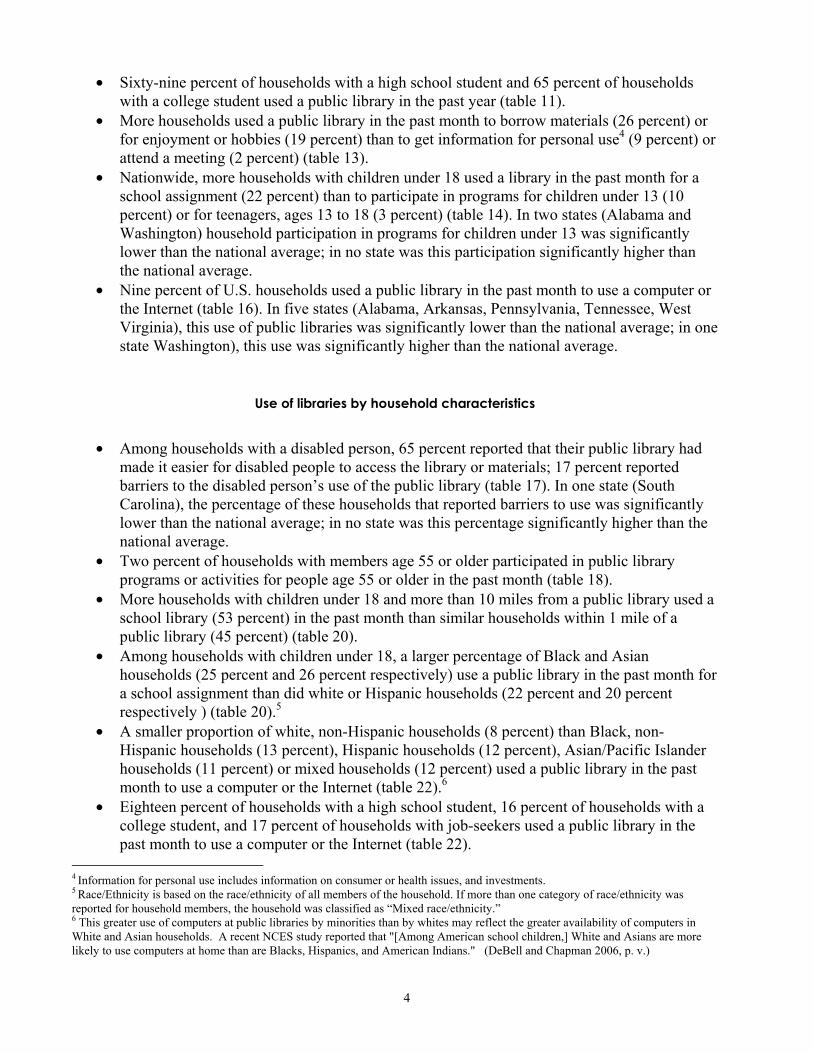
• Sixty-nine percent of households with a high school student and 65 percent of households with a college student used a public library in the past year (table 11).
• More households used a public library in the past month to borrow materials (26 percent) or for enjoyment or hobbies (19 percent) than to get information for personal use4 (9 percent) or attend a meeting (2 percent) (table 13).
• Nationwide, more households with children under 18 used a library in the past month for a school assignment (22 percent) than to participate in programs for children under 13 (10 percent) or for teenagers, ages 13 to 18 (3 percent) (table 14). In two states (Alabama and Washington) household participation in programs for children under 13 was significantly lower than the national average; in no state was this participation significantly higher than the national average.
• Nine percent of U.S. households used a public library in the past month to use a computer or the Internet (table 16). In five states (Alabama, Arkansas, Pennsylvania, Tennessee, West Virginia), this use of public libraries was significantly lower than the national average; in one state Washington), this use was significantly higher than the national average.
Use of libraries by household characteristics
• Among households with a disabled person, 65 percent reported that their public library had
made it easier for disabled people to access the library or materials; 17 percent reported barriers to the disabled person’s use of the public library (table 17). In one state (South Carolina), the percentage of these households that reported barriers to use was significantly lower than the national average; in no state was this percentage significantly higher than the national average.
• Two percent of households with members age 55 or older participated in public library programs or activities for people age 55 or older in the past month (table 18).
• More households with children under 18 and more than 10 miles from a public library used a school library (53 percent) in the past month than similar households within 1 mile of a public library (45 percent) (table 20).
• Among households with children under 18, a larger percentage of Black and Asian households (25 percent and 26 percent respectively) use a public library in the past month for a school assignment than did white or Hispanic households (22 percent and 20 percent respectively ) (table 20).5
• A smaller proportion of white, non-Hispanic households (8 percent) than Black, non-Hispanic households (13 percent), Hispanic households (12 percent), Asian/Pacific Islander households (11 percent) or mixed households (12 percent) used a public library in the past month to use a computer or the Internet (table 22).6
• Eighteen percent of households with a high school student, 16 percent of households with a college student, and 17 percent of households with job-seekers used a public library in the past month to use a computer or the Internet (table 22).
4 Information for personal use includes information on consumer or health issues, and investments. 5 Race/Ethnicity is based on the race/ethnicity of all members of the household. If more than one category of race/ethnicity was reported for household members, the household was classified as “Mixed race/ethnicity.” 6 This greater use of computers at public libraries by minorities than by whites may reflect the greater availability of computers in White and Asian households. A recent NCES study reported that "[Among American school children,] White and Asians are more likely to use computers at home than are Blacks, Hispanics, and American Indians." (DeBell and Chapman 2006, p. v.)

5
• Ten percent of households with job-seekers used a public library in the past month to get information to help find a job (table 23).
• Forty-one percent of households with children under 18, 28 percent of households with any members ages 18 through 64, and 19 percent of households with any members age 65 and older used a public library or bookmobile in the past month to borrow materials7 (table 25).
7 Materials borrowed included books, CDs and tapes.

6
References
Chute, A., Kroe E., O’Shea, P., Craig, T., Freeman, M., Hardesty, L., McLaughlin, J.F., and Ramsey, C.J. (2005), Public Libraries in the United States: Fiscal Year 2002 (NCES 2005-356). U.S. Department of Education. Washington, DC: National Center for Education Statistics. Collins, Mary A. and Chandler, Kathryn (1997), Use of Public Library Services by Household in the United States: 1996 (NCES 97-446). U.S. Department of Education. Washington, DC: National Center for Education Statistics. DeBell, M., and Chapman, C. (2006). Computer and Internet Use by Students in 2003 (NCES 2006-065). U.S. Department of Education. Washington, DC: National Center for Education Statistics. U.S. Department of Labor, Employment & Earnings (monthly). U.S. Department of Labor. Washington, DC: Bureau of Labor Statistics.

7
Tables


Table 1. Number and percent of households that used a public library or bookmobile in the past month or year, or that used a school, college, university, or work libraryTable 1. in the past month, by state: October 2002
Total numberof households Number Percent Number Percent Number Percent Number Percent Number Percent
United States 109,148 51,918 47.6 33,423 30.6 20,878 19.1 11,289 10.3 4,847 4.4
Alabama 1,784 653 36.6 400 22.4 379 21.2 159 8.9 27 1.5Alaska 230 129 56.1 75 32.8 71 31.0 27 11.8 23 9.9Arizona 1,916 909 47.4 564 29.4 373 19.5 232 12.1 72 3.8Arkansas 1,087 405 37.3 238 21.9 180 16.6 102 9.4 34 3.1California 12,569 6,019 47.9 4,075 32.4 2,345 18.7 1,593 12.7 661 5.3
Colorado 1,685 892 52.9 564 33.5 321 19.0 217 12.9 113 6.7Connecticut 1,273 727 57.1 447 35.1 287 22.5 150 11.8 60 4.7Delaware 314 131 41.6 83 26.5 49 15.6 34 10.9 11 3.5District of Columbia 243 101 41.6 68 28.1 18 7.3 32 13.2 27 11.2Florida 6,497 2,876 44.3 1,919 29.5 971 14.9 507 7.8 189 2.9
Georgia 3,219 1,280 39.8 781 24.3 647 20.1 272 8.5 88 2.7Hawaii 421 200 47.5 133 31.7 78 18.6 48 11.4 22 5.1Idaho 516 256 49.6 141 27.3 112 21.7 53 10.2 23 4.4Illinois 4,671 2,319 49.6 1,661 35.6 949 20.3 513 11.0 185 4.0Indiana 2,428 1,283 52.8 889 36.6 468 19.3 189 7.8 76 3.1
Iowa 1,156 688 59.5 411 35.6 309 26.8 145 12.5 65 5.6Kansas 1,071 605 56.5 363 33.9 250 23.4 158 14.8 73 6.8Kentucky 1,701 654 38.5 407 23.9 326 19.2 157 9.2 42 2.5Louisiana 1,734 752 43.3 451 26.0 281 16.2 146 8.4 63 3.6Maine 529 250 47.4 155 29.3 118 22.4 59 11.1 32 6.0
Maryland 2,101 1,175 56.0 734 35.0 416 19.8 262 12.5 214 10.2Massachusetts 2,497 1,164 46.6 857 34.3 382 15.3 228 9.1 135 5.4Michigan 3,908 1,894 48.5 1,176 30.1 779 19.9 457 11.7 175 4.5Minnesota 1,912 1,136 59.4 656 34.3 490 25.6 239 12.5 96 5.0Mississippi 1,059 466 44.0 287 27.1 209 19.8 108 10.2 53 5.0
Missouri 2,249 1,182 52.5 745 33.1 380 16.9 231 10.3 63 2.8Montana 379 172 45.3 103 27.1 66 17.5 45 11.8 23 6.0Nebraska 665 343 51.5 207 31.1 180 27.0 82 12.3 49 7.3Nevada 766 393 51.3 250 32.6 169 22.1 80 10.4 30 3.9New Hampshire 495 238 48.2 153 30.9 104 21.1 45 9.2 22 4.5
New Jersey 3,105 1,633 52.6 1,082 34.8 609 19.6 282 9.1 157 5.1New Mexico 719 321 44.7 185 25.8 114 15.9 75 10.5 30 4.2New York 7,139 3,420 47.9 2,441 34.2 1,167 16.3 726 10.2 275 3.9North Carolina 3,160 1,389 44.0 818 25.9 500 15.8 260 8.2 136 4.3North Dakota 260 102 39.3 58 22.2 64 24.6 29 11.2 14 5.5
Ohio 4,457 2,561 57.5 1,709 38.3 843 18.9 467 10.5 187 4.2Oklahoma 1,380 574 41.6 350 25.4 246 17.8 152 11.0 57 4.2Oregon 1,359 711 52.3 481 35.4 272 20.0 148 10.9 58 4.2Pennsylvania 4,712 1,913 40.6 1,123 23.8 898 19.1 449 9.5 218 4.6Rhode Island 397 192 48.3 132 33.2 61 15.3 40 10.0 11 2.7
South Carolina 1,593 688 43.2 421 26.4 323 20.3 151 9.5 51 3.2South Dakota 292 142 48.6 89 30.5 58 20.0 31 10.7 13 4.4Tennessee 2,234 900 40.3 536 24.0 409 18.3 192 8.6 70 3.2Texas 7,956 3,218 40.5 1,886 23.7 1,862 23.4 757 9.5 329 4.1Utah 728 450 61.9 302 41.5 169 23.2 132 18.1 28 3.9
Vermont 249 127 50.7 86 34.4 49 19.5 29 11.5 13 5.3Virginia 2,856 1,383 48.4 928 32.5 415 14.5 244 8.6 178 6.2Washington 2,375 1,331 56.0 833 35.1 483 20.3 278 11.7 149 6.3West Virginia 760 281 36.9 171 22.5 117 15.4 46 6.1 20 2.6Wisconsin 2,137 1,176 55.0 726 34.0 466 21.8 213 10.0 95 4.4Wyoming 205 117 57.0 74 36.3 45 21.8 18 9.0 14 6.81 The count of households that used a public library or bookmobile in the past year includes those that used one in the past month.
SOURCE: U.S. Department of Commerce, Bureau of the Census, Current Population Survey (CPS), October Supplement, "Household Use of Public Libraries," 2002.
in the past year1 School library university library
2 Library types were not specifically defined in the survey. The determination of library types was made by survey respondents. See the glossary (appendix D) and the questionnaire (appendix C) for more details.
Work library2College or
State
[Numbers in thousands]
Public library
Used in the past monthUsed a public library
9

Table 2. Number and percent of households that used a public library or bookmobile in the past year, by distance from library and state: October 2002
Total number of households
Number of households
Percent that used a public library
Number of households
Percent that used a public library
Number of households
Percent that used a public library
United States 109,148 24,769 51.6 33,124 50.0 32,291 47.4
Alabama 1,784 202 41.1 440 38.0 589 37.2Alaska 230 52 62.9 50 58.3 70 51.5Arizona 1,916 284 58.5 490 50.0 742 46.2Arkansas 1,087 110 45.2 262 39.5 317 36.9California 12,569 3,052 50.9 4,628 49.3 3,642 47.1
Colorado 1,685 366 53.8 512 55.9 571 51.7Connecticut 1,273 303 59.9 575 56.8 321 57.5Delaware 314 38 36.2 104 39.2 111 49.8District of Columbia 243 137 47.8 80 33.2 24 37.3Florida 6,497 804 54.3 1,796 47.9 2,545 42.4
Georgia 3,219 289 42.6 630 48.6 1,135 41.9Hawaii 421 121 47.6 147 48.1 99 49.0Idaho 516 116 48.5 145 54.5 160 50.6Illinois 4,671 1,483 53.1 1,659 52.5 1,063 47.3Indiana 2,428 592 57.0 717 53.6 712 52.1
Iowa 1,156 368 65.5 328 60.6 287 55.4Kansas 1,071 339 60.7 304 52.7 267 56.9Kentucky 1,701 295 39.1 341 39.4 486 45.4Louisiana 1,734 307 53.6 461 48.4 521 40.7Maine 529 127 58.2 129 47.3 160 42.8
Maryland 2,101 384 58.1 746 60.1 684 53.9Massachusetts 2,497 730 45.7 1,124 47.4 537 45.5Michigan 3,908 808 46.3 1,291 46.6 1,358 50.9Minnesota 1,912 419 63.7 559 62.9 526 61.4Mississippi 1,059 86 49.0 256 54.4 328 47.5
Missouri 2,249 502 56.4 695 50.1 604 59.6Montana 379 99 49.2 77 48.3 106 45.8Nebraska 665 223 55.4 186 57.1 152 47.9Nevada 766 165 56.3 241 51.5 265 49.2New Hampshire 495 120 53.2 159 52.0 169 41.9
New Jersey 3,105 1,109 55.7 1,069 47.5 743 53.1New Mexico 719 138 44.8 191 52.3 182 46.4New York 7,139 3,350 46.7 1,994 48.3 1,360 51.2North Carolina 3,160 303 44.0 594 49.6 1,195 45.4North Dakota 260 89 44.2 64 41.7 36 40.5
Ohio 4,457 1,216 56.8 1,565 59.1 1,177 58.0Oklahoma 1,380 291 45.2 400 40.8 358 44.1Oregon 1,359 308 59.1 451 52.7 409 53.5Pennsylvania 4,712 1,211 46.3 1,414 44.4 1,358 37.6Rhode Island 397 119 46.9 149 47.1 106 50.2
South Carolina 1,593 181 47.3 370 46.2 558 45.4South Dakota 292 86 53.3 71 49.0 66 51.7Tennessee 2,234 213 42.0 423 49.6 738 45.5Texas 7,956 1,334 43.5 2,522 45.0 2,696 39.6Utah 728 185 71.6 255 61.9 206 56.3
Vermont 249 76 53.7 73 52.1 68 49.1Virginia 2,856 417 61.8 924 48.6 859 48.8Washington 2,375 568 63.1 616 59.3 768 54.4West Virginia 760 115 51.5 169 41.0 214 38.9Wisconsin 2,137 475 57.7 618 56.0 598 57.4Wyoming 205 64 58.4 58 56.9 47 55.0See notes at end of table.
[Numbers in thousands]
Distance from library1
State
Less than 1 mile 1–2 miles 3–5 miles
10

Table 2. Number and percent of households that used a public library or bookmobile in the past year, by distance from library and state: October 2002—Continued
StateTotal number of
householdsNumber of
householdsPercent that used a
public libraryNumber of
householdsPercent that used a
public library
United States 109,148 12,250 40.9 6,713 33.8
Alabama 1,784 354 37.9 199 24.6Alaska 230 35 54.4 23 52.2Arizona 1,916 269 38.1 131 39.4Arkansas 1,087 211 41.4 187 25.5California 12,569 948 38.0 299 35.7
Colorado 1,685 153 48.2 84 48.0Connecticut 1,273 56 47.7 ‡ ‡Delaware 314 47 30.3 13 47.8District of Columbia 243 ‡ † † †Florida 6,497 972 35.1 380 41.6
Georgia 3,219 705 28.6 460 37.8Hawaii 421 34 55.3 21 23.0 !Idaho 516 74 40.4 21 46.1Illinois 4,671 286 41.0 180 22.6Indiana 2,428 305 47.4 102 44.7
Iowa 1,156 133 52.6 40 49.4Kansas 1,071 99 54.8 63 54.1Kentucky 1,701 283 34.9 296 28.8Louisiana 1,734 230 41.2 215 26.3Maine 529 78 45.2 34 33.3
Maryland 2,101 213 53.7 74 28.3Massachusetts 2,497 88 46.3 ‡ ‡Michigan 3,908 348 53.7 103 38.8Minnesota 1,912 216 50.3 192 44.9Mississippi 1,059 219 34.5 171 31.3
Missouri 2,249 248 45.0 200 39.2Montana 379 50 32.7 46 44.5Nebraska 665 62 39.1 42 37.4Nevada 766 63 46.4 31 52.0New Hampshire 495 34 50.1 ‡ ‡
New Jersey 3,105 124 61.7 ‡ ‡New Mexico 719 72 43.9 136 31.9New York 7,139 335 47.3 99 38.6North Carolina 3,160 708 39.9 360 37.8North Dakota 260 17 37.1 53 28.1
Ohio 4,457 358 54.9 141 47.1Oklahoma 1,380 174 38.6 158 34.4Oregon 1,359 134 39.9 58 34.4Pennsylvania 4,712 522 31.2 207 24.2Rhode Island 397 20 51.2 ‡ ‡
South Carolina 1,593 346 38.5 137 32.2South Dakota 292 26 47.4 43 34.7Tennessee 2,234 455 37.7 405 23.2Texas 7,956 844 34.6 560 25.7Utah 728 56 51.6 ‡ ‡
Vermont 249 23 42.6 ‡ ‡Virginia 2,856 467 42.7 189 30.4Washington 2,375 273 53.3 150 29.2West Virginia 760 152 30.7 111 20.3Wisconsin 2,137 308 52.6 138 36.8Wyoming 205 22 58.2 14 56.8† Not applicable‡ Reporting standards not met.! Interpret data with caution. Estimate is unstable.
[Numbers in thousands]
Distance from library6–10 miles
SOURCE: U.S. Department of Commerce, Bureau of the Census, Current Population Survey (CPS), October Supplement, "Household Use of Public Libraries," 2002.
More than 10 miles
1 The distance categories shown in this table are those used in the questionnaire. Respondents were implicitly asked to round intermediate distances to the nearestrange.
11

Table 3. Number and percent of households that used a public library or bookmobile in the past year, by metropolitan status and state: October 2002
Total number Number of Number ofof households Number Percent households Number Percent households Number Percent
United States 109,148 27,025 12,259 45.4 61,086 30,897 50.6 20,795 8,634 41.5
Alabama 1,784 257 116 45.0 1,005 387 38.5 522 150 28.8Alaska 230 101 52 51.3 ‡ ‡ ‡ 129 77 59.8Arizona 1,916 975 427 43.7 646 352 54.5 296 130 44.0Arkansas 1,087 144 56 38.8 380 149 39.3 562 200 35.6California 12,569 4,596 2,209 48.1 7,810 3,744 47.9 163 66 40.2
Colorado 1,685 388 201 51.9 1,094 606 55.4 204 85 41.6Connecticut 1,273 300 132 44.0 923 561 60.8 ‡ ‡ ‡Delaware 314 ‡ ‡ ‡ 251 109 43.4 63 22 34.6District of Columbia 243 243 101 41.6 ‡ ‡ ‡ ‡ ‡ ‡Florida 6,497 1,190 531 44.7 5,034 2,267 45.0 273 77 28.3
Georgia 3,219 214 77 35.7 2,094 951 45.4 911 252 27.7Hawaii 421 142 54 37.7 156 78 49.7 123 69 56.0Idaho 516 98 54 55.1 88 47 53.3 330 155 46.9Illinois 4,671 1,345 677 50.3 2,511 1,334 53.1 814 308 37.9Indiana 2,428 526 244 46.5 941 516 54.9 962 522 54.3
Iowa 1,156 88 60 68.3 457 275 60.1 611 353 57.8Kansas 1,071 273 133 48.9 390 248 63.7 408 224 54.8Kentucky 1,701 235 100 42.7 539 220 40.8 928 335 36.1Louisiana 1,734 398 166 41.8 969 459 47.4 368 126 34.3Maine 529 ‡ ‡ ‡ 197 108 55.0 332 142 42.8
Maryland 2,101 256 100 39.3 1,697 1,002 59.1 ‡ ‡ ‡Massachusetts 2,497 631 219 34.7 1,735 860 49.6 132 86 65.0Michigan 3,908 808 350 43.4 2,578 1,303 50.6 522 240 46.0Minnesota 1,912 226 143 63.4 1,131 725 64.1 556 268 48.3Mississippi 1,059 106 57 53.3 238 118 49.7 715 291 40.7
Missouri 2,249 447 239 53.5 1,250 676 54.0 551 267 48.4Montana 379 ‡ ‡ ‡ 87 44 51.0 292 127 43.6Nebraska 665 132 69 52.2 253 138 54.5 281 136 48.4Nevada 766 244 135 55.1 407 199 48.9 115 59 51.7New Hampshire 495 ‡ ‡ ‡ 309 145 46.9 186 93 50.3
New Jersey 3,105 213 86 40.5 2,892 1,546 53.5 ‡ ‡ ‡New Mexico 719 199 103 51.7 194 76 38.9 325 142 43.8New York 7,139 3,393 1,300 38.3 3,066 1,816 59.2 680 305 44.8North Carolina 3,160 637 276 43.4 1,611 758 47.0 912 355 38.9North Dakota 260 ‡ ‡ ‡ 115 50 43.5 145 52 35.9
Ohio 4,457 1,206 647 53.7 2,573 1,555 60.4 678 358 52.8Oklahoma 1,380 467 194 41.4 468 240 51.3 445 140 31.5Oregon 1,359 318 190 59.7 678 359 53.0 363 162 44.6Pennsylvania 4,712 877 369 42.1 3,160 1,314 41.6 675 230 34.0Rhode Island 397 152 68 44.9 201 102 50.5 ‡ ‡ ‡
South Carolina 1,593 100 50 50.2 1,071 508 47.4 422 129 30.7South Dakota 292 59 31 52.8 50 26 51.6 184 85 46.5Tennessee 2,234 630 270 42.8 895 455 50.8 708 175 24.8Texas 7,956 2,711 1,070 39.5 4,027 1,717 42.6 1,217 432 35.5Utah 728 163 111 67.9 405 252 62.1 159 88 55.1
Vermont 249 ‡ ‡ ‡ 67 37 55.3 182 89 49.1Virginia 2,856 630 271 43.1 1,596 859 53.8 630 253 40.1Washington 2,375 511 310 60.7 1,320 774 58.7 544 246 45.3West Virginia 760 ‡ ‡ ‡ 391 160 40.8 369 121 32.8Wisconsin 2,137 396 210 53.0 1,074 639 59.5 667 327 49.0Wyoming 205 ‡ ‡ ‡ 64 34 53.6 141 83 58.6‡ Reporting standards not met.
Non-metropolitan
State
1 The MSA status flag in the general CPS file (GEMSAST) was used to identify households within “city centers”. The status of households not flagged as city centers was determined by the CPS metropolitan status indicator (GEMETSTA).
Number of households
SOURCE: U.S. Department of Commerce, Bureau of the Census, Current Population Survey (CPS), October Supplement, "Household Use of Public Libraries," 2002.
[Numbers in thousands]
Households that used public libraries in the past
year
Households that used public libraries in the past
year
Households that used public libraries in the past
year
Metropolitan status1
City center Metropolitan, not city center
12

Table 4. Number and percent of households that used a public library or bookmobile in the past year, by household composition and state: October 2002
Total number Number of Number of of households households Number Percent households Number Percent
United States 109,148 25,987 17,930 69.0 9,445 5,701 60.4
Alabama 1,784 379 234 61.8 186 90 48.3Alaska 230 64 47 73.6 19 11 58.8Arizona 1,916 511 319 62.4 181 103 57.0Arkansas 1,087 253 147 58.2 76 29 37.7California 12,569 3,418 2,300 67.3 1,017 604 59.4
Colorado 1,685 406 292 71.9 114 66 57.7Connecticut 1,273 313 240 76.7 130 104 79.8Delaware 314 71 43 60.0 32 16 48.7District of Columbia 243 18 12 68.7 24 12 48.1Florida 6,497 1,368 899 65.7 583 337 57.8
Georgia 3,219 743 436 58.7 345 194 56.3Hawaii 421 101 76 75.3 31 23 76.0Idaho 516 137 91 66.2 44 26 58.7Illinois 4,671 1,112 792 71.3 409 265 64.8Indiana 2,428 557 424 76.2 201 142 70.6
Iowa 1,156 299 233 77.9 91 68 74.9Kansas 1,071 269 209 77.8 75 51 68.0Kentucky 1,701 358 215 60.2 134 79 58.6Louisiana 1,734 364 243 66.8 190 92 48.3Maine 529 119 85 71.9 27 18 64.6
Maryland 2,101 488 375 76.8 158 122 77.2Massachusetts 2,497 536 402 75.0 212 125 59.3Michigan 3,908 958 717 74.9 334 202 60.5Minnesota 1,912 507 390 76.8 110 81 73.5Mississippi 1,059 220 154 69.7 131 82 62.9
Missouri 2,249 464 350 75.3 194 135 69.9Montana 379 74 52 69.7 25 16 63.4Nebraska 665 169 129 76.4 46 30 65.4Nevada 766 206 136 65.9 65 37 57.3New Hampshire 495 124 88 71.2 34 23 68.0
New Jersey 3,105 888 644 72.5 264 146 55.3New Mexico 719 158 107 67.7 60 28 47.5New York 7,139 1,539 1,118 72.6 687 422 61.5North Carolina 3,160 676 457 67.7 281 167 59.2North Dakota 260 56 36 65.4 17 9 53.8
Ohio 4,457 979 790 80.7 416 299 71.8Oklahoma 1,380 304 185 60.7 99 54 54.3Oregon 1,359 326 230 70.6 111 79 71.5Pennsylvania 4,712 1,012 656 64.8 388 216 55.7Rhode Island 397 75 59 78.4 36 24 68.1
South Carolina 1,593 341 237 69.4 152 75 49.5South Dakota 292 68 50 73.3 20 14 67.2Tennessee 2,234 559 360 64.4 202 117 57.8Texas 7,956 2,187 1,299 59.4 789 384 48.7Utah 728 250 198 79.1 49 32 65.0
Vermont 249 58 47 80.5 19 13 69.1Virginia 2,856 668 453 67.8 230 151 65.8Washington 2,375 548 399 72.7 185 129 69.5West Virginia 760 151 85 56.7 44 26 58.3Wisconsin 2,137 494 355 71.7 157 119 75.3Wyoming 205 45 37 82.8 19 13 69.7See notes at end of table.
Households that used public libraries in the past year
Households that used public libraries in the past year
Households with children
[Numbers in thousands]
State
Two-parent household Single mother household
13

Table 4. Number and percent of households that used a public library or bookmobile in the past year, by household composition and state: October 2002—Continued
Total number Number of Number of Number ofState of households households Number Percent households Number Percent households Number Percent
United States 109,148 16,518 5,583 33.8 12,448 3,542 28.5 41,147 17,195 41.8
Alabama 1,784 262 55 20.8 195 41 21.0 684 196 28.7Alaska 230 25 9 34.0 31 12 40.1 76 40 53.1Arizona 1,916 249 93 37.6 207 67 32.1 696 302 43.3Arkansas 1,087 197 50 25.1 118 27 23.3 409 140 34.2California 12,569 1,666 551 33.1 1,321 342 25.9 4,699 1,942 41.3
Colorado 1,685 210 80 37.9 218 94 43.2 670 316 47.2Connecticut 1,273 178 63 35.1 146 57 38.7 468 244 52.1Delaware 314 48 14 29.2 31 7 ! 23.7 122 45 36.8District of Columbia 243 63 24 38.8 52 17 33.2 77 30 39.0Florida 6,497 1,062 375 35.3 811 197 24.3 2,497 987 39.5
Georgia 3,219 405 123 30.3 382 71 18.5 1,256 413 32.9Hawaii 421 67 17 25.9 46 14 29.9 156 56 35.9Idaho 516 74 30 40.3 53 15 28.9 190 83 43.5Illinois 4,671 710 235 33.2 573 193 33.8 1,726 748 43.4Indiana 2,428 409 139 34.0 268 95 35.3 922 437 47.4
Iowa 1,156 195 84 43.3 124 50 39.8 413 225 54.6Kansas 1,071 163 75 45.8 135 53 39.1 391 192 49.0Kentucky 1,701 276 61 22.0 216 32 14.9 662 238 36.0Louisiana 1,734 298 78 26.3 168 39 23.4 652 256 39.3Maine 529 85 34 40.3 63 20 31.6 219 86 39.3
Maryland 2,101 419 157 37.5 195 81 41.5 768 399 52.0Massachusetts 2,497 466 141 30.2 266 72 26.9 955 390 40.8Michigan 3,908 614 182 29.6 506 125 24.8 1,404 602 42.9Minnesota 1,912 264 137 52.1 227 106 46.8 747 384 51.5Mississippi 1,059 149 42 28.5 92 15 16.6 421 157 37.2
Missouri 2,249 399 152 38.0 277 91 32.9 841 413 49.1Montana 379 56 20 35.5 46 14 31.4 164 61 37.1Nebraska 665 99 34 33.8 79 24 30.3 249 113 45.5Nevada 766 88 32 36.0 92 35 37.9 282 134 47.5New Hampshire 495 72 28 39.3 57 16 28.1 192 74 38.4
New Jersey 3,105 431 159 37.0 341 103 30.3 1,108 531 47.9New Mexico 719 104 32 31.1 90 24 26.7 262 106 40.4New York 7,139 1,241 385 31.0 823 256 31.2 2,637 1,130 42.8North Carolina 3,160 467 145 31.0 408 107 26.1 1,200 458 38.1North Dakota 260 48 13 27.3 36 7 ! 20.8 97 32 32.9
Ohio 4,457 728 357 49.0 470 184 39.2 1,708 854 50.0Oklahoma 1,380 262 77 29.4 156 43 27.4 515 197 38.3Oregon 1,359 197 77 39.2 148 46 31.2 534 252 47.1Pennsylvania 4,712 781 194 24.9 587 128 21.8 1,829 647 35.4Rhode Island 397 71 22 30.3 51 15 30.4 153 65 42.9
South Carolina 1,593 233 87 37.5 169 41 24.2 659 232 35.1South Dakota 292 48 17 36.3 31 7 ! 21.7 ! 118 51 43.4Tennessee 2,234 302 81 26.8 262 48 18.3 854 261 30.6Texas 7,956 978 255 26.0 870 192 22.0 2,757 918 33.3Utah 728 69 31 44.2 57 15 25.8 277 159 57.5
Vermont 249 46 17 36.8 27 10 38.1 92 37 40.2Virginia 2,856 439 196 44.7 284 85 29.8 1,144 457 40.0Washington 2,375 356 173 48.6 259 81 31.4 920 487 53.0West Virginia 760 134 28 21.3 78 16 21.0 327 112 34.2Wisconsin 2,137 285 108 37.9 278 101 36.5 868 464 53.5Wyoming 205 30 15 49.1 26 9 32.8 79 41 51.4! Interpret data with caution. Estimate is unstable.NOTE: Single father households were also included in this survey but estimates for them did not meet reporting requirements.
[Numbers in thousands]
SOURCE: U.S. Department of Commerce, Bureau of the Census, Current Population Survey (CPS), October Supplement, "Household Use of Public Libraries," 2002.
Households that used public libraries in the past year
Households that used public libraries in the past year
Households that used public libraries in the past year
Households without childrenOther households without childrenSingle male householdSingle female household
14

Table 5. Number and percent of households with a homemaker that used a public library or bookmobile in the past year, by state: October 2002
Total number Number ofof households households Number Percent
United States 109,148 13,027 6,939 53.3
Alabama 1,784 231 112 48.2Alaska 230 29 19 65.1Arizona 1,916 269 121 45.0Arkansas 1,087 107 39 35.9California 12,569 1,823 1,008 55.3
Colorado 1,685 218 120 54.8Connecticut 1,273 117 76 65.0Delaware 314 31 14 45.0District of Columbia 243 15 8 ! 51.0Florida 6,497 733 351 48.0
Georgia 3,219 453 214 47.1Hawaii 421 44 23 51.5Idaho 516 60 30 49.4Illinois 4,671 549 311 56.5Indiana 2,428 262 169 64.6
Iowa 1,156 69 49 70.7Kansas 1,071 95 60 63.7Kentucky 1,701 209 100 47.8Louisiana 1,734 287 132 46.0Maine 529 37 22 58.7
Maryland 2,101 189 114 60.6Massachusetts 2,497 258 161 62.3Michigan 3,908 482 306 63.4Minnesota 1,912 128 82 64.1Mississippi 1,059 107 46 43.3
Missouri 2,249 187 128 68.6Montana 379 21 9 42.3Nebraska 665 49 33 68.1Nevada 766 100 61 60.9New Hampshire 495 37 25 67.5
New Jersey 3,105 400 230 57.4New Mexico 719 84 33 39.8New York 7,139 898 483 53.8North Carolina 3,160 363 175 48.0North Dakota 260 13 4 ! 33.4 !
Ohio 4,457 440 245 55.7Oklahoma 1,380 136 65 48.1Oregon 1,359 135 81 59.7Pennsylvania 4,712 525 306 58.3Rhode Island 397 32 20 63.9
South Carolina 1,593 173 99 57.4South Dakota 292 15 9 57.8Tennessee 2,234 360 162 44.8Texas 7,956 1,212 475 39.2Utah 728 112 82 72.9
Vermont 249 17 11 64.7Virginia 2,856 341 189 55.4Washington 2,375 273 170 62.2West Virginia 760 125 47 37.9Wisconsin 2,137 158 101 63.9Wyoming 205 19 13 69.2! Interpret data with caution. Estimate is unstable.NOTE: Homemakers were those household member not currently employed and whose current situation was best described as “taking care of house or family,” as opposed to disabled, ill, in school or retired (CPS variable PENLFACT). SOURCE: U.S. Department of Commerce, Bureau of the Census, Current Population Survey (CPS), October Supplement, "Household Use of Public Libraries," 2002.
[Numbers in thousands]
State
Presence of a homemaker Households that used public libraries in the past year
15

Table 6. Number and percent of households with children under 18 that used a public library or bookmobile in the past year, by state: October 2002
Total number of households Number of households Number Percent
United States 109,148 39,036 25,599 65.6
Alabama 1,784 642 361 56.2Alaska 230 98 68 69.1Arizona 1,916 764 447 58.5Arkansas 1,087 362 188 51.9California 12,569 4,884 3,184 65.2
Colorado 1,685 587 401 68.4Connecticut 1,273 480 363 75.7Delaware 314 113 65 57.0District of Columbia 243 51 29 57.2Florida 6,497 2,127 1,317 61.9
Georgia 3,219 1,176 673 57.2Hawaii 421 152 113 74.4Idaho 516 199 128 64.4Illinois 4,671 1,662 1,142 68.7Indiana 2,428 830 613 73.9
Iowa 1,156 423 329 77.7Kansas 1,071 382 286 74.9Kentucky 1,701 548 323 59.0Louisiana 1,734 616 377 61.3Maine 529 162 110 68.1
Maryland 2,101 718 538 74.9Massachusetts 2,497 809 562 69.5Michigan 3,908 1,384 985 71.2Minnesota 1,912 674 508 75.4Mississippi 1,059 397 252 63.3
Missouri 2,249 731 526 71.9Montana 379 113 76 67.7Nebraska 665 238 172 72.1Nevada 766 305 193 63.2New Hampshire 495 173 120 69.2
New Jersey 3,105 1,226 839 68.5New Mexico 719 262 159 60.6New York 7,139 2,438 1,650 67.7North Carolina 3,160 1,084 680 62.7North Dakota 260 80 50 62.4
Ohio 4,457 1,551 1,166 75.2Oklahoma 1,380 448 257 57.4Oregon 1,359 480 336 70.1Pennsylvania 4,712 1,515 943 62.3Rhode Island 397 122 89 73.0
South Carolina 1,593 532 328 61.7South Dakota 292 96 67 69.9Tennessee 2,234 815 510 62.6Texas 7,956 3,350 1,854 55.3Utah 728 324 245 75.8
Vermont 249 85 62 73.8Virginia 2,856 988 644 65.2Washington 2,375 841 590 70.1West Virginia 760 222 124 56.0Wisconsin 2,137 705 502 71.2Wyoming 205 69 53 76.2SOURCE: U.S. Department of Commerce, Bureau of the Census, Current Population Survey (CPS), October Supplement, "Household Use of Public Libraries," 2002.
[Numbers in thousands]
StateHouseholds that used public libraries in the past year
Households with children under 18
16

Table 7. Number and percent of households that used a public library or bookmobile in the past year, by households with a disabled person and state: October 2002
Total number of households Number of households Number Percent
United States 109,148 9,689 4,088 42.2
Alabama 1,784 180 48 26.6Alaska 230 24 14 58.8Arizona 1,916 135 74 54.6Arkansas 1,087 156 37 23.7California 12,569 1,041 430 41.3
Colorado 1,685 130 67 51.3Connecticut 1,273 108 56 52.1Delaware 314 21 11 52.7District of Columbia 243 18 6 ! 36.4Florida 6,497 518 207 40.0
Georgia 3,219 301 103 34.3Hawaii 421 31 20 63.6Idaho 516 46 16 35.7Illinois 4,671 326 129 39.5Indiana 2,428 198 96 48.7
Iowa 1,156 91 47 51.9Kansas 1,071 116 59 51.1Kentucky 1,701 163 67 41.1Louisiana 1,734 129 64 49.4Maine 529 50 20 38.7
Maryland 2,101 206 112 54.5Massachusetts 2,497 185 72 39.0Michigan 3,908 364 147 40.4Minnesota 1,912 188 97 51.8Mississippi 1,059 142 56 39.7
Missouri 2,249 213 84 39.5Montana 379 49 22 45.2Nebraska 665 57 25 44.4Nevada 766 50 22 44.0New Hampshire 495 42 21 48.7
New Jersey 3,105 255 113 44.3New Mexico 719 78 30 38.3New York 7,139 632 268 42.3North Carolina 3,160 360 144 40.1North Dakota 260 16 6 ! 37.1
Ohio 4,457 459 239 52.2Oklahoma 1,380 155 80 51.5Oregon 1,359 109 54 49.5Pennsylvania 4,712 483 171 35.5Rhode Island 397 38 15 39.4
South Carolina 1,593 128 47 36.4South Dakota 292 21 8 ! 38.3Tennessee 2,234 232 82 35.4Texas 7,956 668 225 33.7Utah 728 51 30 58.7
Vermont 249 15 7 ! 47.7Virginia 2,856 206 80 39.0Washington 2,375 227 124 54.5West Virginia 760 82 30 36.9Wisconsin 2,137 177 95 53.5Wyoming 205 21 11 50.7! Interpret data with caution. Estimate is unstable.
SOURCE: U.S. Department of Commerce, Bureau of the Census, Current Population Survey (CPS), October Supplement, "Household Use of Public Libraries," 2002.
[Numbers in thousands]
Households with disabled person1
Households that used public libraries in the past yearState
1 "Disabled" in this survey was defined as "a long-lasting physical, mental, or emotional condition, that limits participation in the activities done by most people."
17

Table 8. Number and percent of households that used a public library or bookmobile in the past year, by households with a retired person and state: October 2002
Total number of households Number of households Number Percent
United States 109,148 24,581 8,757 35.6
Alabama 1,784 356 94 26.3Alaska 230 37 18 49.6Arizona 1,916 419 179 42.7Arkansas 1,087 276 78 28.3California 12,569 2,499 907 36.3
Colorado 1,685 321 133 41.4Connecticut 1,273 308 130 42.2Delaware 314 75 29 37.8District of Columbia 243 58 21 36.4Florida 6,497 1,729 648 37.5
Georgia 3,219 537 110 20.4Hawaii 421 132 42 31.7Idaho 516 115 40 34.3Illinois 4,671 1,136 404 35.5Indiana 2,428 556 213 38.2
Iowa 1,156 247 111 45.0Kansas 1,071 219 87 39.8Kentucky 1,701 408 108 26.5Louisiana 1,734 417 137 32.8Maine 529 120 45 37.3
Maryland 2,101 501 205 40.9Massachusetts 2,497 555 180 32.5Michigan 3,908 979 314 32.1Minnesota 1,912 381 165 43.2Mississippi 1,059 233 83 35.7
Missouri 2,249 568 201 35.4Montana 379 93 33 35.0Nebraska 665 128 46 36.0Nevada 766 176 73 41.7New Hampshire 495 110 42 37.9
New Jersey 3,105 738 321 43.4New Mexico 719 160 46 29.0New York 7,139 1,816 689 38.0North Carolina 3,160 702 235 33.5North Dakota 260 67 16 23.9
Ohio 4,457 1,010 456 45.1Oklahoma 1,380 348 100 28.7Oregon 1,359 318 123 38.5Pennsylvania 4,712 1,266 330 26.1Rhode Island 397 97 32 32.9
South Carolina 1,593 376 108 28.7South Dakota 292 68 23 33.6Tennessee 2,234 445 130 29.2Texas 7,956 1,505 454 30.2Utah 728 155 71 46.0
Vermont 249 54 20 36.3Virginia 2,856 578 209 36.2Washington 2,375 512 242 47.3West Virginia 760 199 51 25.8Wisconsin 2,137 432 205 47.6Wyoming 205 46 22 48.2SOURCE: U.S. Department of Commerce, Bureau of the Census, Current Population Survey (CPS), October Supplement, "Household Use of Public Libraries," 2002.
[Numbers in thousands]
Households with retired person Households that used public libraries in the past year
State
18

Table 9. Number and percent of households that used a public library or bookmobile in the past year, by household income, or poverty status, and state: October 2002
Total number of households
Number of households
Percent that used a public
libraryNumber of
households
Percent that used a public
libraryNumber of
households
Percent that used a public
libraryNumber of
households
Percent that used a public
library
United States 109,148 21,831 32.8 65,489 48.1 21,828 60.6 13,320 38.0
Alabama 1,784 477 25.1 1,030 37.8 276 52.0 336 28.3Alaska 230 34 50.4 134 56.4 62 58.4 21 61.4Arizona 1,916 408 29.0 1,115 49.2 393 61.4 280 30.2Arkansas 1,087 327 22.6 628 41.6 132 53.2 229 21.7California 12,569 2,160 36.5 7,261 46.7 3,148 58.4 1,441 46.1
Colorado 1,685 231 38.7 1,072 52.6 382 62.3 143 48.1Connecticut 1,273 192 35.8 674 54.6 407 71.2 94 44.1Delaware 314 43 23.7 194 41.5 76 52.2 18 22.6 !District of Columbia 243 47 27.5 141 42.7 55 50.6 34 34.4Florida 6,497 1,376 30.2 4,071 46.0 1,050 56.0 786 33.5
Georgia 3,219 647 25.1 1,960 39.4 612 56.5 372 31.2Hawaii 421 72 37.6 258 47.7 92 54.7 47 54.3Idaho 516 100 35.7 350 51.5 66 60.4 74 43.2Illinois 4,671 799 37.3 2,870 49.1 1,001 61.0 456 47.3Indiana 2,428 485 35.9 1,516 54.3 428 66.9 242 45.1
Iowa 1,156 213 40.6 779 62.7 163 69.2 120 48.0Kansas 1,071 225 46.5 671 57.2 175 66.7 129 51.0Kentucky 1,701 458 25.4 969 41.9 274 48.0 291 33.5Louisiana 1,734 500 31.7 1,055 45.3 179 64.4 287 29.8Maine 529 113 34.1 335 48.0 81 63.1 74 42.4
Maryland 2,101 308 30.2 1,236 57.7 557 66.3 191 37.2Massachusetts 2,497 379 33.9 1,380 45.0 738 56.2 194 36.8Michigan 3,908 777 31.6 2,384 47.8 747 68.0 440 34.0Minnesota 1,912 318 39.8 1,136 60.4 458 70.6 192 37.5Mississippi 1,059 307 29.8 625 47.5 127 61.1 201 35.7
Missouri 2,249 451 35.9 1,431 52.6 367 72.8 266 47.2Montana 379 97 37.1 241 47.5 41 51.2 66 44.2Nebraska 665 135 41.5 434 51.6 96 64.9 95 48.6Nevada 766 108 32.9 503 52.9 155 58.9 76 42.4New Hampshire 495 66 40.0 318 46.2 111 58.8 37 46.8
New Jersey 3,105 438 30.7 1,696 52.9 972 62.0 221 32.0New Mexico 719 217 35.2 409 47.1 92 56.5 158 37.3New York 7,139 1,505 31.2 3,945 48.1 1,689 62.4 870 34.1North Carolina 3,160 760 34.0 1,919 45.5 481 53.4 471 33.9North Dakota 260 66 24.1 170 42.5 23 59.3 36 29.8
Ohio 4,457 817 42.0 2,922 58.9 717 69.1 461 51.8Oklahoma 1,380 342 31.3 851 42.0 187 58.3 218 36.8Oregon 1,359 259 52.9 870 50.0 230 60.4 164 58.5Pennsylvania 4,712 955 25.4 2,866 40.1 891 58.4 447 34.9Rhode Island 397 85 29.5 238 49.8 74 65.3 50 32.2
South Carolina 1,593 379 24.5 1,010 47.7 204 55.6 244 32.5South Dakota 292 62 33.6 195 50.8 34 63.6 40 39.9Tennessee 2,234 537 27.4 1,294 40.1 402 58.2 385 27.1Texas 7,956 1,905 28.8 4,627 41.8 1,423 51.8 1,396 32.5Utah 728 131 46.8 465 63.6 132 70.8 102 49.0
Vermont 249 47 41.1 165 49.2 37 69.7 29 45.0Virginia 2,856 423 31.3 1,671 47.0 763 61.0 201 42.2Washington 2,375 453 49.3 1,426 53.4 496 69.9 270 50.4West Virginia 760 219 25.5 451 40.0 91 49.3 115 28.5Wisconsin 2,137 333 35.1 1,392 56.6 411 66.0 181 37.7Wyoming 205 42 41.6 134 59.8 29 66.6 28 52.7! Interpret data with caution. Estimate is unstable.1 Poverty status is derived from household size and income. Households with incomes below the poverty threshold for their household size (as defined by the U.S. Census Bureau) were classified as poor. Some households reported income in a range that straddles the poverty threshold; these households were classified as poorThe 2002 poverty threshold for a family of three persons including one related child was $14,480. SOURCE: U.S. Department of Commerce, Bureau of the Census, Current Population Survey (CPS), October Supplement, "Household Use of Public Libraries," 2002.
[Numbers in thousands]
Household incomeLowest fifth Middle three-fifths
State
Highest fifthPoverty status1
Below poverty line
19

Table 10. Number and percent of households that used a public library or bookmobile in the past year, by highest educational level in household and state: Table 10. October 2002
StateTotal number of
householdsNumber of
householdsPercent that used
a public libraryNumber of
householdsPercent that used
a public libraryNumber of
householdsPercent that used
a public library
United States 109,148 10,584 20.8 29,576 35.4 32,616 51.2
Alabama 1,784 254 16.7 541 24.4 515 42.3Alaska 230 11 29.5 ! 58 37.6 83 60.4Arizona 1,916 170 29.0 466 31.8 620 48.9Arkansas 1,087 173 12.7 333 28.8 339 41.6California 12,569 1,130 30.3 2,338 34.2 4,290 47.0
Colorado 1,685 119 25.3 332 37.4 515 50.7Connecticut 1,273 89 18.0 351 41.6 308 60.1Delaware 314 23 8.7 ! 95 29.3 91 49.7District of Columbia 243 26 26.3 49 29.0 53 38.7Florida 6,497 623 18.7 1,806 35.0 1,951 47.9
Georgia 3,219 389 14.5 939 29.9 961 47.0Hawaii 421 21 10.5 ! 107 36.3 129 50.4Idaho 516 31 17.6 ! 139 31.3 196 56.9Illinois 4,671 430 32.7 1,245 36.2 1,391 51.1Indiana 2,428 204 23.6 955 43.6 660 58.6
Iowa 1,156 97 19.8 342 47.8 359 62.6Kansas 1,071 80 23.5 292 44.1 329 59.7Kentucky 1,701 217 8.2 533 28.5 516 45.5Louisiana 1,734 220 16.5 592 33.4 457 55.6Maine 529 39 11.7 ! 150 35.2 165 48.3
Maryland 2,101 192 26.9 489 40.4 554 56.0Massachusetts 2,497 203 14.4 630 34.9 582 52.7Michigan 3,908 347 17.6 1,152 33.2 1,256 54.8Minnesota 1,912 101 18.2 395 42.1 722 61.5Mississippi 1,059 138 16.3 339 38.4 338 52.4
Missouri 2,249 198 23.4 586 42.9 726 53.1Montana 379 27 26.4 103 35.2 126 42.9Nebraska 665 41 24.3 166 32.1 245 56.1Nevada 766 84 25.7 187 40.8 257 56.3New Hampshire 495 34 15.1 ! 125 35.0 150 47.7
New Jersey 3,105 244 21.9 813 36.5 725 59.1New Mexico 719 86 20.3 215 32.8 218 53.5New York 7,139 790 23.2 1,878 37.2 1,781 52.2North Carolina 3,160 387 18.2 961 35.3 917 49.3North Dakota 260 19 4.5 ! 68 24.6 96 43.0
Ohio 4,457 323 31.5 1,532 47.5 1,259 59.6Oklahoma 1,380 128 11.4 438 32.1 451 45.4Oregon 1,359 98 33.7 281 37.9 500 50.2Pennsylvania 4,712 408 16.2 1,699 29.3 1,122 44.5Rhode Island 397 57 15.1 106 41.5 97 52.6
South Carolina 1,593 184 9.0 484 31.2 481 48.3South Dakota 292 18 20.1 ! 81 34.9 103 51.1Tennessee 2,234 296 13.2 639 27.4 603 47.9Texas 7,956 1,121 16.0 2,072 30.6 2,406 46.9Utah 728 43 27.5 160 53.2 276 64.2
Vermont 249 16 15.3 ! 72 31.5 61 51.4Virginia 2,856 239 22.6 794 31.3 743 54.3Washington 2,375 137 27.4 478 43.0 910 55.8West Virginia 760 108 9.2 299 28.2 202 50.4Wisconsin 2,137 156 26.8 610 42.3 698 56.4Wyoming 205 14 28.3 ! 57 42.8 83 61.3
[Numbers in thousands]
Highest educational level in householdSome postsecondary
See notes at end of table.
Less than high school diploma High school/GED
20

Table 10. Number and percent of households that used a public library or bookmobile in the past year, by highest educational level in household and state: Table 10. October 2002—Continued
Total number of householdsNumber of
householdsPercent that used
a public libraryNumber of
householdsPercent that used
a public library
United States 109,148 22,512 59.3 13,860 66.2
Alabama 1,784 307 56.1 168 52.6Alaska 230 51 68.4 27 70.1Arizona 1,916 454 59.4 206 67.0Arkansas 1,087 156 58.8 85 63.8California 12,569 2,919 57.8 1,892 62.0
Colorado 1,685 439 62.9 280 71.5Connecticut 1,273 294 67.5 231 78.3Delaware 314 59 49.5 46 57.5District of Columbia 243 46 49.3 69 53.3Florida 6,497 1,427 53.9 691 61.3
Georgia 3,219 632 49.9 299 58.8Hawaii 421 98 56.4 67 58.7Idaho 516 98 60.1 51 70.4Illinois 4,671 1,057 60.0 547 69.9Indiana 2,428 359 70.5 250 71.5
Iowa 1,156 233 77.8 125 79.6Kansas 1,071 245 69.4 126 72.8Kentucky 1,701 243 54.8 191 60.9Louisiana 1,734 315 53.7 150 62.8Maine 529 101 65.9 73 63.7
Maryland 2,101 459 72.2 406 69.9Massachusetts 2,497 591 48.6 490 65.4Michigan 3,908 674 65.1 478 67.5Minnesota 1,912 463 68.1 232 83.1Mississippi 1,059 157 53.9 87 59.6
Missouri 2,249 441 65.1 297 71.2Montana 379 87 55.3 37 71.5Nebraska 665 144 62.2 69 75.5Nevada 766 169 59.4 70 72.6New Hampshire 495 119 59.3 66 71.1
New Jersey 3,105 844 60.3 480 71.9New Mexico 719 124 61.5 76 53.2New York 7,139 1,477 54.1 1,212 66.8North Carolina 3,160 596 56.8 299 62.9North Dakota 260 59 52.2 18 69.4
Ohio 4,457 818 70.3 525 77.4Oklahoma 1,380 220 55.4 143 64.1Oregon 1,359 289 63.5 191 71.9Pennsylvania 4,712 856 51.4 627 65.5Rhode Island 397 88 59.8 49 72.7
South Carolina 1,593 281 64.1 163 66.3South Dakota 292 63 59.0 28 74.9Tennessee 2,234 486 59.6 209 51.3Texas 7,956 1,602 54.0 756 54.6Utah 728 156 69.2 92 73.8
Vermont 249 59 65.8 41 75.6Virginia 2,856 585 61.1 495 64.6Washington 2,375 513 65.2 336 72.8West Virginia 760 94 56.2 58 55.0Wisconsin 2,137 432 68.4 241 77.7Wyoming 205 34 76.6 17 67.3! Interpret data with caution. Estimate is unstable.NOTE: Highest education level in household reflects the highest education level among household members. It is derived from the CPS variable for the highest level of school completed or degree received (PEEDUCA).
[Numbers in thousands]
Highest educational level in householdBachelor's degree
SOURCE: U.S. Department of Commerce, Bureau of the Census, Current Population Survey (CPS), October Supplement, "Household Use of Public Libraries," 2002.
State
Advanced degree
21

Table 11. Number and percent of households that used a public library or bookmobile in the past year, by presence of high school or college student and state:Table 11. October 2002
Total number Number of Number ofof households households Number Percent households Number Percent
United States 109,148 8,376 5,777 69.0 7,654 5,003 65.4
Alabama 1,784 128 82 63.9 116 69 59.7Alaska 230 21 16 77.6 13 9 72.5Arizona 1,916 176 124 70.3 152 103 67.5Arkansas 1,087 70 45 63.6 ‡ ‡ ‡California 12,569 1,091 744 68.2 1,216 748 61.5
Colorado 1,685 118 82 69.5 104 53 50.6Connecticut 1,273 118 85 72.4 86 54 62.7Delaware 314 18 10 55.9 23 14 58.8District of Columbia 243 ‡ ‡ ‡ 16 10 65.5Florida 6,497 430 300 69.8 385 263 68.4
Georgia 3,219 226 130 57.3 192 110 57.3Hawaii 421 26 20 79.1 30 19 64.1Idaho 516 40 29 74.1 30 25 82.9Illinois 4,671 402 286 71.2 371 249 67.2Indiana 2,428 183 136 74.3 118 77 65.1
Iowa 1,156 102 78 76.4 88 54 61.2Kansas 1,071 83 65 77.8 78 61 78.5Kentucky 1,701 94 64 68.6 97 56 57.3Louisiana 1,734 121 78 64.5 120 86 72.0Maine 529 39 31 78.8 31 23 73.6
Maryland 2,101 135 88 65.3 133 116 87.0Massachusetts 2,497 175 128 72.7 134 99 74.0Michigan 3,908 304 226 74.4 312 205 65.8Minnesota 1,912 191 139 72.7 146 108 73.6Mississippi 1,059 89 64 72.3 65 40 61.4
Missouri 2,249 156 121 77.4 162 108 66.9Montana 379 28 20 70.1 23 12 52.1Nebraska 665 53 40 75.3 52 36 70.1Nevada 766 49 30 61.4 34 26 76.8New Hampshire 495 33 24 72.7 29 18 63.2
New Jersey 3,105 225 154 68.6 212 150 70.5New Mexico 719 49 34 69.6 50 31 61.1New York 7,139 531 401 75.5 567 387 68.2North Carolina 3,160 178 106 59.3 142 88 61.8North Dakota 260 22 12 56.1 21 11 55.4
Ohio 4,457 388 292 75.2 298 221 74.2Oklahoma 1,380 117 67 57.3 92 59 64.0Oregon 1,359 97 62 63.6 97 70 72.1Pennsylvania 4,712 327 219 66.8 327 206 62.9Rhode Island 397 24 19 79.4 28 22 80.0
South Carolina 1,593 107 66 61.8 140 93 66.5South Dakota 292 24 17 74.1 25 15 61.3Tennessee 2,234 162 98 60.3 154 93 60.3Texas 7,956 709 422 59.5 499 292 58.5Utah 728 76 61 80.8 83 61 73.7
Vermont 249 16 12 74.6 16 10 60.3Virginia 2,856 199 137 69.2 161 122 75.6Washington 2,375 165 119 72.4 154 89 57.7West Virginia 760 43 29 66.9 30 17 57.2Wisconsin 2,137 191 147 76.8 141 80 56.3Wyoming 205 17 12 70.6 10 7 ! 70.7‡ Reporting standards not met.! Interpret data with caution. Estimate is unstable.NOTE: Household members' student status was determined by whether they were enrolled in the week prior to the survey. It was left to respondents to define"high school" and "college."
[Numbers in thousands]
SOURCE: U.S. Department of Commerce, Bureau of the Census, Current Population Survey (CPS), October Supplement, "Household Use of Public Libraries," 2002.
Households that used a public library in the past year
Households that used a public library in the past year
Households with high school student Households with college student
State
22

Table 12. Number and percent of households that used a public library or bookmobile in the past year, by race/ethnicity and state: October 2002
Total number Number of Number ofof households households Number Percent households Number Percent
United States 109,148 77,757 37,707 48.5 31,391 14,211 45.3
Alabama 1,784 1,301 476 36.6 483 177 36.6Alaska 230 165 95 57.7 65 34 51.9Arizona 1,916 1,310 650 49.6 607 259 42.7Arkansas 1,087 844 340 40.3 243 65 26.9California 12,569 6,687 3,131 46.8 5,883 2,887 49.1
Colorado 1,685 1,272 713 56.1 413 179 43.2Connecticut 1,273 984 576 58.5 289 151 52.2Delaware 314 230 98 42.5 84 33 39.4District of Columbia 243 75 37 49.5 168 64 38.0Florida 6,497 4,282 2,009 46.9 2,215 866 39.1
Georgia 3,219 2,026 798 39.4 1,193 482 40.4Hawaii 421 103 57 55.9 318 143 44.8Idaho 516 464 233 50.2 52 23 44.3Illinois 4,671 3,356 1,615 48.1 1,315 704 53.5Indiana 2,428 2,121 1,158 54.6 308 125 40.6
Iowa 1,156 1,042 622 59.7 113 66 58.5Kansas 1,071 890 504 56.6 181 102 56.2Kentucky 1,701 1,519 562 37.0 183 92 50.4Louisiana 1,734 1,103 509 46.2 631 242 38.4Maine 529 510 239 46.7 18 12 64.5
Maryland 2,101 1,358 790 58.2 743 386 51.9Massachusetts 2,497 2,097 991 47.3 400 174 43.4Michigan 3,908 3,108 1,530 49.2 800 364 45.4Minnesota 1,912 1,728 1,029 59.5 184 108 58.6Mississippi 1,059 701 293 41.7 358 173 48.5
Missouri 2,249 1,914 1,008 52.7 335 174 51.9Montana 379 336 153 45.4 43 19 44.2Nebraska 665 569 290 51.0 96 53 54.7Nevada 766 508 267 52.7 259 126 48.6New Hampshire 495 462 221 47.9 32 17 52.3
New Jersey 3,105 2,128 1,176 55.3 978 457 46.7New Mexico 719 307 139 45.3 412 182 44.2New York 7,139 4,782 2,350 49.1 2,356 1,070 45.4North Carolina 3,160 2,202 966 43.9 958 423 44.1North Dakota 260 241 94 39.2 19 8 ! 40.2
Ohio 4,457 3,691 2,130 57.7 765 430 56.2Oklahoma 1,380 1,052 452 42.9 328 122 37.3Oregon 1,359 1,115 572 51.3 244 139 57.0Pennsylvania 4,712 3,987 1,599 40.1 725 314 43.3Rhode Island 397 335 165 49.4 63 27 42.5
South Carolina 1,593 1,116 474 42.4 477 214 44.9South Dakota 292 270 133 49.0 22 10 43.7Tennessee 2,234 1,805 687 38.1 428 213 49.6Texas 7,956 4,117 1,747 42.4 3,838 1,471 38.3Utah 728 632 397 62.8 96 54 55.9
Vermont 249 239 120 50.3 10 6 ! 60.1Virginia 2,856 1,991 1,019 51.2 865 364 42.1Washington 2,375 1,916 1,091 56.9 459 240 52.3West Virginia 760 723 260 36.0 37 21 55.3Wisconsin 2,137 1,856 1,035 55.8 281 141 50.2Wyoming 205 186 107 57.3 19 10 54.8! Interpret data with caution. Estimate is unstable.
SOURCE: U.S. Department of Commerce, Bureau of the Census, Current Population Survey (CPS), October Supplement, "Household Use of Public Libraries," 2002.
Households that used a public library in the past year
Households that used a public library in the past year
[Numbers in thousands]
Other race/ethnicity1White, non-Hispanic
1 "Other race/ethnicity" includes Black, non-Hispanic; Hispanic; Asian/Pacific Islander; and American Indian/Alaska Native. These categories have been aggregated in this table because the data did not support reliable estimates for these categories separately by state.
23

Table 13. Number and percent of households that used a public library or bookmobile in the past month to get information for personal use; to borrow books,
Total number of households Number Percent Number Percent Number Percent Number Percent
United States 109,148 9,355 8.6 28,871 26.5 2,328 2.1 21,043 19.3
Alabama 1,784 106 6.0 336 18.8 20 1.1 240 13.5Alaska 230 27 11.6 64 27.9 7 ! 3.2 ! 55 23.8Arizona 1,916 180 9.4 482 25.2 47 2.5 374 19.5Arkansas 1,087 57 5.3 205 18.8 11 1.0 158 14.5California 12,569 997 7.9 3,447 27.4 297 2.4 2,262 18.0
Colorado 1,685 218 12.9 487 28.9 49 2.9 429 25.4Connecticut 1,273 107 8.4 399 31.4 43 3.4 261 20.5Delaware 314 21 6.8 71 22.5 6 ! 1.8 ! 50 15.8District of Columbia 243 19 7.9 54 22.3 9 3.6 38 15.6Florida 6,497 652 10.0 1,660 25.6 150 2.3 1,145 17.6
Georgia 3,219 201 6.2 666 20.7 44 1.4 488 15.1Hawaii 421 52 12.4 115 27.3 6 ! 1.5 ! 88 20.8Idaho 516 30 5.8 124 24.0 9 1.7 87 16.8Illinois 4,671 416 8.9 1,450 31.0 118 2.5 1,020 21.8Indiana 2,428 260 10.7 812 33.4 51 2.1 568 23.4
Iowa 1,156 91 7.9 363 31.4 38 3.3 319 27.6Kansas 1,071 119 11.1 307 28.7 29 2.8 250 23.3Kentucky 1,701 86 5.1 339 19.9 27 1.6 256 15.0Louisiana 1,734 112 6.5 357 20.6 24 1.4 246 14.2Maine 529 47 8.9 141 26.6 16 3.0 109 20.6
Maryland 2,101 195 9.3 642 30.6 72 3.5 487 23.2Massachusetts 2,497 219 8.8 748 29.9 60 2.4 535 21.4Michigan 3,908 379 9.7 1,030 26.4 64 1.6 738 18.9Minnesota 1,912 208 10.9 579 30.3 29 1.5 493 25.8Mississippi 1,059 65 6.1 218 20.6 13 1.3 186 17.6
Missouri 2,249 209 9.3 632 28.1 46 2.0 481 21.4Montana 379 32 8.3 91 24.1 10 2.7 86 22.7Nebraska 665 56 8.4 181 27.2 12 1.8 141 21.1Nevada 766 84 11.0 214 27.9 16 2.0 168 21.9New Hampshire 495 36 7.2 126 25.5 18 3.7 95 19.2
New Jersey 3,105 306 9.9 946 30.5 78 2.5 687 22.1New Mexico 719 53 7.3 158 22.0 15 2.1 103 14.4New York 7,139 578 8.1 2,187 30.6 215 3.0 1,410 19.8North Carolina 3,160 262 8.3 702 22.2 56 1.8 522 16.5North Dakota 260 13 5.2 53 20.3 4 ! 1.5 ! 38 14.4
Ohio 4,457 570 12.8 1,517 34.0 101 2.3 1,163 26.1Oklahoma 1,380 118 8.5 300 21.8 37 2.7 255 18.4Oregon 1,359 187 13.7 422 31.1 38 2.8 346 25.5Pennsylvania 4,712 275 5.8 954 20.3 88 1.9 737 15.6Rhode Island 397 32 8.1 116 29.2 9 2.2 79 19.8
South Carolina 1,593 116 7.3 376 23.6 24 1.5 291 18.3South Dakota 292 26 8.8 81 27.6 7 ! 2.4 ! 64 21.8Tennessee 2,234 108 4.8 476 21.3 24 1.1 320 14.3Texas 7,956 457 5.7 1,548 19.5 89 1.1 1,042 13.1Utah 728 96 13.1 277 38.1 19 2.6 204 28.0
Vermont 249 23 9.3 75 30.2 9 3.8 65 26.0Virginia 2,856 273 9.6 800 28.0 69 2.4 598 20.9Washington 2,375 303 12.7 705 29.7 48 2.0 603 25.4West Virginia 760 44 5.8 150 19.7 11 1.4 95 12.5Wisconsin 2,137 212 9.9 623 29.2 42 2.0 522 24.4Wyoming 205 23 11.4 67 32.9 6 ! 3.1 ! 51 24.9! Interpret data with caution. Estimate is unstable.1 Information for personal use includes information on consumer or health issues, and investments
Table 13. CD-ROMs, or tapes; to attend a lecture, meeting, or discussion group; or for enjoyment or hobbies, and state: October 2002
SOURCE: U.S. Department of Commerce, Bureau of the Census, Current Population Survey (CPS), October Supplement, "Household Use of Public Libraries," 2002.
[Numbers in thousands]
Personal use1 Borrow material Attend meeting Enjoyment or hobbies
State
Used a public library or bookmobile in the past month
24

Table 14. Number and percent of households with children under 18 that used a public library or bookmobile in the past month for a program or activity for children
Total number of households
Households with children
under 18 Number Percent Number Percent Number Percent Number Percent
United States 109,148 39,036 3,871 9.9 1,170 3.0 8,687 22.3 18,775 48.1
Alabama 1,784 642 33 5.2 24 3.7 125 19.5 352 54.8Alaska 230 98 8 ! 7.7 ! 3 ! 3.0 ! 24 24.0 63 64.2Arizona 1,916 764 59 7.8 14 1.9 132 17.3 354 46.3Arkansas 1,087 362 20 5.5 2 ! 0.6 ! 44 12.1 161 44.5California 12,569 4,884 545 11.2 250 5.1 1,266 25.9 2,055 42.1
Colorado 1,685 587 78 13.3 18 3.1 113 19.2 276 47.0Connecticut 1,273 480 55 11.4 20 4.2 127 26.5 258 53.8Delaware 314 113 14 12.7 4 ! 3.6 ! 21 18.1 43 38.0District of Columbia 243 51 11 20.7 6 ! 10.8 ! 18 34.9 15 29.1Florida 6,497 2,127 208 9.8 63 3.0 485 22.8 858 40.3
Georgia 3,219 1,176 111 9.5 24 2.0 204 17.3 586 49.8Hawaii 421 152 17 11.2 7 ! 4.8 ! 50 32.8 72 47.3Idaho 516 199 14 6.8 1 ! 0.7 ! 27 13.8 102 51.4Illinois 4,671 1,662 213 12.8 66 4.0 490 29.5 864 52.0Indiana 2,428 830 107 12.8 22 2.6 221 26.6 403 48.6
Iowa 1,156 423 36 8.6 11 2.7 86 20.4 278 65.6Kansas 1,071 382 33 8.5 11 2.8 87 22.8 226 59.2Kentucky 1,701 548 44 8.1 10 1.9 71 12.9 292 53.2Louisiana 1,734 616 50 8.0 9 1.5 92 15.0 257 41.8Maine 529 162 21 13.0 4 ! 2.5 ! 36 22.5 103 63.7
Maryland 2,101 718 74 10.3 22 3.0 181 25.2 351 48.9Massachusetts 2,497 809 116 14.4 20 2.4 218 26.9 344 42.5Michigan 3,908 1,384 164 11.8 35 2.5 340 24.6 706 51.0Minnesota 1,912 674 59 8.7 18 2.7 138 20.5 459 68.1Mississippi 1,059 397 26 6.5 14 3.6 87 21.9 195 49.2
Missouri 2,249 731 74 10.1 19 2.6 157 21.4 368 50.4Montana 379 113 11 9.8 5 ! 4.7 ! 23 20.5 59 52.6Nebraska 665 238 21 8.9 3 ! 1.4 ! 48 20.3 161 67.8Nevada 766 305 43 14.1 13 4.2 65 21.4 154 50.4New Hampshire 495 173 19 11.0 3 ! 2.0 ! 41 23.9 90 52.0
New Jersey 3,105 1,226 153 12.5 42 3.4 261 21.3 549 44.8New Mexico 719 262 14 5.5 10 3.8 57 21.9 102 38.8New York 7,139 2,438 303 12.4 93 3.8 698 28.6 1,055 43.3North Carolina 3,160 1,084 99 9.1 14 1.3 180 16.6 444 40.9North Dakota 260 80 4 ! 4.9 ! 1 ! 1.2 ! 12 14.5 53 66.6
Ohio 4,457 1,551 142 9.2 23 1.5 462 29.8 768 49.5Oklahoma 1,380 448 39 8.7 24 5.3 91 20.4 206 46.1Oregon 1,359 480 44 9.1 22 4.7 105 21.8 244 50.9Pennsylvania 4,712 1,515 133 8.8 19 1.3 250 16.5 800 52.8Rhode Island 397 122 15 12.0 4 ! 3.3 ! 34 27.6 53 43.7
South Carolina 1,593 532 54 10.2 18 3.5 99 18.7 292 54.9South Dakota 292 96 9 9.3 2 ! 2.0 ! 17 18.1 51 52.9Tennessee 2,234 815 69 8.5 17 2.1 177 21.7 384 47.2Texas 7,956 3,350 272 8.1 77 2.3 562 16.8 1,701 50.8Utah 728 324 19 5.9 8 ! 2.4 ! 73 22.6 158 48.7
Vermont 249 85 13 15.6 4 ! 5.1 ! 17 20.2 43 50.8Virginia 2,856 988 84 8.5 32 3.2 194 19.6 339 34.3Washington 2,375 841 36 4.2 11 1.3 173 20.5 460 54.7West Virginia 760 222 17 7.8 4 ! 1.8 ! 36 16.2 102 45.9Wisconsin 2,137 705 61 8.6 21 3.0 155 22.0 427 60.6Wyoming 205 69 9 13.4 2 ! 2.4 ! 16 23.5 38 54.8! Interpret data with caution. Estimate is unstable.
Table 14. under 13, teenagers ages 13 to 18 or for a school or class assignment, or used a school library in the past month, by state: October 2002[Numbers in thousands]
SOURCE: U.S. Department of Commerce, Bureau of the Census, Current Population Survey (CPS), October Supplement, "Household Use of Public Libraries," 2002.
Used a public library for programs for children
under 13
Used a public library for programs for teenagers
ages 13 to 18Used a public library for a
school assignment
Households with children under 18 that used a
school library in the past month
State
Households with children under 18 that used a public library in the past month
25

Table 15. Number and percent of households that used a public library or bookmobile in the past month for a work assignment or to keep up to date at work, or Table 15. who used a work library in the past month, by state: October 2002
Total number of households Number Percent Number Percent
United States 109,148 2,934 2.7 4,847 4.4
Alabama 1,784 13 0.8 27 1.5Alaska 230 8 ! 3.5 ! 23 9.9Arizona 1,916 35 1.8 72 3.8Arkansas 1,087 17 1.6 34 3.1California 12,569 389 3.1 661 5.3
Colorado 1,685 61 3.6 113 6.7Connecticut 1,273 40 3.1 60 4.7Delaware 314 7 ! 2.2 ! 11 3.5District of Columbia 243 10 4.0 27 11.2Florida 6,497 215 3.3 189 2.9
Georgia 3,219 75 2.3 88 2.7Hawaii 421 14 3.3 22 5.1Idaho 516 6 ! 1.1 ! 23 4.4Illinois 4,671 102 2.2 185 4.0Indiana 2,428 74 3.0 76 3.1
Iowa 1,156 26 2.2 65 5.6Kansas 1,071 36 3.4 73 6.8Kentucky 1,701 23 1.3 42 2.5Louisiana 1,734 17 1.0 63 3.6Maine 529 13 2.5 32 6.0
Maryland 2,101 61 2.9 214 10.2Massachusetts 2,497 79 3.2 135 5.4Michigan 3,908 118 3.0 175 4.5Minnesota 1,912 62 3.2 96 5.0Mississippi 1,059 25 2.3 53 5.0
Missouri 2,249 78 3.5 63 2.8Montana 379 8 ! 2.0 ! 23 6.0Nebraska 665 16 2.3 49 7.3Nevada 766 28 3.7 30 3.9New Hampshire 495 14 2.8 22 4.5
New Jersey 3,105 110 3.5 157 5.1New Mexico 719 20 2.7 30 4.2New York 7,139 176 2.5 275 3.9North Carolina 3,160 74 2.3 136 4.3North Dakota 260 5 ! 1.8 ! 14 5.5
Ohio 4,457 144 3.2 187 4.2Oklahoma 1,380 50 3.6 57 4.2Oregon 1,359 46 3.4 58 4.2Pennsylvania 4,712 92 2.0 218 4.6Rhode Island 397 12 2.9 11 2.7
South Carolina 1,593 41 2.6 51 3.2South Dakota 292 7 ! 2.4 ! 13 4.4Tennessee 2,234 34 1.5 70 3.2Texas 7,956 172 2.2 329 4.1Utah 728 18 2.4 28 3.9
Vermont 249 8 ! 3.3 ! 13 5.3Virginia 2,856 105 3.7 178 6.2Washington 2,375 71 3.0 149 6.3West Virginia 760 11 1.5 20 2.6Wisconsin 2,137 66 3.1 95 4.4Wyoming 205 6 ! 2.8 ! 14 6.8! Interpret data with caution. Estimate is unstable.SOURCE: U.S. Department of Commerce, Bureau of the Census, Current Population Survey (CPS), October Supplement, "Household Use of Public Libraries," 2002.
[Numbers in thousands]
Households that used a public library for a work assignment or to keep up to date at work in the past
monthHouseholds that used a work library in the past
month
State
26

Table 16. Number and percent of households that used a public library or bookmobile in the past month to use a computer or the Internet, or to learn how to Table 16. use a computer or the Internet, by state: October 2002
Total number of households Number Percent Number Percent
United States 109,148 9,677 8.9 1,749 1.6
Alabama 1,784 94 5.3 17 0.9Alaska 230 25 10.7 4 ! 1.6 !Arizona 1,916 213 11.1 32 1.7Arkansas 1,087 60 5.5 4 ! 0.4 !California 12,569 1,188 9.4 280 2.2
Colorado 1,685 173 10.3 16 0.9Connecticut 1,273 97 7.6 22 1.7Delaware 314 19 6.1 2 ! 0.8 !District of Columbia 243 24 9.7 6 ! 2.4 !Florida 6,497 593 9.1 127 2.0
Georgia 3,219 269 8.4 34 1.1Hawaii 421 36 8.6 3 ! 0.8 !Idaho 516 38 7.4 5 ! 1.1 !Illinois 4,671 498 10.7 113 2.4Indiana 2,428 246 10.2 22 0.9
Iowa 1,156 103 8.9 13 1.1Kansas 1,071 121 11.3 22 2.0Kentucky 1,701 117 6.9 19 1.1Louisiana 1,734 122 7.0 10 0.6Maine 529 36 6.8 5 ! 1.0 !
Maryland 2,101 222 10.6 34 1.6Massachusetts 2,497 212 8.5 43 1.7Michigan 3,908 400 10.2 73 1.9Minnesota 1,912 174 9.1 22 1.2Mississippi 1,059 109 10.3 21 2.0
Missouri 2,249 247 11.0 41 1.8Montana 379 33 8.8 4 ! 1.1 !Nebraska 665 69 10.4 11 1.7Nevada 766 59 7.8 13 1.7New Hampshire 495 30 6.0 4 ! 0.9 !
New Jersey 3,105 281 9.0 54 1.8New Mexico 719 64 8.9 13 1.8New York 7,139 676 9.5 176 2.5North Carolina 3,160 262 8.3 40 1.3North Dakota 260 13 4.9 1 ! 0.5 !
Ohio 4,457 465 10.4 69 1.5Oklahoma 1,380 115 8.4 23 1.7Oregon 1,359 143 10.5 19 1.4Pennsylvania 4,712 332 7.1 43 0.9Rhode Island 397 36 9.0 6 ! 1.5 !
South Carolina 1,593 98 6.1 12 0.8South Dakota 292 21 7.3 4 ! 1.4 !Tennessee 2,234 131 5.9 9 0.4Texas 7,956 611 7.7 152 1.9Utah 728 77 10.6 7 ! 1.0 !
Vermont 249 21 8.5 4 ! 1.8 !Virginia 2,856 229 8.0 41 1.4Washington 2,375 283 11.9 24 1.0West Virginia 760 33 4.3 5 ! 0.6 !Wisconsin 2,137 140 6.5 18 0.9Wyoming 205 20 9.9 4 ! 1.9 !! Interpret data with caution. Estimate is unstable.
Households that used a public library to learn how to use a computer or the Internet
[Numbers in thousands]
SOURCE: U.S. Department of Commerce, Bureau of the Census, Current Population Survey (CPS), October Supplement, "Household Use of Public Libraries," 2002.
Households that used a public library to use a computer or the Internet
27

Table 17. Number and percent of households that included a disabled person and that responded that the public library had made access easier, or that reported Table 17. barriers to their use of the public library, by state: October 2002
Total number of households Number Percent Number Percent
United States 109,148 9,689 6,331 65.3 1,633 16.9
Alabama 1,784 180 107 59.6 35 19.2Alaska 230 24 16 68.6 2 ! 10.2 !Arizona 1,916 135 108 79.8 21 15.7Arkansas 1,087 156 92 59.1 22 14.3California 12,569 1,041 650 62.4 205 19.7
Colorado 1,685 130 90 69.3 30 23.1Connecticut 1,273 108 83 76.6 19 18.0Delaware 314 21 15 70.6 2 ! 9.4 !District of Columbia 243 18 9 53.6 2 ! 10.2 !Florida 6,497 518 308 59.5 101 19.4
Georgia 3,219 301 183 60.7 40 13.2Hawaii 421 31 13 42.3 3 ! 10.0 !Idaho 516 46 29 63.3 7 ! 15.8Illinois 4,671 326 218 67.0 45 13.8Indiana 2,428 198 130 65.6 37 18.7
Iowa 1,156 91 56 61.7 13 14.2Kansas 1,071 116 94 80.6 11 9.2Kentucky 1,701 163 107 65.6 44 27.1Louisiana 1,734 129 79 61.6 16 12.3Maine 529 50 32 62.9 9 17.9
Maryland 2,101 206 134 65.1 37 18.0Massachusetts 2,497 185 125 67.7 18 9.6Michigan 3,908 364 244 66.9 50 13.8Minnesota 1,912 188 114 60.9 33 17.8Mississippi 1,059 142 96 67.9 14 9.6
Missouri 2,249 213 146 68.2 41 19.4Montana 379 49 41 84.9 5 ! 10.5 !Nebraska 665 57 38 66.2 12 20.5Nevada 766 50 34 68.9 10 21.1New Hampshire 495 42 27 63.5 9 21.9
New Jersey 3,105 255 175 68.9 43 17.0New Mexico 719 78 45 58.4 16 20.5New York 7,139 632 407 64.4 121 19.1North Carolina 3,160 360 246 68.4 60 16.5North Dakota 260 16 13 76.2 4 ! 23.9 !
Ohio 4,457 459 302 65.8 49 10.8Oklahoma 1,380 155 105 68.0 23 14.6Oregon 1,359 109 76 70.4 20 18.3Pennsylvania 4,712 483 330 68.4 57 11.7Rhode Island 397 38 25 67.5 6 ! 16.1 !
South Carolina 1,593 128 84 65.5 9 6.7South Dakota 292 21 16 74.2 3 ! 14.3 !Tennessee 2,234 232 141 60.8 39 16.8Texas 7,956 668 415 62.1 163 24.4Utah 728 51 37 73.1 10 19.3
Vermont 249 15 9 63.6 4 ! 28.9 !Virginia 2,856 206 139 67.3 29 13.8Washington 2,375 227 153 67.5 45 19.9West Virginia 760 82 59 71.7 18 22.1Wisconsin 2,137 177 119 67.1 20 11.4Wyoming 205 21 15 72.9 2 ! 8.9 !! Interpret data with caution. Estimate is unstable.
SOURCE: U.S. Department of Commerce, Bureau of the Census, Current Population Survey (CPS), October Supplement, "Household Use of Public Libraries," 2002.
[Numbers in thousands]
Households with disabled person that responded the public library had made access
easier
State
1"Disabled" in this study was defined as "a long-lasting physical, mental, or emotional condition, that limits participation in the activities done by most people."
Number of households with a disabled
person1
NOTE: The two response categories in this table (“made access easier” and “reported barriers”) were answers to separate, independent questions asked of households that reported a disabled household member. Please see questions L22, L22a and L22b in Appendix C for the context of these responses.
Households with a disabled person that reported barriers to their use of the public library
28

Table 18. Number and percent of households with members age 55 or older that used a public library or bookmobile in the past month for a program or Table 18. activity for people age 55 or older, by state: October 2002
Number Percent
United States 109,148 41,144 941 2.3
Alabama 1,784 694 15 2.1Alaska 230 67 1 ! 1.5 !Arizona 1,916 682 12 1.8Arkansas 1,087 461 6 ! 1.4 !California 12,569 4,348 90 2.1
Colorado 1,685 516 22 4.2Connecticut 1,273 511 10 1.9Delaware 314 119 4 ! 3.2 !District of Columbia 243 94 2 ! 2.6 !Florida 6,497 2,674 57 2.1
Georgia 3,219 1,022 20 2.0Hawaii 421 197 3 ! 1.5 !Idaho 516 172 4 ! 2.2 !Illinois 4,671 1,756 56 3.2Indiana 2,428 890 37 4.2
Iowa 1,156 410 6 ! 1.5 !Kansas 1,071 401 11 2.7Kentucky 1,701 707 12 1.7Louisiana 1,734 704 17 2.4Maine 529 207 4 ! 1.8 !
Maryland 2,101 848 17 2.0Massachusetts 2,497 999 25 2.5Michigan 3,908 1,451 25 1.7Minnesota 1,912 648 28 4.3Mississippi 1,059 431 5 ! 1.1 !
Missouri 2,249 901 15 1.6Montana 379 152 4 ! 2.5 !Nebraska 665 238 5 ! 2.1 !Nevada 766 282 9 3.0New Hampshire 495 184 5 ! 2.5 !
New Jersey 3,105 1,254 40 3.2New Mexico 719 275 4 ! 1.5 !New York 7,139 2,985 84 2.8North Carolina 3,160 1,183 15 1.2North Dakota 260 104 1 ! 0.6 !
Ohio 4,457 1,706 37 2.2Oklahoma 1,380 558 11 2.0Oregon 1,359 492 22 4.4Pennsylvania 4,712 2,020 32 1.6Rhode Island 397 167 4 ! 2.4 !
South Carolina 1,593 653 3 ! 0.4 !South Dakota 292 114 2 ! 1.7 !Tennessee 2,234 814 3 ! 0.3 !Texas 7,956 2,732 64 2.3 Utah 728 238 6 ! 2.5 !
Vermont 249 96 2 ! 2.1 !Virginia 2,856 1,046 43 4.1Washington 2,375 781 17 2.1West Virginia 760 340 10 2.8Wisconsin 2,137 745 16 2.1Wyoming 205 76 3 ! 3.9 !! Interpret data with caution. Estimate is unstable.SOURCE: U.S. Department of Commerce, Bureau of the Census, Current Population Survey (CPS), October Supplement, "Household Use of Public Libraries," 2002.
State
[Numbers in thousands]
Total number of householdsNumber of households with
members age 55 or older
Households with members age 55 or older that used a public library in the past month for a program or activity for people age 55 or older
29

Table 19. Number and percent of households that used a public library or bookmobile in the past month to attend a lecture, meeting, or discussion group, by selected Table 19. household characteristics: October 2002
Household characteristic Total households Number Percent
All 109,148 2,328 2.1
Distance from library Less than 1 mile 24,769 693 2.8 1-2 miles 33,124 705 2.1 3-5 miles 32,291 633 2.0 6-10 miles 12,250 215 1.8 More than 10 miles 6,713 82 1.2
Gegraphic region Northeast 203,956 5,362 2.6 Midwest 252,054 5,408 2.1 South 396,777 6,845 1.7 West 238,692 5,665 2.4
Metropolitan status Unclassified 242 ‡ † City center 27,025 609 2.3 Metropolitan, not city center 61,086 1,369 2.2 Non_Metropolitan 20,795 338 1.6
Race/ethnicity White, non-hispanic 77,757 1,709 2.2 Black, non-hispanic 12,981 284 2.2 Hispanic 9,165 153 1.7 Asian/pacific islander 3,223 ‡ † Other 484 ‡ † Mixed race/ethnicity 5,538 130 2.4
Highest Education in the household Less than high school 10,584 76 0.7 High school/GED 29,576 271 0.9 Some postsecondary 32,616 673 2.1 Baccalaureate 22,512 655 2.9 Advanced degree 13,860 653 4.7
Income level Lowest fifth 21,831 341 1.6 Middle three-fifths 65,489 1,379 2.1 Highest fifth 21,828 608 2.8
Household below poverty line 13,320 187 1.4
Household composition Two-parent household 25,987 581 2.2 Single mother with children 9,445 199 2.1 Single father with children 2,277 ‡ † Other family with children 1,326 ‡ † Single male 12,448 137 1.1 Single female 16,518 387 2.3 Other household without children 41,147 955 2.3
Ages within household Under 18 39,036 849 2.2 18-64 91,907 1,890 2.1 65 and older 24,861 625 2.5
Households with college student 7,654 239 3.1
Households with college or University library user 11,289 507 4.5
Households with homemaker without outside employment 13,027 276 2.1
Households with retired person 24,581 671 2.7
Households with disabled person 9,689 188 1.9‡ Reporting standards not met.† Not applicable.
Households that used a public library in the past month to attend a lecture,
meeting, or discussion group
SOURCE: U.S. Department of Commerce, Bureau of the Census, Current Population Survey (CPS), October Supplement, "Household Use of Public Libraries", 2002.
[Numbers in thousands]
30

Table 20. Number and percent of households with children under age 18 that used a public library or bookmobile for an activity for children under age 13, for teenagers Table 20. ages 13 to 18, or for a school or class assignment, or used a school library in the past month, by selected household characteristics: October 2002
Household characteristic Number Percent Number Percent Number Percent Number Percent
All 39,036 3,871 9.9 1,170 3.0 8,687 22.3 18,775 48.1
Distance from public library Less than 1 mile 8,608 1,057 12.3 311 3.6 2,326 27.0 3,867 44.9 1-2 miles 11,584 1,229 10.6 373 3.2 2,853 24.6 5,577 48.1 3-5 miles 11,994 1,114 9.3 318 2.7 2,406 20.1 5,822 48.5 6-10 miles 4,458 351 7.9 120 2.7 799 17.9 2,244 50.3 More than 10 miles 2,392 120 5.0 ‡ † 302 12.6 1,265 52.9
Geographic region Northeast 7,010 828 11.8 210 3.0 1,682 24.0 3,296 47.0 Midwest 8,756 922 10.5 231 2.6 2,215 25.3 4,764 54.4 South 14,192 1,226 8.6 363 2.6 2,666 18.8 6,580 46.4 West 9,077 896 9.9 366 4.0 2,124 23.4 4,136 45.6
Metropolitan status Unclassified 84 ‡ † ‡ † ‡ † 53 63.2 City center 8,961 903 10.1 388 4.3 2,160 24.1 3,681 41.1 Metropolitan, not city center 23,032 2,374 10.3 627 2.7 5,369 23.3 11,407 49.5 Non_Metropolitan 6,959 588 8.5 153 2.2 1,137 16.3 3,634 52.2
Race/ethnicity White, non-hispanic 23,708 2,242 9.5 515 2.2 5,166 21.8 12,278 51.8 Black, non-hispanic 5,458 630 11.6 230 4.2 1,368 25.1 2,262 41.4 Hispanic 5,106 494 9.7 216 4.2 1,027 20.1 2,096 41.1 Asian/pacific islander 1,431 170 11.9 104 7.2 377 26.3 584 40.8 Other 217 ‡ † ‡ † 37 16.9 106 48.7 Mixed race/ethnicity 3,116 316 10.1 101 3.2 712 22.8 1,449 46.5
Highest Education in the household Less than high school 3,048 234 7.7 103 3.4 485 15.9 1,251 41.1 High school/GED 10,015 698 7.0 259 2.6 1,762 17.6 4,653 46.5 Some postsecondary 12,642 1,121 8.9 388 3.1 2,998 23.7 6,274 49.6 Baccalaureate 8,396 1,051 12.5 252 3.0 2,115 25.2 4,034 48.0 Advanced degree 4,935 767 15.5 167 3.4 1,326 26.9 2,563 51.9
Income level Lowest fifth 5,782 483 8.4 199 3.4 942 16.3 2,333 40.3 Middle three-fifths 23,591 2,293 9.7 654 2.8 5,171 21.9 11,326 48.0 Highest fifth 9,663 1,095 11.3 317 3.3 2,573 26.6 5,116 52.9
Households below poverty level 5,908 520 8.8 222 3.8 1,082 18.3 2,525 42.7
Household composition Two-parent household 25,987 2,813 10.8 786 3.0 6,009 23.1 12,915 49.7 Single mother with children 9,445 811 8.6 269 2.9 2,013 21.3 4,254 45.0 Single father with children 2,277 166 7.3 77 3.4 406 17.8 1,028 45.2 Other family with children 1,326 81 6.1 ‡ † 259 19.5 578 43.6
Households with homemaker 9,026 1,162 12.9 249 2.8 1,635 18.1 3,470 38.5‡ Reporting standards not met.† Not applicable.NOTE: Library types were not specifically defined in the survey. The determination of library types was made by survey respondents. See the glossary (appendix D) and the questionnaire (appendix C) for more details.
[Numbers in thousands]
SOURCE: U.S. Department of Commerce, Bureau of the Census, Current Population Survey (CPS), October Supplement, "Household Use of Public Libraries", 2002.
Households with
children under 18
Households that used a public libraryPrograms for children
under age 13Programs for teenagers
age 13-18 School assignment Used school library
31

Table 21. Number and percent of households that used a public library or bookmobile for a school or class assignment in the past month, by selected household Table 21. characteristics: October 2002
Household characteristic Total households Number Percent
All 109,148 10,670 9.8
Geographic region Northeast 20,396 2,014 9.9 Midwest 25,205 2,681 10.6 South 39,678 3,241 8.2 West 23,869 2,735 11.5
Distance from library Less than 1 mile 24,769 2,845 11.5 1-2 miles 33,124 3,494 10.5 3-5 miles 32,291 3,017 9.3 6-10 miles 12,250 941 7.7 More than 10 miles 6,713 372 5.5
Metropolitan status Unclassified 242 ‡ † City center 27,025 2,816 10.4 Metropolitan, not city center 61,086 6,470 10.6 Non_Metropolitan 20,795 1,361 6.5
Race/ethnicity White, non-hispanic 77,757 6,488 8.3 Black, non-hispanic 12,981 1,651 12.7 Hispanic 9,165 1,187 13 Asian/pacific islander 3,223 463 14.4 Other 484 48 9.9 Mixed race/ethnicity 5,538 833 15
Highest education level in household Less than high school 10,584 514 4.9 High school/GED 29,576 1,930 6.5 Some postsecondary 32,616 3,853 11.8 Baccalaureate 22,512 2,674 11.9 Advanced degree 13,860 1,697 12.2
Family income Lowest fifth 21,831 1,337 6.1 Middle three-fifths 65,489 6,291 9.6 Highest fifth 21,828 3,042 13.9
Household below poverty line 13,320 1,307 9.8
Household composition Two-parent household 25,987 6,009 23.1 Single mother with children 9,445 2,013 21.3 Single father with children 2,277 406 17.8 Other family with children 1,326 259 19.5 Single male 12,448 136 1.1 Single female 16,518 275 1.7 Other household without children 41,147 1,572 3.8
Ages within household Under 18 39,036 8,687 22.3 18-64 91,907 10,609 11.5 65 and older 24,861 538 2.2
Households with high school student 8,376 2,638 31.5
Households with college student 7,654 2,079 27.2
Households with school library user 20,878 5,797 27.8
Households with college or University library user 11,289 2,972 26.3‡ Reporting standards not met.† Not applicable.
Households that used a public library for a school or class assignment
SOURCE: U.S. Department of Commerce, Bureau of the Census, Current Population Survey (CPS), October Supplement, "Household Use of Public Libraries", 2002.
[Numbers in thousands]
32

Table 22. Number and percent of households that used a public library or bookmobile in the past month to use a computer or the Internet, or to learn how to use a
Household characteristic Total households Number Percent Number Percent
All 109,148 9,677 8.9 1,749 1.6
Geographic region Northeast 20,396 1,721 8.4 358 1.8 Midwest 25,205 2,496 9.9 410 1.6 South 39,678 3,107 7.8 556 1.4 West 23,869 2,352 9.9 425 1.8
Metropolitan status Unclassified 242 ‡ † ‡ † City center 27,025 2,708 10 573 2.1 Metropolitan, not city center 61,086 5,554 9.1 938 1.5 Non_Metropolitan 20,795 1,397 6.7 233 1.1
Race/ethnicity White, non-hispanic 77,757 5,860 7.5 875 1.1 Black, non-hispanic 12,981 1,680 12.9 342 2.6 Hispanic 9,165 1,056 11.5 330 3.6 Asian/pacific islander 3,223 348 10.8 86 2.7 Other 484 54 11.1 ‡ † Mixed race/ethnicity 5,538 679 12.3 109 2
Highest Education in the household Less than high school 10,584 512 4.8 173 1.6 High school/GED 29,576 2,003 6.8 450 1.5 Some postsecondary 32,616 3,268 10 551 1.7 Baccalaureate 22,512 2,354 10.5 334 1.5 Advanced degree 13,860 1,540 11.1 241 1.7
Family income Lowest fifth 21,831 1,624 7.4 373 1.7 Middle three-fifths 65,489 5,927 9.1 1,119 1.7 Highest fifth 21,828 2,125 9.7 257 1.2
Household below poverty line 13,320 1,381 10.4 355 2.7
Household composition Two-parent household 25,987 3,707 14.3 688 2.6 Single mother with children 9,445 1,616 17.1 322 3.4 Single father with children 2,277 305 13.4 61 2.7 Other family with children 1,326 138 10.4 ‡ † Single male 12,448 576 4.6 76 0.6 Single female 16,518 697 4.2 131 0.8 Other household without children 41,147 2,637 6.4 447 1.1
Households with high school student 8,376 1,502 17.9 295 3.5
Households with college student 7,654 1,232 16.1 162 2.1
Households with disabled person 9,689 834 8.6 177 1.8
Household with retired person 24,581 1,009 4.1 214 0.9
Households with job-seeker 6,893 1,181 17.1 241 3.5‡ Reporting standards not met.† Not applicable.
Table 22. computer or the Internet, by selected household characteristics: October 2002[Numbers in thousands]
Households that used a public library to use a computer or the Internet
Households that used a public library to learn how to use a computer or the Internet
SOURCE: U.S. Department of Commerce, Bureau of the Census, Current Population Survey (CPS), October Supplement, "Household Use of Public Libraries", 2002.
33

Table 23. Number and percent of households that used a public library or bookmobile in the past month to get information to help find a job, by selected household Table 23. characteristics: October 2002
Household characteristic Total households Number Percent
All 109,148 2,057 1.9
Region Northeast 20,396 382 1.9 Midwest 25,205 522 2.1 South 39,678 582 1.5 West 23,869 570 2.4
Distance from library Less than 1 mile 24,769 620 2.5 1-2 miles 33,124 625 1.9 3-5 miles 32,291 601 1.9 6-10 miles 12,250 164 1.3 More than 10 miles 6,713 ‡ †
Metro Unclassified 242 ‡ † City center 27,025 671 2.5 Metropolitan, not city center 61,086 1,134 1.9 Non_Metropolitan 20,795 249 1.2
Highest education level in household Less than high school 10,584 103 1 High school/GED 29,576 433 1.5 Some postsecondary 32,616 686 2.1 Baccalaureate 22,512 545 2.4 Advanced degree 13,860 289 2.1
Family income Lowest fifth 21,831 433 2 Middle three-fifths 65,489 1,216 1.9 Highest fifth 21,828 408 1.9
Households below poverty line1 13,320 392 2.9
Household composition Two-parent household 25,987 540 2.1 Single mother with children 9,445 294 3.1 Single father with children 2,277 ‡ † Other family with children 1,326 ‡ † Single male 12,448 183 1.5 Single female 16,518 211 1.3 Other household without children 41,147 737 1.8
Ages within household Under 18 39,036 925 2.4 18-64 91,907 2,017 2.2 65 and older 24,861 152 0.6
Households with job-seeker 6,893 699 10.1
Households with retired person 24,581 161 0.7‡ Reporting standards not met.† Not applicable.
Households that used public library to get information to help find a job
SOURCE: U.S. Department of Commerce, Bureau of the Census, Current Population Survey (CPS), October Supplement, "Household Use of Public Libraries", 2002.
1 Poverty status is derived from household size and income. Households with incomes below the poverty threshold for their household size (as defined by the U.S. Census Bureau) were classified as poor. Some households reported income in a range that straddles the poverty threshold; these households were classified as poor. The 2002 poverty threshold for a family of three persons including one related child was $14,480.
[Numbers in thousands]
34

Table 24. Number and percent of households with employed people that used a public library or bookmobile for a work assignment or to keep up to date at work, or
Household characteristic Number Percent Number Percent
All 40,408 1,243 3.1 2,570 6.4
Geographic region Northeast 7,579 241 3.2 499 6.6 Midwest 9,724 323 3.3 585 6 South 14,307 377 2.6 830 5.8 West 8,798 302 3.4 657 7.5
Distance from library Less than 1 mile 8,911 330 3.7 614 6.9 1-2 miles 12,123 381 3.1 782 6.5 3-5 miles 12,224 373 3.1 808 6.6 6-10 miles 4,652 92 2 258 5.5 More than 10 miles 2,498 67 2.7 109 4.3
Metropolitan status Unclassified 93 ‡ † ‡ † City center 10,544 387 3.7 821 7.8 Metropolitan, not city center 22,660 714 3.2 1,435 6.3 Non_Metropolitan 7,111 139 1.9 311 4.4
Highest education level in household Less than high school 2,056 ‡ † ‡ † High school/GED 9,946 130 1.3 87 0.9 Some postsecondary 12,762 284 2.2 462 3.6 Baccalaureate 9,791 443 4.5 890 9.1 Advanced degree 5,853 372 6.4 1,123 19.2
Family income Lowest fifth 4,647 100 2.1 103 2.2 Middle three-fifths 26,418 792 3 1,428 5.4 Highest fifth 9,343 351 3.8 1,040 11.1
Household below poverty line 2,334 ‡ † 52 2.2
Household with business or farm 6,352 251 4 397 6.3
Household occupation group Managerial and professional specialty 16,668 806 4.8 1,979 11.9 Technical, sales, and administrative support 11,715 255 2.2 425 3.6 Service 4,832 80 1.7 88 1.8 Precision production, craft, and repair 3,158 ‡ † ‡ † Operators, fabricators, and laborers 3,375 ‡ † ‡ † Farming, fishing, and forestry 660 ‡ † ‡ †‡ Reporting standards not met.† Not applicable.
Table 24. who used a work library, by selected household characteristics: October 2002[Numbers in thousands]
Households that used a public library for work-related research Households that used a work library
SOURCE: U.S. Department of Commerce, Bureau of the Census, Current Population Survey (CPS), October Supplement, "Household Use of Public Libraries", 2002.
Households with employed people
35

Table 25. Number and percent of households that used a public library or bookmobile in the past month to get information for personal use; or to borrow books, Table 25. CD ROMs, tapes; or for another reason, by selected household characteristics: October 2002
Household characteristicTotal
households Number Percent Number Percent Number Percent
All 109,148 9,355 8.6 28,871 26.5 2,345 2.1
Race/ethnicity White, non-hispanic 77,757 6,961 9.0 20,817 26.8 1,679 2.2 Black, non-hispanic 12,981 1,012 7.8 3,006 23.2 246 1.9 Hispanic 9,165 474 5.2 2,108 23.0 163 1.8 Asian/pacific islander 3,223 253 7.9 1,042 32.3 67 2.1 Other 484 41 8.5 100 20.7 ‡ † Mixed race/ethnicity 5,538 613 11.1 1,799 32.5 176 3.2
Family income Lowest fifth 21,831 1,258 5.8 3,760 17.2 373 1.7 Middle three-fifths 65,489 5,478 8.4 17,330 26.5 1,376 2.1 Highest fifth 21,828 2,619 12.0 7,782 35.6 596 2.7
Households below poverty level 13,320 834 6.3 2,717 20.4 239 1.8
Household composition Two-parent household 25,987 2,936 11.3 11,555 44.5 687 2.6 Single mother with children 9,445 843 8.9 3,431 36.3 203 2.1 Single father with children 2,277 167 7.3 697 30.6 ‡ † Other family with children 1,326 104 7.8 415 31.3 ‡ † Single male 12,448 722 5.8 1,375 11.0 229 1.8 Single female 16,518 1,064 6.4 2,686 16.3 356 2.2 Other household without children 41,147 3,520 8.6 8,713 21.2 776 1.9
Ages within household Under 18 39,036 4,049 10.4 16,098 41.2 985 2.5 18-64 91,907 8,367 9.1 26,005 28.3 2,033 2.2 65 and older 24,861 1,525 6.1 4,635 18.6 444 1.8
Household occupation group Unclassified 24,011 1,446 6.0 4,073 17.0 452 1.9 Managerial and professional specialty 33,981 4,158 12.2 12,060 35.5 1,020 3.0 Technical, sales, and administrative support 24,352 2,066 8.5 6,731 27.6 458 1.9 Service 10,488 713 6.8 2,614 24.9 177 1.7 Precision production, craft, and repair 7,009 436 6.2 1,495 21.3 105 1.5 Operators, fabricators, and laborers 7,849 459 5.9 1,654 21.1 128 1.6 Farming, fishing, and forestry 1,443 76 5.3 244 16.9 ‡ † Armed forces ‡ . ‡ † .
Households with homemaker 13,027 1,203 9.2 4,317 33.1 277 2.1‡ Reporting standards not met.† Not applicable.1 Information for personal use includes information on consumer or health issues, and investmentsSOURCE: U.S. Department of Commerce, Bureau of the Census, Current Population Survey (CPS), October Supplement, "Household Use of Public Libraries", 2002.
[Numbers in thousands]
Households that used a public library to get
information for personal use1Households that used a public
library to borrow materials
Households that used a public library for
another reason
36

Table 26. Number and percent of households with members age 55 or older, that used a public library or bookmobile in the past month for an activity for people age 55 Table 26. or older, by selected household characteristics: October 2002
Household characteristic Number Percent
All 41,144 941 2.3
Geographic region Northeast 8,422 206 2.4 Midwest 9,363 238 2.5 South 15,080 302 2 West 8,279 196 2.4
Distance from library Less than 1 mile 9,509 285 3 1-2 miles 12,939 311 2.4 3-5 miles 11,556 227 2 6-10 miles 4,551 77 1.7 More than 10 miles 2,589 ‡ †
Metropolitan status Unclassified 111 ‡ † City center 9,240 212 2.3 Metropolitan, not city center 22,754 576 2.5 Non_Metropolitan 9,039 150 1.7
Race/ethnicity White, non-hispanic 32,236 767 2.4 Black, non-hispanic 4,080 104 2.5 Hispanic 2,452 ‡ † Asian/pacific islander 989 ‡ † Other 161 ‡ † Mixed race/ethnicity 1,225 ‡ †
Highest education level in household Less than high school 5,968 ‡ † High school/GED 12,765 145 1.1 Some postsecondary 10,641 275 2.6 Baccalaureate 6,543 233 3.6 Advanced degree 5,227 249 4.8
Family income Lowest fifth 10,481 178 1.7 Middle three-fifths 24,109 611 2.5 Highest fifth 6,554 152 2.3
Household below poverty line 4,765 62 1.3
Household composition Two-parent household 2,031 ‡ † Single mother with children 1,023 ‡ † Single father with children 236 ‡ † Other family with children 667 ‡ † Single male 4,254 64 1.5 Single female 10,066 231 2.3 Other household without children 22,868 589 2.6
Ages within household Under 18 3,957 ‡ † 18-64 23,938 473 2 65 and older 24,861 633 2.5
Households with a disabled person 5,885 124 2.1
Households with retired person 23,835 664 2.8‡ Reporting standards not met.† Not applicable.
Households with members age 55 or older that used a public library in the past month for a program or activity for people age 55 or older
Number of households with membersage 55 or older
SOURCE: U.S. Department of Commerce, Bureau of the Census, Current Population Survey (CPS), October Supplement, "Household Use of Public Libraries", 2002.
[Numbers in thousands]
37

Table 27. Number and percent of households with a disabled person that reported barriers to their use of the public library or bookmobile, by selected household Table 27. characteristics: October 2002
Household characteristic Number Percent
All 9,689 1,633 16.9
Geographic region Northeast 1,808 286 15.8 Midwest 2,227 319 14.3 South 3,664 651 17.8 West 1,990 377 18.9
Distance from library Less than 1 mile 2,403 414 17.2 1-2 miles 2,914 521 17.9 3-5 miles 2,610 407 15.6 6-10 miles 1,099 170 15.5 More than 10 miles 663 122 18.3
Metropolitan status Unclassified ‡ ‡ † City center 2,405 475 19.7 Metropolitan, not city center 5,133 835 16.3 Non_Metropolitan 2,129 320 15
Race/ethnicity White, non-hispanic 7,024 1,127 16 Black, non-hispanic 1,312 232 17.7 Hispanic 584 123 21.1 Asian/pacific islander 158 ‡ † Other 53 ‡ † Mixed race/ethnicity 558 103 18.5
Highest Education in the household Less than high school 1,716 345 20.1 High school/GED 3,172 478 15.1 Some postsecondary 2,879 471 16.4 Baccalaureate 1,191 210 17.6 Advanced degree 731 130 17.7
Income level Lowest fifth 3,706 713 19.2 Middle three-fifths 5,093 783 15.4 Highest fifth 889 138 15.5
Households below poverty level 2,438 448 18.4
Ages within household Under 18 2,314 334 14.4 18-64 7,059 1,103 15.6 65 and older 4,048 767 18.9‡ Reporting standards not met.† Not applicable.
[Numbers in thousands]
Households with a disabled person that reported barriers to their use of the public library
SOURCE: U.S. Department of Commerce, Bureau of the Census, Current Population Survey (CPS), October Supplement, "Household Use of Public Libraries", 2002.NOTE: "Disabled" in this survey was defined as "a long-lasting physical, mental, or emotional condition, that limits participation in the activities done by most people."
Households with a disabled person
38

A-1
Appendix A: Standard Error Tables


Table A-1. Standard errors for the number and percent of households that used a public library or bookmobile in the past month or year, or that used a school, college, Table A-1. university, or work library in the past month, by state: October 2002
Total numberof households Number Percent Number Percent Number Percent Number Percent Number Percent
United States 806.0 452.7 0.22 332.1 0.20 244.4 0.17 168.9 0.13 105.6 0.09
Alabama 62.6 37.5 1.66 29.3 1.44 28.5 1.41 18.4 0.99 7.6 0.42Alaska 22.2 16.6 4.78 12.7 4.52 12.3 4.45 7.6 3.10 7.0 2.87Arizona 64.9 44.3 1.67 34.8 1.52 28.3 1.32 22.3 1.09 12.4 0.63Arkansas 48.6 29.5 2.14 22.6 1.83 19.6 1.65 14.8 1.29 8.5 0.77California 179.8 118.7 0.65 96.3 0.61 72.0 0.51 59.0 0.43 37.7 0.29
Colorado 60.8 43.9 1.77 34.8 1.68 26.2 1.40 21.5 1.19 15.5 0.89Connecticut 52.6 39.6 2.03 31.0 1.95 24.8 1.71 17.9 1.32 11.3 0.87Delaware 25.9 16.7 4.06 13.3 3.64 10.2 2.99 8.5 2.57 4.9 1.52District of Columbia 22.8 14.7 4.62 12.1 4.21 6.1 2.44 8.3 3.17 7.6 2.95Florida 123.8 80.1 0.90 64.9 0.83 45.8 0.65 33.0 0.49 20.1 0.30
Georgia 85.0 52.8 1.26 41.0 1.10 37.3 1.03 24.1 0.72 13.7 0.42Hawaii 30.1 20.7 3.55 16.9 3.31 12.9 2.77 10.1 2.26 6.8 1.57Idaho 33.3 23.4 3.21 17.4 2.86 15.5 2.65 10.6 1.95 7.0 1.32Illinois 103.5 71.6 1.07 60.3 1.02 45.3 0.86 33.2 0.67 19.9 0.42Indiana 73.4 52.8 1.48 43.8 1.43 31.7 1.17 20.1 0.79 12.7 0.52
Iowa 50.1 38.5 2.11 29.7 2.06 25.7 1.90 17.6 1.42 11.8 0.99Kansas 48.2 36.1 2.21 27.9 2.11 23.1 1.89 18.4 1.58 12.5 1.12Kentucky 61.0 37.5 1.72 29.6 1.51 26.4 1.39 18.3 1.02 9.5 0.55Louisiana 61.7 40.3 1.74 31.1 1.54 24.5 1.29 17.7 0.97 11.6 0.66Maine 33.7 23.1 3.17 18.2 2.89 15.9 2.65 11.2 2.00 8.2 1.50
Maryland 68.1 50.5 1.58 39.8 1.52 29.9 1.27 23.7 1.05 21.4 0.96Massachusetts 74.4 50.3 1.46 43.0 1.39 28.6 1.05 22.1 0.84 17.0 0.66Michigan 94.1 64.5 1.17 50.5 1.07 41.0 0.93 31.3 0.75 19.3 0.48Minnesota 64.8 49.7 1.64 37.6 1.58 32.5 1.46 22.6 1.10 14.3 0.73Mississippi 47.9 31.6 2.23 24.8 1.99 21.2 1.79 15.2 1.36 10.6 0.97
Missouri 70.5 50.7 1.54 40.1 1.45 28.6 1.15 22.2 0.93 11.6 0.51Montana 28.5 19.1 3.73 14.8 3.33 11.9 2.85 9.8 2.42 7.0 1.78Nebraska 37.9 27.1 2.83 21.0 2.62 19.6 2.51 13.2 1.86 10.2 1.47Nevada 40.7 29.0 2.64 23.1 2.47 19.0 2.19 13.1 1.61 7.9 1.02New Hampshire 32.6 22.6 3.28 18.1 3.03 14.9 2.68 9.8 1.89 6.9 1.36
New Jersey 83.4 59.8 1.31 48.4 1.25 36.2 1.04 24.6 0.75 18.3 0.57New Mexico 39.4 26.2 2.71 19.9 2.38 15.6 1.99 12.7 1.67 8.0 1.09New York 130.4 87.7 0.86 73.5 0.82 50.3 0.64 39.6 0.52 24.3 0.33North Carolina 84.2 55.0 1.29 42.0 1.14 32.8 0.95 23.6 0.71 17.0 0.53North Dakota 23.6 14.8 4.42 11.1 3.77 11.7 3.90 7.9 2.86 5.5 2.07
Ohio 101.0 75.4 1.08 61.2 1.06 42.7 0.86 31.7 0.67 20.0 0.44Oklahoma 54.8 35.1 1.94 27.4 1.71 22.9 1.50 18.0 1.23 11.1 0.78Oregon 54.4 39.2 1.98 32.1 1.89 24.1 1.58 17.8 1.23 11.1 0.80Pennsylvania 104.0 64.8 1.04 49.4 0.91 44.1 0.84 31.1 0.62 21.6 0.45Rhode Island 29.2 20.3 3.66 16.8 3.45 11.4 2.63 9.2 2.20 4.7 1.18
South Carolina 59.0 38.5 1.81 30.1 1.61 26.3 1.47 18.0 1.07 10.4 0.64South Dakota 25.0 17.4 4.27 13.8 3.93 11.1 3.41 8.2 2.64 5.2 1.76Tennessee 70.2 44.1 1.51 33.9 1.32 29.6 1.19 20.3 0.87 12.3 0.54Texas 138.5 85.0 0.80 64.4 0.70 63.9 0.69 40.4 0.48 26.6 0.33Utah 39.6 31.1 2.63 25.4 2.67 19.0 2.28 16.8 2.08 7.8 1.05
Vermont 23.1 16.4 4.62 13.5 4.39 10.2 3.66 7.8 2.95 5.3 2.07Virginia 79.8 54.9 1.37 44.8 1.28 29.8 0.96 22.9 0.76 19.5 0.66Washington 72.5 53.8 1.49 42.4 1.43 32.2 1.21 24.4 0.96 17.8 0.73West Virginia 40.5 24.5 2.55 19.1 2.21 15.8 1.91 9.9 1.26 6.5 0.84Wisconsin 68.7 50.5 1.57 39.6 1.50 31.6 1.30 21.4 0.95 14.2 0.65Wyoming 20.9 15.8 5.05 12.6 4.90 9.8 4.21 6.3 2.91 5.4 2.56
College or
State
[Numbers in thousands]
Public libraryUsed a public library
Used in the past month
SOURCE: U.S. Department of Commerce, Bureau of the Census, Current Population Survey (CPS), October Supplement, "Household Use of Public Libraries," 2002.
School library university library Work libraryin the past year
A-3

Table A-2. Standard errors for the number and percent of households that used a public library or bookmobile in the past year, by distance from library and state: Table A-2. October 2002
Total number of households
Number of households
Percent that used a public library
Number of households
Percent that used a public library
Number of households
Percent that used a public library
United States 806.0 272.5 0.46 330.1 0.40 324.5 0.41
Alabama 62.6 20.8 5.05 30.7 3.38 35.6 2.91Alaska 22.2 10.5 9.80 10.4 10.14 12.2 8.75Arizona 64.9 24.7 4.27 32.4 3.30 40.0 2.67Arkansas 48.6 15.3 6.93 23.7 4.41 26.0 3.96California 179.8 82.6 1.32 103.0 1.07 90.7 1.21
Colorado 60.8 28.0 3.80 33.2 3.20 35.0 3.05Connecticut 52.6 25.5 4.11 35.2 3.02 26.2 4.03Delaware 25.9 9.0 11.40 14.9 6.99 15.4 6.92District of Columbia 22.8 17.1 6.24 13.0 7.70 7.2 14.37Florida 123.8 41.7 2.56 62.8 1.72 75.2 1.43
Georgia 85.0 24.9 4.24 36.8 2.91 49.6 2.14Hawaii 30.1 16.0 6.64 17.7 6.01 14.5 7.33Idaho 33.3 15.7 6.78 17.6 6.04 18.5 5.77Illinois 103.5 56.9 1.89 60.3 1.79 48.0 2.24Indiana 73.4 35.7 2.97 39.3 2.72 39.2 2.73
Iowa 50.1 28.1 3.62 26.5 3.94 24.8 4.28Kansas 48.2 26.9 3.88 25.5 4.18 23.9 4.43Kentucky 61.0 25.1 4.15 27.0 3.86 32.3 3.30Louisiana 61.7 25.7 4.15 31.5 3.40 33.5 3.14Maine 33.7 16.5 6.39 16.6 6.41 18.5 5.71
Maryland 68.1 28.7 3.67 40.1 2.62 38.4 2.78Massachusetts 74.4 39.7 2.69 49.4 2.17 34.0 3.14Michigan 94.1 41.8 2.56 53.0 2.03 54.4 1.98Minnesota 64.8 30.0 3.43 34.7 2.98 33.6 3.10Mississippi 47.9 13.5 7.87 23.4 4.55 26.5 4.02
Missouri 70.5 32.8 3.23 38.7 2.77 36.1 2.91Montana 28.5 14.5 7.34 12.8 8.29 15.1 7.05Nebraska 37.9 21.8 4.86 20.0 5.29 18.0 5.91Nevada 40.7 18.8 5.63 22.7 4.70 23.8 4.48New Hampshire 32.6 16.0 6.65 18.5 5.78 19.0 5.54
New Jersey 83.4 49.1 2.18 48.1 2.23 40.0 2.67New Mexico 39.4 17.2 6.17 20.2 5.27 19.7 5.40New York 130.4 86.8 1.26 66.2 1.63 54.4 1.98North Carolina 84.2 25.5 4.17 35.8 2.99 51.0 2.10North Dakota 23.6 13.8 7.69 11.7 8.98 8.8 11.91
Ohio 101.0 51.4 2.07 58.5 1.81 50.6 2.10Oklahoma 54.8 25.0 4.26 29.3 3.59 27.7 3.83Oregon 54.4 25.7 4.09 31.1 3.43 29.6 3.60Pennsylvania 104.0 51.3 2.09 55.5 1.93 54.4 1.92Rhode Island 29.2 16.0 6.67 17.8 5.98 15.0 7.10
South Carolina 59.0 19.7 5.41 28.2 3.78 34.6 3.08South Dakota 25.0 13.6 7.85 12.3 8.65 11.9 8.98Tennessee 70.2 21.3 4.93 30.1 3.55 39.9 2.68Texas 138.5 53.9 1.98 74.8 1.45 77.5 1.37Utah 39.6 19.9 4.84 23.4 4.44 21.0 5.04
Vermont 23.1 12.8 8.33 12.5 8.51 12.0 8.85Virginia 79.8 29.9 3.47 44.7 2.40 43.1 2.49Washington 72.5 35.0 2.96 36.4 2.89 40.7 2.62West Virginia 40.5 15.7 6.79 19.0 5.52 21.4 4.87Wisconsin 68.7 31.9 3.31 36.5 2.91 35.9 2.95Wyoming 20.9 11.6 9.02 11.1 9.50 10.0 10.57See notes at end of table.
State
[Numbers in thousands]
Distance from libraryLess than 1 mile 1–2 miles 3–5 miles
A-4

Table A-2. Standard errors for the number and percent of all households that used a public library or bookmobile in the past year, by distance from library and state: Table A-2. October 2002—Continued
StateTotal number of
householdsNumber of
householdsPercent that used a
public libraryNumber of
householdsPercent that used a
public library
United States 806.0 177.1 0.65 126.0 0.84
Alabama 62.6 27.5 3.77 20.6 4.46Alaska 22.2 8.6 12.36 7.1 15.05Arizona 64.9 24.0 4.32 16.7 6.23Arkansas 48.6 21.3 4.95 20.0 4.65California 179.8 45.3 2.30 25.3 4.04
Colorado 60.8 18.1 5.90 13.4 7.96Connecticut 52.6 11.0 9.71 ‡ ‡Delaware 25.9 10.0 9.77 5.3 19.90District of Columbia 22.8 † † † †Florida 123.8 45.9 2.23 28.6 3.69
Georgia 85.0 39.0 2.48 31.4 3.30Hawaii 30.1 8.5 12.50 6.6 13.50Idaho 33.3 12.6 8.32 6.8 15.72Illinois 103.5 24.7 4.25 19.6 4.56Indiana 73.4 25.5 4.18 14.8 7.18
Iowa 50.1 16.8 6.32 9.2 11.58Kansas 48.2 14.5 7.31 11.6 9.18Kentucky 61.0 24.6 4.14 25.2 3.84Louisiana 61.7 22.2 4.73 21.4 4.39Maine 33.7 12.9 8.22 8.6 11.75
Maryland 68.1 21.3 4.99 12.6 7.64Massachusetts 74.4 13.7 7.75 ‡ ‡Michigan 94.1 27.3 3.90 14.9 7.00Minnesota 64.8 21.5 4.97 20.3 5.23Mississippi 47.9 21.6 4.69 19.1 5.19
Missouri 70.5 23.0 4.61 20.7 5.04Montana 28.5 10.4 9.65 9.9 10.67Nebraska 37.9 11.5 9.07 9.5 10.85Nevada 40.7 11.6 9.17 8.2 13.00New Hampshire 32.6 8.5 12.50 ‡ ‡
New Jersey 83.4 16.2 6.38 ‡ ‡New Mexico 39.4 12.4 8.54 17.0 5.84New York 130.4 26.8 3.98 14.5 7.15North Carolina 84.2 39.1 2.69 27.8 3.73North Dakota 23.6 6.1 16.99 10.7 8.99
Ohio 101.0 27.7 3.84 17.4 6.13Oklahoma 54.8 19.3 5.39 18.4 5.52Oregon 54.4 16.9 6.18 11.1 9.15Pennsylvania 104.0 33.5 2.96 21.0 4.35Rhode Island 29.2 6.6 16.19 ‡ ‡
South Carolina 59.0 27.2 3.82 17.1 5.82South Dakota 25.0 7.4 14.37 9.6 10.57Tennessee 70.2 31.2 3.32 29.5 3.06Texas 138.5 42.7 2.39 34.7 2.70Utah 39.6 11.0 9.71 ‡ ‡
Vermont 23.1 7.0 15.05 ‡ ‡Virginia 79.8 31.7 3.34 20.1 4.88Washington 72.5 24.2 4.41 17.9 5.41West Virginia 40.5 18.0 5.46 15.4 5.58Wisconsin 68.7 25.7 4.16 17.2 5.99Wyoming 20.9 6.8 15.37 5.5 19.14† Not applicable‡ Reporting standards not met.
6–10 miles
[Numbers in thousands]
More than 10 milesDistance from library
SOURCE: U.S. Department of Commerce, Bureau of the Census, Current Population Survey (CPS), October Supplement, "Household Use of Public Libraries," 2002.
A-5

Table A-3. Standard errors for the number and percent of households that used a public library or bookmobile in the past year, by metropolitan status and state: Table A-3. October 2002
Total number Number of Number of Number ofof households households Number Percent households Number Percent households Number Percent
United States 806.0 288.4 177.2 0.44 510.7 315.0 0.30 285.7 173.8 0.61
Alabama 62.6 23.4 15.7 4.53 46.7 28.8 2.24 41.0 21.9 3.54Alaska 22.2 14.7 10.5 7.27 † † † 20.3 15.7 7.71Arizona 64.9 45.9 30.3 2.32 37.3 27.5 2.86 30.8 20.4 5.16Arkansas 48.6 17.6 10.9 5.92 28.6 17.9 3.65 42.5 25.3 3.61California 179.8 102.6 69.8 1.08 137.0 92.0 0.83 22.9 14.5 6.86
Colorado 60.8 28.8 20.8 3.70 48.7 36.1 2.19 25.6 16.5 6.17Connecticut 52.6 25.4 16.8 4.18 44.7 34.7 2.35 † † †Delaware 25.9 † † † 23.2 15.2 4.57 14.2 8.3 10.72District of Columbia 22.8 22.8 14.7 4.62 † † † † † †Florida 123.8 50.8 33.8 2.10 107.8 70.8 1.02 29.6 15.7 4.88
Georgia 85.0 21.4 12.8 4.78 67.9 45.4 1.59 54.2 28.4 2.65Hawaii 30.1 17.4 10.7 5.94 18.3 12.9 5.84 19.8 14.8 8.01Idaho 33.3 14.5 10.8 7.32 13.7 10.0 7.78 32.5 22.3 4.91Illinois 103.5 54.1 38.2 1.99 74.6 53.9 1.45 51.2 31.4 3.04Indiana 73.4 33.6 22.9 3.18 45.1 33.3 2.37 55.7 41.0 2.87
Iowa 50.1 13.7 11.3 7.24 31.3 24.3 3.34 44.3 33.7 3.57Kansas 48.2 24.2 16.9 4.42 28.9 23.0 3.56 36.2 26.8 4.40Kentucky 61.0 22.4 14.6 4.71 34.0 21.7 3.09 54.7 32.8 2.82Louisiana 61.7 29.2 18.8 3.61 45.8 31.4 2.34 34.4 20.1 4.42Maine 33.7 † † † 20.5 15.2 5.18 32.6 21.3 4.85
Maryland 68.1 23.4 14.6 4.46 61.0 46.6 1.74 † † †Massachusetts 74.4 36.8 21.6 2.77 61.7 43.1 1.75 20.5 16.6 7.43Michigan 94.1 41.8 27.4 2.55 75.7 53.3 1.44 41.0 27.7 3.90Minnesota 64.8 22.0 17.5 4.68 49.5 39.5 2.08 42.3 29.3 3.79Mississippi 47.9 15.0 11.0 7.07 22.6 15.9 4.73 48.0 30.6 3.28
Missouri 70.5 31.0 22.6 3.44 52.1 38.2 2.06 42.1 29.2 3.81Montana 28.5 † † † 13.6 9.7 7.83 30.6 20.2 5.19Nebraska 37.9 16.8 12.1 6.34 23.2 17.2 4.57 30.0 20.9 5.33Nevada 40.7 22.9 17.0 4.65 29.6 20.6 3.62 19.2 13.8 8.33New Hampshire 32.6 † † † 25.7 17.6 4.15 24.4 17.3 6.56
New Jersey 83.4 21.4 13.6 4.91 80.4 58.1 1.35 † † †New Mexico 39.4 20.6 14.8 5.17 20.4 12.7 5.11 32.3 21.4 4.92New York 130.4 87.4 53.2 1.22 82.8 63.1 1.30 46.8 31.3 3.41North Carolina 84.2 37.0 24.3 2.87 59.4 40.4 1.82 54.3 33.7 2.89North Dakota 23.6 † † † 15.7 10.3 6.74 21.5 12.9 7.13
Ohio 101.0 51.2 37.3 2.10 75.6 58.3 1.41 46.7 33.9 3.43Oklahoma 54.8 31.7 20.3 3.33 31.7 22.7 3.37 37.8 21.2 3.94Oregon 54.4 26.1 20.2 4.01 38.2 27.8 2.80 34.1 22.8 4.67Pennsylvania 104.0 43.6 28.1 2.43 84.2 53.5 1.28 46.6 27.1 3.26Rhode Island 29.2 18.0 12.1 5.89 20.7 14.7 5.15 † † †
South Carolina 59.0 14.6 10.4 7.29 48.2 33.0 2.23 36.8 20.4 4.02South Dakota 25.0 11.2 8.1 9.52 10.3 7.4 10.34 24.3 16.5 6.58Tennessee 70.2 36.8 24.0 2.88 44.0 31.2 2.44 47.7 23.7 2.90Texas 138.5 77.7 48.2 1.37 95.7 61.3 1.14 62.8 37.2 2.45Utah 39.6 18.7 15.4 5.33 29.5 23.2 3.52 22.6 16.8 7.05
Vermont 23.1 † † † 12.0 8.9 8.84 24.2 16.9 6.62Virginia 79.8 36.8 24.1 2.88 59.1 43.1 1.82 45.0 28.5 3.49Washington 72.5 33.1 25.8 3.15 53.6 40.9 1.98 41.8 28.1 3.81West Virginia 40.5 † † † 29.0 18.5 3.63 34.4 19.7 4.37Wisconsin 68.7 29.1 21.2 3.66 48.3 37.1 2.19 46.3 32.4 3.46Wyoming 20.9 † † † 11.7 8.5 9.11 21.3 16.3 7.41† Not applicable.
Non-metropolitan
State
SOURCE: U.S. Department of Commerce, Bureau of the Census, Current Population Survey (CPS), October Supplement, "Household Use of Public Libraries," 2002.
[Numbers in thousands]
Households that used public libraries in the past
year
Households that used public libraries in the past
year
Households that used public libraries in the past
year
Metropolitan statusCity center Metropolitan, not city center
A-6

Table A-4. Standard errors for the number and percent of households that used a public library or bookmobile in the past year, by household composition and state: Table A-4. October 2002
Total number Number of Number ofof households households Number Percent households Number Percent
United States 806.0 281.1 222.4 0.42 152.5 115.3 0.73
Alabama 62.6 28.5 22.4 3.64 19.9 13.8 5.35Alaska 22.2 11.7 10.0 8.05 6.4 4.9 16.49Arizona 64.9 33.1 26.1 3.13 19.7 14.8 5.37Arkansas 48.6 23.3 17.7 4.53 12.7 7.8 8.13California 179.8 87.7 71.3 1.17 46.9 36.1 2.25
Colorado 60.8 29.5 25.0 3.26 15.6 11.9 6.74Connecticut 52.6 25.9 22.6 3.49 16.7 14.9 5.14Delaware 25.9 12.3 9.6 8.47 8.3 5.8 12.89District of Columbia 22.8 6.1 5.1 16.17 7.2 5.0 14.76Florida 123.8 54.6 44.1 1.87 35.4 26.9 2.99
Georgia 85.0 40.0 30.6 2.64 27.2 20.4 3.90Hawaii 30.1 14.7 12.7 6.28 8.1 7.0 11.28Idaho 33.3 17.1 13.9 5.90 9.7 7.4 10.86Illinois 103.5 49.1 41.4 1.98 29.6 23.8 3.45Indiana 73.4 34.6 30.2 2.64 20.8 17.4 4.68
Iowa 50.1 25.3 22.3 3.50 14.0 12.1 6.62Kansas 48.2 24.0 21.2 3.70 12.7 10.4 7.86Kentucky 61.0 27.7 21.4 3.78 16.9 13.0 6.20Louisiana 61.7 27.9 22.8 3.61 20.2 14.0 5.29Maine 33.7 15.9 13.5 6.02 7.6 6.1 13.34
Maryland 68.1 32.4 28.3 2.79 18.4 16.2 4.87Massachusetts 74.4 34.0 29.4 2.73 21.3 16.4 4.93Michigan 94.1 45.5 39.3 2.05 26.8 20.8 3.90Minnesota 64.8 33.0 28.9 2.74 15.3 13.1 6.14Mississippi 47.9 21.7 18.1 4.52 16.7 13.3 6.16
Missouri 70.5 31.6 27.4 2.92 20.3 17.0 4.81Montana 28.5 12.6 10.5 7.80 7.3 5.8 14.03Nebraska 37.9 19.0 16.6 4.76 9.9 8.0 10.27Nevada 40.7 21.0 17.0 4.82 11.7 8.9 8.99New Hampshire 32.6 16.3 13.7 5.93 8.5 7.0 11.72
New Jersey 83.4 43.8 37.2 2.19 23.8 17.7 4.46New Mexico 39.4 18.4 15.1 5.44 11.3 7.8 9.44New York 130.4 58.0 49.3 1.66 38.5 30.1 2.71North Carolina 84.2 38.2 31.3 2.63 24.5 18.9 4.28North Dakota 23.6 10.9 8.8 9.31 6.1 4.5 17.42
Ohio 101.0 46.0 41.3 1.84 29.9 25.3 3.22Oklahoma 54.8 25.5 19.9 4.09 14.5 10.7 7.31Oregon 54.4 26.4 22.2 3.68 15.4 13.0 6.26Pennsylvania 104.0 46.8 37.6 2.19 28.9 21.5 3.68Rhode Island 29.2 12.7 11.2 6.92 8.7 7.2 11.38
South Carolina 59.0 27.0 22.5 3.64 18.0 12.7 5.91South Dakota 25.0 12.0 10.3 7.86 6.6 5.4 15.25Tennessee 70.2 34.7 27.8 2.96 20.8 15.8 5.07Texas 138.5 69.5 53.2 1.53 41.3 28.7 2.60Utah 39.6 23.1 20.6 3.75 10.2 8.3 9.92
Vermont 23.1 11.1 10.0 7.60 6.3 5.2 15.66Virginia 79.8 37.9 31.2 2.64 22.2 18.0 4.57Washington 72.5 34.3 29.2 2.78 19.9 16.6 4.94West Virginia 40.5 17.9 13.5 5.89 9.7 7.4 10.84Wisconsin 68.7 32.6 27.6 2.96 18.3 15.9 5.02Wyoming 20.9 9.8 8.9 8.24 6.3 5.2 15.59
Two-parent household Single mother household
State
Households that used public libraries in the past year
Households that used public libraries in the past year
See Notes at end of table.
[Numbers in thousands]
Households with children
A-7

Table A-4. Standard errors for the number and percentage of households that used a public library or bookmobile in the past year, by household composition andTable A-4. state: October 2002—Continued
Total number Number of Number of Number ofof households households Number Percent households Number Percent households Number Percent
United States 806.0 211.5 114.0 0.54 178.7 89.4 0.59 383.3 216.8 0.35
Alabama 62.6 23.7 10.8 3.66 20.4 9.4 4.26 38.4 20.5 2.52Alaska 22.2 7.3 4.3 13.81 8.1 5.1 12.87 12.7 9.3 8.37Arizona 64.9 23.1 14.1 4.48 21.1 11.9 4.73 38.7 25.4 2.74Arkansas 48.6 20.5 10.3 4.51 15.9 7.6 5.68 29.6 17.3 3.42California 179.8 60.4 34.4 1.68 53.6 27.1 1.76 103.9 65.3 1.05
Colorado 60.8 21.2 13.0 4.88 21.6 14.2 4.89 38.0 26.0 2.81Connecticut 52.6 19.5 11.6 5.22 17.7 11.0 5.88 31.7 22.8 3.37Delaware 25.9 10.1 5.5 9.57 8.1 3.9 11.17 16.1 9.8 6.38District of Columbia 22.8 11.6 7.2 8.97 10.5 6.1 9.55 12.8 8.0 8.13Florida 123.8 48.0 28.4 2.14 41.8 20.5 2.20 74.4 46.2 1.43
Georgia 85.0 29.5 16.2 3.33 28.6 12.3 2.90 52.3 29.8 1.94Hawaii 30.1 12.0 6.1 7.79 9.9 5.4 9.87 18.3 10.9 5.61Idaho 33.3 12.6 8.0 8.31 10.6 5.7 9.09 20.2 13.3 5.25Illinois 103.5 39.1 22.4 2.58 35.1 20.3 2.88 61.5 40.2 1.74Indiana 73.4 29.6 17.2 3.42 24.0 14.2 4.26 44.7 30.6 2.40
Iowa 50.1 20.4 13.4 5.18 16.3 10.3 6.41 29.8 22.0 3.58Kansas 48.2 18.7 12.6 5.69 17.0 10.6 6.13 28.9 20.2 3.69Kentucky 61.0 24.3 11.4 3.64 21.5 8.3 3.53 37.7 22.6 2.72Louisiana 61.7 25.3 12.9 3.72 19.0 9.2 4.77 37.5 23.4 2.79Maine 33.7 13.4 8.5 7.78 11.6 6.5 8.54 21.7 13.6 4.82
Maryland 68.1 30.0 18.3 3.45 20.4 13.1 5.15 40.7 29.3 2.63Massachusetts 74.4 31.6 17.3 3.10 23.9 12.4 3.97 45.5 28.9 2.32Michigan 94.1 36.4 19.7 2.69 33.0 16.4 2.80 55.3 36.0 1.93Minnesota 64.8 23.8 17.1 4.49 22.1 15.1 4.83 40.1 28.7 2.67Mississippi 47.9 17.8 9.5 5.40 14.0 5.7 5.66 30.0 18.3 3.44
Missouri 70.5 29.3 18.0 3.55 24.4 13.9 4.12 42.6 29.8 2.52Montana 28.5 10.9 6.5 9.34 9.9 5.6 9.99 18.7 11.4 5.50Nebraska 37.9 14.6 8.5 6.93 13.0 7.2 7.54 23.1 15.5 4.61Nevada 40.7 13.7 8.2 7.49 14.0 8.6 7.39 24.6 16.9 4.34New Hampshire 32.6 12.4 7.7 8.42 11.0 5.8 8.69 20.3 12.6 5.12
New Jersey 83.4 30.4 18.5 3.39 27.0 14.9 3.63 49.0 33.8 2.19New Mexico 39.4 14.9 8.3 6.61 13.9 7.2 6.81 23.7 15.0 4.42New York 130.4 51.9 28.7 1.92 42.1 23.4 2.36 76.6 49.5 1.41North Carolina 84.2 31.7 17.6 3.13 29.6 15.1 3.17 51.1 31.4 2.05North Dakota 23.6 10.1 5.3 9.41 8.7 4.0 9.92 14.4 8.2 6.98
Ohio 101.0 39.6 27.7 2.71 31.8 19.8 3.29 61.2 43.0 1.77Oklahoma 54.8 23.7 12.8 4.11 18.3 9.5 5.21 33.3 20.5 3.13Oregon 54.4 20.5 12.8 5.08 17.8 9.9 5.56 33.9 23.2 3.15Pennsylvania 104.0 41.1 20.4 2.26 35.5 16.5 2.49 63.4 37.3 1.63Rhode Island 29.2 12.3 6.8 7.95 10.4 5.7 9.40 18.1 11.8 5.85
South Carolina 59.0 22.3 13.6 4.63 19.0 9.3 4.82 37.7 22.3 2.71South Dakota 25.0 10.1 6.1 10.12 8.1 3.8 10.86 15.9 10.4 6.67Tennessee 70.2 25.4 13.1 3.72 23.7 10.1 3.48 43.0 23.6 2.30Texas 138.5 46.0 23.3 2.05 43.4 20.2 2.05 78.4 44.6 1.31Utah 39.6 12.2 8.1 8.71 11.0 5.6 8.46 24.4 18.5 4.33
Vermont 23.1 9.9 6.0 10.43 7.7 4.7 13.52 14.0 8.9 7.47Virginia 79.8 30.7 20.5 3.46 24.7 13.4 3.96 49.8 31.3 2.11Washington 72.5 27.6 19.2 3.87 23.6 13.2 4.21 44.6 32.4 2.40West Virginia 40.5 16.9 7.8 5.17 12.9 5.9 6.73 26.5 15.4 3.83Wisconsin 68.7 24.7 15.2 4.19 24.4 14.7 4.21 43.3 31.6 2.47Wyoming 20.9 8.0 5.6 13.28 7.5 4.3 13.32 13.0 9.3 8.20
Other households without childrenSingle female householdHouseholds that used
public libraries in the past year
SOURCE: U.S. Department of Commerce, Bureau of the Census, Current Population Survey (CPS), October Supplement, "Household Use of Public Libraries," 2002.
Single male householdHouseholds without children
Households that used public libraries in the past year
Households that used public libraries in the past year
State
[Numbers in thousands]
A-8

Table A-5. Standard errors for the number and percent of households with a homemaker that used a public library or bookmobile in the past year, by state: Table A-5. October 2002
Total number Number of of households households Number Percent
United States 806.0 183.6 128.3 0.64
Alabama 62.6 22.2 15.4 4.80Alaska 22.2 7.9 6.4 12.83Arizona 64.9 24.0 16.1 4.43Arkansas 48.6 15.1 9.1 6.76California 179.8 63.3 46.7 1.70
Colorado 60.8 21.6 16.0 4.92Connecticut 52.6 15.8 12.7 6.44Delaware 25.9 8.1 5.4 13.09District of Columbia 22.8 5.7 4.1 18.54Florida 123.8 39.7 27.4 2.69
Georgia 85.0 31.2 21.4 3.42Hawaii 30.1 9.7 6.9 11.03Idaho 33.3 11.3 7.9 9.43Illinois 103.5 34.4 25.8 3.09Indiana 73.4 23.7 19.0 4.31
Iowa 50.1 12.1 10.2 8.00Kansas 48.2 14.2 11.3 7.21Kentucky 61.0 21.1 14.6 5.04Louisiana 61.7 24.8 16.8 4.30Maine 33.7 8.9 6.8 11.84
Maryland 68.1 20.1 15.6 5.19Massachusetts 74.4 23.5 18.5 4.40Michigan 94.1 32.2 25.6 3.20Minnesota 64.8 16.5 13.2 6.19Mississippi 47.9 15.1 9.9 7.01
Missouri 70.5 20.0 16.5 4.96Montana 28.5 6.7 4.4 15.68Nebraska 37.9 10.2 8.4 9.76Nevada 40.7 14.6 11.4 7.14New Hampshire 32.6 8.9 7.3 11.22
New Jersey 83.4 29.3 22.2 3.61New Mexico 39.4 13.4 8.4 7.79New York 130.4 44.1 32.2 2.43North Carolina 84.2 27.9 19.3 3.83North Dakota 23.6 5.3 3.1 18.98
Ohio 101.0 30.7 22.9 3.46Oklahoma 54.8 17.0 11.8 6.26Oregon 54.4 17.0 13.1 6.16Pennsylvania 104.0 33.6 25.6 3.14Rhode Island 29.2 8.2 6.6 12.48
South Carolina 59.0 19.2 14.6 5.49South Dakota 25.0 5.7 4.4 18.38Tennessee 70.2 27.8 18.6 3.82Texas 138.5 51.3 31.9 2.05Utah 39.6 15.5 13.2 6.12
Vermont 23.1 6.0 4.8 16.91Virginia 79.8 27.0 20.1 3.93Washington 72.5 24.2 19.0 4.29West Virginia 40.5 16.3 10.1 6.33Wisconsin 68.7 18.4 14.7 5.57Wyoming 20.9 6.3 5.2 15.63SOURCE: U.S. Department of Commerce, Bureau of the Census, Current Population Survey (CPS), October Supplement, "Household Use of Public Libraries", 2002.
[Numbers in thousands]
Households that used public libraries in the past year
State
Presence of a homemaker
A-9

Table A-6. Standard errors for the number and percent of households with children under 18 that used a public library or bookmobile in the past year, by Table A-6. state: October 2002
Number Percent
United States 806.0 369.5 278.4 0.35
Alabama 62.6 37.2 27.8 2.86Alaska 22.2 14.5 12.0 6.81Arizona 64.9 40.6 31.0 2.60Arkansas 48.6 27.9 20.1 3.83California 179.8 106.0 84.5 1.00
Colorado 60.8 35.5 29.3 2.80Connecticut 52.6 32.1 27.9 2.86Delaware 25.9 15.5 11.7 6.79District of Columbia 22.8 10.5 7.9 10.08Florida 123.8 68.5 53.5 1.54
Georgia 85.0 50.5 38.1 2.11Hawaii 30.1 18.0 15.5 5.18Idaho 33.3 20.6 16.5 4.96Illinois 103.5 60.3 49.8 1.66Indiana 73.4 42.3 36.3 2.23
Iowa 50.1 30.1 26.5 2.95Kansas 48.2 28.6 24.8 3.24Kentucky 61.0 34.3 26.3 3.07Louisiana 61.7 36.4 28.4 2.87Maine 33.7 18.6 15.3 5.35
Maryland 68.1 39.4 34.0 2.36Massachusetts 74.4 41.8 34.8 2.36Michigan 94.1 54.9 46.2 1.78Minnesota 64.8 38.1 33.0 2.42Mississippi 47.9 29.2 23.2 3.53
Missouri 70.5 39.7 33.6 2.43Montana 28.5 15.5 12.8 6.43Nebraska 37.9 22.6 19.2 4.24Nevada 40.7 25.6 20.3 4.03New Hampshire 32.6 19.3 16.0 5.12
New Jersey 83.4 51.6 42.6 1.94New Mexico 39.4 23.7 18.4 4.41New York 130.4 73.5 60.1 1.38North Carolina 84.2 48.5 38.3 2.14North Dakota 23.6 13.1 10.3 7.91
Ohio 101.0 58.2 50.3 1.60Oklahoma 54.8 31.0 23.4 3.41Oregon 54.4 32.1 26.9 3.05Pennsylvania 104.0 57.5 45.2 1.82Rhode Island 29.2 16.2 13.8 5.86
South Carolina 59.0 33.8 26.5 3.08South Dakota 25.0 14.3 11.9 6.85Tennessee 70.2 42.0 33.1 2.47Texas 138.5 86.8 63.8 1.25Utah 39.6 26.3 22.9 3.47
Vermont 23.1 13.4 11.5 6.98Virginia 79.8 46.3 37.3 2.21Washington 72.5 42.6 35.6 2.30West Virginia 40.5 21.8 16.3 4.87Wisconsin 68.7 39.0 32.8 2.49Wyoming 20.9 12.1 10.6 7.47SOURCE: U.S. Department of Commerce, Bureau of the Census, Current Population Survey (CPS), October Supplement, "Household Use of Public Libraries", 2002.
[Numbers in thousands]
StateHouseholds that used public libraries in the past year
Households with children under 18
Total number of households Number of households
A-10

Table A-7. Standard errors for the number and percent of households that used a public library or bookmobile in the past year, by households with a disabled person Table A-7. and state: October 2002
Total number Number of of households households Number Percent
United States 806.0 154.7 96.4 0.73
Alabama 62.6 19.6 10.1 4.80Alaska 22.2 7.1 5.4 14.81Arizona 64.9 17.0 12.5 6.25Arkansas 48.6 18.3 8.9 4.97California 179.8 47.5 30.4 2.23
Colorado 60.8 16.7 11.9 6.39Connecticut 52.6 15.2 10.9 7.02Delaware 25.9 6.7 4.9 15.81District of Columbia 22.8 6.1 3.7 16.72Florida 123.8 33.4 21.0 3.14
Georgia 85.0 25.4 14.8 4.00Hawaii 30.1 8.1 6.5 12.63Idaho 33.3 9.9 5.9 10.32Illinois 103.5 26.4 16.6 3.95Indiana 73.4 20.6 14.4 5.18
Iowa 50.1 13.9 10.0 7.67Kansas 48.2 15.8 11.3 6.76Kentucky 61.0 18.7 11.9 5.63Louisiana 61.7 16.6 11.6 6.43Maine 33.7 10.4 6.5 10.01
Maryland 68.1 21.0 15.5 5.07Massachusetts 74.4 19.9 12.4 5.23Michigan 94.1 27.9 17.7 3.75Minnesota 64.8 20.0 14.4 5.32Mississippi 47.9 17.4 11.0 5.99
Missouri 70.5 21.4 13.4 4.88Montana 28.5 10.2 6.8 10.43Nebraska 37.9 11.0 7.4 9.59Nevada 40.7 10.3 6.8 10.30New Hampshire 32.6 9.5 6.6 11.23
New Jersey 83.4 23.3 15.5 4.54New Mexico 39.4 12.9 8.0 8.06New York 130.4 36.9 23.9 2.87North Carolina 84.2 27.8 17.6 3.77North Dakota 23.6 5.9 3.6 17.41
Ohio 101.0 31.4 22.6 3.40Oklahoma 54.8 18.2 13.0 5.87Oregon 54.4 15.2 10.7 7.00Pennsylvania 104.0 32.2 19.1 3.18Rhode Island 29.2 8.9 5.6 11.64
South Carolina 59.0 16.6 10.0 6.20South Dakota 25.0 6.7 4.2 15.35Tennessee 70.2 22.3 13.2 4.59Texas 138.5 37.9 21.9 2.67Utah 39.6 10.4 8.0 10.10
Vermont 23.1 5.6 3.9 18.89Virginia 79.8 21.0 13.1 4.96Washington 72.5 22.0 16.3 4.82West Virginia 40.5 13.2 8.0 7.80Wisconsin 68.7 19.4 14.2 5.48Wyoming 20.9 6.7 4.8 15.89SOURCE: U.S. Department of Commerce, Bureau of the Census, Current Population Survey (CPS), October Supplement, "Household Use of Public Libraries," 2002.
[Numbers in thousands]
Households with disabled person
Households that used public libraries in the past year
State
A-11

Table A-8. Standard errors for the number and percent of households that used a public library or bookmobile in the past year, by households with a retired person Table A-8. and state: October 2002
Total number Number of of households households Number Percent
United States 806.0 271.2 146.1 0.45
Alabama 62.6 27.6 14.1 3.41Alaska 22.2 8.9 6.3 12.00Arizona 64.9 30.0 19.5 3.53Arkansas 48.6 24.3 12.9 3.96California 179.8 74.5 44.3 1.40
Colorado 60.8 26.2 16.8 4.01Connecticut 52.6 25.7 16.6 4.11Delaware 25.9 12.7 7.8 8.15District of Columbia 22.8 11.1 6.7 9.24Florida 123.8 61.6 37.4 1.70
Georgia 85.0 34.0 15.3 2.54Hawaii 30.1 16.8 9.4 5.91Idaho 33.3 15.7 9.2 6.46Illinois 103.5 49.7 29.4 2.07Indiana 73.4 34.6 21.3 3.01
Iowa 50.1 23.0 15.4 4.62Kansas 48.2 21.6 13.6 4.83Kentucky 61.0 29.6 15.2 3.19Louisiana 61.7 29.9 17.1 3.35Maine 33.7 16.0 9.8 6.44
Maryland 68.1 32.8 20.9 3.21Massachusetts 74.4 34.6 19.6 2.90Michigan 94.1 46.0 26.0 2.18Minnesota 64.8 28.6 18.8 3.70Mississippi 47.9 22.3 13.3 4.58
Missouri 70.5 35.0 20.7 2.93Montana 28.5 14.1 8.3 7.23Nebraska 37.9 16.5 9.9 6.21Nevada 40.7 19.4 12.5 5.43New Hampshire 32.6 15.3 9.4 6.76
New Jersey 83.4 39.9 26.2 2.66New Mexico 39.4 18.5 9.9 5.24New York 130.4 63.1 38.5 1.66North Carolina 84.2 38.9 22.4 2.60North Dakota 23.6 12.0 5.8 7.59
Ohio 101.0 46.8 31.3 2.29Oklahoma 54.8 27.3 14.6 3.54Oregon 54.4 26.1 16.2 3.98Pennsylvania 104.0 52.5 26.6 1.80Rhode Island 29.2 14.4 8.2 6.96
South Carolina 59.0 28.4 15.2 3.40South Dakota 25.0 12.0 7.0 8.38Tennessee 70.2 30.9 16.7 3.15Texas 138.5 57.3 31.2 1.73Utah 39.6 18.2 12.3 5.85
Vermont 23.1 10.7 6.5 9.54Virginia 79.8 35.3 21.1 2.92Washington 72.5 33.2 22.8 3.22West Virginia 40.5 20.6 10.5 4.53Wisconsin 68.7 30.4 21.0 3.51Wyoming 20.9 9.9 6.9 10.74SOURCE: U.S. Department of Commerce, Bureau of the Census, Current Population Survey (CPS), October Supplement, "Household Use of Public Libraries," 2002.
[Numbers in thousands]
Households with retired person
Households that used public libraries in the past year
State
A-12

Table A-9. Standard errors for the number and percent of households that used a public library or bookmobile in the past year, by household income, or poverty status, Table A-9. and state: October 2002
Total number of households
Number of households
Percent that used a public
libraryNumber of
households
Percent that used a public
libraryNumber of
households
Percent that used a public
libraryNumber of
households
Percent that used a public
library
United States 806.0 251.4 0.46 538.2 0.29 251.4 0.48 186.0 0.61
Alabama 62.6 32.0 2.90 47.3 2.20 24.3 4.39 26.8 3.59Alaska 22.2 8.5 12.57 16.9 6.26 11.5 9.12 6.7 15.37Arizona 64.9 29.6 3.28 49.2 2.19 29.0 3.58 24.5 4.01Arkansas 48.6 26.5 3.38 36.8 2.87 16.8 6.34 22.1 3.98California 179.8 69.0 1.51 131.6 0.85 84.0 1.28 56.1 1.92
Colorado 60.8 22.2 4.68 48.2 2.23 28.6 3.62 17.5 6.10Connecticut 52.6 20.2 5.06 38.1 2.80 29.5 3.28 14.2 7.48Delaware 25.9 9.6 9.41 20.4 5.16 12.7 8.36 6.3 14.22District of Columbia 22.8 10.0 9.52 17.3 6.09 10.9 9.82 8.5 11.88Florida 123.8 54.8 1.81 96.2 1.14 47.7 2.24 41.2 2.46
Georgia 85.0 37.3 2.49 65.7 1.61 36.3 2.93 28.2 3.51Hawaii 30.1 12.4 8.34 23.5 4.54 14.0 7.59 10.0 10.60Idaho 33.3 14.6 7.00 27.4 3.90 11.9 8.77 12.6 8.41Illinois 103.5 41.5 2.50 80.0 1.36 46.6 2.25 31.3 3.41Indiana 73.4 32.3 3.18 57.5 1.87 30.3 3.32 22.8 4.67
Iowa 50.1 21.3 4.91 41.0 2.53 18.7 5.28 16.0 6.65Kansas 48.2 22.0 4.85 38.0 2.79 19.3 5.21 16.6 6.43Kentucky 61.0 31.4 2.97 45.8 2.31 24.2 4.41 25.0 4.04Louisiana 61.7 32.8 3.04 47.8 2.24 19.6 5.22 24.8 3.94Maine 33.7 15.6 6.50 26.8 3.99 13.1 7.85 12.5 8.41
Maryland 68.1 25.7 3.82 51.8 2.05 34.6 2.92 20.2 5.10Massachusetts 74.4 28.5 3.55 54.8 1.95 39.9 2.67 20.4 5.05Michigan 94.1 40.9 2.43 72.7 1.49 40.1 2.49 30.7 3.29Minnesota 64.8 26.1 4.01 49.7 2.12 31.3 3.11 20.3 5.10Mississippi 47.9 25.6 3.81 36.7 2.92 16.5 6.31 20.7 4.94
Missouri 70.5 31.1 3.30 55.9 1.93 28.1 3.39 23.9 4.47Montana 28.5 14.4 7.18 22.7 4.69 9.4 11.37 11.9 8.92Nebraska 37.9 17.0 6.19 30.5 3.50 14.3 7.11 14.3 7.48Nevada 40.7 15.2 6.60 32.9 3.25 18.2 5.76 12.7 8.29New Hampshire 32.6 11.9 8.79 26.1 4.08 15.4 6.83 8.9 11.92
New Jersey 83.4 30.7 3.22 60.9 1.77 45.9 2.27 21.7 4.58New Mexico 39.4 21.6 4.73 29.6 3.60 14.0 7.54 18.4 5.61New York 130.4 57.3 1.74 94.6 1.16 60.8 1.72 43.4 2.35North Carolina 84.2 40.5 2.51 64.9 1.66 32.1 3.32 31.8 3.18North Dakota 23.6 11.9 7.66 19.1 5.53 7.0 14.94 8.8 11.06
Ohio 101.0 42.0 2.52 80.8 1.33 39.3 2.52 31.5 3.40Oklahoma 54.8 27.1 3.66 42.9 2.47 20.0 5.26 21.6 4.77Oregon 54.4 23.5 4.53 43.4 2.47 22.2 4.71 18.7 5.62Pennsylvania 104.0 45.5 2.06 80.0 1.34 43.9 2.41 31.0 3.29Rhode Island 29.2 13.5 7.21 22.6 4.73 12.5 8.10 10.3 9.69
South Carolina 59.0 28.5 3.22 46.8 2.29 20.9 5.08 22.9 4.37South Dakota 25.0 11.5 8.72 20.4 5.22 8.6 11.98 9.2 11.33Tennessee 70.2 34.0 2.81 53.1 1.99 29.4 3.59 28.7 3.31Texas 138.5 64.7 1.51 103.0 1.06 55.7 1.93 55.2 1.83Utah 39.6 16.7 6.37 31.6 3.26 16.8 5.77 14.7 7.23
Vermont 23.1 10.1 10.43 18.8 5.69 8.9 10.96 7.8 13.54Virginia 79.8 30.1 3.29 60.5 1.78 40.6 2.58 20.7 5.08Washington 72.5 31.2 3.43 55.8 1.93 32.6 3.01 24.0 4.44West Virginia 40.5 21.6 4.30 31.1 3.37 13.9 7.65 15.7 6.14Wisconsin 68.7 26.7 3.82 55.1 1.94 29.7 3.41 19.6 5.26Wyoming 20.9 9.5 11.12 16.9 6.18 7.8 12.84 7.8 13.67SOURCE: U.S. Department of Commerce, Bureau of the Census, Current Population Survey (CPS), October Supplement, "Household Use of Public Libraries," 2002.
[Numbers in thousands]
Household income Poverty statusLowest fifth Middle three-fifths Highest fifth Below poverty line
State
A-13

Table A-10. Standard errors for the number and percent of households that used a public library or bookmobile in the past year, by highest educational level in householTable A-10. and state: October 2002
Total number of households
Number of households
Percent that used a public library
Number of households
Percent that used a public library
Number of households
Percent that used a public library
United States 806.0 162.7 0.58 306.0 0.41 326.7 0.40
Alabama 62.6 23.3 3.42 34.1 2.70 33.3 3.18Alaska 22.2 4.9 20.01 11.1 9.31 13.3 7.83Arizona 64.9 19.0 5.08 31.6 3.15 36.5 2.93Arkansas 48.6 19.2 3.70 26.7 3.62 26.9 3.91California 179.8 49.5 2.00 71.9 1.43 98.9 1.11
Colorado 60.8 15.9 5.82 26.7 3.88 33.3 3.22Connecticut 52.6 13.8 5.96 27.4 3.84 25.7 4.07Delaware 25.9 7.0 8.60 14.3 6.81 14.0 7.63District of Columbia 22.8 7.4 12.61 10.3 9.42 10.6 9.81Florida 123.8 36.6 2.28 62.9 1.64 65.5 1.65
Georgia 85.0 28.9 2.60 45.1 2.18 45.6 2.35Hawaii 30.1 6.7 9.69 15.1 6.80 16.6 6.43Idaho 33.3 8.1 9.98 17.3 5.73 20.5 5.16Illinois 103.5 30.4 3.30 52.0 1.99 55.1 1.96Indiana 73.4 20.9 4.34 45.5 2.34 37.7 2.80
Iowa 50.1 14.4 5.92 27.1 3.94 27.7 3.73Kansas 48.2 13.0 6.93 25.0 4.24 26.5 3.95Kentucky 61.0 21.6 2.71 33.9 2.85 33.3 3.20Louisiana 61.7 21.7 3.65 35.7 2.83 31.3 3.39Maine 33.7 9.2 7.46 17.9 5.69 18.8 5.68
Maryland 68.1 20.3 4.67 32.4 3.24 34.5 3.08Massachusetts 74.4 20.8 3.60 36.8 2.77 35.4 3.02Michigan 94.1 27.3 2.98 50.0 2.03 52.3 2.05Minnesota 64.8 14.7 5.60 29.1 3.63 39.5 2.64Mississippi 47.9 17.2 4.59 26.9 3.86 26.9 3.97
Missouri 70.5 20.6 4.39 35.5 2.98 39.6 2.70Montana 28.5 7.6 12.36 14.8 6.88 16.4 6.45Nebraska 37.9 9.4 9.76 18.8 5.29 22.9 4.63Nevada 40.7 13.4 6.97 20.0 5.24 23.4 4.52New Hampshire 32.6 8.5 8.94 16.3 6.23 17.9 5.95
New Jersey 83.4 22.8 3.87 41.9 2.46 39.5 2.66New Mexico 39.4 13.5 6.33 21.5 4.67 21.6 4.93New York 130.4 41.3 2.19 64.2 1.63 62.5 1.73North Carolina 84.2 28.8 2.86 45.6 2.25 44.5 2.41North Dakota 23.6 6.4 6.92 12.0 7.65 14.3 7.37
Ohio 101.0 26.3 3.78 57.9 1.86 52.3 2.02Oklahoma 54.8 16.5 4.11 30.7 3.26 31.1 3.42Oregon 54.4 14.5 6.96 24.5 4.22 32.8 3.27Pennsylvania 104.0 29.6 2.66 61.0 1.61 49.3 2.17Rhode Island 29.2 11.1 6.90 15.0 6.99 14.4 7.41
South Carolina 59.0 19.8 3.09 32.2 3.07 32.1 3.33South Dakota 25.0 6.2 13.86 13.2 7.71 14.8 7.21Tennessee 70.2 25.2 2.87 37.1 2.58 36.0 2.97Texas 138.5 49.3 1.60 67.6 1.48 73.0 1.49Utah 39.6 9.6 9.91 18.5 5.75 24.3 4.21
Vermont 23.1 5.8 13.13 12.4 8.00 11.4 9.32Virginia 79.8 22.6 3.94 41.4 2.40 40.0 2.67Washington 72.5 17.1 5.56 32.1 3.30 44.4 2.40West Virginia 40.5 15.2 4.08 25.3 3.80 20.8 5.14Wisconsin 68.7 18.2 5.18 36.2 2.92 38.8 2.74Wyoming 20.9 5.4 17.88 11.0 9.57 13.3 7.78See notes at end of table.
Less than high school diploma High school/GED Some postsecondary
State
Highest educational level in household
[Numbers in thousands]
A-14
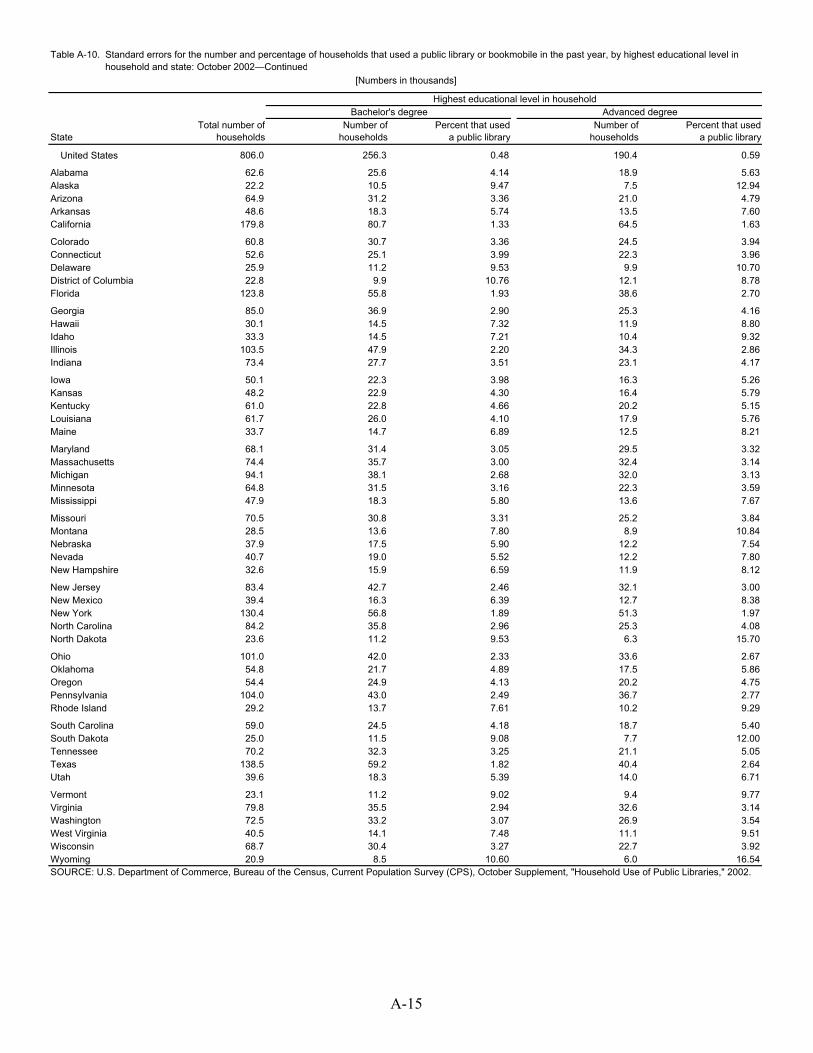
Table A-10. Standard errors for the number and percentage of households that used a public library or bookmobile in the past year, by highest educational level in Table A-10. household and state: October 2002—Continued
StateTotal number of
householdsNumber of
householdsPercent that used
a public libraryNumber of
householdsPercent that used
a public library
United States 806.0 256.3 0.48 190.4 0.59
Alabama 62.6 25.6 4.14 18.9 5.63Alaska 22.2 10.5 9.47 7.5 12.94Arizona 64.9 31.2 3.36 21.0 4.79Arkansas 48.6 18.3 5.74 13.5 7.60California 179.8 80.7 1.33 64.5 1.63
Colorado 60.8 30.7 3.36 24.5 3.94Connecticut 52.6 25.1 3.99 22.3 3.96Delaware 25.9 11.2 9.53 9.9 10.70District of Columbia 22.8 9.9 10.76 12.1 8.78Florida 123.8 55.8 1.93 38.6 2.70
Georgia 85.0 36.9 2.90 25.3 4.16Hawaii 30.1 14.5 7.32 11.9 8.80Idaho 33.3 14.5 7.21 10.4 9.32Illinois 103.5 47.9 2.20 34.3 2.86Indiana 73.4 27.7 3.51 23.1 4.17
Iowa 50.1 22.3 3.98 16.3 5.26Kansas 48.2 22.9 4.30 16.4 5.79Kentucky 61.0 22.8 4.66 20.2 5.15Louisiana 61.7 26.0 4.10 17.9 5.76Maine 33.7 14.7 6.89 12.5 8.21
Maryland 68.1 31.4 3.05 29.5 3.32Massachusetts 74.4 35.7 3.00 32.4 3.14Michigan 94.1 38.1 2.68 32.0 3.13Minnesota 64.8 31.5 3.16 22.3 3.59Mississippi 47.9 18.3 5.80 13.6 7.67
Missouri 70.5 30.8 3.31 25.2 3.84Montana 28.5 13.6 7.80 8.9 10.84Nebraska 37.9 17.5 5.90 12.2 7.54Nevada 40.7 19.0 5.52 12.2 7.80New Hampshire 32.6 15.9 6.59 11.9 8.12
New Jersey 83.4 42.7 2.46 32.1 3.00New Mexico 39.4 16.3 6.39 12.7 8.38New York 130.4 56.8 1.89 51.3 1.97North Carolina 84.2 35.8 2.96 25.3 4.08North Dakota 23.6 11.2 9.53 6.3 15.70
Ohio 101.0 42.0 2.33 33.6 2.67Oklahoma 54.8 21.7 4.89 17.5 5.86Oregon 54.4 24.9 4.13 20.2 4.75Pennsylvania 104.0 43.0 2.49 36.7 2.77Rhode Island 29.2 13.7 7.61 10.2 9.29
South Carolina 59.0 24.5 4.18 18.7 5.40South Dakota 25.0 11.5 9.08 7.7 12.00Tennessee 70.2 32.3 3.25 21.1 5.05Texas 138.5 59.2 1.82 40.4 2.64Utah 39.6 18.3 5.39 14.0 6.71
Vermont 23.1 11.2 9.02 9.4 9.77Virginia 79.8 35.5 2.94 32.6 3.14Washington 72.5 33.2 3.07 26.9 3.54West Virginia 40.5 14.1 7.48 11.1 9.51Wisconsin 68.7 30.4 3.27 22.7 3.92Wyoming 20.9 8.5 10.60 6.0 16.54SOURCE: U.S. Department of Commerce, Bureau of the Census, Current Population Survey (CPS), October Supplement, "Household Use of Public Libraries," 2002.
Highest educational level in household
[Numbers in thousands]
Bachelor's degree Advanced degree
A-15

Table A-11. Standard errors for the number and percent of households that used a public library or bookmobile in the past year, by presence of high school or college Table A-11. student and state: October 2002
Total number Number of Number ofof households households Number Percent households Number Percent
United States 806.0 142.5 116.1 0.74 135.5 107.4 0.79
Alabama 62.6 16.6 13.2 6.19 15.7 12.2 6.65Alaska 22.2 6.7 5.9 13.25 5.2 4.4 18.23Arizona 64.9 19.4 16.3 5.03 18.0 14.8 5.54Arkansas 48.6 12.3 9.8 8.37 † † †California 179.8 48.7 40.1 2.06 51.4 40.2 2.04
Colorado 60.8 15.9 13.2 6.18 14.9 10.6 7.15Connecticut 52.6 15.9 13.5 6.02 13.6 10.7 7.60Delaware 25.9 6.2 4.7 17.00 7.1 5.4 14.84District of Columbia 22.8 † † † 5.8 4.7 17.60Florida 123.8 30.4 25.3 3.23 28.7 23.7 3.46
Georgia 85.0 22.0 16.6 4.80 20.2 15.3 5.22Hawaii 30.1 7.4 6.6 11.71 8.0 6.4 12.85Idaho 33.3 9.2 7.9 10.14 8.0 7.3 9.98Illinois 103.5 29.4 24.8 3.30 28.2 23.1 3.56Indiana 73.4 19.8 17.0 4.72 15.9 12.8 6.41
Iowa 50.1 14.7 12.9 6.14 13.7 10.7 7.57Kansas 48.2 13.3 11.7 6.66 12.9 11.4 6.80Kentucky 61.0 14.2 11.7 6.99 14.4 10.9 7.31Louisiana 61.7 16.1 12.9 6.36 16.0 13.6 5.99Maine 33.7 9.1 8.1 9.57 8.2 7.0 11.48
Maryland 68.1 17.0 13.7 5.99 16.9 15.7 4.25Massachusetts 74.4 19.4 16.5 4.91 16.9 14.5 5.54Michigan 94.1 25.5 22.0 3.66 25.9 21.0 3.92Minnesota 64.8 20.2 17.2 4.70 17.7 15.2 5.32Mississippi 47.9 13.8 11.7 6.93 11.8 9.2 8.82
Missouri 70.5 18.3 16.1 4.89 18.6 15.2 5.40Montana 28.5 7.8 6.5 12.57 7.0 5.0 15.24Nebraska 37.9 10.6 9.2 8.64 10.5 8.8 9.28Nevada 40.7 10.2 8.0 10.14 8.5 7.5 10.55New Hampshire 32.6 8.4 7.2 11.32 7.9 6.2 13.09
New Jersey 83.4 21.9 18.2 4.52 21.3 17.9 4.57New Mexico 39.4 10.2 8.5 9.59 10.3 8.1 10.07New York 130.4 33.8 29.3 2.72 34.9 28.8 2.85North Carolina 84.2 19.5 15.0 5.37 17.4 13.7 5.95North Dakota 23.6 6.8 5.1 15.51 6.6 5.0 15.93
Ohio 101.0 28.9 25.0 3.20 25.2 21.7 3.70Oklahoma 54.8 15.8 11.9 6.68 14.0 11.2 7.30Oregon 54.4 14.4 11.5 7.13 14.4 12.2 6.64Pennsylvania 104.0 26.5 21.6 3.80 26.5 21.0 3.90Rhode Island 29.2 7.2 6.4 12.03 7.7 6.9 11.04
South Carolina 59.0 15.1 11.9 6.87 17.3 14.1 5.83South Dakota 25.0 7.1 6.1 13.18 7.3 5.7 14.14Tennessee 70.2 18.6 14.5 5.60 18.2 14.1 5.75Texas 138.5 39.1 30.1 2.69 32.8 25.0 3.22Utah 39.6 12.7 11.5 6.60 13.3 11.4 7.06
Vermont 23.1 5.9 5.1 15.77 5.8 4.5 17.87Virginia 79.8 20.6 17.1 4.78 18.5 16.1 4.94Washington 72.5 18.8 16.0 5.09 18.2 13.8 5.81West Virginia 40.5 9.6 7.8 10.48 8.0 6.0 13.23Wisconsin 68.7 20.2 17.7 4.46 17.4 13.0 6.09Wyoming 20.9 6.0 5.0 16.23 4.6 3.8 21.22† Not applicable.
[Numbers in thousands]
SOURCE: U.S. Department of Commerce, Bureau of the Census, Current Population Survey (CPS), October Supplement, "Household Use of Public Libraries," 2002.
Households that used a public library in the past year
Households with high school student Households with college studentHouseholds that used a public library in
the past year
State
A-16

Table A-12. Standard errors for the number and percent of households that used a public library or bookmobile in the past year, by race/ethnicity and state: Table A-12. October 2002
Total number Number of Number ofof households households Number Percent households Number Percent
United States 806.0 614.3 360.7 0.26 318.4 193.3 0.41
Alabama 62.6 53.2 32.0 1.95 32.2 19.4 3.20Alaska 22.2 18.8 14.2 5.62 11.8 8.5 9.03Arizona 64.9 53.4 37.4 2.02 36.1 23.5 2.93Arkansas 48.6 42.7 27.0 2.46 22.8 11.8 4.16California 179.8 125.8 83.8 0.89 117.3 80.3 0.95
Colorado 60.8 52.6 39.2 2.03 29.8 19.5 3.56Connecticut 52.6 46.2 35.2 2.29 24.9 17.9 4.29Delaware 25.9 22.2 14.4 4.76 13.4 8.4 7.78District of Columbia 22.8 12.7 8.9 8.42 18.9 11.7 5.47Florida 123.8 98.8 66.5 1.11 69.9 43.3 1.51
Georgia 85.0 66.8 41.5 1.58 50.9 32.2 2.07Hawaii 30.1 14.8 11.1 7.15 26.1 17.5 4.07Idaho 33.3 31.6 22.3 3.39 10.5 7.0 10.05Illinois 103.5 86.9 59.4 1.26 53.5 38.9 2.01Indiana 73.4 68.4 50.2 1.58 25.7 16.3 4.09
Iowa 50.1 47.5 36.6 2.22 15.6 11.9 6.75Kansas 48.2 43.9 32.9 2.43 19.7 14.7 5.38Kentucky 61.0 57.6 34.8 1.81 19.8 14.0 5.40Louisiana 61.7 48.9 33.1 2.19 36.9 22.8 2.83Maine 33.7 33.1 22.6 3.22 6.2 5.0 16.34
Maryland 68.1 54.4 41.3 1.95 40.0 28.8 2.68Massachusetts 74.4 68.0 46.3 1.59 29.3 19.3 3.62Michigan 94.1 83.4 57.8 1.31 41.6 27.9 2.57Minnesota 64.8 61.5 47.2 1.72 19.8 15.2 5.30Mississippi 47.9 38.9 25.0 2.72 27.7 19.2 3.86
Missouri 70.5 64.9 46.7 1.67 26.8 19.3 3.99Montana 28.5 26.8 18.1 3.97 9.6 6.4 11.05Nebraska 37.9 35.0 24.9 3.06 14.3 10.6 7.41Nevada 40.7 33.0 23.9 3.23 23.5 16.4 4.54New Hampshire 32.6 31.5 21.8 3.39 8.3 6.0 12.85
New Jersey 83.4 68.5 50.5 1.57 46.0 31.3 2.33New Mexico 39.4 25.6 17.2 4.15 29.7 19.7 3.57New York 130.4 104.8 72.1 1.06 72.2 48.2 1.50North Carolina 84.2 69.7 45.7 1.54 45.5 30.1 2.34North Dakota 23.6 22.7 14.2 4.59 6.4 4.0 16.37
Ohio 101.0 91.3 68.5 1.19 40.6 30.4 2.62Oklahoma 54.8 47.8 31.1 2.23 26.5 16.2 3.90Oregon 54.4 49.2 35.1 2.18 22.8 17.2 4.63Pennsylvania 104.0 95.1 59.1 1.13 39.5 25.9 2.69Rhode Island 29.2 26.8 18.8 3.99 11.6 7.5 9.12
South Carolina 59.0 49.2 31.9 2.16 32.0 21.4 3.32South Dakota 25.0 24.1 16.8 4.44 6.8 4.5 15.52Tennessee 70.2 62.9 38.5 1.67 30.3 21.3 3.53Texas 138.5 96.8 61.9 1.12 93.2 56.7 1.15Utah 39.6 36.9 29.2 2.81 14.3 10.7 7.40
Vermont 23.1 22.6 16.0 4.72 4.6 3.6 22.50Virginia 79.8 66.2 47.0 1.64 43.2 27.9 2.45Washington 72.5 64.9 48.6 1.65 31.4 22.7 3.40West Virginia 40.5 39.5 23.6 2.61 8.9 6.6 11.90Wisconsin 68.7 63.8 47.4 1.68 24.5 17.4 4.35Wyoming 20.9 19.9 15.1 5.29 6.3 4.7 16.73
[Numbers in thousands]
Households that used a public library in the past year
Households that used a public library in the past year
SOURCE: U.S. Department of Commerce, Bureau of the Census, Current Population Survey (CPS), October Supplement, "Household Use of Public Libraries," 2002.
White, non-Hispanic Other race/ethnicity
A-17

Table A-13. Standard errors for the number and percent of households that used a public library or bookmobile in the past month to get information for personal use;
Total number of households Number Percent Number Percent Number Percent Number Percent
United States 806.0 151.7 0.12 301.2 0.19 71.8 0.06 245.6 0.17
Alabama 62.6 15.1 0.82 26.8 1.35 6.6 0.37 22.7 1.18Alaska 22.2 7.5 3.08 11.7 4.32 4.0 1.69 10.8 4.10Arizona 64.9 19.6 0.97 32.2 1.45 10.1 0.52 28.3 1.32Arkansas 48.6 11.0 0.99 20.9 1.73 4.9 0.45 18.3 1.56California 179.8 46.5 0.35 88.1 0.58 25.2 0.20 70.7 0.50
Colorado 60.8 21.6 1.19 32.3 1.61 10.2 0.60 30.3 1.55Connecticut 52.6 15.1 1.13 29.3 1.90 9.5 0.74 23.6 1.65Delaware 25.9 6.8 2.08 12.3 3.44 3.5 1.10 10.3 3.01District of Columbia 22.8 6.4 2.52 10.7 3.90 4.3 1.75 9.0 3.40Florida 123.8 37.5 0.54 60.3 0.79 17.9 0.27 49.9 0.69
Georgia 85.0 20.7 0.62 37.9 1.04 9.7 0.30 32.4 0.92Hawaii 30.1 10.5 2.34 15.7 3.17 3.6 0.85 13.7 2.89Idaho 33.3 8.0 1.50 16.3 2.75 4.3 0.82 13.6 2.40Illinois 103.5 29.9 0.61 56.2 0.99 15.8 0.33 47.0 0.88Indiana 73.4 23.6 0.92 41.9 1.40 10.4 0.42 35.0 1.25
Iowa 50.1 14.0 1.16 27.9 1.99 9.0 0.76 26.1 1.92Kansas 48.2 15.9 1.40 25.7 2.02 7.9 0.73 23.1 1.89Kentucky 61.0 13.6 0.78 26.9 1.41 7.6 0.44 23.4 1.27Louisiana 61.7 15.5 0.86 27.6 1.42 7.2 0.41 23.0 1.22Maine 33.7 10.0 1.81 17.3 2.80 5.9 1.09 15.3 2.57
Maryland 68.1 20.4 0.92 37.2 1.47 12.4 0.58 32.4 1.34Massachusetts 74.4 21.6 0.83 40.2 1.34 11.4 0.45 33.9 1.20Michigan 94.1 28.5 0.69 47.2 1.03 11.7 0.30 39.9 0.91Minnesota 64.8 21.1 1.04 35.3 1.53 7.9 0.41 32.5 1.46Mississippi 47.9 11.7 1.07 21.6 1.81 5.4 0.50 19.9 1.71
Missouri 70.5 21.1 0.89 36.9 1.38 9.9 0.44 32.1 1.26Montana 28.5 8.2 2.07 14.0 3.21 4.7 1.22 13.6 3.14Nebraska 37.9 10.9 1.57 19.7 2.52 5.1 0.76 17.3 2.31Nevada 40.7 13.4 1.65 21.4 2.37 5.8 0.74 18.9 2.18New Hampshire 32.6 8.7 1.70 16.4 2.86 6.3 1.24 14.2 2.59
New Jersey 83.4 25.6 0.78 45.2 1.21 12.9 0.41 38.5 1.09New Mexico 39.4 10.6 1.42 18.4 2.26 5.7 0.78 14.8 1.91New York 130.4 35.3 0.47 69.5 0.80 21.4 0.30 55.4 0.69North Carolina 84.2 23.7 0.72 38.9 1.08 10.9 0.34 33.5 0.96North Dakota 23.6 5.3 2.00 10.6 3.64 2.9 1.10 8.9 3.18
Ohio 101.0 35.0 0.73 57.6 1.04 14.7 0.32 50.3 0.96Oklahoma 54.8 15.9 1.10 25.4 1.62 8.9 0.63 23.3 1.52Oregon 54.4 20.0 1.36 30.1 1.83 9.0 0.65 27.2 1.73Pennsylvania 104.0 24.2 0.50 45.5 0.85 13.7 0.29 39.9 0.77Rhode Island 29.2 8.3 2.00 15.7 3.33 4.3 1.07 13.0 2.92
South Carolina 59.0 15.7 0.95 28.4 1.55 7.1 0.44 25.0 1.41South Dakota 25.0 7.4 2.42 13.1 3.82 3.8 1.30 11.7 3.53Tennessee 70.2 15.2 0.66 32.0 1.27 7.1 0.32 26.2 1.08Texas 138.5 31.3 0.38 58.2 0.65 13.8 0.17 47.5 0.55Utah 39.6 14.3 1.83 24.4 2.63 6.3 0.85 20.9 2.43
Vermont 23.1 7.0 2.69 12.7 4.24 4.5 1.77 11.8 4.05Virginia 79.8 24.2 0.80 41.5 1.23 12.1 0.42 35.9 1.11Washington 72.5 25.5 1.00 39.0 1.37 10.1 0.42 36.0 1.30West Virginia 40.5 9.7 1.24 17.9 2.11 4.8 0.63 14.2 1.75Wisconsin 68.7 21.3 0.94 36.6 1.44 9.4 0.44 33.5 1.36Wyoming 20.9 7.1 3.24 12.0 4.79 3.7 1.78 10.4 4.41
Table A-13. to borrow books, CD-ROMs, or tapes; to attend a lecture, meeting, or discussion group; or for enjoyment or hobbies, and state: October 2002[Numbers in thousands]
SOURCE: U.S. Department of Commerce, Bureau of the Census, Current Population Survey (CPS), October Supplement, "Household Use of Public Libraries," 2002.
Used a public library or bookmobile in the past month Personal use Borrow material Attend meeting Enjoyment or hobbies
State
A-18

Table A-14. Standard errors for the number and percent of households with children under 18 that used a public library or bookmobile in the past month for a program Table A-14. or activity for children under 13, teenagers ages 13 to 18, or for a school or class assignment, or used a school library in the past month, by stateTable A-14. October 2002
Total number of households
Households with children
under 18 Number Percent Number Percent Number Percent Number Percent
United States 806.0 369.5 93.7 0.22 50.4 0.13 145.4 0.31 228.8 0.37
Alabama 62.6 37.2 8.4 1.28 7.1 1.08 16.3 2.28 27.5 2.87Alaska 22.2 14.5 4.0 3.94 2.5 2.52 7.1 6.30 11.6 7.07Arizona 64.9 40.6 11.3 1.41 5.5 0.72 16.8 2.00 27.5 2.63Arkansas 48.6 27.9 6.5 1.75 2.1 0.58 9.7 2.50 18.6 3.81California 179.8 106.0 34.2 0.66 23.1 0.46 52.5 0.92 67.3 1.03
Colorado 60.8 35.5 12.9 2.04 6.2 1.04 15.5 2.38 24.3 3.01Connecticut 52.6 32.1 10.8 2.11 6.5 1.33 16.5 2.94 23.5 3.32Delaware 25.9 15.5 5.5 4.57 2.9 2.54 6.6 5.29 9.6 6.66District of Columbia 22.8 10.5 4.8 8.25 3.4 6.31 6.2 9.71 5.6 9.25Florida 123.8 68.5 21.1 0.94 11.6 0.54 32.3 1.33 43.0 1.55
Georgia 85.0 50.5 15.4 1.25 7.1 0.60 20.9 1.61 35.5 2.13Hawaii 30.1 18.0 6.0 3.74 4.0 2.54 10.3 5.57 12.4 5.92Idaho 33.3 20.6 5.4 2.61 1.8 0.89 7.6 3.57 14.8 5.18Illinois 103.5 60.3 21.3 1.20 11.8 0.70 32.5 1.63 43.2 1.79Indiana 73.4 42.3 15.1 1.70 6.8 0.81 21.7 2.24 29.4 2.53
Iowa 50.1 30.1 8.8 1.99 4.9 1.15 13.6 2.86 24.4 3.37Kansas 48.2 28.6 8.3 2.09 4.8 1.23 13.6 3.13 22.0 3.67Kentucky 61.0 34.3 9.7 1.70 4.7 0.85 12.3 2.09 25.0 3.11Louisiana 61.7 36.4 10.3 1.60 4.5 0.72 14.0 2.10 23.5 2.90Maine 33.7 18.6 6.7 3.86 2.9 1.78 8.8 4.79 14.8 5.52
Maryland 68.1 39.4 12.6 1.66 6.8 0.93 19.7 2.37 27.4 2.72Massachusetts 74.4 41.8 15.7 1.80 6.5 0.79 21.6 2.28 27.1 2.54Michigan 94.1 54.9 18.7 1.27 8.6 0.61 27.0 1.69 39.0 1.96Minnesota 64.8 38.1 11.2 1.59 6.2 0.91 17.2 2.27 31.4 2.62Mississippi 47.9 29.2 7.4 1.80 5.5 1.37 13.6 3.03 20.4 3.66
Missouri 70.5 39.7 12.5 1.63 6.4 0.87 18.3 2.22 28.1 2.70Montana 28.5 15.5 4.9 4.09 3.4 2.92 7.0 5.55 11.2 6.87Nebraska 37.9 22.6 6.7 2.70 2.6 1.10 10.1 3.81 18.6 4.42Nevada 40.7 25.6 9.6 2.91 5.2 1.67 11.8 3.43 18.1 4.18New Hampshire 32.6 19.3 6.4 3.47 2.7 1.54 9.4 4.73 13.9 5.54
New Jersey 83.4 51.6 18.1 1.38 9.5 0.76 23.6 1.71 34.4 2.07New Mexico 39.4 23.7 5.6 2.06 4.6 1.73 11.0 3.73 14.7 4.40New York 130.4 73.5 25.5 0.98 14.1 0.57 38.8 1.34 47.8 1.46North Carolina 84.2 48.5 14.5 1.27 5.4 0.49 19.6 1.65 30.9 2.18North Dakota 23.6 13.1 2.9 3.52 1.4 1.77 5.0 5.76 10.7 7.70
Ohio 101.0 58.2 17.4 1.07 6.9 0.44 31.5 1.70 40.7 1.85Oklahoma 54.8 31.0 9.1 1.95 7.1 1.55 13.9 2.78 21.0 3.44Oregon 54.4 32.1 9.6 1.91 6.9 1.41 15.0 2.75 22.9 3.33Pennsylvania 104.0 57.5 16.9 1.06 6.4 0.42 23.1 1.39 41.6 1.87Rhode Island 29.2 16.2 5.6 4.28 2.9 2.36 8.5 5.90 10.7 6.54
South Carolina 59.0 33.8 10.8 1.92 6.3 1.15 14.6 2.47 25.0 3.15South Dakota 25.0 14.3 4.4 4.33 2.0 2.11 6.1 5.75 10.4 7.45Tennessee 70.2 42.0 12.1 1.42 6.0 0.73 19.4 2.11 28.7 2.55Texas 138.5 86.8 24.1 0.69 12.8 0.38 34.8 0.94 61.0 1.26Utah 39.6 26.3 6.4 1.91 4.1 1.25 12.5 3.39 18.4 4.05
Vermont 23.1 13.4 5.3 5.76 3.0 3.48 6.0 6.37 9.6 7.93Virginia 79.8 46.3 13.4 1.29 8.2 0.82 20.4 1.84 27.0 2.20Washington 72.5 42.6 8.7 1.01 4.8 0.57 19.2 2.03 31.4 2.51West Virginia 40.5 21.8 6.1 2.63 2.9 1.30 8.7 3.61 14.7 4.88Wisconsin 68.7 39.0 11.4 1.54 6.7 0.93 18.2 2.28 30.3 2.69Wyoming 20.9 12.1 4.4 5.98 1.9 2.68 5.9 7.44 9.0 8.74SOURCE: U.S. Department of Commerce, Bureau of the Census, Current Population Survey (CPS), October Supplement, "Household Use of Public Libraries," 2002.
[Numbers in thousands]
Used a public library for programs for children
under 13
Used a public library for programs for teenagers
ages 13 to 18Used a public library for a
school assignment
Households with children under 18 that used a
school library in the past month
State
Households with children under 18 that used a public library in the past month
A-19

Table A-15. Standard errors for the number and percent of households that used a public library or bookmobile in the past month for a work assignment orTable A-15. to keep up to date at work, or who used a work library in the past month, by state: October 2002
Total number of households Number Percent Number Percent
United States 806.0 80.9 0.07 105.6 0.09
Alabama 62.6 5.3 0.30 7.6 0.42Alaska 22.2 4.1 1.76 7.0 2.87Arizona 64.9 8.6 0.45 12.4 0.63Arkansas 48.6 6.0 0.55 8.5 0.77California 179.8 28.9 0.23 37.7 0.29
Colorado 60.8 11.4 0.67 15.5 0.89Connecticut 52.6 9.2 0.71 11.3 0.87Delaware 25.9 3.8 1.20 4.9 1.52District of Columbia 22.8 4.5 1.83 7.6 2.95Florida 123.8 21.4 0.32 20.1 0.30
Georgia 85.0 12.7 0.39 13.7 0.42Hawaii 30.1 5.4 1.26 6.8 1.57Idaho 33.3 3.5 0.67 7.0 1.32Illinois 103.5 14.8 0.31 19.9 0.42Indiana 73.4 12.6 0.51 12.7 0.52
Iowa 50.1 7.4 0.64 11.8 0.99Kansas 48.2 8.8 0.81 12.5 1.12Kentucky 61.0 7.0 0.41 9.5 0.55Louisiana 61.7 6.0 0.34 11.6 0.66Maine 33.7 5.4 1.00 8.2 1.50
Maryland 68.1 11.4 0.53 21.4 0.96Massachusetts 74.4 13.0 0.51 17.0 0.66Michigan 94.1 15.8 0.40 19.3 0.48Minnesota 64.8 11.5 0.59 14.3 0.73Mississippi 47.9 7.3 0.68 10.6 0.97
Missouri 70.5 12.9 0.56 11.6 0.51Montana 28.5 4.0 1.05 7.0 1.78Nebraska 37.9 5.8 0.86 10.2 1.47Nevada 40.7 7.8 1.00 7.9 1.02New Hampshire 32.6 5.4 1.09 6.9 1.36
New Jersey 83.4 15.3 0.48 18.3 0.57New Mexico 39.4 6.5 0.89 8.0 1.09New York 130.4 19.4 0.27 24.3 0.33North Carolina 84.2 12.6 0.39 17.0 0.53North Dakota 23.6 3.1 1.20 5.5 2.07
Ohio 101.0 17.5 0.39 20.0 0.44Oklahoma 54.8 10.3 0.73 11.1 0.78Oregon 54.4 9.9 0.72 11.1 0.80Pennsylvania 104.0 14.0 0.29 21.6 0.45Rhode Island 29.2 5.0 1.24 4.7 1.18
South Carolina 59.0 9.3 0.58 10.4 0.64South Dakota 25.0 3.9 1.30 5.2 1.76Tennessee 70.2 8.5 0.38 12.3 0.54Texas 138.5 19.2 0.24 26.6 0.33Utah 39.6 6.1 0.83 7.8 1.05
Vermont 23.1 4.2 1.64 5.3 2.07Virginia 79.8 15.0 0.51 19.5 0.66Washington 72.5 12.3 0.51 17.8 0.73West Virginia 40.5 4.9 0.63 6.5 0.84Wisconsin 68.7 11.8 0.55 14.2 0.65Wyoming 20.9 3.5 1.67 5.4 2.56SOURCE: U.S. Department of Commerce, Bureau of the Census, Current Population Survey (CPS), October Supplement, "Household Use of Public Libraries," 2002.
[Numbers in thousands]
Households that used a public library for a work assignment or to keep up to date at work in the past
monthHouseholds that used a work library in the past
month
State
A-20

Table A-16. Standard errors for the number and percent of households that used a public library or bookmobile in the past month to use a computer or theTable A-16. Internet, or to learn how to use a computer or the Internet, by state: October 2002
Total number of households Number Percent Number Percent
United States 806.0 154.6 0.13 61.9 0.06
Alabama 62.6 14.2 0.77 6.0 0.33Alaska 22.2 7.2 2.98 2.8 1.21Arizona 64.9 21.4 1.05 8.3 0.43Arkansas 48.6 11.3 1.01 3.0 0.27California 179.8 50.8 0.38 24.5 0.19
Colorado 60.8 19.2 1.08 5.8 0.34Connecticut 52.6 14.4 1.09 6.8 0.53Delaware 25.9 6.4 1.97 2.3 0.72District of Columbia 22.8 7.1 2.78 3.5 1.43Florida 123.8 35.7 0.52 16.4 0.25
Georgia 85.0 24.0 0.71 8.5 0.26Hawaii 30.1 8.8 1.99 2.7 0.64Idaho 33.3 9.0 1.68 3.4 0.66Illinois 103.5 32.7 0.66 15.5 0.33Indiana 73.4 23.0 0.89 6.9 0.28
Iowa 50.1 14.8 1.22 5.2 0.45Kansas 48.2 16.0 1.41 6.8 0.63Kentucky 61.0 15.8 0.89 6.3 0.37Louisiana 61.7 16.1 0.90 4.7 0.27Maine 33.7 8.8 1.60 3.4 0.64
Maryland 68.1 21.8 0.98 8.6 0.40Massachusetts 74.4 21.3 0.81 9.5 0.38Michigan 94.1 29.3 0.71 12.5 0.32Minnesota 64.8 19.3 0.96 6.9 0.36Mississippi 47.9 15.3 1.36 6.7 0.63
Missouri 70.5 23.0 0.96 9.4 0.41Montana 28.5 8.4 2.12 3.0 0.79Nebraska 37.9 12.1 1.73 4.9 0.73Nevada 40.7 11.3 1.41 5.3 0.69New Hampshire 32.6 8.0 1.56 3.0 0.60
New Jersey 83.4 24.5 0.75 10.8 0.34New Mexico 39.4 11.7 1.55 5.3 0.73New York 130.4 38.2 0.51 19.4 0.27North Carolina 84.2 23.7 0.72 9.2 0.29North Dakota 23.6 5.2 1.96 1.7 0.64
Ohio 101.0 31.6 0.67 12.1 0.27Oklahoma 54.8 15.7 1.09 7.1 0.51Oregon 54.4 17.5 1.22 6.3 0.46Pennsylvania 104.0 26.7 0.54 9.6 0.20Rhode Island 29.2 8.7 2.10 3.6 0.90
South Carolina 59.0 14.4 0.88 5.1 0.32South Dakota 25.0 6.7 2.22 2.9 0.99Tennessee 70.2 16.7 0.73 4.5 0.20Texas 138.5 36.3 0.44 18.0 0.22Utah 39.6 12.8 1.67 4.0 0.54
Vermont 23.1 6.7 2.58 3.1 1.22Virginia 79.8 22.2 0.74 9.4 0.33Washington 72.5 24.6 0.97 7.2 0.30West Virginia 40.5 8.3 1.07 3.1 0.41Wisconsin 68.7 17.3 0.78 6.3 0.29Wyoming 20.9 6.6 3.04 2.9 1.38
Households that used a public library to learn how to use a computer or the Internet
[Numbers in thousands]
SOURCE: U.S. Department of Commerce, Bureau of the Census, Current Population Survey (CPS), October Supplement, "Household Use of Public Libraries," 2002.
Households that used a public library to use a computer or the Internet
A-21

Table A-17. Standard errors for the number and percent of households that included a disabled person and that responded that the public library had made
Total number of households
Number of householdswith a disabled
person Number Percent Number Percent
United States 806.0 154.7 122.0 0.71 59.8 0.56
Alabama 62.6 19.6 15.1 5.33 8.6 4.29Alaska 22.2 7.1 5.9 13.96 2.3 9.12Arizona 64.9 17.0 15.2 5.04 6.7 4.56Arkansas 48.6 18.3 14.0 5.75 6.9 4.10California 179.8 47.5 37.4 2.19 20.9 1.80
Colorado 60.8 16.7 13.9 5.90 8.0 5.39Connecticut 52.6 15.2 13.3 5.95 6.4 5.41Delaware 25.9 6.7 5.7 14.43 2.1 9.26District of Columbia 22.8 6.1 4.5 17.33 2.0 10.51Florida 123.8 33.4 25.7 3.15 14.7 2.54
Georgia 85.0 25.4 19.8 4.11 9.2 2.85Hawaii 30.1 8.1 5.3 12.97 2.6 7.86Idaho 33.3 9.9 7.9 10.38 3.9 7.86Illinois 103.5 26.4 21.6 3.80 9.8 2.79Indiana 73.4 20.6 16.7 4.93 8.9 4.04
Iowa 50.1 13.9 10.9 7.46 5.2 5.35Kansas 48.2 15.8 14.1 5.35 4.8 3.91Kentucky 61.0 18.7 15.1 5.44 9.7 5.09Louisiana 61.7 16.6 13.0 6.26 5.8 4.23Maine 33.7 10.4 8.2 9.92 4.4 7.88
Maryland 68.1 21.0 16.9 4.85 8.9 3.91Massachusetts 74.4 19.9 16.4 5.02 6.1 3.16Michigan 94.1 27.9 22.8 3.60 10.3 2.64Minnesota 64.8 20.0 15.6 5.20 8.4 4.07Mississippi 47.9 17.4 14.3 5.72 5.4 3.60
Missouri 70.5 21.4 17.6 4.65 9.4 3.95Montana 28.5 10.2 9.4 7.50 3.3 6.42Nebraska 37.9 11.0 9.0 9.13 5.0 7.79Nevada 40.7 10.3 8.5 9.60 4.7 8.46New Hampshire 32.6 9.5 7.6 10.82 4.4 9.29
New Jersey 83.4 23.3 19.4 4.24 9.6 3.43New Mexico 39.4 12.9 9.8 8.17 5.8 6.68New York 130.4 36.9 29.6 2.78 16.1 2.28North Carolina 84.2 27.8 22.9 3.58 11.3 2.86North Dakota 23.6 5.9 5.2 15.34 2.9 15.36
Ohio 101.0 31.4 25.4 3.23 10.3 2.11Oklahoma 54.8 18.2 15.0 5.48 6.9 4.14Oregon 54.4 15.2 12.8 6.39 6.5 5.42Pennsylvania 104.0 32.2 26.6 3.09 11.0 2.14Rhode Island 29.2 8.9 7.4 11.16 3.6 8.76
South Carolina 59.0 16.6 13.4 6.12 4.3 3.22South Dakota 25.0 6.7 5.8 13.83 2.6 11.05Tennessee 70.2 22.3 17.3 4.68 9.1 3.58Texas 138.5 37.9 29.8 2.74 18.7 2.43Utah 39.6 10.4 8.9 9.09 4.6 8.10
Vermont 23.1 5.6 4.5 18.20 3.0 17.14Virginia 79.8 21.0 17.2 4.77 7.8 3.51Washington 72.5 22.0 18.1 4.54 9.8 3.86West Virginia 40.5 13.2 11.2 7.28 6.2 6.70Wisconsin 68.7 19.4 15.9 5.16 6.5 3.49Wyoming 20.9 6.7 5.7 14.12 2.0 9.07
Table A-17. access easier, or that reported barriers to their use of the public library, by state: October 2002
Households with a disabled person that reported barriers to their use of the public
library
SOURCE: U.S. Department of Commerce, Bureau of the Census, Current Population Survey (CPS), October Supplement, "Household Use of Public Libraries," 2002.
[Numbers in thousands]
Households with disabled person that responded the public library had made
access easier
State
A-22

Table A-18. Standard errors for the number and percent of households with members age 55 or older that used a public library or bookmobile in the past month for a Table A-18. program or activity for people age 55 or older, by state: October 2002
Total number of householdsNumber of households with
members age 55 or older Number Percent
United States 806.0 383.3 45.1 0.11
Alabama 62.6 38.7 5.6 0.80Alaska 22.2 12.0 1.5 2.16Arizona 64.9 38.3 5.1 0.75Arkansas 48.6 31.5 3.7 0.80California 179.8 99.6 13.9 0.32
Colorado 60.8 33.3 6.8 1.29Connecticut 52.6 33.1 4.6 0.89Delaware 25.9 16.0 2.8 2.34District of Columbia 22.8 14.2 2.3 2.41Florida 123.8 77.1 11.1 0.41
Georgia 85.0 47.1 6.6 0.64Hawaii 30.1 20.5 2.5 1.28Idaho 33.3 19.2 2.9 1.64Illinois 103.5 62.0 10.9 0.61Indiana 73.4 43.9 8.9 0.98
Iowa 50.1 29.7 3.6 0.87Kansas 48.2 29.3 4.8 1.19Kentucky 61.0 39.0 5.0 0.70Louisiana 61.7 38.9 6.0 0.84Maine 33.7 21.0 2.8 1.35
Maryland 68.1 42.8 6.0 0.70Massachusetts 74.4 46.5 7.3 0.72Michigan 94.1 56.3 7.3 0.50Minnesota 64.8 37.4 7.7 1.16Mississippi 47.9 30.4 3.1 0.73
Missouri 70.5 44.1 5.6 0.61Montana 28.5 18.0 2.9 1.86Nebraska 37.9 22.6 3.3 1.37Nevada 40.7 24.6 4.3 1.49New Hampshire 32.6 19.8 3.1 1.68
New Jersey 83.4 52.2 9.2 0.72New Mexico 39.4 24.3 3.0 1.07New York 130.4 81.7 13.4 0.44North Carolina 84.2 50.7 5.6 0.47North Dakota 23.6 14.9 1.2 1.14
Ohio 101.0 61.1 8.9 0.52Oklahoma 54.8 34.6 4.9 0.86Oregon 54.4 32.5 6.8 1.35Pennsylvania 104.0 66.7 8.3 0.41Rhode Island 29.2 18.9 2.9 1.71
South Carolina 59.0 37.5 2.3 0.36South Dakota 25.0 15.6 2.0 1.76Tennessee 70.2 41.9 2.4 0.30Texas 138.5 78.0 11.7 0.42Utah 39.6 22.6 3.5 1.47
Vermont 23.1 14.3 2.1 2.14Virginia 79.8 47.6 9.5 0.89Washington 72.5 41.1 5.9 0.75West Virginia 40.5 27.0 4.5 1.30Wisconsin 68.7 40.1 5.8 0.77Wyoming 20.9 12.8 2.5 3.23SOURCE: U.S. Department of Commerce, Bureau of the Census, Current Population Survey (CPS), October Supplement, "Household Use of Public Libraries," 2002.
[Numbers in thousands]
Households with members age 55 or older that used a public library in the past month for a program or activity for people age 55 or older
State
A-23

Table A-19. Standard errors for number and percent of households that used a public library or bookmobile in the past month to attend a lecture, meeting, or discussion Table A-19. group, by selected household characteristics: October 2002
Household characteristic Number Percent
All 806 72 0.1
Distance from home to public library Less than 1 mile 273 39 0.2 1-2 miles 330 39 0.1 3-5 miles 325 37 0.1 6-10 miles 177 21 0.2 More than 10 miles 126 13 0.2
Geographic region Northeast 241 34 0.2 Midwest 276 34 0.1 South 374 38 0.1 West 266 35 0.1
Metropolitan status Unclassified 23 † † City center 288 36 0.1 Metropolitan, not city center 511 55 0.1 Non_Metropolitan 244 27 0.1
Race/ethnicity White, non-hispanic 614 61 0.1 Black, non-hispanic 193 26 0.2 Hispanic 168 20 0.2 Asian/pacific islander 85 † † Other 32 † † Mixed race/ethnicity 113 17 0.3
Highest Education in the household Less than high school 163 13 0.1 High school/GED 306 24 0.1 Some postsecondary 327 38 0.1 Baccalaureate 256 38 0.2 Advanced degree 190 38 0.3
Income level Lowest fifth 251 27 0.1 Middle three fifths 538 55 0.1 Highest fifth 251 36 0.2
Household below poverty line 186 20 0.1
Household composition Two-parent household 281 35 0.1 Single mother with children 152 21 0.2 Single father with children 71 † † Other family with children 54 † † Single male 179 17 0.1 Single female 212 29 0.2 Other household without children 383 45 0.1
Ages within household Under 18 369 43 0.1 18-64 701 64 0.1 65 and older 273 37 0.1
Households with college student 136 23 0.3
Households with college or University library user 169 33 0.3
Households with homemaker 184 24 0.2
Households with a retired person 271 38 0.2
Households with a disabled person 155 20 0.2† Not applicable.
Households that used a public library in the past month to attend a lecture, meeting, or discussion group
Total households
SOURCE: U.S. Department of Commerce, Bureau of the Census, Current Population Survey (CPS), October Supplement, "Household Use of Public Libraries", 2002.
[Numbers in thousands]
A-24

Table A-20. Standard errors for number and percent of households with children under age 18 that used a public library or bookmobile for an activity for children Table A-20. under age 13, for teenagers ages 13 to 18, or for a school or class assignment, or used a school library in the past month, by selected householdTable A-20. characteristics: October 2002
Household characteristic Number Percent Number Percent Number Percent Number Percent
All 369 94 0.2 50 0.1 145 0.3 229 0.4
Distance from library Less than 1 mile 145 48 0.5 26 0.3 72 0.7 94 0.8 1-2 miles 171 52 0.4 28 0.2 80 0.6 114 0.7 3-5 miles 175 49 0.4 26 0.2 73 0.5 117 0.7 6-10 miles 101 27 0.6 16 0.4 42 0.8 70 1.1 More than 10 miles 73 16 0.7 † † 25 1.0 52 1.5
Geographic region Northeast 129 42 0.6 21 0.3 61 0.7 86 0.9 Midwest 146 45 0.5 22 0.2 70 0.7 105 0.8 South 193 52 0.3 28 0.2 77 0.5 125 0.6 West 149 44 0.5 28 0.3 68 0.6 97 0.8
Metropolitan status Unclassified 13 † † † † † † 11 7.7 City center 148 44 0.5 29 0.3 69 0.7 91 0.8 Metropolitan, not city center 260 72 0.3 37 0.2 112 0.4 170 0.5 Non_Metropolitan 129 36 0.5 18 0.3 50 0.6 91 0.9
Race/ethnicity White, non-hispanic 265 70 0.3 33 0.1 109 0.4 177 0.5 Black, non-hispanic 119 39 0.7 24 0.4 58 0.9 75 1.0 Hispanic 122 37 0.7 24 0.5 53 0.9 77 1.1 Asian/pacific islander 56 19 1.2 15 1.0 28 1.7 35 1.9 Other 22 † † † † 9 3.7 15 4.9 Mixed race/ethnicity 84 26 0.8 15 0.5 39 1.1 56 1.3
Highest Education in the household Less than high school 83 22 0.7 15 0.5 32 1.0 52 1.3 High school/GED 158 39 0.4 24 0.2 62 0.6 103 0.7 Some postsecondary 180 49 0.4 29 0.2 82 0.6 121 0.6 Baccalaureate 143 48 0.5 23 0.3 68 0.7 96 0.8 Advanced degree 107 41 0.8 19 0.4 54 0.9 75 1.0
Income level Lowest fifth 116 32 0.5 21 0.3 45 0.7 72 0.9 Middle three-fifths 264 71 0.3 38 0.2 109 0.4 169 0.5 Highest fifth 154 49 0.5 26 0.3 76 0.7 109 0.70 0 0 0 0Households below poverty level 118 33 0.5 22 0.4 48 0.7 75 0.9
Household composition Two-parent household 281 79 0.3 41 0.2 119 0.4 183 0.5 Single mother with children 152 42 0.4 24 0.3 67 0.6 98 0.7 Single father with children 71 19 0.8 13 0.6 30 1.2 47 1.5 Other family with children 54 13 1.0 † † 24 1.6 35 2.0
Households with homemaker 149 50 0.5 23 0.3 60 0.6 88 0.7† Not applicable.
[Numbers in thousands]
SOURCE: U.S. Department of Commerce, Bureau of the Census, Current Population Survey (CPS), October Supplement, "Household Use of Public Libraries", 2002.
School assignment Used school library Households
with children
under 18
Programs for children under age 13
Programs for teenagers age 13-18
Households that used a public library
A-25

Table A-21. Standard errors for number and percent of households that used a public library or bookmobile for a school or class assignment in the past Table A-21. month, by selected household characteristics: October 2002
Household characteristic Number Percent
All 806 163 0.1
Geographic region Northeast 241 67 0.3 Midwest 276 77 0.3 South 374 85 0.2 West 266 78 0.3
Distance from library Less than 1 mile 273 80 0.3 1-2 miles 330 89 0.2 3-5 miles 325 82 0.2 6-10 miles 177 45 0.4 More than 10 miles 126 28 0.4
Metropolitan status Unclassified 23 † † City center 288 79 0.3 Metropolitan, not city center 511 124 0.2 Non_Metropolitan 244 54 0.2
Race/ethnicity White, non-hispanic 614 124 0.1 Black, non-hispanic 193 64 0.5 Hispanic 168 58 0.6 Asian/pacific islander 85 32 0.9 Other 32 10 2.0 Mixed race/ethnicity 113 42 0.7
Highest education level in household Less than high school 163 33 0.3 High school/GED 306 65 0.2 Some postsecondary 327 93 0.3 Baccalaureate 256 77 0.3 Advanced degree 190 61 0.4
Family income Lowest fifth 251 54 0.2 Middle three-fifths 538 122 0.2 Highest fifth 251 82 0.3
Household below poverty line 186 53 0.4
Household composition Two-parent household 281 119 0.4 Single mother with children 152 67 0.6 Single father with children 71 30 1.2 Other family with children 54 24 1.6 Single male 179 17 0.1 Single female 212 24 0.1 Other household without children 383 59 0.1
Ages within household Under 18 369 145 0.3 18-64 701 163 0.2 65 and older 273 34 0.1
Households with high school student 142 77 0.7
Households with college student 136 68 0.7
Households with school library user 244 116 0.5
Households with college or University library user 169 81 0.6† Not applicable.
Households that used a public library for a school or class assignment
SOURCE: U.S. Department of Commerce, Bureau of the Census, Current Population Survey (CPS), October Supplement, "Household Use of Public Libraries", 2002.
Total households
[Numbers in thousands]
A-26

Table A-22. Standard errors for number and percent of households that used a public library or bookmobile in the past month to use a computer or the Internet,
Household characteristic Total households Number Percent Number Percent
All 806 155 0.1 62 0.1
Geographic region Northeast 241 61 0.3 28 0.1 Midwest 276 74 0.3 30 0.1 South 374 83 0.2 35 0.1 West 266 72 0.3 30 0.1
Metropolitan status Unclassified 23 † † † † City center 288 78 0.3 35 0.1 Metropolitan, not city center 511 114 0.2 45 0.1 Non_Metropolitan 244 55 0.3 22 0.1
Race/ethnicity White, non-hispanic 614 117 0.1 43 0.1 Black, non-hispanic 193 64 0.5 29 0.2 Hispanic 168 54 0.6 30 0.3 Asian/pacific islander 85 27 0.8 14 0.4 Other 32 11 2.1 † † Mixed race/ethnicity 113 38 0.6 15 0.3
Highest education level in household Less than high school 163 33 0.3 19 0.2 High school/GED 306 66 0.2 31 0.1 Some postsecondary 327 86 0.2 34 0.1 Baccalaureate 256 72 0.3 27 0.1 Advanced degree 190 58 0.4 23 0.2
Family income Lowest fifth 251 60 0.3 28 0.1 Middle three-fifths 538 118 0.2 49 0.1 Highest fifth 251 68 0.3 23 0.1
Household below poverty line 186 55 0.4 28 0.2
Household composition Two-parent household 281 92 0.3 39 0.1 Single mother with children 152 59 0.6 26 0.3 Single father with children 71 26 1.0 11 0.5 Other family with children 54 17 1.2 † † Single male 179 35 0.3 13 0.1 Single female 212 39 0.2 17 0.1 Other household without children 383 77 0.2 31 0.1
Households with high school student 142 57 0.6 25 0.3
Households with college student 136 52 0.6 19 0.2
Households with disabled person 155 42 0.4 19 0.2
Household with retired person 271 47 0.2 21 0.1
Households with job-seeker 128 51 0.7 23 0.3† Not applicable.
Table A-22. or to learn how to use a computer or the Internet, by selected household characteristics: October 2002[Numbers in thousands]
Households that used a public library to use a computer or the Internet
Households that used a public library to learn how to use a computer or the Internet
SOURCE: U.S. Department of Commerce, Bureau of the Census, Current Population Survey (CPS), October Supplement, "Household Use of Public Libraries", 2002.
A-27

Table A-23. Standard errors for number and percent of households that used a public library or bookmobile in the past month to get information to help find a job, Table A-23. by selected household characteristics: October 2002
Household characteristic Total households Number Percent
All 806 67 0.1
Region Northeast 241 29 0.1 Midwest 276 34 0.1 South 374 35 0.1 West 266 35 0.1
Distance from library Less than 1 mile 273 37 0.1 1-2 miles 330 37 0.1 3-5 miles 325 36 0.1 6-10 miles 177 19 0.1 More than 10 miles 126 † †
Metro Unclassified 23 † † City center 288 38 0.1 Metropolitan, not city center 511 50 0.1 Non_Metropolitan 244 23 0.1
Highest education level in household Less than high school 163 15 0.1 High school/GED 306 30 0.1 Post high school 327 38 0.1 BA/BS 256 34 0.1 Graduate 190 25 0.2
Family income Lowest fifth 251 30 0.1 Middle three-fifths 538 51 0.1 Highest fifth 251 30 0.1
Households below poverty line 186 29 0.2
Household composition Two-parent household 281 34 0.1 Single mother with children 152 25 0.3 Single father with children 71 † † Other family with children 54 † † Single male 179 20 0.2 Single female 212 21 0.1 Other household without children 383 40 0.1
Ages within household 567 50 0.1 Under 18 369 45 0.1 18-64 701 67 0.1 65 and older 273 18 0.1
Households with job-seeker 128 39 0.5
Households with retired person 271 19 0.1† Not applicable.
Households that used public library to get information to help find a job
SOURCE: U.S. Department of Commerce, Bureau of the Census, Current Population Survey (CPS), October Supplement, "Household Use of Public Libraries", 2002.
[Numbers in thousands]
A-28

Table A-24. Standard errors for number and percent of households with employed people that used a public library or bookmobile for a work assignment or to
Household characteristic Number Percent Number Percent
All 378 52 0.1 76 0.2
Geographic region Northeast 135 23 0.3 33 0.4 Midwest 155 26 0.3 35 0.4 South 194 28 0.2 42 0.3 West 146 25 0.3 38 0.4
Distance from library Less than 1 mile 148 27 0.3 36 0.4 1-2 miles 176 29 0.2 41 0.3 3-5 miles 177 28 0.2 42 0.3 6-10 miles 103 14 0.3 23 0.5 More than 10 miles 74 12 0.5 15 0.6
Metropolitan status Unclassified 14 † † † † City center 162 29 0.3 42 0.4 Metropolitan, not city center 257 39 0.2 56 0.2 Non_Metropolitan 130 17 0.2 26 0.4
Highest education level in household Less than high school 67 † † † † High school/GED 157 17 0.2 14 0.1 Some postsecondary 181 25 0.2 32 0.2 Baccalaureate 156 31 0.3 44 0.4 Advanced degree 117 28 0.5 49 0.8
Family income Lowest fifth 103 15 0.3 15 0.3 Middle three-fifths 284 41 0.2 56 0.2 Highest fifth 152 27 0.3 47 0.5
Household below poverty line 72 † † 11 0.4
Household with business or farm 122 23 0.4 29 0.4
Household occupation group Managerial and professional specialty 213 42 0.2 66 0.4 Technical, sales, and administrative support 173 23 0.2 30 0.3 Service 105 13 0.3 14 0.3 Precision production, craft, and repair 84 † † † † Operators, fabricators, and laborers 87 † † † † Farming, fishing, and forestry 38 † † † †† Not applicable.
Table A-24. keep up to date at work, or who used a work library, by selected household characteristics: October 2002
SOURCE: U.S. Department of Commerce, Bureau of the Census, Current Population Survey (CPS), October Supplement, "Household Use of Public Libraries", 2002.
[Numbers in thousands]
Households that used a public library for work-related research Households that used a work library
Households with employed people
A-29

Table A-25. Standard Errors for number and percent of households that used a public library or bookmobile in the past month to get information for personal Table A-25. use; or to borrow books, CD ROMs, tapes; or for another reason, by selected household characteristics: October 2002
Household characteristicTotal
households Number Percent Number Percent Number Percent
All 806 152 0.1 301 0.2 72 0.1
Race/ethnicity White, non-hispanic 614 129 0.1 244 0.2 61 0.1 Black, non-hispanic 193 50 0.4 87 0.6 24 0.2 Hispanic 168 36 0.4 77 0.7 21 0.2 Asian/pacific islander 85 23 0.7 48 1.2 12 0.4 Other 32 9 1.9 15 2.7 † † Mixed race/ethnicity 113 36 0.6 63 0.9 19 0.3
Family income Lowest fifth 251 52 0.2 92 0.4 28 0.1 Middle three-fifths 538 113 0.2 218 0.3 55 0.1 Highest fifth 251 76 0.3 137 0.5 36 0.2
Households below poverty level 186 42 0.3 78 0.5 23 0.2
Household composition Two-parent household 281 81 0.3 171 0.5 38 0.1 Single mother with children 152 43 0.4 88 0.7 21 0.2 Single father with children 71 19 0.8 39 1.4 † † Other family with children 54 15 1.1 30 1.9 † † Single male 179 39 0.3 55 0.4 22 0.2 Single female 212 48 0.3 77 0.4 28 0.2 Other household without children 383 89 0.2 146 0.3 41 0.1
Ages within household Under 18 369 96 0.2 208 0.4 46 0.1 18-64 701 142 0.1 281 0.2 67 0.1 65 and older 273 58 0.2 103 0.4 31 0.1
Household occupation group Unclassified 267 56 0.2 96 0.4 31 0.1 Managerial and professional specialty 336 97 0.3 175 0.4 47 0.1 Technical, sales, and administrative support 270 67 0.3 126 0.4 31 0.1 Service 162 39 0.4 76 0.6 19 0.2 Precision production, craft, and repair 129 31 0.4 57 0.7 15 0.2 Operators, fabricators, and laborers 137 31 0.4 60 0.7 17 0.2 Farming, fishing, and forestry 56 13 0.9 23 1.4 † † Armed forces † † † † † † †
Households with homemaker 184 51 0.4 99 0.6 24 0.2† Not applicable.
[Numbers in thousands]
SOURCE: U.S. Department of Commerce, Bureau of the Census, Current Population Survey (CPS), October Supplement, "Household Use of Public Libraries", 2002.
Households that used a public library to get
information for personal useHouseholds that used a public
library to borrow materials
Households that used a public library for
another reason
A-30

Table A-26. Standard errors for number and percent of households with members age 55, or older that used a public library or bookmobile in the past month Table A-26. for an activity for people age 55 or older, by selected household characteristics: October 2002
Household characteristic Number Percent
All 383 45 0.1
Geographic region Northeast 143 21 0.2 Midwest 152 23 0.2 South 200 25 0.2 West 142 20 0.2
Distance from public library Less than 1 mile 153 25 0.3 1-2 miles 183 26 0.2 3-5 miles 171 22 0.2 6-10 miles 102 13 0.3 More than 10 miles 76 † †
Metropolitan status Unclassified 15 † † City center 151 21 0.2 Metropolitan, not city center 258 35 0.2 Non_Metropolitan 149 18 0.2
Race/ethnicity White, non-hispanic 324 41 0.1 Black, non-hispanic 96 15 0.4 Hispanic 74 † † Asian/pacific islander 46 † † Other 19 † † Mixed race/ethnicity 52 † †
Highest education level in household Less than high school 118 † † High school/GED 181 18 0.1 Some postsecondary 163 24 0.2 Baccalaureate 124 22 0.3 Advanced degree 110 23 0.4
Family income Lowest fifth 162 19 0.2 Middle three-fifths 268 36 0.1 Highest fifth 124 18 0.3
Household below poverty line 105 12 0.2
Household composition Two-parent household 67 † † Single mother with children 47 † † Single father with children 22 † † Other family with children 38 † † Single male 98 12 0.3 Single female 158 22 0.2 Other household without children 259 36 0.2
Ages within household Under 18 95 † † 18-64 267 32 0.1 65 and older 273 37 0.1
Households with a disabled person 117 16 0.3
Households with retired person 266 38 0.2† Not applicable.SOURCE: U.S. Department of Commerce, Bureau of the Census, Current Population Survey (CPS), October Supplement, "Household Use of Public Libraries", 2002.
Number of households with membersage 55 or older
Households with members age 55 or older that used a public library in the past month for a program or activity for people age 55 or older
[Numbers in thousands]
A-31

Table A-27. Standard errors for number and percent of households with a disabled person that reported barriers to their use of the public library or bookmobile, Table A-27. by selected household characteristics: October 2002
Household characteristic Number Percentage
All 155 60 0.6
Geographic region Northeast 63 25 1.3 Midwest 70 26 1.1 South 91 37 0.9 West 66 28 1.3
Distance from library Less than 1 mile 73 30 1.1 1-2 miles 81 33 1.0 3-5 miles 76 30 1.0 6-10 miles 49 19 1.6 More than 10 miles 38 16 2.2
Metropolitan status Unclassified † † † City center 73 32 1.2 Metropolitan, not city center 109 42 0.8 Non_Metropolitan 69 26 1.1
Race/ethnicity White, non-hispanic 129 49 0.6 Black, non-hispanic 57 24 1.6 Hispanic 40 18 2.8 Asian/pacific islander 18 † † Other 11 † † Mixed race/ethnicity 35 15 2.4
Highest Education in the household Less than high school 61 27 1.4 High school/GED 84 32 0.9 Some postsecondary 80 32 1.0 Baccalaureate 51 21 1.6 Advanced degree 40 17 2.1
Income level Lowest fifth 92 39 0.9 Middle three-fifths 108 41 0.7 Highest fifth 44 17 1.8
Households below poverty level 74 31 1.1
Ages within household Under 18 72 27 1.1 18-64 130 49 0.6 65 and older 96 41 0.9† Not applicable.
Households with a disabled person that reported barriers to their use of the public library
SOURCE: U.S. Department of Commerce, Bureau of the Census, Current Population Survey (CPS), October Supplement, "Household Use of Public Libraries", 2002.
Households with a disabled person
[Numbers in thousands]
A-32

B-1
Appendix B: Technical Notes—The Current Population Survey Introduction
The Current Population Survey (CPS) is the source of the official government statistics on employment and unemployment. The CPS has been conducted monthly for over 50 years. Currently, it obtains interviews from between 50,000 and 60,000 households monthly, scientifically selected on the basis of area of residence to represent the nation as a whole, individual states, and other specified areas. Each household is interviewed once a month for four consecutive months one year, and again for the corresponding time period a year later. This technique makes it possible to obtain reliable month-to-month and year-to-year comparisons at a reasonable cost while minimizing the inconvenience to any one household.
Although the main purpose of the survey is to collect information on the employment situation, a very important secondary purpose is to collect information on demographic characteristics such as age, sex, race, marital status, education, family relationship, occupation, and industry. The statistics resulting from these questions serve to update similar information collected once every 10 years through the decennial census.
Census Bureau staff conducted the October 2002 “Household Use of Public Libraries” survey as a supplement to that month’s Current Population Survey (CPS). While the school enrollment supplement is done every October, the library supplement is not scheduled to be conducted again. CPS Sample Design
The current CPS sample is selected based on 1990 census information. The first stage of the 1990 sample design created 2,007 geographic areas called primary sampling units (PSUs) that cover the entire United States. These PSUs were grouped into strata within each state. Some of these PSUs formed strata by themselves and were sampled with certainty, which is referred to as self-representing. Of the remaining nonself-representing PSUs, one PSU was selected from each stratum with the probability of selection proportional to the population of the PSU. A total of 754 PSUs containing 2,121 counties, minor civil divisions, and independent cities were selected for the sample. The second stage of the sample design selected housing units within these PSUs.
Approximately 72,000 housing units are assigned for interview each month, of which about 60,000 are occupied and thus eligible for interview. The remainder are units found to be destroyed, vacant, converted to nonresidential use, containing persons whose usual place of residence is elsewhere, or ineligible for other reasons. Of the 60,000 occupied housing units, approximately 5 percent are not interviewed in a given month due to temporary absence (vacation, etc.), the residents are not found at home after repeated attempts, inability of persons contacted to respond, unavailability for other reasons, and refusals to cooperate. The interviewed households included approximately 140,000 persons. A more precise explanation regarding the CPS sample design is provided in “Explanatory Notes and Estimates of Error: Household Data—Sampling” in any issue of Employment & Earnings (U.S. Department of Labor monthly).

B-2
Data Collection
The Census Bureau staff conducted interviews during the period of October 13–19, 2002. A designated “responsible” person (or “reference person”) in each sample household provided the answers for that household. The school enrollment items were asked about all people 3 years old or over, as appropriate. The library use items were asked of each household concerning library use and accessibility of public library resources to people with disabilities. Personal visits are preferred in the first month in which the household is in the sample. In other months, the interview generally is conducted by telephone. Approximately 70 percent of the households in any given month are interviewed by telephone.
Data Processing
The data processing involved a consistency edit and allocation module for all school enrollment items. The consistency edit ensured that entries within an individual record followed the correct skip pattern. Items with missing values were assigned values, if appropriate. When a response was not obtained for a particular data item, or an inconsistency in reported items is detected, an “imputed” response was entered in the field. Imputation was performed using a “hot deck” method, whereby a response from another sample person with similar demographic and economic characteristics was used for the nonresponse. The imputation procedure is performed one item at a time. In October 2002, the imputation rate for supplement items ranged from 4–7 percent per item.
Weights
The CPS estimation procedure involves weighting the data from each sample person. The base weight, which is the inverse of the probability of the person being in the sample, is a rough measure of the number of actual persons that the sample person represents. Almost all sample persons in the same state have the same base weight, but the weights across state are different. Selection probabilities may also differ for some sample areas due to field subsampling, which is done when areas selected for the sample contain many more households than expected. The base weights are then adjusted for noninterview, and the ratio estimation procedure is applied. The estimates in this report were calculated using the household weight. The household weight is equal to the family weight of the household reference person. The family weight is derived from the final weight of the reference person in each household. In most households, it is exactly the reference person’s weight. However, when the reference person is a married man, for purposes of family weights, he is given the same weight as his wife. This is done so that weighted tabulations of CPS data by sex and marital status show an equal number of married women and married men with their spouses present. For more specific on CPS weights, please see the CPS Technical Paper 63RV Design and Methodology, available online at http://www.census.gov/prod/2002pubs/tp63rv.pdf.

B-3
Standard Errors
In any sample survey, production of standard errors and significance tests is required in order to make any statements about one group being different from the next. The standard errors for the CPS are based on generalized variance functions (GVFs). The GVF is a simple model that expresses the variance as a function of the expected value of the survey estimate. The parameters of the model are estimated using direct replicate variances. These models provide a way to obtain an approximate standard error on numerous characteristics. Most importantly, variance estimates are based on sample data and have variances of their own. The variance estimate for a survey estimate for a particular month generally has less precision than the survey estimate itself. This means that the estimates of variance for the same characteristic may vary considerably from month-to-month or for related characteristics (that might actually have nearly the same level of precision) in a given month. Therefore, some method of stabilizing these estimates of variance, for example, by generalization or by averaging over time, is needed to improve their reliability. Experience has shown that certain groups of CPS estimates have a similar relationship between their variance and expected value. Modeling or generalization may provide more stable variance estimates by taking advantage of these similarities. The GVF that is used to estimate the variance of an estimated population total, X, is of the form
bXaXXVar += 2^
)( (1)
where X is the population total, ^X is the estimate of that total, and a and b are two parameters
estimated using least squares regression. The rationale for this form of the GVF model is the
assumption that the variance of ^X can be expressed as the product of the variance from a simple
random sample for a binomial random variable and a design effect. The design effect accounts for the effect of a complex sample design relative to a simple random sample. The parameters, a and b in (1), are estimated by use of the model for relative variance
XbaVx +=2 , (2)
where the relative variance (Vx2) is the variance divided by the square of the expected value of the estimate. The a and b parameters are estimated by fitting a model to a group of related estimates and their estimated relative variances. The relative variances are calculated using the successive difference replication method. The model fitting technique is an iterative weighted least squares procedure, where the weight is the inverse of the square of the predicted relative variance. The use of these weights prevents items with large relative variances from unduly influencing the estimates of the a and b parameters.

B-4
After the parameters a and b in expression (1) are determined, it is a simple matter to construct a table of standard errors of estimates for publication with a report. In practice, such tables show the standard errors that are appropriate for specific estimates, and the user is instructed to interpolate for figures not explicitly shown in the table. However, many reports present a list of the parameters, enabling data users to compute generalized variance estimates directly.
Significance Testing
All statements in the selected findings portion of this report were tested for significance at the .05 level using two-tailed t-tests. For the comparisons of state-level estimates to national estimates, a t-test was performed to determine which states were significantly above or below the national average. This t-test included a Bonferroni adjustment to account for multiple comparisons being made against the national average.

C-1
Appendix C: Questionnaire Following is a copy of the questionnaire for the Library Use Supplement to the October 2002 Current Population Survey. Question numbers are prefixed with an ‘L’ (for ‘Library Use Supplement’) and enclosed in “> <.” Each question is followed by the possible answers. The line “Blind <D> or <R>” is an instruction to the interviewer that “don’t know” answers, or refusals to answer are not options to be read to the respondent (i.e., they are “blind”), but if those are the answers given, they are to be coded as “D” and “R,” respectively. Instructions in bold font direct the interviewer to the next question to be asked.
>LPRESUP<
These next questions are about your household’s use of public libraries. This does not include school or college libraries, or special research libraries.
>L1< About how far would you say it is from your home to the closest public library? Would you say... <1> Less than 1 mile <2> 1 or 2 miles <3> 3 to 5 miles <4> 6 to 10 miles <5> More than 10 miles Blind <D> or <R> (In all cases, Go to L2) ====>_ >L2< In the past month, that is since (MONTH) (DAY), has any member of your household used a public library or bookmobile for any reason? <1> Yes (Skip to L4) <2> No (Go to PROBE) Blind <D> or <R> (Go to PROBE) ====>_

C-2
PROBE How about to borrow materials, take a class, to use the computers, or for activities for children? <1> Yes (Go to L4) <2> No (Skip to L3) Blind <D> or <R> (Skip to L3) >L3< Has anyone in your household used a public library or bookmobile in the past year, that is since October, 2001? <1> Yes <2> No Blind <D> or <R> (In all cases, Skip to L22)
====>_
>L4< Did this person use the library.... to borrow books, cds, or tapes? <1> Yes <2> No Blind <D> or <R> (In all cases, Go to L5) ====>_ >L5< To use a computer or the internet? <1> Yes <2> No Blind <D> or <R> (In all cases, Go to L6) ====>_ >L6< To learn how to use a computer or the internet? <1> Yes <2> No Blind <D> or <R> (In all cases, Go to L7) ====>_ >L7< For a program or activity for children under 13, such as a story hour? <1> Yes <2> No Blind <D> or <R> (In all cases, Go to L8) ====>_

C-3
>L8< For a program or activity for teenagers ages 13 to 18? <1> Yes <2> No Blind <D> or <R> (In all cases, Go to L9) ====>_ >L9< For a program or activity for people ages 55 and over? <1> Yes <2> No Blind <D> or <R> (In all cases, Go to L10) ====>_ >L10< To attend a lecture, meeting, or discussion group? <1> Yes <2> No Blind <D> or <R> (In all cases, Go to L11) ====>_ >L11< To borrow materials for people with physical disabilities, including visual or hearing impairments or other health impairments? <1> Yes <2> No Blind <D> or <R> (In all cases, Go to L12) ====>_ >L12< To borrow materials in a language other than English? <1> Yes <2> No Blind <D> or <R> (In all cases, Go to L13) ====>_ >L13< To work with a tutor or take a class to learn to read? <1> Yes <2> No Blind <D> or <R> (In all cases, Go to L14) ====>_

C-4
>L14< To learn to read or speak English as a second language? <1> Yes <2> No Blind <D> or <R> (In all cases, Go to L15) ====>_ >L15< For a school or class assignment? <1> Yes <2> No Blind <D> or <R> (In all cases, Go to L16) ====>_ >L16< To get information to help find a job? <1> Yes <2> No Blind <D> or <R> (In all cases, Go to L17) ====>_ >L17< For a work assignment or to keep up to date at work? <1> Yes <2> No Blind <D> or <R> (In all cases, Go to L18) ====>_ >L18< To get information for personal use, such as consumer or health issues, investments, and so on? <1> Yes <2> No Blind <D> or <R> (In all cases, Go to L19) ====>_ >L19< For enjoyment or hobbies? <1> Yes <2> No
Blind <D> or <R> (In all cases, Go to L20) ====>_

C-5
>L20< For any other reason? <1> Yes (Specify and fill-in) <2> No
Blind <D> or <R> (In all cases, Go to L21) ====>_
>L21< Has anyone in your household used the internet from outside of the library to access library resources? <1> Yes <2> No
Blind <D> or <R> (In all cases, Go to L22) ====>_
>L22< Does anyone in your household have a long-lasting physical, mental, or emotional condition, that limits participation in the activities done by most people? <1> Yes (Go to L22a) <2> No (Skip to L23) Blind <D> or <R> (Skip to L23) ====>_ >L22a< Are any of the factors listed below barriers to their use of the public library? <1> Yes <2> No a. Insufficient accessibility to the library building or other facilities ====>_ b. Lack of assistive or adaptive devices for people with disabilities ====>_ c. Insufficient library materials for the blind or physically disabled ====>_ d. Other (specify) ====>_
Blind <D> or <R> (In all cases, Go to L22b) ====>_

C-6
>L22b< Has your public library made it easier for people in your household with physical, mental, or emotional conditions to...? <1> Yes <2> No a. Access library facilities ====>_ b. Have access to assistive or adaptive devices for people with disabilities ====>_ c. Have access to sufficient library materials for the blind and physically disabled ====>_ d. Other (specify) ====>_
Blind <D> or <R> (In all cases, Go to L23) ====>_
>L23< Have anyone in your household used any other type of library in the past month, such as a school library, a university or college library or a work library? <1> Yes (Go to L23a) <2> No (Skip to END)
Blind <D> or <R> (Skip to END) ====>
>L23a< What kind of library? <1> University or college library <2> Other school library <3> Work library
<4> Other library (Specify) Blind <D> or <R> (In all cases, Go to END) =====>

D-1
Appendix D: Glossary COLLEGE STUDENT. These are household members who reported being enrolled in either college or a university in the previous week (CPS variables PESCHENR and PESCHLVL). DISABLED PERSON. As part of the library supplement, the household respondent was asked whether anyone in the household had “a long-lasting physical, mental, or emotional condition, that limits participation in the activities done by most people.” Those households in which the respondent answered “yes” to this question were classified as a household with a disabled person. EDUCATION LEVEL. This reflects the highest education level among household members. It is derived from the CPS variable for the highest level of school completed or degree received (PEEDUCA). FAMILY INCOME. Family income is derived from a single question asked of the household respondent. Income includes money from all sources including jobs, business, interest, rent, social security payments, and so forth that was received in the preceding 12 months. The income of all family members 15 years old and over is included. Income is reported in fourteen categories ranging from “less than $5,000” to “$75,000” or more.” HIGH SCHOOL STUDENT. These are household members who reported being enrolled in high school in the previous week (CPS variables PESCHENR and PESCHLVL). HOUSEHOLD COMPOSITION. Households were classified as either households with children or households without children. Those with children were further divided into two-parent households, single mother households, single father households and “others.” Those without children were further divided into single male households, single female households, and “others.” HOMEMAKER. Homemakers were those household member not currently employed and whose current situation was best described as “taking care of house or family,” as opposed to disabled, ill, in school or retired (CPS variable PENLFACT). JOB SEEKER. Job seekers were those household members who answered “yes” to the question, “Have you been doing anything to find work during the last 4 weeks?” (CPS variable PULK). METROPOLITAN STATUS. The metropolitan status used in this report is a composite of two CPS variables: Central City Status (GEMSAST) and Metropolitan Status (GEMETSTA). Those households identified as “central city” by their “Central City Status” were so classified for this report. All other households were classified as either “metropolitan, not city center” or “non-metropolitan” according to their “Metropolitan Status.”

D-2
NATIVITY / ETHNICITY. This is the status of the highest wage-earner in the household. The CPS “country of birth” variable (PENATVTY) was used to distinguish between those born in the U.S. and those born outside the U.S. The variables for parents’ places of birth (PEMNTVTY and PEFNTVTY) were used to determine first and second generation status. The Hispanic/non-Hispanic flag (PRHSPNON) was used to determine ethnicity. PERSONAL USE. Respondents were asked whether any household member had used a public library “to get information for personal use, such as consumer or health issues, investments, and so on.” POVERTY. Poverty status is deduced from household size and reported household income categories. Households with reported income in categories below the poverty threshold for their household size (as defined by the U.S. Census Bureau for 2002) were classified as poor, and those households with income categories above the poverty threshold were classified as not poor. Some households reported income in a range that straddles the poverty threshold. It is likely that some of these households meet the Census Bureau definition of poverty and that some do not, but the CPS data do not allow discrimination between poor and non-poor status for these households. For the purposes of this analysis, all households in an income category that straddles a poverty threshold were classified as poor. For example, the poverty threshold for a family of three persons including one related child in 2002 was $14,480. A family of three that reported an income in the category “12,500 to $14,999” is classified as poor in this analysis. PROGRAMS FOR CHILDREN. Respondents were asked whether any household member had used a public library “for a program or activity for children under 13, such as story hour.” PROGRAMS FOR TEENAGERS. Respondents were asked whether any household member had used a public library “for a program or activity for teenagers, ages 13 to 18.” RACE/ETHNICITY. Race/Ethnicity is based on the race/ethnicity of all members of the household. If more than one category of race/ethnicity was reported for household members, the household was classified as “Mixed race/ethnicity.”

D-3
REGION. The geographic regions used in this report are as follows. Northeast Connecticut Maine Massachusetts New Hampshire New Jersey New York
Pennsylvania Rhode Island Vermont
Midwest Illinois Indiana Iowa Kansas Michigan Minnesota Missouri Nebraska North Dakota Ohio South Dakota Wisconsin South Alabama Arkansas Delaware District of Columbia Florida Georgia Kentucky Louisiana Maryland Mississippi
North Carolina Oklahoma South Carolina Tennessee Texas Virginia West Virginia
West Alaska Arizona California Colorado Hawaii Idaho Montana Nevada New Mexico Oregon Utah Washington Wyoming RETIRED PERSON. Retired persons were those household members whose status was “retired,” as opposed to employed, unemployed, or disables (CPS variable PEMLR).

D-4
TYPE OF LIBRARY. Four types of libraries were used in this report: public, school, university or college and work. These categories were not precisely defined for respondents. At the beginning of the survey, respondents were told that public libraries do not include “school or college libraries, or special research libraries.” After the questions about use of public libraries, respondents were asked whether anyone in the household had used “… any other type of library in the past month, such as a school library, a university or college library or a work library …”