hosted by the international inequalities institute the ... · hosted by the international...
TRANSCRIPT
Hosted by the International Inequalities InstituteThe Evolution of Global Inequalities: the impact on politics and the economy
Professor Branko MilanovicSenior Scholar, Luxembourg Income Study Centre Visiting Presidential Professor, Graduate Centre, City University of New York
Hashtag for Twitter users: #LSEBranko
Professor Mike SavageChair, LSE

Inequality in the age of globalization
Branko MilanovicSpring/Summer 2017
Branko Milanovic
Largely based on:
3

Brief structure of the talk
• Global inequality: in the past and now• Technical problems of measurement• How the world has changed between 1988 and 2013• [Political implications of the changes]• [Kuznets waves?]• Issues of justice, politics and migration
Branko Milanovic
1. Global inequality: key developments
Branko Milanovic

Branko MilanovicHistory…/the past.xls
30
35
40
45
50
55
60
65
70
75
1800 1850 1900 1950 2000 2050
Global and US Gini over two centuries
Global (BM)
Global (LM)
US inequality
Lahoti, Jayadev, Reddy
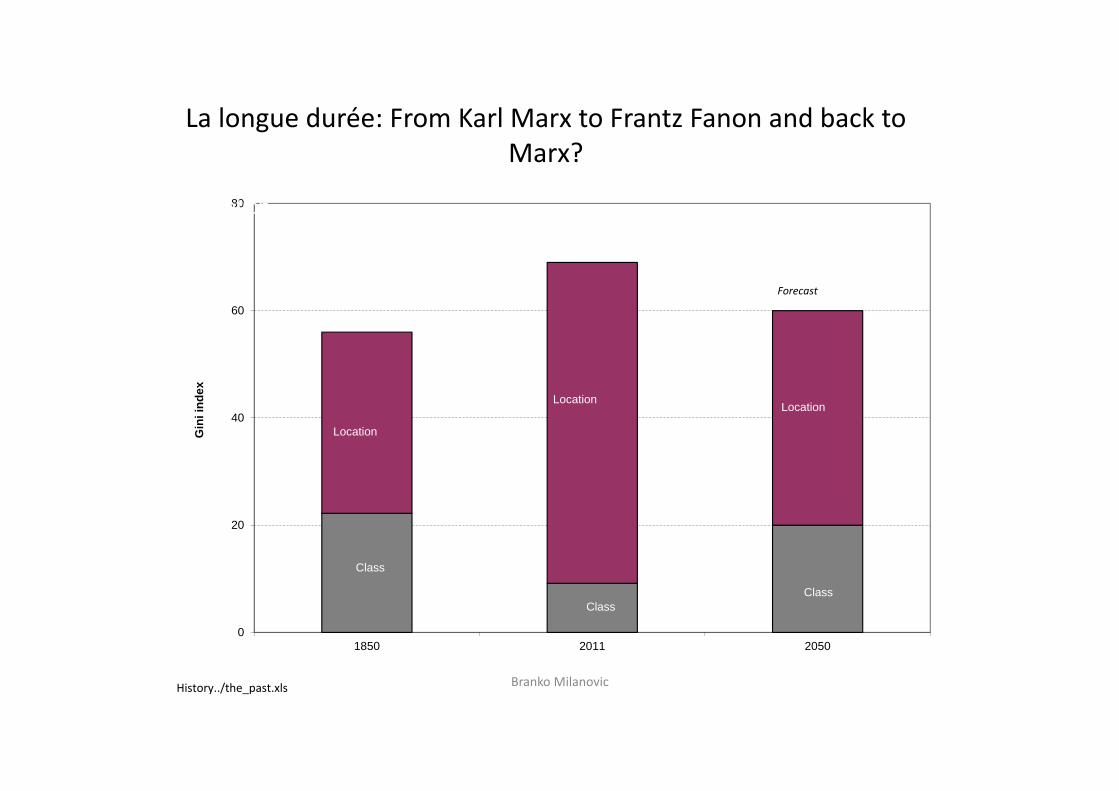
La longue durée: From Karl Marx to Frantz Fanon and back to Marx?
Branko Milanovic
0
20
40
60
80
1850 2011 2050
Gin
i ind
ex
Class
Location
Location
Class
Location
Location
Class
Forecast
History../the_past.xls

• In the long‐run inequality is determined by the spread of the technological revolutions: the West in the 19th century, Asia today
• In the medium‐run global inequality is determined by:
• What happens to within‐country income distributions?
• Is there a catching up of poor countries? • Are mean incomes of populous & large countries (China, India) growing faster or slower that the rich world?
Branko Milanovic
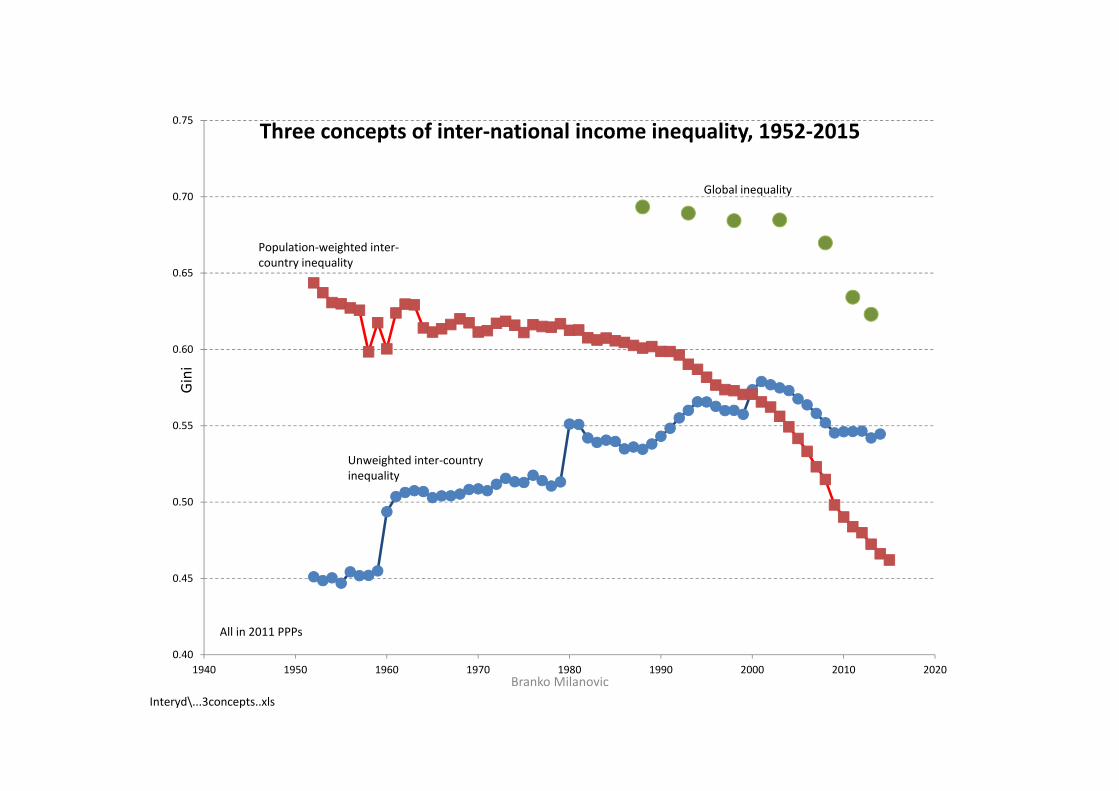
Branko MilanovicInteryd\...3concepts..xls
0.40
0.45
0.50
0.55
0.60
0.65
0.70
0.75
1940 1950 1960 1970 1980 1990 2000 2010 2020
Gini
Three concepts of inter‐national income inequality, 1952‐2015
Global inequality
Population‐weighted inter‐country inequality
Unweighted inter‐country inequality
All in 2011 PPPs
Branko Milanovic
0.0
0.5
1.0
1.5
2.0
2.5
3.0
3.5
4.0
4.5
0.0
2.0
4.0
6.0
8.0
10.0
12.0
14.0
16.0
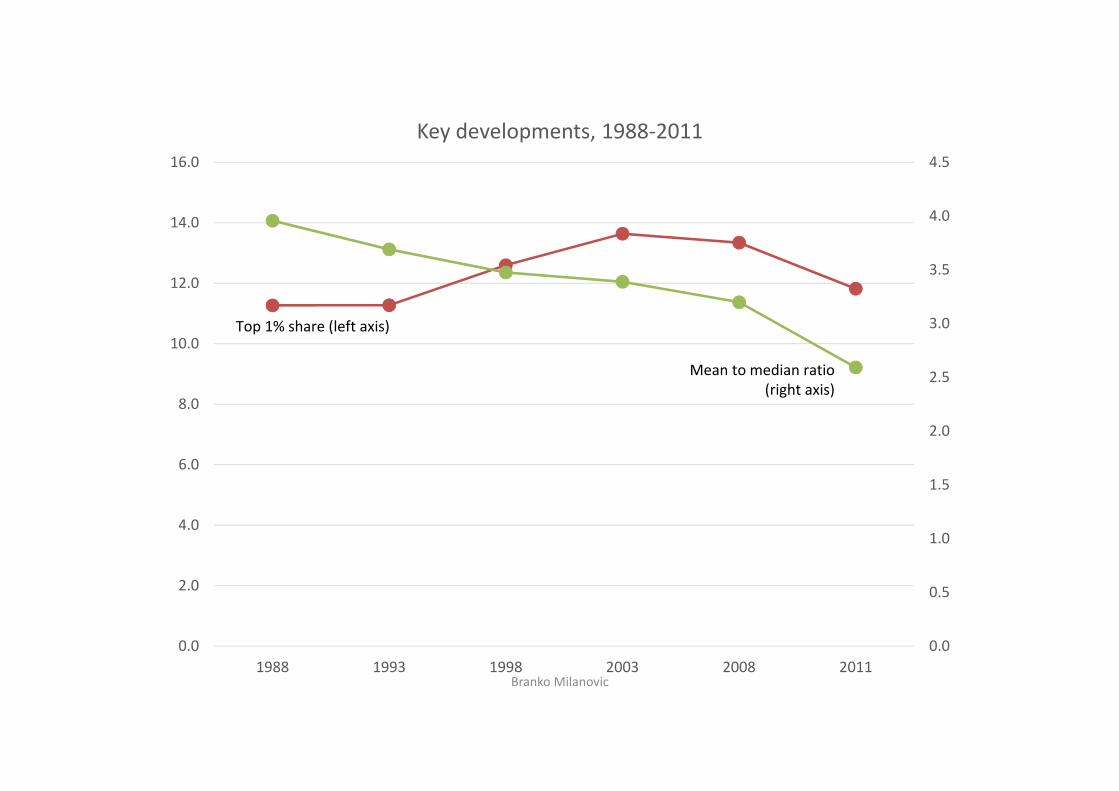
1988 1993 1998 2003 2008 2011
Key developments, 1988‐2011
Top 1% share (left axis)
Mean to median ratio (right axis)

60
61
62
63
64
65
66
67
68
69
70
0
5
10
15
20
25
30
1988 1993 1998 2003 2008 2011
Global G
ini
Percen
tage of relatively po
or
Axis Title
Gini and percentage of world population with income less than 1/2 global median, 1988‐2011
% ppl under 1/2 median Gini with 2011 PPPs
Summary.xls

0.2
.4.6
.8de
nsity
600
2100
5500
1460
0
log of annual PPP real income
Global income distribution in 2011 with 2011 PPPs
twoway (kdensity loginc_11_11 [w=popu] if loginc_11_11>2 & bin_year==2011, bwidth(0.2)) , legend(off) title(Global income distribution in 2011 with 2011 PPPs) xtitle(log of annual PPP real income) ytitle(density) xlabel(2.8"600" 3.3"2100" 3.74"5500" 4.2"14600", labsize(small) angle(90))Using combine88_11.dta
10% 73%91%50%
Median of WENAO
Global mean
Global median
Absolute poverty
Large gaps in mean country incomes raise two important issues
• Political philosophy: is the “citizenship rent” morally acceptable? Does global equality of opportunity matter?
• Global and national politics: Migration and national welfare state
• (will address both at the end)
Branko Milanovic

Different countries and income classes in global income distribution in 2008
From calcu08.dta
USA
India
Brazil
China
Russia
110
2030
4050
6070
8090
100
perc
entil
e of
wor
ld in
com
e di
strib
utio
n
1 20 40 60 80 100country percentile
Branko Milanovic
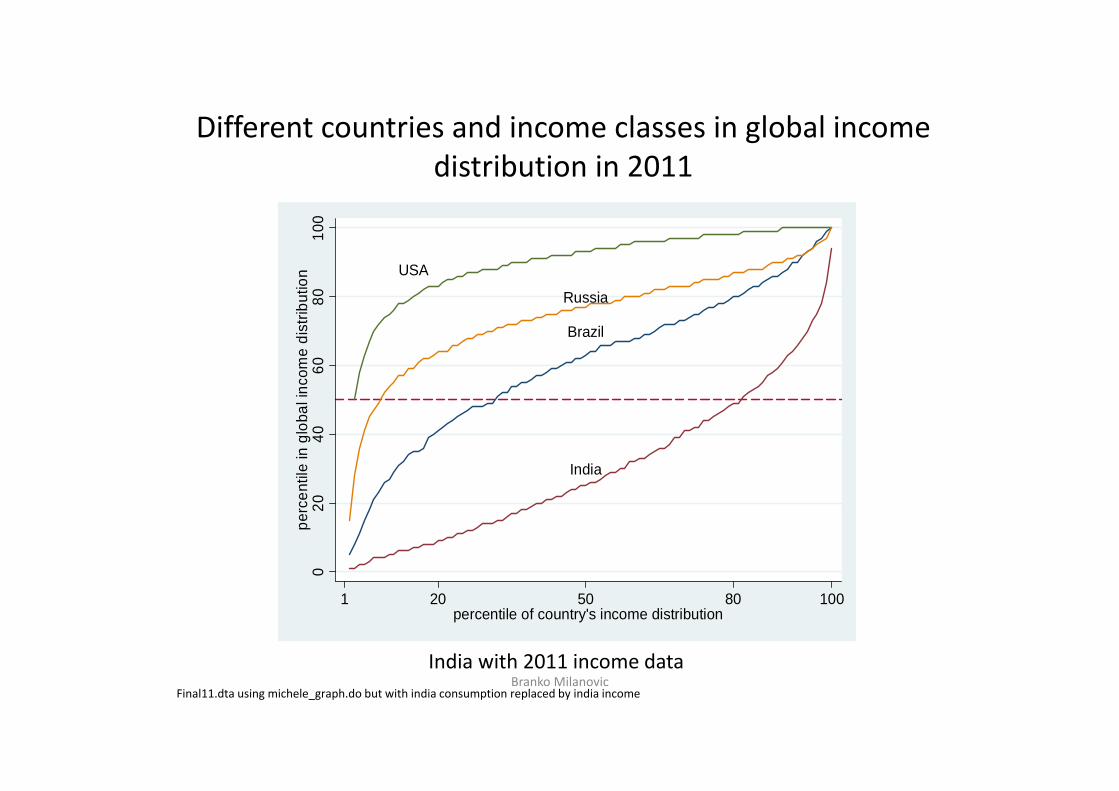
Different countries and income classes in global income distribution in 2011
Branko MilanovicIndia with 2011 income data
Final11.dta using michele_graph.do but with india consumption replaced by india income
USA
Russia
Brazil
India
020
4060
8010
0pe
rcen
tile
in g
loba
l inc
ome
dist
ribut
ion
1 20 50 80 100percentile of country's income distribution
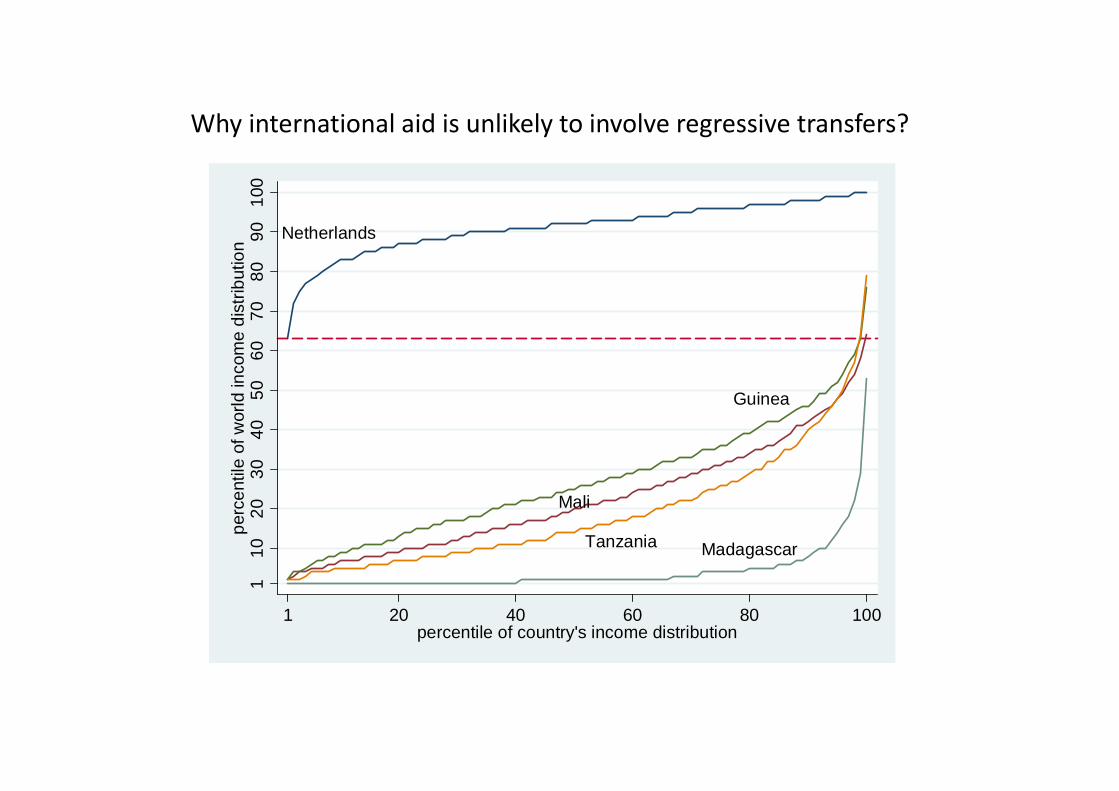
Netherlands
Madagascar
Mali
Tanzania
Guinea
110
2030
4050
6070
8090
100
perc
entil
e of
wor
ld in
com
e di
strib
utio
n
1 20 40 60 80 100percentile of country's income distribution
Why international aid is unlikely to involve regressive transfers?
2. Technical issues in the measurement of global inequality
Branko Milanovic

Three important technical issues in the measurement of global inequality
• The ever‐changing PPPs in particular for populous countries like China and India
• The increasing discrepancy between GDP per capita and HS means, or more importantly consumption per capita and HS means
• Inadequate coverage of top 1% (related also to the previous point)
Branko Milanovic
The issue of PPPs
Branko Milanovic
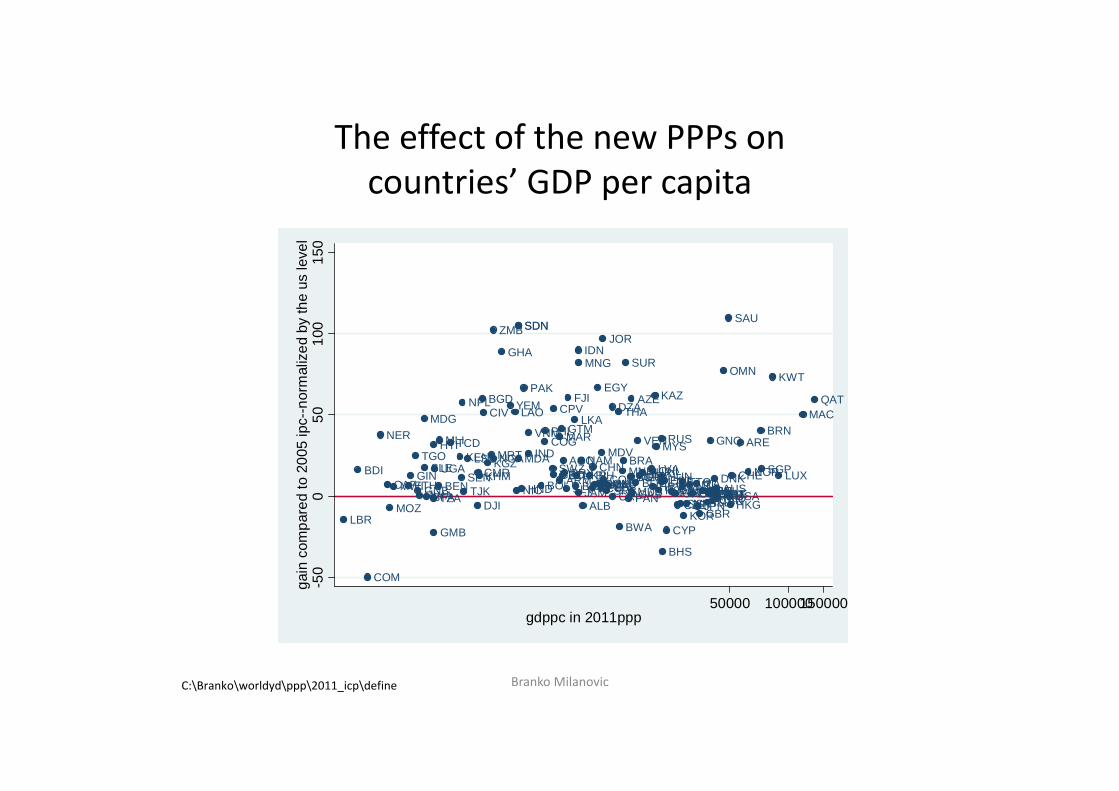
The effect of the new PPPs on countries’ GDP per capita
Branko Milanovic
EGYPAK
ETH
LAOBGD
IND
VNM
UGAKHM
TZA
MDGNPL
GMB
BDI
LKAYEM
SLEBTN
TJKGIN BLR
KGZKEN
NIC
THA
IDN
MRT
PHL
JOR
DZA
TUNMKD
MNG
BOLUKR
RWA
MLI
ALBBFA
BEN
MAR
TGO
AZE
SDNSDN
GHA
GTM
GNB
NER
BGRMDA
HTI MYSNGA
CMR
CIV
MWI
ZMBSAU
OMN
SEN ARMSLV SRBDOM
GEO MNE
TWNBIH
LBR
HND ECUDJI
TCD
PRYSWZLSO
CAFCHN
KAZ
PAN
BWA
MOZ
PER MUS
SUR
BRNMAC
BLZ
FJI
MDV
COM
TUR
RUS
CPV
COG
TTOHUNPOL
MEX
KWT
GNQ
COLJAM
LTU
VEN
NAM
ZAF
QAT
GABCRI
LVA
ARE
HKGSVK
SGPHRVCHL
AGO
EST
CZEKOR
MLTURY
SVNPRT
BRA
CYP
BHS
GRCESP USAITA
DEUISR
GBRIRLISLAUTNLDBELNZLFRA
CAN
LUXFIN
JPNSWEDNKAUS
NORCHE
-50
050
100
150
gain
com
pare
d to
200
5 ip
c--n
orm
aliz
ed b
y th
e us
leve
l
50000 100000150000gdppc in 2011ppp
C:\Branko\worldyd\ppp\2011_icp\define

The effect of new PPPsCountry GDP per capita
increase (in %)GDP per capita increase population‐weighted (in %)
Indonesia 90 ‐‐‐
Pakistan 66 ‐‐‐
Russia 35 ‐‐‐
India 26 ‐‐‐
China 17 ‐‐‐
Africa 23 32
Asia 48 33
Latin America 13 17
Eastern Europe 16 24
WENAO 3 2
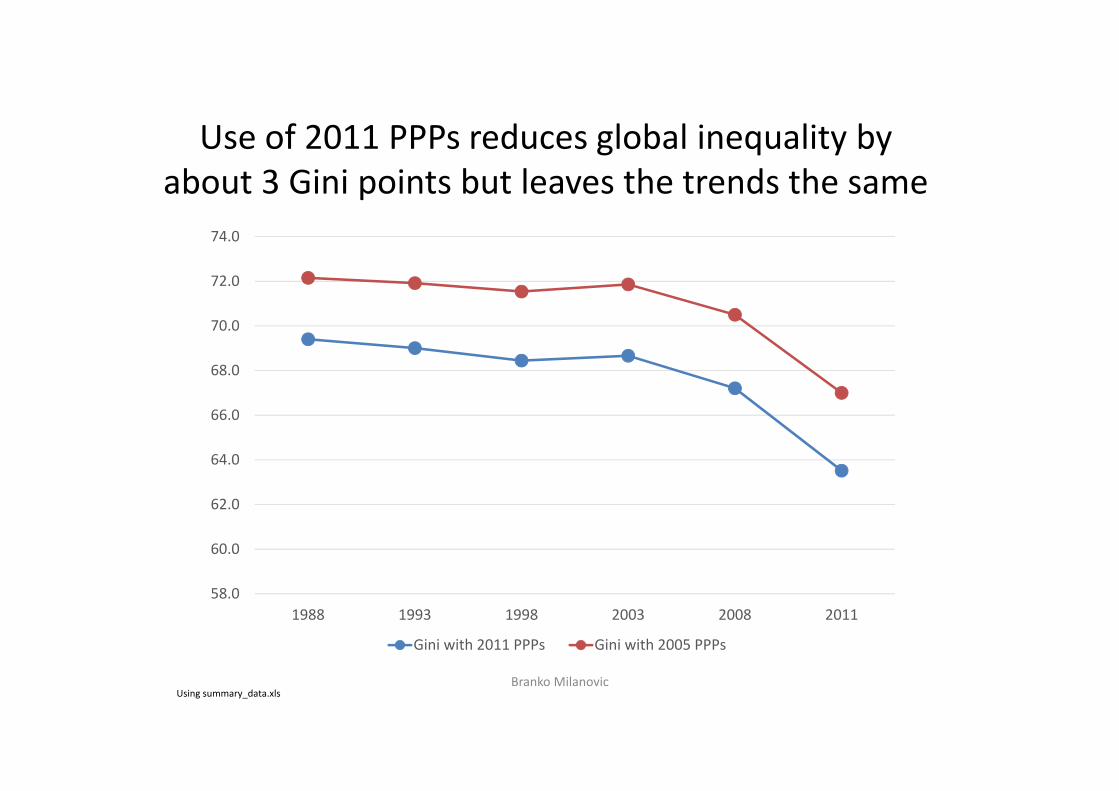
Use of 2011 PPPs reduces global inequality by about 3 Gini points but leaves the trends the same
Branko Milanovic
58.0
60.0
62.0
64.0
66.0
68.0
70.0
72.0
74.0
1988 1993 1998 2003 2008 2011
Gini with 2011 PPPs Gini with 2005 PPPs
Using summary_data.xls

The gap between national accounts and household surveys
Branko Milanovic
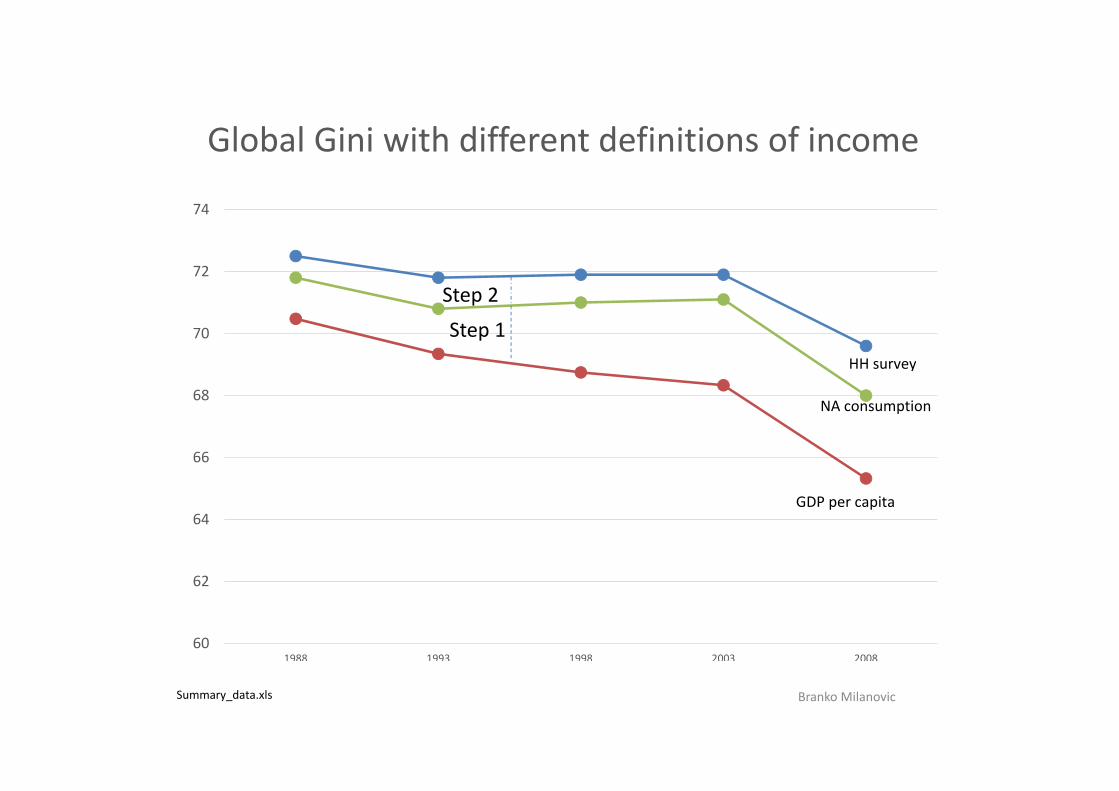
Global Gini with different definitions of income
Branko Milanovic
60
62
64
66
68
70
72
74
1988 1993 1998 2003 2008
HH survey
NA consumption
GDP per capita
Summary_data.xls
Step 2
Step 1

Step 1 driven by low consumption shares in China and India (although on an unweighted base C/GDP decreases with GDP)
Branko Milanovic
twoway scatter cons_gdp gdpppp if group==1 & cons_gdp<1.4 [w=totpop], xscale(log) xtitle(GDP per capita in ppp) xlabel(1000 10000 50000) ytitle(share of consumption in GDP) title(C/GDP from national accounts in year 2008) using final08,dta
.2.4
.6.8
11.
2sh
are
of c
onsu
mpt
ion
in G
DP
1000 10000 50000GDP per capita in ppp
C/GDP from national accounts in year 2008
China
India
USA
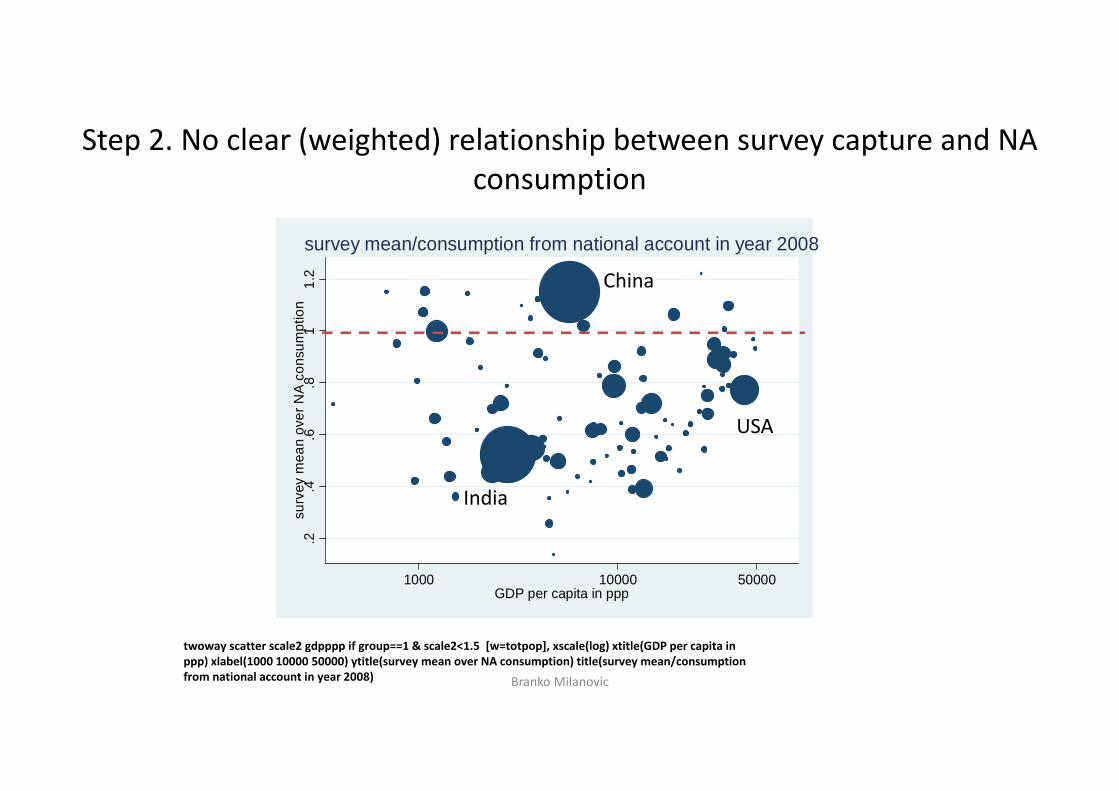
Step 2. No clear (weighted) relationship between survey capture and NA consumption
Branko Milanovic
.2.4
.6.8
11.
2su
rvey
mea
n ov
er N
A co
nsum
ptio
n
1000 10000 50000GDP per capita in ppp
survey mean/consumption from national account in year 2008
twoway scatter scale2 gdpppp if group==1 & scale2<1.5 [w=totpop], xscale(log) xtitle(GDP per capita in ppp) xlabel(1000 10000 50000) ytitle(survey mean over NA consumption) title(survey mean/consumption from national account in year 2008)
India
China
USA

The issue of top underestimation
Branko Milanovic

Rising NAC/HS gap and top underestimation
• If these two problems are really just one & the same problem.• Assign the entire positive (NA consumption – HS mean) gap to national top deciles
• Use Pareto interpolation to “elongate” the distribution• No a priori guarantee that global Gini will increase
Branko Milanovic
Branko Milanovic
0
2
4
6
8
10
12
14
16
18
20
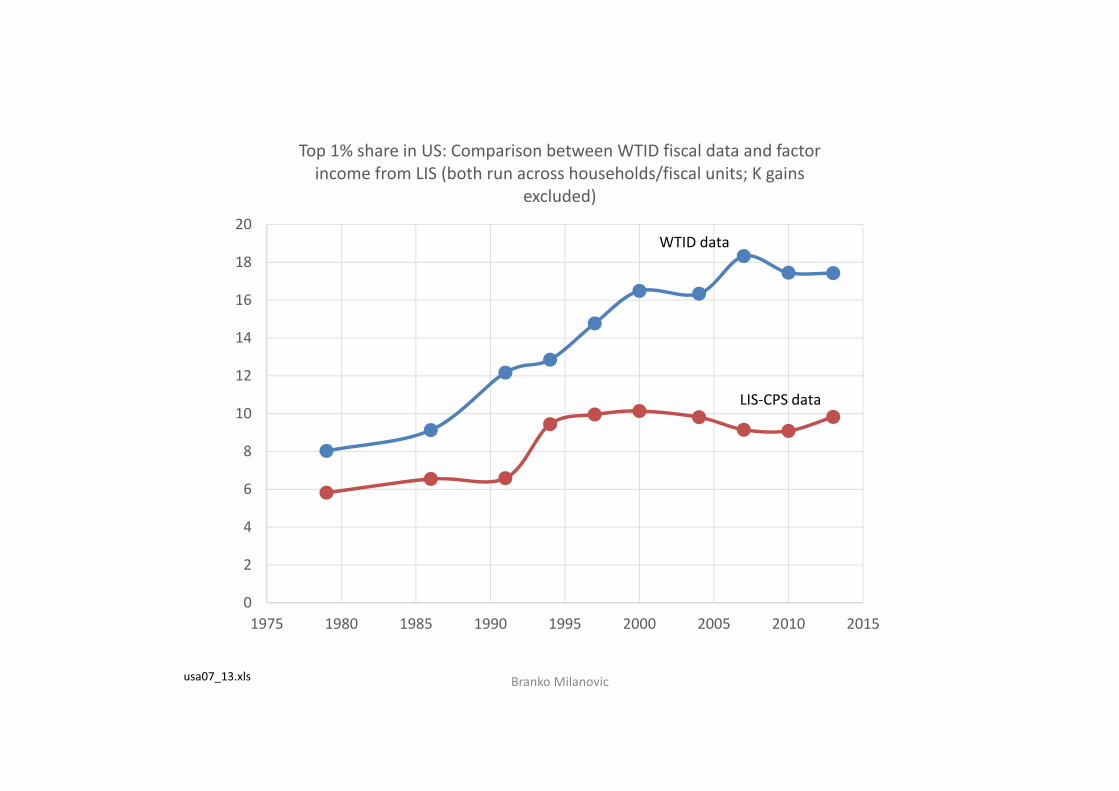
1975 1980 1985 1990 1995 2000 2005 2010 2015
Top 1% share in US: Comparison between WTID fiscal data and factor income from LIS (both run across households/fiscal units; K gains
excluded)
WTID data
LIS‐CPS data
usa07_13.xls
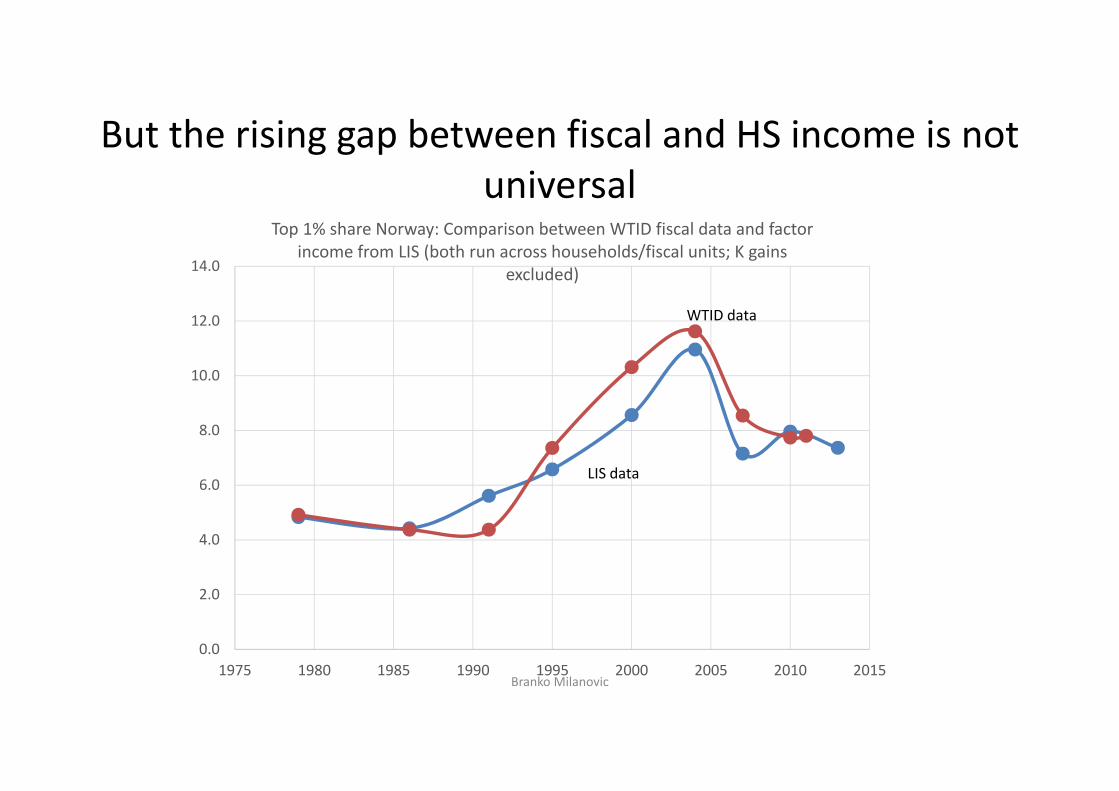
But the rising gap between fiscal and HS income is not universal
Branko Milanovic
0.0
2.0
4.0
6.0
8.0
10.0
12.0
14.0
1975 1980 1985 1990 1995 2000 2005 2010 2015
Top 1% share Norway: Comparison between WTID fiscal data and factor income from LIS (both run across households/fiscal units; K gains
excluded)
WTID data
LIS data

With full adjustment (allocation to the top 10% + Pareto) Gini decline almost vanishes
Branko Milanovic
Survey data only
64
66
68
70
72
74
76
78
80
1988 1993 1998 2003 2008
Top‐heavy allocation of the gap + Pareto adjustment
Summary_data.xls

3. How has the world changed between the fall of the Berlin Wall and
the Great Recession[based on joint work with Christoph Lakner]
Branko Milanovic

Number of surveys
1988 1993 1998 2002 2005 2008 2011
Africa 14 30 24 29 32 23 30
Asia 19 26 28 26 23 27 22
E.Europe 27 22 27 25 27 27 24
LAC 19 20 22 21 18 18 18
WENAO 23 23 21 21 22 23 21
World 102 121 122 122 122 118 115
Branko Milanovic

Population coverage
1988 1993 1998 2002 2005 2008 2011
Africa 48 76 67 77 78 78 70
Asia 93 95 94 96 94 98 96
E.Europe 99 95 100 97 93 92 87
LAC 87 92 93 96 96 97 97
WENAO 92 95 97 99 99 97 96
World 87 92 92 94 93 94 92
Non‐triviality of the omitted countries

GDI (US dollar) coverage
1988 1993 1998 2002 2005 2008 2011
Africa 49 85 71 71 70 71 63
Asia 94 93 96 95 90 93 83
E. Europe 99 96 100 99 99 98 94
LAC 90 93 95 95 98 98 94
WENAO 99 96 96 100 100 97 95
World 96 95 96 98 97 95 90
Branko Milanovic

Real income growth at various percentiles of global income distribution, 1988‐2008 (in 2005 PPPs)
From twenty_years\final\summary_data
X“US lower middle class”
X “China’s middle class”
Branko Milanovic
$PPP2
$PPP4.5 $PPP12
$PPP 180
Estimated at mean‐over‐mean
0
10
20
30
40
50
60
70
80
0 20 40 60 80 100
Real PPP
income chan
ge (in pe
rcen
t)
Percentile of global income distribution
Branko MilanovicFrom analysis horizontal quasinonanon gic pop 2do
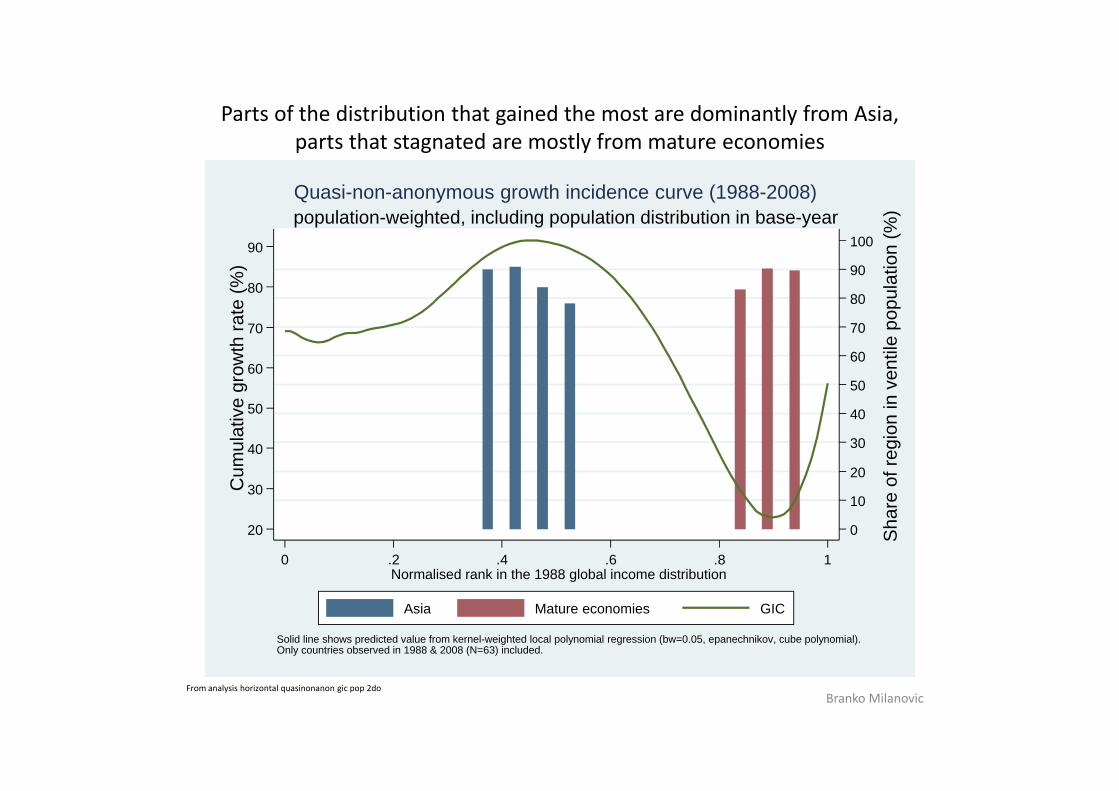
Parts of the distribution that gained the most are dominantly from Asia, parts that stagnated are mostly from mature economies
20
30
40
50
60
70
80
90C
umul
ativ
e gr
owth
rate
(%)
0
10
20
30
40
50
60
70
80
90
100
Sha
re o
f reg
ion
in v
entil
e po
pula
tion
(%)
0 .2 .4 .6 .8 1Normalised rank in the 1988 global income distribution
Asia Mature economies GIC
Solid line shows predicted value from kernel-weighted local polynomial regression (bw=0.05, epanechnikov, cube polynomial).Only countries observed in 1988 & 2008 (N=63) included.
population-weighted, including population distribution in base-yearQuasi-non-anonymous growth incidence curve (1988-2008)

Quasi non‐anonymous growth between 1988 and 2008: real absolute per capita gains at different fractiles of the 1988 distribution
140 217 236 443 466 799 1246 11632218
3168
7190
22891
0
5000
10000
15000
20000
25000
D1 D2 D3 D4 D5 D6 D7 D8 D9 V19 P95‐99 P100
Absolute per cap
ita re
al income gain between
1988
and
200
8
Decile/fractile of 1988 global income distribution
Branko Milanovic
Branko Milanovic
0
20
40
60
80
100
120
140
0 10 20 30 40 50 60 70 80 90 100
Cumulative real per capita
growth in
% between 19
88 and
200
8
Percentile of global income distribution
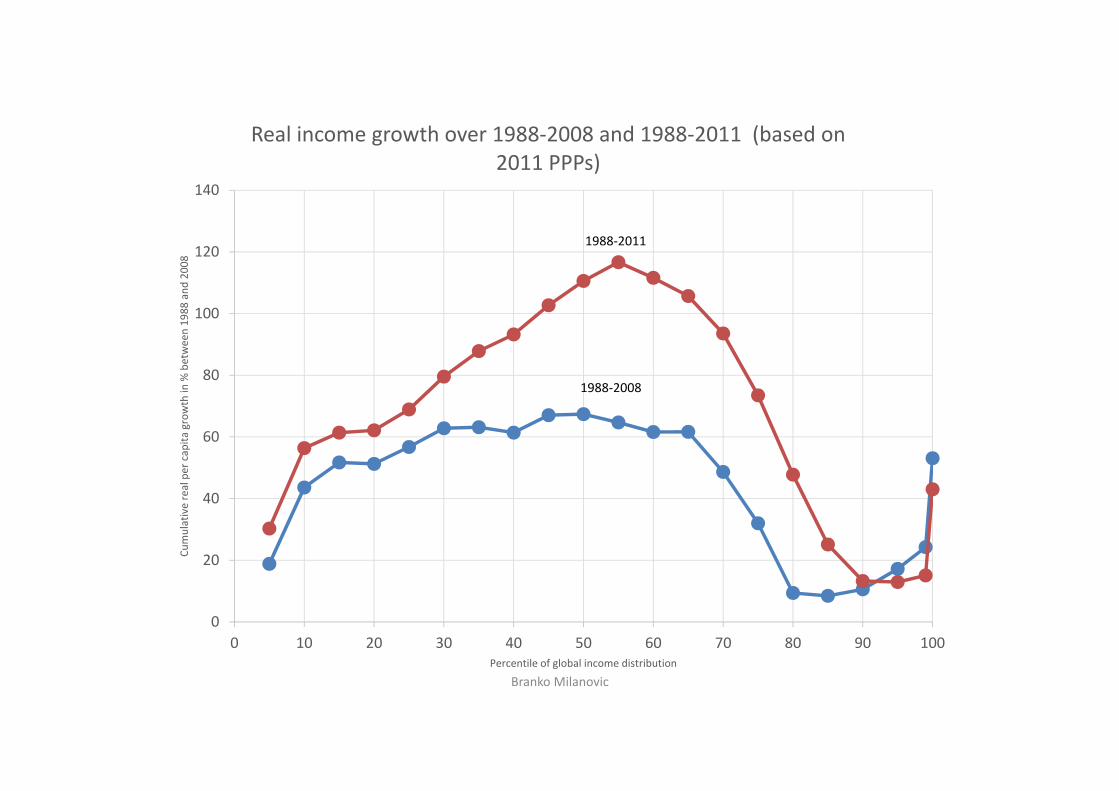
Real income growth over 1988‐2008 and 1988‐2011 (based on 2011 PPPs)
1988‐2011
1988‐2008

Global income distributions in 1988 and 2011
Branko Milanovic
twoway (kdensity loginc_11_11 [w=popu] if loginc_11_11>2 & bin_year==1988, bwidth(0.14) title("Figure 3. Global income distribution in 1988 and 2011")) (kdensity loginc_11_11 [w=popu] if loginc_11_11>2 & bin_year==2011, bwidth(0.2)) , legend(off) xtitle(log of annual PPP real income) ytitle(density) text(0.78 2.5 "1988") text(0.65 3.5 "2011") xlabel(2.477"300" 3"1000" 3.477"3000" 4"10000" 4.699"50000", labsize(small) angle(90))Using Branko\Income_inequality\final11\combine88_08_11_new.dta
1988
2011
0.2
.4.6
.8de
nsity
300
1000
3000
1000
0
5000
0
log of annual PPP real income
Figure 3. Global income dstribution in 1988 and 2011
Emerging global “middle class” between $3 and $16
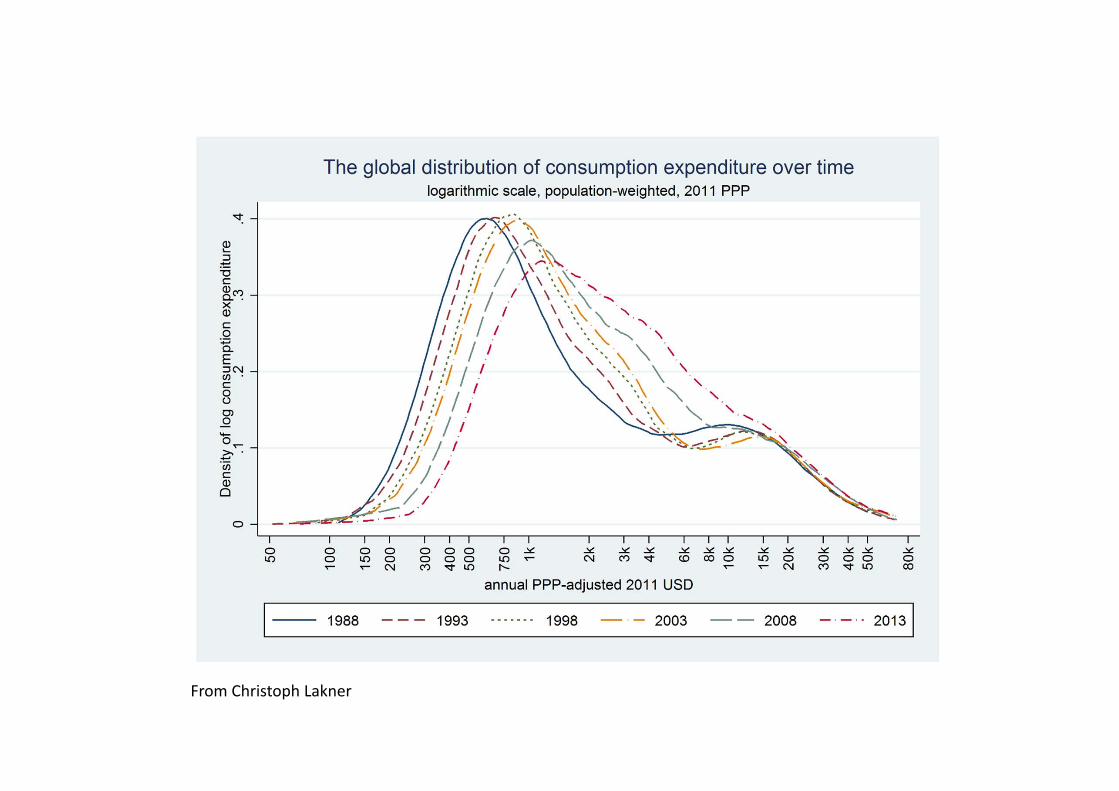
From Christoph Lakner

4. Political implications
Branko Milanovic
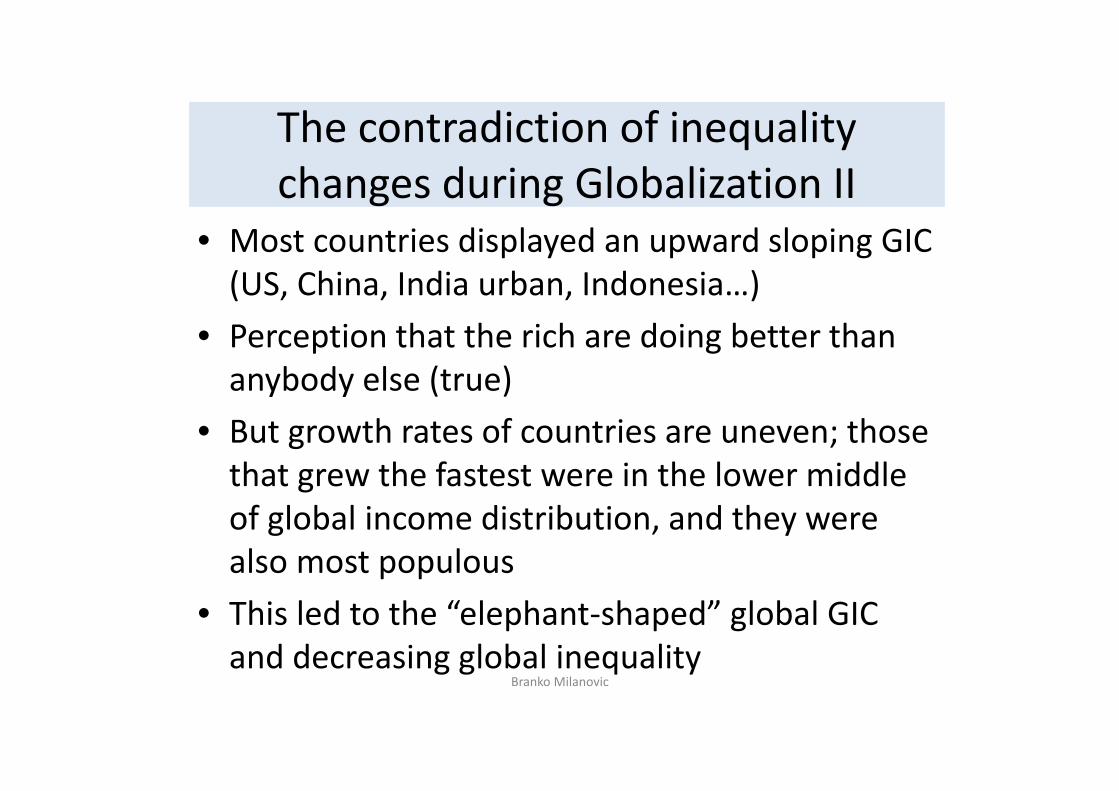
The contradiction of inequality changes during Globalization II
• Most countries displayed an upward sloping GIC (US, China, India urban, Indonesia…)
• Perception that the rich are doing better than anybody else (true)
• But growth rates of countries are uneven; those that grew the fastest were in the lower middle of global income distribution, and they were also most populous
• This led to the “elephant‐shaped” global GIC and decreasing global inequality
Branko Milanovic

The issues• Are growth (1) along the entire Chinese income distribution
and (2) stagnation around the median in the rich world as well as stagnation across most of income distribution in E. Europe and LAC, related?
• In other words, is the hump in middle related to the dip around the 70‐80th percentile?
• Marching of China and India through the ranks reduces global inequality and the importance of the between‐country component in global inequality
• But it might “cause” increases in within‐national inequalities (thus offsetting global inequality decline)
• Can democracy survive if rich countries’ middle classes are hollowed out?
Branko Milanovic
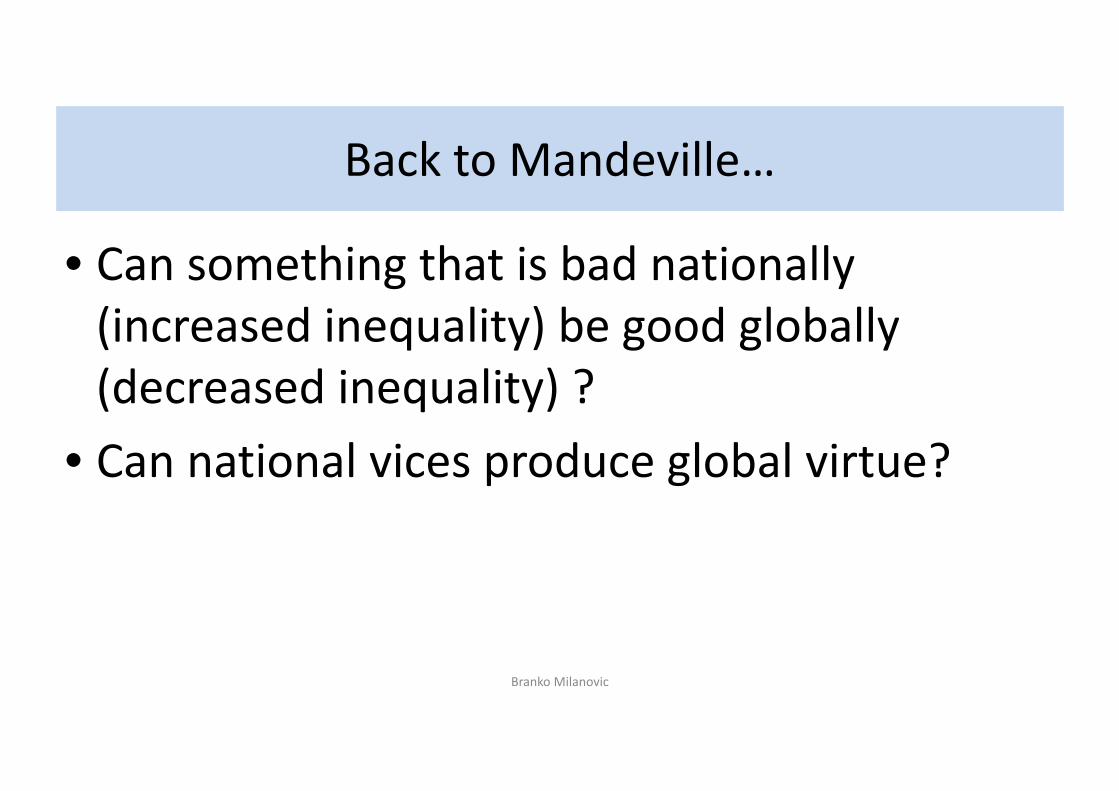
Back to Mandeville…
• Can something that is bad nationally (increased inequality) be good globally (decreased inequality) ?
• Can national vices produce global virtue?
Branko Milanovic
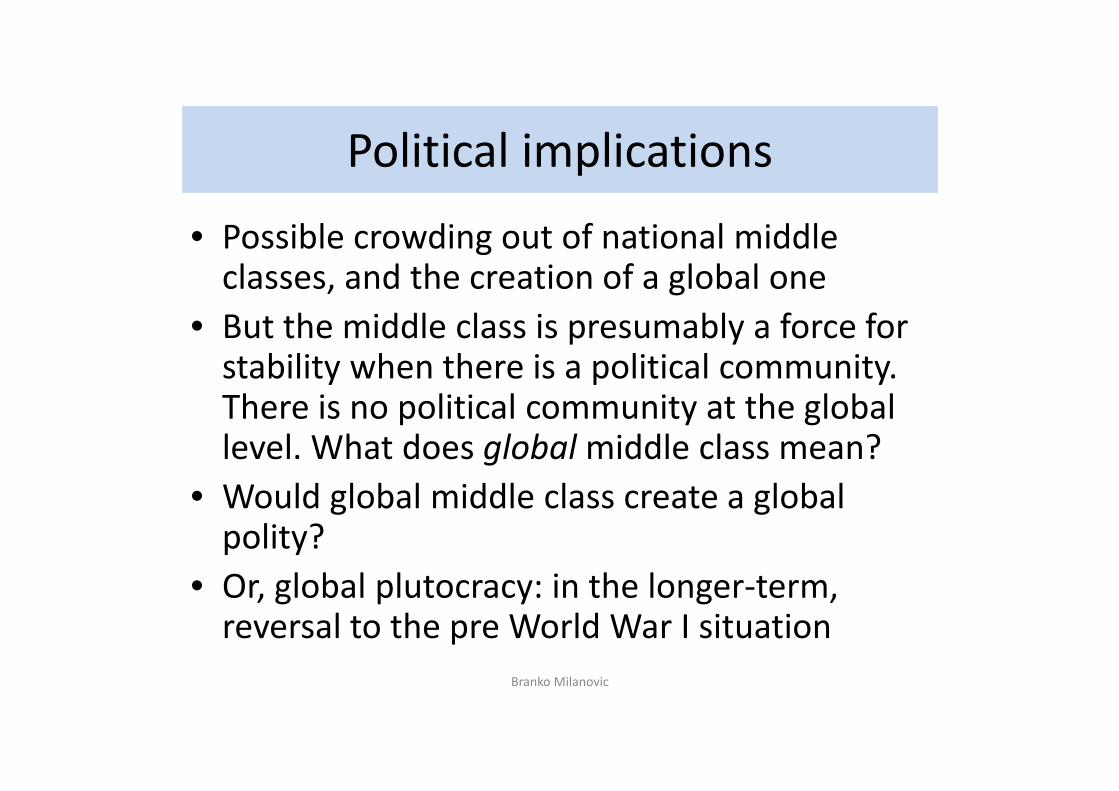
Political implications
• Possible crowding out of national middle classes, and the creation of a global one
• But the middle class is presumably a force for stability when there is a political community. There is no political community at the global level. What does globalmiddle class mean?
• Would global middle class create a global polity?
• Or, global plutocracy: in the longer‐term, reversal to the pre World War I situation
Branko Milanovic

Are we at the end of capitalism’s long “el periodo especial” or going upward the second modern era Kuznets curve?
• Three challengers to global capitalism were beaten off in the 20th century: depression (by reinventing gov’t), war (by marshalling resources), Communism (through Welfare State)
• Neither of these threats is any longer present; so is this the reason capitalism is becoming more unequal?
• Or is the period after 1980, the second modern era Kuznets curve driven by the technological revolution and globalization?
Branko Milanovic

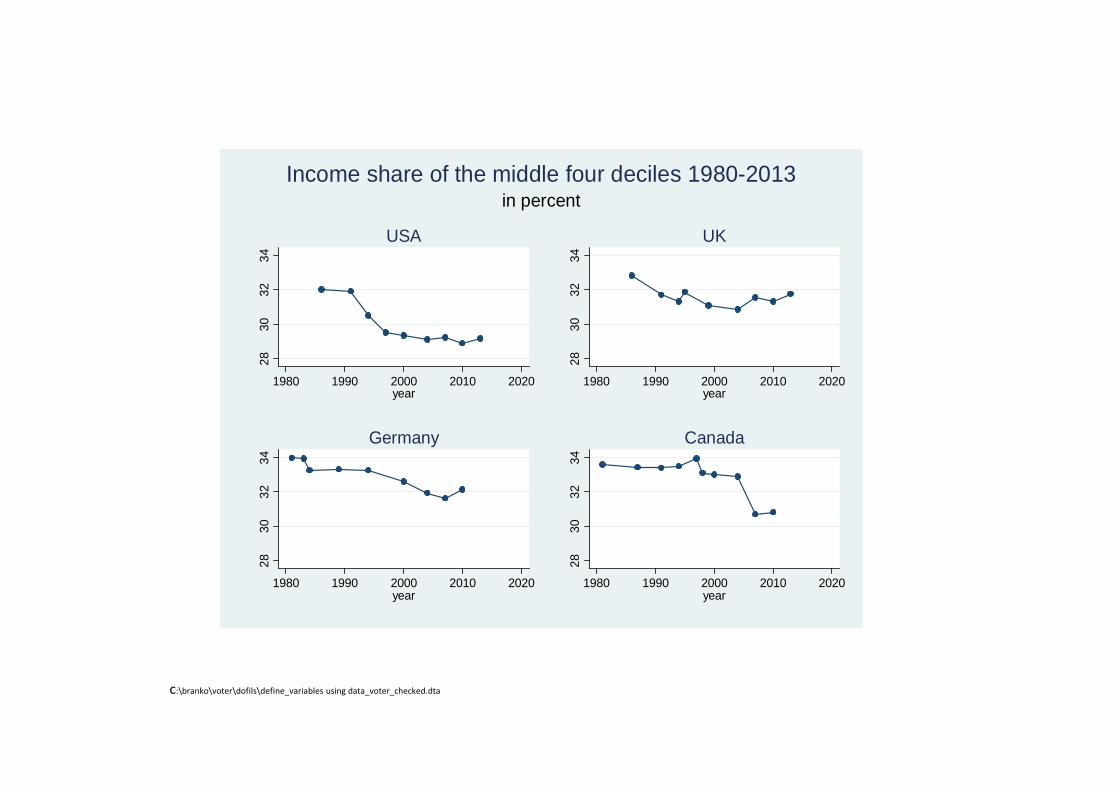
Focus on point B of the “elephant graph”
(income stagnation and erosion of the middle class in advanced
economies)
Branko Milanovic
2830
3234
1980 1990 2000 2010 2020year
USA
2830
3234
1980 1990 2000 2010 2020year
UK28
3032
34
1980 1990 2000 2010 2020year
Germany
2830
3234
1980 1990 2000 2010 2020year
Canada
in percentIncome share of the middle four deciles 1980-2013
c:\branko\voter\dofils\define_variables using data_voter_checked.dta
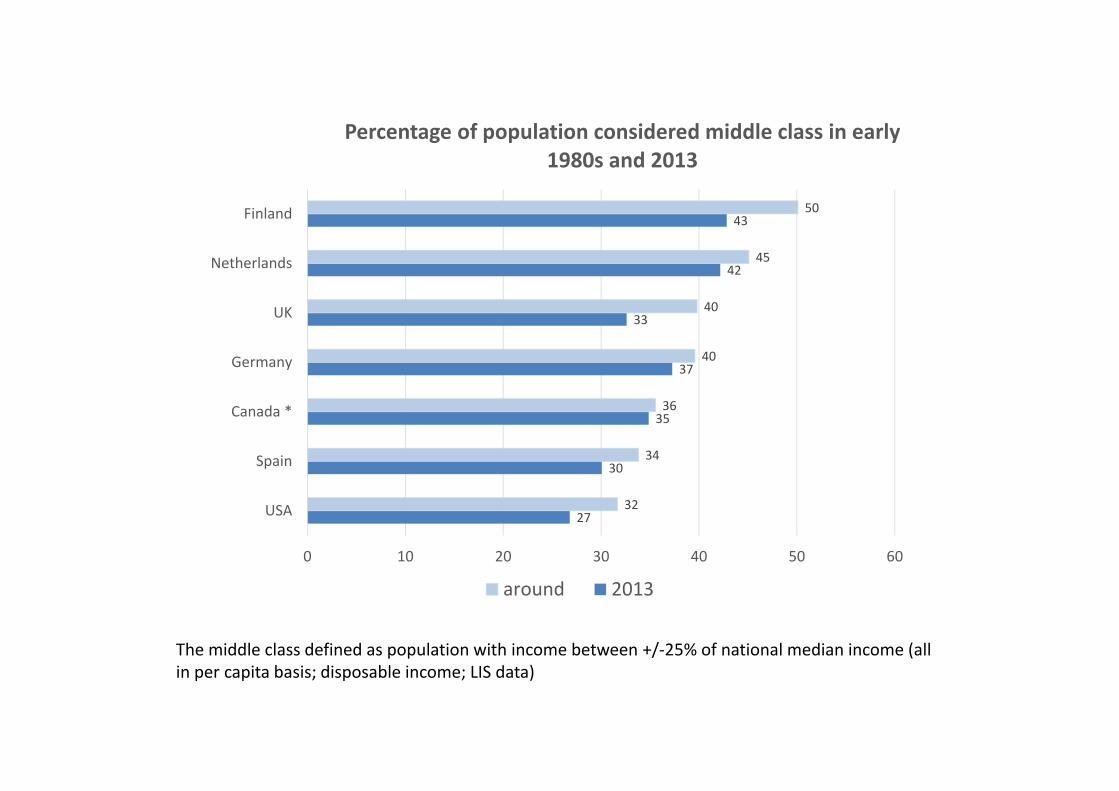
The middle class defined as population with income between +/‐25% of national median income (all in per capita basis; disposable income; LIS data)
27
30
35
37
33
42
43
32
34
36
40
40
45
50
0 10 20 30 40 50 60
USA
Spain
Canada *
Germany
UK
Netherlands
Finland
Percentage of population considered middle class in early 1980s and 2013
around 2013
0
2,000
4,000
6,000
8,000
10,000
12,000
14,000
16,000
18,000
20,000
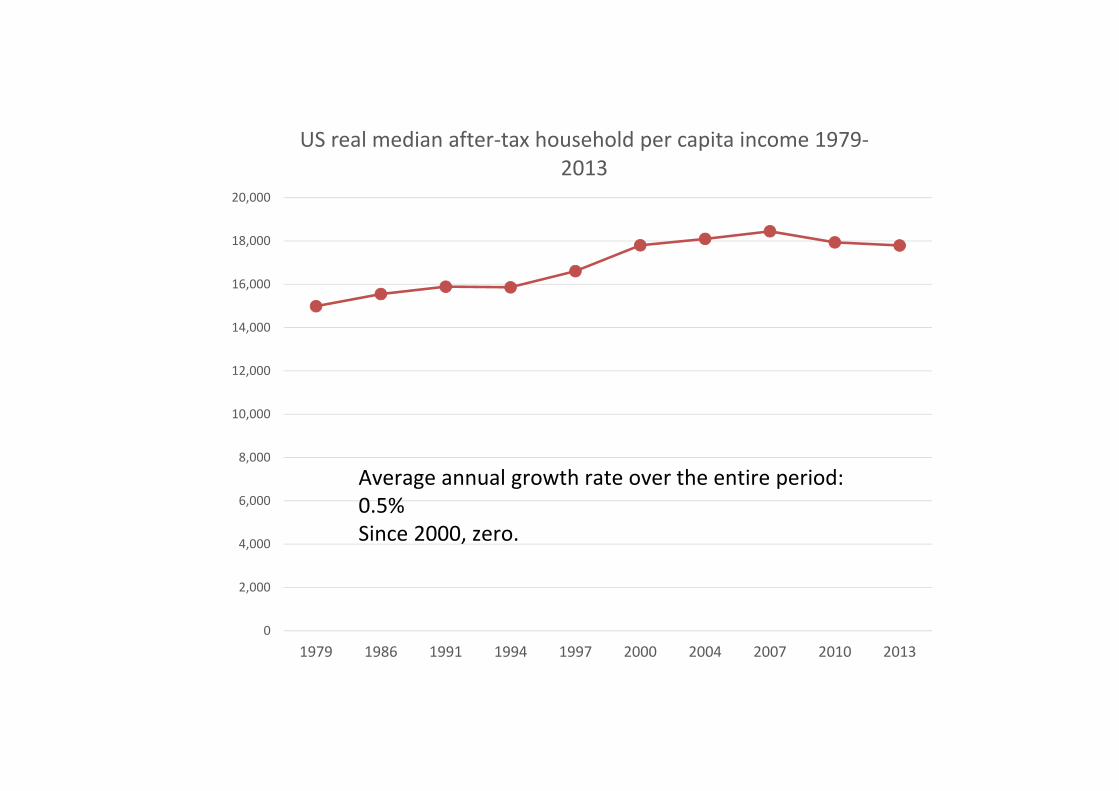
1979 1986 1991 1994 1997 2000 2004 2007 2010 2013
US real median after‐tax household per capita income 1979‐2013
Average annual growth rate over the entire period: 0.5% Since 2000, zero.

5. How to think of within‐national inequalities:
Introducing the Kuznets waves
Branko Milanovic

Kuznets waves defined• Kuznets saw just one curve. We now know there may be many
more.• Distinguish the waves in pre‐industrial and modern societies
(those with sustained increase in mean income)• Kuznets waves in pre‐industrial societies are visible when
plotted against time only (because mean income is stagnant)• Kuznets cycles in industrial societies are visible when plotted
against income per capita=> proxy for structural changes • Inequality waves are too complex for formal modelling =>
need to use inductive reasoning and analytic narrative• The waves in modern era reflect economic forces of
technological innovation and structural transformation. But also wars and policy changes.
53
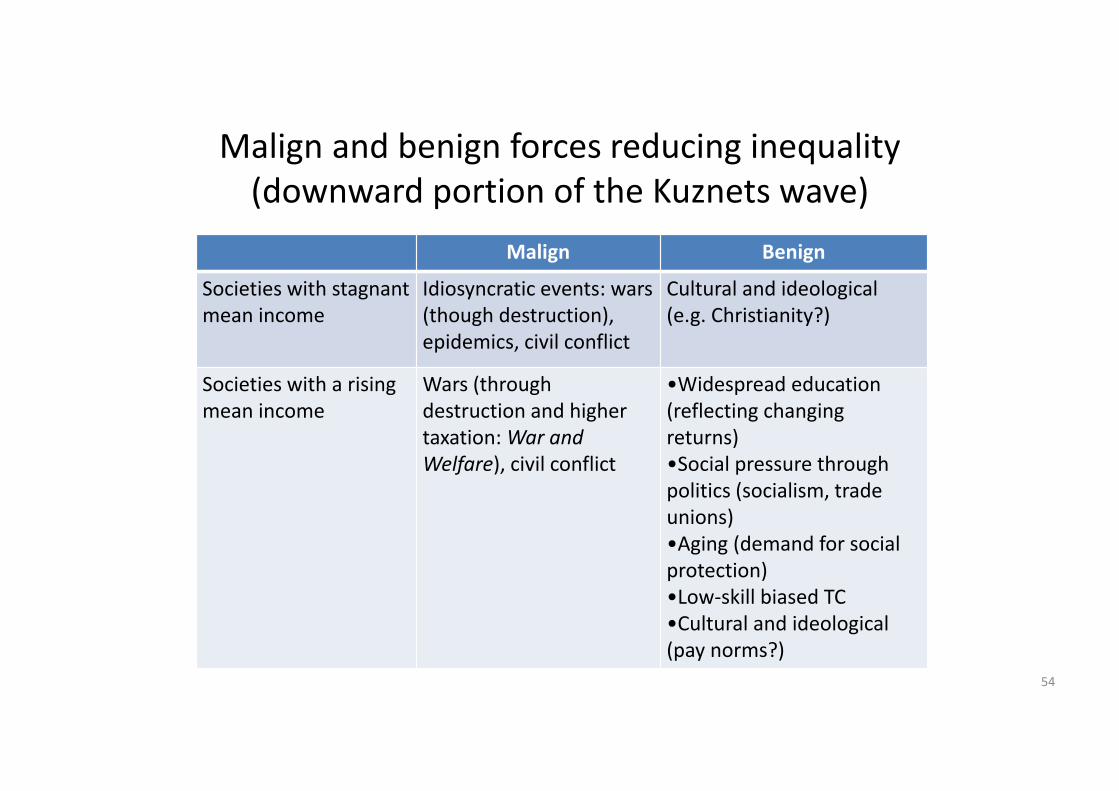
Malign and benign forces reducing inequality (downward portion of the Kuznets wave)
Malign Benign
Societies with stagnant mean income
Idiosyncratic events: wars (though destruction), epidemics, civil conflict
Cultural and ideological (e.g. Christianity?)
Societies with a rising mean income
Wars (through destruction and higher taxation: War and Welfare), civil conflict
•Widespread education (reflecting changing returns)•Social pressure through politics (socialism, trade unions)•Aging (demand for social protection)•Low‐skill biased TC •Cultural and ideological (pay norms?)
54
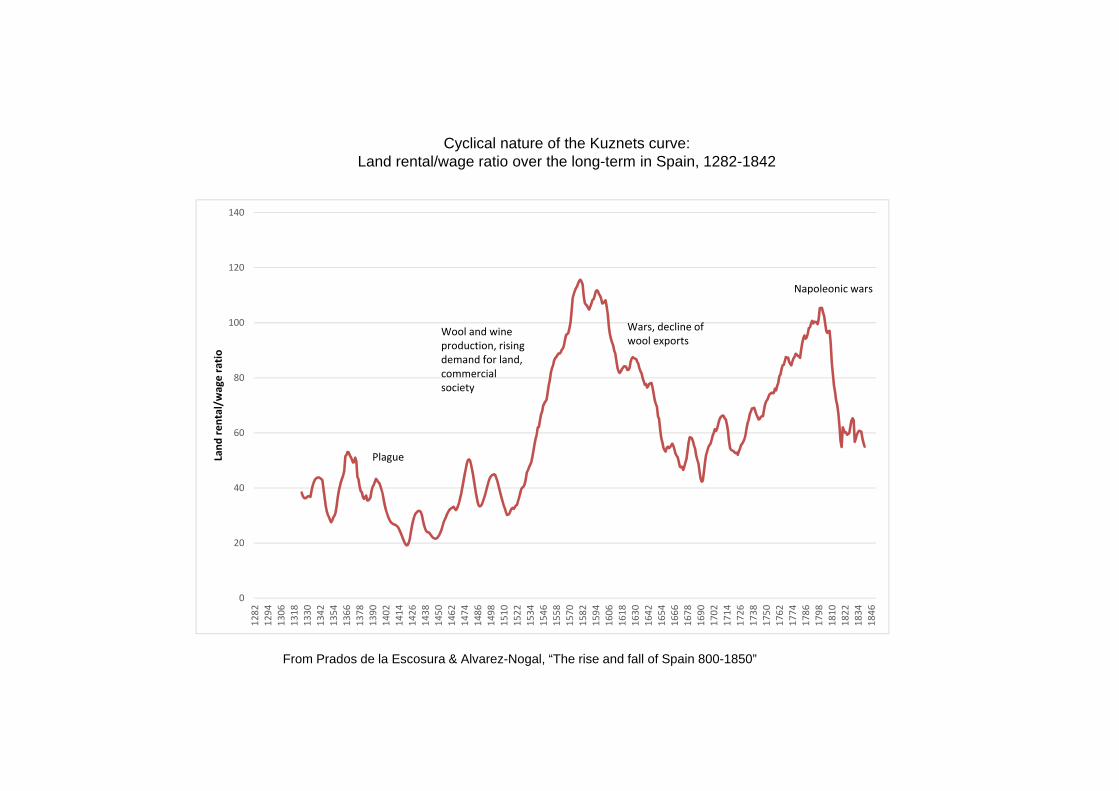
From Prados de la Escosura & Alvarez-Nogal, “The rise and fall of Spain 800-1850”
Cyclical nature of the Kuznets curve: Land rental/wage ratio over the long-term in Spain, 1282-1842
0
20
40
60
80
100
120
140
1282
1294
1306
1318
1330
1342
1354
1366
1378
1390
1402
1414
1426
1438
1450
1462
1474
1486
1498
1510
1522
1534
1546
1558
1570
1582
1594
1606
1618
1630
1642
1654
1666
1678
1690
1702
1714
1726
1738
1750
1762
1774
1786
1798
1810
1822
1834
1846
Land
rental/w
age ratio
Plague
Wool and wine production, rising demand for land, commercialsociety
Wars, decline of wool exports
Napoleonic wars

Kuznets curve here? No.
56
From Prados de la Escosura & Alvarez‐Nogal, “The rise and fall of Spain 800‐1850”
0
20
40
60
80
100
120
140
0 10 20 30 40 50 60 70 80 90 100
Lad rent/w
age ratio
GDP per capita (1859‐100)
GDP per capita and rent‐wage ratio: Spain 1325‐1840
Land/wage…

0
10
20
30
40
50
60
0 5000 10000 15000 20000 25000 30000
Gini of d
ispo
sable pe
r cap
ita income
GDP per capita (in 1990 international dollars; Maddison)
Kuznets relationship for the UK, 1688‐2014
1867
19781962
1993
1688
2013
1913

0
10
20
30
40
50
60
0 5000 10000 15000 20000 25000 30000 35000
Gini of d
ispo
sable pe
r cap
ita income
GDP per capita (in 1990 international dollars; Maddison)
Kuznets relationship for the United States, 1774‐2013
1860
19292013
19471979
1774
1933
Branko Milanovic
0
10
20
30
40
50
60
70
0 5000 10000 15000 20000 25000 30000
Gini
GDP per capita (in 1990 international dollars)
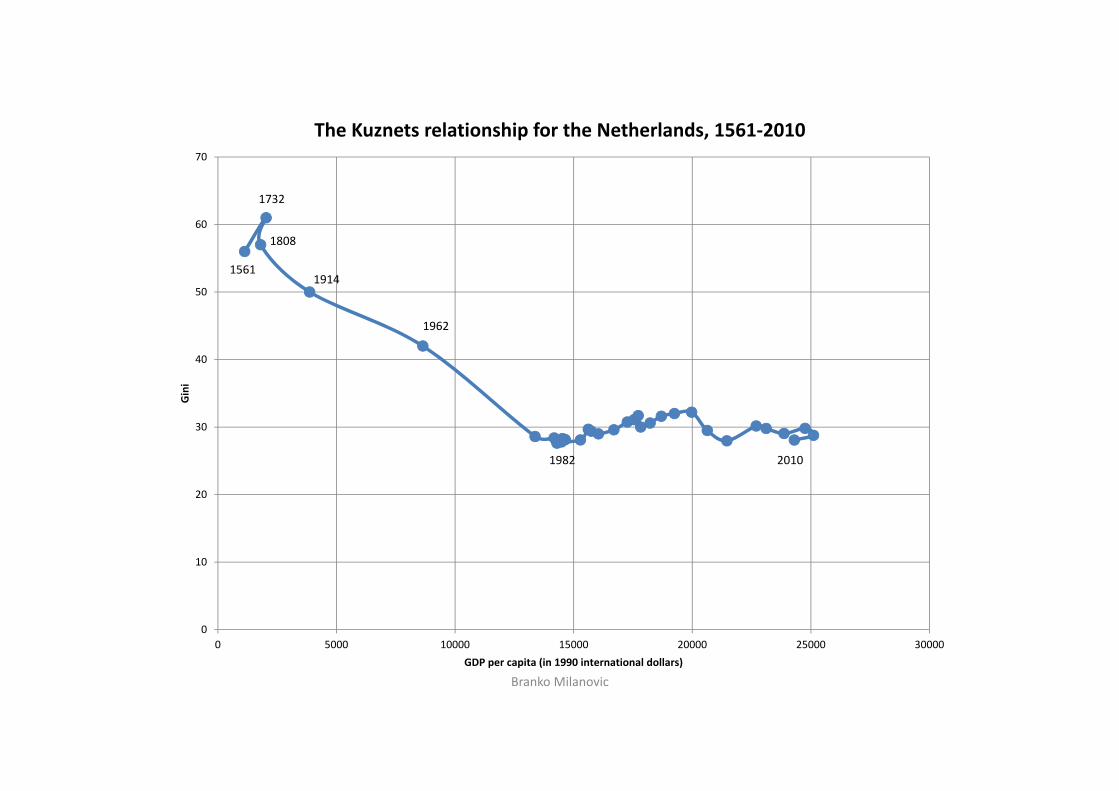
The Kuznets relationship for the Netherlands, 1561‐2010
1561
1732
1962
2010
1914
1982
1808
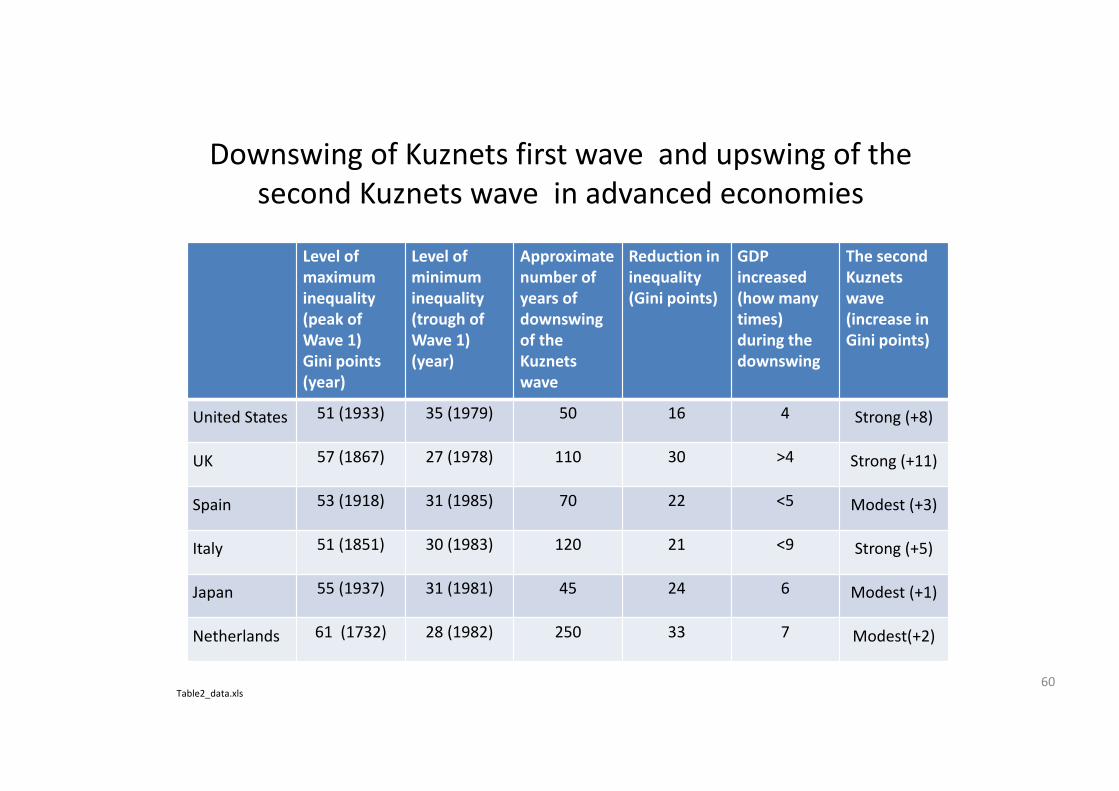
Downswing of Kuznets first wave and upswing of the second Kuznets wave in advanced economies
Level of maximum inequality (peak of Wave 1)Gini points (year)
Level of minimum inequality (trough of Wave 1)(year)
Approximate number of years of downswing of the Kuznets wave
Reduction in inequality (Gini points)
GDP increased (how many times) during the downswing
The second Kuznets wave (increase in Gini points)
United States 51 (1933) 35 (1979) 50 16 4 Strong (+8)
UK 57 (1867) 27 (1978) 110 30 >4 Strong (+11)
Spain 53 (1918) 31 (1985) 70 22 <5 Modest (+3)
Italy 51 (1851) 30 (1983) 120 21 <9 Strong (+5)
Japan 55 (1937) 31 (1981) 45 24 6 Modest (+1)
Netherlands 61 (1732) 28 (1982) 250 33 7 Modest(+2)
60Table2_data.xls

Branko Milanovic
0
0.05
0.1
0.15
0.2
0.25
0.3
0.35Urban
Gini
Year
Urban Gini in China: 1981‐2014 (based on official household surveys)
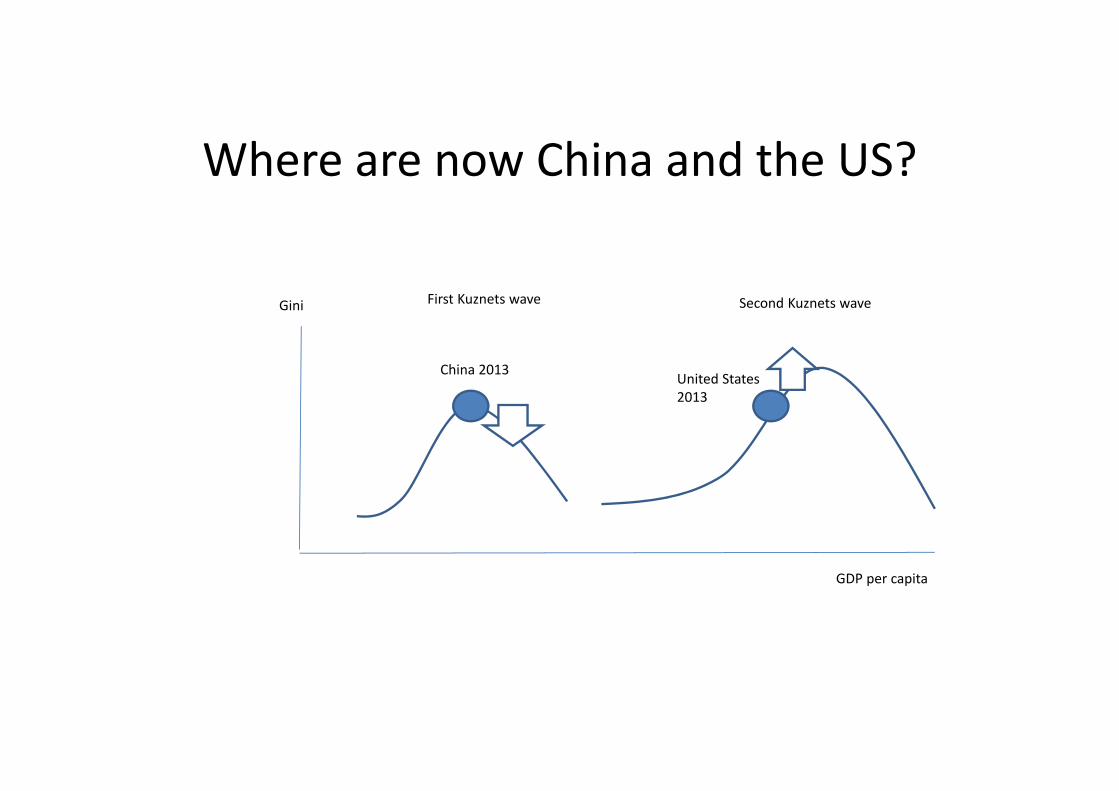
Where are now China and the US?
China 2013 United States 2013
GDP per capita
Gini First Kuznets wave Second Kuznets wave

What might drive the 2nd Kuznets cycle down?
• Progressive political change (endogenous: political demand)
• Dissipation of innovation rents• Low‐skilled biased technological progress (endogenous)
• Reduced gap in education (but it is not a silver bullet)• Global income convergence: Chinese wages catch up with American wages: the hollowing‐out process stops
• Note that all are all endogenous
63
6. Issues of justice and politics
1. Citizenship rent2. Migration and national welfare state
3. Hollowing out of the rich countries’ middle classes
Branko Milanovic
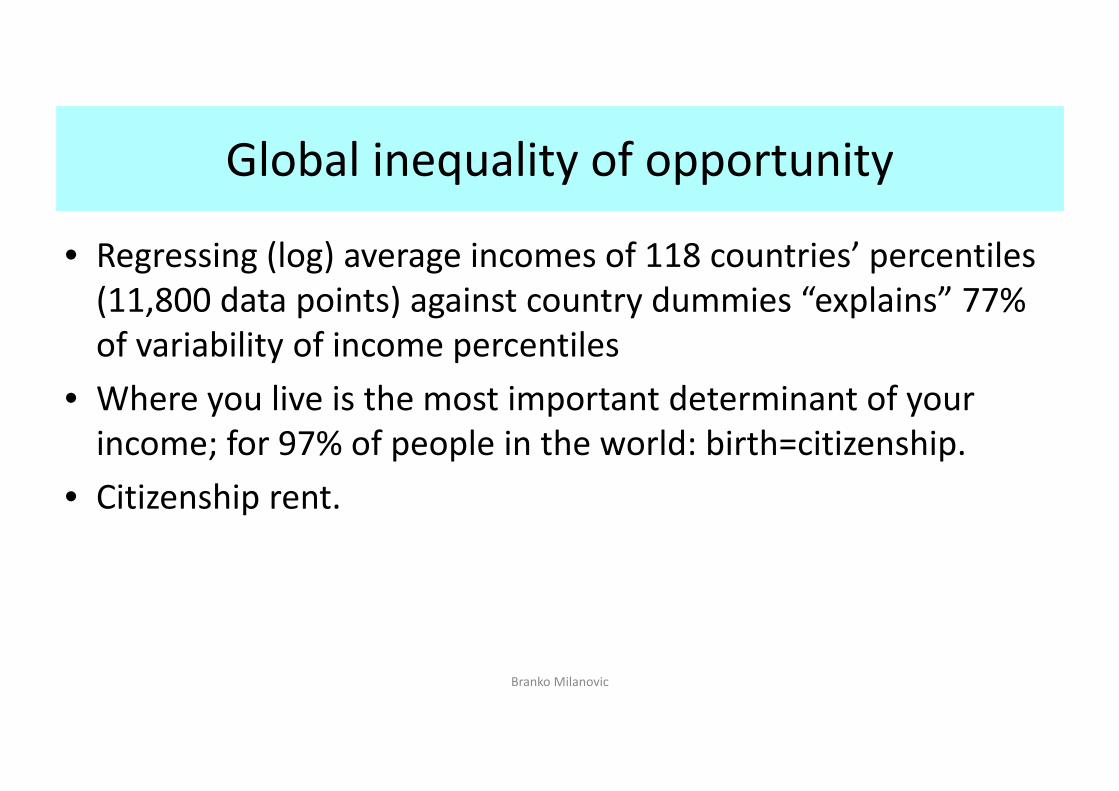
Global inequality of opportunity
• Regressing (log) average incomes of 118 countries’ percentiles (11,800 data points) against country dummies “explains” 77% of variability of income percentiles
• Where you live is the most important determinant of your income; for 97% of people in the world: birth=citizenship.
• Citizenship rent.
Branko Milanovic
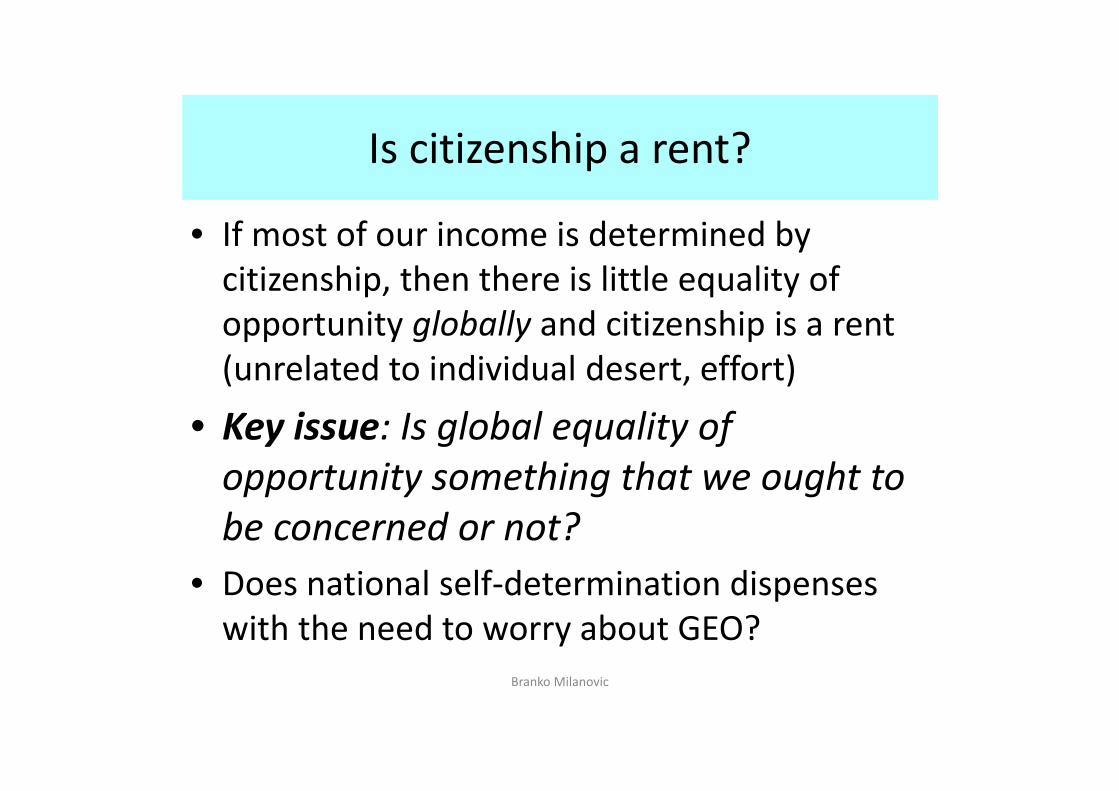
Is citizenship a rent?
• If most of our income is determined by citizenship, then there is little equality of opportunity globally and citizenship is a rent (unrelated to individual desert, effort)
• Key issue: Is global equality of opportunity something that we ought to be concerned or not?
• Does national self‐determination dispenses with the need to worry about GEO?
Branko Milanovic

The logic of the argument• Citizenship is a morally‐arbitrary circumstance, independent of individual effort
• It can be regarded as a rent (shared by all members of a community)
• Are citizenship rents globally acceptable or not?
• Political philosophy arguments pro (social contract; statist theory; self‐determination) and contra (cosmopolitan approach)
Branko Milanovic
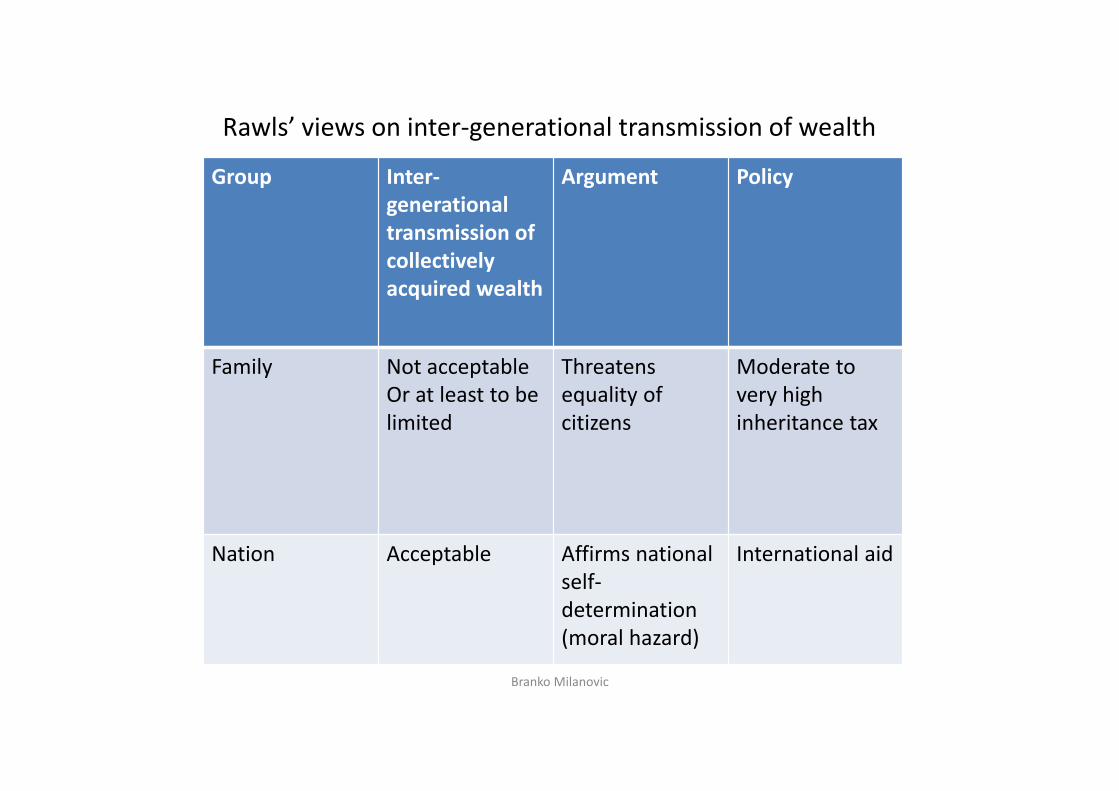
Rawls’ views on inter‐generational transmission of wealth
Group Inter‐generationaltransmission of collectively acquired wealth
Argument Policy
Family Not acceptableOr at least to be limited
Threatens equality of citizens
Moderate to very high inheritance tax
Nation Acceptable Affirms national self‐determination(moral hazard)
International aid
Branko Milanovic

The Rawlsian world
• For Rawls, global optimum distribution of income is simply a sum of national optimal income distributions
• Why Rawlsian world will remain unequal?
Branko Milanovic

All equal Different (as now)
All equal
Different (as now)
Mean country incomes
Individual incomes within country
Global inequality in Real World, Rawlsian World, Convergence World…and Shangri‐La World (Theil 0; year 2011)
77
54(all country Theils=0; all mean incomes as now)
23 (all mean incomes equalized; all country Ginis as now)
0
Branko Milanovic

Conclusion
• Working on equalization of within‐national inequalities will not be sufficient to significantly reduce global inequality
• Faster growth of poorer countries is key and also…
Branko Milanovic

Migration….
Branko Milanovic
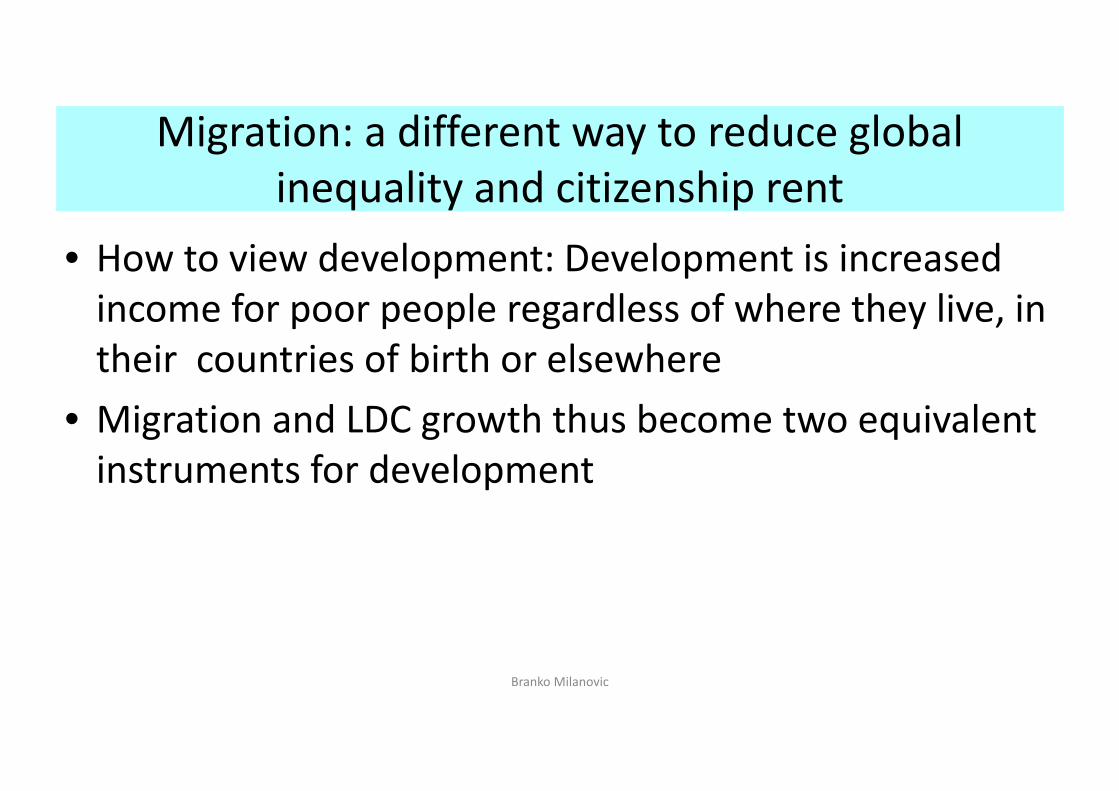
Migration: a different way to reduce global inequality and citizenship rent
• How to view development: Development is increased income for poor people regardless of where they live, in their countries of birth or elsewhere
• Migration and LDC growth thus become two equivalent instruments for development
Branko Milanovic

Growing inter‐country income differences and migration: Key seven borders today
Branko Milanovic
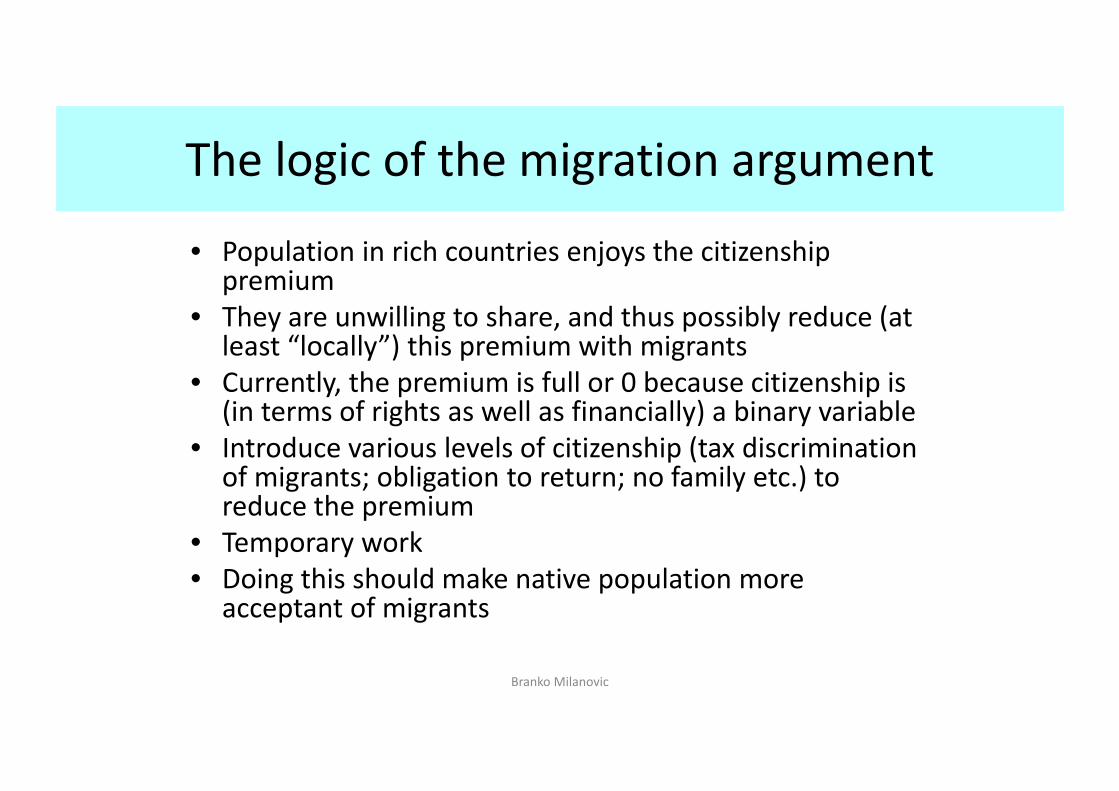
The logic of the migration argument
• Population in rich countries enjoys the citizenship premium
• They are unwilling to share, and thus possibly reduce (at least “locally”) this premium with migrants
• Currently, the premium is full or 0 because citizenship is (in terms of rights as well as financially) a binary variable
• Introduce various levels of citizenship (tax discrimination of migrants; obligation to return; no family etc.) to reduce the premium
• Temporary work• Doing this should make native population more
acceptant of migrants
Branko Milanovic
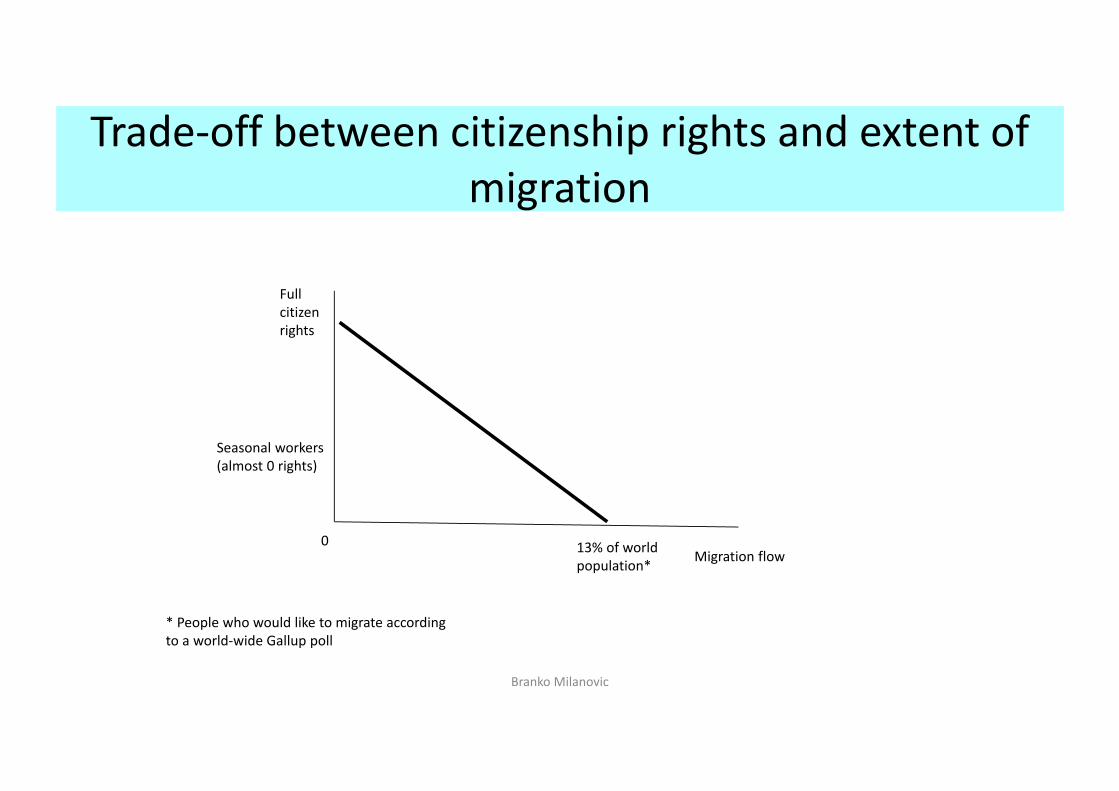
Trade‐off between citizenship rights and extent of migration
Branko Milanovic
Full citizen rights
Seasonal workers (almost 0 rights)
Migration flow13% of world population*
0
* People who would like to migrate according to a world‐wide Gallup poll
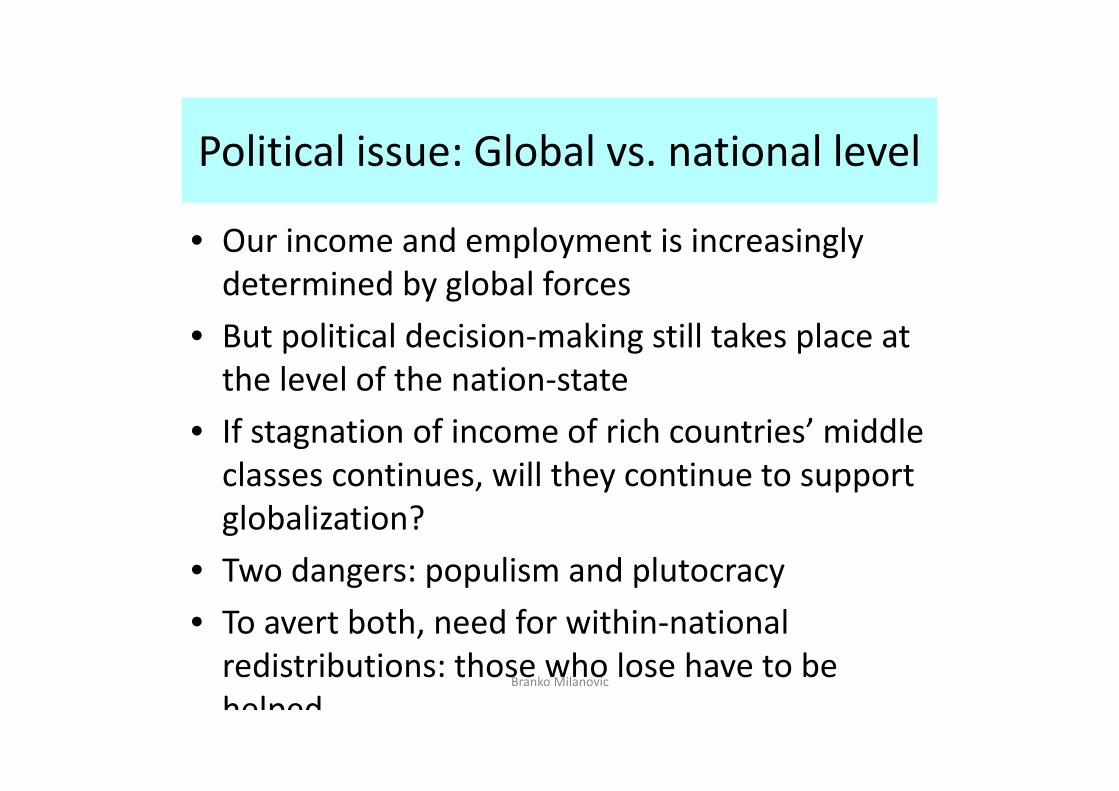
Political issue: Global vs. national level
• Our income and employment is increasingly determined by global forces
• But political decision‐making still takes place at the level of the nation‐state
• If stagnation of income of rich countries’ middle classes continues, will they continue to support globalization?
• Two dangers: populism and plutocracy• To avert both, need for within‐national redistributions: those who lose have to be helped
Branko Milanovic

Final conclusion
• To reduce global inequality: fast growth of poor countries + migration
• To have migration, discriminate the migrants• To preserve good aspects of globalization: reduced inequality within rich countries via equalization of human and financial assets (i.e. focus on pre‐redistribution)
Branko Milanovic

Hosted by the International Inequalities InstituteThe Evolution of Global Inequalities: the impact on politics and the economy
Professor Branko MilanovicSenior Scholar, Luxembourg Income Study Centre Visiting Presidential Professor, Graduate Centre, City University of New York
Hashtag for Twitter users: #LSEBranko
Professor Mike SavageChair, LSE