horse racing system - turf anaylist the indicator handicapping method
DESCRIPTION
horse racingTRANSCRIPT
Indicator Handicapping Free Edition
© 2007 Turf Analyst All Rights Reserved PO Box 4234 · Joliet · IL 60436-4234 - 2 -
The Indicator Handicapping Method
Free Edition
By Mike Beale
Copyright © 2007 by Turf Analyst Handicapping Service. All rights reserved.No part of this publication may be reproduced, stored in a retrieval system, ortransmitted in any form or by any means, electronic, mechanical, photocopying,recording, scanning, or otherwise, except as permitted under Section 107 or 108 of the1976 United States Copyright Act, without the prior written permission of the publisher
Limit of Liability/Disclaimer of Warranty: Although the publisher and author have usedtheir best efforts in preparing this book, they make no representations or warrantieswith respect to the accuracy or completeness of the contents of this book andspecifically disclaim any implied warranties of merchantability or fitness for a particularpurpose. No warranty may be created or extended by sales representatives or writtensales materials. The advice and strategies contained herein may not be suitable foryour situation. You should consult with a professional where appropriate. Neither thepublisher nor author shall be liable for any loss of profit or any other commercialdamages, including but not limited to special, incidental, consequential, or otherdamages.
Indicator Handicapping Free Edition
© 2007 Turf Analyst All Rights Reserved PO Box 4234 · Joliet · IL 60436-4234 - 3 -
Introduction
How I Stopped Picking Winners andStarted Handicapping to Make Money . . .
Back in the early 70's when I was learning how to handicap, I was under the mistakenimpression that the goal of handicapping was to pick the winner of each race. Iremember that between races I would have friendly arguments with my racetrackbuddies about which horse was "going to win" the next race. I was so convinced that Iwould soon be able to name the winner in each race that I spent countless hours eachnight going over and over each race that I lost. I believed that if I did not pick thewinner, I must have made some mistake in my handicapping.
Then one day I was befriended by one of the old-timers at the track. His name wasJohn. He was a very kindly man who sat me down and changed forever myassumptions about horseracing. What he told me is that I should stop trying to pickwinners and start handicapping to make money. John pulled out his racing form andshowed me who the main contenders were going to be in the next race. In doing so,he explained what mistakes other horseplayers were likely to make in evaluating therace.
Most of his attention was focused on the contender that he said was only the secondmost likely to win. He said it might become an overlay. I had never heard of the termbefore so I asked him what it meant. John said, “The overlays are your profit horsesand the underlays are your loss horses.” Then he added, “Most horses are losers.”Together, we watched odds go up and down on the tote board and, sure enough, theodds on John's second choice kept going higher and higher.
Finally, it was only five minutes to post time and odds on the horse were waveringbetween 5-to-1 and 6-to-1. There were long lines at the ticket windows but Johnshowed no sign that he was going to get in line to play the horse. John could see thatI was getting anxious and he told me, “Don't worry. This one is not going to be anoverlay. You have to remember that you are not just playing against the other players.You also have to overcome the money that the track takes out of the pool.”
I had never considered the effect that the take and break of the mutual pool wouldhave on my handicapping, but what John was saying made a lot of sense to me. Hesaid, “If the crowd only handicaps a race reasonably close then, every horse will be aloser after the track cuts the pool.” He continued,”What most of the guys do is to lookat very small differences between the records of each horse. You'll never overcomethe track's edge by doing that. What you have to do to make money at this game is towait for the really big overlays to appear.” So, we waited and passed a few moreraces. Eventually, we did play two races later that day but I would be lying if I told youthat we won.
Indicator Handicapping Free Edition
© 2007 Turf Analyst All Rights Reserved PO Box 4234 · Joliet · IL 60436-4234 - 4 -
We did, however, have many opportunities to visit the cashier's window over the nextcouple of weeks and I became very accustomed to cashing winning tickets at 8-to-1and higher odds. I will always be indebted to John for showing me how to handicap.
Why Overlays OccurOver the last 30 years, I have devoted a lot of time to learning why overlays occur andhow to detect them. When personal computers became available in the 80’s, I evenlearned how to program so I could conduct my own custom studies into thecomplexities of the handicapping fundamentals.
What I learned is that overlays will often result when horseracing fans apply validhandicapping principles past the point where they are significantly predictive. This willcause some horses to look much better than they really are. In extreme cases thepublic will make a “false favorite” where the wrong horse goes to post with the lowestodds. When this happens it’s very likely that there will be a good overlay somewhereelse.
The reverse of this can also happen when a horse looks much worse to the generalpublic than it really is. Racing fans tend to ignore any horse that is difficult to figure orhas an element of uncertainty in its record. The horse trainers are quick to exploit thistendency by darkening the form of their horses. Also, some contenders will becomeoverlays just because the average handicapper is only interested in picking the winner.Any other horse that is perceived as less likely to win may not be given adequateconsideration and may go overlooked in the betting.
How the Indicator Handicapping Method WorksIn developing a practical way of identifying overlay situations for my personalhandicapping, I invented what is now known as the Indicator Handicapping Method.What make this method different are the indicators which are used to detect the maincontenders of each race. They are based on traditional handicapping fundamentalsbut are designed to underweight many of the factors that the general public tends tooverweigh in their handicapping. This causes the indicators to be very sensitive toconditions that may cause large segments of the track patrons to make incorrecthandicapping decisions. The construction of each indicator is very simple and eachindicator can be applied to a horse in just a minute or two using only basic math.
When the indicators are applied according to the rules of the Indicator HandicappingMethod they will not influence the final selection more than the actual predictive valueof their underlying handicapping fundamentals. In fact, the real power of this methodis demonstrated by how the indicators work together to reveal the real contenders ineach race. Once you have applied the indicators, you will quickly see if you aredealing with a race that has 1, 2 or 3 main contenders by the way the indicators haveclustered around the top horses.
In the final step, you will calculate the Overlay Indicator for each of the contendersusing the odds on the tote board just before post time. This is very quick and easy todo. The Overlay Indicator will tell you which horse to play and how profitable yourselection is likely to be. The higher the Overlay Indicator the better the play.
Indicator Handicapping Free Edition
© 2007 Turf Analyst All Rights Reserved PO Box 4234 · Joliet · IL 60436-4234 - 5 -
Indicator Handicapping Method Free EditionAs in the past, I am offering a free edition of the Indicator Handicapping Method. I dothis because the paid version of the book is offered without any phony claims orworkouts and without any money back guarantee. I want any prospective purchasersof the paid version to get a good idea of what my handicapping philosophy is beforethey make their purchase.
Indicator Handicapping Method 2nd EditionOver the past five years, I've sold almost 1,000 copies of the first edition of theIndicator Handicapping e-book. Many of the guys and gals who have bought the bookhave also sent me emails to share the successes they have had with it. Many haveeven contacted me years after purchasing their copy just to let me know that they arestill using it in their handicapping. I am very grateful for all the feedback that I havereceived from the people who have purchased my book. It has been overwhelminglypositive.
The 2nd edition of the Indicator Handicapping Method is not just a re-edit of theoriginal work. It is a complete rewrite based on the comments and suggestions I havereceived from the original users. Those of you who have read the original version ofthe book will recognize the same basic handicapping method with only a few smallimprovements. What has changed is that the rules of the method are now stated in amuch clearer manner with more detailed explanations. This should make the methodmuch easier to learn even if you have never handicapped before.
Before You Get StartedOver the years I have received many e-mails that repeat a basic theme. In thesemessages, the handicapper tells me that he has tried the method and it worked for himbut for one reason or another he put it down and tried something else. Now, afterlosing a significant amount of money, he is writing me to let me know that he is comingback to Indicator Handicapping because he remembered that it worked for him in thepast. Many of these people were lured by the promises of computer handicappingsystems, but most of them just lost their discipline and started experimenting with it,trying to do things that will not work in the long run.
I have always been very careful about making any claims or guarantees of successusing this handicapping method. I will never promise you that it is easy to makemoney at the track, but I will never tell you that it is impossible either. I will never usephony workouts or make outrageous claims about how much money you can winusing it.
Indicator Handicapping is not the same old warmed-over handicapping dogma thatyou read in other handicapping books. It is a whole new approach that is bothpractical and systematic. Unlike many of the other handicapping books out there, thisbook will actually teach you how to handicap. It presents an exact procedure for youto follow when handicapping a race. Indicator Handicapping will work for you if it isapplied as presented in the book.
Indicator Handicapping Free Edition
© 2007 Turf Analyst All Rights Reserved PO Box 4234 · Joliet · IL 60436-4234 - 6 -
I would also like to point out that the sections that are included in the free versions ofthe book are just as important to your success as the selection method itself. I havealso included a section on the overlay indicator in the free edition of the book. You willfind that the overlay indicator will be helpful to you whether or not you decide to studyIndicator Handicapping. In fact, the free edition of this book is not just anadvertisement for my handicapping method. It is information that any handicapper willbenefit from.
My advice to you is to study the book very carefully and to only risk very smallamounts of money in the beginning. Also be sure to follow the money managementtechniques presented. Remember that in any situation that involves managed risk,there will always be winning and losing streaks. These are inevitable so do not letyourself become greedy or despondent. If you play for the long run and keep yourselfin the game, you will do just fine.
Mike BealeThe Turf Analyst
Indicator Handicapping Free Edition
© 2007 Turf Analyst All Rights Reserved PO Box 4234 · Joliet · IL 60436-4234 - 7 -
Chapter 1
Setting Yourself Up for Success
To start off, I am going to list some practical suggestions that can greatly improve yourresults as a handicapper. While it is not required that you adopt every suggestion inyour personal handicapping, you should at least be aware of the fact that adoptingeach of these strategies could improve your results.
Adopt a Structured Handicapping MethodYou should have a set discipline procedure that you follow each time you handicap arace. The idea here is that you structure your handicapping so that if you re-handicapped the race at a different time, you would come up with the same results.Many horseplayers use an undisciplined approach that varies each time they handicapa race. So, their results will have no consistency.
When you use the Indicator Handicapping Method, you will have an automatic built-indisciplined procedure in your handicapping and this will not be a problem.
Stop Trying to Win Races and Start Handicapping to Make MoneyIf you examine the emotions of the average handicapper, you will see that they feelmost comfortable when they're betting on a horse that looks like it's going to win. Theproblem with this is that by the time the average handicapper feels confident that ahorse is going to win, nearly every one else at the track also knows this.
The goal of handicapping is to find profitable betting situations, not to determine who isgoing to win the race. The best way to do this is to find ways to determine if thebetting public has overestimated or underestimated a horse’s chances of winning arace. A good handicapper has the ability to evaluate uncertain situations by beingable to make logical deductions when all the facts are not present. This is whereindicator handicapping really shines. You will often find that the indicators point tohorses that most handicappers shy away from and are afraid to bet. But in fact, theseare the exact type of situations that can develop into powerful overlay bettingopportunities.
Concentrate Your Betting on Your Most Profitable SituationsOnce you have learned how to detect profitable overlay situations, it is important thatyou concentrate your betting where the profit is. You should only be betting when youfeel that you have an overwhelming advantage in the odds. I recommend that yourestrict your handicapping to two or three tracks each day and restrict your betting toyour most profitable four to six bets.
During your preliminary handicapping, look for contenders that are not listed asselections on the program. These are the most likely overlay candidates. If you doend up betting one of the program selections, you should be aware of the fact that thetote board odds of the program selections do tend to go down in the last-minute
Indicator Handicapping Free Edition
© 2007 Turf Analyst All Rights Reserved PO Box 4234 · Joliet · IL 60436-4234 - 8 -
betting. To help you determine how profitable a bet is likely to be, I have developed theoverlay indicator which will be discussed at length later on in this book.
Only Place Win Bets; Never Play Exotic BetsMost successful horse players only bet to win and never bet to place, show or play anyof the exotic bets such as the trifecta or exacta. The reason for this is that the track’stake and break are the least on win bets and there is no income tax on win bets. If youexamine a series of bets that would make a profit betting place or show, you willalmost always find that the same series of bets would produce a much larger profitwhen bet to win.
The exotic bets such as exacta, trifecta or pick six are really sucker bets. Most trackstake a higher percentage of the betting pool for these bets. The only way to get anoverlay playing the exotics is to have all overlay picks in your selections. If you puteven one underlay selection the payoff will drop precipitously and you will not bemaking a profitable bet. Even when bet correctly, there can be wild fluctuations in thepayoff of the exotic bets. Just a few dollars placed on a particular combination in thelast minute betting can dramatically lower the payoff. The only exotics worth bettingare going to pay off at over 200-to-1 odds. This means that if you place these betsyou will have to endure very long losing streaks and be subject to backup withholdingby the IRS.
I am not a tax professional, so please consult one if you intend to seriously pursuebetting the exotics. Once the IRS withholds a portion of your payoff, you are in a no-win situation. Since the IRS knows that you received "gambling income," they willexpect you to list this income on your tax return and pay taxes on it. The IRS assumesthat you have never had a loss and you must itemize your deductions to claim yourlosses and get the money the IRS has withheld back. Not listing this income on yourreturn could cause you to be flagged for an audit and additional taxes and penaltiescould be due. In fact, if you do not itemize your losses and your marginal tax rate ishigher than the 10% withholding rate, then the IRS will calculate your taxes on yourwinnings to be more than the amount they actually withheld.
Only Bet Where You Get Track OddsIt is very hard to be a successful horse player when you’re betting at an off trackbetting establishment that takes an additional percentage out of the betting pool. Thevery best way to place your bets is over the Internet where your bets are put into thetracks mutual pool and you receive the same odds that the track patrons receive.Placing your bets on the Internet also gives you the advantage of being able to waituntil the last minute before committing your money. So, you do not have to worryabout being shut out when you bet on the Internet.
If you are looking for an excellent Internet wagering site, I highly recommendwinticket. They feature live feeds direct from the tracks. So, it’s just like being there.You can actually watch the horses coming into the gate, see the race in real time whilelistening to the calls by the track announcer, and then watch reruns of the race. Thesystem lets you bet up to 1 minute to post time so you will never get shut out.

Indicator Handicapping Free Edition
© 2007 Turf Analyst All Rights Reserved PO Box 4234 · Joliet · IL 60436-4234 - 9 -
I have a special arrangement with winticket that will allow you to receive your first$100.00 that you bet with the service credited back to your account. To takeadvantage of this no-lose offer, you must meet the following requirements:
1) You are referred to winticket by the Turf Analyst web site2) You are a new customer with winticket3) In the first 30 days of your account you must bet at least $100.00
To sign up for this offer, click here: http://turfanalyst.com/cash_back.html.
Indicator Handicapping Free Edition
© 2007 Turf Analyst All Rights Reserved PO Box 4234 · Joliet · IL 60436-4234 - 10 -
Chapter 2
Understanding the Odds
Since horseracing is a game that is based on probabilities, it is critical to your successas a handicapper to understand how the odds can work for you or against you. WhenI was in college, I took classes on statistics and discrete mathematics and I learnedfirsthand how incredibly complicated the mathematics of probabilities can be. I willattempt to keep the math as simple as possible, but if you are having problemsfollowing along, don’t worry. Just drop down to the conclusions which are highlightedin yellow at the end of the chapter.
A Simulation Based on Even OddsTo keep this simple and easy to understand, I will be using a typical scenario that anyhorse player can relate to. Let’s say that each day you narrow down you selections toyour 5 most profitable bets. To start out, we will further stipulate that the actualchances of each of your bets winning are 1-to-1 or even odds. This means that youshould expect to win on average every other bet. If the payoff is fair on an even oddsbet, you should expect each winner to pay off at $2.00 for each dollar you bet.
This is very convenient for us because you can easily simulate each day’s results byflipping a coin. There are only 2 possible outcomes of a coin toss - heads and tails. Ifwe arbitrarily decide that a result of heads will be a winner and a tails is a losing bet,then we only need to record 5 coin tosses to simulate each day’s results. In doing so,we will enter a W for each win and L for each loss.
When we do this we will notice a great variation in our results. Very rarely do we seethe expected result of winning every other bet (WLWLW or LWLWL). Instead, we seethat the winners and losers are clustered together seemingly at random. So, how dowe know what to expect when we make 5 bets at 1-to-1 odds?
The way to calculate this is actually quite straightforward. We know that just like acoin toss there are only 2 possible outcomes of a wager at 1-to-1 odds and that eachoutcome is equally likely to occur. What this means is that there are exactly 32possible combinations for 5 bets made at 1-to-1 odds and that each day’s series of 5bets must be one of those 32 combinations:
2*2*2*2*2 = 25 = 32
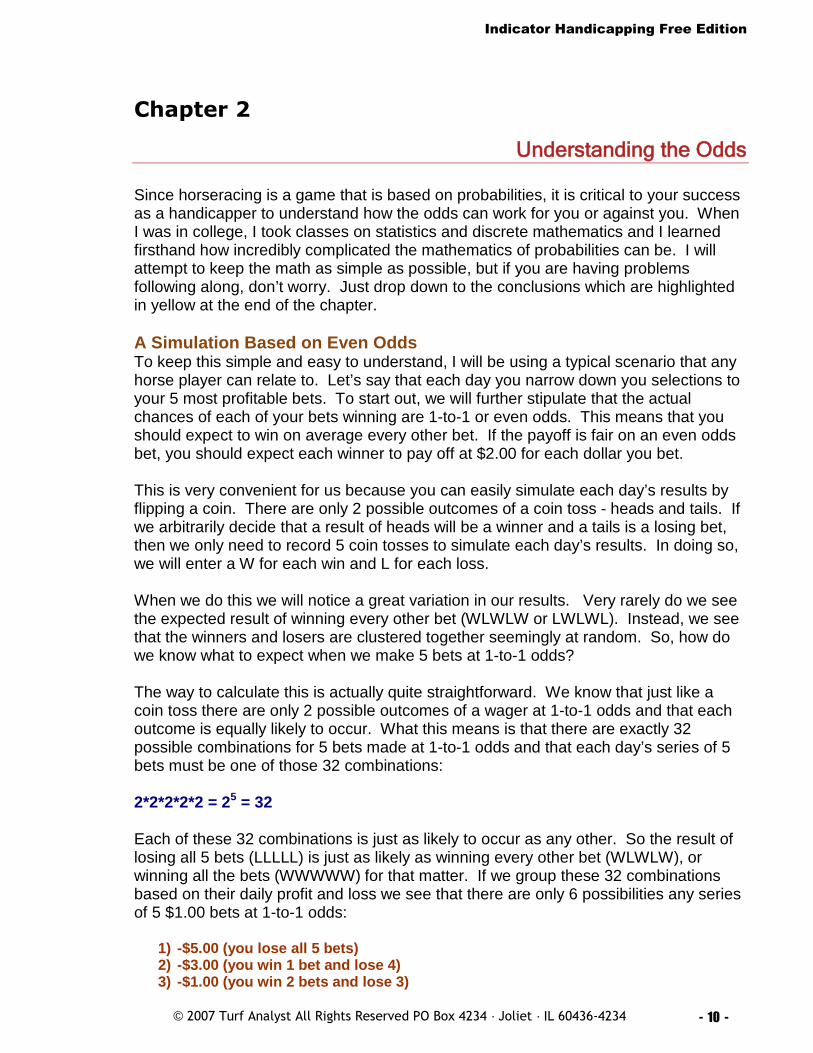
Each of these 32 combinations is just as likely to occur as any other. So the result oflosing all 5 bets (LLLLL) is just as likely as winning every other bet (WLWLW), orwinning all the bets (WWWWW) for that matter. If we group these 32 combinationsbased on their daily profit and loss we see that there are only 6 possibilities any seriesof 5 $1.00 bets at 1-to-1 odds:
1) -$5.00 (you lose all 5 bets)2) -$3.00 (you win 1 bet and lose 4)3) -$1.00 (you win 2 bets and lose 3)
Indicator Handicapping Free Edition
© 2007 Turf Analyst All Rights Reserved PO Box 4234 · Joliet · IL 60436-4234 - 11 -
4) $1.00 (you win 3 bets and lose 2)5) $3.00 (you win 4 bets and lose 1)6) $5.00 (you win all 5 bets)
Notice how symmetrical the data is. Since we are basing this example on the fairpayoff of a horse at even odds, $2.00, if you totaled the results for all the combinationsyou would end up with a profit/loss of $0.00:
(-5*1) + (-3*5) + (-1*10) + (1*10) + (3*5) + (5*1) = 0
Actually, when we examine the data in terms of the daily profit or loss it doesn’t matterwhat the order of the wins and losses are. It is really the number of wins and lossesthat occur each day that are significant. When you look at the $3.00/profit column, forinstance, you see that there are 5 possible combinations of winning 4 bets and losing1 bet. As a handicapper, it really doesn’t matter if your win/loss pattern wasLWWWW, WWLWW or WWWWL. The important thing to you is that you won $3.00that particular day.
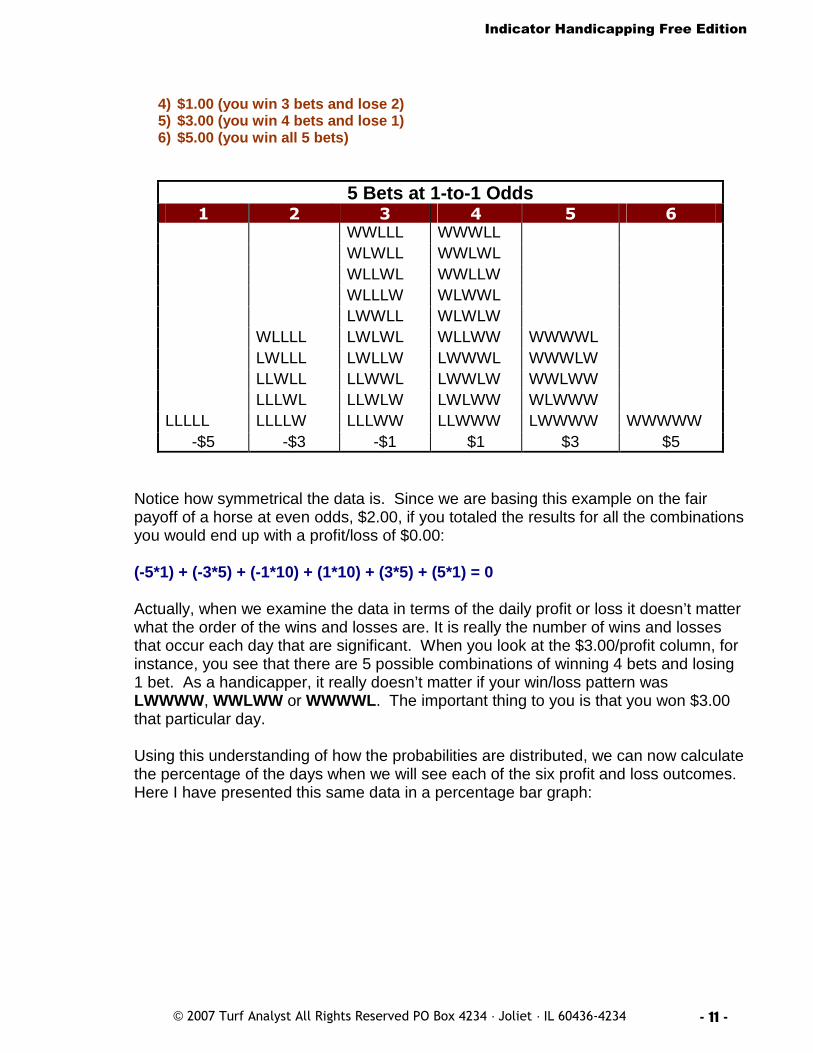
Using this understanding of how the probabilities are distributed, we can now calculatethe percentage of the days when we will see each of the six profit and loss outcomes.Here I have presented this same data in a percentage bar graph:
5 Bets at 1-to-1 Odds1 2 3 4 5 6
WWLLL WWWLL
WLWLL WWLWL
WLLWL WWLLW
WLLLW WLWWL
LWWLL WLWLW
WLLLL LWLWL WLLWW WWWWL
LWLLL LWLLW LWWWL WWWLW
LLWLL LLWWL LWWLW WWLWW
LLLWL LLWLW LWLWW WLWWW
LLLLL LLLLW LLLWW LLWWW LWWWW WWWWW
-$5 -$3 -$1 $1 $3 $5
Indicator Handicapping Free Edition
© 2007 Turf Analyst All Rights Reserved PO Box 4234 · Joliet · IL 60436-4234 - 12 -
0.00%
5.00%
10.00%
15.00%
20.00%
25.00%
30.00%
35.00%
Daily Profit/Loss
5 Bets at 1-to-1 Odds
Percentage
Percentage 3.13% 15.63% 31.25% 31.25% 15.63% 3.13%
-$5 -$3 -$1 $1 $3 $5
To demonstrate the how to use the percentage chart, let’s say that you are interestedin knowing how many days a year you can expect to lose all 5 of your bets. If you lookat the percentage in the first column, it shows that that 3.13% of the days, you wouldlose all 5 of the daily bets and lose $5.00. To make the calculation you convert thepercentage to a decimal by shifting the decimal point two places to the left (3.13% =0.0313) and multiplying the number of days in a year (365) by the decimal (0.0313).The result is that you would lose all 5 of your daily bets about 11 days (365 * 0.0313 =11.425) each year.
It is important to understand that losing streaks like these can not be avoided. Manyhandicappers believe that they can minimize or shorten the effect of losing streaks byimproving their handicapping skills. Unfortunately, losing streaks are inevitable andare determined by the underlying odds of your bets according to the laws ofprobability. They happen to everyone, even the best handicappers.
You can no more avoid a losing streak using your handicapping skill than someonewho is good at flipping coins can prevent a series of tails from occurring. While I’m onthis subject I should also point out that you can not just stand aside and wait out alosing streak either. Using a strategy that waits for a losing streak to end actuallycauses you to miss out on the winner that ends the streak. The fact that you are on alosing streak does not affect the odds of your next bet. If you have just flipped a coin25 times and got 25 tails in a row, the odds of flipping a heads on your next toss is still1-to-1.
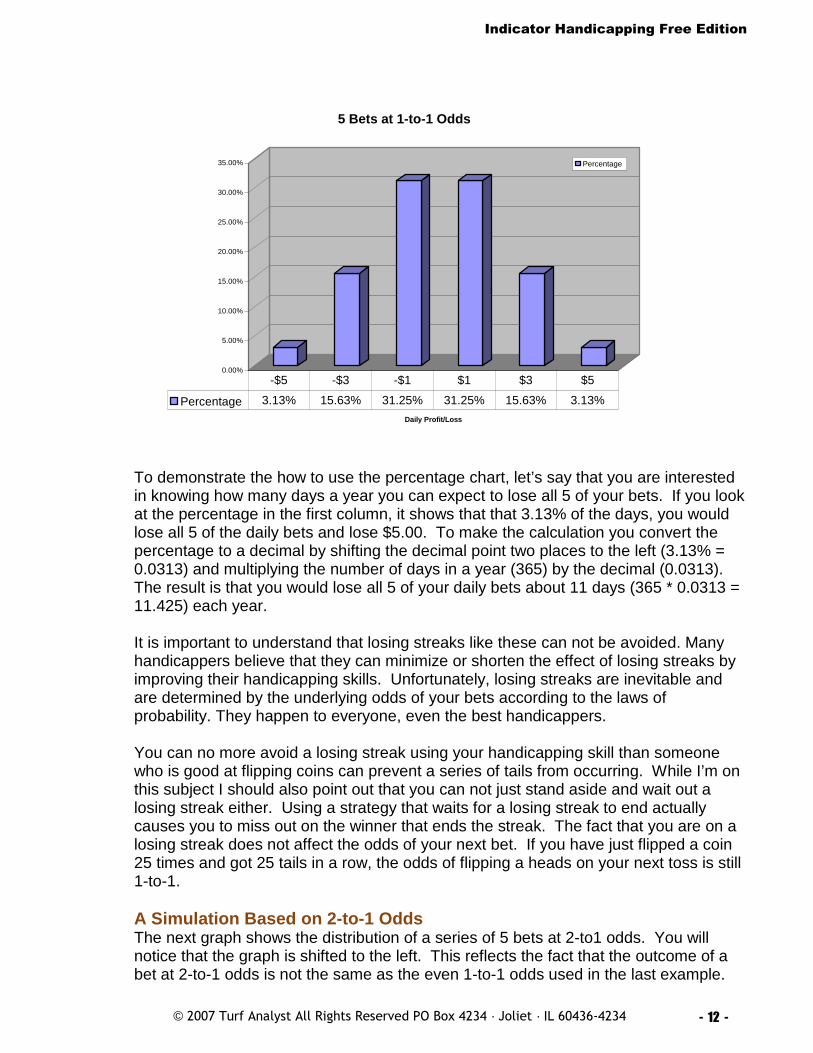
A Simulation Based on 2-to-1 OddsThe next graph shows the distribution of a series of 5 bets at 2-to1 odds. You willnotice that the graph is shifted to the left. This reflects the fact that the outcome of abet at 2-to-1 odds is not the same as the even 1-to-1 odds used in the last example.
Indicator Handicapping Free Edition
© 2007 Turf Analyst All Rights Reserved PO Box 4234 · Joliet · IL 60436-4234 - 13 -
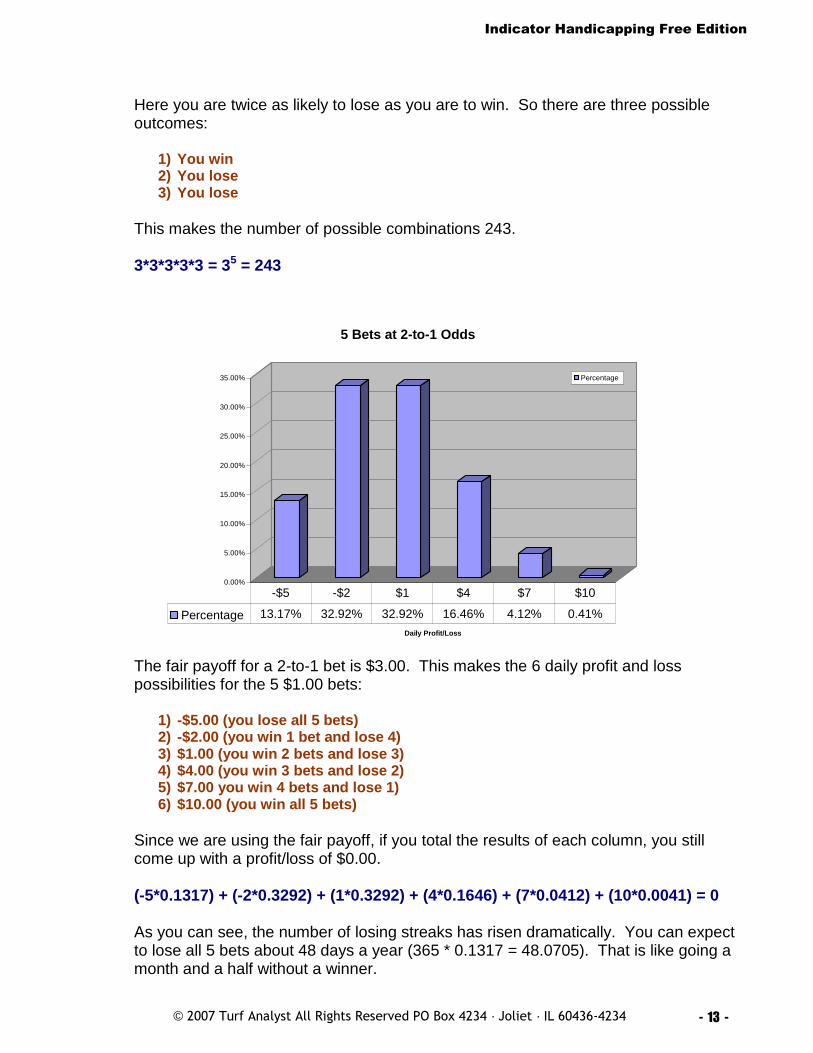
Here you are twice as likely to lose as you are to win. So there are three possibleoutcomes:
1) You win2) You lose3) You lose
This makes the number of possible combinations 243.
3*3*3*3*3 = 35 = 243
0.00%
5.00%
10.00%
15.00%
20.00%
25.00%
30.00%
35.00%
Daily Profit/Loss
5 Bets at 2-to-1 Odds
Percentage
Percentage 13.17% 32.92% 32.92% 16.46% 4.12% 0.41%
-$5 -$2 $1 $4 $7 $10
The fair payoff for a 2-to-1 bet is $3.00. This makes the 6 daily profit and losspossibilities for the 5 $1.00 bets:
1) -$5.00 (you lose all 5 bets)2) -$2.00 (you win 1 bet and lose 4)3) $1.00 (you win 2 bets and lose 3)4) $4.00 (you win 3 bets and lose 2)5) $7.00 you win 4 bets and lose 1)6) $10.00 (you win all 5 bets)
Since we are using the fair payoff, if you total the results of each column, you stillcome up with a profit/loss of $0.00.
(-5*0.1317) + (-2*0.3292) + (1*0.3292) + (4*0.1646) + (7*0.0412) + (10*0.0041) = 0
As you can see, the number of losing streaks has risen dramatically. You can expectto lose all 5 bets about 48 days a year (365 * 0.1317 = 48.0705). That is like going amonth and a half without a winner.
Indicator Handicapping Free Edition
© 2007 Turf Analyst All Rights Reserved PO Box 4234 · Joliet · IL 60436-4234 - 14 -
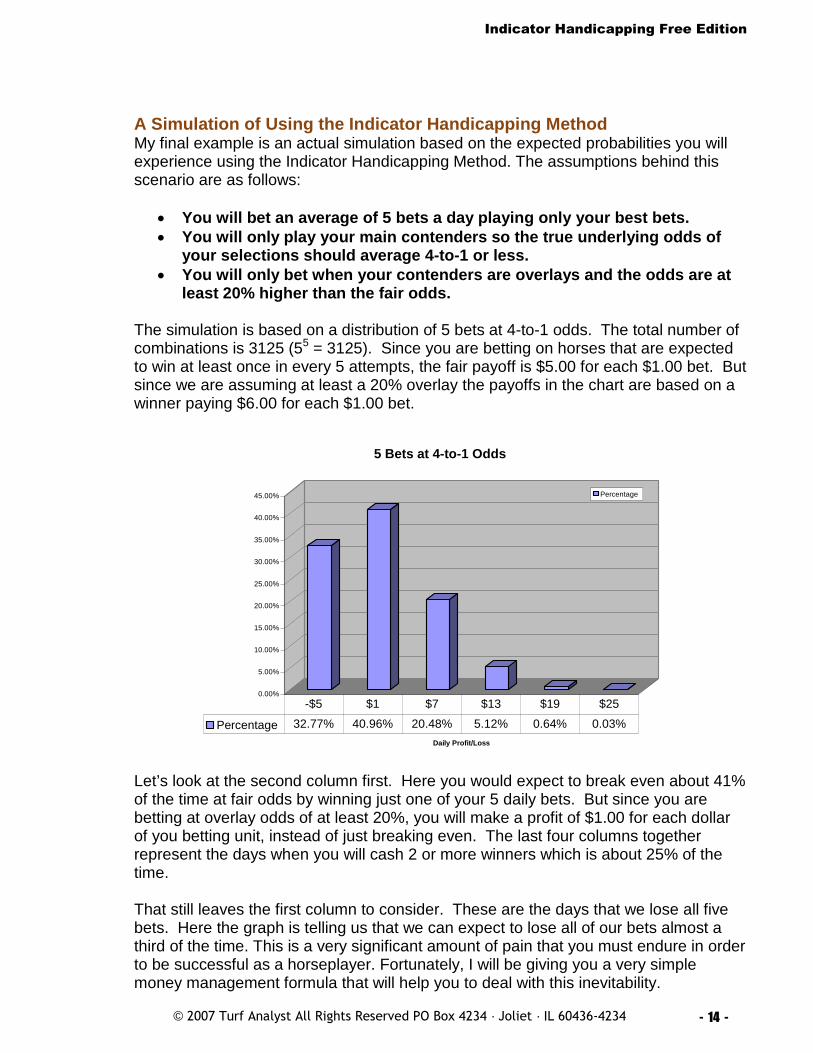
A Simulation of Using the Indicator Handicapping MethodMy final example is an actual simulation based on the expected probabilities you willexperience using the Indicator Handicapping Method. The assumptions behind thisscenario are as follows:
You will bet an average of 5 bets a day playing only your best bets. You will only play your main contenders so the true underlying odds of
your selections should average 4-to-1 or less. You will only bet when your contenders are overlays and the odds are at
least 20% higher than the fair odds.
The simulation is based on a distribution of 5 bets at 4-to-1 odds. The total number ofcombinations is 3125 (55 = 3125). Since you are betting on horses that are expectedto win at least once in every 5 attempts, the fair payoff is $5.00 for each $1.00 bet. Butsince we are assuming at least a 20% overlay the payoffs in the chart are based on awinner paying $6.00 for each $1.00 bet.
0.00%
5.00%
10.00%
15.00%
20.00%
25.00%
30.00%
35.00%
40.00%
45.00%
Daily Profit/Loss
5 Bets at 4-to-1 Odds
Percentage
Percentage 32.77% 40.96% 20.48% 5.12% 0.64% 0.03%
-$5 $1 $7 $13 $19 $25
Let’s look at the second column first. Here you would expect to break even about 41%of the time at fair odds by winning just one of your 5 daily bets. But since you arebetting at overlay odds of at least 20%, you will make a profit of $1.00 for each dollarof you betting unit, instead of just breaking even. The last four columns togetherrepresent the days when you will cash 2 or more winners which is about 25% of thetime.
That still leaves the first column to consider. These are the days that we lose all fivebets. Here the graph is telling us that we can expect to lose all of our bets almost athird of the time. This is a very significant amount of pain that you must endure in orderto be successful as a horseplayer. Fortunately, I will be giving you a very simplemoney management formula that will help you to deal with this inevitability.
Indicator Handicapping Free Edition
© 2007 Turf Analyst All Rights Reserved PO Box 4234 · Joliet · IL 60436-4234 - 15 -
As we have already learned, there is no way to eliminate these losing days. But it isinteresting to note that many of the people who sell handicapping related products willeliminating the losing days from their workouts, making their products look much betterthan they really are. When you really examine these workouts, you will see that theyare usually not based on enough data to be statistically significant or their distributionsare not normal and do not conform to the laws of probability.
This is why I have never provided workouts or guarantees that you will be successfulusing my handicapping method. The use of these tactics presents the illusion thatbeing a successful handicapper is easier that it really is.
The Odds ConclusionHere are the assumptions and the expected results that you should experience whileusing the Indicator Handicapping System.
The assumptions are:
You will make an average of 5 bets a day, the true underlying odds of yourselections should average 4-to-1 or less and your selections will be at overlayodds of 20% or higher than the horse’s actual chances of winning the race.
The expected daily results are:
1) 32.77% of the days you will lose all 5 bets resulting in a $5.00 loss for each dollar in yourbetting unit.
2) 40.96% of the days you will win 1 bet and lose 4 bets resulting in a $1.00 gain for eachdollar in your betting unit.
3) 20.48% of the days you will win 2 bets and lose 3 bets resulting in a $7.00 gain for eachdollar in your betting unit.
4) 5.12% of the days you will win 3 bets and lose 2 bets resulting in a $13.00 gain for eachdollar in your betting unit.
5) 0.64% of the days you will win 4 bets and lose 1 bet resulting in a $19.00 gain for eachdollar in your betting unit.
6) 0.03% of the days you will win all 5 of your bets resulting in a $25.00 gain for each dollar inyou betting unit.
Indicator Handicapping Free Edition
© 2007 Turf Analyst All Rights Reserved PO Box 4234 · Joliet · IL 60436-4234 - 16 -
Chapter 3
Money Management
In dealing with the risks associated with betting horses it is important to know inadvance what is going to happen and to have a strategy in place to deal with allpossible outcomes. In providing such a plan to you, I am also going to make threesuggestions that will help to prepare you emotionally to handle both the good days andthe bad days that are inevitable when you play this game:
1. Before You Begin, Practice on PaperBy starting out making paper bets, you will learn faster and make fewermistakes when you are actually betting real money. Practicing on paper willalso give you confidence and will prevent your success from being sabotagedby fear or greed.
2. Start Out by Only Betting Very Small Amounts of MoneyIt is very important to not have a large emotional investment in each bet youmake. You should make it a habit of betting unemotionally. This is much easierto do when you start out making bets that are much smaller than your usualbetting unit.
3. Psychologically isolate each day’s activitiesThink of each day as being a separate unit. Each day calculate your bettingunit for that day and make all your bets that same amount. Only play your mostprofitable bets. Don’t worry about how you did yesterday or how well you willdo tomorrow.
Using the Money Management PlanWhen you determine your starting betting unit, you should consider how much moneyyou would feel comfortable losing each day if you lost all the bets you placed that day.You should also bear in mind that you are expecting to have losing days about 33% ofthe time. This means that there will be many back to back losing days.
Let’s say, for example, that you are willing to risk $25.00 a day. The number of betsyou play each day will depend on how many tracks you play. But if you are bettingover the internet, you should have no trouble finding 5 very good bets by playing 2 to 4tracks each day. This would mean that your initial betting unit would be $5.00($25.00/5 = $5.00).
After you have determined your initial betting unit, you need to calculate your startingbankroll. The bankroll is not an actual amount of money you are keeping in your backpocket. It is a hypothetical sum which is used to calculate the size of your bets eachday.
Indicator Handicapping Free Edition
© 2007 Turf Analyst All Rights Reserved PO Box 4234 · Joliet · IL 60436-4234 - 17 -
Bank Roll 0.50% 1.00% Bank Roll 0.50% 1.00% Bank Roll 0.50% 1.00%
2000 10 20 5000 25 50 20000 100 2001900 10 19 4800 24 48 19000 95 1901800 9 18 4600 23 46 18000 90 1801700 9 17 4400 22 44 17000 85 1701600 8 16 4200 21 42 16000 80 1601500 8 15 4000 20 40 15000 75 1501400 7 14 3800 19 38 14000 70 1401300 7 13 3600 18 36 13000 65 1301200 6 12 3400 17 34 12000 60 1201100 6 11 3200 16 32 11000 55 1101000 5 10 3000 15 30 10000 50 100900 5 9 2900 15 29 9500 48 95800 4 8 2800 14 28 9000 45 90700 4 7 2700 14 27 8500 43 85
600 3 6 2600 13 26 8000 40 80500 3 5 2500 13 25 7500 38 75400 2 4 2400 12 24 7000 35 70300 2 3 2300 12 23 6500 33 65200 2 2 2200 11 22 6000 30 60100 2 2 2100 11 21 5500 28 55
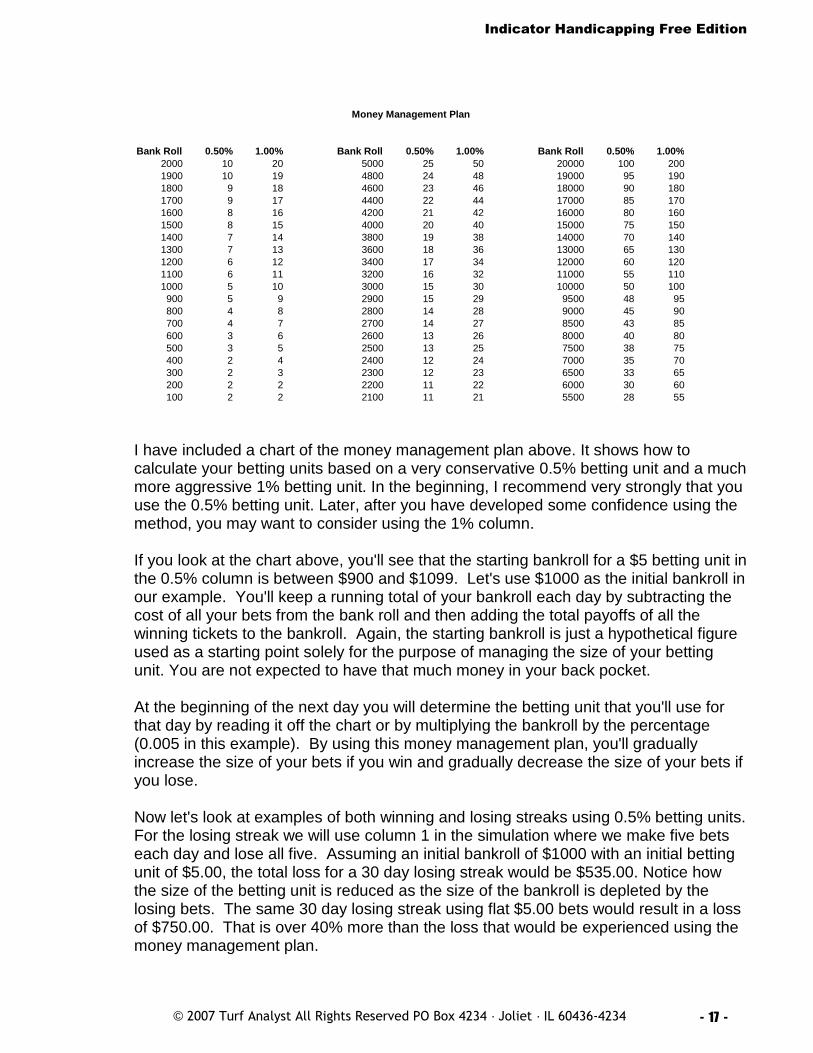
Money Management Plan
I have included a chart of the money management plan above. It shows how tocalculate your betting units based on a very conservative 0.5% betting unit and a muchmore aggressive 1% betting unit. In the beginning, I recommend very strongly that youuse the 0.5% betting unit. Later, after you have developed some confidence using themethod, you may want to consider using the 1% column.
If you look at the chart above, you'll see that the starting bankroll for a $5 betting unit inthe 0.5% column is between $900 and $1099. Let's use $1000 as the initial bankroll inour example. You'll keep a running total of your bankroll each day by subtracting thecost of all your bets from the bank roll and then adding the total payoffs of all thewinning tickets to the bankroll. Again, the starting bankroll is just a hypothetical figureused as a starting point solely for the purpose of managing the size of your bettingunit. You are not expected to have that much money in your back pocket.
At the beginning of the next day you will determine the betting unit that you'll use forthat day by reading it off the chart or by multiplying the bankroll by the percentage(0.005 in this example). By using this money management plan, you'll graduallyincrease the size of your bets if you win and gradually decrease the size of your bets ifyou lose.
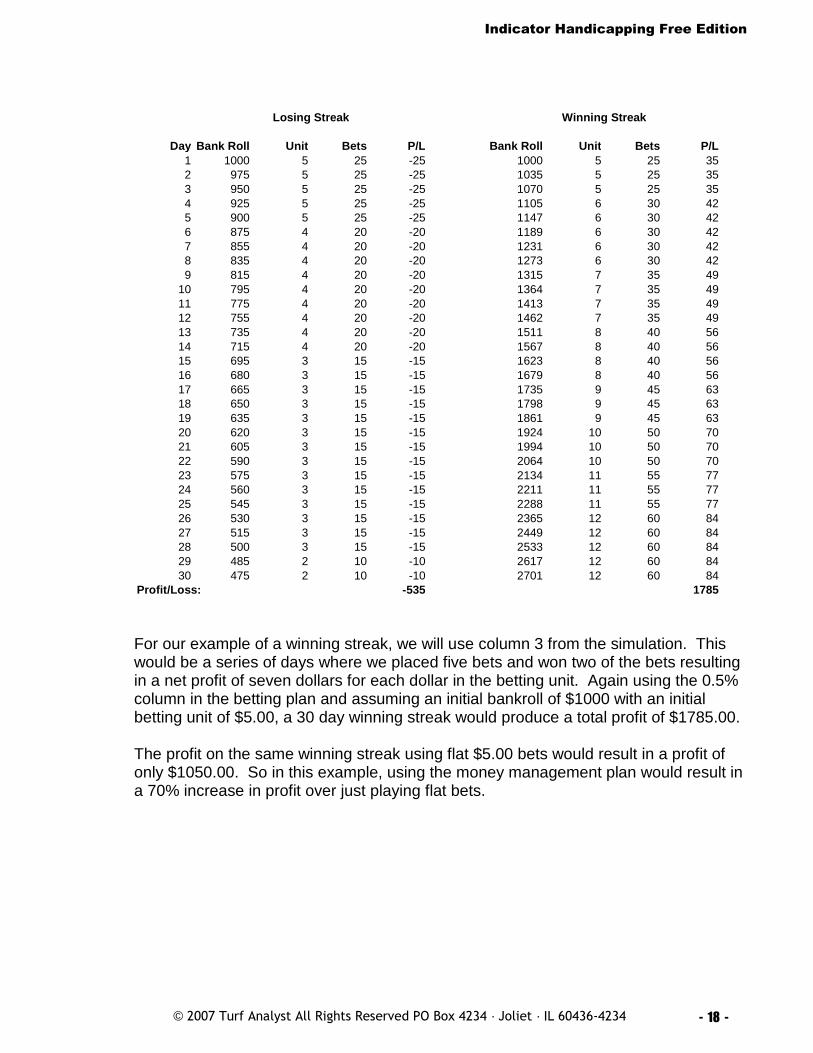
Now let's look at examples of both winning and losing streaks using 0.5% betting units.For the losing streak we will use column 1 in the simulation where we make five betseach day and lose all five. Assuming an initial bankroll of $1000 with an initial bettingunit of $5.00, the total loss for a 30 day losing streak would be $535.00. Notice howthe size of the betting unit is reduced as the size of the bankroll is depleted by thelosing bets. The same 30 day losing streak using flat $5.00 bets would result in a lossof $750.00. That is over 40% more than the loss that would be experienced using themoney management plan.
Indicator Handicapping Free Edition
© 2007 Turf Analyst All Rights Reserved PO Box 4234 · Joliet · IL 60436-4234 - 18 -
Day Bank Roll Unit Bets P/L Bank Roll Unit Bets P/L
1 1000 5 25 -25 1000 5 25 352 975 5 25 -25 1035 5 25 353 950 5 25 -25 1070 5 25 354 925 5 25 -25 1105 6 30 425 900 5 25 -25 1147 6 30 426 875 4 20 -20 1189 6 30 427 855 4 20 -20 1231 6 30 428 835 4 20 -20 1273 6 30 429 815 4 20 -20 1315 7 35 49
10 795 4 20 -20 1364 7 35 4911 775 4 20 -20 1413 7 35 4912 755 4 20 -20 1462 7 35 4913 735 4 20 -20 1511 8 40 5614 715 4 20 -20 1567 8 40 5615 695 3 15 -15 1623 8 40 5616 680 3 15 -15 1679 8 40 5617 665 3 15 -15 1735 9 45 6318 650 3 15 -15 1798 9 45 6319 635 3 15 -15 1861 9 45 6320 620 3 15 -15 1924 10 50 7021 605 3 15 -15 1994 10 50 7022 590 3 15 -15 2064 10 50 7023 575 3 15 -15 2134 11 55 7724 560 3 15 -15 2211 11 55 7725 545 3 15 -15 2288 11 55 7726 530 3 15 -15 2365 12 60 8427 515 3 15 -15 2449 12 60 8428 500 3 15 -15 2533 12 60 8429 485 2 10 -10 2617 12 60 8430 475 2 10 -10 2701 12 60 84
Profit/Loss: -535 1785
Losing Streak Winning Streak
For our example of a winning streak, we will use column 3 from the simulation. Thiswould be a series of days where we placed five bets and won two of the bets resultingin a net profit of seven dollars for each dollar in the betting unit. Again using the 0.5%column in the betting plan and assuming an initial bankroll of $1000 with an initialbetting unit of $5.00, a 30 day winning streak would produce a total profit of $1785.00.
The profit on the same winning streak using flat $5.00 bets would result in a profit ofonly $1050.00. So in this example, using the money management plan would result ina 70% increase in profit over just playing flat bets.
Indicator Handicapping Free Edition
© 2007 Turf Analyst All Rights Reserved PO Box 4234 · Joliet · IL 60436-4234 - 19 -
Chapter 4
The Overlay Indicator
It's five minutes to post time and you are looking over your top contenders in theupcoming race. Your handicapping has told you which horses will play a major role indetermining the outcome of the race. Most likely, you have isolated the one or twohorses that will probably win today. But how do you know when a horse is worthbetting on? In other words, is the horse an overlay? Will he pay enough to justify thebet?
The Indicator Handicapping Method is designed to systematically detect overlaysituations. In the final step of your handicapping you will calculate the overlayindicator for each of your main contenders. The overlay indicator will serve as a kindof warning light to let you know when to take action. If it is flashing you will know thata good betting opportunity has developed. If none of the overlay indicators areflashing, you should pass the race. Used correctly, it will put you on the winning endof some very nice payoffs. But before we look at the overlay indicator, we must learnhow the betting pools work.
The Track Take and BreakThe percentage of the betting pool that the track takes out for win bets is 17% to 20%at most tracks. The take for the exotic bets is usually higher and can be up to 25% ofthe betting pool. You should also be aware of the fact that many off-track bettingparlors will take an additional 2% to 5% out of the betting pool.
Breakage occurs when the track rounds down the payoff on a $2.00 winning ticket tothe next lowest whole dime. The effect of the breakage for the horses that we will bebetting is to add 0.5% to 1% to the tracks take. But, when you are betting on horsesthat go to post at lower odds, the break will be much more significant. Also, the breakfor place and show bets can be extremely high making it almost impossible to show aprofit using these betting pools.
My friend John, who taught me how to handicap, always maintained that in most racesevery horse will be an underlay after the track cuts the pool. It was his contention thatthe public as a whole will handicap most races so accurately that after the take andbreak there will be relatively few playable overlays.
Over my career as a handicapper, I have devoted considerable time to researchingthis matter. To test this theory, I wrote a program that converted the free results chartspublished on the Internet into flat text files. Using the program, I was able to develop adatabase covering the results of every major race track for one year. My databaseincluded the name of each horse running in each race, as well as its closing odds, thepayoff and the finish position.
Using my database, I was able to run studies that clearly showed that the favorite doeswin most of the time and the second choice in the betting wins the second most often.
Indicator Handicapping Free Edition
© 2007 Turf Analyst All Rights Reserved PO Box 4234 · Joliet · IL 60436-4234 - 20 -
This continues for the horses with the third highest odds and the fourth highest odds,right up to the longest long shot who wins the least often.
When you rank the horses by the closing odds, they will follow this same pattern. Thegroup of horses that went to post with odds of less than 1-to-1 won a higherpercentage of their races than the horses with closing odds of 1-to-1. This secondgroup of horses with closing odds of 1-to-1 won a higher percent of their races thanthe horse with closing odds of 2-to-1, so again you see that as the odds increase thewinning percentage decreases uniformly.
What this means is that the public usually does do a very good job handicapping mostraces. To further test this theory, I used the same database to examine how profitableeach odds grouping would be when bet to win. The results show the same pattern.The odds-on favorites, the horses that went to post at less than 1-to-1 odds, actuallylost the least amount of money. The horses that went to post at 1-to-1 closing oddslost the second most for each dollar bet. Again, as the odds increase so did theexpected loss. So if you bet every horse that went to post at 3-to-1 odds, for instance,you would lose less money per dollar bet that if you bet every horse that went to postat 4-to-1 odds.
This illustrates how good the collective judgment of the track patrons is. It also showswhy handicapping is so difficult. When you make a bet you are actually betting againstthe collective judgment of the crowd as represented by the tote board. In fact, thebetting line determined by the closing odds is by far the most accurate estimate ofeach horse’s chances of winning. Over a long series of races, I have never seen anybetting line made by a commercial handicapping program or by a professional bettingservice even come close to beating the betting line determined by the closing odds.
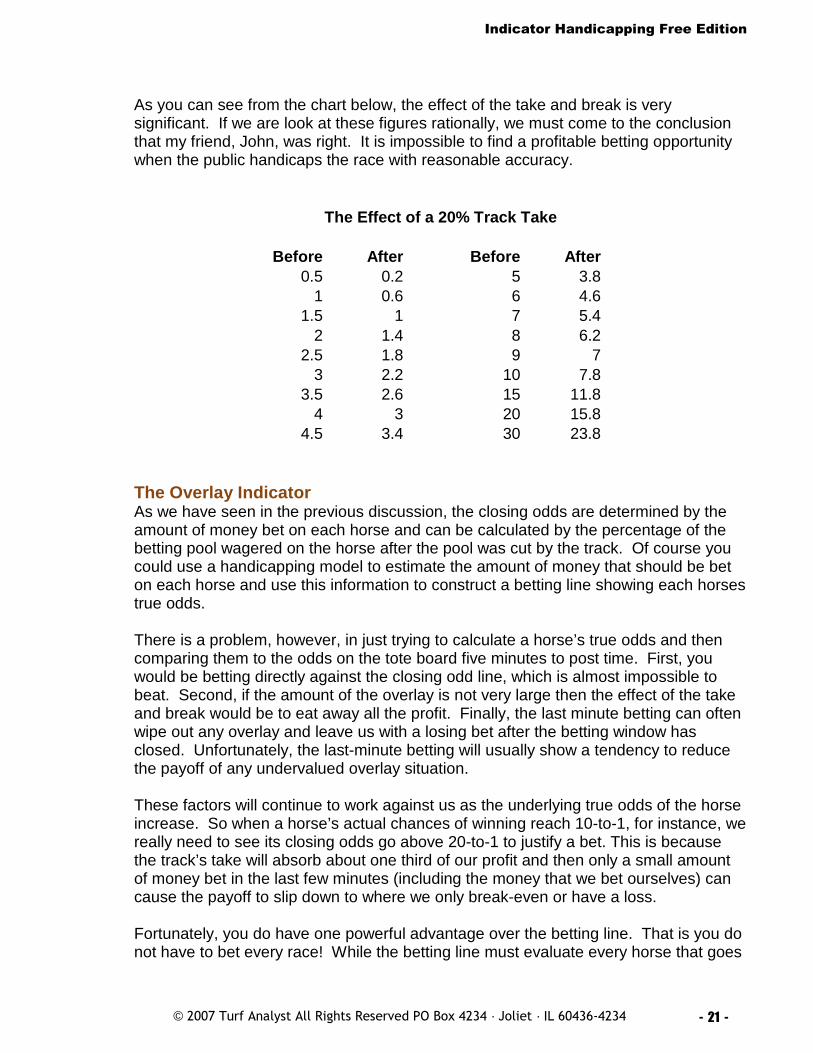
How the Odds Are Affected by the Take and BreakLet's use a specific example to illustrate how the take and break affects the betting.We will make the assumptions that a horse’s actual chances of winning a particularrace will be 4-to-1 and that the track’s take and break will total 20% of the betting pool.If the betting public correctly assesses this horse’s chances of winning, then 20% ofthe betting pool will be wagered on our horse.
After the track cuts the pool by 20%, however, the amount of money wagered on thehorse will now be effectively increased to 25% of the betting pool resulting in a payoffof only 3-to-1 instead of the expected 4-to-1 payoff. Betting on a series of horses likethis will guarantee you a loss in the long run because you are not being adequatelycompensated for the risk that you’re taking.
In order to overcome the effect of the take, the public would have to reduce theamount bet on the horse causing it to go to post at 5.25-to-1 odds before the track cutsthe pool. This would mean that only 16% of the money in the betting pool should bewagered on our horse before the take and break occurs. Even if that did happen,remember that it would still not produce a profit over a long series of similar bets. Itwould only give you the expectation of breaking even if you bet the horse.
Indicator Handicapping Free Edition
© 2007 Turf Analyst All Rights Reserved PO Box 4234 · Joliet · IL 60436-4234 - 21 -
As you can see from the chart below, the effect of the take and break is verysignificant. If we are look at these figures rationally, we must come to the conclusionthat my friend, John, was right. It is impossible to find a profitable betting opportunitywhen the public handicaps the race with reasonable accuracy.
Before After Before After
0.5 0.2 5 3.81 0.6 6 4.6
1.5 1 7 5.4
2 1.4 8 6.22.5 1.8 9 7
3 2.2 10 7.83.5 2.6 15 11.8
4 3 20 15.84.5 3.4 30 23.8
The Effect of a 20% Track Take
The Overlay IndicatorAs we have seen in the previous discussion, the closing odds are determined by theamount of money bet on each horse and can be calculated by the percentage of thebetting pool wagered on the horse after the pool was cut by the track. Of course youcould use a handicapping model to estimate the amount of money that should be beton each horse and use this information to construct a betting line showing each horsestrue odds.
There is a problem, however, in just trying to calculate a horse’s true odds and thencomparing them to the odds on the tote board five minutes to post time. First, youwould be betting directly against the closing odd line, which is almost impossible tobeat. Second, if the amount of the overlay is not very large then the effect of the takeand break would be to eat away all the profit. Finally, the last minute betting can oftenwipe out any overlay and leave us with a losing bet after the betting window hasclosed. Unfortunately, the last-minute betting will usually show a tendency to reducethe payoff of any undervalued overlay situation.
These factors will continue to work against us as the underlying true odds of the horseincrease. So when a horse’s actual chances of winning reach 10-to-1, for instance, wereally need to see its closing odds go above 20-to-1 to justify a bet. This is becausethe track’s take will absorb about one third of our profit and then only a small amountof money bet in the last few minutes (including the money that we bet ourselves) cancause the payoff to slip down to where we only break-even or have a loss.
Fortunately, you do have one powerful advantage over the betting line. That is you donot have to bet every race! While the betting line must evaluate every horse that goes
Indicator Handicapping Free Edition
© 2007 Turf Analyst All Rights Reserved PO Box 4234 · Joliet · IL 60436-4234 - 22 -
to post, you do not. You can greatly improve your results by sitting back and waitingfor the betting public to make a big mistake in their evaluations.
To maximize this advantage, I have developed the Overlay Indicator. It has the abilityto tell you just how profitable any particular betting situation will likely be. Of course,the results that you achieve with the overlay indicator will be governed by how goodyour handicapping is. It works best with a handicapping system that is designed touncover overlay betting situations like the Indicator Handicapping Method, but it will behelpful to any handicapper regardless of the handicapping method being used.
The Construction of the Overlay IndicatorAs a practical mater, it will only be necessary to look for overlays in the top three orfour contenders. Any over lay detected in the rest of the field will not be big enough tobe playable. Then instead of looking for shifts in the betting odds, we will look forshifts in the betting rank.
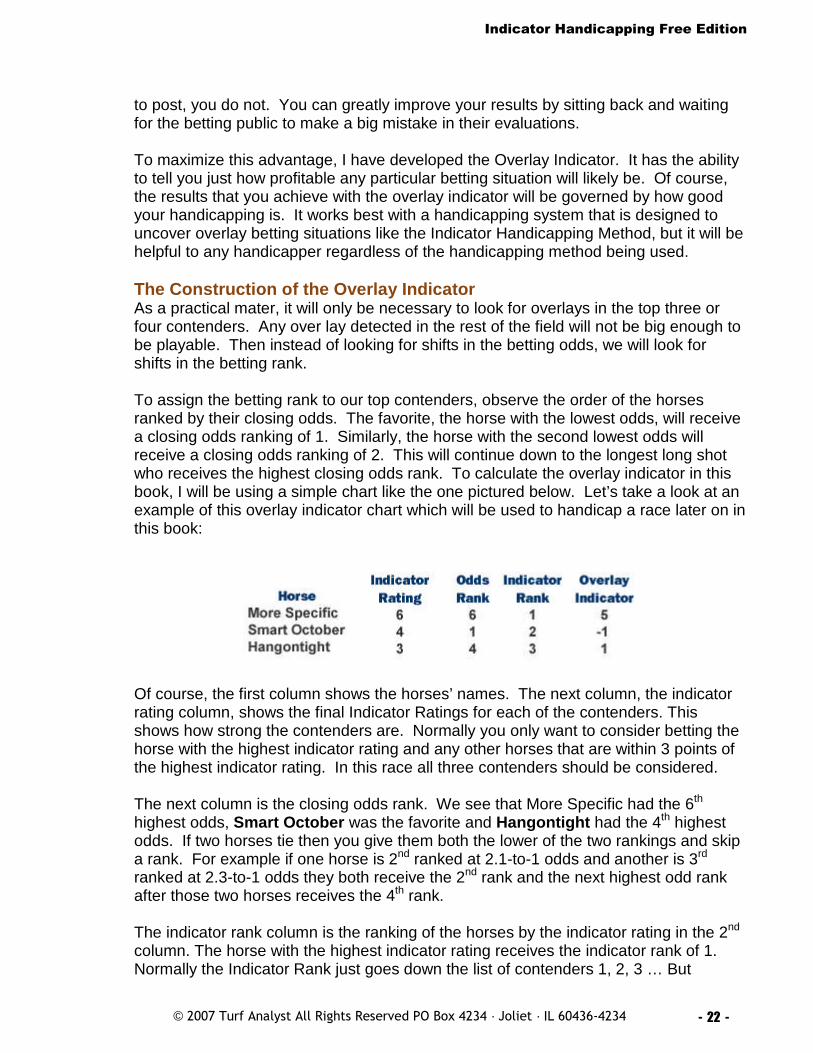
To assign the betting rank to our top contenders, observe the order of the horsesranked by their closing odds. The favorite, the horse with the lowest odds, will receivea closing odds ranking of 1. Similarly, the horse with the second lowest odds willreceive a closing odds ranking of 2. This will continue down to the longest long shotwho receives the highest closing odds rank. To calculate the overlay indicator in thisbook, I will be using a simple chart like the one pictured below. Let’s take a look at anexample of this overlay indicator chart which will be used to handicap a race later on inthis book:
Of course, the first column shows the horses’ names. The next column, the indicatorrating column, shows the final Indicator Ratings for each of the contenders. Thisshows how strong the contenders are. Normally you only want to consider betting thehorse with the highest indicator rating and any other horses that are within 3 points ofthe highest indicator rating. In this race all three contenders should be considered.
The next column is the closing odds rank. We see that More Specific had the 6th
highest odds, Smart October was the favorite and Hangontight had the 4th highestodds. If two horses tie then you give them both the lower of the two rankings and skipa rank. For example if one horse is 2nd ranked at 2.1-to-1 odds and another is 3rd
ranked at 2.3-to-1 odds they both receive the 2nd rank and the next highest odd rankafter those two horses receives the 4th rank.
The indicator rank column is the ranking of the horses by the indicator rating in the 2nd
column. The horse with the highest indicator rating receives the indicator rank of 1.Normally the Indicator Rank just goes down the list of contenders 1, 2, 3 … But
Indicator Handicapping Free Edition
© 2007 Turf Analyst All Rights Reserved PO Box 4234 · Joliet · IL 60436-4234 - 23 -
sometimes there can be a tie in the indicator rating. That is handled in the same wayas a tie in the odds rank. There will be an example of that in the final chapter.
Finally the overlay indicator column is calculated by subtracting the indicator rank fromthe odds rank. To be playable the overlay indicator should be at least a +2. In thisrace More Specific receives a +5 Overlay Indicator (6 – 1 = 5) making him a very nicebet. The other two horses have Overlay Indicators of less than +2 and should not bebet.
The advantages of using the shifting in the odds rank in calculating the overlayindicator as opposed to using the shift in the actual odds are:
1) The Odds Rank is less sensitive to changes in the last minute betting2) A shift of two positions in the Odds Rank is more than enough to overcome the
effect of the take and break.3) It is very simple to calculate and apply during the final minutes of betting.
As you can see, the overlay indicator is very simple and practical. I designed thewhole Indicator Handicapping Method to be practical and easy to use between racesat the track. Once you learn it, you should be able to handicap a race in minutes usingonly simple math, most of which you can just do in your head.
This chapter marks the end of the free version of the Indicator Handicapping Method.For those or you who are planning to purchase the full selection method, I have someadvice to consider. After you have applied the indicators and tallied the results you willhave a list of contenders just like the list you saw in the indicator ranking column in the
Indicator Handicapping Free Edition
© 2007 Turf Analyst All Rights Reserved PO Box 4234 · Joliet · IL 60436-4234 - 24 -
chart up above. Do not make the mistake in thinking that the horse in the first positionof the Indicator Ranking Column is the horse that is most likely to win the race.
What you should be thinking is that he is likely to be the best betting opportunity if heis confirmed by the overlay indicator with at least a +2 overlay rating. It is important toremember that the Indicator Handicapping System is designed to find profitable bets,not to pick the winner of the race.
I am often asked by the people who have read the book how well IndicatorHandicapping will work for them. I always answer how well you do will depend on howselective you are in your betting. If you confine your self to only betting on the horsewith the highest indicator rating, and only bet when the overlay indicator is a +4 orhigher, you should do extremely well. The problem with that strategy is that you will notbe making many bets and you may suffer from boredom.
Another selective betting strategy would be to only bet the horse with the highestIndicator rating if the overlay indicator is +3 or higher or to bet the 2nd highest indicatorrating horse if it is within 2 indicator rating points of the highest horse and has anoverlay indicator rating of +4 or higher. This is a great way to go if you are interestedin confining yourself to only best betting opportunities.
The most liberal betting strategy that I could recommend would to bet the horse withthe highest indicator rating if the overlay indicator is +2 or higher or bet any othercontender if they are within 3 indicator rating points of the highest horse and have anoverlay indicator rating of +3 or higher. You may not do quite as well using this as theother two plans but you will have a lot more action. Chances are you will still farebetter than what you are doing now.
This concludes the free version of the IndicatorHandicapping Method 2nd Edition. I hope you haveenjoyed reading it. If you wish to purchase the rest ofthis book, please follow this link:
Indicator Handicapping Method 2nd Edition