higher education background briefing fy 2009-10 education 2009-1… · university classified as a...
TRANSCRIPT

Background Briefing
HIGHER EDUCATION
Kyle I. Jen, Associate Director
January 2010
The fiscal information in this background briefing is based on data through January 1, 2010.

House Fiscal Agency: January 2010 2
Constitutional Provisions
Article VIII of the State Constitution:
Section 4: Requires Legislature to appropriate funds to maintain Michigan’s 15 state universities.
Section 5: Provides for elected boards of control for University of Michigan, Michigan State, and Wayne State.
Section 6: Provides for appointed boards of control for remaining state universities.
Sections 5 and 6: Grants each university board control and direction of all expenditures from institution’s funds.
Higher Education budget includes funds to fulfill constitutionalrequirement for financial support of state university operations.

House Fiscal Agency: January 2010 3
State Universities
190318681956195918171963195718991885185519461960188418491892
Founded
WMUWestern Michigan UniversityWSUWayne State UniversityUMFUniversity of Michigan – FlintUMDUniversity of Michigan – DearbornUMUniversity of Michigan – Ann Arbor
SVSUSaginaw Valley State UniversityOUOakland University
NMUNorthern Michigan UniversityMTUMichigan Tech. UniversityMSUMichigan State UniversityLSSULake Superior State UniversityGVSUGrand Valley State UniversityFSUFerris State UniversityEMUEastern Michigan UniversityCMUCentral Michigan University
AbbreviationUniversity

House Fiscal Agency: January 2010 4
Higher Education Appropriations
$1,925.8
$1,844.9
$1,696.7 $1,680.0$1,734.4 $1,749.5 $1,747.9 $1,754.1
$1,612.2
FY 02 FY 03 FY 04 FY 05 FY 06 FY 07 FY08 FY09 FY10
Mill
ions
FY 2009-10 Higher Education appropriations are roughly 16.3 percentlower than they were in FY 2001-02 (not adjusting for inflation).
Note: Delayed payments in 2004 and 2007 are reflected in original budget years

SOURCES OF FUNDING

House Fiscal Agency: January 2010 6
Revenue Sources
Other Federal$5,900,000
0.4%
State Restricted$30,400,100
1.9%
Federal ARRA$68,238,000
4.2%
State GF/GP$1,507,705,200
93.5%
FY 2009-10 Total = $1.61 Billion
Primary revenue source for Higher Education budget is state GF/GP;$68.2 million in federal ARRA revenue available in FY 2009-10 only.

House Fiscal Agency: January 2010 7
Share of State GF/GP
Higher Education$1,507,705,200
18.5%
All Other Budgets$6,620,334,000
81.5%
FY 2009-10 GF/GP Total = $8.13 Billion

STATE SPENDING

House Fiscal Agency: January 2010 9
Budget Description
The line item section of the FY 2009-10 Higher Education budget act is divided into three subparts:
• Research universities (Subpart A)• State universities (Subpart B)• Student financial aid and other higher education-related
programs (Subpart C)
All but 5.4% of FY 2009-10 Higher Education funding is appropriated to the 15 public universities for operations or other purposes.

House Fiscal Agency: January 2010 10
Higher Education Budget
Financial Aid/Other
$87,364,800 5.4%
State Universities$623,664,300
38.7%
Research Universities$901,214,200
55.9%
FY 2009-10 Total = $1.61 Billion
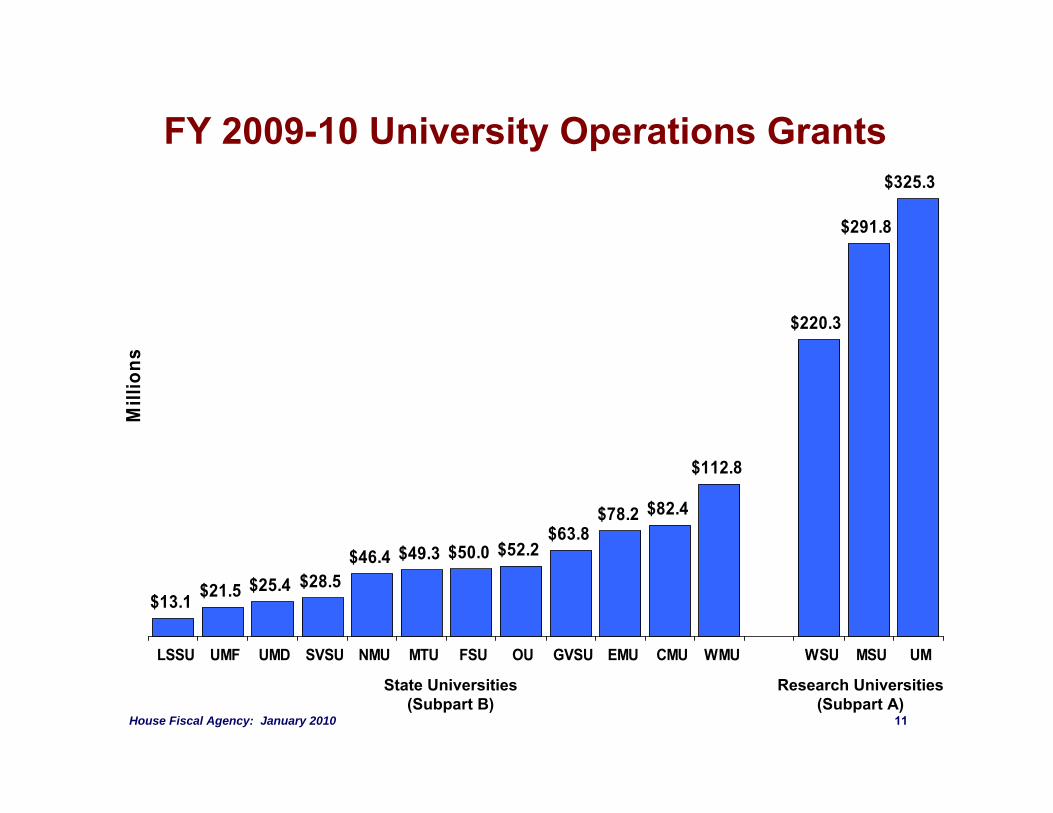
House Fiscal Agency: January 2010 11
FY 2009-10 University Operations Grants
$13.1 $21.5 $25.4 $28.5$46.4 $49.3 $50.0 $52.2
$63.8$78.2 $82.4
$112.8
$220.3
$291.8
$325.3
LSSU UMF UMD SVSU NMU MTU FSU OU GVSU EMU CMU WMU WSU MSU UM
Mill
ions
Research Universities(Subpart A)
State Universities(Subpart B)

House Fiscal Agency: January 2010 12
Additional ResearchUniversity Appropriations
Two separate appropriations are made to Michigan State annually:
Agricultural Experiment Station: $34.2 millionAgriculture research program operated by MSU at 14 facilities across state.
Cooperative Extension Service: $29.5 millionProgram jointly funded by counties to extend MSU’s public service mission across state in a variety of program areas:– Agriculture– Community and Economic Development– Family and Consumer Sciences– 4-H Youth Development– Natural Resources
Of total FY 2009-10 funding of $63.7 million for the two programs, $27.8 million is appropriated from federal ARRA funds available for one year only.

House Fiscal Agency: January 2010 13
Financial Aid Programs
Tuition GrantsNeed-based awards to students attending independent colleges.
State Competitive ScholarshipsAwards to students with both qualifying ACT score and financial need.
Tuition Incentive ProgramPayment of associate’s degree tuition costs and up to $2,000 for bachelor’s degree for Medicaid-eligible individuals.
Project GEAR UPFederally-funded awards targeted to students in urban school districts.
Robert C. Byrd Honors Scholarship ProgramFederally-funded awards to outstanding high school graduates.
Children of Veterans Tuition Grant ProgramGrants to children of deceased or disabled veterans.

House Fiscal Agency: January 2010 14
Financial Aid Funding
Tuition Incentive Program
$31,200,000 36.9%
Tuition Grants$31,664,700
37.5%
Other$4,000,100
4.7%
State Competitive Scholarships$17,608,500
20.8%
FY 2009-10 Total = $84.5 Million

House Fiscal Agency: January 2010 15
Other Higher Education Programs
King-Chavez-Parks: $2.7 million GF/GPGrant programs to increase participation of academically or economically disadvantaged students in postsecondary education.
Higher Education Database: $105,000 GF/GPMaintenance of Higher Education Institutional Data Inventory (HEIDI), to which state universities submit enrollment/finance data annually.
Midwestern Higher Education Compact: $95,000 GF/GPDues for interstate compact to realize economies of scale.

MAJOR BUDGET ISSUES
House Fiscal Agency: January 2010 17
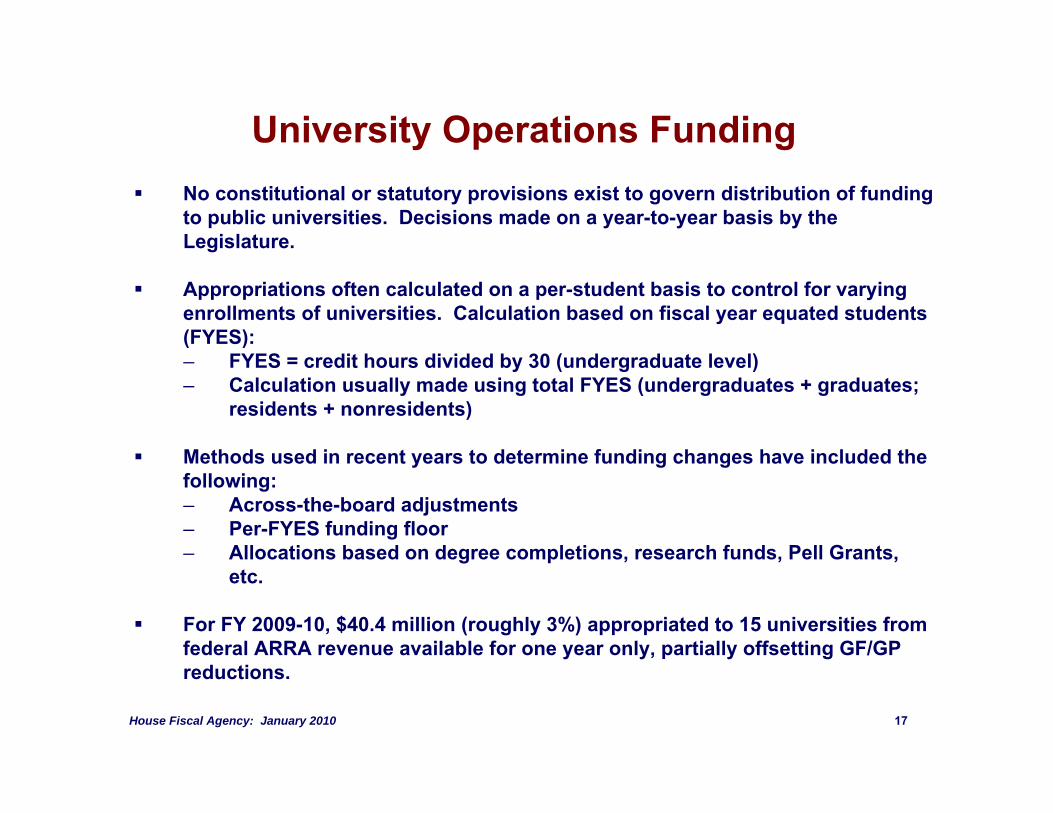
University Operations Funding No constitutional or statutory provisions exist to govern distribution of funding
to public universities. Decisions made on a year-to-year basis by the Legislature.
Appropriations often calculated on a per-student basis to control for varying enrollments of universities. Calculation based on fiscal year equated students (FYES):– FYES = credit hours divided by 30 (undergraduate level)– Calculation usually made using total FYES (undergraduates + graduates;
residents + nonresidents)
Methods used in recent years to determine funding changes have included the following:– Across-the-board adjustments– Per-FYES funding floor– Allocations based on degree completions, research funds, Pell Grants,
etc.
For FY 2009-10, $40.4 million (roughly 3%) appropriated to 15 universities from federal ARRA revenue available for one year only, partially offsetting GF/GP reductions.

House Fiscal Agency: January 2010 18
University Appropriations per StudentFY 2009-10 appropriations per FY 2008-09 FYES vary from $2,949 to $9,104.
$2,949$3,462 $3,465 $3,644 $3,829 $4,036 $4,287 $4,447
$5,069$5,469 $5,517
$7,487
$6,609
$7,874
$9,104
GVSU SVSU OU UMF CMU UMD FSU EMU WMU LSSU NMU MTU MSU UM WSU
Research Universities(Subpart A)
State Universities(Subpart B)

House Fiscal Agency: January 2010 19
Historical University Appropriations per StudentTotal FY 2009-10 university appropriations per FYES (two years prior) are 19.2 percent lower
than they were in FY 2000-01―or 34.9 percent lower on an inflation-adjusted basis.
$0
$2,000
$4,000
$6,000
$8,000
FY84
FY85
FY86
FY87
FY88
FY89
FY90
FY91
FY92
FY93
FY94
FY95
FY96
FY97
FY98
FY99
FY00
FY01
FY02
FY03
FY04
FY05
FY06
FY07
FY08
FY09
FY10
Nominal Approps/FYES Adjusted for US CPI

House Fiscal Agency: January 2010 20
University Classification
Beginning with fiscal year 2007-08, budget act distinguishes between Research Universities and other State Universities. Initially, budget act contained separate articles; for FY 2009-10, subparts in line item section are utilized.
Boilerplate language defines a Research University as a public university classified as a “research university (very high research activity)” under the 2005 Carnegie Classifications:
— Michigan State University— University of Michigan-Ann Arbor— Wayne State University
Carnegie Foundation classifies postsecondary institutions into various categories, utilizing data on (1) academic degree-granting activity at various levels and (2) research-related activities.

House Fiscal Agency: January 2010 21
FY 2009-10 Financial Aid Reductions
Appropriations for five financial aid programs eliminated:– Michigan Promise Grant Program ($140.0 million in FY 2009-10 Exec Rec)– Michigan Work Study Program ($7.3 million in FY 2008-09)– Nursing Scholarship Program ($4.25 million in FY 2008-09)– Part-Time Independent Student Program ($2.7 million in FY 2008-09)– Michigan Education Opportunity Grants ($2.1 million in FY 2008-09)
Appropriation for State Competitive Scholarships reduced from $35.5 million to $17.6 million (50.4%):– Maximum award amount lowered from $1,300 to $510
Appropriation for Tuition Grants reduced from $56.7 million to $31.7 million (44.1%):– Graduate student eligibility eliminated– Cap of $3.0 million per institution implemented (affects students at Baker
College and Davenport University)– Maximum award amount lowered from $2,100 to $1,610
Overall reduction of $63.9% in state funding for financial aid programs, from $217.5 million in FY 2008-09 to $78.6 million in FY 2009-10.

House Fiscal Agency: January 2010 22
Changes in State-Funded Financial Aid by Category
$0
$50
$100
$150
$200
$250
$300FY
199
6
FY 1
997
FY 1
998
FY 1
999
FY 2
000
FY 2
001
FY 2
002
FY 2
003
FY 2
004
FY 2
005
FY 2
006
FY 2
007
FY 2
008
FY 2
009
FY 2
010
Mill
ions Need-Based Merit-Based
Note: Excludes federally-funded programs

PUBLIC UNIVERSITY DATA

House Fiscal Agency: January 2010 24
Key Data Definitions Pursuant to budget bill language, the 15 state universities annually submit
enrollment, finance, and other institutional data to the state’s Higher Education Institutional Data Inventory (HEIDI).
Enrollment definitions:
– Student Headcount: Number of individual students enrolled for at least one class at a university.
– Fiscal Year Equated Students (FYES): Calculated equivalent of the number of full-time students enrolled at a university.
Finance definitions:
– Current Fund: All revenue/expenditures for current operations― including auxiliary operations, such as hospitals and dormitories, and operations funded from restricted sources, such as research.
– General Fund: Subset of current fund revenue/expenditures for instruction and related activities; vast majority of revenue consists of state appropriations and student tuition/fees.

House Fiscal Agency: January 2010 25
FY 2008-09 Public University Enrollments
0
10,000
20,000
30,000
40,000
50,000
CMU EMU FSU GVSU LSSU MSU MTU NMU OU SVSU UM UMD UMF WSU WMU
Headcount FYES

House Fiscal Agency: January 2010 26
Public University Enrollment History
0
25,000
50,000
75,000
100,000
125,000
150,000
175,000
200,000FY
77
FY79
FY81
FY83
FY85
FY87
FY89
FY91
FY93
FY95
FY97
FY99
FY01
FY03
FY05
FY07
FY09
Undergraduate FYES
Graduate FYES

House Fiscal Agency: January 2010 27
University Enrollment GrowthFY 2000-01 to FY 2008-09
(20.0)
(10.0)
0.0
10.0
20.0
30.0
40.0
50.0
LSSU
WM
U
EMU
UM
D
CM
U
WSU
MSU
UM
A
MTU
NM
U
UM
F
SVSU O
U
FSU
GVS
U
% C
hang
e
Note: Changes based on total Fiscal Year Equated Students (FYES)

House Fiscal Agency: January 2010 28
Public University General Fund Revenue
Tuition and Fees $3,126,938,367
63.1%
State Appropriations$1,466,971,589
29.6%
Other$363,265,842
7.3%
FY 2008-09 Total = $5.0 Billion

House Fiscal Agency: January 2010 29
Public University General Fund Revenue Source History
% o
f Tot
al G
F R
even
ue
0%
10%
20%
30%
40%
50%
60%
70%FY
77
FY79
FY81
FY83
FY85
FY87
FY89
FY91
FY93
FY95
FY97
FY99
FY01
FY03
FY05
FY07
FY09
Other
State Appropriations
Tuition and Fees

House Fiscal Agency: January 2010 30
State University General FundRevenue per FYES: FY 2007-08
$0
$5,000
$10,000
$15,000
$20,000
$25,000
$30,000
$35,000
CMU EMU FSU GVSU LSSU MSU MTU NMU OU SVSU UM UMD UMF WSU WMU
State Appropropriation Tuition Other

House Fiscal Agency: January 2010 31
Average Resident UndergraduateTuition and Fee Rate
$2,2
88
$2,4
34
$2,6
78
$2,9
65
$3,2
46
$3,4
64
$3,6
15
$3,7
43
$3,9
19
$4,1
17
$4,2
60
$4,4
47
$4,9
45
$5,3
88
$5,9
73
$6,1
48
$6,8
99
$7,3
95
$8,1
06
$8,7
53
$9,3
11
FY90
FY91
FY92
FY93
FY94
FY95
FY96
FY97
FY98
FY99
FY00
FY01
FY02
FY03
FY04
FY05
FY06
FY07
FY08
FY09
FY10

House Fiscal Agency: January 2010 32
Tuition Rates and State Funding
-10%
-5%
0%
5%
10%
15%
FY91
FY92
FY93
FY94
FY95
FY96
FY97
FY98
FY99
FY00
FY01
FY02
FY03
FY04
FY05
FY06
FY07
FY08
FY09
FY10
% C
hang
e Fr
om P
rior Y
ear
Avg. Resident Undergrad. Tuition/Fee Rate
State Funding/FYES
Based onFY 2008-09
FYES

House Fiscal Agency: January 2010 33
Public University General Fund Expenditures
Transfers$358,468,190
7.2%
Aux Enterprises$34,945,130
0.7%
Financial Aid$456,275,606
9.1%
Plant Op and Maintenance$561,846,928
11.2%
Institution Support$493,783,198
9.9%Student Service
$231,129,522 4.6%
Public Service$45,044,529
0.9%
Research$222,358,848
4.4%
Instruction$1,989,861,196
39.7%
Academic Support$619,242,500
12.4%
FY 2008-09 Total = $5.0 Billion

House Fiscal Agency: January 2010 34
Total Public University General Fund Expenditures per FYES
$0
$5,000
$10,000
$15,000
$20,000FY
90
FY91
FY92
FY93
FY94
FY95
FY96
FY97
FY98
FY99
FY00
FY01
FY02
FY03
FY04
FY05
FY06
FY07
FY08
FY09
Expe
nditu
res/
FYES
Nominal Expends/FYES Adjusted for US CPI Adjusted for Higher Ed Price Index
House Fiscal Agency: January 2010 35
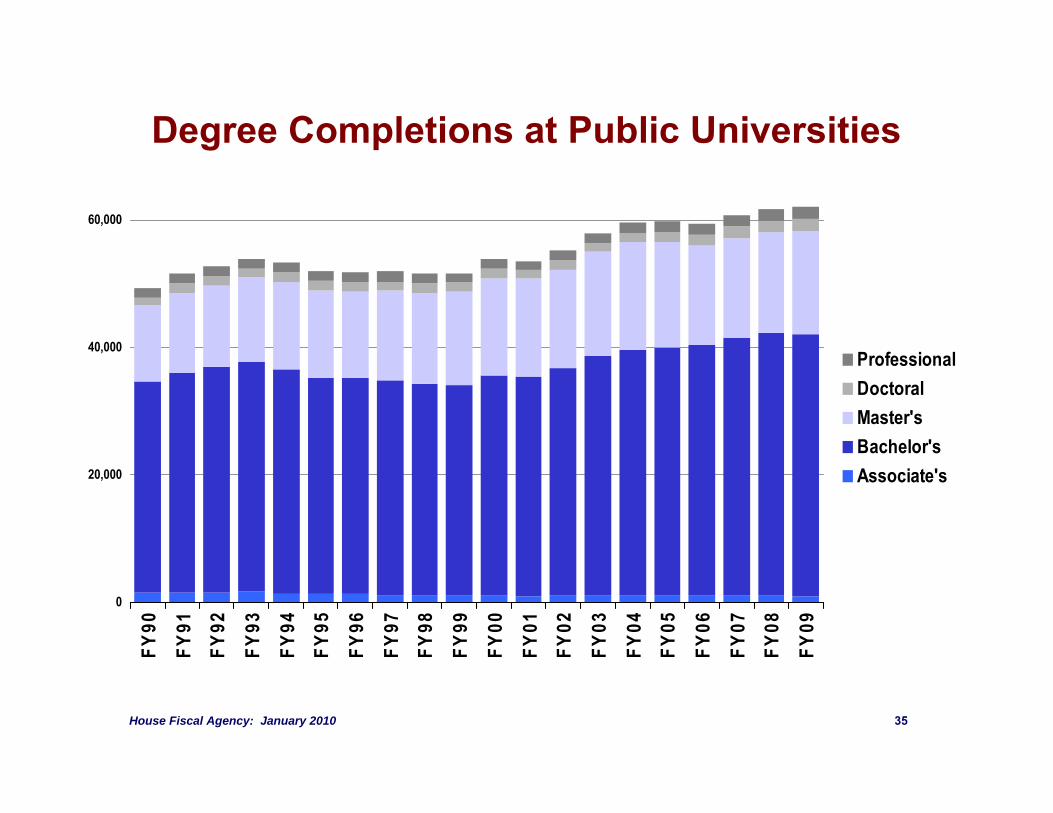
Degree Completions at Public Universities
0
20,000
40,000
60,000
FY90
FY91
FY92
FY93
FY94
FY95
FY96
FY97
FY98
FY99
FY00
FY01
FY02
FY03
FY04
FY05
FY06
FY07
FY08
FY09
ProfessionalDoctoralMaster'sBachelor'sAssociate's

House Fiscal Agency: January 2010 36
Additional Background Information
Available at http://www.house.mi.gov/hfa/highed.asp:
State Financial Aid Funding for Postsecondary Education (September 2008)
State University Appropriations (November 2006)
Degree Completions at State Universities (May 2006)
Net Tuition Costs After Financial Aid at State Universities (November 2004)

For more information about the Higher Education budget, contact:
Kyle I. [email protected]
(517) 373-8080