hera s.p.a. holding energia risorse ambiente sede: viale c...
TRANSCRIPT
HERA S.p.A. Holding Energia Risorse Ambiente Sede: Viale C. Berti Pichat 2/4 40127 Bologna tel. 051.287111 fax 051.2814036 www.gruppohera.it
Group Consolidated
Quarterly report as at 30 september 2007
1 – Hera Group 001
1.01 Hera’s mission 002 1.02 Summary results 003 1.03 Company officers 004 1.04 Strategy and the new industrial plan 005 1.05 Business sectors 010 1.06 Hera’s performance on the stock echange 014
2. Directors’ Report of the Hera Group 019
2.01 Financial and economic results 020 2.02 Hera Group Investments 024 2.03 Analysis by business area 028
2.03.1 Gas 030 2.03.2 Electricity 032 2.03.3 Integrated Water Cycle 034 2.03.4 Waste 036 2.03.5 Other Services 038
2.04 Human Resources 040
3. Hera Group Consolidated Financial Statements 042
3.01 Reclassified consolidated income statement 043 3.02 Income statement with related parties Consob resolution no.15519 of 27 July 2006 000 3.03 Consolidated net financial position 045 3.04 Content and form of the accounting statements 046 3.05 Accounting standards and policies 047 3.06 List of companies 064
Hera Group as at 30 September 2007
1
1 – THE HERA GROUP
The Hera Group as at 30.09.2007
2
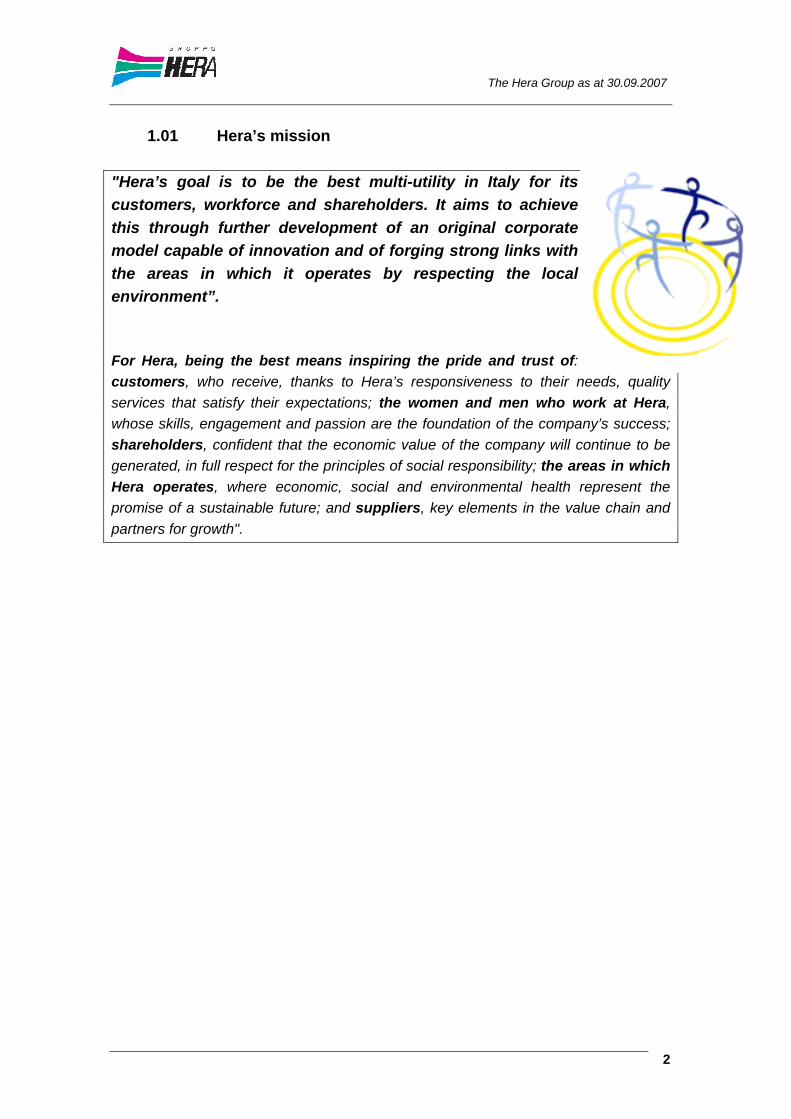
1.01 Hera’s mission
"Hera’s goal is to be the best multi-utility in Italy for its customers, workforce and shareholders. It aims to achieve this through further development of an original corporate model capable of innovation and of forging strong links with the areas in which it operates by respecting the local environment”. For Hera, being the best means inspiring the pride and trust of: customers, who receive, thanks to Hera’s responsiveness to their needs, quality services that satisfy their expectations; the women and men who work at Hera, whose skills, engagement and passion are the foundation of the company’s success; shareholders, confident that the economic value of the company will continue to be generated, in full respect for the principles of social responsibility; the areas in which Hera operates, where economic, social and environmental health represent the promise of a sustainable future; and suppliers, key elements in the value chain and partners for growth".
The Hera Group as at 30.09.2007
3
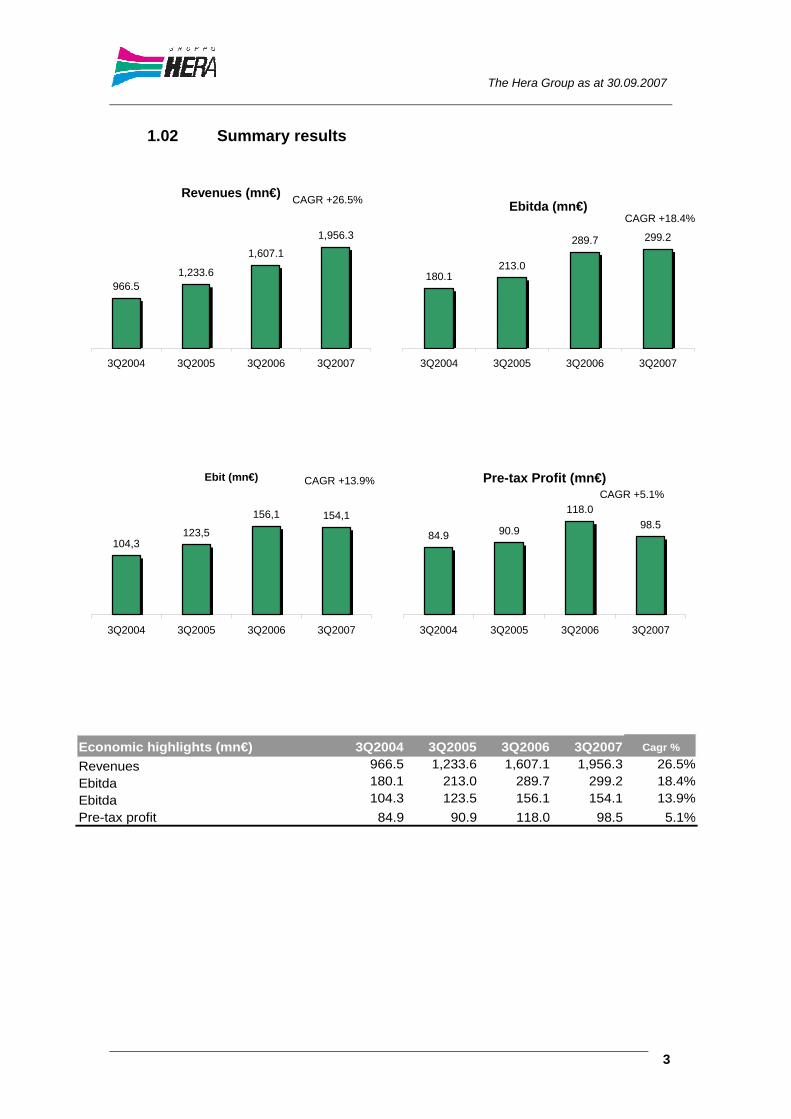
1.02 Summary results
Revenues (mn€)
966.51,233.6
1,607.1
1,956.3
3Q2004 3Q2005 3Q2006 3Q2007
CAGR +26.5% Ebitda (mn€)
180.1213.0
289.7 299.2
3Q2004 3Q2005 3Q2006 3Q2007
CAGR +18.4%
Ebit (mn€)
104,3123,5
156,1 154,1
3Q2004 3Q2005 3Q2006 3Q2007
CAGR +13.9% Pre-tax Profit (mn€)
84.9 90.9
118.098.5
3Q2004 3Q2005 3Q2006 3Q2007
CAGR +5.1%
Economic highlights (mn€) 3Q2004 3Q2005 3Q2006 3Q2007 Cagr %
Revenues 966.5 1,233.6 1,607.1 1,956.3 26.5%Ebitda 180.1 213.0 289.7 299.2 18.4%Ebitda 104.3 123.5 156.1 154.1 13.9%Pre-tax profit 84.9 90.9 118.0 98.5 5.1%
The Hera Group as at 30.09.2007
4
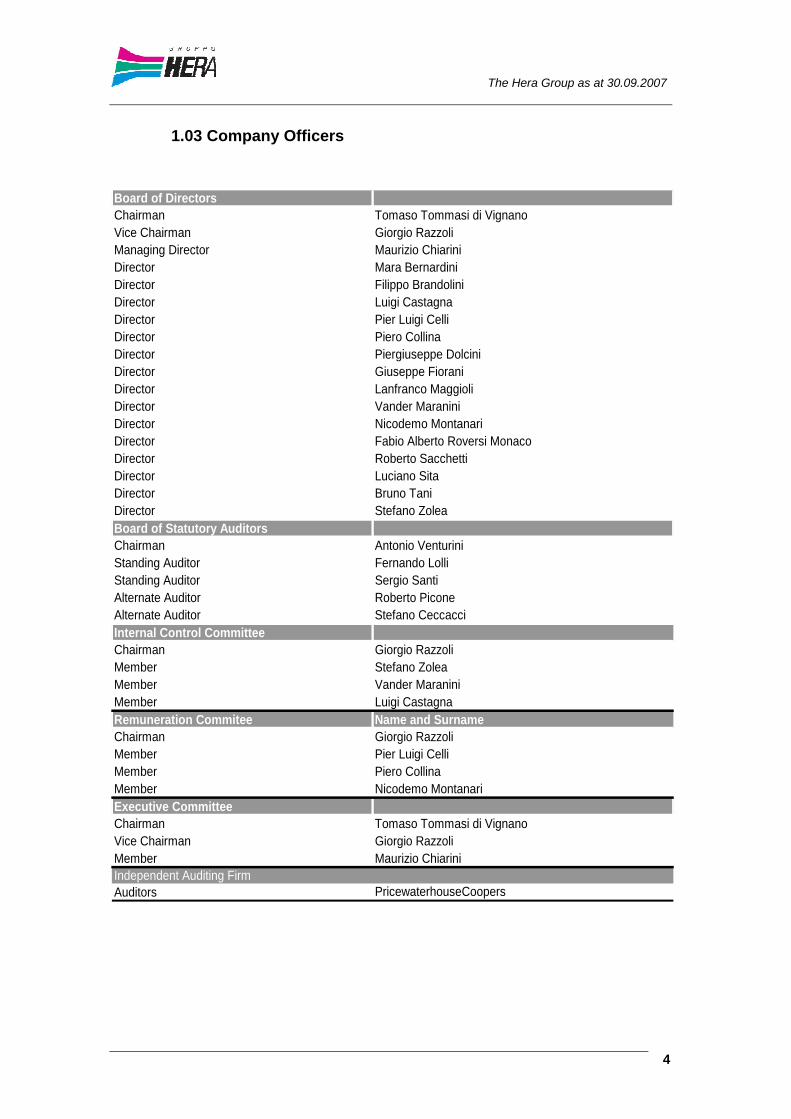
1.03 Company Officers
Board of DirectorsChairman Tomaso Tommasi di VignanoVice Chairman Giorgio RazzoliManaging Director Maurizio ChiariniDirector Mara BernardiniDirector Filippo BrandoliniDirector Luigi CastagnaDirector Pier Luigi CelliDirector Piero CollinaDirector Piergiuseppe DolciniDirector Giuseppe FioraniDirector Lanfranco MaggioliDirector Vander MaraniniDirector Nicodemo MontanariDirector Fabio Alberto Roversi MonacoDirector Roberto SacchettiDirector Luciano SitaDirector Bruno TaniDirector Stefano ZoleaBoard of Statutory AuditorsChairman Antonio VenturiniStanding Auditor Fernando LolliStanding Auditor Sergio SantiAlternate Auditor Roberto PiconeAlternate Auditor Stefano CeccacciInternal Control CommitteeChairman Giorgio RazzoliMember Stefano ZoleaMember Vander MaraniniMember Luigi CastagnaRemuneration Commitee Name and SurnameChairman Giorgio RazzoliMember Pier Luigi CelliMember Piero CollinaMember Nicodemo MontanariExecutive CommitteeChairman Tomaso Tommasi di VignanoVice Chairman Giorgio RazzoliMember Maurizio ChiariniIndependent Auditing FirmAuditors PricewaterhouseCoopers

The Hera Group as at 30.09.2007
5
1.04 Strategy and new industrial plan
Consolidation of the Italian multi-utility sector In 2007, in the Italian local multi-utility sector, the pace of consolidation among operators increased as a result of their intention to become larger in size and hence manage to effectively compete in an energy sector dominated by large-scale national and international players. The ongoing consolidation process is supported by renewed attention by the Italian government which, however, has yet to introduce significant incentives to foster aggregation between operators. As far as this process is concerned, the protracted negotiations for the merger of Aem Milano and Asm Brescia, which had been formally announced by the financial community on 6 June 2007 and approved by the Board of Directors of the two former municipal enterprises on 25 June, were concluded in the first nine months of 2007. In the context of the consolidation process taking place among Italian utilities, Hera appears to be one of the most active players. Since it was established in 2002, Hera has always based its Group strategy on increasing in size to strengthen its competitive positions in all of its key businesses. This strategy has been followed by seizing further opportunities for expansion, primarily represented by multi-utility companies located in the neighbouring areas (an important aspect to guarantee the creation of further operating efficiencies). These companies have been integrated into the Group according to the “total” merger model (merger and reorganisation of operations), capable of exploiting economies of scale and reaching increased levels of operating efficiency. The success of this strategy is evident from Hera’s figures highlighting a doubling of the Ebidta in the last four years, and from the significant number of further mergers with multi-utility companies (besides the business combination of 11 companies which gave rise to the Hera Group in 2002).
*Hera holds a 49.7% equity investment in Aspes Multiservizi SpA, included in the scope of consolidation. ** Megas Trade, whose business name was later changed to HeraComm Marche, was transferred to Hera following the merger of Urbino-based Megas and Pesaro-based Aspes. *** The merger by incorporation of SAT, a company operating in the province of Modena, was resolved by the Extraordinary Shareholders’ Meeting of 16 October 2007.
2002 2003 2004 2005 2006 2007Seabo, Area, Unica, Amia, Amir, Taularia,
Asc, Amf, Sis and Team
Geat Agea Meta Geat Gas, SAT (46.5%), Aspes*, Enel (network in the province
of Modena)
Megas Trade**, SAT*** (100%)
The Hera Group as at 30.09.2007
6
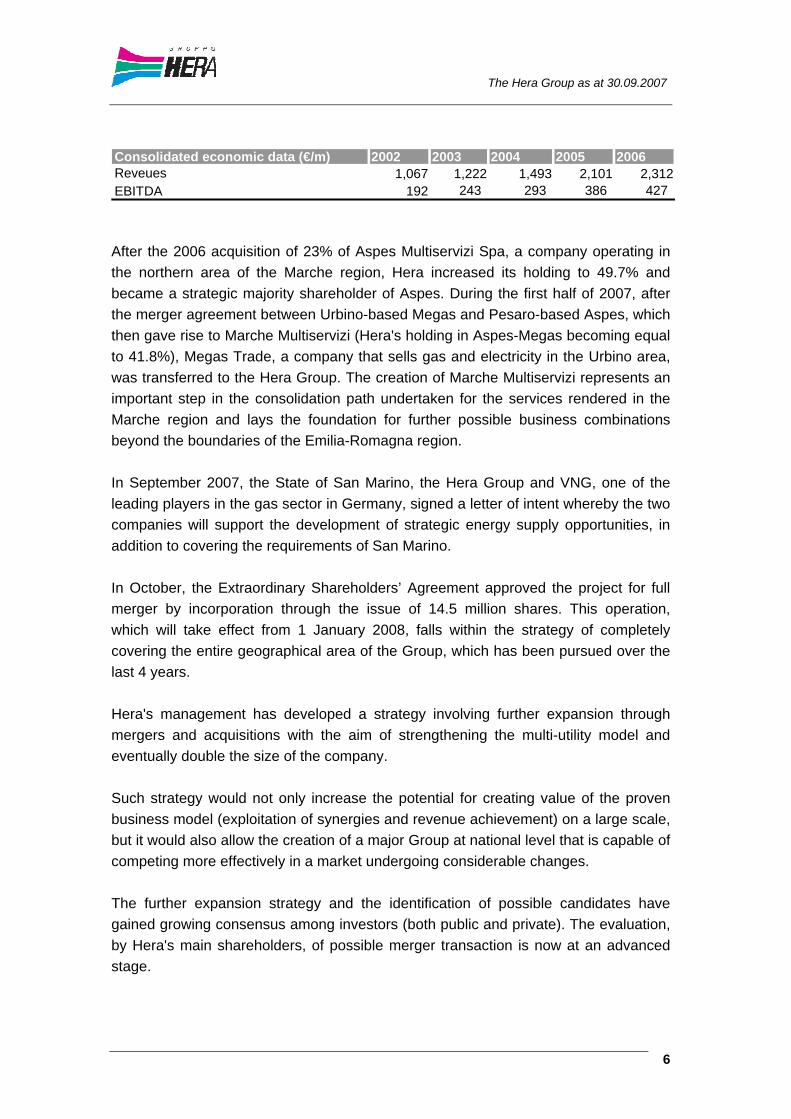
Consolidated economic data (€/m) 2002 2003 2004 2005 2006Reveues 1,067 1,222 1,493 2,101 2,312 EBITDA 192 243 293 386 427 After the 2006 acquisition of 23% of Aspes Multiservizi Spa, a company operating in the northern area of the Marche region, Hera increased its holding to 49.7% and became a strategic majority shareholder of Aspes. During the first half of 2007, after the merger agreement between Urbino-based Megas and Pesaro-based Aspes, which then gave rise to Marche Multiservizi (Hera's holding in Aspes-Megas becoming equal to 41.8%), Megas Trade, a company that sells gas and electricity in the Urbino area, was transferred to the Hera Group. The creation of Marche Multiservizi represents an important step in the consolidation path undertaken for the services rendered in the Marche region and lays the foundation for further possible business combinations beyond the boundaries of the Emilia-Romagna region. In September 2007, the State of San Marino, the Hera Group and VNG, one of the leading players in the gas sector in Germany, signed a letter of intent whereby the two companies will support the development of strategic energy supply opportunities, in addition to covering the requirements of San Marino. In October, the Extraordinary Shareholders’ Agreement approved the project for full merger by incorporation through the issue of 14.5 million shares. This operation, which will take effect from 1 January 2008, falls within the strategy of completely covering the entire geographical area of the Group, which has been pursued over the last 4 years. Hera's management has developed a strategy involving further expansion through mergers and acquisitions with the aim of strengthening the multi-utility model and eventually double the size of the company. Such strategy would not only increase the potential for creating value of the proven business model (exploitation of synergies and revenue achievement) on a large scale, but it would also allow the creation of a major Group at national level that is capable of competing more effectively in a market undergoing considerable changes. The further expansion strategy and the identification of possible candidates have gained growing consensus among investors (both public and private). The evaluation, by Hera's main shareholders, of possible merger transaction is now at an advanced stage.
The Hera Group as at 30.09.2007
7
Strengthening of the core businesses of energy and waste Over the last four years, further M&A transactions were carried out on single-business companies which permitted a significant enhancement of the Group’s market positions with regards to waste management and energy services. With a view to strengthening the Group’s competitive edge in its core businesses, Hera continues to follow a strategy of “upstream integration” of its gas and electricity sales and distribution businesses, as well as its special waste treatment business. All of the energy resources procurement activities are managed by Hera Trading Srl, a company specialised in optimising the purchases of methane gas and electricity. Thus, Hera has developed strategic and organisational initiatives which provide the Group with the opportunity to maximise its level of competitiveness and profitability in energy businesses undergoing progressive liberalisation. As regards “upstream integration” in the gas business, the Group has further diversified the procurement of methane gas, increasing its international shipping capacity with imports totalling 780 million cubic metres, also due to important supply contracts subscribed with the VNG Group (one of the leading German companies selling methane gas). In 2006, Hera and the VNG Group signed a strategic agreement for the sale of gas in Europe and for the expansion of research and development activities. The expansion and rationalisation of the sale and distribution of gas were pursued through the acquisition of small to medium-sized companies operating in the Group’s market, where the Group has reached over 90% penetration.
Hera is the first Italian multi-utility company to acquire a joint venture interest (9%) with other international operators in a company (Galsi) set up for the construction of a gas pipeline. Hera's participation in the project allowed the Group to secure a 15-year term contract for the import of 1 billion cubic metres of gas directly from Algeria as soon as the gas pipeline comes on stream.
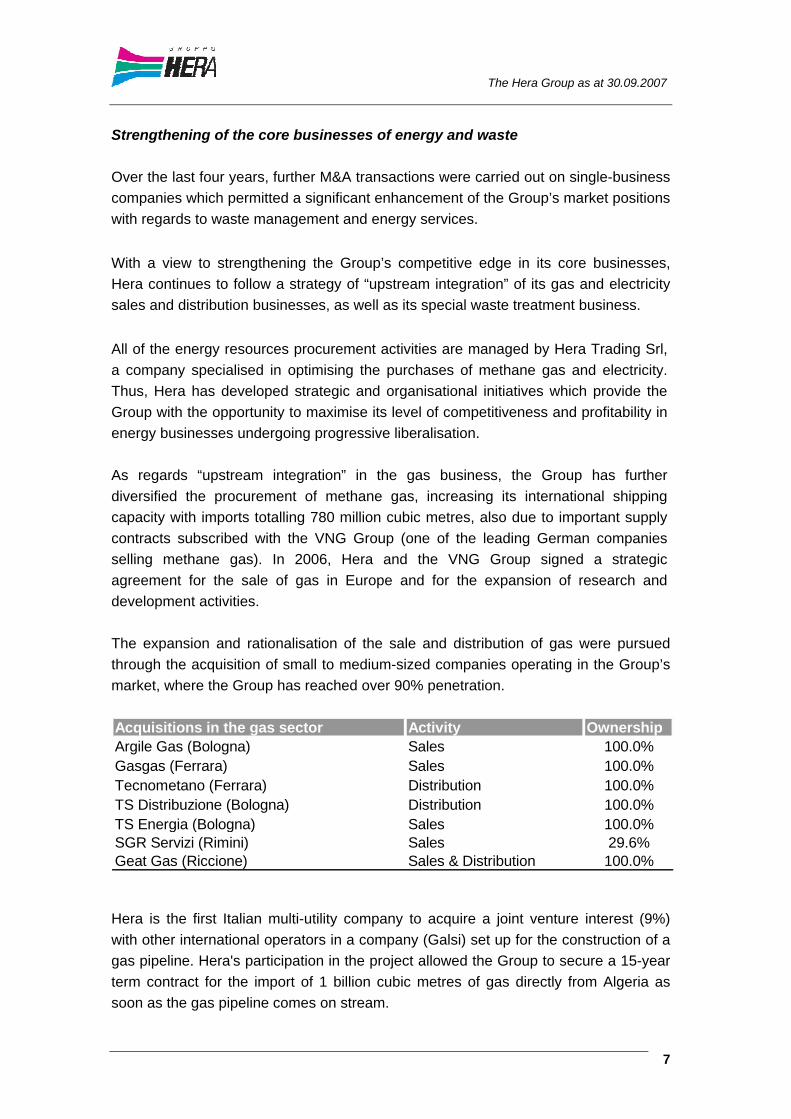
Acquisitions in the gas sector Activity OwnershipArgile Gas (Bologna) Sales 100.0%Gasgas (Ferrara) Sales 100.0%Tecnometano (Ferrara) Distribution 100.0%TS Distribuzione (Bologna) Distribution 100.0%TS Energia (Bologna) Sales 100.0%SGR Servizi (Rimini) Sales 29.6%Geat Gas (Riccione) Sales & Distribution 100.0%
The Hera Group as at 30.09.2007
8
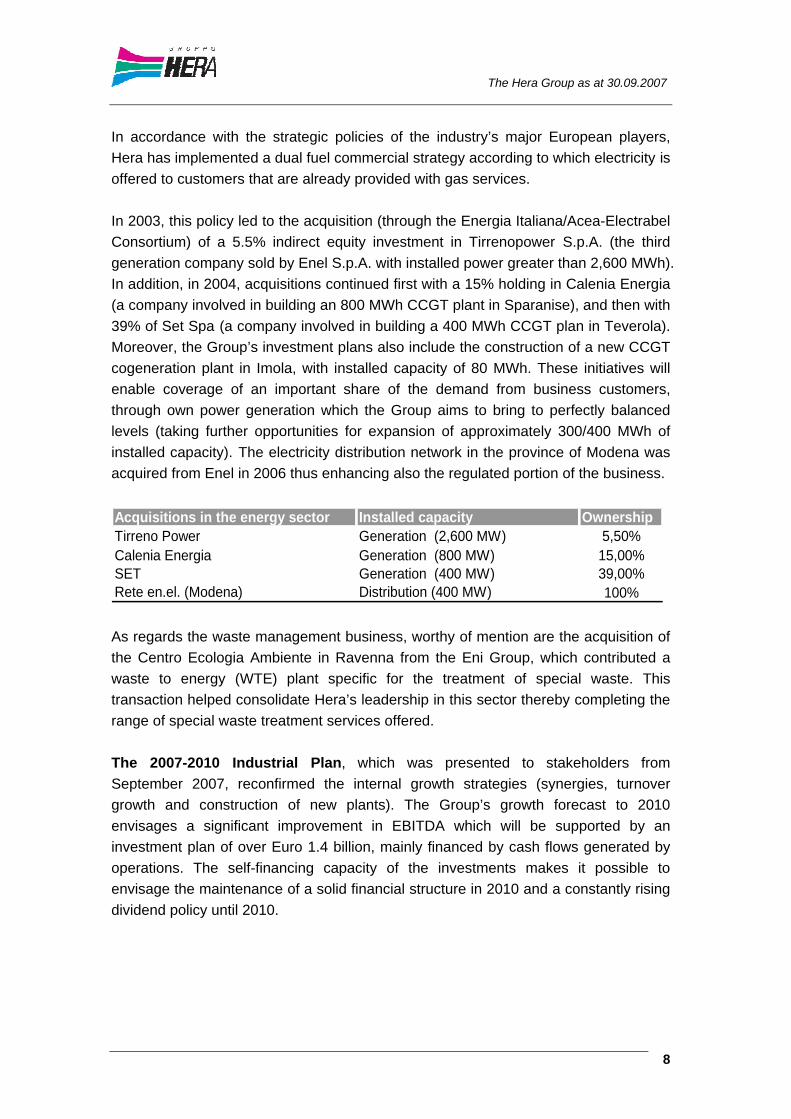
In accordance with the strategic policies of the industry’s major European players, Hera has implemented a dual fuel commercial strategy according to which electricity is offered to customers that are already provided with gas services. In 2003, this policy led to the acquisition (through the Energia Italiana/Acea-Electrabel Consortium) of a 5.5% indirect equity investment in Tirrenopower S.p.A. (the third generation company sold by Enel S.p.A. with installed power greater than 2,600 MWh). In addition, in 2004, acquisitions continued first with a 15% holding in Calenia Energia (a company involved in building an 800 MWh CCGT plant in Sparanise), and then with 39% of Set Spa (a company involved in building a 400 MWh CCGT plan in Teverola). Moreover, the Group’s investment plans also include the construction of a new CCGT cogeneration plant in Imola, with installed capacity of 80 MWh. These initiatives will enable coverage of an important share of the demand from business customers, through own power generation which the Group aims to bring to perfectly balanced levels (taking further opportunities for expansion of approximately 300/400 MWh of installed capacity). The electricity distribution network in the province of Modena was acquired from Enel in 2006 thus enhancing also the regulated portion of the business. Acquisitions in the energy sector Installed capacity OwnershipTirreno Power Generation (2,600 MW) 5,50%Calenia Energia Generation (800 MW) 15,00%SET Generation (400 MW) 39,00%Rete en.el. (Modena) Distribution (400 MW) 100% As regards the waste management business, worthy of mention are the acquisition of the Centro Ecologia Ambiente in Ravenna from the Eni Group, which contributed a waste to energy (WTE) plant specific for the treatment of special waste. This transaction helped consolidate Hera’s leadership in this sector thereby completing the range of special waste treatment services offered. The 2007-2010 Industrial Plan, which was presented to stakeholders from September 2007, reconfirmed the internal growth strategies (synergies, turnover growth and construction of new plants). The Group’s growth forecast to 2010 envisages a significant improvement in EBITDA which will be supported by an investment plan of over Euro 1.4 billion, mainly financed by cash flows generated by operations. The self-financing capacity of the investments makes it possible to envisage the maintenance of a solid financial structure in 2010 and a constantly rising dividend policy until 2010.
The Hera Group as at 30.09.2007
9
Sustainability in Hera: the new Code of Ethics In companies which provide public utilities, such as the Hera Group, the presence and implementation of a Code of Ethics is of particular importance, both due to the nature of the business carried out and the recent history of these companies, as well as the transformation which these companies have undergone, and which is still in progress. On 12 September 2007, the Board of Directors of Hera Spa approved the new Code of Ethics of the Hera Group, which represents the result of extensive work coordinated by the Corporate Social Responsibility Department. This work began in September 2006, following the revision of Hera’s corporate mission, charter of values and operational principles, which involved the main organisational units of the entire Group, and several categories of stakeholders such as employees, suppliers and shareholders. The new Code is a further step forward in the Group’s commitment to corporate social responsibility as a valid tool for increasing the company’s competitive edge, and a key element for achieving sustainable development. In order to guarantee the dissemination and implementation of the Code, on 8 October 2007 the Hera Spa Board of Directors appointed an Ethics Committee. The corporate Code of Ethics is also an integral part of the organisational model pursuant to Legislative Decree 231/01.
The Hera Group as at 30.09.2007
10
1.05 Business Sectors
The Hera Group is active in over 180 municipalities in the seven provinces of Bologna, Rimini, Ravenna, Forlì - Cesena, Imola-Faenza, Ferrara and Modena, serving an area which covers approximately 70% of Emilia Romagna (a region with a GDP and per-capita consumption rates among the highest in Europe) and the northern part of the Marche region (through Marche Multiservizi). The Group’s multi-business portfolio is equally balanced between services managed under "monopoly regimes" such as the integrated water cycle, the collection and disposal of municipal waste, the distribution of methane gas and electricity, the management of district heating and services managed under "free competition" conditions such as the supply of methane gas and electricity, the disposal of special and industrial waste and the management of public lighting. The complementary nature of these activities (given the market opportunities pursued with "multi-service" commercial proposals) favours the expansion of turnover and the creation of cost synergies and achievement of higher levels of efficiency. Municipal waste In an Italian context characterised by a considerable dearth of infrastructures in this sector, the Hera Group constitutes an outstanding example with one of the nation’s most impressive plant structures comprising 72 plants as of 31 December 2006, capable of covering the full range of possible treatments and exploitation of waste, as illustrated in the table below. The urban hygiene service is managed in 7 ATOs (corresponding to the Provinces of the Emilia Romagna and Marche regions in which the Group operates), on the basis of long-term concessions (2011), covering a population in excess of 2.5 million inhabitants. This service handles the collection and disposal of approximately 1.7 million tonnes of municipal waste per year. Hera is also a leading Italian operator in the recovery of electricity and thermal energy from waste due to 7 waste-to-energy plants with a total treatment capacity equal to approximately 610,000 tonnes per annum and an installed electricity generation capacity equal to 57MW. In the 2007-2010 period, the Group intends to increase the recovery of energy from waste, further reducing the environmental impact of the service managed through the use of landfills. The three-year plan in fact envisages an increase in capacity for the current 4 WTE plants and the replacement of an old plant so as to bring the overall incineration capacity to 1 million tonnes (the present capacity being approximately 0.6 million tonnes per annum) and the electricity generation capacity to well over 100
The Hera Group as at 30.09.2007
11
MWh (the present capacity being approximately 56 MWh). All the plant development projects have already obtained the necessary permits and the construction sites have been started up. The Group also plans to develop other types of plants as well as test new and exclusive technologies to capture CO2 and employ it to produce biogases. Special waste In this sector too, the country’s supply of waste treatment services is unable to meet domestic demand owing to a shortage of infrastructures which forces many Italian manufacturers to dispose of their waste abroad, hence incurring huge transportation costs. The Hera Group is the leading operator with regards to the treatment and disposal of special waste with a treatment capacity equal to 2.3 million tonnes/year owing to one of the nation’s largest plant infrastructures, which includes 31 specifically dedicated plants and 28 mixed-usage plants (both special and municipal waste). The 2007-2010 plan envisages to increase the exploitation of plant capacities thanks to the positive evolution experienced by the market in the last few years. According to the Plan the results of the business area are expected to improve significantly as a result of the development of a "full service" commercial range of services for business customers (integrated services of industrial waste treatment and disposal services as well as the gradual reclamation of industrial sites) and the progressive adjustment of the regulated tariffs to the legal provisions which discipline municipal waste collection, transportation and disposal services. Integrated Water Cycle The Hera Group is one of the three leading Italian operators that provide water collection, treatment, adduction, distribution, waste water collection and water purification services ("integrated water cycle"). The service is performed on the basis of concessions with average expiry in 2022 in 7 ATOs (corresponding to the provinces of the Emilia-Romagna and Marche regions in which the Group operates), which include over 180 municipalities. Each year approximately 240 million cubic metres of drinking water are supplied for domestic and industrial use. The Group avails of an extensive and efficient water system as well as of purification plants serving the population in the area covered. The rationalisation, efficiency-increasing and tariff adjustment activities (in line with legal requirements) remain the key points of the 2007-2010 Industrial Plan, which envisages a significant improvement in the results of the business area and a challenging plant expansion and modernisation program.
The Hera Group as at 30.09.2007
12
Energy Taking into consideration the Modena merger, the Hera Group is Italy’s third-largest operator in the sale and distribution of gas (with approximately 2.4 million cubic metres sold per year to approximately 960,000 customers, served through 11,500 km of network). In the sale and distribution of electricity, mainly due to the integration of the Modena area, the Hera Group now ranks among the top Italian operators with over 5,500 km of distribution network, 3.1 TWH sold in 2006 and over 260,000 customers. The sale of gas and electricity is an activity that was liberalised on 1 July 2007, while distribution is still managed under a monopoly regime based on long-term concessions (those relating to methane gas expiring in 2010 and those relating to electricity in 2030). The Hera Group has successfully dealt with the greater competitive pressure in the sale of energy products, by implementing a dual fuel commercial strategy and by strengthening customer care for domestic customers, thus making it possible to withstand competition in gas sales and to increase electricity sales. In light of the positive results in the electricity sales market, Hera has implemented a plan for expansion of its electricity generating capacity (primarily achieved through industrial partnerships in which Hera has acquired minority interests) and has stipulated long-term contracts with both national and foreign suppliers. The new 2007-2010 Industrial Plan highlights that the results from the sale of gas are expected to remain substantially unchanged and envisages a considerable improvement in the electricity market by offering the service in question to customers that are currently supplied with gas services (“dual fuel” offer). Furthermore, the upstream integration strategy is expected to continue both with regards to electricity generation through the development of plants and the further diversification in methane gas supplies.
The Hera Group as at 30.09.2007
13
Other Businesses Further to the considerable rationalisation of the activities of the companies within the Hera Group, the "other complementary businesses" have been reorganised and provided with integrated management. Within this context, particularly important are the District Heating activities, in which Hera takes a leading role in Italy, and those relating to Public Lighting, in which Hera ranks second on the domestic market. The Group effectively provided approximately 425 GWh in 2006 and managed over 310,000 light points within the area in which it operates: the development plans envisage the significant expansion of both these activities through investments and processes to heighten efficiency. The 2007-2010 Industrial Plan envisages growing results from further rationalisation and increased efficiency of the activities, as well as from the development of district heating plants.
The Hera Group as at 30.09.2007
14
1.06 Hera’s performance on the Stock Exchange
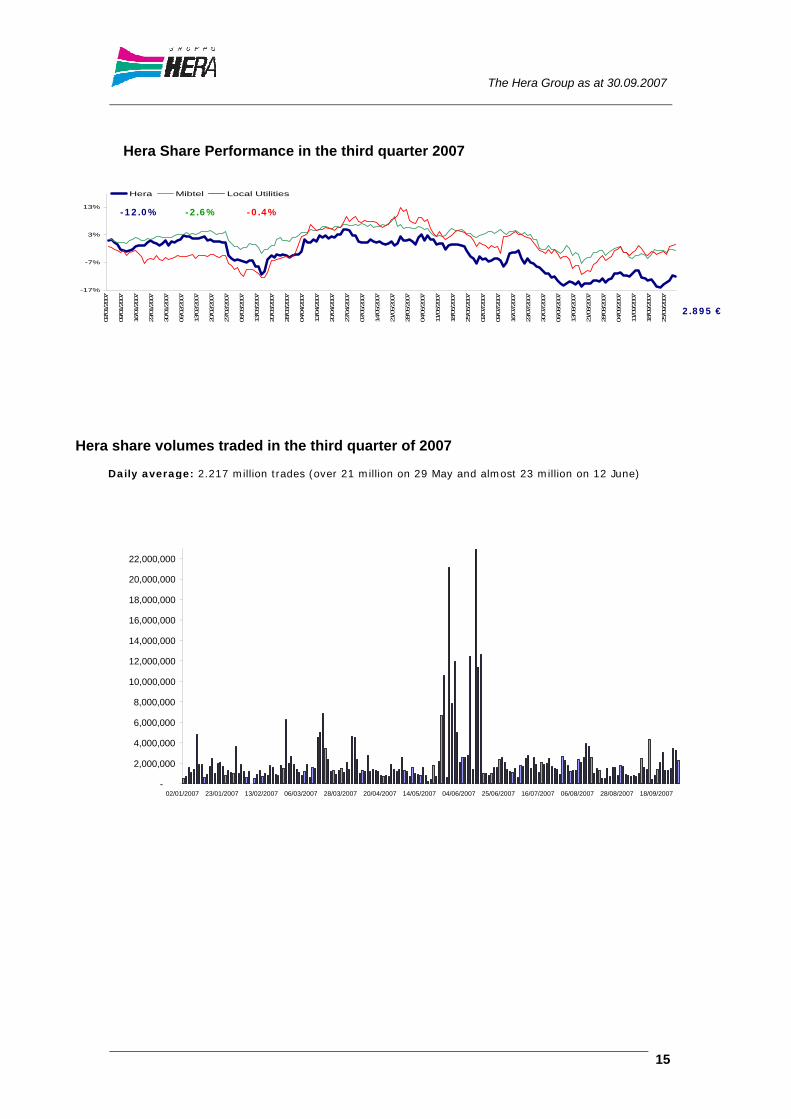
In the first part of 2007 the financial markets highlighted volatile trends influenced by the protracted historical upward trend, concern about increases in inflation, interest rates and oil prices that reached their all time high. In February, significant downward adjustments in European stock exchange lists coincided with a particularly negative performance by the Asian markets (Shanghai Stock Exchange), also due to the decline in durable goods (which affected the New York Stock Exchange) which, however, was offset in the following months. Further negative trends in worldwide stock exchange lists occurred in June as a result of the interest rate increase and, again, at the end of July, due to the concern about US sub-prime mortgages. Only in the last few days of September did the market demonstrate new interest in utility sector securities. In this scenario, the trend registered by Hera's shares was in line with the market phenomena highlighted above, though its price remained close to Euro 3.15 throughout most of the year, also thanks to its fast improving results (despite the negative impact of the weather conditions of last winter) and the key role assigned to the Group in the consolidation process that the sector is currently undergoing. During the period prior to the publication of the new Industrial Plan 2007-2010, and the definition of the next significant merger, during the quarter, the share recorded a negative trend, bringing the average value to approximately Euro 2.90 at the end of September. The share closed the first nine months of the year with a downward trend compared to the beginning of the year (-12.0%). It’s performance during the period increased its distance from other sector securities and the values estimated by analysts. However, in October, the share regained stable levels of around Euro 3.10.
The Hera Group as at 30.09.2007
15
Hera Share Performance in the third quarter 2007
-17%
-7%
3%
13%
02/01/20
07
09/01/20
07
16/01/20
07
23/01/20
07
30/01/20
07
06/02/20
07
13/02/20
07
20/02/20
07
27/02/20
07
06/03/20
07
13/03/20
07
20/03/20
07
28/03/20
07
04/04/20
07
13/04/20
07
20/04/20
07
27/04/20
07
07/05/20
07
14/05/20
07
21/05/20
07
28/05/20
07
04/06/20
07
11/06/20
07
18/06/20
07
25/06/20
07
02/07/20
07
09/07/20
07
16/07/20
07
23/07/20
07
30/07/20
07
06/08/20
07
13/08/20
07
21/08/20
07
28/08/20
07
04/09/20
07
11/09/20
07
18/09/20
07
25/09/20
07
Hera Mibtel Local Utilities
Hera share volumes traded in the third quarter of 2007
- 2,000,000
4,000,000
6,000,000
8,000,000
10,000,000
12,000,000
14,000,000
16,000,000
18,000,000
20,000,000
22,000,000
02/01/2007 23/01/2007 13/02/2007 06/03/2007 28/03/2007 20/04/2007 14/05/2007 04/06/2007 25/06/2007 16/07/2007 06/08/2007 28/08/2007 18/09/2007
Daily average: 2.217 million trades (over 21 million on 29 May and almost 23 million on 12 June)
-12.0% -2.6% -0.4%
2.895 €
The Hera Group as at 30.09.2007
16
The daily average counter-value of the first nine months of the year increased compared to the same period of the previous year, from Euro 5.8 million to approximately Euro 7 million, whilst the average daily trades remained substantially unchanged at 2.2 million shares (compared to 2.3 million shares in the first nine months of the previous year). Hera's shares are listed on the "Dow Jones Stoxx TMI" and "TMI Utility" indices, as well as on the "Axia Ethical Index" and "Kempen SNS Smaller Europe SRI Index" ethical indices.
Share coverage At present, 14 independent analysts regularly cover Hera Group's shares (and half of these analysts are international), namely: Axia (ethical analysis), Caboto, CAI Cheuvreux, Cazenove, CentroSim, Citigroup, Euromobiliare, Intermonte Securities, Kepler, Mediobanca, Merril Lynch, Rasbank and Studi investimenti. In July also Banca Leonardo started the coverage of Hera's shares by assigning a target price of Euro 3.5 (excluding the effects of a possible transaction of extraordinary finance) in line with analysts' consensus (of Euro 3.45 with 11 Buy/Outperform ratings). In September, Banca Leonardo named Hera as one of the five best picks, meaning one of the top investment opportunities. Hera was the only company named in the utility sector.
Some credit analysts (Banca IMI and UBS) have also maintained coverage since the issue of the Euro 500 million bond loan listed on the Luxembourg market in the first part of 2006.
On 17 May 2007 Hera finalised a Put-Bond worth Euro 100 million with Deutsche Bank AG London; this transaction is relatively new to its market of reference, and extremely competitive. On 2 August 2007, an agreement was signed with BNP Paribas London for a Euro 200 million Extendable Put-Bond, which was assigned an “A” rating by Standard&Poor’s.
Rating The Hera Group was assigned positive ratings by both Standard & Poor’s (A with a stable outlook) and by Moody’s (A1 with a stable outlook), evidence of the Group's solid financial standing and satisfactory profitability over the short and medium/long-term.

The Hera Group as at 30.09.2007
17
Shareholding Structure The share capital is represented by no. 1,016,752,029 ordinary shares with a par value of Euro 1 each; no share capital increase transactions were carried out during the year. At 30 September 2007, the Hera Group capitalised Euro 2.94 billion.
Hera SpA has a widespread shareholding structure with over 183 different public shareholders (mainly represented by municipalities in the Emilia Romagna region), which together hold around 58.4% of the share capital, around 300 Italian and international institutional investors and more than 26,000 private shareholders. The absence of a controlling shareholder in its structure (the largest shareholder is the municipality of Bologna with approximately 15%) is a feature which distinguishes Hera from the other local utility companies.
*equity investments included in "free float" ^ includes the investments of the municipalities of Emilia-Romagna and CON.AMI
Some international institutional investors (Lazard, Pictet and Schroders) hold a “significant” shareholding of approximately 2% of the share capital.
Hera has a treasury share repurchase program applicable to max. no. 15 million shares which was exercised while holding 1.17 million shares in the portfolio as at 30 September 2007. The Shareholders' Meeting of 26 April 2007 renewed the treasury share repurchase program increasing the overall number of shares allowed to be repurchased from Euro 45 million to Euro 60 million.
Prov. Bologna 20.5%
Prov. Modena 13.8%
Schroders ~2.0%*
Lazard ~ 2.0%*
Free float 41.6%
Province Romagna 21.3%
Prov. Ferrara 2.8%
Pictet ~2.0%*
The Hera Group as at 30.09.2007
18
Relations with the Financial Market The 2006 financial statements were approved and presented to the international financial community on 26 March 2007.
In April the Hera Group organised an international Road Show covering the main financial markets (London, Paris, Geneva, Zurich and New York), which involved the management in over 50 meetings with investors.
As the annual results were published, all the data relating to the 2006 financial year were made available on the website (www.gruppohera.it), in real time, upon approval by the Board of Directors, converted into interactive format; the data could also be downloaded in excel format by analysts.
On 14 May 2007 the results of the first quarter 2007 were approved and, at the same time, presented to the financial community during a conference call webcast on the Group's website.
Investor relations included several visits to the Hera Group by analysts and investors, both foreign and Italian, as well as the participation by management in a conference organised by brokers in foreign markets.
On 12 September 2007, the results of the first half of 2007 and the Industrial Plan 2007-2010 were approved: on the same day, both were presented to the financial community through a conference call webcast on the Group’s website. In October, a short road show was launched, which included a visit to the London Stock Exchange for a meeting of the top management with the Hera Group’s main institutional investors.
Hera's investor relations kept in close contact with institutional investors via the website which is increasingly considered as the backbone of Group's financial communication. The Investor Relations section, available on the website (www.gruppohera.it), has been regularly updated in real time and periodically changed so as to improve the availability of the information, dedicating specific sections to each of the main investor categories. On 5 November 2007, Hera’s website reached sixth place in “Webranking 2007”, by Hallvarsson & Hallvarson (up from eighth place last year), following Telecom Italia, Unicredit, Edison, Eni and Pirelli.
Hera Group – Directors’ Report as at 30 September 2007
20
2 – Directors’ Report of the Hera Group
Hera Group – Directors’ Report as at 30 September 2007
21
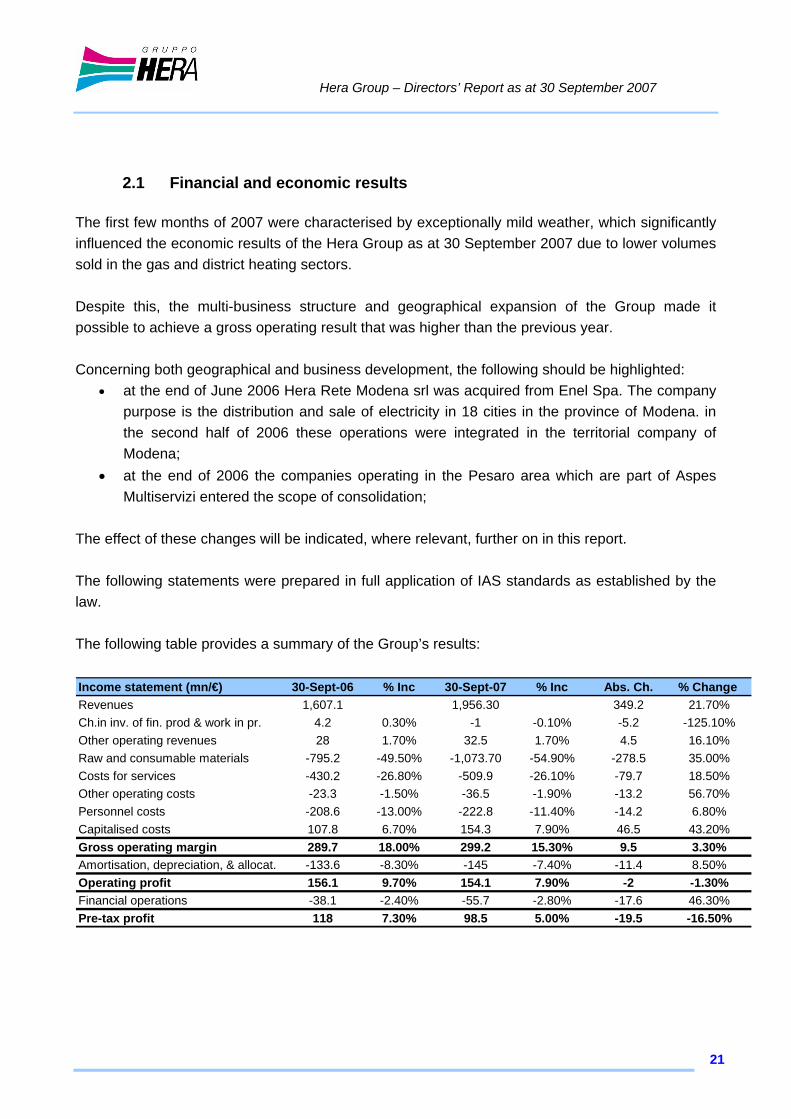
2.1 Financial and economic results The first few months of 2007 were characterised by exceptionally mild weather, which significantly influenced the economic results of the Hera Group as at 30 September 2007 due to lower volumes sold in the gas and district heating sectors. Despite this, the multi-business structure and geographical expansion of the Group made it possible to achieve a gross operating result that was higher than the previous year. Concerning both geographical and business development, the following should be highlighted:
• at the end of June 2006 Hera Rete Modena srl was acquired from Enel Spa. The company purpose is the distribution and sale of electricity in 18 cities in the province of Modena. in the second half of 2006 these operations were integrated in the territorial company of Modena;
• at the end of 2006 the companies operating in the Pesaro area which are part of Aspes Multiservizi entered the scope of consolidation;
The effect of these changes will be indicated, where relevant, further on in this report. The following statements were prepared in full application of IAS standards as established by the law. The following table provides a summary of the Group’s results: Income statement (mn/€) 30-Sept-06 % Inc 30-Sept-07 % Inc Abs. Ch. % Change Revenues 1,607.1 1,956.30 349.2 21.70%Ch.in inv. of fin. prod & work in pr. 4.2 0.30% -1 -0.10% -5.2 -125.10%Other operating revenues 28 1.70% 32.5 1.70% 4.5 16.10%Raw and consumable materials -795.2 -49.50% -1,073.70 -54.90% -278.5 35.00%Costs for services -430.2 -26.80% -509.9 -26.10% -79.7 18.50%Other operating costs -23.3 -1.50% -36.5 -1.90% -13.2 56.70%Personnel costs -208.6 -13.00% -222.8 -11.40% -14.2 6.80%Capitalised costs 107.8 6.70% 154.3 7.90% 46.5 43.20%Gross operating margin 289.7 18.00% 299.2 15.30% 9.5 3.30%Amortisation, depreciation, & allocat. -133.6 -8.30% -145 -7.40% -11.4 8.50%Operating profit 156.1 9.70% 154.1 7.90% -2 -1.30%Financial operations -38.1 -2.40% -55.7 -2.80% -17.6 46.30%Pre-tax profit 118 7.30% 98.5 5.00% -19.5 -16.50%
Hera Group – Directors’ Report as at 30 September 2007
22
As at 30 September 2007, revenues amounted to Euro 1,956.3 million compared to Euro 1,607.1 million in the same period of 2006, disclosing growth of 21.7%. The EBITDA rose from Euro 289.7 million in the first nine months of 2006 to Euro 299.2 million in the first nine months of 2007, an increase of 3.3%, and the EBIT decreased from Euro 156.1 million to Euro 154.1 million (-1.3%). Pre-tax profit decreased by 16.5%, passing from Euro 118.0 million in the first nine months of 2006 to Euro 98.5 million in the same period in 2007. The increase in Revenues, equal to Euro 349.2 million, should be viewed in relation to two opposing factors: (i) the reduction in revenues of the Gas segment linked to the mild weather with a consequent drop of Euro 78.3 million in revenues (ii) the increase in turnover in all other segments, in particular in the Electricity Area where revenues have gone up by Euro 388.8 million. It is also noted that the consolidation of the Aspes Group companies accounts for approximately Euro 39.6 million. Costs of raw and consumable materials, equal to Euro 1,073.7 million as at 30 September 2007 increased by 35.0%, linked to the rise in costs associated with higher volumes of electrical energy traded and to the decrease in gas volumes, in addition to the said consolidation of the Pesaro companies. The increase in other operating costs (Service costs up by Euro 79.7 million and Other operating costs up by Euro 13.2 million) amounted in total to Euro 92.9 million (+20.5%), feeling the effect of Euro 21.2 million relating to the consolidation of Aspes. Net of this item, the rise in costs emerged as contained at Euro 71.7 million which, taking into account the capitalised costs for Euro 45.7 million and the increase in costs for transport of about Euro 30.0 million, shows a reduction in operating costs compared to the same period last year: this result despite general inflationary increases and the higher turnover confirms the attention that the Group places on efficiency and operating synergy. Personnel costs rose from Euro 208.6 million in the first nine months of 2006 to Euro 222.8 million in the same period of 2007 (+6.8%), with a ratio to revenues of 11.4%: the increase in costs is due to the consolidation of the Aspes Group companies for about 11.0% and the acquisition of former Enel grids in the Province of Modena. There was a 1.3% percentage increase net of the consolidation effect. The increase in Capitalised costs, which rose from Euro 107.8 million to Euro 154.3 million is mainly due to the current increased investments in the local operating areas, particularly in the water sector.
Hera Group – Directors’ Report as at 30 September 2007
23
As at 30 September 2007, the Group’s consolidated EBITDA increased from Euro 289.7 to 299.2 million, a change of 3.3%. this result is particularly good considering the exceptionally mild weather conditions mentioned above which significantly reduced gas and district heating profits and the application in 2007 of Resolution 134 of the Italian Authority for Electricity and Gas (AEEG), which considerably affected sales spreads to residential customers. These negative events were compensated by (i) positive trends in the waste management and water cycle sectors, (ii) the increase in volumes and margins in the electricity sector and (iii) the contribution from the Pesaro companies amounting to about Euro 10.7 million. The percentage-based incidence of the EBITDA on Revenues decreased slightly from 18.0% of the first quarter 2006 to 15.3% in 2007 due to higher interim volumes in the electricity area. Amortisation, Depreciation and Provisions increased by 8.5%, passing from Euro 133.6 million in 2006 to Euro 145.0 million in the first nine months of this year: almost half of this increase is linked to the consolidation of Aspes for approximately Euro 5.3 million and for the remaining part, to the investment plan carried out. In the light of the above-mentioned information, the first nine months of 2007 highlight an EBIT equal to Euro 154.1 million, down 1.3% compared to the same period of the previous year. Financial charges, which include the figurative portion linked to the application of the IAS standards, net of the portion of profits from associated companies, rose from Euro 38.1 million to Euro 55.7 million, involving an increase of 46.3% when compared with the same period of 2006, in line with expectations. This increase is linked to (i) the rise in indebtedness made necessary by the increased turnover and the operating and extraordinary investments of the Group, (ii) the inclusion of Aspes within the scope of consolidation as well as (iii) the rise in interest rates. In the light of the above, the period ended with a Pre-tax profit of Euro 98.5 million, down by 16.5% compared to the previous year.
Hera Group – Directors’ Report as at 30 September 2007
24
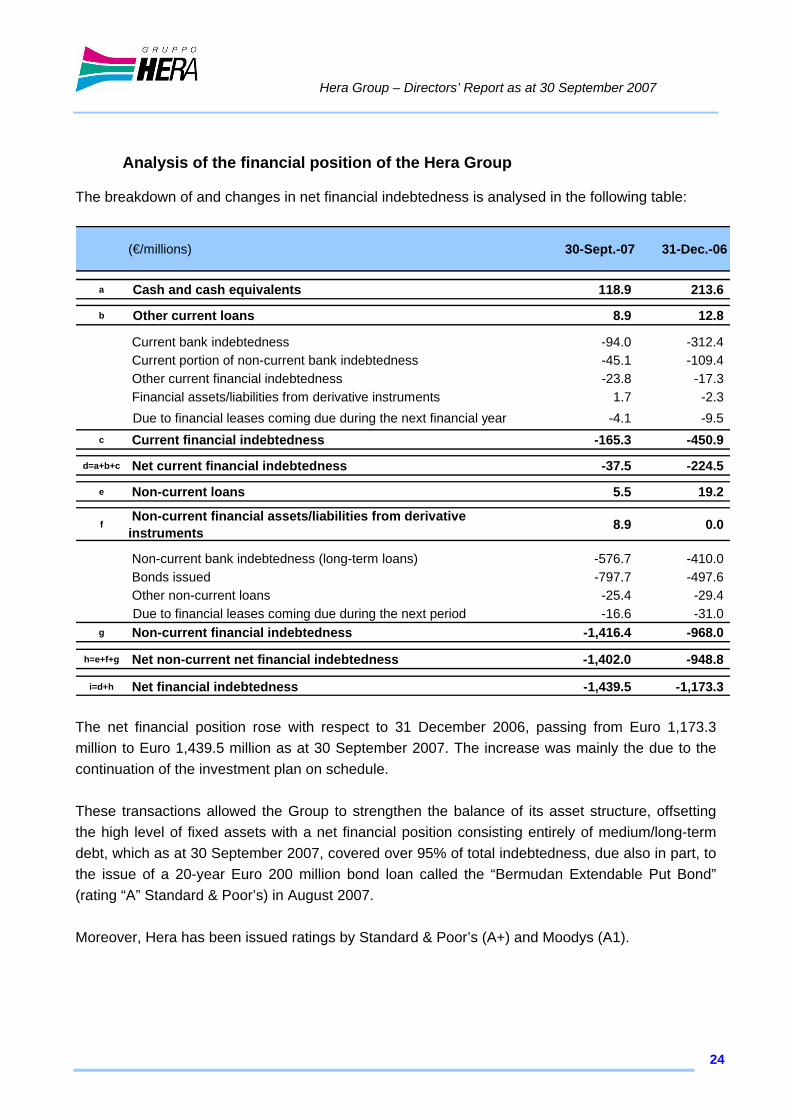
Analysis of the financial position of the Hera Group
The breakdown of and changes in net financial indebtedness is analysed in the following table:
(€/millions) 30-Sept.-07 31-Dec.-06
a Cash and cash equivalents 118.9 213.6
b Other current loans 8.9 12.8
Current bank indebtedness -94.0 -312.4 Current portion of non-current bank indebtedness -45.1 -109.4 Other current financial indebtedness -23.8 -17.3 Financial assets/liabilities from derivative instruments 1.7 -2.3 Due to financial leases coming due during the next financial year -4.1 -9.5
c Current financial indebtedness -165.3 -450.9
d=a+b+c Net current financial indebtedness -37.5 -224.5
e Non-current loans 5.5 19.2
f Non-current financial assets/liabilities from derivative instruments 8.9 0.0
Non-current bank indebtedness (long-term loans) -576.7 -410.0 Bonds issued -797.7 -497.6 Other non-current loans -25.4 -29.4 Due to financial leases coming due during the next period -16.6 -31.0
g Non-current financial indebtedness -1,416.4 -968.0
h=e+f+g Net non-current net financial indebtedness -1,402.0 -948.8
i=d+h Net financial indebtedness -1,439.5 -1,173.3 The net financial position rose with respect to 31 December 2006, passing from Euro 1,173.3 million to Euro 1,439.5 million as at 30 September 2007. The increase was mainly the due to the continuation of the investment plan on schedule. These transactions allowed the Group to strengthen the balance of its asset structure, offsetting the high level of fixed assets with a net financial position consisting entirely of medium/long-term debt, which as at 30 September 2007, covered over 95% of total indebtedness, due also in part, to the issue of a 20-year Euro 200 million bond loan called the “Bermudan Extendable Put Bond” (rating “A” Standard & Poor’s) in August 2007. Moreover, Hera has been issued ratings by Standard & Poor’s (A+) and Moodys (A1).
Hera Group – Directors’ Report as at 30 September 2007
25
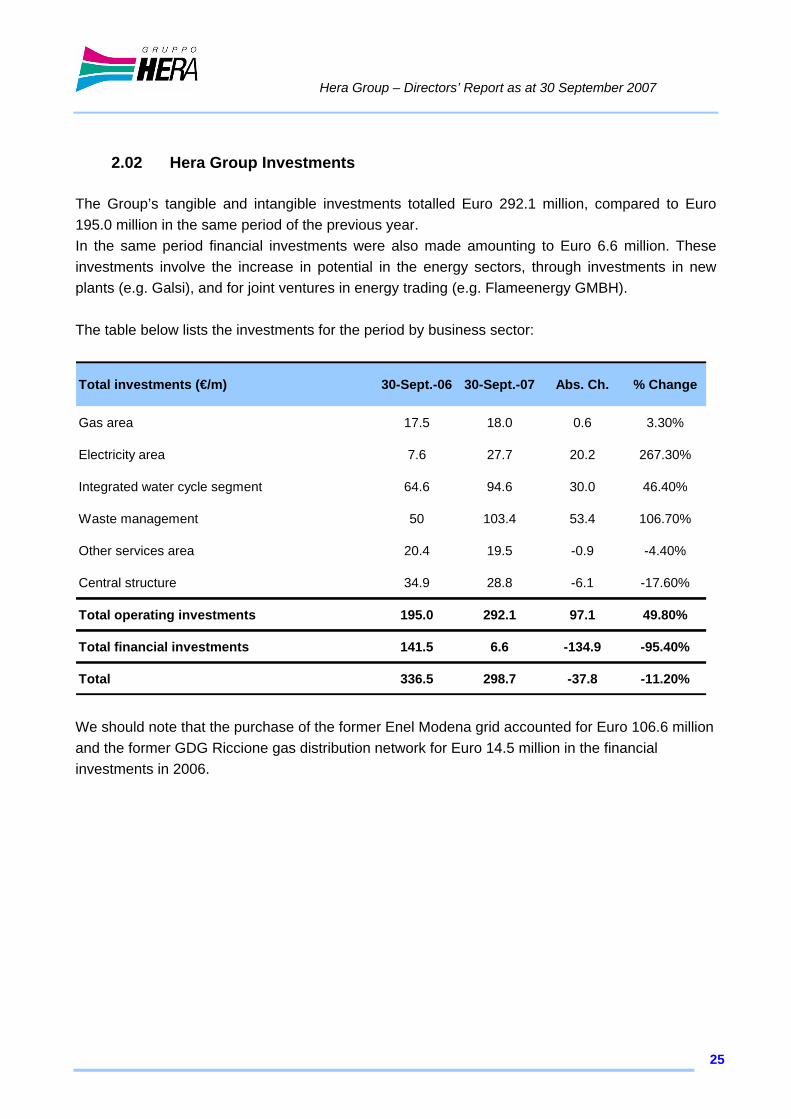
2.02 Hera Group Investments
The Group’s tangible and intangible investments totalled Euro 292.1 million, compared to Euro 195.0 million in the same period of the previous year. In the same period financial investments were also made amounting to Euro 6.6 million. These investments involve the increase in potential in the energy sectors, through investments in new plants (e.g. Galsi), and for joint ventures in energy trading (e.g. Flameenergy GMBH). The table below lists the investments for the period by business sector:
Total investments (€/m) 30-Sept.-06 30-Sept.-07 Abs. Ch. % Change
Gas area 17.5 18.0 0.6 3.30%
Electricity area 7.6 27.7 20.2 267.30%
Integrated water cycle segment 64.6 94.6 30.0 46.40%
Waste management 50 103.4 53.4 106.70%
Other services area 20.4 19.5 -0.9 -4.40%
Central structure 34.9 28.8 -6.1 -17.60%
Total operating investments 195.0 292.1 97.1 49.80%
Total financial investments 141.5 6.6 -134.9 -95.40%
Total 336.5 298.7 -37.8 -11.20%
We should note that the purchase of the former Enel Modena grid accounted for Euro 106.6 million and the former GDG Riccione gas distribution network for Euro 14.5 million in the financial investments in 2006.
Hera Group – Directors’ Report as at 30 September 2007
26
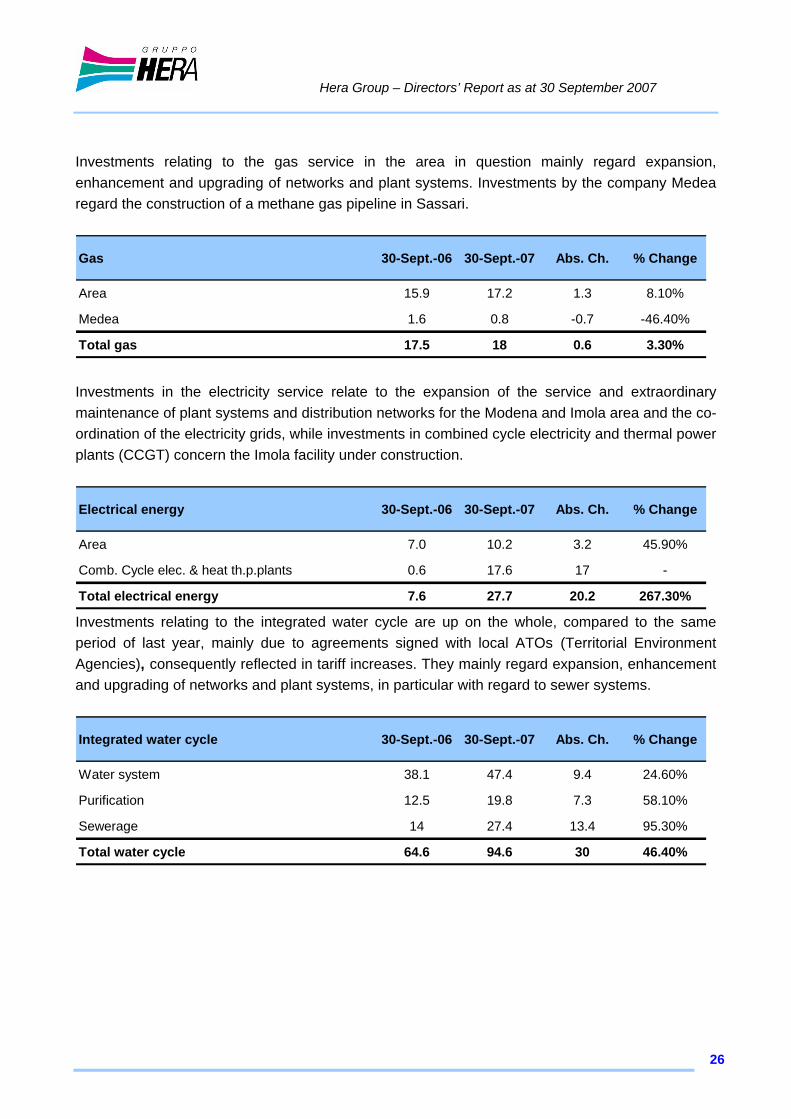
Investments relating to the gas service in the area in question mainly regard expansion, enhancement and upgrading of networks and plant systems. Investments by the company Medea regard the construction of a methane gas pipeline in Sassari.
Gas 30-Sept.-06 30-Sept.-07 Abs. Ch. % Change
Area 15.9 17.2 1.3 8.10%
Medea 1.6 0.8 -0.7 -46.40%
Total gas 17.5 18 0.6 3.30% Investments in the electricity service relate to the expansion of the service and extraordinary maintenance of plant systems and distribution networks for the Modena and Imola area and the co-ordination of the electricity grids, while investments in combined cycle electricity and thermal power plants (CCGT) concern the Imola facility under construction.
Electrical energy 30-Sept.-06 30-Sept.-07 Abs. Ch. % Change
Area 7.0 10.2 3.2 45.90%
Comb. Cycle elec. & heat th.p.plants 0.6 17.6 17 -
Total electrical energy 7.6 27.7 20.2 267.30% Investments relating to the integrated water cycle are up on the whole, compared to the same period of last year, mainly due to agreements signed with local ATOs (Territorial Environment Agencies), consequently reflected in tariff increases. They mainly regard expansion, enhancement and upgrading of networks and plant systems, in particular with regard to sewer systems.
Integrated water cycle 30-Sept.-06 30-Sept.-07 Abs. Ch. % Change
Water system 38.1 47.4 9.4 24.60%
Purification 12.5 19.8 7.3 58.10%
Sewerage 14 27.4 13.4 95.30%
Total water cycle 64.6 94.6 30 46.40%
Hera Group – Directors’ Report as at 30 September 2007
27
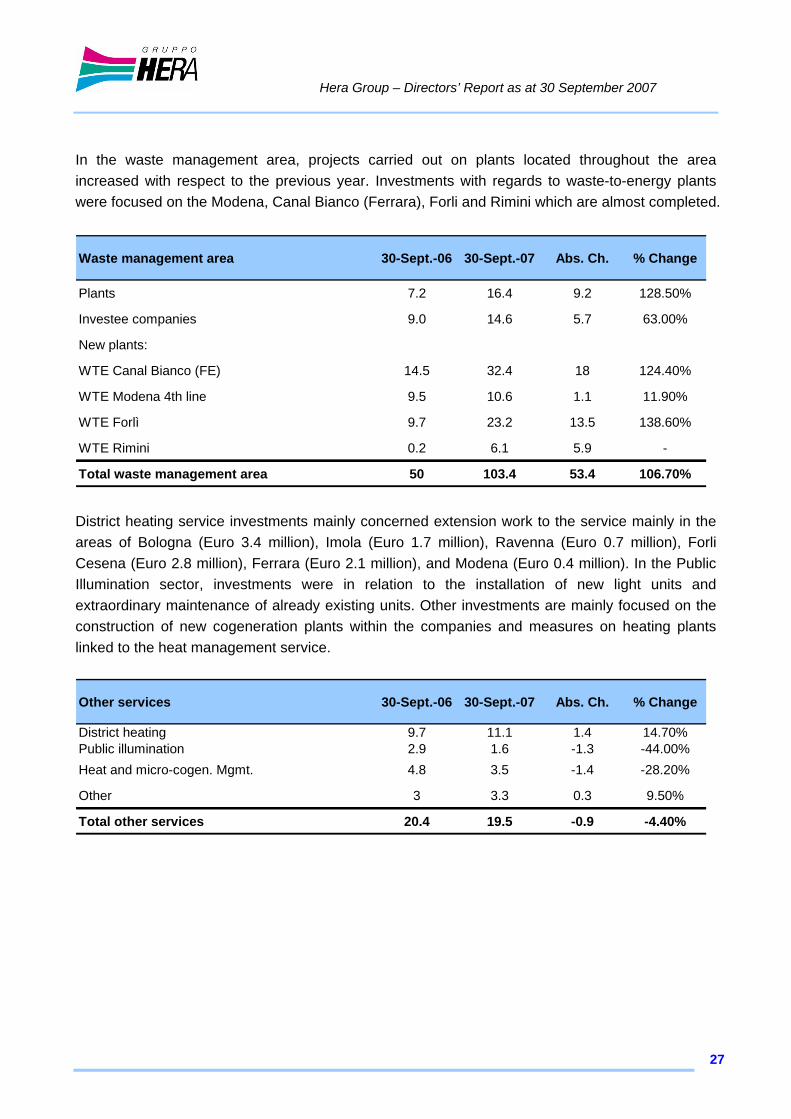
In the waste management area, projects carried out on plants located throughout the area increased with respect to the previous year. Investments with regards to waste-to-energy plants were focused on the Modena, Canal Bianco (Ferrara), Forli and Rimini which are almost completed.
Waste management area 30-Sept.-06 30-Sept.-07 Abs. Ch. % Change
Plants 7.2 16.4 9.2 128.50%
Investee companies 9.0 14.6 5.7 63.00%
New plants:
WTE Canal Bianco (FE) 14.5 32.4 18 124.40%
WTE Modena 4th line 9.5 10.6 1.1 11.90%
WTE Forlì 9.7 23.2 13.5 138.60%
WTE Rimini 0.2 6.1 5.9 -
Total waste management area 50 103.4 53.4 106.70% District heating service investments mainly concerned extension work to the service mainly in the areas of Bologna (Euro 3.4 million), Imola (Euro 1.7 million), Ravenna (Euro 0.7 million), Forli Cesena (Euro 2.8 million), Ferrara (Euro 2.1 million), and Modena (Euro 0.4 million). In the Public Illumination sector, investments were in relation to the installation of new light units and extraordinary maintenance of already existing units. Other investments are mainly focused on the construction of new cogeneration plants within the companies and measures on heating plants linked to the heat management service.
Other services 30-Sept.-06 30-Sept.-07 Abs. Ch. % Change
District heating 9.7 11.1 1.4 14.70%Public illumination 2.9 1.6 -1.3 -44.00%Heat and micro-cogen. Mgmt. 4.8 3.5 -1.4 -28.20%
Other 3 3.3 0.3 9.50%
Total other services 20.4 19.5 -0.9 -4.40%
Hera Group – Directors’ Report as at 30 September 2007
28
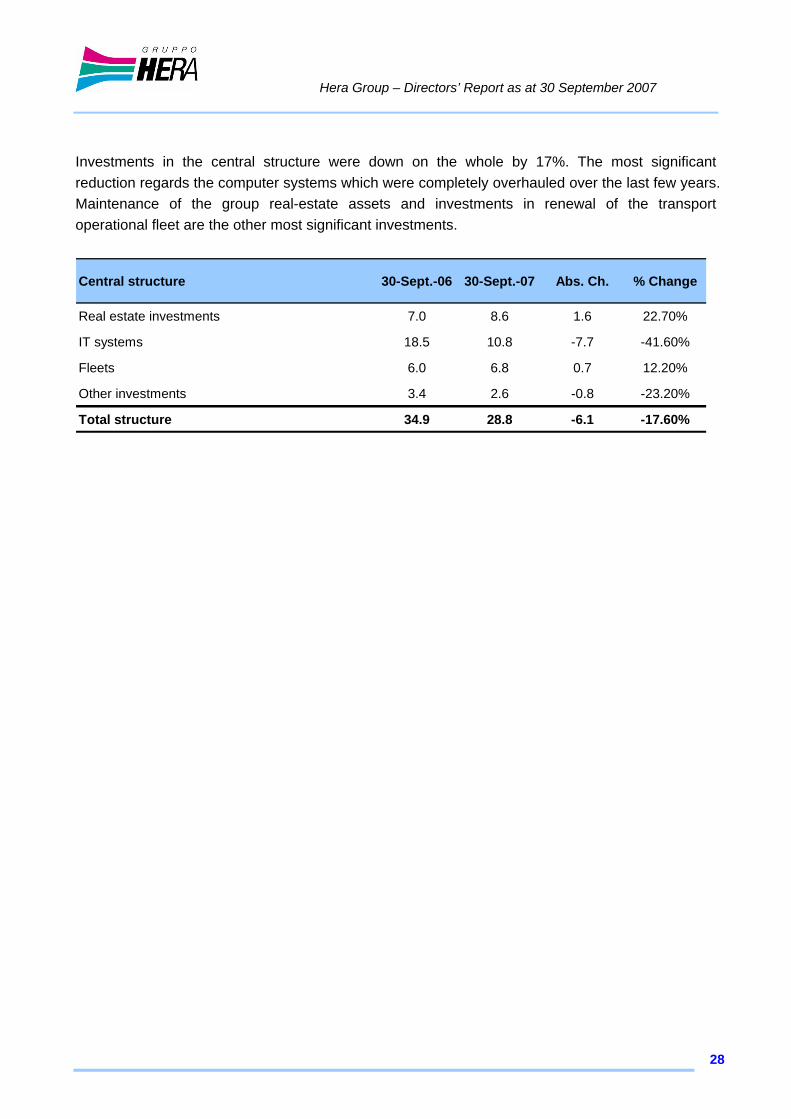
Investments in the central structure were down on the whole by 17%. The most significant reduction regards the computer systems which were completely overhauled over the last few years. Maintenance of the group real-estate assets and investments in renewal of the transport operational fleet are the other most significant investments.
Central structure 30-Sept.-06 30-Sept.-07 Abs. Ch. % Change
Real estate investments 7.0 8.6 1.6 22.70%
IT systems 18.5 10.8 -7.7 -41.60%
Fleets 6.0 6.8 0.7 12.20%
Other investments 3.4 2.6 -0.8 -23.20%
Total structure 34.9 28.8 -6.1 -17.60%
Hera Group – Directors’ Report as at 30 September 2007
29
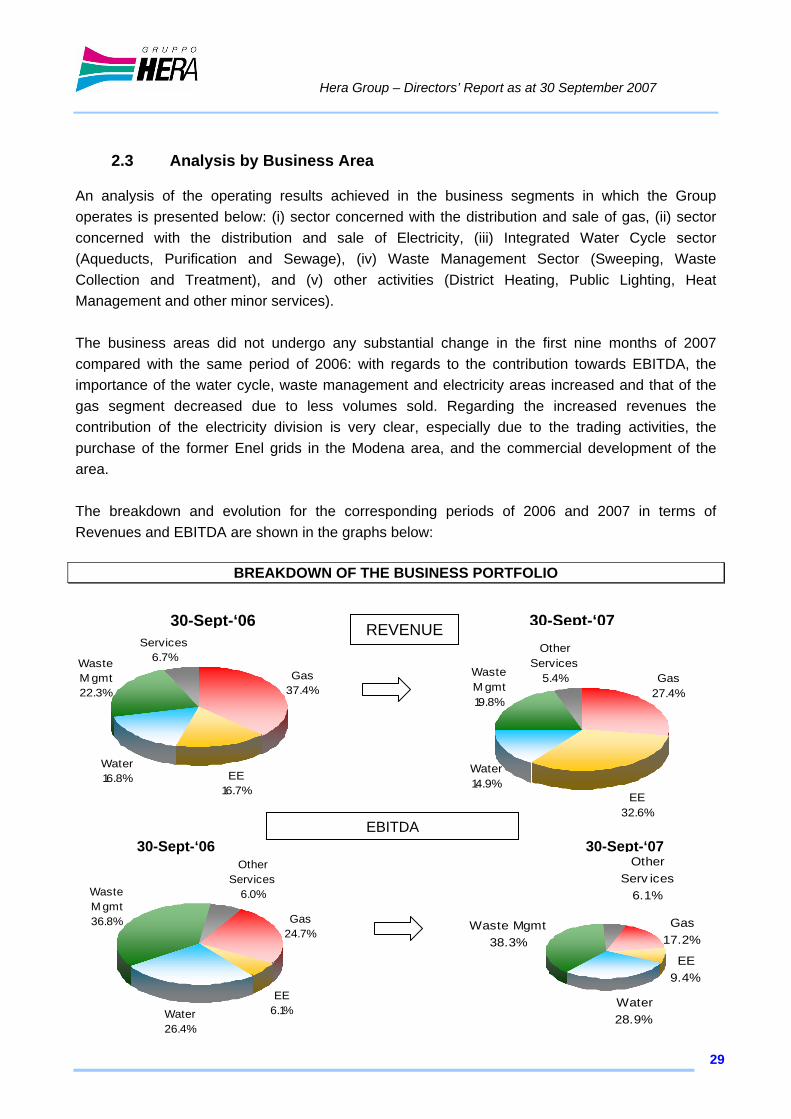
2.3 Analysis by Business Area
An analysis of the operating results achieved in the business segments in which the Group operates is presented below: (i) sector concerned with the distribution and sale of gas, (ii) sector concerned with the distribution and sale of Electricity, (iii) Integrated Water Cycle sector (Aqueducts, Purification and Sewage), (iv) Waste Management Sector (Sweeping, Waste Collection and Treatment), and (v) other activities (District Heating, Public Lighting, Heat Management and other minor services). The business areas did not undergo any substantial change in the first nine months of 2007 compared with the same period of 2006: with regards to the contribution towards EBITDA, the importance of the water cycle, waste management and electricity areas increased and that of the gas segment decreased due to less volumes sold. Regarding the increased revenues the contribution of the electricity division is very clear, especially due to the trading activities, the purchase of the former Enel grids in the Modena area, and the commercial development of the area. The breakdown and evolution for the corresponding periods of 2006 and 2007 in terms of Revenues and EBITDA are shown in the graphs below:
BREAKDOWN OF THE BUSINESS PORTFOLIO
Gas 37.4%
Water16.8%
Waste M gmt22.3%
Other Services
6.7%
EE16.7%
REVENUE30-Sept-‘06 30-Sept-‘07
EBITDA30-Sept-‘07
Gas 27.4%
Water14.9%
Waste M gmt19.8%
Other Services
5.4%
EE32.6%
Gas 24.7%
Water26.4%
Waste M gmt36.8%
Other Services
6.0%
EE6.1%
30-Sept-‘06
Gas 17.2%
Water28.9%
Waste Mgmt38.3%
Other Serv ices
6.1%
EE9.4%
Hera Group – Directors’ Report as at 30 September 2007
30
In the following chapters, in order to provide the necessary details on performance in the first nine months of 2007, an analysis is shown of the various business sectors in which the Group operates, presented on a comparative basis with the 2006 figures. The income statements by business area include structural costs, including inter-divisional transactions valued at current market prices. It should also be noted that the analysis of the business sectors includes the increases in construction on a time and materials basis/work in progress and, therefore, the related costs. These items, as envisaged in the indications of the IAS standards, are indicated by way of a cost adjustment as costs capitalised in the individual tables.
Hera Group – Directors’ Report as at 30 September 2007
31
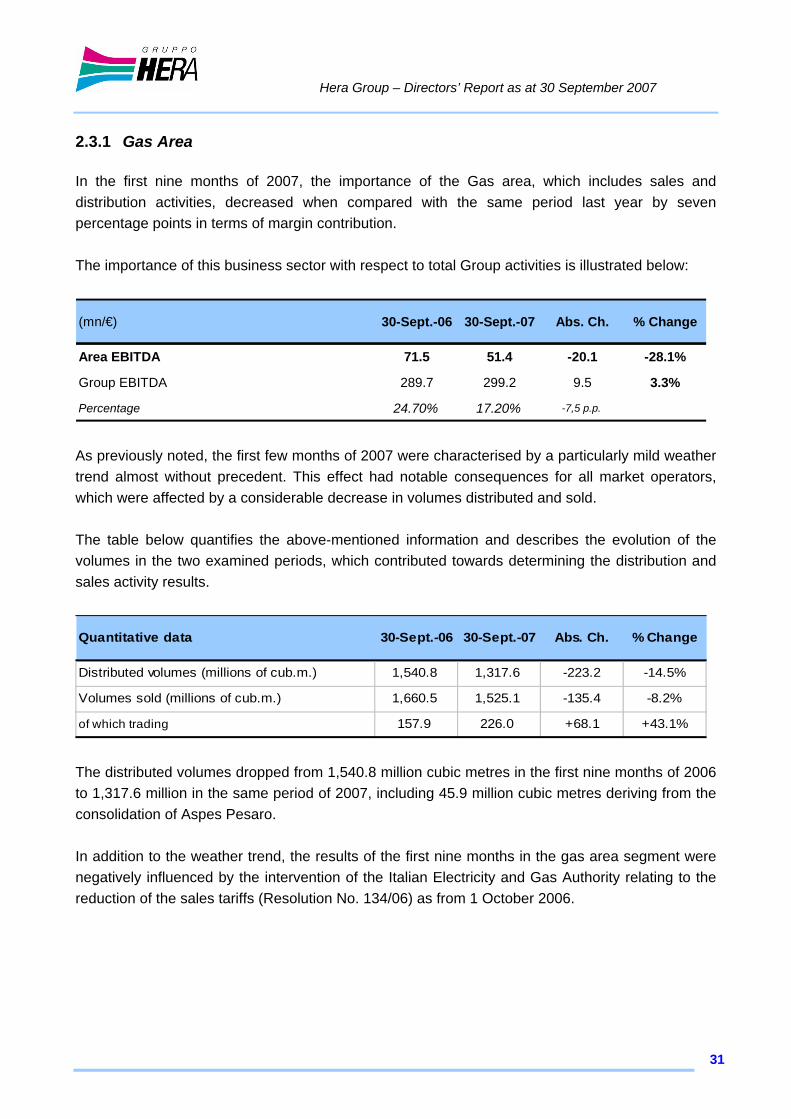
2.3.1 Gas Area In the first nine months of 2007, the importance of the Gas area, which includes sales and distribution activities, decreased when compared with the same period last year by seven percentage points in terms of margin contribution. The importance of this business sector with respect to total Group activities is illustrated below:
(mn/€) 30-Sept.-06 30-Sept.-07 Abs. Ch. % Change
Area EBITDA 71.5 51.4 -20.1 -28.1%
Group EBITDA 289.7 299.2 9.5 3.3%
Percentage 24.70% 17.20% -7,5 p.p.
As previously noted, the first few months of 2007 were characterised by a particularly mild weather trend almost without precedent. This effect had notable consequences for all market operators, which were affected by a considerable decrease in volumes distributed and sold. The table below quantifies the above-mentioned information and describes the evolution of the volumes in the two examined periods, which contributed towards determining the distribution and sales activity results.
Quantitative data 30-Sept.-06 30-Sept.-07 Abs. Ch. % Change
Distributed volumes (millions of cub.m.) 1,540.8 1,317.6 -223.2 -14.5%
Volumes sold (millions of cub.m.) 1,660.5 1,525.1 -135.4 -8.2%
of which trading 157.9 226.0 +68.1 +43.1%
The distributed volumes dropped from 1,540.8 million cubic metres in the first nine months of 2006 to 1,317.6 million in the same period of 2007, including 45.9 million cubic metres deriving from the consolidation of Aspes Pesaro. In addition to the weather trend, the results of the first nine months in the gas area segment were negatively influenced by the intervention of the Italian Electricity and Gas Authority relating to the reduction of the sales tariffs (Resolution No. 134/06) as from 1 October 2006.
Hera Group – Directors’ Report as at 30 September 2007
32
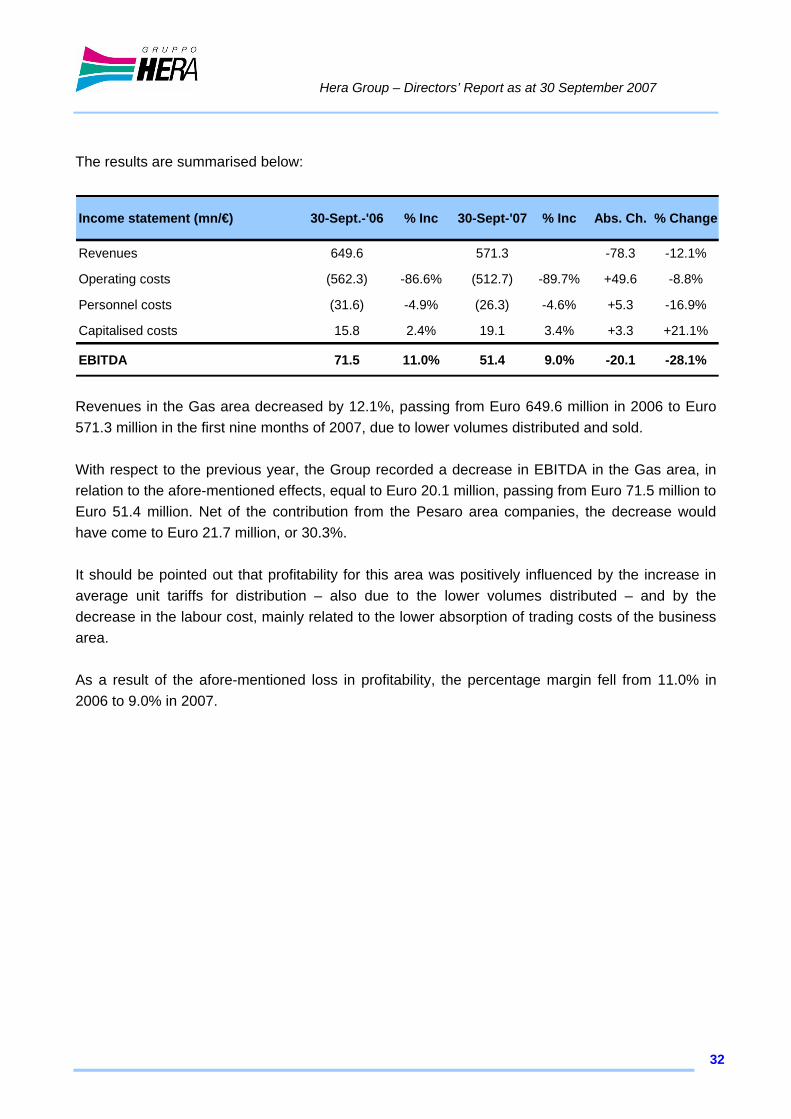
The results are summarised below:
Income statement (mn/€) 30-Sept.-'06 % Inc 30-Sept-'07 % Inc Abs. Ch. % Change
Revenues 649.6 571.3 -78.3 -12.1%
Operating costs (562.3) -86.6% (512.7) -89.7% +49.6 -8.8%
Personnel costs (31.6) -4.9% (26.3) -4.6% +5.3 -16.9%
Capitalised costs 15.8 2.4% 19.1 3.4% +3.3 +21.1%
EBITDA 71.5 11.0% 51.4 9.0% -20.1 -28.1%
Revenues in the Gas area decreased by 12.1%, passing from Euro 649.6 million in 2006 to Euro 571.3 million in the first nine months of 2007, due to lower volumes distributed and sold. With respect to the previous year, the Group recorded a decrease in EBITDA in the Gas area, in relation to the afore-mentioned effects, equal to Euro 20.1 million, passing from Euro 71.5 million to Euro 51.4 million. Net of the contribution from the Pesaro area companies, the decrease would have come to Euro 21.7 million, or 30.3%. It should be pointed out that profitability for this area was positively influenced by the increase in average unit tariffs for distribution – also due to the lower volumes distributed – and by the decrease in the labour cost, mainly related to the lower absorption of trading costs of the business area. As a result of the afore-mentioned loss in profitability, the percentage margin fell from 11.0% in 2006 to 9.0% in 2007.
Hera Group – Directors’ Report as at 30 September 2007
33
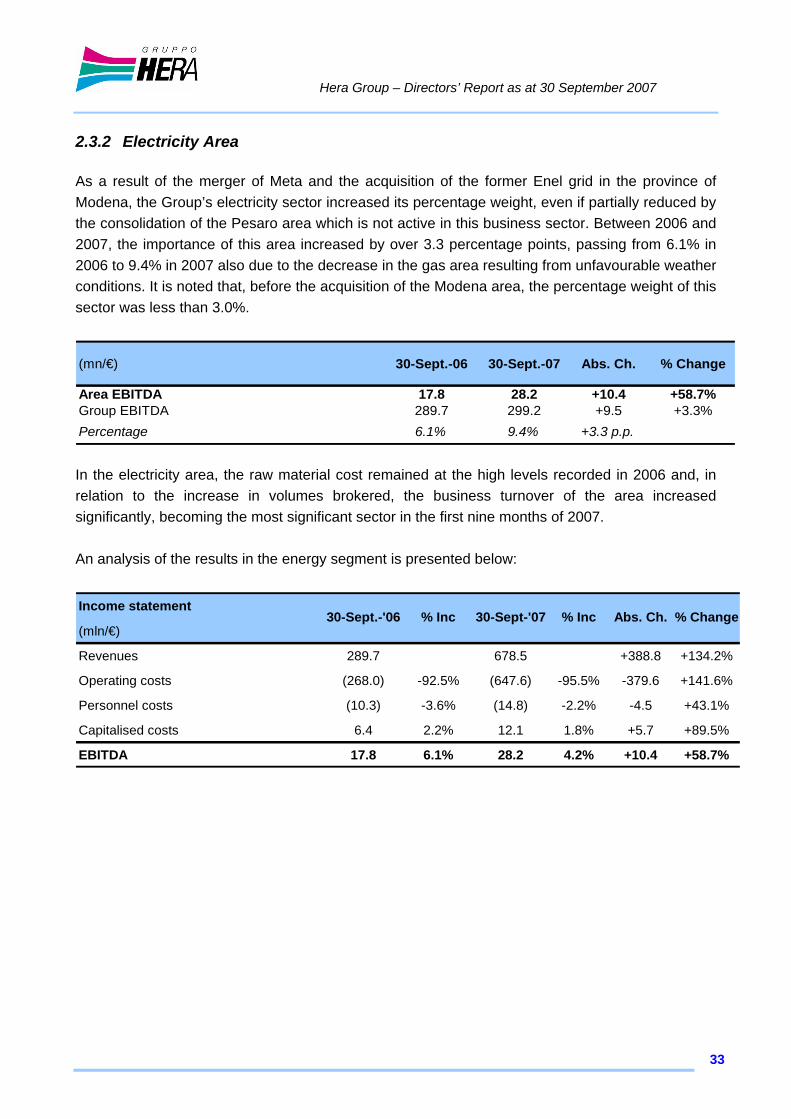
2.3.2 Electricity Area As a result of the merger of Meta and the acquisition of the former Enel grid in the province of Modena, the Group’s electricity sector increased its percentage weight, even if partially reduced by the consolidation of the Pesaro area which is not active in this business sector. Between 2006 and 2007, the importance of this area increased by over 3.3 percentage points, passing from 6.1% in 2006 to 9.4% in 2007 also due to the decrease in the gas area resulting from unfavourable weather conditions. It is noted that, before the acquisition of the Modena area, the percentage weight of this sector was less than 3.0%.
(mn/€) 30-Sept.-06 30-Sept.-07 Abs. Ch. % Change
Area EBITDA 17.8 28.2 +10.4 +58.7%Group EBITDA 289.7 299.2 +9.5 +3.3%Percentage 6.1% 9.4% +3.3 p.p.
In the electricity area, the raw material cost remained at the high levels recorded in 2006 and, in relation to the increase in volumes brokered, the business turnover of the area increased significantly, becoming the most significant sector in the first nine months of 2007. An analysis of the results in the energy segment is presented below:
Income statement
(mln/€)
Revenues 289.7 678.5 +388.8 +134.2%
Operating costs (268.0) -92.5% (647.6) -95.5% -379.6 +141.6%
Personnel costs (10.3) -3.6% (14.8) -2.2% -4.5 +43.1%
Capitalised costs 6.4 2.2% 12.1 1.8% +5.7 +89.5%
EBITDA 17.8 6.1% 28.2 4.2% +10.4 +58.7%
Abs. Ch. % Change30-Sept.-'06 % Inc 30-Sept-'07 % Inc
Hera Group – Directors’ Report as at 30 September 2007
34
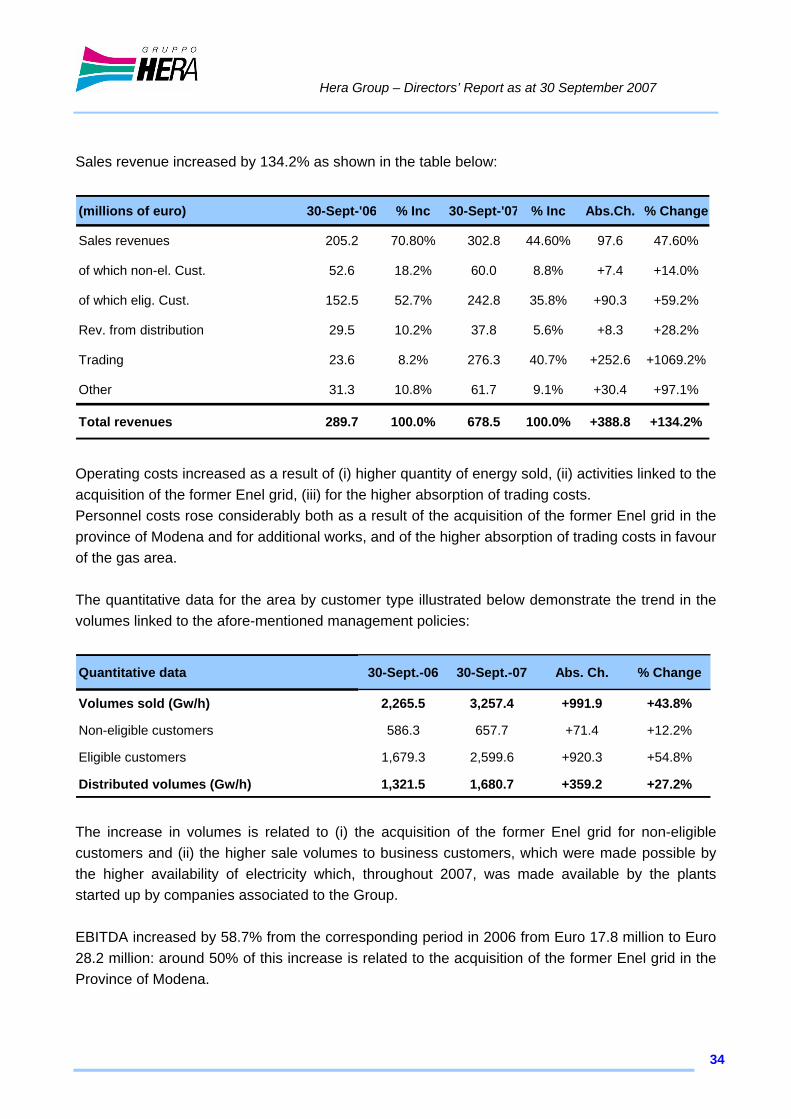
Sales revenue increased by 134.2% as shown in the table below:
(millions of euro) 30-Sept-'06 % Inc 30-Sept-'07 % Inc Abs.Ch. % Change
Sales revenues 205.2 70.80% 302.8 44.60% 97.6 47.60%
of which non-el. Cust. 52.6 18.2% 60.0 8.8% +7.4 +14.0%
of which elig. Cust. 152.5 52.7% 242.8 35.8% +90.3 +59.2%
Rev. from distribution 29.5 10.2% 37.8 5.6% +8.3 +28.2%
Trading 23.6 8.2% 276.3 40.7% +252.6 +1069.2%
Other 31.3 10.8% 61.7 9.1% +30.4 +97.1%
Total revenues 289.7 100.0% 678.5 100.0% +388.8 +134.2%
Operating costs increased as a result of (i) higher quantity of energy sold, (ii) activities linked to the acquisition of the former Enel grid, (iii) for the higher absorption of trading costs. Personnel costs rose considerably both as a result of the acquisition of the former Enel grid in the province of Modena and for additional works, and of the higher absorption of trading costs in favour of the gas area. The quantitative data for the area by customer type illustrated below demonstrate the trend in the volumes linked to the afore-mentioned management policies:
Quantitative data 30-Sept.-06 30-Sept.-07 Abs. Ch. % Change
Volumes sold (Gw/h) 2,265.5 3,257.4 +991.9 +43.8%
Non-eligible customers 586.3 657.7 +71.4 +12.2%
Eligible customers 1,679.3 2,599.6 +920.3 +54.8%
Distributed volumes (Gw/h) 1,321.5 1,680.7 +359.2 +27.2% The increase in volumes is related to (i) the acquisition of the former Enel grid for non-eligible customers and (ii) the higher sale volumes to business customers, which were made possible by the higher availability of electricity which, throughout 2007, was made available by the plants started up by companies associated to the Group. EBITDA increased by 58.7% from the corresponding period in 2006 from Euro 17.8 million to Euro 28.2 million: around 50% of this increase is related to the acquisition of the former Enel grid in the Province of Modena.
Hera Group – Directors’ Report as at 30 September 2007
35
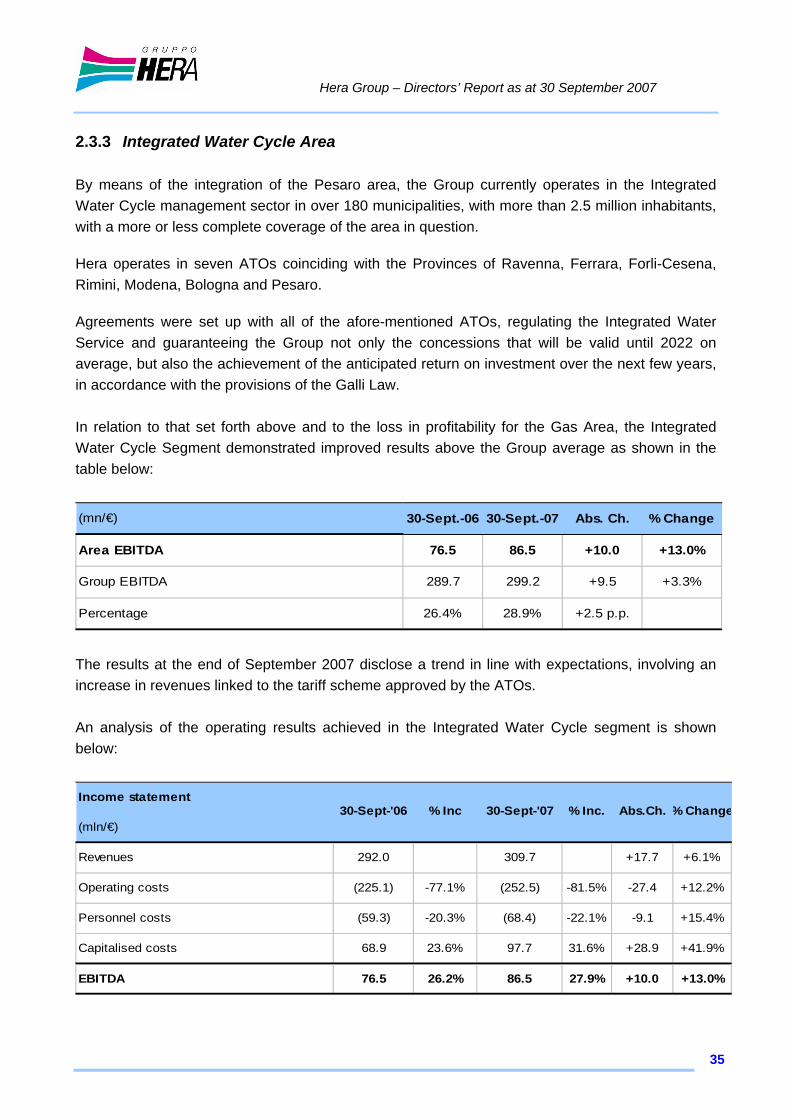
2.3.3 Integrated Water Cycle Area By means of the integration of the Pesaro area, the Group currently operates in the Integrated Water Cycle management sector in over 180 municipalities, with more than 2.5 million inhabitants, with a more or less complete coverage of the area in question.
Hera operates in seven ATOs coinciding with the Provinces of Ravenna, Ferrara, Forli-Cesena, Rimini, Modena, Bologna and Pesaro.
Agreements were set up with all of the afore-mentioned ATOs, regulating the Integrated Water Service and guaranteeing the Group not only the concessions that will be valid until 2022 on average, but also the achievement of the anticipated return on investment over the next few years, in accordance with the provisions of the Galli Law. In relation to that set forth above and to the loss in profitability for the Gas Area, the Integrated Water Cycle Segment demonstrated improved results above the Group average as shown in the table below:
(mn/€) 30-Sept.-06 30-Sept.-07 Abs. Ch. % Change
Area EBITDA 76.5 86.5 +10.0 +13.0%
Group EBITDA 289.7 299.2 +9.5 +3.3%
Percentage 26.4% 28.9% +2.5 p.p.
The results at the end of September 2007 disclose a trend in line with expectations, involving an increase in revenues linked to the tariff scheme approved by the ATOs. An analysis of the operating results achieved in the Integrated Water Cycle segment is shown below:
Income statement
(mln/€)
Revenues 292.0 309.7 +17.7 +6.1%
Operating costs (225.1) -77.1% (252.5) -81.5% -27.4 +12.2%
Personnel costs (59.3) -20.3% (68.4) -22.1% -9.1 +15.4%
Capitalised costs 68.9 23.6% 97.7 31.6% +28.9 +41.9%
EBITDA 76.5 26.2% 86.5 27.9% +10.0 +13.0%
Abs.Ch. % Change30-Sept-'06 % Inc 30-Sept-'07 % Inc.
Hera Group – Directors’ Report as at 30 September 2007
36
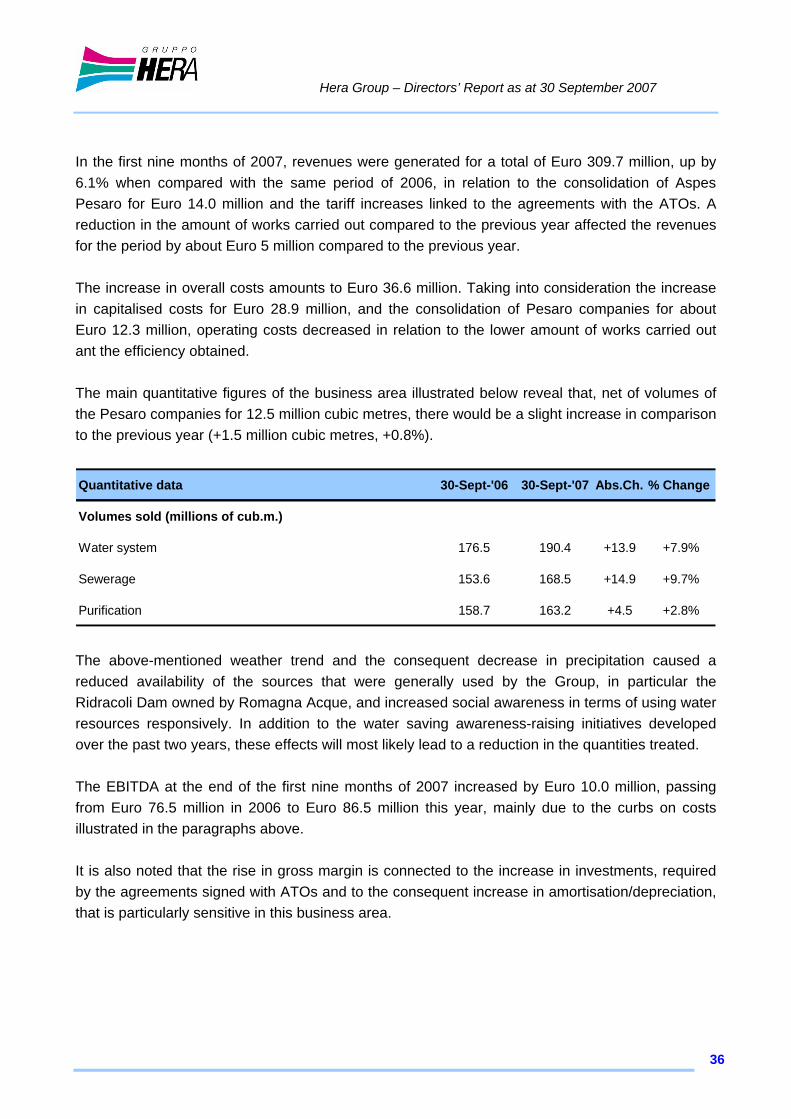
In the first nine months of 2007, revenues were generated for a total of Euro 309.7 million, up by 6.1% when compared with the same period of 2006, in relation to the consolidation of Aspes Pesaro for Euro 14.0 million and the tariff increases linked to the agreements with the ATOs. A reduction in the amount of works carried out compared to the previous year affected the revenues for the period by about Euro 5 million compared to the previous year. The increase in overall costs amounts to Euro 36.6 million. Taking into consideration the increase in capitalised costs for Euro 28.9 million, and the consolidation of Pesaro companies for about Euro 12.3 million, operating costs decreased in relation to the lower amount of works carried out ant the efficiency obtained. The main quantitative figures of the business area illustrated below reveal that, net of volumes of the Pesaro companies for 12.5 million cubic metres, there would be a slight increase in comparison to the previous year (+1.5 million cubic metres, +0.8%).
Quantitative data 30-Sept-'06 30-Sept-'07 Abs.Ch. % Change
Volumes sold (millions of cub.m.)
Water system 176.5 190.4 +13.9 +7.9%
Sewerage 153.6 168.5 +14.9 +9.7%
Purification 158.7 163.2 +4.5 +2.8%
The above-mentioned weather trend and the consequent decrease in precipitation caused a reduced availability of the sources that were generally used by the Group, in particular the Ridracoli Dam owned by Romagna Acque, and increased social awareness in terms of using water resources responsively. In addition to the water saving awareness-raising initiatives developed over the past two years, these effects will most likely lead to a reduction in the quantities treated. The EBITDA at the end of the first nine months of 2007 increased by Euro 10.0 million, passing from Euro 76.5 million in 2006 to Euro 86.5 million this year, mainly due to the curbs on costs illustrated in the paragraphs above. It is also noted that the rise in gross margin is connected to the increase in investments, required by the agreements signed with ATOs and to the consequent increase in amortisation/depreciation, that is particularly sensitive in this business area.
Hera Group – Directors’ Report as at 30 September 2007
37
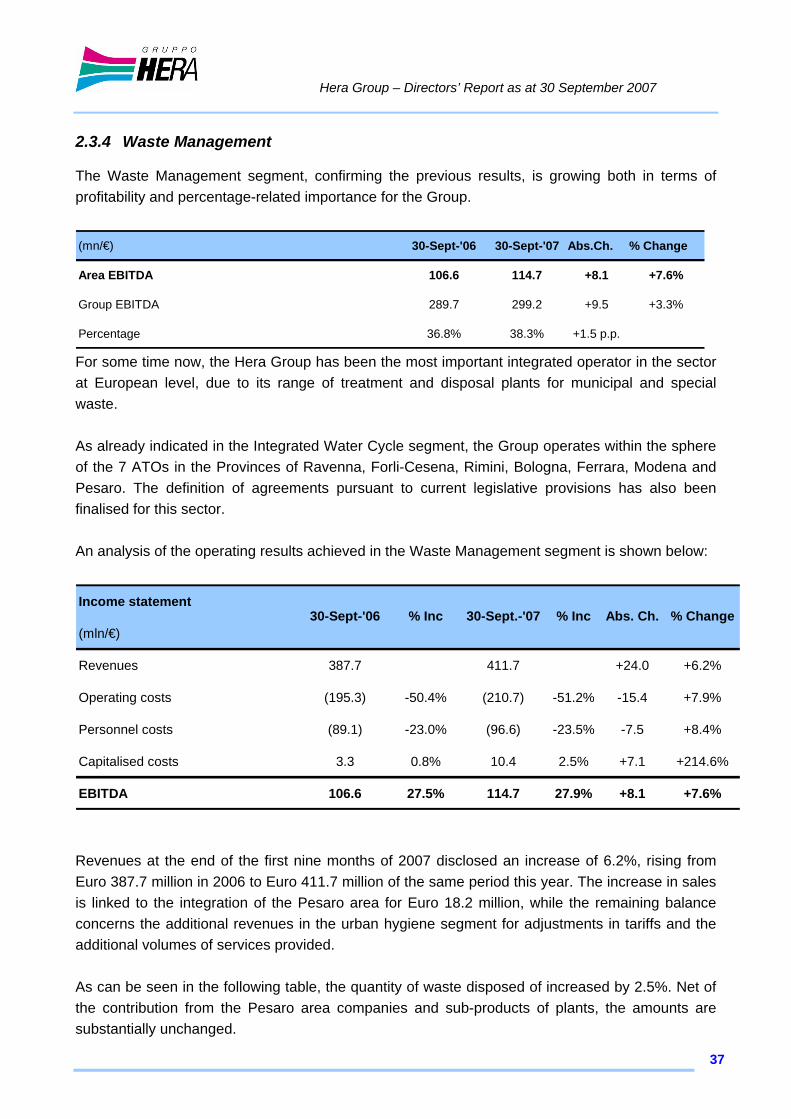
2.3.4 Waste Management The Waste Management segment, confirming the previous results, is growing both in terms of profitability and percentage-related importance for the Group.
(mn/€) 30-Sept-'06 30-Sept-'07 Abs.Ch. % Change
Area EBITDA 106.6 114.7 +8.1 +7.6%
Group EBITDA 289.7 299.2 +9.5 +3.3%
Percentage 36.8% 38.3% +1.5 p.p.
For some time now, the Hera Group has been the most important integrated operator in the sector at European level, due to its range of treatment and disposal plants for municipal and special waste. As already indicated in the Integrated Water Cycle segment, the Group operates within the sphere of the 7 ATOs in the Provinces of Ravenna, Forli-Cesena, Rimini, Bologna, Ferrara, Modena and Pesaro. The definition of agreements pursuant to current legislative provisions has also been finalised for this sector. An analysis of the operating results achieved in the Waste Management segment is shown below:
Income statement
(mln/€)
Revenues 387.7 411.7 +24.0 +6.2%
Operating costs (195.3) -50.4% (210.7) -51.2% -15.4 +7.9%
Personnel costs (89.1) -23.0% (96.6) -23.5% -7.5 +8.4%
Capitalised costs 3.3 0.8% 10.4 2.5% +7.1 +214.6%
EBITDA 106.6 27.5% 114.7 27.9% +8.1 +7.6%
Abs. Ch. % Change30-Sept-'06 % Inc 30-Sept.-'07 % Inc
Revenues at the end of the first nine months of 2007 disclosed an increase of 6.2%, rising from Euro 387.7 million in 2006 to Euro 411.7 million of the same period this year. The increase in sales is linked to the integration of the Pesaro area for Euro 18.2 million, while the remaining balance concerns the additional revenues in the urban hygiene segment for adjustments in tariffs and the additional volumes of services provided. As can be seen in the following table, the quantity of waste disposed of increased by 2.5%. Net of the contribution from the Pesaro area companies and sub-products of plants, the amounts are substantially unchanged.
Hera Group – Directors’ Report as at 30 September 2007
38
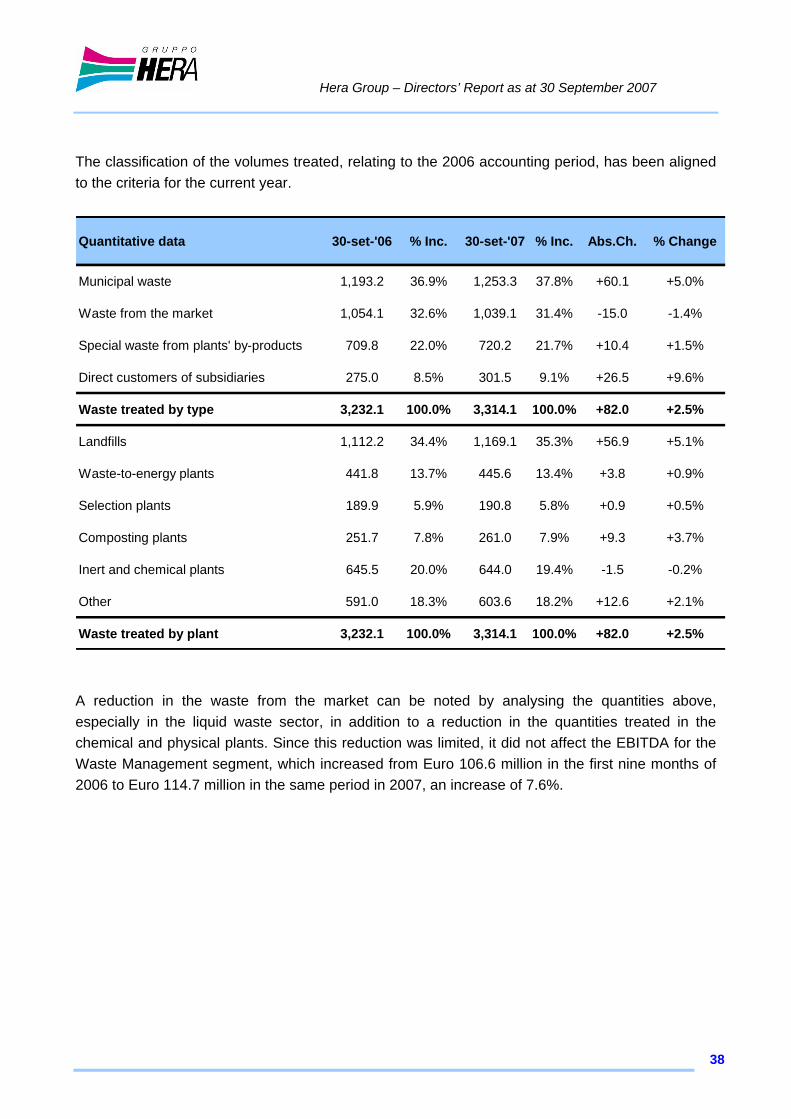
The classification of the volumes treated, relating to the 2006 accounting period, has been aligned to the criteria for the current year.
Quantitative data 30-set-'06 % Inc. 30-set-'07 % Inc. Abs.Ch. % Change
Municipal waste 1,193.2 36.9% 1,253.3 37.8% +60.1 +5.0%
Waste from the market 1,054.1 32.6% 1,039.1 31.4% -15.0 -1.4%
Special waste from plants' by-products 709.8 22.0% 720.2 21.7% +10.4 +1.5%
Direct customers of subsidiaries 275.0 8.5% 301.5 9.1% +26.5 +9.6%
Waste treated by type 3,232.1 100.0% 3,314.1 100.0% +82.0 +2.5%
Landfills 1,112.2 34.4% 1,169.1 35.3% +56.9 +5.1%
Waste-to-energy plants 441.8 13.7% 445.6 13.4% +3.8 +0.9%
Selection plants 189.9 5.9% 190.8 5.8% +0.9 +0.5%
Composting plants 251.7 7.8% 261.0 7.9% +9.3 +3.7%
Inert and chemical plants 645.5 20.0% 644.0 19.4% -1.5 -0.2%
Other 591.0 18.3% 603.6 18.2% +12.6 +2.1%
Waste treated by plant 3,232.1 100.0% 3,314.1 100.0% +82.0 +2.5%
A reduction in the waste from the market can be noted by analysing the quantities above, especially in the liquid waste sector, in addition to a reduction in the quantities treated in the chemical and physical plants. Since this reduction was limited, it did not affect the EBITDA for the Waste Management segment, which increased from Euro 106.6 million in the first nine months of 2006 to Euro 114.7 million in the same period in 2007, an increase of 7.6%.
Hera Group – Directors’ Report as at 30 September 2007
39
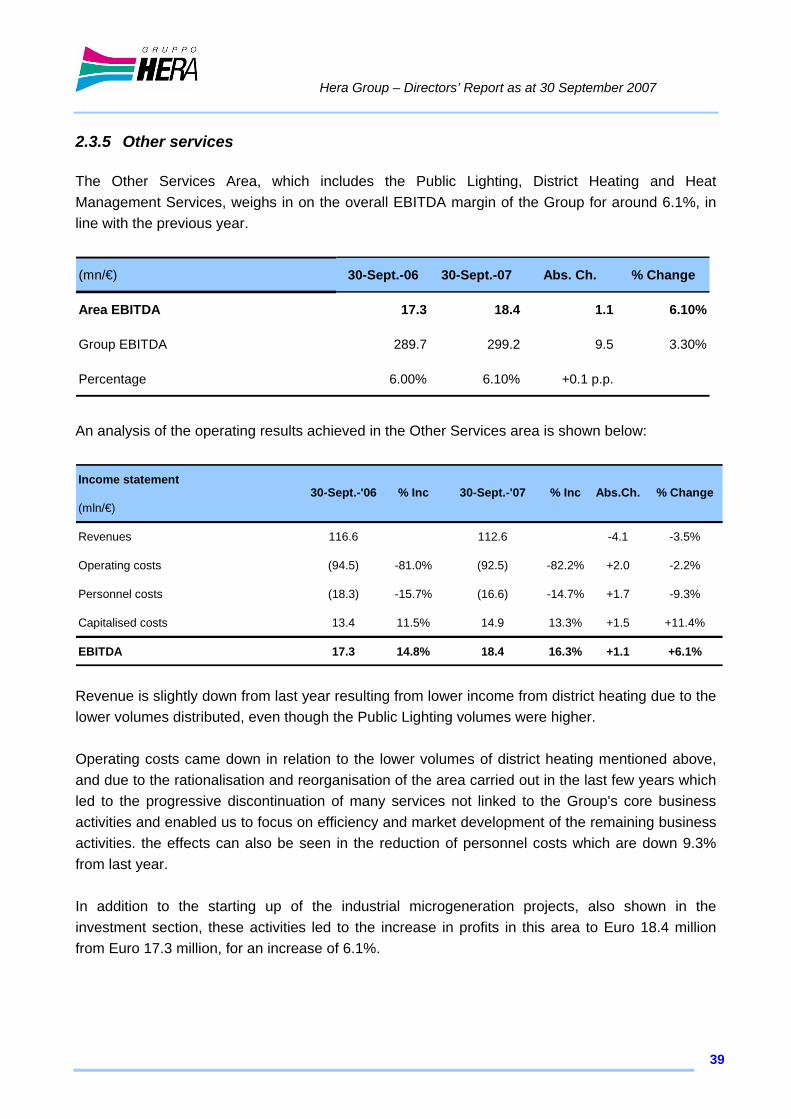
2.3.5 Other services The Other Services Area, which includes the Public Lighting, District Heating and Heat Management Services, weighs in on the overall EBITDA margin of the Group for around 6.1%, in line with the previous year.
(mn/€) 30-Sept.-06 30-Sept.-07 Abs. Ch. % Change
Area EBITDA 17.3 18.4 1.1 6.10%
Group EBITDA 289.7 299.2 9.5 3.30%
Percentage 6.00% 6.10% +0.1 p.p.
An analysis of the operating results achieved in the Other Services area is shown below:
Income statement
(mln/€)
Revenues 116.6 112.6 -4.1 -3.5%
Operating costs (94.5) -81.0% (92.5) -82.2% +2.0 -2.2%
Personnel costs (18.3) -15.7% (16.6) -14.7% +1.7 -9.3%
Capitalised costs 13.4 11.5% 14.9 13.3% +1.5 +11.4%
EBITDA 17.3 14.8% 18.4 16.3% +1.1 +6.1%
Abs.Ch. % Change30-Sept.-'06 % Inc 30-Sept.-'07 % Inc
Revenue is slightly down from last year resulting from lower income from district heating due to the lower volumes distributed, even though the Public Lighting volumes were higher. Operating costs came down in relation to the lower volumes of district heating mentioned above, and due to the rationalisation and reorganisation of the area carried out in the last few years which led to the progressive discontinuation of many services not linked to the Group's core business activities and enabled us to focus on efficiency and market development of the remaining business activities. the effects can also be seen in the reduction of personnel costs which are down 9.3% from last year. In addition to the starting up of the industrial microgeneration projects, also shown in the investment section, these activities led to the increase in profits in this area to Euro 18.4 million from Euro 17.3 million, for an increase of 6.1%.
Hera Group – Directors’ Report as at 30 September 2007
40
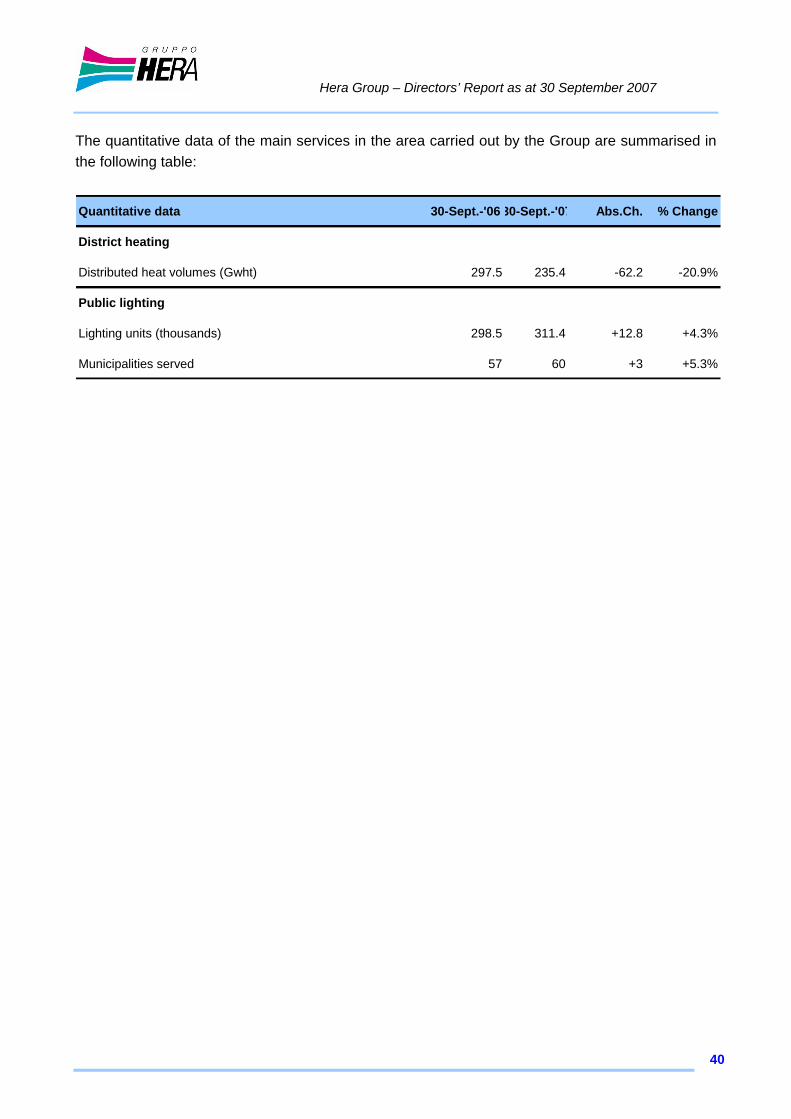
The quantitative data of the main services in the area carried out by the Group are summarised in the following table:
Quantitative data 30-Sept.-'0630-Sept.-'07 Abs.Ch. % Change
District heating
Distributed heat volumes (Gwht) 297.5 235.4 -62.2 -20.9%
Public lighting
Lighting units (thousands) 298.5 311.4 +12.8 +4.3%
Municipalities served 57 60 +3 +5.3%
Hera Group – Directors’ Report as at 30 September 2007
41
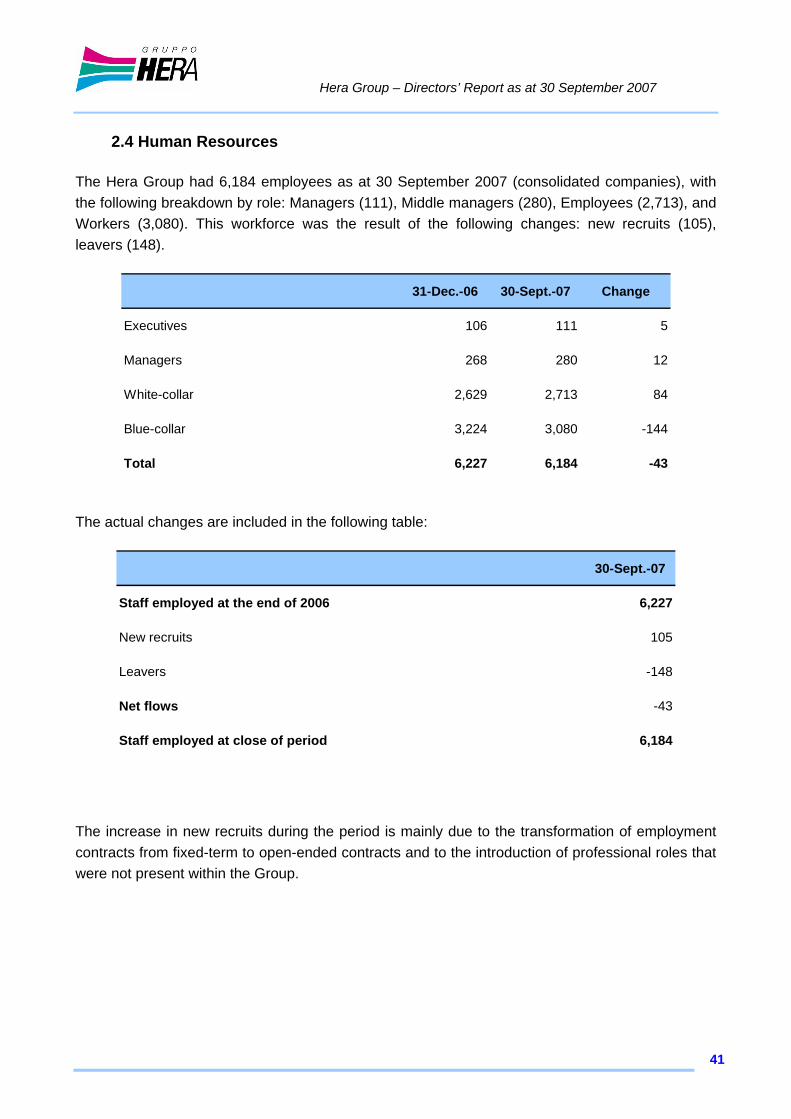
2.4 Human Resources The Hera Group had 6,184 employees as at 30 September 2007 (consolidated companies), with the following breakdown by role: Managers (111), Middle managers (280), Employees (2,713), and Workers (3,080). This workforce was the result of the following changes: new recruits (105), leavers (148).
31-Dec.-06 30-Sept.-07 Change
Executives 106 111 5
Managers 268 280 12
White-collar 2,629 2,713 84
Blue-collar 3,224 3,080 -144
Total 6,227 6,184 -43
The actual changes are included in the following table:
30-Sept.-07
Staff employed at the end of 2006 6,227
New recruits 105
Leavers -148
Net flows -43
Staff employed at close of period 6,184
The increase in new recruits during the period is mainly due to the transformation of employment contracts from fixed-term to open-ended contracts and to the introduction of professional roles that were not present within the Group.
Hera Group Consolidated Financial Statements as at 30 September 2007
42
3 – Hera Group Consolidated Financial Statements
Hera Group Consolidated Financial Statements as at 30 September 2007
43
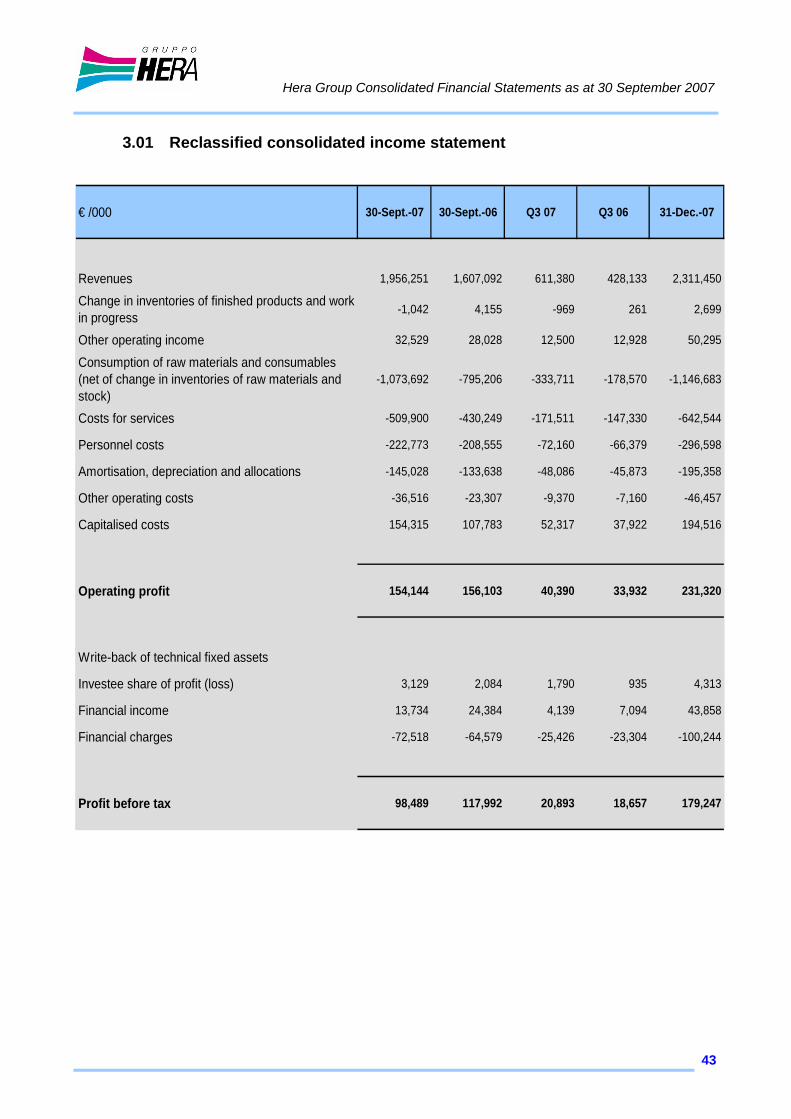
3.01 Reclassified consolidated income statement
€ /000 30-Sept.-07 30-Sept.-06 Q3 07 Q3 06 31-Dec.-07
Revenues 1,956,251 1,607,092 611,380 428,133 2,311,450
Change in inventories of finished products and work in progress -1,042 4,155 -969 261 2,699
Other operating income 32,529 28,028 12,500 12,928 50,295
Consumption of raw materials and consumables (net of change in inventories of raw materials and stock)
-1,073,692 -795,206 -333,711 -178,570 -1,146,683
Costs for services -509,900 -430,249 -171,511 -147,330 -642,544
Personnel costs -222,773 -208,555 -72,160 -66,379 -296,598
Amortisation, depreciation and allocations -145,028 -133,638 -48,086 -45,873 -195,358
Other operating costs -36,516 -23,307 -9,370 -7,160 -46,457
Capitalised costs 154,315 107,783 52,317 37,922 194,516
Operating profit 154,144 156,103 40,390 33,932 231,320
Write-back of technical fixed assets
Investee share of profit (loss) 3,129 2,084 1,790 935 4,313
Financial income 13,734 24,384 4,139 7,094 43,858
Financial charges -72,518 -64,579 -25,426 -23,304 -100,244
Profit before tax 98,489 117,992 20,893 18,657 179,247
Hera Group Consolidated Financial Statements as at 30 September 2007
44
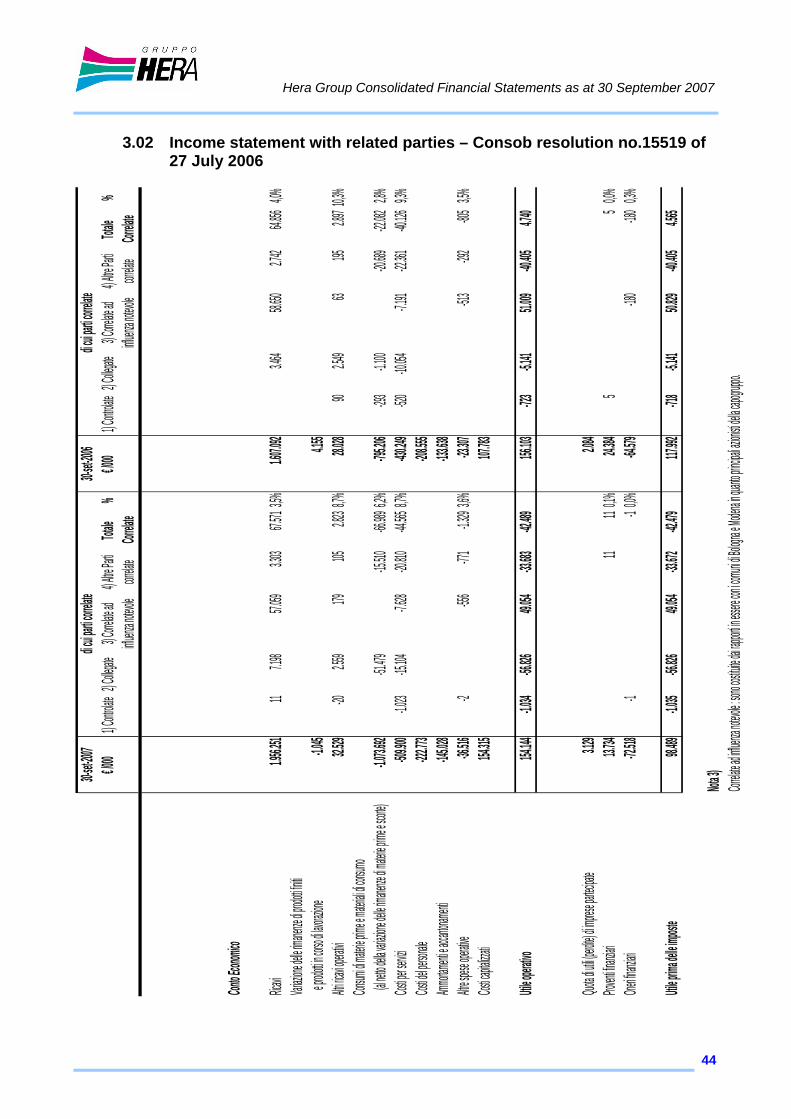
3.02 Income statement with related parties – Consob resolution no.15519 of 27 July 2006
30-set-20
0730-s
et-2006
€ /000
1) Contro
late2) C
ollegate
3) Corre
late ad
4) Altre P
arti Tota
le %
€ /000
1) Contro
late2) C
ollegate
3) Correl
ate ad
4) Altre P
arti Tota
le %
influenza
notevole
corre
late Corr
elateinflu
enza note
vole
correlate
Correlate
Conto E
conomico
Ricavi
1.956.25
111
7.198
57.059
3.303
67.5713
,5%1.60
7.092
3.464
58.650
2.742
64.856
4,0%Varia
zione de
lle riman
enze di p
rodotti fin
iti e pro
dotti in c
orso di la
vorazion
e-1.04
54.15
5Altri
ricavi ope
rativi
32.529
-202.55
9179
1052.82
38,7%
28.028
902.54
963
1952.89
710,3%
Consum
i di materi
e prime e
material
i di consu
mo (al n
etto della
variazio
ne delle
rimanenz
e di mate
rie prime
e scorte)
-1.073.69
2-51.4
79-15.5
10-66.9
896,2%
-795.206
-293-1.10
0-20.6
89-22.0
822,8%
Costi pe
r servizi
-509.900
-1.023
-15.104
-7.628
-20.810
-44.5658
,7%-430
.249-520
-10.054
-7.191
-22.361
-40.126
9,3%Cost
i del pers
onale
-222.773
-208.555
Ammortam
enti e ac
cantonam
enti-145
.028-133
.638Altre
spese o
perative
-36.516
-2-556
-771-1.32
93,6%
-23.307
-513-292
-8053,5%
Costi ca
pitalizzat
i154.
315107.
783
Utile ope
rativo
154.144
-1.034
-56.826
49.054
-33.683
-42.489
156.103
-723-5.14
151.0
09-40.4
054.74
0
Quota di
utili (per
dite) di im
prese pa
rtecipate
3.129
2.084
Proventi
finanziari
13.734
11110
,1%24.3
845
50,0%
Oneri fin
anziari
-72.518
-1-10
,0%-64.5
79-180
-1800,3%
Utile prim
a delle im
poste
98.489
-1.035
-56.826
49.054
-33.672
-42.479
117.992
-718-5.14
150.8
29-40.4
054.56
5
Nota 3)
Correlate
ad influe
nza note
vole : so
no costit
uite dai r
apporti in
essere c
on i com
uni di Bol
ogna e M
odena in
quanto pr
incipali a
zionisti d
ella capo
gruppo.
di cui par
ti correla
te di cu
i parti co
rrelate
Hera Group Consolidated Financial Statements as at 30 September 2007
45
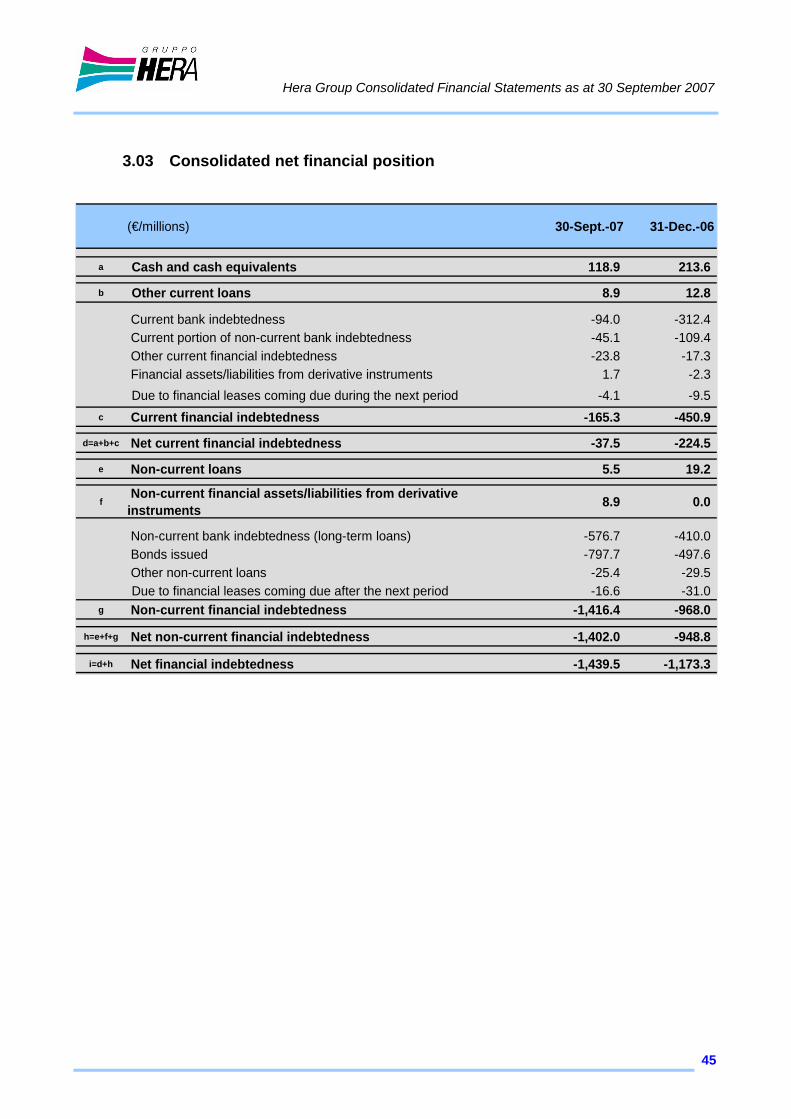
3.03 Consolidated net financial position
(€/millions) 30-Sept.-07 31-Dec.-06
a Cash and cash equivalents 118.9 213.6
b Other current loans 8.9 12.8
Current bank indebtedness -94.0 -312.4 Current portion of non-current bank indebtedness -45.1 -109.4 Other current financial indebtedness -23.8 -17.3 Financial assets/liabilities from derivative instruments 1.7 -2.3 Due to financial leases coming due during the next period -4.1 -9.5
c Current financial indebtedness -165.3 -450.9
d=a+b+c Net current financial indebtedness -37.5 -224.5
e Non-current loans 5.5 19.2
f Non-current financial assets/liabilities from derivative instruments 8.9 0.0
Non-current bank indebtedness (long-term loans) -576.7 -410.0 Bonds issued -797.7 -497.6 Other non-current loans -25.4 -29.5 Due to financial leases coming due after the next period -16.6 -31.0
g Non-current financial indebtedness -1,416.4 -968.0
h=e+f+g Net non-current financial indebtedness -1,402.0 -948.8
i=d+h Net financial indebtedness -1,439.5 -1,173.3
Hera Group Consolidated Financial Statements as at 30 September 2007
46
3.04 Content and form of the accounting statements The consolidated quarterly report of the Hera Group as at 30 September 2007 was drawn up in compliance with the provisions of art. 82 of the “Regulations containing the provisions for implementation of Legislative Decree o. 58 of 24 February 1998, on the matter of issuers” (Consob Resolution no. 11971 of 14 May 999 and subsequent amendments), as amended by Consob Resolution no. 14990 of 14 April 2005. This report is not subject to an accounting audit. Based on the aforementioned art. 82, the quarterly report has been drawn up by applying, solely to the valuations, the international accounting standards IFRS according to the contents of Attachment 3D of said regulations. Thus, this quarterly report has not been drawn up in compliance with the accounting standards regarding infra-annual reporting (IAS 34 “Interim Financial Reporting”). The format of the income statement for the first nine months of 2006 was reclassified, with respect to the version previously published. Specifically, the reclassification involved costs for the use of third party assets. “other operating costs” and “costs for services”, for a total of Euro 62,392 thousand, consistent with the format used for the income statement for the entire financial year 2006. The format used for the income statement requires the classification of costs by nature, which is considered as better representing company results. In addition, sub-totals have been inserted in order to point out the interim figures (operating income) also used in disclosing data to third parties. The consolidated balance sheet and income statement schedules and the information included in the explanatory notes are expressed in thousands of Euro, unless otherwise indicated.
Hera Group Consolidated Financial Statements as at 30 September 2007
47
3.05 Accounting standards and policies
The quarterly report of the Hera Group as at 30 September 2007 includes the quarterly financial statements of the Parent Company, Hera SpA and those of the subsidiary companies. Control is obtained when the Parent Company has the power to determine the financial and operating policies of a company in such a way as to benefit from its activities. Subsidiary companies whose size is insignificant, where the voting rights are subject to serious and long term restrictions and the subsidiary companies held for the exclusive purpose of their subsequent disposal are excluded from the scope of line-by-line consolidation. Investments representing non-current assets in associated companies whose size is significant are carried at equity. Those of an insignificant size are instead carried at cost. The companies held exclusively for the purpose of their disposal are excluded from consolidation and assessed at the lower between cost and fair value. These investments are recorded as separate items. There are no companies consolidated under the proportional method. The list of companies included within the scope of consolidation, including the changes with respect to the previous year, is illustrated at the end of these notes. The financial statements used for the preparation of the balance sheet and income statement schedules were those which the companies included within the scope of consolidation reclassified and adjusted (on the basis of specific instructions issued by the Parent Company) for the purposes of consistency with the accounting policies and principles of the Hera Group. With regard to associated companies, adjustments in shareholders’ equity values were considered in order to adapt to IAS/IFRS principles. Specifically, the income statement includes, on a line-by-line basis, the income and charges of the companies included in the scope of consolidation, while the income and charges, and profits and losses generated from operations carried out between companies included in the scope of consolidation have been eliminated. Dividends received from the parent company and recorded in the income statement among financial income are eliminated during the process of consolidating the relative companies. The valuation of the financial statement items has been carried out on the basis of the general criteria of prudence and accruals, with a view to the business as a going-concern. For the purposes of the accounting entries, priority is given to the economic substance of the transactions rather than their legal form.
Hera Group Consolidated Financial Statements as at 30 September 2007
48
The accounting standards applied to the Group are set forth below. Tangible assets – Tangible assets are recorded at acquisition or production costs, including accessory costs, or at the value based on expert appraisals of the business assets, if relating to purchased companies, net of the related accumulated depreciation and any impairment. The production cost includes the portion of the direct and indirect costs reasonably attributable to the asset (such as: transport, customs duty, costs for the preparation of the installation location, final test & inspection costs, notary fees, land registry expenses). Cost includes any professional fees and, for certain assets, capitalised financial charges up to the moment the asset enters into service. Cost also comprises the costs for reclamation of the site on which the tangible fixed asset exists, if complying with the provisions of IAS 37. As of the date of changeover to the IFRS – 1 January 2004 – the Group adopted the criteria of fair value as a replacement for cost (fair value as deemed cost) for tangible fixed assets, applying it selectively to certain categories of assets; the additional value which emerged was credited directly to reserves. The adoption of the fair value occurred on the basis of an expert appraisal carried out by an independent expert which made it possible, amongst other things, to identify the individual plant and machinery components of a significant amount and with a different useful life, in accordance with the approach for components envisaged by IAS 16. Ordinary maintenance costs are charged in full to the income statement. Improvement, modernisation and transformation costs which increase the value of the assets, are charged to the balance sheet assets concerned. The book value of tangible fixed assets is subject to assessment so as to identify any losses in value, and on any occasion that events or changes in circumstances indicate that the book value cannot be recovered (for details, see the section “losses in value – impairment”). Depreciation starts to be applied when the assets are ready for use. The tangible fixed assets are systematically depreciated in each accounting period using the economic-technical rates considered representative of the residual possible usefulness of the assets. The following tables contain the useful lives taken into account for the depreciation of the assets.
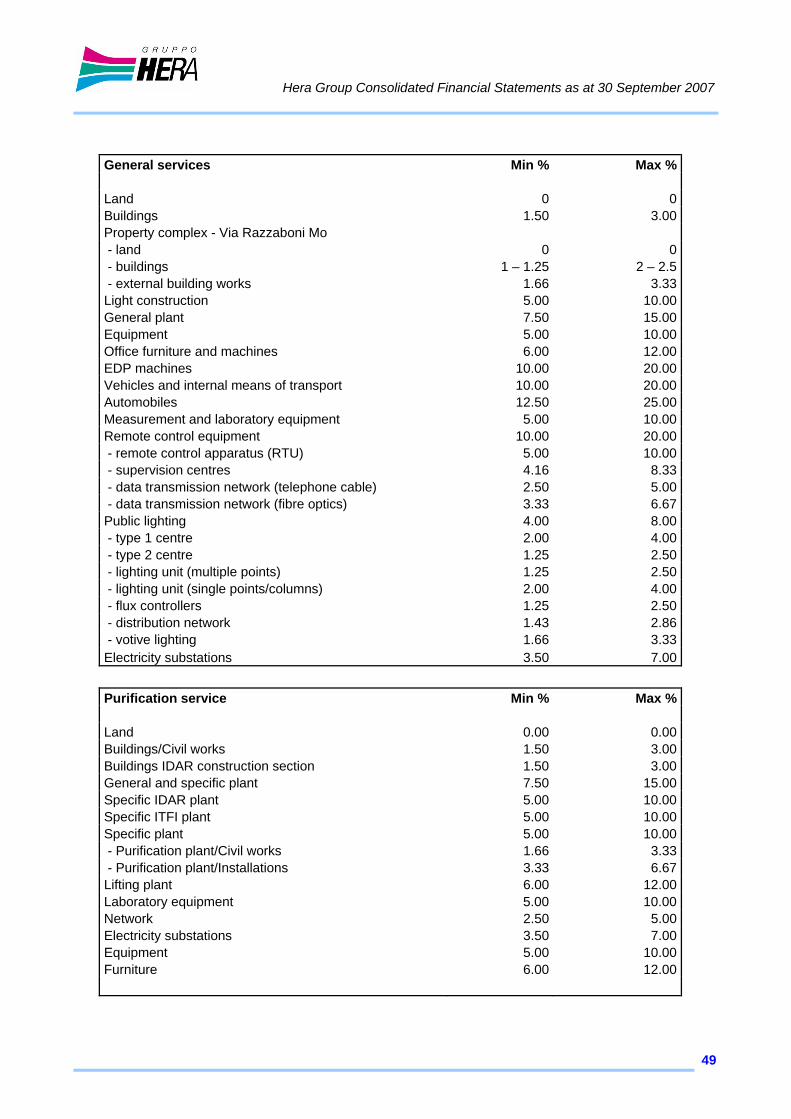
Hera Group Consolidated Financial Statements as at 30 September 2007
49
General services Min % Max % Land 0 0Buildings 1.50 3.00Property complex - Via Razzaboni Mo - land 0 0 - buildings 1 – 1.25 2 – 2.5 - external building works 1.66 3.33Light construction 5.00 10.00General plant 7.50 15.00Equipment 5.00 10.00Office furniture and machines 6.00 12.00EDP machines 10.00 20.00Vehicles and internal means of transport 10.00 20.00Automobiles 12.50 25.00Measurement and laboratory equipment 5.00 10.00Remote control equipment 10.00 20.00 - remote control apparatus (RTU) 5.00 10.00 - supervision centres 4.16 8.33 - data transmission network (telephone cable) 2.50 5.00 - data transmission network (fibre optics) 3.33 6.67Public lighting 4.00 8.00 - type 1 centre 2.00 4.00 - type 2 centre 1.25 2.50 - lighting unit (multiple points) 1.25 2.50 - lighting unit (single points/columns) 2.00 4.00 - flux controllers 1.25 2.50 - distribution network 1.43 2.86 - votive lighting 1.66 3.33Electricity substations 3.50 7.00
Purification service Min % Max % Land 0.00 0.00Buildings/Civil works 1.50 3.00Buildings IDAR construction section 1.50 3.00General and specific plant 7.50 15.00Specific IDAR plant 5.00 10.00Specific ITFI plant 5.00 10.00Specific plant 5.00 10.00 - Purification plant/Civil works 1.66 3.33 - Purification plant/Installations 3.33 6.67Lifting plant 6.00 12.00Laboratory equipment 5.00 10.00Network 2.50 5.00Electricity substations 3.50 7.00Equipment 5.00 10.00Furniture 6.00 12.00
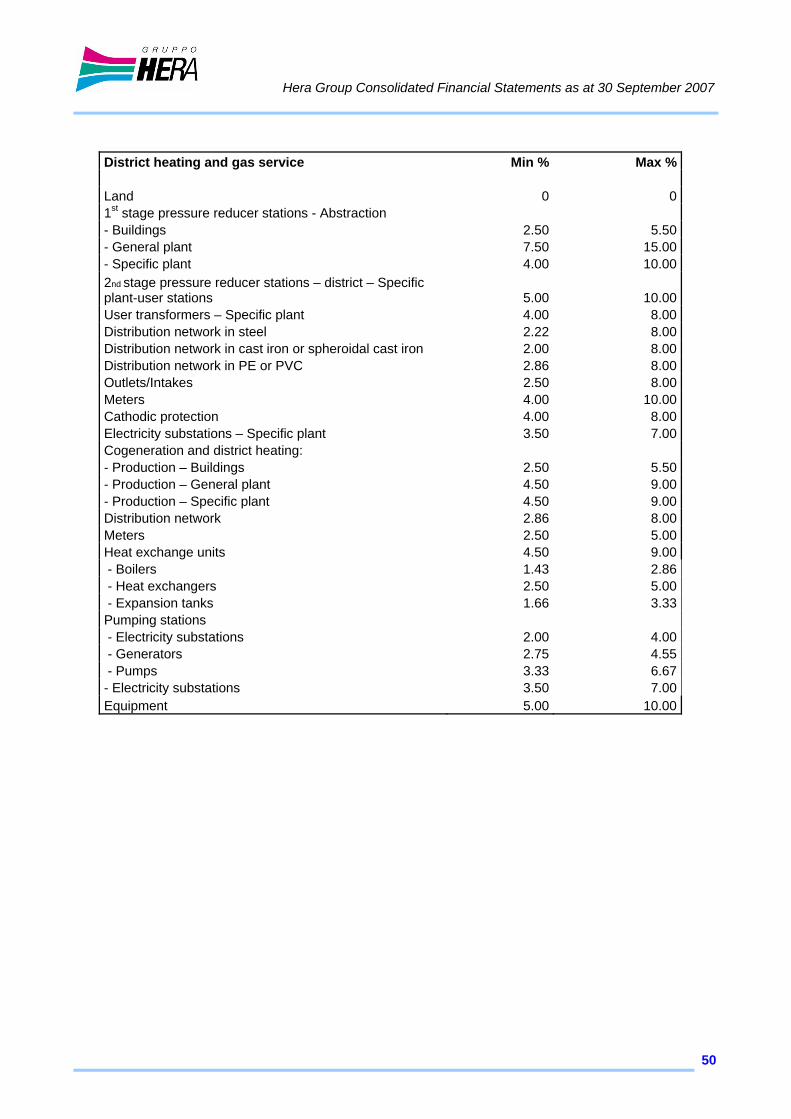
Hera Group Consolidated Financial Statements as at 30 September 2007
50
District heating and gas service Min % Max % Land 0 01st stage pressure reducer stations - Abstraction - Buildings 2.50 5.50- General plant 7.50 15.00- Specific plant 4.00 10.002nd stage pressure reducer stations – district – Specific plant-user stations 5.00 10.00User transformers – Specific plant 4.00 8.00Distribution network in steel 2.22 8.00Distribution network in cast iron or spheroidal cast iron 2.00 8.00Distribution network in PE or PVC 2.86 8.00Outlets/Intakes 2.50 8.00Meters 4.00 10.00Cathodic protection 4.00 8.00Electricity substations – Specific plant 3.50 7.00Cogeneration and district heating: - Production – Buildings 2.50 5.50- Production – General plant 4.50 9.00- Production – Specific plant 4.50 9.00Distribution network 2.86 8.00Meters 2.50 5.00Heat exchange units 4.50 9.00 - Boilers 1.43 2.86 - Heat exchangers 2.50 5.00 - Expansion tanks 1.66 3.33Pumping stations - Electricity substations 2.00 4.00 - Generators 2.75 4.55 - Pumps 3.33 6.67- Electricity substations 3.50 7.00Equipment 5.00 10.00
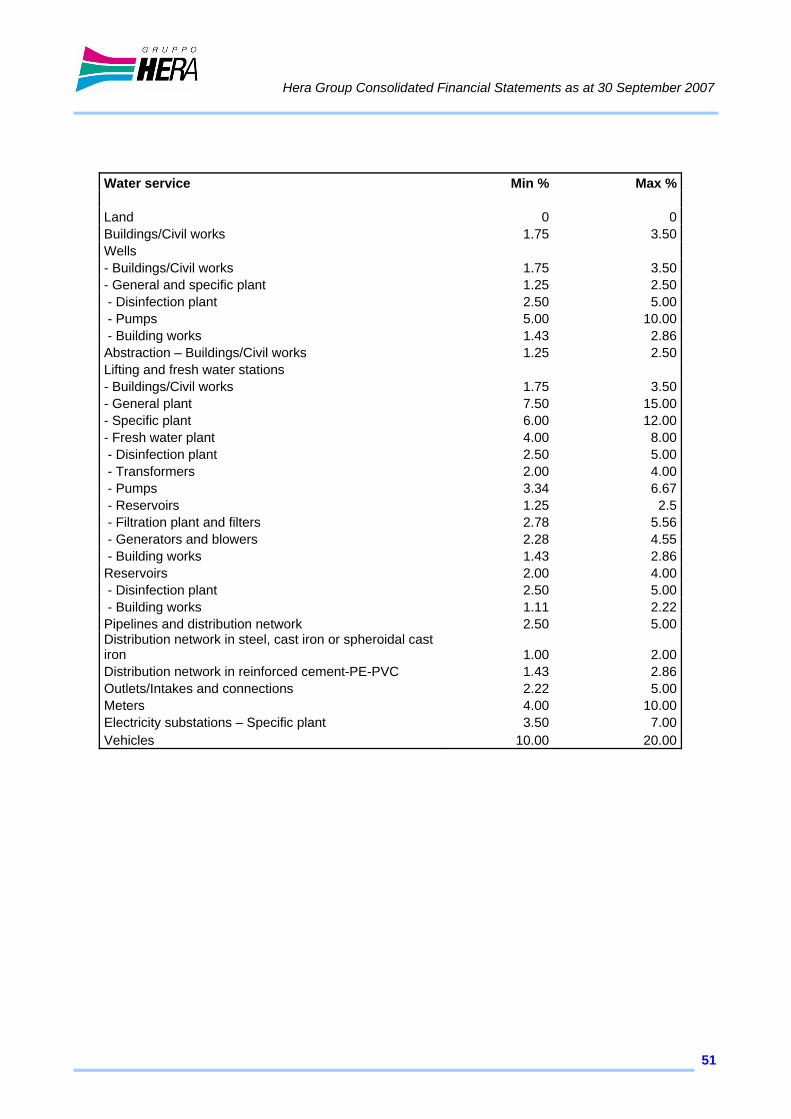
Hera Group Consolidated Financial Statements as at 30 September 2007
51
Water service Min % Max % Land 0 0Buildings/Civil works 1.75 3.50Wells - Buildings/Civil works 1.75 3.50- General and specific plant 1.25 2.50 - Disinfection plant 2.50 5.00 - Pumps 5.00 10.00 - Building works 1.43 2.86Abstraction – Buildings/Civil works 1.25 2.50Lifting and fresh water stations - Buildings/Civil works 1.75 3.50- General plant 7.50 15.00- Specific plant 6.00 12.00- Fresh water plant 4.00 8.00 - Disinfection plant 2.50 5.00 - Transformers 2.00 4.00 - Pumps 3.34 6.67 - Reservoirs 1.25 2.5 - Filtration plant and filters 2.78 5.56 - Generators and blowers 2.28 4.55 - Building works 1.43 2.86Reservoirs 2.00 4.00 - Disinfection plant 2.50 5.00 - Building works 1.11 2.22Pipelines and distribution network 2.50 5.00Distribution network in steel, cast iron or spheroidal cast iron 1.00 2.00Distribution network in reinforced cement-PE-PVC 1.43 2.86Outlets/Intakes and connections 2.22 5.00Meters 4.00 10.00Electricity substations – Specific plant 3.50 7.00Vehicles 10.00 20.00
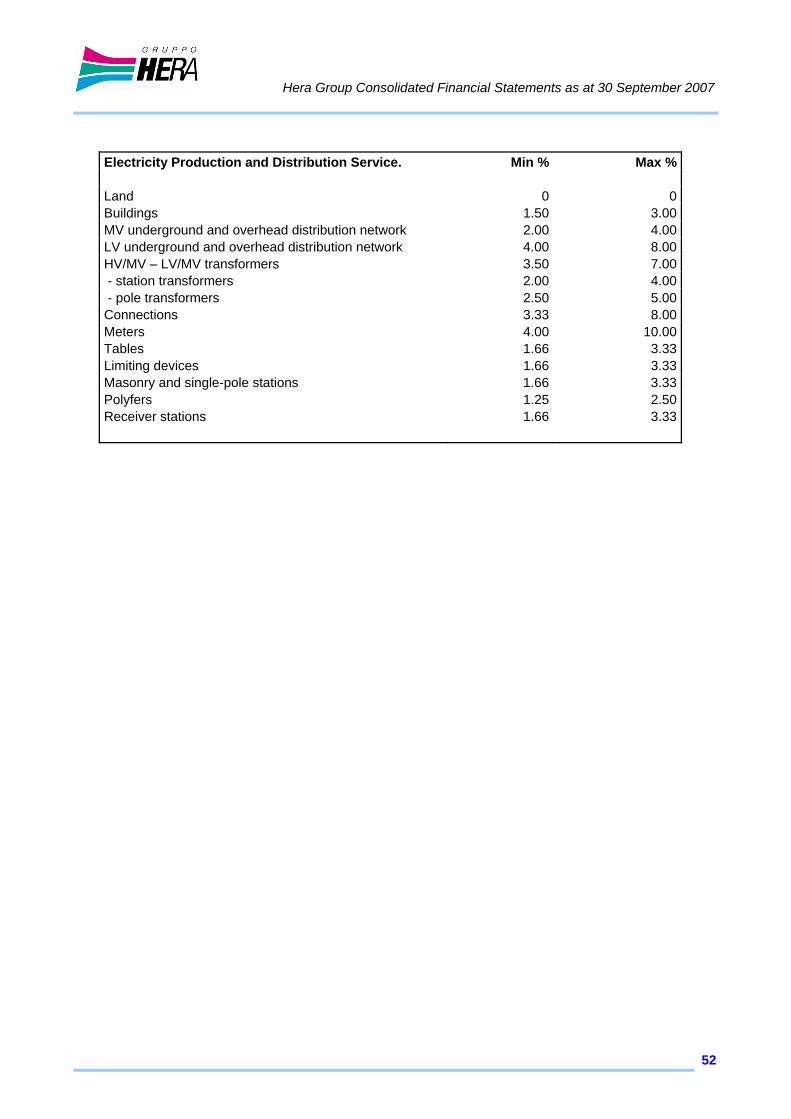
Hera Group Consolidated Financial Statements as at 30 September 2007
52
Electricity Production and Distribution Service. Min % Max % Land 0 0Buildings 1.50 3.00MV underground and overhead distribution network 2.00 4.00LV underground and overhead distribution network 4.00 8.00HV/MV – LV/MV transformers 3.50 7.00 - station transformers 2.00 4.00 - pole transformers 2.50 5.00Connections 3.33 8.00Meters 4.00 10.00Tables 1.66 3.33Limiting devices 1.66 3.33Masonry and single-pole stations 1.66 3.33Polyfers 1.25 2.50Receiver stations 1.66 3.33
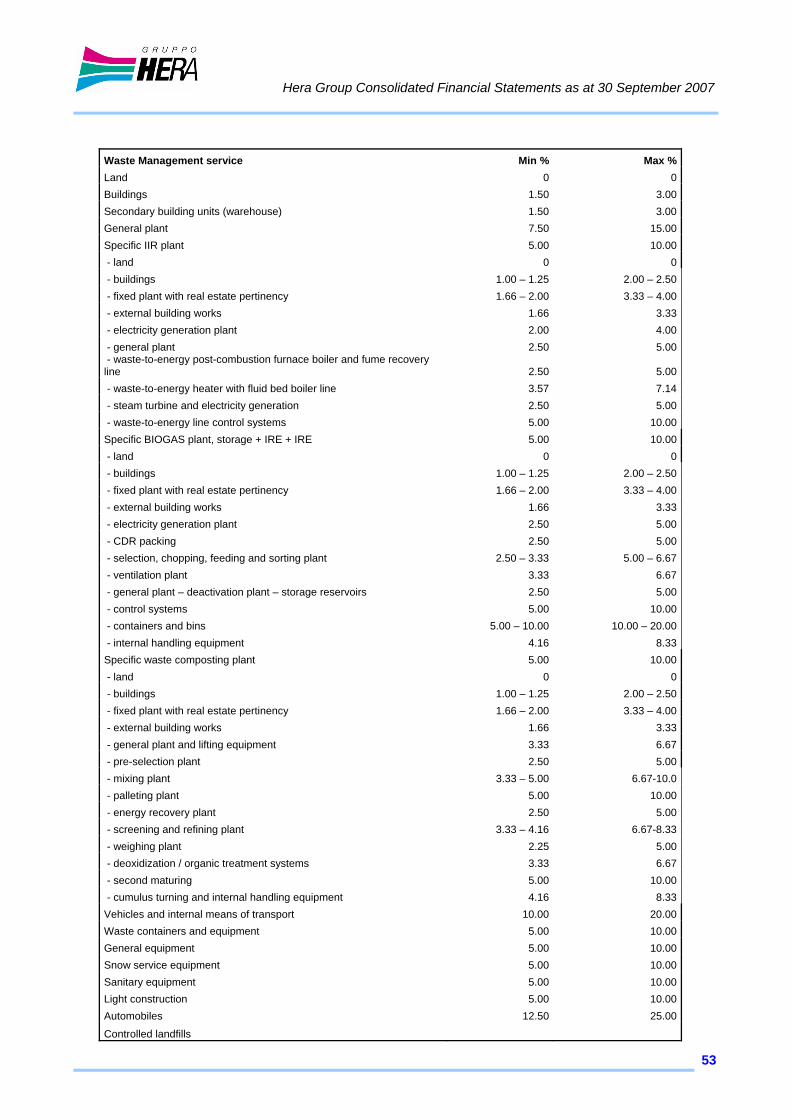
Hera Group Consolidated Financial Statements as at 30 September 2007
53
Waste Management service Min % Max %Land 0 0Buildings 1.50 3.00Secondary building units (warehouse) 1.50 3.00General plant 7.50 15.00Specific IIR plant 5.00 10.00 - land 0 0 - buildings 1.00 – 1.25 2.00 – 2.50 - fixed plant with real estate pertinency 1.66 – 2.00 3.33 – 4.00 - external building works 1.66 3.33 - electricity generation plant 2.00 4.00 - general plant 2.50 5.00 - waste-to-energy post-combustion furnace boiler and fume recovery line 2.50 5.00 - waste-to-energy heater with fluid bed boiler line 3.57 7.14 - steam turbine and electricity generation 2.50 5.00 - waste-to-energy line control systems 5.00 10.00Specific BIOGAS plant, storage + IRE + IRE 5.00 10.00 - land 0 0 - buildings 1.00 – 1.25 2.00 – 2.50 - fixed plant with real estate pertinency 1.66 – 2.00 3.33 – 4.00 - external building works 1.66 3.33 - electricity generation plant 2.50 5.00 - CDR packing 2.50 5.00 - selection, chopping, feeding and sorting plant 2.50 – 3.33 5.00 – 6.67 - ventilation plant 3.33 6.67 - general plant – deactivation plant – storage reservoirs 2.50 5.00 - control systems 5.00 10.00 - containers and bins 5.00 – 10.00 10.00 – 20.00 - internal handling equipment 4.16 8.33Specific waste composting plant 5.00 10.00 - land 0 0 - buildings 1.00 – 1.25 2.00 – 2.50 - fixed plant with real estate pertinency 1.66 – 2.00 3.33 – 4.00 - external building works 1.66 3.33 - general plant and lifting equipment 3.33 6.67 - pre-selection plant 2.50 5.00 - mixing plant 3.33 – 5.00 6.67-10.0 - palleting plant 5.00 10.00 - energy recovery plant 2.50 5.00 - screening and refining plant 3.33 – 4.16 6.67-8.33 - weighing plant 2.25 5.00 - deoxidization / organic treatment systems 3.33 6.67 - second maturing 5.00 10.00 - cumulus turning and internal handling equipment 4.16 8.33Vehicles and internal means of transport 10.00 20.00Waste containers and equipment 5.00 10.00General equipment 5.00 10.00Snow service equipment 5.00 10.00Sanitary equipment 5.00 10.00Light construction 5.00 10.00Automobiles 12.50 25.00
Controlled landfills
Hera Group Consolidated Financial Statements as at 30 September 2007
54
Land is not depreciated. Landfills are depreciated on the basis of the percentage filled. Gains and losses deriving from the sale or disposal of assets are determined as the difference between the sales revenues and the net book value of the assets, and are charged to the income statement. Leasing – Leasing agreements are classified as financial leases when the terms of the agreement are such that they essentially transfer all the risks and benefits of ownership to the lessee. The assets forming the subject matter of financial leasing agreements are recorded among tangible fixed assets and stated as Group assets at their fair value as of the date of acquisition, or, if lower, at the current value of the minimum payments due for the leasing; they are depreciated on the basis of their estimated useful life on a consistent basis with the assets owned. The corresponding liability vis-à-vis the lessor is recorded in the balance sheet. The payments for lease instalments are divided up into the principal portion and the interest portion and the financial charges are booked directly to the income statement for the period. All the other leases are considered to be operating leases and the related costs for the lease instalments are recorded on the basis of the conditions anticipated in the agreement. Intangible assets – Intangible assets which are identifiable and can be monitored, and whose cost can be reliably determined based on the supposition that said assets will generate future economic benefits, are recorded in the accounts. These assets are stated at cost in accordance with the policies indicated for tangible fixed assets and, if they have a defined useful life, they are amortised systematically over the period of the estimated useful life. The amortisation commences when the asset is available for utilisation or in any case begins to produce economic benefit for the business. If the intangible fixed assets have an undefined useful life, they are not amortised but subjected to an annual impairment test, even in the absence of indicators which disclose losses in value. Research and development costs for new products and/or processes are essentially booked to the income statement in the period they are incurred. Advertising expenses are charged directly to the income statement. Industrial patent rights and know-how are representative of assets which are identifiable and capable of generating future economic benefits under the Company’s control; these rights are amortised over the related useful lives. Concessions and licences mainly comprise rights for the concession under management of local public services and are amortised on a straight-line basis over either the economic-technical life of the assets granted or the duration of the concession involved, whichever period is shorter. The residual value of the intangible fixed assets which corresponds with the water concessions contributed by the merged companies and/or the spun-off business segments, is by contrast amortised in consideration of the average residual management duration in light of the agreements
Hera Group Consolidated Financial Statements as at 30 September 2007
55
currently in force with the area agencies. The residual value of the in tangible fixed assets which corresponds with the concessions for the management of the methane gas distribution networks contributed by the merged companies and/or the spun-off business segments is amortised in consideration of the residual transitory management duration anticipated by current legislation (Letta Decree and Marzano Law). The gains and losses deriving from the disposal of an intangible fixed asset are determined as the difference between the disposal value and the book value of the assets; they are recorded in the income statement at the time of disposal. Business combinations – IFRS 3 is applicable to the business combinations which have come about as from 31 March 2004. The Company has applied this standard for the acquisitions of the Agea Group in Ferrara, the Meta Group in Modena and the Geat Distribuzione Gas Group in Riccione. IFRS 3 envisages that business combinations be recorded in accordance with the acquisition method. Specifically, the acquisition cost is determined by the sum total of the current values, as of the date of exchange, of the activities given, the liabilities incurred or undertaken and the financial instruments issued by the group in exchange for control over the company acquired, in addition to the costs directly attributable to the combination; the only exception is represented by non-current assets which are classified as “held for sale” in compliance with IFRS 5 and stated and valued at current values less the sales costs. The goodwill deriving from the acquisition is recorded as an asset and initially valued at cost, represented by the additional value of the acquisition cost when compared with the Group portion of the current values of the identifiable assets, liabilities and potential liabilities recorded. If, after the re-calculation of these values, the Group portion of the current values of the identifiable assets, liabilities and potential liabilities exceeds the acquisition cost, the surplus is recorded via the income statement. Availing itself of the faculty envisaged by the IRFS, the Group has not retroactively applied IFRS 3 to the business combination transactions which took place before the date of changeover to the IAS/IFRS Standards; these transactions have been recorded at the same values determined on the basis of the previous accounting principles. Goodwill deriving from consolidation represents the additional value of the acquisition cost with respect to the percentage due to the Group of the assets and liabilities, stated at fair value, of the subsidiary, associated or jointly controlled investee companies as of the acquisition date. Goodwill deriving from the acquisition of an associated company is included in the book value of the investee company.
Hera Group Consolidated Financial Statements as at 30 September 2007
56
Losses in value (Impairment) - As of each balance sheet date and when events or situation changes indicated that the book value cannot be recovered, the Group takes into consideration the book value of the tangible and intangible fixed assets in order to assess whether there is any indication that said assets have suffered a reduction in value. If there is any indication in this sense, the recoverable amount of said assets is estimated so as to determine the total of the writedown. The recoverable amount is either the net sales price or the usage value, whichever is the greater. Where it is not possible to estimate the recoverable value of an asset individually, the Group estimates the recoverable value of the unit generating the financial flows to which said assets belong. Future cash flows are discounted back at a discount rate (net of taxation) which reflects the current valuation of the market and takes into account the risks associated with the specific business activities. If the recoverable amount of an asset (or of a unit generating financial flows) is estimated as lower than the related book value, the book value of the assets is reduced to the lower recoverable value and the impairment is booked to the income statement. When there is no longer any reason for a writedown to be maintained, the book value of the asset (or the unit generating financial flows), with the exception of goodwill, is restated at the new value deriving from the estimate of its recoverable value; however, this new value cannot exceed the net book value which the asset would have had if the writedown had not been made due to impairment. The write-back of the value is charged to the income statement, unless the asset is valued at revalued value, in which case the value write-back is charged to the revaluation reserve. Treasury shares In application of IAS 32 and 39, treasury shares are recognised as a reduction in shareholders’ equity. Also, any differences generated by future purchase or sale transactions are recorded directly as changes in shareholders’ equity, without passing via the income statement. Equity investments and securities – The equity investments recorded in this item relate to long-term investments.
Investments in associated companies – An associated company is a company over which the Group is able to exercise significant influence, (but not control, or joint control), by means of participation in the decisions on the financial and operating policies of the investee company. Investments in associated companies are carried at equity, except in the cases where they are classified as “held for sale”, or when they are not of a significant value; in such an event they are carried at cost, with write-downs if necessary based on the results of the impairment test. In accordance with the equity method, the investments are stated in the balance sheet at cost, as adjusted for the changes subsequent to acquisition in the net assets of the associated companies, net of any losses in value of the individual investments. The additional value of the acquisition cost with respect to the percentage due the Group of the current value of the identifiable assets, liabilities and potential liabilities of
Hera Group Consolidated Financial Statements as at 30 September 2007
57
the associated company as of the acquisition date is recognized as goodwill. Goodwill is included in the book value of the investment and subject to an impairment test.
Other equity investments and securities – The other equity investments and securities
belong to the category set forth in IAS 39 “financial assets available for sale”. They comprise instruments representative of shareholders’ equity and are stated at fair value. When the market price or fair value cannot be calculated, they are assessed at cost and can be adjusted in application of IAS 36.
If the reasons for the write-down cease to exist, the investments carried at cost are revalued within the limits of the write downs made and the effect is booked to the income statement, or to shareholders’ equity if the investments are held as assets available for sale. The risk deriving from any losses exceeding the book value of the investment is recorded in a specific reserve to the extent that the holder is obliged to fulfil legal or implicit obligations vis-à-vis the investee company or in any event cover its losses. Financial assets which the Company intends or is able to maintain until maturity, are stated at cost represented by the fair value of the initial payment made in exchange, increased by the transaction costs. Following initial registration, the financial assets are valued on an amortised cost basis using the effective interest rate method.
Other non-current assets – These are stated at their par value, and possibly adjusted for any losses in value. Contract work in progress – When the result of a contract can be reliably estimated, contract work in progress is valued on the basis of the contractual payments accrued with reasonable certainty, on a percentage of completion basis (cost-to-cost), so as to allocate the revenues and the economic result of the contract to the pertinent individual accounting periods, in proportion to the stage of completion of the work. The positive or negative difference between the value of the contracts and the advance payments received is recorded respectively among the balance sheet assets or liabilities. Contract revenues, in addition to the contractual payments, include the variations, the price review and the recognition of the incentives up to the extent it is probable that they represent effective revenues which can be determined reliably. When the result of a contract cannot be reliably estimated, the revenues referable to the related contract are recorded solely within the limits of the contract costs incurred which will probably be recovered. The contract costs are recorded as expenses during the accounting period in which they are incurred. When it is probable that the total contract costs will be greater than the contractual revenues, the expected loss is immediately stated at cost.
Hera Group Consolidated Financial Statements as at 30 September 2007
58
Inventories – Inventories are recorded at purchase cost, including directly chargeable related costs, or net estimated realisable value, whichever is the lower. Cost is determined on the basis of constant average cost. The net realizable value is calculated on the basis of the current costs of the inventories at period end, less the estimated costs necessary for achieving the sale. The value of obsolete and slow-moving stock is written down in relation to the possible use or realization, by means of the provision of a specific materials obsolescence allowance. Inventories of work in progress and finished products are valued at weighted average manufacturing cost for the period, which comprises the raw materials, the consumables and the direct and indirect production costs excluding general expenses. Trade receivables – Trade receivables are recorded at par value, reduced by an appropriate writedown in order to reflect the expected realisable value. Financial assets – Financial assets are recorded and reversed from the financial statements and are initially valued at cost, inclusive of the charges directly associated with the acquisition. As of subsequent balance sheet dates, the financial assets which the Group intends and is able to hold until maturity are recorded at cost, amortised/depreciated on the basis of the effective interest rate method, net of the writedowns made in order to reflect any losses in value. Financial assets other than those held until maturity, are classified as held for trading purposes or available for sale and are valued at fair value at each period end, with recognition to the income statement or shareholders’ equity. Cash and cash equivalents – The item relating to liquid funds and cash equivalents includes cash and bank current accounts and deposits repayable on demand and other short-term financial investments with high liquidity which are readily convertible into cash and are subject to an insignificant risk regarding their change in value. Loans – Financial liabilities, with the exception of derivatives, are initially stated at cost, corresponding to the fair value of the liability net of the transaction costs which are directly attributable to the issue of said liability. Following the initial statement, financial liabilities are valued on the basis of amortised cost, using the original effective interest rate method. Employee leaving indemnity and other employee benefits – The liabilities relating to the defined-benefits plans (such as employee leaving indemnities - TFR) are calculated net of any assets serving the plan on the basis of actuarial suppositions and on an accruals basis in line with the employment services necessary for obtaining the benefits; the valuation of the liability is checked by independent actuaries. The gains and losses deriving from carrying out the actuarial calculation are charged to the income statement as a cost or revenue when the net cumulative value of the "actuarial" gains and losses not recorded for each plan at the end of the previous
Hera Group Consolidated Financial Statements as at 30 September 2007
59
accounting period exceeds by more than 10% the highest value among the obligations referring to defined benefit plans (known as the corridor method). Provisions for risks and charges – The provisions for risks and charges comprise the amounts set aside as recorded in the financial statements on the basis of current obligations (as emerging from past events) which the Group believes it probably will have to meet. The provisions are set aside on the basis of the best estimate of the costs required to meet the fulfilment, as of the balance sheet date, and are discounted back when the effect is significant and the necessary information is available. In such an event, the provisions are determined by discounting back the future cash flows at a pre-taxation discount rate which reflects the current market valuation and takes into account the risk associated with the business activities. When the discounting back is carried out, the increase in the provision due to the passing of time is recorded as a financial charge. If the liability is associated with an intangible asset (such as the recovery of sites), the provision is recorded as a matching entry to the asset to which it refers and the recording of the charge in the income statement takes place by means of the depreciation process of the tangible fixed asset to which the charge refers. Trade payables – These concern commercial supply transactions. Other current liabilities – These concern sundry transactions and are stated at par value. Derivative financial instruments – The Group holds derivative instruments for the purpose of hedging its exposure to the risk of interest rate fluctuations and the risk of changes in methane gas and electricity prices. In relation to said activities, the Group must handle the risks associated with the misalignment between the index-linking formulas relating to the purchase of gas and electricity and the index-linking formulas linked to the sale of said commodities. The instruments used for the handling price risk, both with regards to the price of the goods and the related Euro/Dollar exchange rate, are substantiated in commodity-swap agreements, aimed at pre-establishing the effects on the sales margins irrespective of the changes in the afore-mentioned market conditions. On a consistent basis with the chosen strategy, the Group does not enter into derivative transactions for speculative purposes. The transactions which, in observance of the risk management policies, satisfy the requisites laid down by the accounting standards for hedge accounting treatment are classified as “hedging”, while those which, despite being entered into for hedging purposes, do not satisfy the requisites required by the standards, are classified as “trading”. For registration purposes, the hedging transactions are classified as “fair value hedges” if they cover the risk of fluctuation in the market value of the underlying asset or liability; or as “cash flow hedges” if they cover the risk of changes in financial flows deriving both from an existing asset or liability, or from a future transaction.
Hera Group Consolidated Financial Statements as at 30 September 2007
60
As far as derivative instruments classified as fair value hedges are concerned, which observe the conditions for the accounting treatment as hedging transactions, the gains and losses deriving from the determination of their market value are booked to the income statement. The gains and losses deriving from the adjustment to fair value of the element underlying the hedge are also booked to the income statement. In relation to the instruments classified as cash flow hedges which observe the conditions for the accounting treatment as hedging transactions, the gains and losses deriving from the determination of their market value are booked to shareholders’ equity. The changes in the fair value of the derivative instruments which are not classified as hedging are recorded in the income statements for the period in which they occur. Grants – Capital grants are stated in the income statement over the period necessary for correlating them to the related costs; they are represented in the balance sheet by recording the grant as deferred revenue. Operating grants, including those received from users for connection purposes, are considered to be revenues for services carried out during the accounting period and are therefore recorded on an accruals basis. Revenue recognition - Revenues and income are stated net of returned items, discounts and rebates, and net of direct taxes related to the sales of products and services rendered. They are broken down into revenues deriving from operating activities and financial income which accrues between the sale date and the payment date. Specifically:
the revenues from energy, gas and water sales are recognised and recorded at the moment of the provision of the service and include the services provided but not yet invoiced (estimated on the basis of historical analyses determined according to previous consumption levels),
revenues from services rendered are recognised on the basis of services provided and in compliance with the relevant contracts,
revenues from the sale of goods are recognised at the time the Group transfers the significant risks and benefits associated with ownership of the assets to the purchaser,
Financial income and charges – Financial income and charges are recognised in accordance with the accruals principle. Translation of foreign currency balances – The functional and reporting currency adopted by the Hera Group is the Euro. Foreign currency transactions are initially recorded using the exchange rate in force as of the transaction date. Foreign currency assets and liabilities, with the exception of fixed assets, are recorded using the exchange rate in force as at the period end date and the related exchange gains and losses are duly charged to the income statement; any net gain which might arise, is set aside in a specific restricted reserve until the date of realization.
Hera Group Consolidated Financial Statements as at 30 September 2007
61
New IFRS and IFRIC interpretations Over the last few months the IASB and the International Financial Reporting Interpretations Committee (IFRIC) have issued new Standards and Interpretations. Even though, at present, said Standards and Interpretations are not yet obligatory, the Group is considering said aspects with regard to its financial and economic situation.
Financial risk management
As required by IAS 32, comments on the main aspects associated with financial risk management are provided below.
Market risk The Group is exposed to exchange rate risk and price risk, connected with the acquisition costs of raw materials and the determination of the sales tariffs. No financial instruments to hedge against said risk are available; hence the relative risk management policy falls within ordinary corporate management.
Credit risk The credit risk is associated above all with commercial transactions. However, the Group does not have any significant risk concentrations.
Interest rate risk Reference should be made to the specific section of the explanatory notes.
Significant estimates and valuations The preparation of this quarterly report required the directors to use estimates and valuations, with effects on the balance sheet figures, based on historical data and on the forecasts of specific events that should reasonably occur on the basis of currently available information. These estimates, by definition, are an approximation of the final figures. Hence the main areas characterised by valuations and assumptions that could give rise to variations in the values of assets and liabilities by the next accounting period are set forth below. Specific information is provided on the nature of these estimates and the assumptions on which they have been based; as regards the reference book values, reference should be made to the notes to the accounts.
Employee leaving indemnity The estimate of employee leaving indemnities calculations as at 30 September 2007 considers the effects of the amendments to the regulations, implemented by Law no. 296 of 27 December 2006 (Finance Bill 2007) and subsequent decrees and regulations issued in the first few months of 2007, as well as the indications provided by the Italian Standard Setter (OIC), the Italian Bankers' Association (ABI) and the National Council of Actuaries. Specifically, the provisions were restated at 31 December 2006, adopting the new methodological framework, i.e., applying the hypothesis that for all Group companies with
Hera Group Consolidated Financial Statements as at 30 September 2007
62
more than 50 employees, the quotas matured starting from 1 January 2007 were defined contribution benefit plans and thus, are not included in the calculation of the provisions. Where the provisions matured as at 31 December 2006 are treated as defined benefit plans according to the new regulations mentioned above, Thus curtailment, the item in the income statement which represents the impact of the reform on the calculation of the provisions as at 31 December 2006, was calculated as the difference between the provisions as at 31 December 2006 pre-reform and post-reform. Allocations to provisions for risks. These provisions have been made by adopting the same procedures as previous years and hence by referring to the updated reports of the legal counsel and the consultants following the disputes, as well as on the basis of developments in the related proceedings.
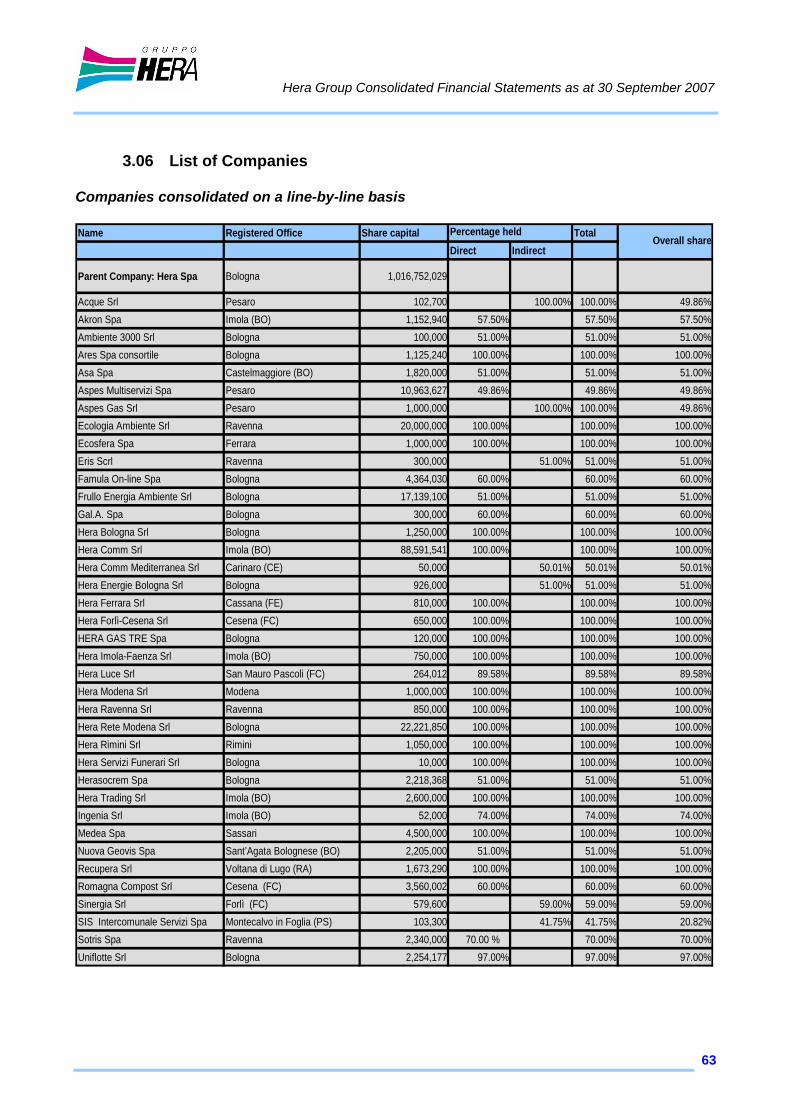
Hera Group Consolidated Financial Statements as at 30 September 2007
63
3.06 List of Companies
Companies consolidated on a line-by-line basis Name Registered Office Share capital Total
Direct Indirect
Parent Company: Hera Spa Bologna 1,016,752,029
Acque Srl Pesaro 102,700 100.00% 100.00% 49.86%Akron Spa Imola (BO) 1,152,940 57.50% 57.50% 57.50%Ambiente 3000 Srl Bologna 100,000 51.00% 51.00% 51.00%Ares Spa consortile Bologna 1,125,240 100.00% 100.00% 100.00%Asa Spa Castelmaggiore (BO) 1,820,000 51.00% 51.00% 51.00%Aspes Multiservizi Spa Pesaro 10,963,627 49.86% 49.86% 49.86%Aspes Gas Srl Pesaro 1,000,000 100.00% 100.00% 49.86%Ecologia Ambiente Srl Ravenna 20,000,000 100.00% 100.00% 100.00%Ecosfera Spa Ferrara 1,000,000 100.00% 100.00% 100.00%Eris Scrl Ravenna 300,000 51.00% 51.00% 51.00%Famula On-line Spa Bologna 4,364,030 60.00% 60.00% 60.00%Frullo Energia Ambiente Srl Bologna 17,139,100 51.00% 51.00% 51.00%Gal.A. Spa Bologna 300,000 60.00% 60.00% 60.00%Hera Bologna Srl Bologna 1,250,000 100.00% 100.00% 100.00%Hera Comm Srl Imola (BO) 88,591,541 100.00% 100.00% 100.00%Hera Comm Mediterranea Srl Carinaro (CE) 50,000 50.01% 50.01% 50.01%Hera Energie Bologna Srl Bologna 926,000 51.00% 51.00% 51.00%Hera Ferrara Srl Cassana (FE) 810,000 100.00% 100.00% 100.00%Hera Forlì-Cesena Srl Cesena (FC) 650,000 100.00% 100.00% 100.00%HERA GAS TRE Spa Bologna 120,000 100.00% 100.00% 100.00%Hera Imola-Faenza Srl Imola (BO) 750,000 100.00% 100.00% 100.00%Hera Luce Srl San Mauro Pascoli (FC) 264,012 89.58% 89.58% 89.58%Hera Modena Srl Modena 1,000,000 100.00% 100.00% 100.00%Hera Ravenna Srl Ravenna 850,000 100.00% 100.00% 100.00%Hera Rete Modena Srl Bologna 22,221,850 100.00% 100.00% 100.00%Hera Rimini Srl Rimini 1,050,000 100.00% 100.00% 100.00%Hera Servizi Funerari Srl Bologna 10,000 100.00% 100.00% 100.00%Herasocrem Spa Bologna 2,218,368 51.00% 51.00% 51.00%Hera Trading Srl Imola (BO) 2,600,000 100.00% 100.00% 100.00%Ingenia Srl Imola (BO) 52,000 74.00% 74.00% 74.00%Medea Spa Sassari 4,500,000 100.00% 100.00% 100.00%Nuova Geovis Spa Sant’Agata Bolognese (BO) 2,205,000 51.00% 51.00% 51.00%Recupera Srl Voltana di Lugo (RA) 1,673,290 100.00% 100.00% 100.00%Romagna Compost Srl Cesena (FC) 3,560,002 60.00% 60.00% 60.00%Sinergia Srl Forlì (FC) 579,600 59.00% 59.00% 59.00%SIS Intercomunale Servizi Spa Montecalvo in Foglia (PS) 103,300 41.75% 41.75% 20.82%Sotris Spa Ravenna 2,340,000 70.00 % 70.00% 70.00%Uniflotte Srl Bologna 2,254,177 97.00% 97.00% 97.00%
Percentage heldOverall share
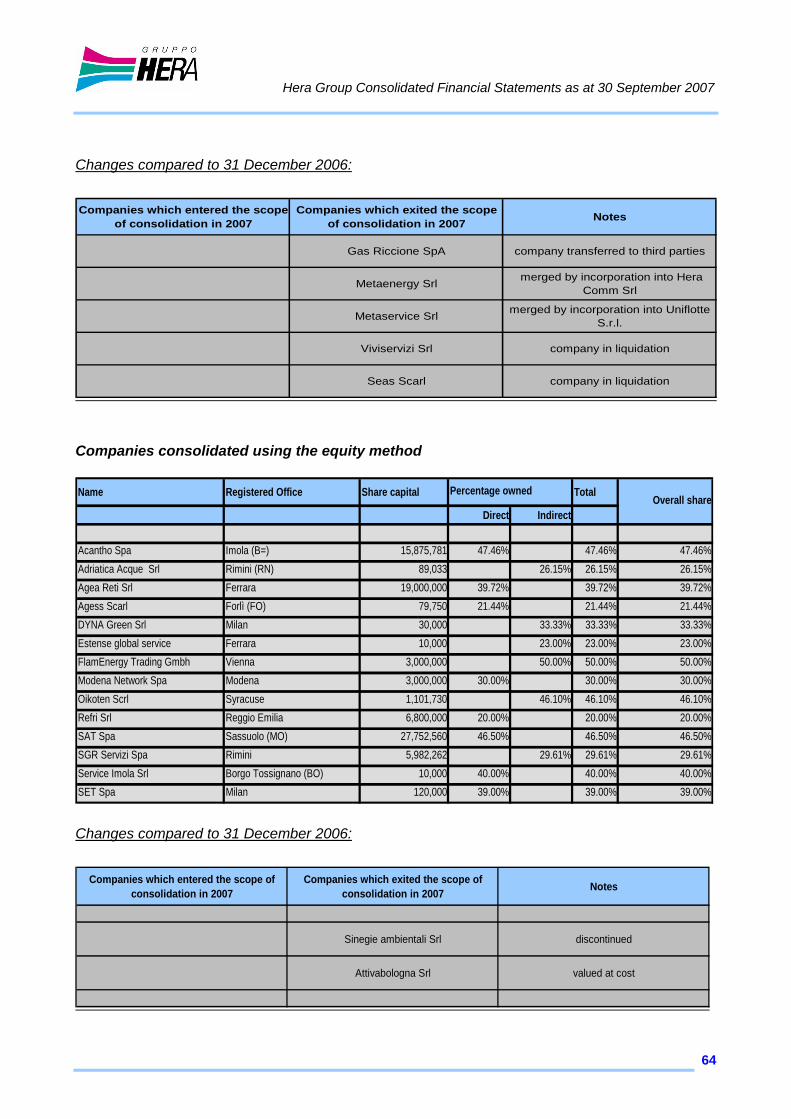
Hera Group Consolidated Financial Statements as at 30 September 2007
64
Changes compared to 31 December 2006: Companies which entered the scope
of consolidation in 2007Companies which exited the scope
of consolidation in 2007 Notes
Gas Riccione SpA company transferred to third parties
Metaenergy Srl merged by incorporation into Hera Comm Srl
Metaservice Srl merged by incorporation into Uniflotte S.r.l.
Viviservizi Srl company in liquidation
Seas Scarl company in liquidation
Companies consolidated using the equity method Name Registered Office Share capital Total
Direct Indirect
Acantho Spa Imola (B=) 15,875,781 47.46% 47.46% 47.46%Adriatica Acque Srl Rimini (RN) 89,033 26.15% 26.15% 26.15%Agea Reti Srl Ferrara 19,000,000 39.72% 39.72% 39.72%Agess Scarl Forlì (FO) 79,750 21.44% 21.44% 21.44%DYNA Green Srl Milan 30,000 33.33% 33.33% 33.33%Estense global service Ferrara 10,000 23.00% 23.00% 23.00%FlamEnergy Trading Gmbh Vienna 3,000,000 50.00% 50.00% 50.00%Modena Network Spa Modena 3,000,000 30.00% 30.00% 30.00%Oikoten Scrl Syracuse 1,101,730 46.10% 46.10% 46.10%Refri Srl Reggio Emilia 6,800,000 20.00% 20.00% 20.00%SAT Spa Sassuolo (MO) 27,752,560 46.50% 46.50% 46.50%SGR Servizi Spa Rimini 5,982,262 29.61% 29.61% 29.61%Service Imola Srl Borgo Tossignano (BO) 10,000 40.00% 40.00% 40.00%SET Spa Milan 120,000 39.00% 39.00% 39.00%
Percentage ownedOverall share
Changes compared to 31 December 2006:
Companies which entered the scope of consolidation in 2007
Companies which exited the scope of consolidation in 2007 Notes
Sinegie ambientali Srl discontinued
Attivabologna Srl valued at cost