helpingthe create a downtown event & transportation hub · create a downtown event &...
TRANSCRIPT

helping the City of Overland Park
create a downtown event & transportation hub
Final PresentationNovember 13, 2017

Project Summary & Goals
Background
• Recognize importance of Overland Park Farmers’ Market to the city’s downtown revitalization efforts and community identity
• Explore ways to improve Farmers’ Market while identifying other uses for pavilion
• Provide foundation for future capital investments
Goals
• Accommodate large downtown events such as the Farmers’ Market while minimizing disruption caused by limited parking
• Create a new or enhanced Market structure that permits growth, increases comfort for customers and vendors, and adds new amenities
• Expand transit service, enhance pedestrian connections to downtown businesses in order to promote greater downtown density, and encourage alternative transportation
• Test the economic feasibility of a more flexible event and community gathering facility in the current or alternate locations

Consultant Team• Market Ventures, Inc., Lead
– National consultants on public markets, farmers’ markets, and other food‐based economic development projects
– Ted Spitzer, President and Project Manager– Hugh Boyd, FAIA
• Vireo– Planning and design, with focus on alternative
transportation– Chad Potter, PLA– Ben Wagner, PLA
• Taliaferro & Browne– Urban planning, transit and transportation– Leonard Graham, PE, President– Mike Looney, PE– Quartney Taylor
118 William Street, Portland, ME 04103www.marketventuresinc.com
929 Walnut St., Kansas City, MO 64106www.bevireo.com
1020 E. 8th St, Kansas City, MO 64106www.tb‐engr.com

Scope of WorkPhase 1: Market Research & Analysis1. Farmers’ Market expansion
a) Advisory Committee meeting #1
b) Key informant interviews
c) Operational & financial analysis of current market
d) Resident internet survey
e) Economic & demographic analysis of OP trade area
f) Vendor & merchant focus groups
g) Analysis of competing markets
h) Advisory Committee meeting #2
2. Transportation & Parking Alternatives
a) Review existing studies & plans
b) Key informant interviews
c) Farmers’ market parking analysis
d) Transit analysis
3. Event Space
a) Competing facilities review
b) Key informant interviews
c) Demand potential
d) Comparison with public markets nationwide
e) Advisory Committee meeting #3
Phase 2: Design & Implementation4. Design Alternatives
a) Site analysis
b) Facility conceptual design
c) Site plan
d) Perspective sketch
e) Implementation strategy & final report
f) Public meeting
g) Advisory Committee meeting #4 & Council meeting

Advisory CommitteeThe Advisory Committee, selected by the City, met four times over the course of the study to:
Name, Title, Organization Category
Michael Billings, Owner, Buffalo Lodge Farmer/vendor
Jon Birkel, Director of Development, Hunt Midwest Developer
Robert Brassard, Director, Broadmoor Bistro/OP Public Schools Government
Sara Ebbers, Resident Resident
Frank Gieringer, Owner, Gieringer's Orchard Farmer/vendor
Marc Hansen, Principal Planner, Mid‐America Regional Council Government
Elaine Johnson, Owner, Harper's Fabric Business
Doug Johnson, Manager of GIS, Planning & Development Services, Overland Park Government
Laura Laiben, Owner, Culinary Center of Kansas City Business
Dana Markel, Executive Director, Visit Overland Park Nonprofit
Jack Messer, Director, Planning & Development Services, Overland Park Government
Clayton Prestwood, General Manager, The Other Place RestaurantKristina Stanley, Recreation Supervisor/Farmers' Market, Recreation Services, City of Overland Park Government
Kate Sweeten, Executive Director, Downtown Overland Park Partnership Nonprofit
Juan Trujillo, Owner, Kansas School of Classical Ballet Business
Bev White, Citizen Advisory Member Resident
1. Provide input into the research and analysis
2. Ensure all necessary perspectives were considered and be a conduit for constituent feedback
3. Review and help publicize the community internet survey
4. Understand the analysis and recommendations
5. Potentially become advocates for the plan

Market Research• Consultant team conducted a range of primary and secondary market research activities to
explore the potential for expanding or altering the Overland Park Farmers’ Market
• Key informant interviews were conducted with public officials, market vendors, downtown retailers and developers, and nonprofit leaders to ensure that various viewpoints and input were considered
• Site visits were made to observe the Overland Park Farmers’ Market in operation on both Saturday and Wednesday, and to observe other markets and event facilities in the area
• Community internet survey attracted 1,649 respondents from throughout the city– The survey explored residents’ satisfaction with existing food stores, utilization and satisfaction with
existing sources of local foods, ideas for improvements, and reactions to potential changes
• Trade area analysis explored demographic trends and food purchasing behavior in three trade areas (2 mile ring, 2‐6 mile band, and 6‐15 mile band) using data provided by Nielsen Claritas, a national data service provider
• Supply analysis sought to determine the potential for attracting additional vendors through key informant interviews, focus groups, and review of Farmers’ Market data

Operational and Financial Review
• Consultant team reviewed Farmers’ Market’s operations – Observations, interviews, information provided by Market management, and responses to
community internet survey
• Customer attendance– Steady growth over past five years (management hourly counts within Market)
– 2017 expected to be busiest year on record, despite challenges with parking and access due to downtown construction
– Based on five year linear trend, 2018 attendance should reach nearly 190,000 visitors
y = 10288x + 114634R² = 0.8566
‐
20,000
40,000
60,000
80,000
100,000
120,000
140,000
160,000
180,000
200,000
2012 2013 2014 2015 2016 2017 2018
AttendanceOverland Park Farmers' Market
Operational and Financial Review
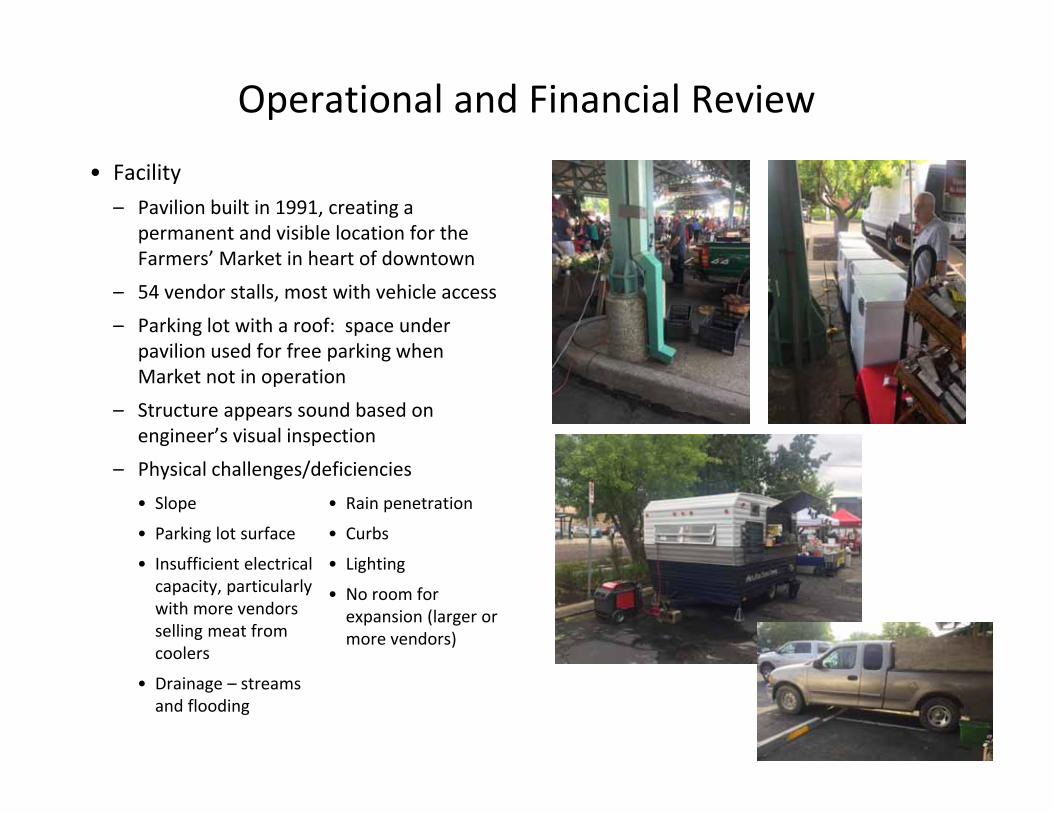
• Facility– Pavilion built in 1991, creating a
permanent and visible location for the Farmers’ Market in heart of downtown
– 54 vendor stalls, most with vehicle access
– Parking lot with a roof: space under pavilion used for free parking when Market not in operation
– Structure appears sound based on engineer’s visual inspection
– Physical challenges/deficiencies• Slope
• Parking lot surface
• Insufficient electrical capacity, particularly with more vendors selling meat from coolers
• Drainage – streams and flooding
• Rain penetration
• Curbs
• Lighting
• No room for expansion (larger or more vendors)

Operational and Financial Review• Schedule
– Saturdays, 7 am to 1 pm (April – Nov)– Wednesdays, 7:30 am to 1 pm (May – Sep)– Holiday Market – one Saturday in December– Interest in changing schedule
• Vendors opposed to longer hours (71% no)• Customer interest in extending hours past 1 pm
(market survey: 45% yes, 20% not sure)• Community survey found substantial interest in
extending hours, adding third day of operation (Sundays), adding evening hours, expanding the Market’s size, and enclosing part of the Market
0.0%
5.0%
10.0%
15.0%
20.0%
25.0%
30.0%
35.0%
40.0%
45.0%
Extend hours Add third day Add evening Expand size Enclose
Interest in ChangesOverland Park Community Survey
Not at all
Not very
Neutral
Somewhat
Extremely
0
200
400
600
800
1000
1200
Mon Tue Wed Thu Fri Sat Sun
Preferred Days of OperationOverland Park Community Survey

Operational and Financial Review
• Rules– Review found rules generally complete and clear– Suggest changing the vendor categories
• Create separate categories for “Specialty food vendor” and “Prepared food vendor”• Replace name “Specialty vendor” with “Nonfood vendor”• Consider charging higher fees for prepared foods
$‐
$10,000
$20,000
$30,000
$40,000
$50,000
$60,000
$70,000
$80,000
$90,000
$100,000
2011 2012 2013 2014 2015 2016 2017 2018
Annual RevenueOverland Park Farmers' Market
• Finances– Revenue
• Revenue increased every year since 2011 (average 6.1% per year)
• Based on revenue and customer growth, potential to expand the Market with more vendors or additional days
– Expenses• Market Manager and part‐time staff
positions funded through Recreation Services
• DOPP provides marketing and events ‐$30,000 annual budget

Operational and Financial Review• Vendors and product mix
– Strong focus on local farmers and diverse mix of products, reflecting community interest in buying directly from farmers (75% of 81 total vendors are farmers, while 22% are food and 3% specialty/nonfood)
– To ensure authenticity, management conducted 59 farm visits in 2016 (average 64 farm visits/year over past 5 years)
‐ 200 400 600 800 1,000 1,200
Buy direct from farmers
Freshness/quality
Atmosphere/location
Selection/variety
Music/entertainment
Vendors
Meeting friends/gathering place
Prices
Like Most at OP Farmers' MarketOverland Park Community Survey

Operational and Financial Review
• Changing the product mix– Resident interest in more fruits &
vegetables, baked goods, prepared foods, flowers/plants, and cheeses
– Management appropriately cautious when introducing new vendors so all have profit potential
– Nearly all vendors (>80%) return yearly
– No room to accommodate either larger stalls or more vendors, although strong produce vendors want more space
– Demand from new, qualified vendors but no space to accommodate them (22 vendors on waiting list)
0 0.5 1 1.5 2 2.5 3 3.5 4 4.5 5
Seafood
Milk/Dairy
Handmade arts/crafts
Chocolate/Candy
Poultry
Wine
Meats
Sweet baked
Prep food to go
Cheeses
Flowers/Plants
Prep food at Mkt
Savory baked
Fruits & vegetables
Additional Products (Mean)Overland Park Community Survey
Q22. If the Overland Park Farmers' Market expands and has room for more vendors and/or larger vendor stalls, what products would you like to see more of:

Operational and Financial Review
• Food access– Management runs token program to convert SNAP EBT (electronic food stamps) into usable Market currency
– Double Up Food Bucks (SNAP matching program) reduces the cost of fresh produce for low income shoppers
– Senior Farmers’ Market Nutrition Program provides coupons to eligible seniors (redeemable by Kansas farmers’ only)
– 2016 drop in SNAP and Senior Coupon redemptions because of late funding
– Opportunity to increase SNAP utilization with greater promotion and outreach
$25,151
$48,693 $49,368 $46,238
$26,225
$‐
$10,000
$20,000
$30,000
$40,000
$50,000
$60,000
2012 2013 2014 2015 2016
SNAP/DUFBOverland Park Farmers' Market
$10,074
$8,258
$5,310
$12,829
$4,898
$‐
$2,000
$4,000
$6,000
$8,000
$10,000
$12,000
$14,000
2012 2013 2014 2015 2016
SFMNPOverland Park Farmers' Market

Operational and Financial Review: Marketing
• Events – two events per market– Live music– Kids activities– Cooking demonstrations– Classes– Theme days
• Web site– City site (www.opkansas.org/things‐to‐see‐
and‐do/farmers‐market/) Suggestions for improvements: • Hours of operation • Parking information• Public transit information and links• Description about types of vendors• Listings of upcoming events• Customer testimonials
– DOPP (http://downtownop.org/market) • More informative than city website but subset of
organizational website
• Active social media– Facebook
• Over 30,000 followers• Posts about upcoming events
– Instagram – posts each Market– Twitter – posts/video twice per week
• Calendar listings• Online advertising• Banners and signs• Collateral materials
– Canvas shopping bags– T‐shirts– Cookbooks– Magnets– Buyers guide– Stickers
DOPP provides marketing services in coordination with Market management, using funds provided by the City of Overland ParkFarmers’ Market has a robust marketing program:

Market ResearchKey Informant Interviews
Name, Title, Organization CategorySean Barnard, Owner, Bambou Salon & Spa BusinessMelanie Colemand, Owner, TallulahBelle's BusinessKevin Cowan, Owner, Kevin Cowan Architects BusinessTim Crough, Owner, Move Right KC Fitness Studio BusinessTeresa Gebbett, Owner, Clock Tower Bakery BusinessKaren Greenwood, Community Engagement Director, 10,000 Villages BusinessElaine Johnson, Owner, Harper's Fabric* BusinessLaura Laiben, Owner, Culinary Center of Kansas City* BusinessJay Mackay, Owner, The Tasteful Olive BusinessJuan Trujillo, Owner, Kansas School of Classical Ballet* BusinessJon Birkel, Director of Development, Hunt Midwest* DeveloperPaul Goehausen, Principal, Goehausen & Co. DeveloperMike McKeen, Principal, EPC Apartments DeveloperHal Shapiro, Principal, Real Property Group DeveloperMichael Billings, Owner, Buffalo Lodge* Farmer/vendorDave Derr, Owner, Wiener Wagon Farmer/vendorGeorge Dragush, Owner (retired), Dragush Farm Farmer/vendorJohn Edmonds, Owner, Farmer/vendorFrank Gieringer, Owner, Gieringer's Orchard* Farmer/vendorLinda Hughes, Farmer, Jordy's Honey Farmer/vendorRobert Hughes, Farmer, Jordy's Honey Farmer/vendorQuinten Koetting, Owner, Dragonfly Gourmet Foods Farmer/vendorKrista Koetting, Owner, Dragonfly Gourmet Foods Farmer/vendorKate Matsch, Owner, Ibis Bakery Farmer/vendorJill McEnroe, Owner, Frannie Franks Coffee Cakes Farmer/vendorEdith Palmberg, Farmer, Thane Palmberg Orchard Farmer/vendorAustin Reynolds, Owner, Green Thumbs Up Farmer/vendorCherie Schenker, Owner, Schenker Farms Farmer/vendorKevin Schenker, Owner, Schenker Farms Farmer/vendorJon Umsted, Owner, Yummylicious Cookie Company Farmer/vendorJoli Winer, Farmer, Heartland Honey Farmer/vendorRobert Brassard, Director, Broadmoor Bistro/OP Public Schools* GovernmentBill Ebel, City Manager, City of Overland Park GovernmentTerry Happer‐Scheier, City Councilmember, City of Overland Park GovernmentDave Janson, City Councilmember, City of Overland Park GovernmentDoug Johnson, Manager of GIS, Planning & Development Services, Overland Park* GovernmentPaul Lyons, City Councilmember, City of Overland Park GovernmentJack Messer, Director , Planning & Development Services, Overland Park* GovernmentKristina Stanley, Farmers' Market Manager, Recreation Services, City of Overland Park* GovernmentAngi Hejduk, CEO, InterUrban Art House NonprofitDana Markel, Executive Director, Visit Overland Park* NonprofitSara Ebbers, Resident, * ResidentBev White, Citizen Advisory Member, * ResidentRenee Kelly, Owner, Renee Kelly's Harvest RestaurantClayton Prestwood, General Manager, The Other Place* RestaurantCarl Thorne‐Thompson, Owner, Story Restaurant Restaurant
* Advisory Committee members
• Quasi‐structured key informant interviews were conducted early in the research process to understand different perspectives on the farmers’ market, events, downtown retail and development, parking, transportation, and other planning issues.
• Information from the interviews shaped the design of the community internet survey and focus groups, and informed the research and analysis

Market ResearchCommunity internet survey
• Survey instrument utilized a question set that MVI has refined on other similar projects, altered to fit needs of Overland Park
• Survey available on‐line from June 29 – July 17, 2017, promoted by local project team via press releases, email blasts, and social media
• 1,649 respondents, 96% primary shoppers for fresh foods in their households
• Self‐selected respondents so not a random sampling of the population, but large dataset suggests that responses reflect a large proportion of area residents
• Large number of responses allows exploration of how different groups perceive and experience food shopping and the OP Farmers’ Market, including nonshoppers

Market ResearchTrade area analysis
• Trade area analysis explored characteristics of people living in and around Overland Park in order to identify demographic trends that might impact the Market
• Trade areas1. Two mile radius: area where the market is easily accessible, including for people without cars, and a
very convenient place to shop for fresh foods
2. Band between 2 and 6 miles: band around the first area that is reasonably convenient but where there are other places to purchase similar products
3. Band between 6 and 15 miles: band around the second area that is not convenient but which can attract a small percentage of customers who appreciate the unique market environment and product offerings

Trade Areas: 2 mile ring• Low projected population growth (data misses new
downtown residential developments, which will likely attract higher income, empty‐nesters)
• Very small households and low percent family households – typically lower spending customers
• Slightly above average median age (38.7)
• High median but below average household income; below average expected growth
• Nearly 8,000 households with income above $75,000 – strong target for Farmers’ Market
• 1,615 households with income below $15,000
• Very high educational attainment: 15,875 adults with college or higher degrees – key indicator of interest in farmers’ markets
• Conclusions: new downtown residents potential customers for farmers’ market; highly educated residents typically strong market shoppers
Demographics 2 m ring
Population 2010 census 48,290
Population 2017 estimate 48,984
Population 2022 projection 49,681
Population change 2010-2017 (%) 1.4%
Population change 2017-2022 (%) 1.4%
Population change 2017-2022 697
Racial diversity (% non-white) 18.9%
Percent Hispanic 2016 12.0%
Households 2017 22,938
Households 2022 23,557
Household change 2017-2022 2.7%
Average household size 2.11
Family households 2017 12,723
Family households 2017 55.5%
Median household income 2017 $58,360
Average household income 2017 $73,107
Average household income 2022 est $77,475
Change HH income 2017-2022 6.0%
Household income >$75,000/yr 7,862
Household income >$75,000/yr (%) 34.3%
Median age 2017 38.7
Median age 2022 39.2
Resident age 35-64 19,032
Targeted age range (35-64) 38.9%
Residents with bachelor's or higher 15,875
Bachelor's Degree 28.9%
Master's, Professional or Doctorate 16.0%
No Vehicles 4.6%
Transportation to work - bus 2017 0.7%
Transportation to work - bicycle 2017 0.2% Source: Claritas 2017

Trade Areas: 2‐6 m band
• Substantial population but low projected growth
• High median age
• Small household size and below average percentage of family households
• Highest household incomes, well above national average, although below average expected growth
• 44% of households have income above $75,000 (~60,000 households)
• Highest educational attainment of three trade areas; ~109,000 adults with bachelor’s degree or higher
• Conclusions: Opportunity to grow customer base with highly educated, high income residential base but low projected population growth
Demographics 2-6 m band
Population 2010 census 298,822
Population 2017 estimate 304,065
Population 2022 projection 308,882
Population change 2010-2017 (%) 1.8%
Population change 2017-2022 (%) 1.6%
Population change 2017-2022 4,817
Racial diversity (% non-white) 19.9%
Percent Hispanic 2016 9.0%
Households 2017 136,611
Households 2022 140,026
Household change 2017-2022 2.5%
Average household size 2.19
Family households 2017 79,316
Family households 2017 58.1%
Median household income 2017 $66,223
Average household income 2017 $93,606
Average household income 2022 est $100,078
Change HH income 2017-2022 6.9%
Household income >$75,000/yr 59,798
Household income >$75,000/yr (%) 43.8%
Median age 2017 39.8
Median age 2022 41.0
Resident age 35-64 119,560
Targeted age range (35-64) 39.3%
Residents with bachelor's or higher 108,933
Bachelor's Degree 31.0%
Master's, Professional or Doctorate 19.1%
No Vehicles 5.1%
Transportation to work - bus 2017 0.9%
Transportation to work - bicycle 2017 0.3% Source: Claritas 2017

Trade Areas: 6‐15 mile band, total
• Large area with large and growing population
• Racially diverse
• Slightly below average household size and family households
• Slightly below average household incomes but growing quickly
• ~112, 000 upper income households, 35% of population
• Many households with income <$15,000 (44,656 or 14%)
• Above average educational attainment; ~178,000 adults with bachelor’s or higher
• Conclusions: Growing, well educated population provides opportunity to expand customer base or create a new farmers’ market facility elsewhere in Overland Park; opportunity for Sunday market because more leisure time than weekdays
Demographics 6-15 m band Total USA
Population 2010 census 785,514 1,132,626
Population 2017 estimate 831,505 1,184,554
Population 2022 projection 861,158 1,219,721
Population change 2010-2017 (%) 5.9% 4.6% 5.3%
Population change 2017-2022 (%) 3.6% 3.0% 3.8%
Population change 2017-2022 29,653 35,167
Racial diversity (% non-white) 36.6% 29.7%
Percent Hispanic 2016 13.2% 18.0%
Households 2017 320,486 480,035
Households 2022 332,344 495,928
Household change 2017-2022 3.7% 3.3% 4.0%
Average household size 2.45 2.55
Family households 2017 207,190
Family households 2017 64.6% 66.4%
Median household income 2017 $52,149 $56,156
Average household income 2017 $76,329 $80,853
Average household income 2022 est $82,419 $87,464
Change HH income 2017-2022 8.0% 8.2%
Household income >$75,000/yr 111,784 179,444
Household income >$75,000/yr (%) 34.9% 37.4%
Median age 2017 36.0 38.2
Median age 2022 39.2
Resident age 35-64 321,383 459,975
Targeted age range (35-64) 38.7% 39.5%
Residents with bachelor's or higher 177,914 302,722
Bachelor's Degree 21.2% 18.4%
Master's, Professional or Doctorate 11.8% 11.2%
No Vehicles 8.6%
Transportation to work - bus 2017 2.1%
Transportation to work - bicycle 2017 0.3% Source: Claritas 2017

Trade Area Analysis
$0
$10,000
$20,000
$30,000
$40,000
$50,000
$60,000
$70,000
$80,000
$90,000
$100,000
2 m ring 2‐6 m band 6‐15 m band USA
Ave household income 2017Overland Park Trade Areas
0.0%
10.0%
20.0%
30.0%
40.0%
50.0%
60.0%
2 m ring 2‐6 m band 6‐15 m band USA
Educational AttainmentOverland Park Trade Areas
Bachelor's Degree Master's, Professional or Doctorate

Trade Area Analysis
Source: Claritas 2017
Consumer Expenditures: Food & Beverage, Overland Park
2.0 m ring 2017 Estimate 2022 Projection Δ $ Δ %Market categories (000s) (000s) (000s)Bread $3,594 $3,693 $99 2.8%Dairy $7,926 $8,279 $353 4.5%Cheese $3,394 $3,548 $154 4.5%Meat $11,323 $11,806 $483 4.3%Poultry $3,231 $3,366 $135 4.2%Prepared foods $4,213 $4,379 $166 3.9%Produce - fresh $10,700 $11,181 $481 4.5%Seafood - fresh $1,227 $1,271 $44 3.6%Specialty food $6,927 $7,230 $303 4.4%Sweets (candy) $2,406 $2,501 $95 3.9%Coffee/Tea $2,758 $2,886 $128 4.6%Wine/Beer $5,371 $5,567 $196 3.6%Total $63,070 $65,707 $2,637 4.2%
All Food at Home $87,732 $91,526 $3,794 4.3%
Lunch - Fast Food $8,572 $8,803 $230 2.7%
Lunch - Full Service $7,748 $7,996 $247 3.2%
Dinner - Fast Food $8,984 $9,260 $276 3.1%
Dinner - Full Service $17,900 $18,509 $609 3.4%All Food Away Home $54,275 $56,054 $1,779 3.3%
Consumer Expenditures: Food & Beverage, Overland Park
2.0-6 mile band 2017 Estimate 2022 Projection Δ $ Δ %Market categories (000s) (000s) (000s)Bread $22,707 $23,364 $657 2.9%Dairy $49,621 $51,900 $2,279 4.6%Cheese $21,392 $22,453 $1,061 5.0%Meat $71,915 $74,910 $2,995 4.2%Poultry $20,708 $21,494 $786 3.8%Prepared foods $26,871 $28,007 $1,136 4.2%Produce - fresh $68,964 $72,174 $3,210 4.7%Seafood - fresh $8,323 $8,636 $313 3.8%Specialty food $43,924 $45,907 $1,983 4.5%Sweets (candy) $15,304 $15,922 $618 4.0%Coffee/Tea $17,510 $18,368 $858 4.9%Wine/Beer $35,861 $37,182 $1,321 3.7%Total $403,100 $420,317 $17,217 4.3%
All Food at Home $555,111 $579,207 $24,096 4.3%
Lunch - Fast Food $54,328 $55,745 $1,417 2.6%
Lunch - Full Service $51,133 $53,051 $1,917 3.7%
Dinner - Fast Food $55,967 $57,599 $1,632 2.9%
Dinner - Full Service $120,166 $124,664 $4,498 3.7%
All Food Away Home $353,755 $365,974 $12,219 3.5%
• Charts show estimated annual sales of fresh and prepared foods, derived from national consumer expenditure surveys applied to local demographics

Trade Area Analysis
Source: Claritas 2017
Consumer Expenditures: Food & Beverage, Overland Park
6-15 mile band 2017 Estimate 2022 Projection Δ $ Δ %Market categories (000s) (000s) (000s)Bread $53,546 $55,932 $2,386 4.5%Dairy $117,941 $125,304 $7,363 6.2%Cheese $47,708 $50,815 $3,107 6.5%Meat $180,486 $191,180 $10,694 5.9%Poultry $55,026 $57,920 $2,894 5.3%Prepared foods $61,378 $64,984 $3,606 5.9%Produce - fresh $158,686 $169,104 $10,418 6.6%Seafood - fresh $19,742 $20,808 $1,066 5.4%Specialty food $101,294 $107,437 $6,143 6.1%Sweets (candy) $34,393 $36,253 $1,860 5.4%Coffee/Tea $38,999 $41,611 $2,612 6.7%Wine/Beer $72,759 $76,886 $4,127 5.7%Total $941,958 $998,234 $56,276 6.0%
All Food at Home $1,323,035 $1,401,375 $78,340 5.9%
Lunch - Fast Food $125,269 $130,699 $5,431 4.3%
Lunch - Full Service $101,010 $107,364 $6,354 6.3%
Dinner - Fast Food $132,718 $138,578 $5,860 4.4%
Dinner - Full Service $236,170 $250,183 $14,013 5.9%
All Food Away Home $749,026 $789,308 $40,282 5.4%
Total Fresh/Specialty Food (3 Trade Areas) $1,408,128 $1,484,258 $76,130 5.4%
All Food at Home $1,965,878 $2,072,108 $106,230 5.4%All Food Away Home $1,157,056 $1,211,337 $54,281 4.7%
• Over $14 million growth in demand for fresh produce over next five years within three trade areas
• Similarly high expected growth for meat, poultry, cheese, dairy, and other products that can be sold at the Farmers’ Market
• Overland Park Farmers’ Market need only capture a small fraction of increased demand to substantially grow farmer sales and provide the basis for expansion

Poverty and Food Assistance• Over 34,000 people in poverty in Johnson County• Number of SNAP (food stamp) recipients declining
but still historically high • Average monthly SNAP benefit in Kansas is ~$114
per participant – insufficient for healthy diet• SNAP/Double Up Food Bucks
– $26,225 redeemed at OPFM in 2016 – Peak $49,368 in 2014
• Senior Farmers’ Market Nutrition Program coupons – $4,898 redeemed at OPFM in 2016– Peak $12,829 in 2015
• Market management and community partners can encourage more low income consumers to shop at Farmers’ Market using Double Bucks and other coupon programs, plus increased outreach efforts
Source: https://fred.stlouisfed.org/series/CBR20091KSA647NCEN, accessed 8/9/2017

Competition – Farmers’ Markets near OP
Source: USDA National Farmers’ Market Directory
• While the Overland Park Farmers’ Market is consistently rated as the best farmers’ market in Kansas, other farmers’ markets have been established in surrounding communities
• Given its size and growth, the City of Overland Park should consider establishing a farmers’ market in the city’s southern section, where few farmers’ markets are located

Competition – Nearby Public Markets• City Market, Kansas City
– Historic, large scale public market district with mix of fresh, specialty and prepared food vendors and restaurants
– Recent repositioning to utilize historic sheds for regional farmers only
– All sheds have added garage doors
– Robust event programming
– New trolley and plans for expanded parking
• Lenexa Public Market– New indoor food hall on lower level of city
hall, opened September 2017
– Primarily prepared foods (3 of 5 vendors)
– Demonstration kitchen and event space on market hall mezzanine
– Small outdoor farmers’ market on plaza adjacent to city hall, with farmers parked inside garage
– Should not be a threat to Overland Park Farmers’ Market due to small size and prepared food focus
Competition ‐ Supermarkets
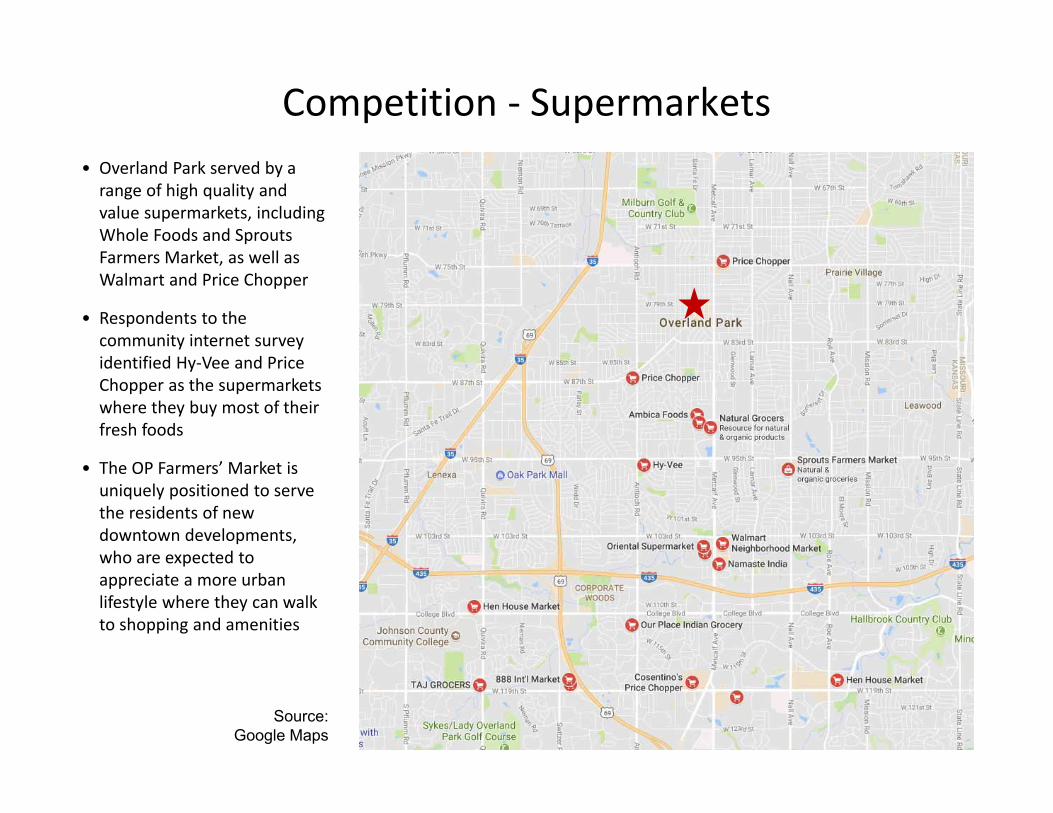
Source: Google Maps
• Overland Park served by a range of high quality and value supermarkets, including Whole Foods and Sprouts Farmers Market, as well as Walmart and Price Chopper
• Respondents to the community internet survey identified Hy‐Vee and Price Chopper as the supermarkets where they buy most of their fresh foods
• The OP Farmers’ Market is uniquely positioned to serve the residents of new downtown developments, who are expected to appreciate a more urban lifestyle where they can walk to shopping and amenities

Parking Analysis: Challenges
• Nearly all community internet survey respondents typically drive to the Farmers’ Market (91%) or walk (8%); <1% ride bicycles and no ride a bus
• “Difficulty parking” identified as the most common reason that respondents have not visited the Farmers’ Market recently
• Many respondents feel parking is inconvenient because it took too long to find a space (28%) or their parking space is too far away (9%)
• Market management notices more customers needing handicap parking spaces, which should be very close by
• Drivers loiter in nearby parking lots while waiting for a free parking space
• Overland Park Downtown Parking Plan 2014 found “ease of finding a parking space” the most important consideration for visiting downtown
Q8. How do you typically get to the Overland Park Farmers' Market? (N=1,464)
Drive90%
Drive in other's car
1% Walk8%
Bicycle1%
Bus0%
How travel to Farmers' MktOverland Park Community Survey

Parking Analysis: Supply• OP Downtown Parking Plan 2014
– 80% of parking is off‐street; 20% on‐street
– 69% of off‐street parking is private– Recommended creating 185 new on‐
street spaces – construction underway on 45 spaces
– While lots adjacent to OPFM at or near capacity during Saturday Markets, total utilization of downtown parking only 50‐60% at peak
– Plan concludes that downtown has near adequate supply of parking spaces but drivers unaware of available inventory
• Parking management– No street parking or public lots are paid
or metered– Time constraints posted on some spaces– No parking enforcement division; police
respond to complaints, don’t monitor
• New downtown developments– Five new residential developments under
construction or imminent– Collectively building 1,103 parking spaces
• Required to provide one space per unit, plus shared spaces
• 66 shared off‐street spaces• 90 shared on‐street spaces
– New downtown residents might increase demand for shared spaces if households have more than one car

Parking Analysis: Supply
• Handicap accessible spaces– 43 accessible spaces in
downtown– Market customers require
accessible spaces adjacent to the pavilion
• 200’ radius is ideal for drivers with limited mobility
• 500’ radius a comfortable distance for able‐bodied customers– Parking lots across Marty Street
from Farmers’ Market– On‐street parking on Santa Fe
Drive and 80th Street
• 800’ more demanding but acceptable distance for some customers
• New on‐street parking proposed for 79th Street, Santa Fe Drive, Foster, and Conser

Parking Analysis: Supply
Maximum Distance from Market (ft)
Existing Public Parking Spaces*Available Public Parking Spaces
New Parking Spaces
*Potential Available Public Parking Spaces
Off‐street On‐Street
200 166 0 86 0 86
500 280 125 325 70 395
800 373 274 567 131 698
>800 691 462 1,073 195 1,268
Total: 691 462 1,073 195 1,268
Summary of Available Public Parking Spaces
*Less 80 spaces used by vendors
• Each row includes the previous rows• “New parking spaces” are spaces being created as part of new downtown developments• Nearly 400 spaces available within 500’ of pavilion on Market days• Survey completed June 2017

Parking Analysis: Demand• Farmers’ Market peak parking demand
– Peak demand occurs typically between 10 am and noon on Saturdays
– Peak in 2017: 841 customers in one hour (source: management count on July 1, 2017)
– Based on 2.1 visitors per vehicle (source: MVI research at other farmers’ markets) and 91% who drive (source: community internet survey), peak parking demand = 364 cars
• Other sources of demand– Downtown employees and customers
• Highest conflicts on Saturday mornings in fall when local restaurants host college football viewing
– Residents – parking demand might grow with new residential developments
– Non‐farmers’ market demand estimated at 20% of available spaces on Saturdays and 60% on weekdays (source: City of Overland Park)
• Summation– Within 500’ of pavilion: 395 total spaces – 79 for other users (20%) = 316 available for
Market shoppers
– Existing inventory within 500’ supplies 87% of peak demand; 48 space deficit
– Expanded pavilion and increased popularity could lead to higher parking demand
– 20% growth would result in peak demand of 437 spaces, creating a deficit of 121 spaces

Potential Parking Strategies
1. Provide more shared parking– Overland Park Presbyterian Church at 8029 Overland
Park Drive (37 spaces)– Unpaved lot north of Presbyterian Church (~50 spaces)
2. Encourage parking >500 feet from pavilion– Wayfinding signage– Parking information on web sites or mobile app
3. Parking meters– Adding costs and limits will encourage some customers
to park further away– Requires parking enforcement
4. Valet parking– Create a valet parking stand at the Clock Tower on
Santa Fe Drive or Marty Street, but spaces still needed within reasonable vicinity for valet drivers
5. Shuttle service– Shuttle bus or van could utilize outlying parking lots– KCATA or private provider could provide shuttle service

Potential Parking Strategies
6. Product drop‐off zone– A manned drop‐off zone would make it easier for
customers to park further away and retrieve their purchases adjacent to the pavilion
– Market’s site managers could locate their information table adjacent to the drop‐off zone
7. Parking garage– A new multistory parking garage could be created at the
pavilion site or nearby
– Self‐driving cars might lead to reduction in parking demand, could drop off riders at Market and then self‐park in outlying areas
8. Manned lot with increased accessible spaces– Meet growing demand for handicap spaces
– Restrict parking adjacent to the pavilion to handicap plates only, along with the product drop‐off zone
– Model: Rochester Public Market provides only handicap spaces adjacent to pavilions, runs a product pick‐up zone
Product pick up at Rochester Public Market

Parking Recommendations
• Address parking at current site with:– Create monitored handicap parking and
product pick‐up zone adjacent to pavilion
– Increase information about available parking in downtown
– Incentive more shoppers to walk and bicycle
– Encourage customers to shop before or after peak times
– Extend Market’s closing time by one hour to spread out parking demand
– Complete new on‐street parking from 2014 Parking Plan
• Monitor impact of new residential development to see if parking availability diminishes when buildings are tenanted
• New private development south of 80th Street might provide parking deck available to public on weekends – would solve parking deficit within 500’ radius

Parking Analysis: Supply (Santa Fe Commons)
• Very limited customer parking within 200’ radius of proposed pavilion – will need to be dedicated to handicap parking
• Only one parking lot within 500’ radius and limited on‐street parking
• Additional lots within 800’, including current pavilion site and lot at Matt Ross Community Center
• Residential area south of park not included in analysis but has street parking, which might be resisted by residents

Parking Analysis: Supply (Santa Fe Commons)
Maximum Distance from Market (ft)
Existing Public Parking Spaces*Available Public Parking Spaces
New Parking Spaces
*Potential Available Public Parking Spaces
Off‐street On‐Street
200 11 42 ‐27 31 4
500 81 136 137 34 171
800 317 285 522 70 592
>800 691 462 1,073 195 1,268
Total: 691 462 1,073 195 1,268
Summary of Available Public Parking Spaces
*Less 80 spaces used by vendors
• Supply does not include available on‐street parking in residential area south of park• Currently inadequate supply with 500’ to meet demand for Farmers’ Market (171 spaces
compared to demand for 364 spaces, deficit of 193 spaces)• New public or private parking structure near park needed to meet demand

Public Transit
• Existing bus routes– Routes 401 and 404 service
bus stop at Marty Street adjacent to pavilion and at Matt Ross Community Center
– Route 475 travels east‐west along 75th Street
– Route 482 Flex: shuttle service from Overland Park Towers
– 402 and 475 are 2016 expansions
– KCATA anticipates transit growth but does not collect ridership data for these routes
– Bus service focused on weekday peak service
– No bus service on Saturdays; none planned for several years

Public Transit• Community internet survey
– Less than 1% of respondents had ever taken a bus to the Farmers’ Market– 77% said nothing would make them more likely to take a bus– Bus stops closer to their home, Saturday service, and more frequent service all were
suggestions for making it more likely to ride a bus to the Market
• Farmers’ market unlikely to create substantial new demand for bus ridership
Q13. What would make you more likely to ride a bus to the Farmers’ Market? (multiple answers permitted)
1%
7%6%
14%
2%
0%
2%
4%
6%
8%
10%
12%
14%
16%
Delivery service Add Sat service More frequent service Bus stop closer tohome
Lower fares
What make it more likely to use busOverland Park Community Survey

Alternative Transportation: Bicycle Plan
• City of Overland Park implementing recommendations from the Safe Bicycle Use Outreach Project, including lane markings and links to regional bike corridors

Alternative Transportation: Biking• Few bicycles observed at Market• 6% of respondents to community survey
had ever ridden a bicycle to the Market• 71% said nothing would make them more
likely to bike• Bike lanes and bike parking could
encourage more biking to the Market
• Overland Park currently adding bike lanes to downtown area
• Bike parking should be added adjacent to pavilion
• Incentive program (such as $5 Market Bucks or raffle) would encourage walking or biking
Q11. What would make you more likely to ride a bicycle to the Farmers’ Market? (multiple answers permitted)
14%
11%
6%
3%
0%
2%
4%
6%
8%
10%
12%
14%
16%
Bike lanes Bike parking Bike sharing Delivery service
What make it more likely to ride bikeOverland Park Community Survey
• Bicyclists at Rochester Public Market• Bicycle promo program has weekly raffle drawing• http://www.cityofrochester.gov/biketomarket/

Alternative Transportation: Biking• Recommendations
– Provide bike parking at the pavilion. Coordinate with Interurban Arts Center effort to add artistic bicycle racks in downtown
– If the city implements a B‐Cycle/bike share program, install a shared bike rack close to the Farmers’ Market pavilion (either adjacent to the bus stop on Marty Street as part of the mobility hub or in Santa Fe Commons)
– Add signage and wayfinding to direct bicyclists to the Farmers’ Market
– Implement an incentive program to encourage more people to bike to the Farmers’ Market, such as the raffle and promotion program at the Rochester Public Market

Alternative Transportation: Walking• 21% of respondents to community internet
survey had ever walked to the Market• 70% said nothing would make them more
likely to walk• Improved sidewalks and crosswalks could
encourage more walking to the Market
• 80th Street undergoing substantial construction – will have improved sidewalks and crosswalks when complete
• Incentive program (such as $5 Market Bucks or raffle) could encourage walking
Q15. What would make you more likely to walk to the Farmers’ Market? (multiple answers permitted)
10%
7% 6%
0%
2%
4%
6%
8%
10%
12%
Improved sidewalks Improved crosswalks Delivery service
What make it more likely to walkOverland Park Community Survey

Alternative Transportation: Walking• Recommendations
– Improve existing sidewalks and ramps to meet current accessibility standards and increase safety and mobility
– Develop new sidewalks and accessible ramps that connect proposed parking improvements to the Market location
– Develop pedestrian connections that capitalize on planned 80th Street pedestrian improvements, including planned, improved crosswalk at 80th & Metcalf
– Improve pedestrian and amenity zones near the Market to promote uniformity and aesthetics
– Add signage and wayfinding to direct visitors to the Market

Mobility Hub• Mid‐America Regional Council recommends
creation of mobility hubs in its Smart Moves 3.0 Regional Transit Plan
• Potential components of a multi‐modal hub in downtown Overland Park– RideKC bus– RideKC Freedom On‐Demand– Bike share rentals and bike parking– Car share– Electric charging stations
• Potential location: Marty Street parking lot across street from Farmer’s Market pavilion– Bus stop already in place– Near new downtown residential developments –
potential users of transit and share services– Split‐level parking garage option could provide
covered bike parking

Event Spaces• Farmers’ Market pavilion does not work for many events because of the slope, the
parking lot environment, and the lack of enclosed space
• Farmers’ market pavilions in other cities (examples follow) have been designed for multiple uses, which provide additional income sources and leverage the asset
• City of Overland Park currently lacks large, flexible, indoor/outdoor event spaces
– Public event rental facilities available at Matt Ross Community Center, Tomahawk Ridge Community Center, Arboretum & Botanical Gardens, Deanna Rose Children’s Farmstead
– 13 parks have shelters with grills that can be reserved
Prairie Pavilion at Deanna Rose Children’s Farmstead accommodates 150 people
– City receives requests for larger scale events such as class reunions that would be better served in a larger, enclosable pavilion

Event Spaces – National Models• Grand Rapids Downtown Market
– Market shed• Food and ethnic festivals
• Dances
• Private parties and weddings
• Makers’ Market and Vintage Market
• Drink & Play Wednesday
• Ice Bar
• Cars & Coffee, Meet the Machines car and truck shows
– Other event spaces within Downtown Market• Rooftop greenhouse
• Large event room with demonstration kitchen
• Rooftop veranda
• Hands‐on teaching kitchen
• Shared commercial kitchen
• Meeting rooms

National Models• Rochester Public Market
– Food truck rodeo
– Concerts (portable stage)
– Community Garage Sale
– Flower Days at the Market
– Artists Row
• City Market, Kansas City– Historic sheds used for weddings, car
shows
– Enclosable shed allows indoor winter events

National Models• Eau Claire (WI) Farmers’ Market
– Located in downtown park along Chippewa River
– Used for weddings and festivals
– Attractive structure with stone and wood piers, wood decking, and skylights

Focus Groups
• Based on market research, observations, national models, and analysis, consultant team tested a variety of potential redevelopment and improvement concepts with four focus groups
• Focus groups– Farmers’ Market vendors
– Downtown merchants
– Community residents
– City staff connected with Farmers’ Market
• Discussions organized around nine opportunities for altering the operation, location or facility– Posters created for each of nine opportunities
– Dot voting with green dots (good idea), yellow dots (maybe), and red dots (bad idea)
– Following description of each opportunity, participants given three each green, yellow and red dots to place on the posters
– Group discussed each opportunity: why participants chose where to place dots and thoughts about each concept
– The following pages contain each poster’s content

Focus Group Opportunity 1
Leave the Farmers’ Market As It IsThe Farmers’ Market isn’t broke, so don’t fix it. However, the Market needs to be regularly maintained. Maintenance items might include:
1. Paint2. Address rain and drainage3. Upgrade the electrical system to
handle vendor equipment4. Improve lighting5. Repave and stripe6. Expand Wifi7. Improve/expand bathrooms8. Add a public address system9. Create a designated pick‐up zone10. Add a system so vendors can
hang their signs
Focus Group Opportunity 2
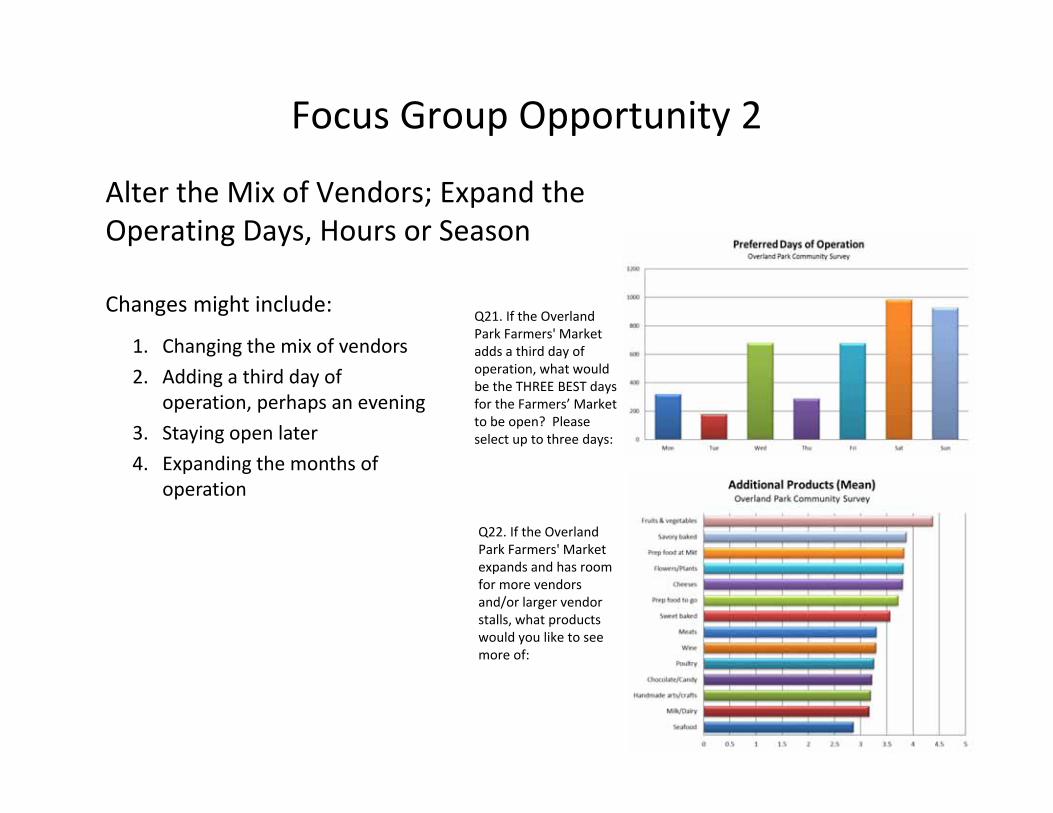
Alter the Mix of Vendors; Expand the Operating Days, Hours or Season
Changes might include:
1. Changing the mix of vendors2. Adding a third day of
operation, perhaps an evening3. Staying open later4. Expanding the months of
operation
Q22. If the Overland Park Farmers' Market expands and has room for more vendors and/or larger vendor stalls, what products would you like to see more of:
Q21. If the Overland Park Farmers' Market adds a third day of operation, what would be the THREE BEST days for the Farmers’ Market to be open? Please select up to three days:

Focus Group Opportunity 3
Enclose Part of the Farmers’ MarketFor better weather protection and to extend the selling season, garage doors might be added to some or all of the existing Farmers’ Market pavilion. If the pavilion is rebuilt, a section could be designed for indoor operation, allowing a wider range of products and cooking.
Eastern Market, DetroitCity Market, Kansas City

Focus Group Opportunity 4
Address Parking Issue1. Create information systems that direct drivers to empty parking spaces2. Build a parking garage near the Farmers’ Market3. Add a shuttle bus from the Farmers’ Market to outlying parking lots4. Will driverless car technology sharply reduce need for nearby parking?

Focus Group Opportunity 5Enhance Pedestrian, Bike and Bus Infrastructure1. Add Saturday bus service
2. Improve sidewalks and crosswalks
3. Add bike lanes and parking
4. Encourage patrons to walk, bike or ride bus
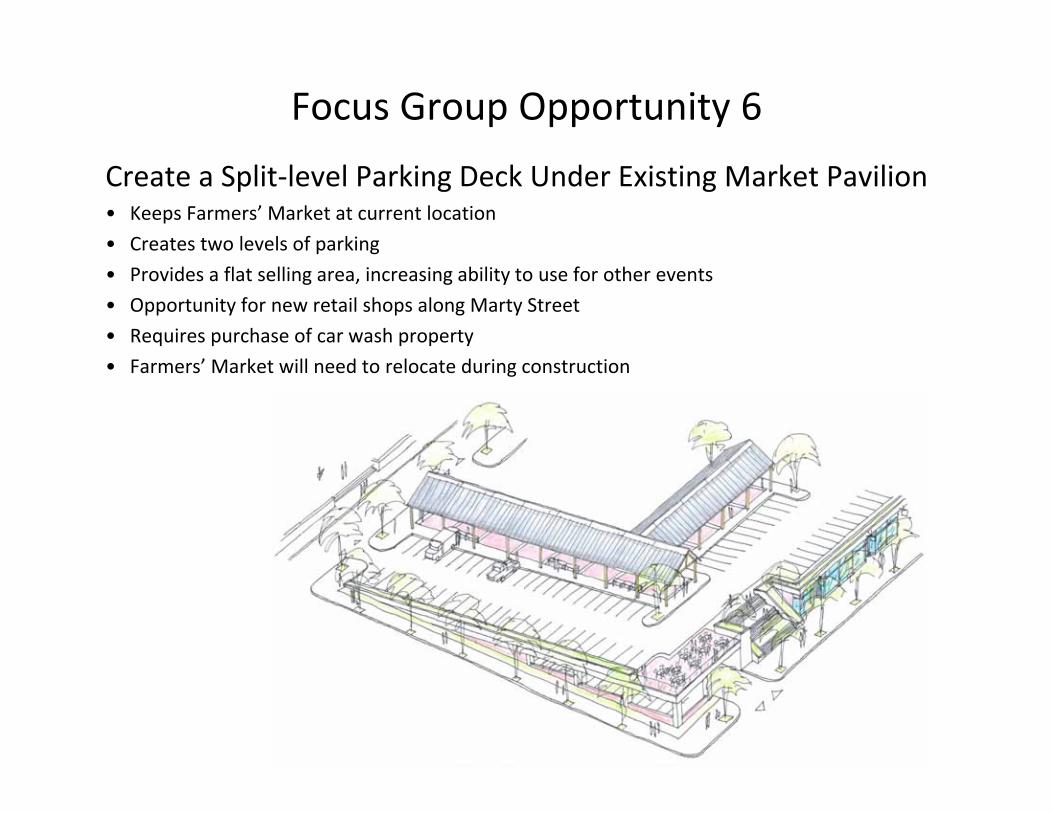
Focus Group Opportunity 6
Create a Split‐level Parking Deck Under Existing Market Pavilion• Keeps Farmers’ Market at current location• Creates two levels of parking• Provides a flat selling area, increasing ability to use for other events• Opportunity for new retail shops along Marty Street• Requires purchase of car wash property• Farmers’ Market will need to relocate during construction

Focus Group Opportunity 7
Reposition Farmers’ Market Pavilion along Marty Street• Requires purchase of car
wash property
• Less slope inside pavilion
• Creates room for a plaza between clock tower and pavilion— can be designed for outdoor vendor, music, events
• Expansion of pavilion could include interior space
• Farmers’ Market will need to relocate during construction

Focus Group Opportunity 8
Relocate pavilion to new “Market Street” between Marty & Floyd• Requires property acquisition
• Pedestrian/view corridor to Metcalf requires redevelopment between Floyd and Metcalf
• Substantial slope between Marty and Floyd; could have split‐level parking
• Farmers’ Market can stay in operation during construction
• Current Farmers’ Market site could become multistory development with parking (although might lose the view corridor)

Focus Group Opportunity 9
Relocate Farmers’ Market to Santa Fe Commons• Pavilion could be larger than
existing structure: either longer or with a “T” section toward Santa Fe Drive
• Buildings at Santa Fe and 80thStreet could be redeveloped with food‐related retail or restaurants that serve Farmers’ Market customers
• Future parking garage might serve this area on weekends
• Park redesign could create multi‐use plaza for music, events, vendors
• Farmers’ Market could stay in operation during construction
City StaffConcept Opportunity Score
Concept 6 Split level 38
Concept 3 Enclose 20
Concept 9 Santa Fe Commons 10
Concept 2 Alter mix 8
Concept 4 Parking 7
Concept 8 Market Street 0
Concept 5 Transit ‐6
Concept 7 Marty Street ‐6
Concept 1 Leave as is ‐22
VendorsConcept Opportunity Score
Concept 3 Enclose 46
Concept 1 Leave as is 38
Concept 4 Parking 20
Concept 9 Santa Fe Commons 17
Concept 8 Market Street 2
Concept 7 Marty Street 0
Concept 6 Split level ‐13
Concept 5 Transit ‐25
Concept 2 Alter mix ‐49
ResidentsConcept Opportunity Score
Concept 7 Marty Street 16
Concept 3 Enclose 14
Concept 9 Santa Fe Commons 14
Concept 4 Parking 13
Concept 8 Market Street 9
Concept 6 Split level 8
Concept 2 Alter mix ‐7
Concept 5 Transit ‐13
Concept 1 Leave as is ‐24
Downtown MerchantsConcept Opportunity Score
Concept 4 Parking 13
Concept 5 Transit 12
Concept 3 Enclose 9
Concept 7 Marty Street 8
Concept 2 Alter mix 7
Concept 8 Market Street 3
Concept 6 Split level 1
Concept 1 Sante Fe Commons ‐5
Concept 1 Leave as is ‐16
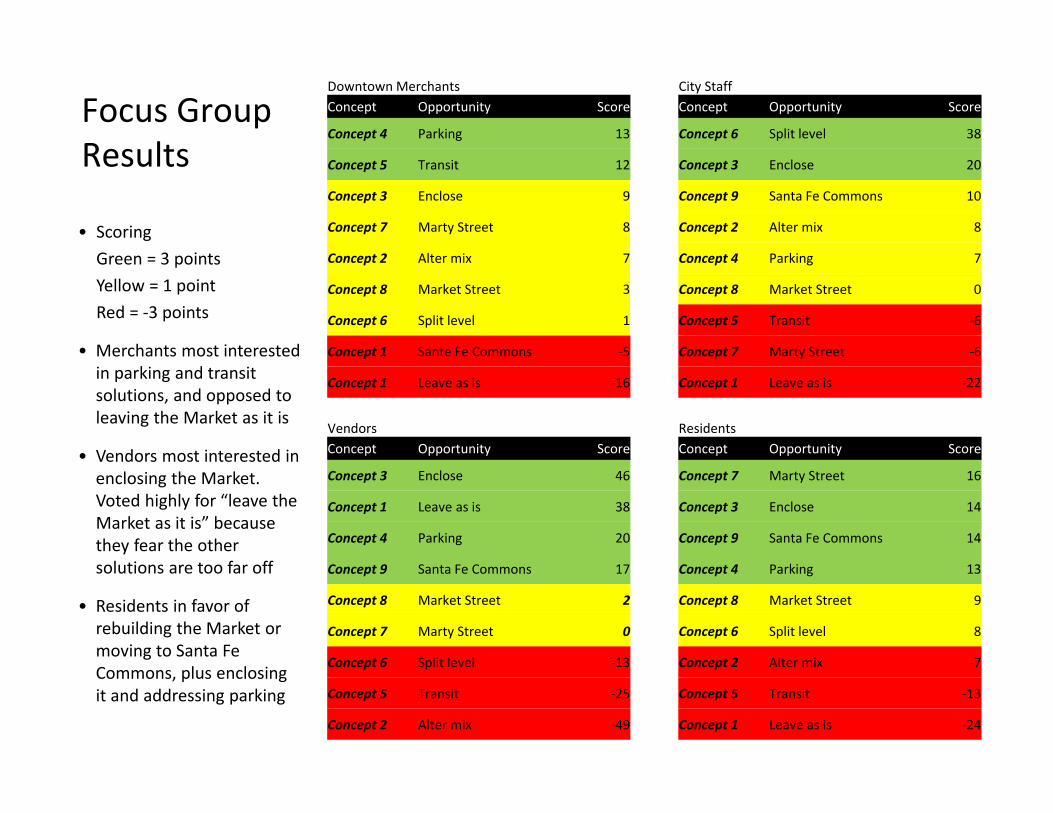
Focus Group Results
• ScoringGreen = 3 pointsYellow = 1 pointRed = ‐3 points
• Merchants most interested in parking and transit solutions, and opposed to leaving the Market as it is
• Vendors most interested in enclosing the Market. Voted highly for “leave the Market as it is” because they fear the other solutions are too far off
• Residents in favor of rebuilding the Market or moving to Santa Fe Commons, plus enclosing it and addressing parking

Concept Opportunity Overall
Concept 3 Enclose 89
Concept 4 Parking 53
Concept 9 Santa Fe Commons 36
Concept 6 Split level 34
Concept 7 Marty Street 18
Concept 8 Market Street 14
Concept 1 Leave as is -24
Concept 5 Transit -32
Concept 2 Alter mix -41
Concept Opportunity Overall Merchants City Staff Vendors Residents
Concept 1 Leave as is -24 -16 -22 38 -24
Concept 2 Alter mix -41 7 8 -49 -7
Concept 3 Enclose 89 9 20 46 14
Concept 4 Parking 53 13 7 20 13
Concept 5 Transit -32 12 -6 -25 -13
Concept 6 Split level 34 1 38 -13 8
Concept 7 Marty Street 18 8 -6 0 16
Concept 8 Market Street 14 3 0 2 9
Concept 9 Santa Fe Commons 36 -5 10 17 14
• Combining the votes from all four groups, the highest scores are for enclosing parts of the Market, addressing parking, and moving to Santa Fe Commons
• The lowest scores are for altering the mix, addressing transit, and leaving the Market as it is
• Range of opinion about each concept
Focus Group Results

Research Conclusions & Development Program
1. Maintain essence of what has made the Overland Park Farmers’ Market successful, including open pavilion facility in downtown, focus on regional farmers, broad product selection, and strong city management
2. Address facility challenges and limitations– Rebuild pavilion on flat area
– Replace parking lot environment under pavilion with plaza‐like space
– Expand electrical capacity
– Address drainage
3. Expand pavilion up to 25% to accommodate larger displays and more vendors
4. Add enclosures for a portion of the Market using flexible garage doors in order to extend the selling season and create enhanced event space
5. Create eating area adjacent to pavilion with tables and chairs
6. Address parking with multiple strategies – Increase supply and enhance management of
accessible parking spaces adjacent to pavilion, along with product pick‐up program
– Promote new on‐street parking spaces
– Encourage construction of new parking deck south of 80th Street (particularly if pavilion moves to Santa Fe Commons)
7. Create mobility hub on Marty Street, building on the existing bus stop with bicycle and other transit options
8. Promote alternative transportation through expanded bike lanes, bike parking, pedestrian upgrades, and rewards program
9. Explore creation of farmers’ market facility in southern section of Overland Park

Redevelopment Options
• Following input from the focus groups, the consultant team identified four viable redevelopment options for the Overland Park Farmers’ Market
– Option 1: Upgrade the current Market pavilion
– Option 2: Create a two‐level parking garage at the current site with the Market on top
– Option 3: Keep the Market at the current site but expand it by adding a wing along Marty that is flat and can be enclosed
– Option 4: Relocate the pavilion to Santa Fe Commons Park
• Layout options and renderings were prepared for options two through four
• Site evaluation matrix identifies how each option addresses site selection criteria, including parking, access, enclosures, cost, and impact on downtown businesses

Option 1: Upgrade Existing Pavilion
− Drainage− Electrical− Rain/wind penetration− Curbs and repaving
− Paint− Lighting− Wifi and public address
system
• Upgrades could include:
• Upgrades would not address the slope or enclosures• Lowest cost alternative

Option 2: Split Level Garage
• The split level option creates a flat, two‐story parking deck at the current Market site, with at‐grade access from both Marty Street and OP Drive
• This option requires purchase of the car wash site
• Parking on the site increases from 166 to 307 spaces
• The Farmers’ Market must relocate during construction
• Access to the upper deck requires stairs and elevator from Marty St.
• Vending area increases about 25%
• The building (red) includes elevator/stairs from garage, restrooms and office
• Highest cost (est. $17 million) and longest construction period

Option 2: Split Level Garage – Lower Level
• Parking deck utilizes 12’ elevation change between Overland Park Drive and Marty Street, so the garage is at‐grade on Marty Street but underground at OP Drive
• Mechanical ventilation will likely be needed on the lower level
• The lower level has 173 parking spaces
• New storefronts facing Brew Lab and Ambrosia Café help create a retail corridor along Marty Street and create a rent revenue stream
• The stores total about 11,700 sf, plus about 1,000 sf of storage under the staircase
• Alternative transportation is enhanced with indoor bike parking

Option 2: Split Level Renderings

Option 3: Marty Street
• Marty Street option keeps pavilion at current location, expanded with new wing along Marty Street
• Requires purchase of car wash site
• Site grading increases the elevation of the southeast corner of the site, making the north‐south axis flat and allowing garage door enclosures on that wing
• Vending area increases about 25%
• Parking on the site decreases from 166 to 139 spaces
• Farmers’ Market must relocate during construction
• Outdoor plaza is created on the western side of the site
• Cost significantly less than the split‐level garage (estimate $6 million)

Option 3: Marty Street Renderings

Option 4: Santa Fe Commons• Proposed location is the northeast corner of park• Pavilion would be added as part of planned renovation
of the entire park

Option 4: Santa Fe Commons
• Santa Fe Commons option creates a flat pavilion with garage door enclosures that can be used for the farmers’ market and other park/event functions
• Farmers’ Market can stay open at current site during construction
• The pavilion is about 500’ from current site along OP Drive, so that parking lot can serve Market if pedestrian environment improved
• Building provides restrooms for park and Market
• Closest bus stop at Matt Ross Community Center
• Park setting should encourage walking and biking
• Currently inadequate parking within close proximity to this site – will require a public or private parking solution

Option 4: Santa Fe Commons
• Conceptual park renovation plan prepared by Parks Department, City of Overland Park
• Historic Carriage House remains in place
• Plan envisions an active urban park, combining indoor and outdoor events in the northern section of the park with greenspace, playground, and walking loop located in southern section
• Plan retains many of the large trees

Option 4: Santa Fe Commons

Preliminary Cost EstimateBudget item Option 1. Maintenance 2. Split Level 3. Marty St 4. Santa Fe CommonsEarthwork $0 $113,000 $0 $12,000Demolition $9,000 $523,000 $523,000 $250,000Hardscape $16,000 $147,000 $1,035,000 $443,000Landscape $0 $14,000 $23,000 $30,000Stormwater drainage $123,000 $192,000 $223,000 $155,000Electrical $35,000 $175,000 $262,000 $209,000Parking garage $0 $9,443,000 $0 $0Pavilion $0 $2,386,000 $2,501,000 $2,501,000Subtotal $183,000 $12,993,000 $4,566,000 $3,600,000
Design Contingency 20.0% $37,000 $2,599,000 $913,000 $720,000Arch/Engineering Fees 8.0% $15,000 $1,039,000 $365,000 $288,000Environ/Inspection/Geotech 1.5% $3,000 $195,000 $68,000 $54,000
Land Purchase (car wash site) $0 $450,000 $450,000 $0
Total $238,000 $17,300,000 $6,400,000 $4,700,000
• To identify order‐of‐magnitude costs, Taliaferro & Browne provided a preliminary cost estimate based on recent experience with similar projects; Hugh Boyd provided square foot costs for pavilion
• Some costs associated with the Santa Fe Commons site overlap with planned park upgrades

Site MatrixDevelopment Options
Selection criteria 1. Upgrade current structure
2. Split level garage 3. Marty Street 4. Santa Fe Commons
Proximity to downtown core
Yes Yes Yes Slightly removed but near businesses on Santa Fe Dr.
Expands downtown parking
No change Total spaces: 166 Customer parking
when farmers’ market: 75‐91
Increases supply Total spaces: 307
− Lower 173; upper 134 Customer parking when
farmers’ market: 232
Reduces supply Total spaces: 139 Customer parking when
farmers’ market: 72 spaces
Increases supply Current pavilion lot becomes
available (166 spaces) Potential new private parking
lot available on weekends
Provides adequate customer parking
No changeDeficit of 48 spaces
Yes NoDeficit of ~67 spaces
NoDeficit of ~193 spaces
Slope Substantial slope (no change)4% slope
Flat Reduced slope Flat along Marty Street 4% grade for 120’ on
east‐west wing
Flat
Pavilion size, number of vendor stalls
54 covered vendor stalls
Shed: 9 bays (none enclosed); 12,500 sf
Restrooms: 864 sf
65 covered stalls (37 w/ adjacent parking)
Shed: 13 bays; 20,330 sf Restroom/office/stairs:
1,365 sf
72 covered stalls (55 w/ adjacent parking)
Shed: 13 bays; 19,285 sf
Restroom/office: 719 sf
66 covered stalls (29 w/ adjacent parking)
Shed: 13 bays; 19,290 sf Restroom: 576 sf
Adds enclosed section and/or retail storefronts
No Yes 4‐6 bays enclosed Storefronts (6), 11,740 sf Storage 1,060 sf
Yes 6 enclosed bays
Yes 4‐7 enclosed bays

Site MatrixDevelopment Options
Selection criteria 1. Upgrade current structure
2. Split level garage 3. Marty Street 4. Santa Fe Commons
Cost Maintenance itemsEst. $250,000
HighestEst. $17m
LowerEst. $6m
Lower but requires park improvements; Est. $5m
Requires temporary Market relocation
No Yes – longer Yes – shorter No
Requires purchase of private property
No Yes (car wash site) Est: $400‐450,000 15‐30% over appraised
value of $340,000
Yes (car wash site) Est: $400‐450,000 15‐30% over appraised
value of $340,000
No
Increases visibility No No No Potentially
Impact on downtown retail
No change No change Slightly further away, but adds retail storefronts to Marty Street
One block south; closer to Santa Fe Drive
Event space utility Very limited High High Very high – park can accommodate a variety of events
Public transit Mobility hub on Marty Mobility hub on Marty Mobility hub on Marty 2.5 blocks from bus stop
Alternative transportation
Bike parking Covered bike parkingSteps from Marty
Dedicated bike parking on Marty
Best bike access, room for bike parking, pleasant walking location
Bike lanes go to roundabout
Controversy Low Medium/high ‐ cost Low High

Site Matrix (unweighted assessment)

Site Matrix
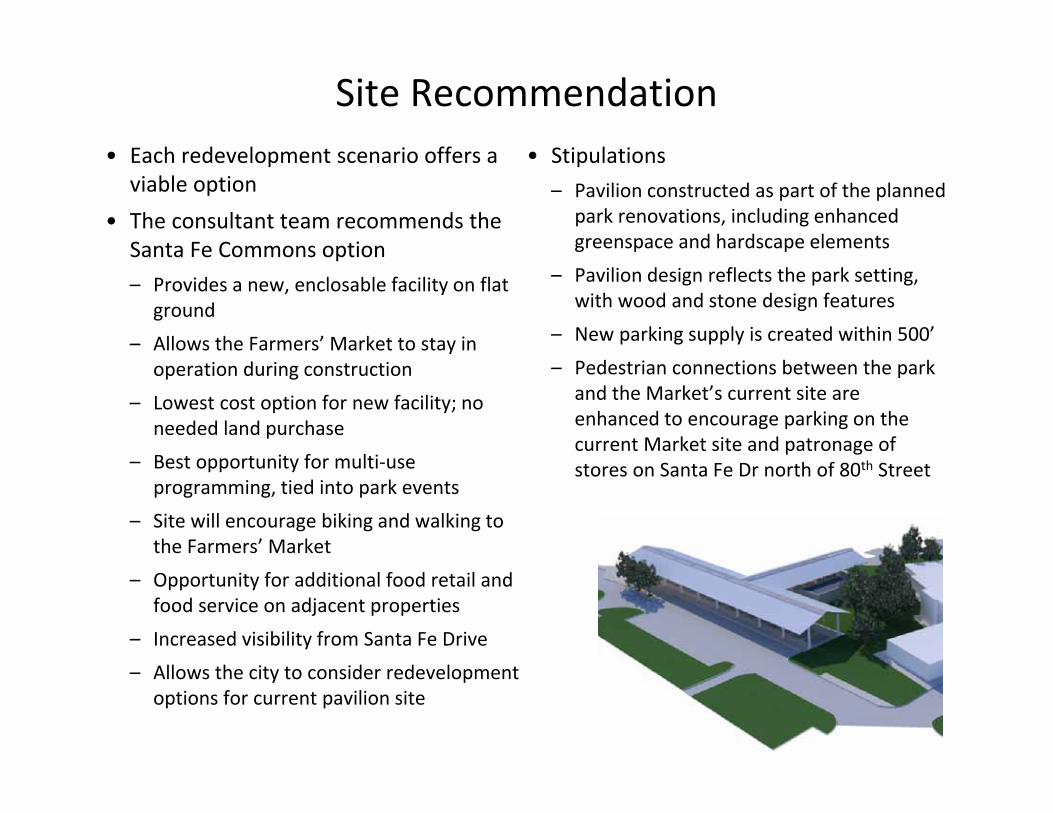
Site Recommendation• Each redevelopment scenario offers a
viable option• The consultant team recommends the
Santa Fe Commons option– Provides a new, enclosable facility on flat
ground
– Allows the Farmers’ Market to stay in operation during construction
– Lowest cost option for new facility; no needed land purchase
– Best opportunity for multi‐use programming, tied into park events
– Site will encourage biking and walking to the Farmers’ Market
– Opportunity for additional food retail and food service on adjacent properties
– Increased visibility from Santa Fe Drive
– Allows the city to consider redevelopment options for current pavilion site
• Stipulations– Pavilion constructed as part of the planned
park renovations, including enhanced greenspace and hardscape elements
– Pavilion design reflects the park setting, with wood and stone design features
– New parking supply is created within 500’
– Pedestrian connections between the park and the Market’s current site are enhanced to encourage parking on the current Market site and patronage of stores on Santa Fe Dr north of 80th Street

Summary of Recommendations1. Construct new expanded, enclosable pavilion in Santa Fe Commons, as part of
park renovation, featuring wood and stone design2. Develop new parking capacity south of 80th Street3. Improve pedestrian streetscape to connect park with current Market site and
Santa Fe Drive north of 80th Street4. Address pavilion’s critical maintenance issues (especially electricity and
drainage/flooding) while exploring long range solutions5. Create mobility hub around existing bus stop on Marty6. Gradually increase number of vendors and allow larger produce vendors to utilize
more space7. Enhance social media, particularly with more information about parking8. Explore development of new farmers’ market in south Overland Park9. Create more accessible parking and product drop zone adjacent to pavilion10. Secure shared parking opportunities with owners of nearby parking lots11. Create biking promotion program, with gift card or raffle drawing

helping the City of Overland Park
create a downtown event & transportation hub
Final PresentationNovember 13, 2017