the 2010 olympic downtown transportation...
TRANSCRIPT

THE 2010 OLYMPIC DOWNTOWN TRANSPORTATION
EXPERIENCE: LESSONS FOR VANCOUVER AND FUTURE HOST CITIES OF MEGA-EVENTS
by
Steve Chou Bachelor of Arts, University of British Columbia, 2008
RESEARCH PROJECT SUBMITTED IN PARTIAL FULFILLMENT OF THE REQUIREMENTS FOR THE DEGREE OF
MASTER OF URBAN STUDIES
In the Faculty of Arts and Social Sciences
© Steve Chou 2010
SIMON FRASER UNIVERSITY
Fall 2010
All rights reserved. However, in accordance with the Copyright Act of Canada, this work may be reproduced, without authorization, under the conditions for Fair Dealing. Therefore, limited reproduction of this work for the purposes of private
study, research, criticism, review and news reporting is likely to be in accordance with the law, particularly if cited appropriately.
ii
APPROVAL
Name: Steve Chou
Degree: Master of Urban Studies
Title of Thesis: The 2010 Olympic Downtown Transportation Experience: Lessons for Vancouver and Future Host Cities of Mega-Events
Examining Committee:
Chair: Karen Ferguson Associate Professor, Urban Studies and History
_____________________________________
Anthony Perl
Supervisor Director, Urban Studies Professor, Urban Studies and Political Science
_____________________________________
Meg Holden
Second Supervisor Associate Professor, Urban Studies and Geography
_____________________________________
Ken Cameron
External Examiner Adjunct Professor, Urban Studies
Date Defended/Approved: November 22 2010
Last revision: Spring 09
Declaration of Partial Copyright Licence
The author, whose copyright is declared on the title page of this work, has granted to Simon Fraser University the right to lend this thesis, project or extended essay to users of the Simon Fraser University Library, and to make partial or single copies only for such users or in response to a request from the library of any other university, or other educational institution, on its own behalf or for one of its users.
The author has further granted permission to Simon Fraser University to keep or make a digital copy for use in its circulating collection (currently available to the public at the “Institutional Repository” link of the SFU Library website <www.lib.sfu.ca> at: <http://ir.lib.sfu.ca/handle/1892/112>) and, without changing the content, to translate the thesis/project or extended essays, if technically possible, to any medium or format for the purpose of preservation of the digital work.
The author has further agreed that permission for multiple copying of this work for scholarly purposes may be granted by either the author or the Dean of Graduate Studies.
It is understood that copying or publication of this work for financial gain shall not be allowed without the author’s written permission.
Permission for public performance, or limited permission for private scholarly use, of any multimedia materials forming part of this work, may have been granted by the author. This information may be found on the separately catalogued multimedia material and in the signed Partial Copyright Licence.
While licensing SFU to permit the above uses, the author retains copyright in the thesis, project or extended essays, including the right to change the work for subsequent purposes, including editing and publishing the work in whole or in part, and licensing other parties, as the author may desire.
The original Partial Copyright Licence attesting to these terms, and signed by this author, may be found in the original bound copy of this work, retained in the Simon Fraser University Archive.
Simon Fraser University Library Burnaby, BC, Canada
STATEMENT OF ETHICS APPROVAL
The author, whose name appears on the title page of this work, has obtained, for the research described in this work, either:
(a) Human research ethics approval from the Simon Fraser University Office of Research Ethics,
or
(b) Advance approval of the animal care protocol from the University Animal Care Committee of Simon Fraser University;
or has conducted the research
(c) as a co-investigator, collaborator or research assistant in a research project approved in advance,
or
(d) as a member of a course approved in advance for minimal risk human research, by the Office of Research Ethics.
A copy of the approval letter has been filed at the Theses Office of the University Library at the time of submission of this thesis or project.
The original application for approval and letter of approval are filed with the relevant offices. Inquiries may be directed to those authorities.
Simon Fraser University Library
Simon Fraser University Burnaby, BC, Canada
Last update: Spring 2010
iii
ABSTRACT
The XXI Olympic Winter Games presented Vancouver with significant
transportation challenges and generated concerns about the potential difficulties
of travelling during the 17-day period of the Games. Olympic partner
organizations developed and implemented a range of transportation demand
management (TDM) strategies to influence the travel behaviour of residents.
The result was a very successful transportation experience.
This paper examines the details of the Olympic downtown transportation
experience including changes that residents made to their travel behaviour and
the factors that contributed to the success of transportation in the downtown. In
the end, ten transportation lessons for Vancouver were generated from this
research. These lessons have a range of applications from informing long-term
transportation planning to planning for episodic events. Additionally, this paper
highlights the opportunity that future host cities have to leverage mega-events
like the Olympic Games to generate valuable and insightful lessons on
addressing current and future transportation challenges.
Keywords: transportation demand management; Olympic transportation;
Vancouver; lessons learned; sustainable transportation; episodic events

iv
DEDICATION
To my family.
v
ACKNOWLEDGEMENTS
I would like to take this opportunity to thank those who played an
important part in the completion of my research project. I would like to firstly
acknowledge the faculty, staff, and students of the Urban Studies Program. In
particular, I sincerely thank Anthony Perl who provided his continual guidance,
regularly provided feedback, and helped me in the development and completion
of the project. I also thank Ken Cameron and Meg Holden for their comments
that pushed me go further in my analysis.
I would like to recognize Kathrine Richardson for giving me my first
opportunity to go out in the field and gain experience with conducting interviews.
As well, thanks to all interviewees in this project for taking the time to participate
and provide their input.
Finally, special thanks goes out to my family for their support throughout
my academic career.
vi
TABLE OF CONTENTS
Approval .......................................................................................................................... ii
Abstract .......................................................................................................................... iii
Dedication ...................................................................................................................... iv
Acknowledgements ......................................................................................................... v
Table of Contents ........................................................................................................... vi
List of Figures................................................................................................................ viii
List of Tables .................................................................................................................. ix
Glossary .......................................................................................................................... x
1: Introduction ............................................................................................................... 1
2: Background ............................................................................................................... 3
2.1 Downtown Transportation Infrastructure .................................................................. 3
2.2 Downtown Vancouver Mode Share ......................................................................... 5
2.3 The Olympic Transportation Plan ............................................................................ 7
2.3.1 Olympic Transportation Challenges ............................................................. 8 2.3.2 Transportation Strategies ............................................................................ 9
3: Literature Review .................................................................................................... 13
3.1 TDM and Travel Behaviour ................................................................................... 14
3.1.1 Definition and Emergence of TDM ............................................................. 14 3.1.2 Effectiveness of TDM ................................................................................. 17 3.1.3 Travel Behaviour ....................................................................................... 19
3.2 Transportation Challenges Facing Cities ............................................................... 23
3.2.1 Long Term Transportation Planning ........................................................... 24 3.2.2 Planning for Episodic Events ..................................................................... 36 3.2.3 State of Research on TDM Strategies ....................................................... 42 3.2.4 Applicability of Olympic Lessons ................................................................ 45
3.3 Olympic Transportation ......................................................................................... 46
4: Methodology ............................................................................................................ 49
4.1 Research Design................................................................................................... 49
4.2 Pre-Planning ......................................................................................................... 50
4.3 Data Sources ........................................................................................................ 51
4.3.1 Media Reports ........................................................................................... 51 4.3.2 Travel Survey ............................................................................................ 52 4.3.3 Data Describing Driving Conditions ........................................................... 53 4.3.4 Data Describing Transit Conditions ............................................................ 54 4.3.5 Data Describing Walking and Cycling Conditions ...................................... 55 4.3.6 Interviews with Experts .............................................................................. 56
vii
5: Olympic Transportation Analysis .......................................................................... 58
5.1 Pre-Olympic Expectations, Issues, and Targets .................................................... 58
5.2 Olympic Downtown Transportation Experience ..................................................... 60
5.2.1 Transportation Initiatives ............................................................................ 60 5.2.2 Driving Experiences ................................................................................... 62 5.2.3 Transit Experiences ................................................................................... 63 5.2.4 Walking and Cycling Experiences .............................................................. 66
6: Analysis Of The Downtown Transportation Experience ...................................... 70
6.1 Post-Games Assessment ...................................................................................... 70
6.2 Factors Contributing to the Outcome of the Olympic Downtown
Transportation Experience .................................................................................... 74
6.2.1 Structural Factors ...................................................................................... 75 6.2.2 Psychological Factors ................................................................................ 77 6.2.3 Random Factors ........................................................................................ 79
7: Transportation Lessons ......................................................................................... 84
7.1 Applicability of Olympic Lessons ........................................................................... 84
7.1.1 Long Term Transportation Planning ........................................................... 84 7.1.2 Planning for Episodic Events ..................................................................... 85
7.2 Transportation Lessons for Vancouver .................................................................. 87
7.2.1 It is Possible to Achieve Higher than Current Levels of Sustainable Mode Use .................................................................................................. 89
7.2.2 Transit Has the Potential to Attract Almost Anyone .................................... 92 7.2.3 Minimizing the Space That Transportation Takes Up Can Create
Valuable Public Spaces ............................................................................. 93 7.2.4 Our Transportation System is Resilient but Could Be Improved With
Additional TDM Strategies ......................................................................... 95 7.2.5 We Are More Effective When We Work Together ...................................... 97 7.2.6 Set a Date for Change and Celebrate ...................................................... 101 7.2.7 Define What „Normal‟ Travel Conditions Will Be Like ............................... 102 7.2.8 Modelling Change to the Transportation System Provides Valuable
Insight ...................................................................................................... 104 7.2.9 There Are Many Ways of Disseminating Travel Information ..................... 105 7.2.10 We Gained Improved Operational Knowledge of Our Transportation
System .................................................................................................... 108
7.3 Transportation Lessons for Future Host Cities .................................................... 109
7.3.1 Generating Transportation Lessons ......................................................... 109 7.3.2 Transportation Planning for the Olympics ................................................ 112
8: Conclusion ............................................................................................................ 114
Reference List ........................................................................................................... 117

viii
LIST OF FIGURES
Figure 1: Boundaries of Downtown Vancouver............................................................... 3
Figure 2: Mode Share of All Trips to Downtown Vancouver............................................ 7
Figure 3: Timeline of Select Transportation Initiatives Implemented in the Downtown ..................................................................................................... 12
Figure 4: Three Ingredients in Structural and Psychological Measures ........................ 21
Figure 5: Queue Management Strategy for Waterfront Station ..................................... 65
Figure 6: Burrard Bridge Monthly Pedestrian and Bicycle Volumes .............................. 67
ix
LIST OF TABLES
Table 1: Journey to Work Mode Shares in 2006 ........................................................... 6
Table 2: Change in Trips Taken By Mode Over the Duration of the TravelSmart Pilot Project ................................................................................................... 34
Table 3: Breakdown in Changes to Transit Ridership.................................................. 63
Table 4: Person Trips to and from UBC on a Typical Weekday in Fall 2008 ............... 81
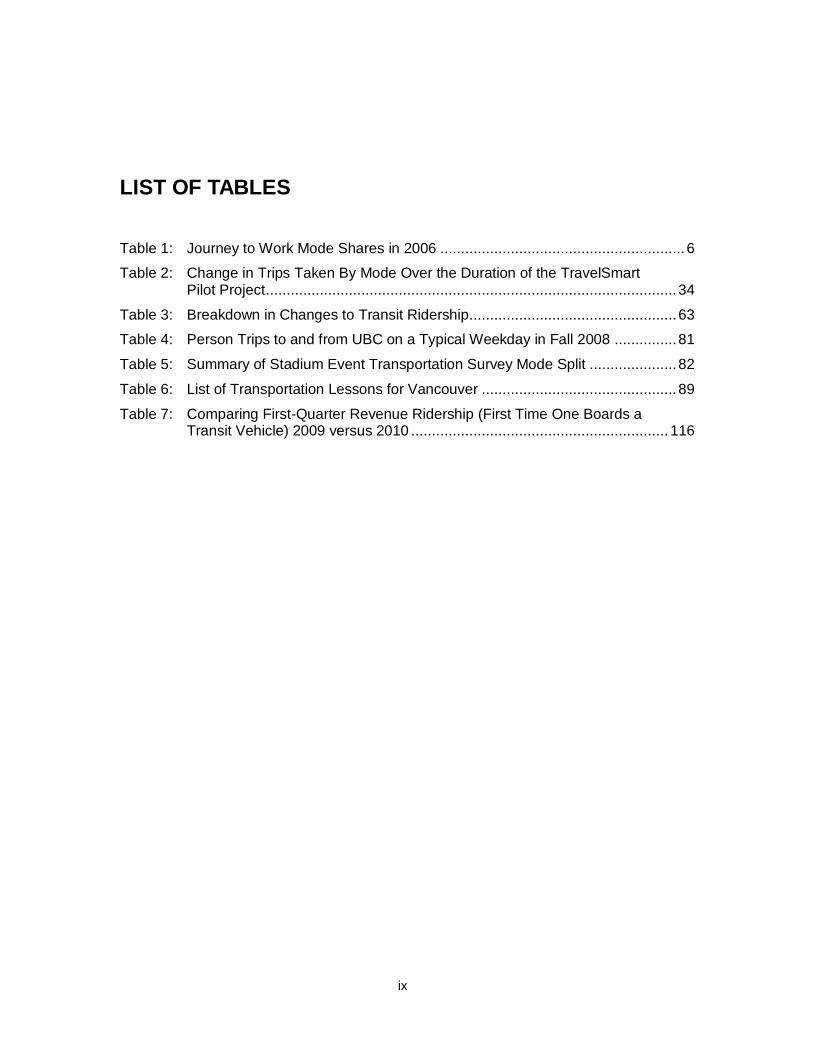
Table 5: Summary of Stadium Event Transportation Survey Mode Split ..................... 82
Table 6: List of Transportation Lessons for Vancouver ............................................... 89
Table 7: Comparing First-Quarter Revenue Ridership (First Time One Boards a Transit Vehicle) 2009 versus 2010 .............................................................. 116
x
GLOSSARY
ORGANIZATIONS
2010 Integrated Security Unit
The unit responsible for securing the 2010 Olympic and Paralympic Games.
British Columbia Ministry of Transportation and Infrastructure
The provincial government ministry responsible for transportation infrastructure and law in British Columbia.
British Columbia Rapid Transit Company
A subsidiary of TransLink. It operates and maintains the Expo and Millennium SkyTrain Lines.
British Columbia Transit
A provincial Crown agency responsible for coordinating the delivery of public transportation in British Columbia outside of the Metro Vancouver region.
City of Vancouver The local government body of Vancouver responsible for providing various services, operations, and programs.
Coast Mountain Bus Company
A subsidiary of TransLink. It operates bus service and the SeaBus in Metro Vancouver.
Downtown Vancouver Business Improvement Association
Serves a 90 block area in downtown Vancouver consisting of 8,000 businesses, property owners, and tenants.
HandyDART A transit service for persons with disabilities which is operated by MVT Canadian Bus Inc.
Insurance Corporation of British Columbia
A provincial Crown corporation that provides universal automobile insurance to motorists in British Columbia.
Olympic and Paralympic Transportation Team
Composed of members from Olympic partner organizations responsible for planning transportation during the Olympics.

xi
ProTrans BC The private operator of the Canada Line.
TransLink Legally known as the South Coast British Columbia Transportation Authority. It is responsible for transit, funding the major road network, and transportation demand management in Metro Vancouver.
Vancouver Organizing Committee
A not-for-profit organization responsible for the planning, organizing, financing, and staging of the 2010 Olympic and Paralympic Games.
ABBREVIATIONS
BCRTC British Columbia Rapid Transit Company
DTP Downtown Transportation Plan
DVBIA Downtown Vancouver Business Improvement Association
ICBC Insurance Corporation of British Columbia
IOC International Olympic Committee
LRSP Livable Region Strategic Plan
OPTT Olympic and Paralympic Transportation Team
OTP Olympic Transportation Plan
SOV Single Occupant Vehicle
TDM Transportation Demand Management
UBC University of British Columbia
UTSP Urban Transportation Showcase Project
VANOC Vancouver Organizing Committee
1
1: INTRODUCTION
The XXI Olympic Winter Games were held from February 12th to February
28th, 2010. In this research project, I examine the questions of what happened
with transportation in downtown Vancouver during the Olympics and what can be
learned from the Olympic downtown transportation experience?
The first part of the paper focuses on understanding the response of
residents to the 2010 Olympics and the Olympic Transportation Plan (OTP). I
examine travel conditions and the travel behaviour of residents during the 17-day
period of the Games. In particular, changes to travel mode, trips made, and the
quality of transportation for residents who travelled by automobile, transit, foot, or
bicycle are analyzed. This examination involved the use of quantitative data from
counts and surveys as well as observations gathered from media reports,
interviews, and personal experiences.
The second part of the paper provides an analysis of the Olympic
downtown transportation experience. I compare the outcome of Olympic
transportation with prior expectations and determine whether pre-established
targets were met. An evaluation of Olympic transportation is then provided along
with an analysis of the factors that contributed to the outcome. In the end,
transportation lessons from the Olympics are generated using data gathered in
this project and input provided by commentators in the media, local experts, and
transportation planners. The main purpose of these lessons is to inform future
2
decision-making about transportation in the city and region of Vancouver. As
well, transportation lessons for future host cities of mega-events are generated.
These lessons provide insight into how mega-events like the Olympics can be
leveraged by host cities to generate transportation lessons that are relevant to
their respective localities. The lessons described in this paper, both for
Vancouver and future host cities, help provide an improved understanding of how
to address the current and future transportation challenges facing cities.

3
2: BACKGROUND
2.1 Downtown Transportation Infrastructure
Figure 1: Boundaries of Downtown Vancouver1
Downtown Vancouver is located on a peninsula and encompasses eight
communities as defined within the Downtown Transportation Plan2 (see Figure 1
for boundaries). To the north of the downtown is Burrard Inlet and to the south is
False Creek. Access to and from the west side of the downtown is provided by
the Lions Gate bridge, which crosses Burrard Inlet. The Burrard, Granville
Street, and Cambie Street bridges span False Creek and provide access to and
from the south side of the downtown. Major roads provide access to and from
1 Taken from City of Vancouver, “Background to the Downtown Transportation Plan”, (City of
Vancouver, 2010) Available: <http://vancouver.ca/dtp/transportationchallenge.htm> 2 City of Vancouver, Downtown Transportation Plan, (City of Vancouver, 2002)
4
the east side of the downtown and these include Hastings Street, Pender Street,
and the Dunsmuir and Georgia Viaducts.
Transit service is provided by TransLink3. There is a commuter rail
service known as the West Coast Express which connects the downtown and six
cities to the east of Vancouver including Port Moody, Coquitlam, Port Coquitlam,
Pitt Meadows, Maple Ridge, and Mission. Also, three rapid transit lines known as
SkyTrain4 serve the downtown. These are the Expo and Millennium Lines, which
connect to the cities of Burnaby, New Westminster, and Surrey, and the Canada
Line, which connects to the city of Richmond and Vancouver International Airport.
Additionally, passenger ferry service known as SeaBus connects the North Shore
with downtown Vancouver across Burrard Inlet. In total, there are eight major
transit stations in the downtown: Waterfront station is a major hub and is served
by the SeaBus, West Coast Express, and all three SkyTrain lines; Vancouver
City Centre and Yaletown-Roundhouse stations are served by the Canada Line;
and Burrard, Granville, Stadium-Chinatown, and Main Street stations are served
by the Expo and Millennium Lines. The downtown is also served by an extensive
public bus network5, a public transportation service for people with disabilities6,
private ferry service on False Creek, and private taxis.
3 TransLink is a regional transportation authority responsible for public transportation, cycling, and
other commuting options. 4 SkyTrain is a system of automated light rail trains. The BC Rapid Transit Company operates
and maintains the Expo and Millennium Lines while ProTrans BC operates and maintains the Canada Line.
5 Bus service in the region is operated by the Coast Mountain Bus Company (CMBC) which is a
subsidiary of TransLink. 6 This service is known as HandyDART.
5
The seawall provides pedestrians and cyclists with a pathway that runs
along the waterfront of downtown Vancouver. As well, a section of Granville
Street in the downtown was closed to motor vehicles leading up to and during the
Olympics. For cyclists, there also exists a network of bike lanes along 12 major
streets in the downtown.
2.2 Downtown Vancouver Mode Share
Census data7 collected in 2006 indicates that 41.1% of residents in the city
of Vancouver use transit, walk, or cycle to work. A comparison made by the City
of Vancouver to other select municipalities in North America shows that
Vancouver residents rank relatively high for the use of sustainable modes. In
particular, “[t]ransit use is much higher in Vancouver than in all the US cities”8
although it is lower than in Toronto or Montreal. In addition, Vancouver has the
second highest percentage of people walking to work in comparison to other
Canadian and American cities9. Vancouver can also be compared to the Metro
Vancouver region as a whole where mode shares for transit, walking, and cycling
total 18.1%10 (see Table 1 for a breakdown of mode shares).
7 City of Vancouver, Transportation Trends – 2006 Census and Central Business District Counts,
City of Vancouver, 2008 8 More details can be found in City of Vancouver, Vancouver Transportation Plan, Progress
Report, (City of Vancouver, 2006). This comparison was made to selected cities in the US and in Canada.
9 Ibid.
10 Data source: City of Vancouver, Transportation Trends

6
Table 1: Journey to Work Mode Shares in 2006
Location of Residents
Mode Share
Auto Driver
Auto Passenger
Transit Walk Bike
Downtown Vancouver11
32.7% 3.3% 20.4% 38.8% 2.6%
Vancouver12 51.5% 6.1% 25.1% 12.2% 3.8%
Metro Vancouver13
67.3% 7.1% 16.5% 6.3% 1.7%
Data shows the relatively high modal share of downtown Vancouver residents for taking transit, walking, and cycling to work.
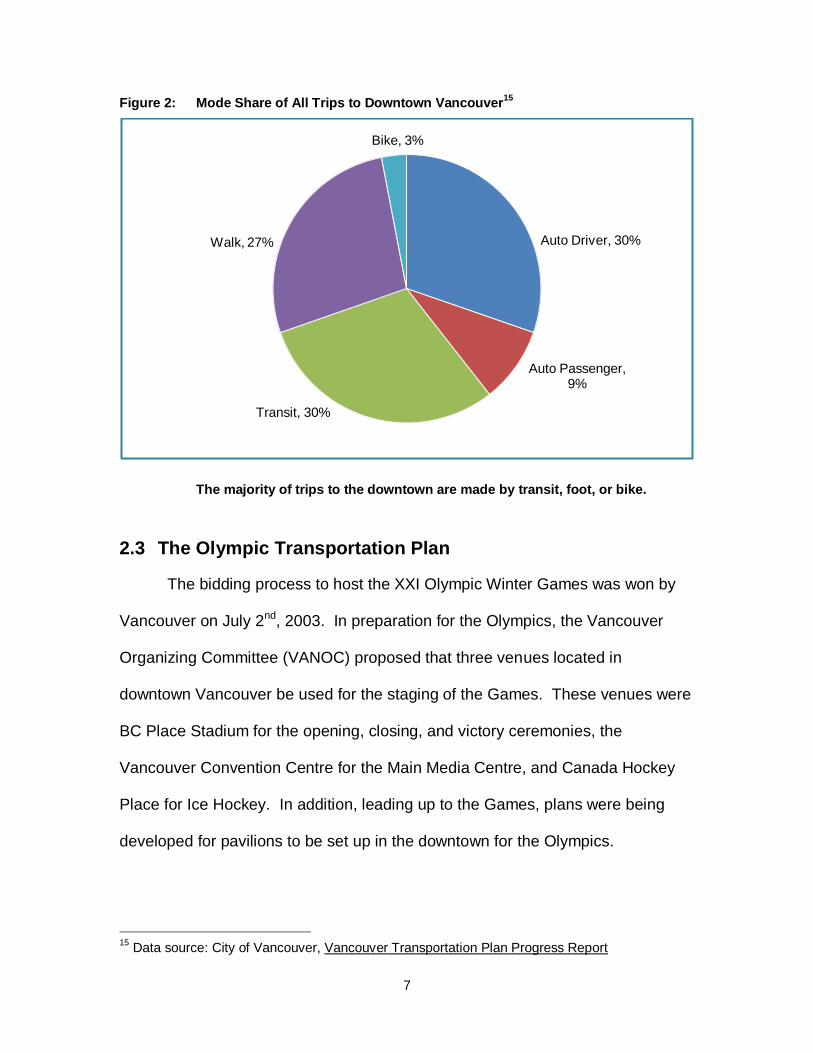
In terms of the downtown, a report from the City of Vancouver14 using
Census data from 2006 shows that for journeys to work, 61.8% of downtown
residents use transit, walk, or cycle. A travel survey completed in 2004 by
TransLink shows a similarly high use of sustainable modes for trips made to the
downtown (see Figure 2 for a breakdown of the mode share).
11
Ibid. 12
Ibid. 13
Statistics Canada, Employed labour force by mode of transportation, both sexes, percentage distribution, for Canada, census metropolitan areas and census agglomerations, and component census subdivisions (municipalities) of residence - 20% sample data, 2006 Census, Ottawa, 2009, Available from <http://www12.statcan.gc.ca/census-recensement/2006/dp-pd/hlt/97-561/T603-eng.cfm?SR=1>
14 City of Vancouver, Transportation Trends
7
Figure 2: Mode Share of All Trips to Downtown Vancouver15
The majority of trips to the downtown are made by transit, foot, or bike.
2.3 The Olympic Transportation Plan
The bidding process to host the XXI Olympic Winter Games was won by
Vancouver on July 2nd, 2003. In preparation for the Olympics, the Vancouver
Organizing Committee (VANOC) proposed that three venues located in
downtown Vancouver be used for the staging of the Games. These venues were
BC Place Stadium for the opening, closing, and victory ceremonies, the
Vancouver Convention Centre for the Main Media Centre, and Canada Hockey
Place for Ice Hockey. In addition, leading up to the Games, plans were being
developed for pavilions to be set up in the downtown for the Olympics.
15
Data source: City of Vancouver, Vancouver Transportation Plan Progress Report
Auto Driver, 30%
Auto Passenger, 9%
Transit, 30%
Walk, 27%
Bike, 3%
8
Consequently, many visitors, including members of the Olympic family16 and out
of town tourists, and residents attending Olympic events and activities were
expected to fill the downtown peninsula of Vancouver. Left alone, this increase in
the number of people in the downtown could create potentially challenging
transportation conditions characterized by high congestion and immobility for
those travelling into, out of, and within the downtown.
2.3.1 Olympic Transportation Challenges
The need to accommodate the travel demand from an influx of visitors and
residents represented one of the main challenges for downtown Vancouver‟s
transportation system. Another challenge involved maintaining acceptable
conditions for residents who needed to travel for the purposes of work, shopping,
or leisure. As well, Games-time operation required the addition of a
transportation system that was operated by VANOC to move athletes, media,
officials, and other Olympic Games clientele.
Predictions were that approximately 10,000 accredited media, 5,500
athletes, and 55,000 members of the workforce were to be located in the
Vancouver and Whistler areas. Approximately 135,000 spectators per day were
expected to attend sporting events in Vancouver and 60,000 people per day were
expected at the two LiveCity gathering sites17. It was also estimated that at any
one time, there could be approximately 100,000 people on the streets of
16
The Olympic Family includes Organizing Committees for the Olympic Games; athletes and their families, National Olympic Committees; International Sport Federations; United Nations agencies; sponsors; and the media.
17 VANOC, Fact Sheet: Transportation Planning for the 2010 Olympic Winter Games, (VANOC, 2009)

9
downtown Vancouver18. As Ken Hardie, spokesperson for TransLink, suggested,
“the daily number of people roaming the downtown core for Olympic
entertainment on any given night would be equivalent to the crush after a
summer fireworks night coupled with a Madonna concert”19.
At the same time, Olympic venues and other large special events required
that certain streets be closed for staging and security purposes. As a result,
there was going to be reduced space in the downtown available for vehicles,
pedestrians, and cyclists. In fact, the OTP stated that “Games-time operations
will reduce the capacity of the local road network into downtown by 50 per cent
from the east, and overall into downtown by 20 per cent”20. The OTP suggests
that to accommodate the increased travel demand and to facilitate travel during
the Olympic Games, a minimum 30% reduction in vehicle traffic would be
required for downtown Vancouver. As for the transit system, it was suggested
that the system would need to handle a 33% increase in the number of daily
transit trips during the Olympics, which would be equivalent to an additional
230,000 trips21.
2.3.2 Transportation Strategies
In anticipation of these potential transportation problems, VANOC, the City
of Vancouver, the Resort Municipality of Whistler, TransLink, BC Transit, the
18
Ken Hardie, spokesperson for TransLink in Kelly Sinoski, “TransLink expecting nearly a million passengers a day during 2010 Games”, Vancouver Sun, Mar 3, 2009
19 Kelly Sinoski, “Nine major downtown Vancouver traffic routes to close for the Olympics”, Vancouver Sun, Oct 14, 2009
20 VANOC, Fact Sheet
21 Ibid.
10
provincial Ministry of Transportation and Infrastructure, and the 2010 Integrated
Security Unit (ISU) assembled the Olympic and Paralympic Transportation Team
(OPTT). One of their main goals was to develop transportation initiatives for the
downtown that would mitigate potential transportation problems. The outcome of
this process was the 2010 Olympic Transportation Plan (OTP). The overall goals
of the OTP were to
Ensure safe, reliable, accessible travel during the 2010 Winter Games,
Take into account everyone‟s travel needs,
Make the best use of the existing transportation networks,
Reduce vehicle traffic during the Games, and
Create legacies of sustainable transportation choices22.
Details of the OTP were publicly released in phases in March and October
2009. In the downtown, the OTP called for an Olympic route network to be
established, which consisted of designated Olympic lanes for VANOC accredited
vehicles, emergency vehicles, and TransLink buses. A number of temporary
road closures in the downtown were also set out in the OTP. Six major roads
were identified for closure to the public for security purposes23 and four
pedestrian corridors were identified which would require the closure of additional
roads in the downtown to motor vehicles from noon to midnight every day24.
Other temporary road modifications named in the OTP included extending rush-
hour parking and turn restrictions, implementing new 24 hour parking restrictions,
22
Ibid. 23
In downtown, these are Expo Boulevard, Pacific Boulevard, Georgia Viaduct, Dunsmuir Viaduct, Canada Place Way and Waterfront road.
24 The four corridors would consist of 32 pedestrian only blocks running along Granville Street from Helmcken to W. Hastings street, Robson Street from Beatty to Jervis Streets, Hamilton Street from Drake to Georgia Streets, and Beatty Street from Smithe to Dunsmuir Streets.
11
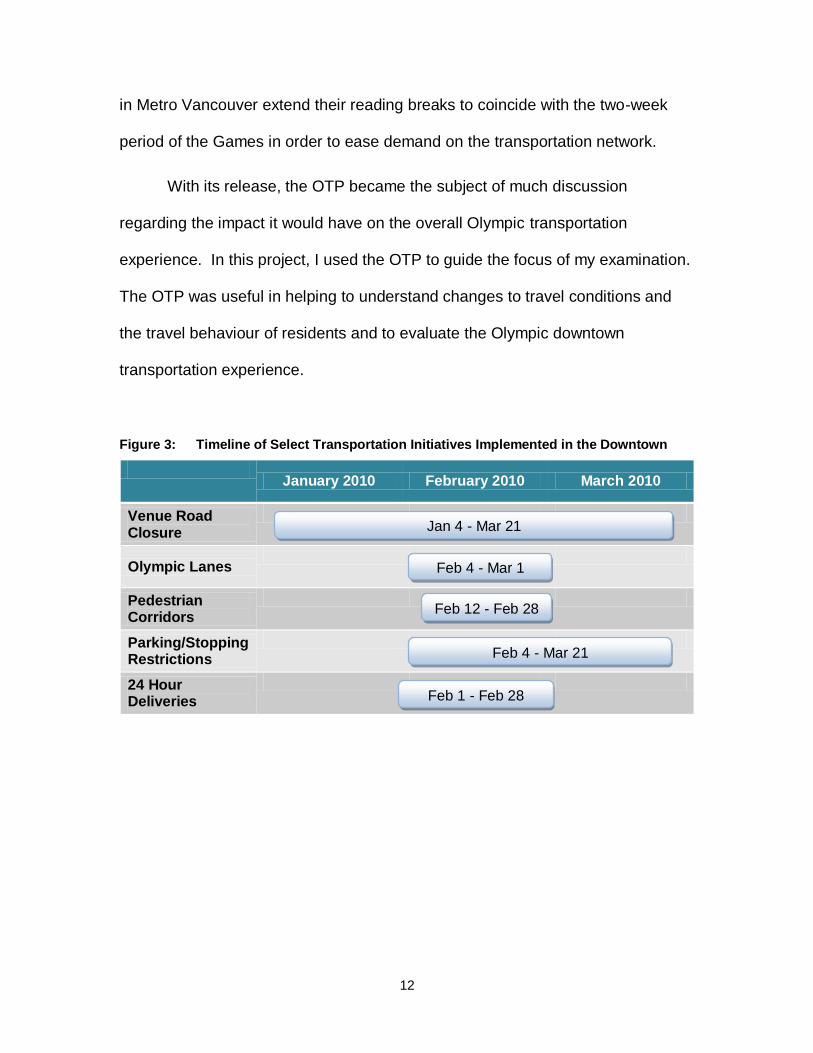
and modifying traffic signals. As well, the OTP stated that temporary changes to
existing bike routes would be made and some temporary bike parking in the
downtown would be established for the Games. Additionally, pedestrians and
cyclists would be provided with improved wayfinding and signage (see Figure 3
for a timeline of the implementation of select initiatives).
The OPT also outlined a number of Games-time transit improvements
affecting the downtown. These include
Adding more trips to the West Coast Express,
Providing an additional 180 buses where required,
Providing 30 additional HandyDART25 vehicles,
Establishing a free streetcar line known as the Olympic Line which
would run just outside the edge of the downtown,
Making available a limited edition two month souvenir transit pass,
Providing for all ticketed Olympic spectators unlimited access to public
transit for the day of the event, and
Extending the operating hours of the Expo Line and SeaBus.
Lastly, two other major initiatives relevant to the downtown were named in
the OTP. The first was the creation of a TravelSmart „Know Before You Go‟
campaign. This campaign would involve the creation of a transportation
management centre that would address transportation issues and provide real-
time updates to the public about travel conditions. The public would be
encouraged to use travel tips and travel information to plan their trips accordingly
during the Games. The second initiative was to have post-secondary institutions
25
HandyDART is a door-to-door shared ride public transit service aimed at travellers with physical or cognitive disabilities.
12
in Metro Vancouver extend their reading breaks to coincide with the two-week
period of the Games in order to ease demand on the transportation network.
With its release, the OTP became the subject of much discussion
regarding the impact it would have on the overall Olympic transportation
experience. In this project, I used the OTP to guide the focus of my examination.
The OTP was useful in helping to understand changes to travel conditions and
the travel behaviour of residents and to evaluate the Olympic downtown
transportation experience.
Figure 3: Timeline of Select Transportation Initiatives Implemented in the Downtown
January 2010 February 2010 March 2010
Venue Road Closure
Olympic Lanes
Pedestrian Corridors
Parking/Stopping Restrictions
24 Hour Deliveries
Jan 4 - Mar 21
Feb 4 - Mar 1
Feb 12 - Feb 28
Feb 4 - Mar 21
Feb 1 - Feb 28
13
3: LITERATURE REVIEW
A core component of the Olympic Transportation Plan (OTP) is the use of
transportation strategies that fall under the term transportation demand
management (TDM). To better understand and inform analysis of the OTP and
its impacts during the Olympics, I draw upon literature to review the concept of
TDM. I explore the history of TDM including its emergence in public policy and
experiences with the implementation of TDM. In doing so, I develop an
understanding for the role that TDM currently plays in public policy and reveal the
uncertainty that surrounds TDM in terms of its effectiveness. Research into this
uncertainty highlights the importance of considering the structural, psychological,
and random factors that influence travel behaviour when analyzing the impacts of
TDM strategies such as those in the OTP.
In addition, I examine the applications of TDM. In doing so, I identify two
sets of transportation challenges for which lessons from the Olympics could be
generated. This review also provides insight into the nature of current and future
transportation challenges facing cities and the gaps that exist in research.
Lastly, literature on Olympic transportation was examined. This literature
helps to outline the opportunities to generate transportation lessons from
examining the transportation experience during an Olympic Games. Examining
past studies also helped to shape and inform the methodology for this research
project.

14
3.1 TDM and Travel Behaviour
3.1.1 Definition and Emergence of TDM
According to Transport Canada26, the term TDM, also referred to as
mobility management, encompasses a wide range of policies, programs,
services, and products developed by transportation planners with one primary
purpose - to achieve transportation goals by influencing people‟s travel
behaviour. A common way of viewing TDM is that it involves the use of a carrot
and stick approach where incentives and disincentives could be provided to
induce people to make certain transportation choices. The outcome of
implementing TDM policies as anticipated by planners and policymakers is that
travellers will make one or more of several changes such as,
Changes to the amount of travel (e.g. reducing the total number of trips
taken),
Changes to the routes taken (e.g. shifting trips from congested routes
to less congested routes),
Changes to the time of travel (e.g. shifting trips from congested times
to less congested times), and
Changes to the mode of travel (e.g. shifting trips from low occupancy to
high occupancy travel modes).27
In the United States, the beginnings of TDM have been traced by Michael
Meyer28 and Martin Wachs29 to the early 1970s. According to Wachs, for three
26
Transport Canada, “TDM definition, overview, and rationale”, Transport Canada, 2010, <http://www.tc.gc.ca/eng/programs/environment-utsp-tdmintro-1039.htm>
27 Derived from Greater Vancouver Regional District, Greater Vancouver Region Transportation Demand Management Project: Final Report, (GVRD, 1996)
28 Michael D. Meyer, “Demand management as an element of transportation policy: using carrots and sticks to influence travel behaviour”, Transportation Research Part A, 33, (1999) 575-599
15
decades after the Second World War, public policy in the US was focused on the
construction of new infrastructure such as highways and transit facilities. New
infrastructure would provide adequate capacity for increasing travel demand.
However, the early 1970s was a time when a new concept was introduced at the
federal and local levels. This new concept was centred on better managing
existing urban transportation systems in ways that could allow increasing travel
demand to be satisfied without building more capacity.
According to Meyer and Wachs, new interest in managing travel demand
arose mainly in response to three factors. The first was growing pressure from
the public to address transportation challenges such as traffic congestion. The
second was a declining funding base available for the construction of new
transportation infrastructure. Finally, the third was the focus of federal and state
law on reducing the use of single occupant vehicles (SOVs). This last factor
arose from concerns related to the oil supply disruptions of the 1970s and
concerns over the environmental consequences of heavy reliance on the
automobile. According to Meyer, the result of this new interest was a clear shift
in policy away from moving more vehicles towards more efficient movement of
people that continued well into the 1990s.
In Canada, the movement towards managing travel demand appears to
have come at a later time in the 1990s. In a paper published in 1997, Russ
29
Martin Wachs, “Policy Implications of Recent Behavioural Research in Transportation Demand Management”, Journal of Planning Literature, 5, (1991) 333-341
16
Robinson30 presents the beginnings of what appeared to be a paradigm shift
towards the use of TDM strategies in Canada. He suggests that Canadian
municipalities were beginning to realize that financial resources to support
policies of major expansions of infrastructure would not be available. As well,
there was growing recognition among municipalities that the “past reliance on
technology alone to address energy and environmental impacts of transportation
must now be modified to include the fundamental social change that is the
primary focus of TDM”31. Robinson suggests that these factors would prompt
governments to consider TDM-based transportation options for the future.
Today, TDM appears to be recognized as an important transportation
policy option across Canada. This can be exemplified by Transport Canada and
their development of a TDM resource centre32 which currently profiles the use of
TDM strategies around the world and whose purpose is to act as a starting place
for Canadian cities to understand how they can increase sustainable
transportation options. As well, the Federation of Canadian Municipalities33 has
recognized the benefits of TDM and the important role that TDM can play in the
future of cities. Recognition can be seen through their development of resources
and tools to promote the use of TDM in cities34.
30
Russ Robinson, “Transportation demand management in Canada: an overview”, Energy policy, 25, (1997) 1189-1191
31 Ibid., pg. 1190
32 Transport Canada, “Transportation Demand Management (TDM) Resource Centre”, 2010, <http://www.tc.gc.ca/eng/programs/environment-utsp-tdmresources-1051.htm>
33 The Federation of Canadian Municipalities (FCM) is the national voice of municipal governments in Canada since 1901.
34 For example, see Federation of Canadian Municipalities, Improving Travel Options with Transportation Demand Management (TDM), (FCM, 2008)
17
3.1.2 Effectiveness of TDM
Yet, despite the lengthy history of TDM implementation especially in the
US and the numerous studies conducted by researchers to examine the effects
of TDM, there appears to be an ongoing debate over the prospects of TDM and
its potential for achieving significant changes in travel behaviour. My
examination of studies involving the use of mathematical simulations and
analysis based on empirical evidence has shown varied results.
On the one hand, there are arguments and evidence for TDM as
demonstrated by Todd Litman35 who profiles many successful TDM programs
from around the world On the other hand, there are arguments and evidence
against TDM as an effective strategy for changing travel behaviour and
addressing transportation problems. For example, Pascal Poudenx36 examines
TDM strategies deployed in cities around the world and finds evidence that they
are failing to reduce private vehicle use.
A number of researchers have looked into the literature on TDM and have
found some issues that exist with past research, which could explain the varied
results. Jennifer Dill and Erin Wardell37 explain the difficulty and complexities of
evaluating TDM programs. They state that TDM programs can be “diverse in
scope and involve individual behaviour patterns, which are complex and difficult
35
Todd Litman, “Success stories: Examples of TDM Programs that work”, Victoria Transport Policy Institute, 2010, <http://www.vtpi.org/tdm/tdm71.htm>
36 Pascal Poudenx, “The effect of transportation policies on energy consumption and greenhouse gas emission from urban passenger transportation”, Transportation Research Part A, 42, (2008) 901-909
37 Jennifer Dill and Erin Wardell, “Factors affecting worksite mode choice: findings from Portland, Oregon”, Transportation Research Record: Journal of the Transportation Research Board, 1994, (2007) 51-57
18
to measure.”38 Moreover, they point out that rarely do TDM programs exist in a
vacuum. Rather, TDM programs are usually implemented as part of larger
regional efforts to address transportation challenges. As such, accounting for
other changes adds to the difficulties and complexities of evaluating TDM.
In the third International Symposium on the success and failure of TDM
measures39, there was a general consensus among participants that past
research on the implementation and assessment of impacts of TDM measures
suffers from a number of methodological issues. Among the critiques were that
some of the work produced was too simplistic and ignored the dynamics of
behavioural response. As well, many so-called proofs were flawed or based on
flawed assumptions. This critique also appears in a study conducted for the
National Cooperative Highway Research Program that examines TDM
strategies40. The study states, “Few evaluation studies have been conducted
using robust and consistent methods.”41 Limited funding for evaluation efforts is
one reason that n given in the study for the current state of research.
Finally, David Ungemiah and Casey Dusza42 point out that to date, there is
limited research that has identified metrics that can be used to compare TDM
38
Dill, “Factors affecting worksite mode choice”, pg. 51 39
Wafaa Saleh, “Success and failure of transportation demand management: Is congestion charging the way forward?”, Transportation Research Part A, 41, (2007) 611-614
40 Cambridge Systematics Inc. and Eastern Research Group Inc., Evaluate the Interactions between Transportation-Related Particulate Matter, Ozone, Air Toxics, Climate Change, and Other Air-Pollutant Control Strategies, (National Cooperative Highway Research Program, 2010)
41 Cambridge Systematics Inc., Evaluate the Interactions, pg. 6
42 David Ungemiah and Casey Dusza, “Transportation Demand Management Benchmark: Results from 2008 TDM Program Survey”, Transportation Research Record: Journal of the Transportation Research Board, 2118, (2009) 55-66
19
programs. As well, it has been pointed out43 that the potential effectiveness of
some TDM strategies such as telecommuting is evolving due to changes in
technology.
In summary, much of the research on the effectiveness of TDM appears to
be characterized by poor methodology and weak analysis. This makes it difficult
to determine the theoretical and practical implications of research. Therefore,
there does not appear to be strong consensus about the potential of TDM to
address transportation challenges and there remains uncertainty about the
impact that TDM can have on travel behaviour. However, this state of research
has not deterred TDM from being seriously considered in public policy. Promise
has been shown from some TDM programs. As well, the factors that led to the
emergence of TDM in public policy have not disappeared. These factors include
pressure to address transportation problems, limited resources for new
infrastructure, recognition of the problems associated with reliance on the
automobile, and realization that technology by itself might not be the solution to
transportation problems.
3.1.3 Travel Behaviour
The varied results from past evaluations of TDM programs highlight the
importance of analyzing the factors that influence people‟s travel behaviour. This
is one point that appears in Saleh‟s paper, which criticizes some of the work on
TDM as “ignor[ing] the dynamics of behavioural response.”44 This sentiment
43
Cambridge Systematics Inc., Evaluate the Interactions 44
Saleh, “Success and failure”, pg. 611
20
seems to have resonated with researchers because it appears that TDM
research has been evolving over the years to include analysis of travel
behaviour. Dill and Warnell45 note that recent research has attempted to explain
what factors influence the results of TDM programs.
I have identified three sets of factors that influence travel behaviour and
may determine and influence the outcome and effectiveness of a TDM strategy.
Structural factors are one set of factors that has been found to be statistically
significant in influencing travel decisions. These factors include the quantity of
goods and services available such as the frequency and speed of a travel mode
and the user cost of travel such as travel time and the price of fares46. The
second set is psychological factors such as people‟s beliefs, attitudes, and
values. The third set is random factors, which can include media coverage and
past travel behaviour.
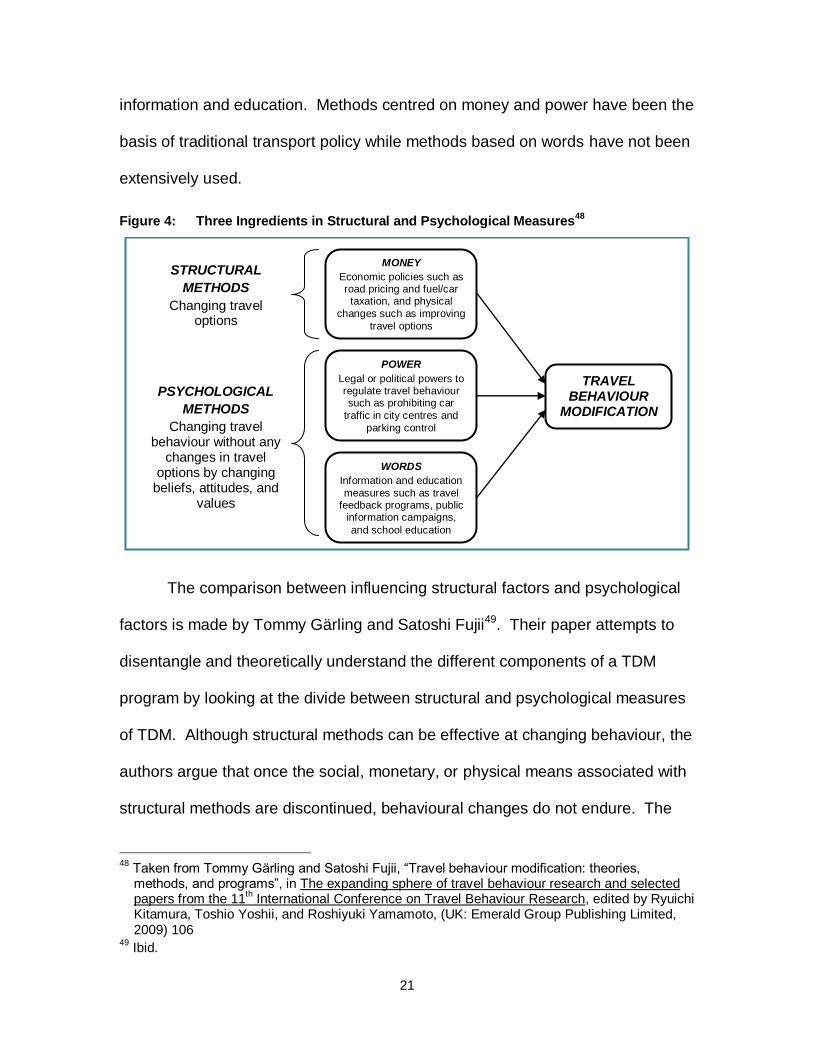
According to Satoshi Fujii47, money, power, and words represent three
ingredients that planners and policymakers can use to influence the structural
and psychological factors that shape travel behaviour (see Figure 4). Money
refers to economic factors that can include goods and services; power can refer
to physical power such as barriers and legal power such as regulations; and
words can refer to different forms of communication including providing
45
Dill, “Factors affecting worksite mode choice”, 2007 46
Stéphanie Souche, “Measuring the structural determinants of urban travel demand”, Transport Policy, 17, (2010) 127-134
47 Satoshi Fujii, “Retrospectives and Perspectives on Travel Behavioural Modification Research: A report of the “Behavioural Modification” Workshop”, in The expanding sphere of travel behaviour research and selected papers from the 11
th International Conference on Travel
Behaviour Research, edited by Ryuichi Kitamura, Toshio Yoshii, and Roshiyuki Yamamoto, (UK: Emerald Group Publishing Limited, 2009)
21
information and education. Methods centred on money and power have been the
basis of traditional transport policy while methods based on words have not been
extensively used.
Figure 4: Three Ingredients in Structural and Psychological Measures48
The comparison between influencing structural factors and psychological
factors is made by Tommy Gärling and Satoshi Fujii49. Their paper attempts to
disentangle and theoretically understand the different components of a TDM
program by looking at the divide between structural and psychological measures
of TDM. Although structural methods can be effective at changing behaviour, the
authors argue that once the social, monetary, or physical means associated with
structural methods are discontinued, behavioural changes do not endure. The
48
Taken from Tommy Gärling and Satoshi Fujii, “Travel behaviour modification: theories, methods, and programs”, in The expanding sphere of travel behaviour research and selected papers from the 11
th International Conference on Travel Behaviour Research, edited by Ryuichi
Kitamura, Toshio Yoshii, and Roshiyuki Yamamoto, (UK: Emerald Group Publishing Limited, 2009) 106
49 Ibid.
MONEY
Economic policies such as road pricing and fuel/car
taxation, and physical
changes such as improving
travel options
POWER
Legal or political powers to regulate travel behaviour such as prohibiting car
traffic in city centres and
parking control
WORDS
Information and education
measures such as travel feedback programs, public
information campaigns,
and school education
TRAVEL BEHAVIOUR
MODIFICATION
STRUCTURAL
METHODS
Changing travel options
PSYCHOLOGICAL
METHODS
Changing travel behaviour without any
changes in travel options by changing
beliefs, attitudes, and values
22
authors continue to argue that unless forced by social, monetary, or physical
means, a change in travel behaviour is determined by changes in an individual‟s
beliefs, attitudes, and/or values. As such, the authors suggest that if actual
behaviour is to an extent dependent on these factors then psychological methods
may have an advantage in terms of effectiveness. In the end, they suggest that
psychological TDM measures such as providing information could be more
important in driving change than structural measures.
The analysis by Ryuichi Kitamura et al.50 also speaks to the importance of
psychological aspects of travel changes. The authors argue that a TDM scheme
will not work unless a certain majority of individuals abide by the rule set out by
the scheme. They explain that if the rule is not observed by the majority of
individuals, then there would be less incentive for an individual to comply with it.
I think this is a perspective that is particularly relevant to certain TDM schemes
such as those employed during special events where there is greater media
attention and a higher likelihood for people to see others following the rule.
Their analysis also adds another set of factors that are important to
consider when thinking about travel behaviour. They argue that whether or not
policy measures can be successful may also depend on random factors. These
random factors include media coverage and initial conditions. Initial conditions
refers to the initial compliance rate of individuals and “implies path dependence in
the system‟s behaviour; its future behaviour depends on its past behaviour.”51
50
Ryuichi Kitamura, S. Nakayama, and T. Yamamoto, “Self-reinforcing motorization: can travel demand management take us out of the social trap?”, Transport Policy, 6, (1999) 135-145
51 Ibid., pg. 143
23
Through the use of simulations, the authors argue that in the end, the
effectiveness of a TDM measure is subjected to a large extent to these chance
elements.
These three factors, structural, psychological, and random, thus appear to
be significant determinants of people‟s travel behaviour. Therefore, it will be
important to take into account these factors when analyzing and interpreting the
impact of the OTP and the outcome of the Olympics downtown transportation
experience.
3.2 Transportation Challenges Facing Cities
TDM has been examined and advocated by planners, researchers, and
policy makers as a possible solution for addressing many transportation
challenges that are facing cities. It is revealed in the literature how TDM can
provide travel options that can be used on a daily basis or during an episodic
event. This ability makes TDM important for enhancing the resilience of the city.
The concept of a resilient city is described by Peter Newman et al.52 as having
“built-in systems that can adapt to change, such as a diversity of transport and
land-use systems”53. This quality is important because it allows cities to better
deal with future transportation challenges and to respond to potential crises such
as peak oil and climate change thereby avoiding collapse.
52
Peter Newman, Timothy Beatley, and Heather Boyer, Resilient Cities: Responding to Peak Oil and Climate Change, (Washington: Island Press, 2009)
53 Ibid., pg. 6
24
This section focuses on understanding these transportation challenges
that TDM has been linked to as a potential solution and determining the potential
applications of lessons generated in this research project. I also examine the
state of research regarding how cities could address these challenges. Doing so
helps to provide an understanding of the current research needs of planners and
policy makers by identifying limitations and gaps in past research. This is useful
in helping to inform analysis of the Olympic experience so that useful and
relevant lessons can be generated for planners and policy makers.
3.2.1 Long Term Transportation Planning
The first type of transportation challenge that has been linked to TDM
involves preparing cities to be more sustainable in the long term. This challenge
involves dealing with problems like congestion and pollution. TDM could be one
possible solution for addressing these challenges due to its ability to influence
travel behaviour and potentially encourage people to travel in more sustainable
ways.
Sustainable Transportation
Many researchers and policymakers have noted the potential role that
TDM can play in promoting sustainable transportation by encouraging behaviour
changes over the long term that are consistent with the goals of sustainability.
This appears to be the focus of the majority of research regarding TDM.
The interest in using TDM to promote sustainable transportation can be
linked to the growing recognition among researchers, policy-makers, and
25
planners that current transportation systems are not sustainable environmentally,
economically, and socially and that there is a need to develop more sustainable
transportation systems in cities around the world. This sentiment has been
expressed in a number of academic research articles as well as government and
institutional documents such as in TransLink‟s Transport 2040 document which
describes TransLink‟s dedication to “creating and sustaining a transportation
system that meets the needs of residents, businesses, and goods movers, in a
manner that protects the environment and supports the economic and social
objectives of the region.”54
As indicated in the previous section on the emergence of TDM, one of the
reasons why TDM emerged in the field of transportation planning was in
response to the consequences of cities being over-reliant on the automobile.
Because automobiles run by burning products derived from petroleum, they emit
carbon emissions and other air pollutants. For this reason, Tommy Gärling et al.
argue that automobiles are a major contributor to air pollution and climate
change55.
Furthermore, in light of the finite amounts of fossil fuels, there is the
argument that the growth of automobile use simply cannot go on forever and that
the cost of travel will increase as fuel prices rise thereby significantly limiting the
54
TransLink, Transport 2040, (TransLink, 2008). Transport 2040 is the document that constitutes the long term strategy for the regional transportation system.
55 Tommy Gärling, Anita Gärling, and Peter Loukopoulos, “Forecasting Psychological Consequences of Car Use Reduction: A Challenge to an Environmental Psychology of Transportation”, Applied Psychology: An International Review, 51.1, (2002) 90-106
26
mobility of individuals56. Many experts including Richard Gilbert and Anthony
Perl57 argue that oil production will peak early this decade, possibly in the year
2012. The ramifications of this peak are made clear by Gilbert and Perl who
identify the dependency of current transportation on oil as a fuel source with
about 95% of the fuel used for transport being a liquid petroleum product made
from crude oil58. Consequently, continuing current rates of oil use by
transportation is at threat and needs to be addressed.
Many commentators have also noted the social consequences of current
transportation systems that are over-reliant on the automobile. Robert Gifford
and Linda Steg59 note that in the United States, 44% of all accidental deaths are
the result of a motor vehicle accident, which they point out does not include the
much larger number of citizens who were injured in motor vehicle accidents nor
the number of family members and friends affected by these deaths or injuries.
In contrast, Gifford and Steg suggest that transit vehicles are safer. For example,
on a per passenger mile basis, automobiles are 25 times more likely to lead to
death than buses.
Although many lives are indeed lost as a result of motor vehicle accidents,
John Adams60 has made the point that increases in vehicular traffic and
56
OECD, Towards Sustainable Transportation, (OECD, 1996) 57
Robert Gilbert and Anthony Perl, Transport revolutions: moving people and freight without oil, (Sterling: Earthscan, 2008)
58 Ibid., pg. 120
59 Robert Gifford and Linda Steg, “The impact of automobile traffic on quality of life”, in Threats from Car Traffic to the Quality of Life, edited by Tommy Gärling and Linda Steg, (Netherlands: Elsevier, 2007)
60 John Adams, “The social implications of hypermobility”, in The Economic and Social Implications of Sustainable Transportation: Proceedings from the Ottawa Workshop, (OECD, 2000)
27
increases in traffic speeds are not correlated with increased road accident
fatalities but rather they are correlated with a decrease. This is because higher
levels of traffic mean that fewer people will attempt to cross the road and fewer
cyclists will venture onto the road. According to Adams, the biggest social cost of
this scenario would be children. Children would be increasingly confined to their
homes and be chauffeured by parents. The costs would include impairment of
social development and impairment of fitness as they get less physical exercise.
In fact, a study by Lawrence D. Frank et al.61 provides evidence that “each
additional hour spent in a car per day was associated with a 6% increase in the
likelihood of obesity”62. This would also have implications for all age groups.
Thus, one challenge facing cities appears to be moving away from over-
reliance on the automobile, which has become a fixture in current transportation
systems, towards sustainable forms of transportation such as transit, walking,
and cycling. As Tommy Gärling and Geertje Schultema63 put it, policy measures
must be implemented that decrease car use. TDM is one possible strategy that
could be effective at addressing this challenge. One of the roles that TDM can
play is to induce changes in travel behaviour such as encouraging a modal shift
away from the automobile and towards more sustainable modes of
transportation. However, as noted earlier, research on the effectiveness of TDM
61
Lawrence D. Frank, Martin A. Andresen, and Thomas L. Schmid, “Obesity Relationships with Community Design, Physical Activity, and Time Spent in Cars”, American Journal of Preventive Medicine, 27.2, (2004) 87-96
62 Ibid., pg. 87
63 Tommy Gärling and Geetrtje Schultema, “Travel demand management targeting reduced private car use: effectiveness, public acceptability, and political feasibility”, Journal of Social Issues, 63.1, (2007) 139-153
28
is still unclear and there is evidence that questions the role that TDM might have
in addressing transportation problems.
The use of technology is another solution that has been examined for its
role in creating a sustainable transportation system. Technological solutions
include improving the fuel efficiency of vehicles and using alternative fuel
sources. These solutions can be beneficial in substantially reducing vehicle
emissions and mitigating the adverse environmental effects of driving. As well,
technology can be important in the long run because of the energy and cost
savings that can be accrued. In addition, technological solutions are generally
viewed as being more acceptable to the public compared to behavioural changes
because technological solutions tend not to restrict the freedom to move.
However, Linda Steg and Robert Gifford64 make the point that there are
certain limits to technological solutions. For example, they note that
technological solutions are aimed at reducing the negative impact of driving on a
per car and per kilometre basis and do little to curb the use of cars. If anything,
these solutions may actually encourage more car use because drivers might be
“tempted to use their energy-efficient car more often because it is cheaper and
more environmentally friendly”65. As a result, Steg and Gifford argue that the
“mitigating effects of new technologies tend to be overshadowed by the
continuing growth of car use”66. Another point made by Steg and Gifford is that
64
Linda Steg and Robert Gifford, “Sustainable transportation and quality of life”, Journal of Transport Geography, 13, (2005) 59-69
65 Ibid., pg. 60
66 Ibid., pg. 59
29
technological solutions like energy efficient cars do little to solve social problems
such as health and safety.
Another advantage of TDM is that it is not subjected to the severe
technical and economic constraints that technological solutions face. According
to Moriarty and Honnery, these constraints make the technological breakthroughs
that are necessary for continuing along a high-mobility path unlikely to occur,
unlikely to make much impact regardless, and likely to increase the cost of
transportation.
Both local and regional governments in Vancouver have recognized the
challenges of developing a sustainable transportation system. This can be seen,
for example, in the City of Vancouver‟s Downtown Transportation Plan67 (DTP).
The DTP outlines the population and employment growth that is projected for
downtown Vancouver to the year 2021, which could pose challenges to the
sustainability of the city. It is expected that the number of residents living in
downtown Vancouver will reach 100,000 by the year 2021, a 62% increase over
25 years from 1996 population numbers. Similarly, employment in downtown
Vancouver is expected to rise to 175,000 jobs, up 33% from the 1996 figure of
132,000. Consequently, an increase of 18% in the total number of trips into
downtown Vancouver from beyond the downtown peninsula and an increase of
64% in the total number of trips made within the peninsula from 1996 levels are
projected for the year 202168.
67
City of Vancouver, Downtown Transportation Plan, (City of Vancouver, 2002) Available: <http://vancouver.ca/dtp/dtpfinalplan.htm>.
68 Figures are taken from the City of Vancouver, Downtown Transportation Plan

30
Similarly, Transport 204069 projects that the population in the region will
increase by 1 million people from 2.2 million in 2006 to 3.2 million in 2040. It
recognizes that this growth in population could put pressure on existing
infrastructure especially if private vehicle use continues to grow at its current
trend. The ongoing transportation challenge facing Vancouver is therefore to
accommodate the increase in the number of people travelling. An additional
constraint for the City of Vancouver is that they must do this without adding more
road capacity to the existing network of roads and bridges. This restriction was
put forth by the Vancouver Transportation Plan which recognized that road
capacity is finite and that even if more roads were to be built, they would simply
be filled with more cars and be congested70.
TDM is one strategy that has been recognized for a long time by the City
of Vancouver and Metro Vancouver for its potential to support sustainable
transportation. The importance of TDM has been formally recognized in guiding
policies. For example, TDM is recognized in the Transport 2021 long range
transportation plan71, which helps to guide regional transportation decision-
making to the year 2021. In the document, it suggests that TDM is the “most
promising public policy lever” that can be used to “change travel behaviour and
help solve urban transport problems.”72 It continues by pointing out that while
TDM is not a panacea, it is important because it can “postpone capital investment
69
TransLink, Transport 2040 70
This restriction is mentioned in „Section 3.1 - Terms of Reference‟ in the Downtown Transportation Plan.
71 Greater Vancouver Regional District and the Province of BC, A Long-Range Transportation Plan for Greater Vancouver: Transport 2021 Report, (GVRD and Province of BC, 1993)
72 Ibid., pg. 21
31
and reshape travel demand to boost transit and carpool use.”73 This principle of
“applying transportation demand management (TDM), to change the behaviour of
travellers in order to make better use of the existing transportation system”74 has
also been adopted by the City of Vancouver as an “essential framework for
transportation planning in the city”75 in the Vancouver Transportation Plan.
The role of TDM is also embedded in the Livable Region Strategic Plan76
(LRSP) adopted in 1996 by what is now Metro Vancouver. The LRSP recognizes
the importance of prioritizing sustainable modes of transportation and the need to
“have land use that brings origins and destinations together at sufficient
density”77. One strategy outlined in the LRSP is to “increase transportation
choice” through the following three policies:
1. Manage growth and development to reduce travel distances and
emphasize sustainable modes as priorities;
2. Encourage sustainable modes of transportation such as transit and
discourage others such as the single occupant vehicle,
3. Create a transportation system that supports the goals of the LRSP
including the development of complete communities78.
73
Ibid., pg. 21 74
City of Vancouver, “[3] Principles, Policies and Priorities”, (City of Vancouver, Engineering Services, 2010) Available: <http://vancouver.ca/engsvcs/transport/plan/1997report/3-1.htm>
75 Ibid.
76 The LRSP is the regional growth strategy that provides a framework for making decisions on regional land use and transportation.
77 Ken Cameron in Mike Harcourt, Ken Cameron, and Sean Rossiter, City Making in Paradise: Nine Decisions that Saved Vancouver, (Vancouver: Douglas & McIntyre, 2007) pg 134
78 Greater Vancouver Regional District, Livable Region Strategic Plan, (Burnaby: Policy and Planning; 1999)
32
The implementation of TDM strategies in the past ten years provides an
illustration of the role that TDM has played in Vancouver. A U-Pass program was
introduced to the University of British Columbia and Simon Fraser University in
September 2003. The U-Pass is a mandatory transit pass that is subsidized for
post-secondary students. This program was later expanded in 2009 to include
Capilano University and Langara College. Recently in June 2010, the Province
of BC announced the expansion of the program to a province wide initiative79.
The Urban Transportation Showcase Program (UTSP)80 also introduced a
number of TDM initiatives. The first was the TravelSmart pilot program, which
used information, incentives, and rewards to encourage people to reduce car
travel by being more informed about sustainable modes of transportation. The
delivery of individualized marketing to pilot communities in Metro Vancouver
began in October 2005 and the pilot program ended in October 2006. The
second was the development of plans for transit villages around two SkyTrain
stations in Metro Vancouver. The third was the Main Street Transit and
Pedestrian Priority Project, which aimed to achieve a modal shift from the car to
transit, walking, and cycling through the improvement of Main Street as a transit
and pedestrian environment.
79
Office of the Premier, “U-Pass BC to save students on transit fares”, Ministry of Transportation and Infrastructure, June 9, 2010
80 The UTSP is a Transport Canada initiative that helped to provide financial support to transportation strategies that reduce GHG emissions.

33
Analysis of these past TDM initiatives has indicated some success. A
study by Graham Senft81 indicates that the U-Pass had immediate success at
UBC. Data used by Senft indicates that by December of 2003, SOV traffic had
been reduced by 9% from 2002 levels and there was an increase of 51% in
transit trips made in Fall 2003 than in Fall 2002. However, walking and cycling
trips also decreased by 27% and 5% respectively over that period. This is
important to keep in mind when evaluating the program because it may not be
completely in keeping with the goals of sustainability to discourage those modes.
The TravelSmart pilot project also appeared to be successful in
encouraging people to reduce their car travel. This success is indicated by
survey data gathered by TransLink, which shows an increase in the number of
trips taken by sustainable modes (see Table 2 for survey results). However, it is
difficult to conclude whether this increase was due to residents shifting modes to
transit, walking, and cycling or due to an increase in the number of overall trips
taken.
81
Graham Senft, U-pass at the University of British Columbia: Lessons for Effective Demand Management in the Campus Context, 2005 Annual Conference of the Transportation Association of Canada, Calgary, 2005

34
Table 2: Change in Trips Taken By Mode Over the Duration of the TravelSmart Pilot Project
82
Neighbourhood
Travel Mode
Walk Bike Auto
Driver Auto
Passenger Transit
Kitsilano 3% 9% -13% 8% 5%
Richmond 14% 85% -6% 1% 35%
Burnaby 14% 85% -6% 1% 35%
South Surrey 28% 66% -7% 0% 17%
Coquitlam 8% n/a -3% -1% 14%
Tsawwassen 6% 54% -11% 12% 2%
Control Group 4% 8% -1% -5% 1%
A ‘before’ survey was launched in September 2005 and an ‘after’ survey was launched in September 2006. Data collected during the TravelSmart pilot project suggests there is potential effectiveness in providing travel information for influencing the mode of transportation used for trips.
This is not to say that Vancouver relies exclusively on TDM as a
transportation strategy. There has also been significant funding put into the
construction of new infrastructure. A new rapid transit line, the Canada Line, and
a major cycling and walking route, the Central Valley Greenway83, were recently
completed in 2009. As well, new technology has been investigated in the
transportation system including new bus technology like buses that run on biofuel
or compressed natural gas. There has also been experimentation with electric
82
Taken from TransLink, “TravelSmart Pilot Project”, TransLink, <http:www.translink.ca/en/Plans-and-Projects/Urban-Showcase/Travel-Smart-Pilot-Project.aspx>. Note that no data was available for „motorcycle‟.
83 The Central Valley Greenway is a 24 km route linking Vancouver, Burnaby, and New Westminster.
35
and hydrogen powered automobiles. However, it is important to note that there
has also been expansion in highway capacity in the region from projects like the
Gateway Program84, which may work against the effectiveness of TDM.
While Vancouver has a history of implementing TDM programs, it is hard
to say that they are necessarily a leader in TDM but it does appear they have
been keeping up with the growing use of initiatives in North America. This is
because the initiatives described above had been implemented in many areas
prior to Vancouver. For example, a U-Pass program was initiated at the
University of Washington in September 1991. That program was also successful
by decreasing vehicle trips to campus by 16% and increasing transit ridership by
35%85. As well, the City of Portland implemented two two-year TravelSmart pilot
programs – one in 2002 and a larger one in 2005. These programs were
successful in producing a 12% reduction in vehicle miles travelled, 9% decrease
in car travel, and 8% increase in walking, cycling, and transit in the targeted
neighbourhoods86.
As well, TDM strategies appear to be commonly utilized in municipalities
across Canada. For example, in 2002, Calgary was the first municipality to offer
a regional rideshare program in Canada and the Waterloo region in Ontario has
implemented a „You Can Clear the Air‟ program that adds curriculum to grade 3
84
The Gateway Program is a provincial initiative that involves the construction and expansion of a number of highways in the region.
85 M.E. Williams and K.L. Petrait, “U-Pass: A model transportation management program that works”, Transportation Research Record, 1404, (1993) 73-81
86 Transport Canada, “Targeted marketing and outreach”, Transport Canada, <http://www.tc.gc.ca/eng/programs/environment-utsp-tdm-prj49e-953.htm>
36
students that provides education on transportation choices and air quality issues.
Many other examples are profiled in Transport Canada‟s TDM resource centre.
3.2.2 Planning for Episodic Events
The second type of transportation challenge linked to TDM is episodic
events, which involve major and sudden disruptions to transportation systems.
These disruptions can come from a variety of sources and can potentially cause
entire cities to grind to a halt. Episodic events can affect travel demand such as
during a special event where large numbers of people travel to one location in the
same time period. Travel supply can also be affected such as during a disaster
where portions of a transportation system are damaged or destroyed. Either
way, the balance between travel demand and supply are brought out of balance
and this can cause ramifications for residents and the city as a whole.
TDM has been suggested as a solution to help bring the demand and
supply of travel back into line thereby helping to minimize interruptions and
mitigate the negative impacts of disruptions on the city.
Energy Crisis
A study by Robert B. Noland et al87 suggests that major oil disruptions that
affect the mobility of residents could be one transportation challenge that TDM
may be suited for as a transportation strategy. Geopolitical situations, natural
disasters, and coordinated terrorist attacks on critical energy infrastructure are
87
Robert B. Noland, William A. Cowart, and Lewis M. Folton, “Travel demand policies for saving oil during a supply emergency”, Energy Policy, 34 (2006) 2994-3005

37
some of the potential sources for oil disruptions. Noland et al.88 suggest that
TDM is one strategy that could be employed during an oil disruption to reduce
travel demand, which would in turn reduce the demand for fuel. The authors
state that during a crisis, some TDM strategies might be suitable for offering
customers more flexibility which could result in less economic hardship compared
to alternative strategies such as mandatory fuel rationing. The potential
disruptions for Metro Vancouver can be exemplified by its large modal share for
private car use (see section 2.2 for modal share).
Another potential energy crisis could involve electric power outages.
While this has not been studied extensively89, it is important to point out that
traffic signals and street lights are powered by electricity as well as other vital
parts of the transportation system such as gasoline pumps, electric trolley buses,
and rail systems. As demonstrated by experience in the recent past, electric
power outages could have significant ramifications on transportation. For
example, coverage by the local media of the power outage in downtown
Vancouver on August 26th, 2006 noted that “just before 5 p.m., eastbound traffic
on Georgia Street was at a near standstill as far back as Jervis Street” and “at
Hornby and Georgia streets, many vehicles ignored the temporary stop signs as
cars darted into the intersection from all directions. Pedestrians huddled together
for safety as they crossed the road.”90 A longer power outage occurred on the
88
Ibid. 89
There appears to be some research that examines the vulnerability of the North American electric grid system (for example see Reka Albert, Istvan Albert, and Gary L. Nakarado, “Structural vulnerability of the North American power grid”, Physical Review E, 69.2, (2004) 025103) but limited research on its implications for transportation.
90 Vancouver Sun, “Power outage causes chaos downtown”, Vancouver Sun, Aug 26
th, 2006
38
morning of July 14th, 2008 and it took approximately 3 days before power was
fully restored to customers91. A study of the impact of this power outage on
businesses indicated that employees had difficulty getting to work, there was
difficulty in getting deliveries, and businesses experienced reductions in the
number of customers92.
Natural and Human Disasters
Natural disasters such as earthquakes can cause major disruptions to
travel and severe damage to a city or region‟s transportation infrastructure. For
example, during the 1994 Northridge earthquake in Los Angeles, severe damage
was done to 4 major freeways and parts of arterial networks93. Human disasters
can include transit strikes and the collapse of transportation infrastructure from
criminal or accidental means. Transportation systems could fall victim to terrorist
attacks such as the July 7th, 2005 attack that occurred on London‟s Underground
Tube system. Accidents could also affect the mobility of commuters. For
example, in September 2006, a portion of the Papineau-Leblanc Bridge in Laval,
suddenly collapsed affecting the commuters in the 57,000 cars that cross the
91
BC Hydro, “Press Release: Report released on downtown Vancouver power outage”, BC Hydro, Sept 29, 2008, <http://www.bchydro.com/news/articles/press_releases/2008/report_released_on.html>
92 Study and results from Rajan Dhariwal, “Downtown Vancouver Blackout 2008: Assessing Disruptions to Businesses”, UBC Centre for Human Settlements, March 16
th, 2010
93 Genevieve Giuliano and Jacqueline Golob, “Impacts of the Northridge earthquake on transit and highway use”, Journal of Transportation and Statistics, 1.2, (1998) 1-20
39
bridge daily94. These examples illustrate the potentially disruptive effect that a
single event can have on the mobility of commuters.
For these types of disruptions, Transport Canada95 suggests that TDM
strategies can be used to help minimize interruptions to travel and other effects.
According to Transport Canada, “communities that have well-established TDM
programs can often cope better with such disruptions because transportation
alternatives are already in place.”96 Specific benefits regarding the use of TDM
strategies can include contributing significantly to getting employees to and from
work safely and maintaining economic viability and community cohesion following
a disaster. TDM is especially important given that immediate infrastructure
improvements or repair can be unrealistic and unfeasible in post-disaster
situations.
In Vancouver, the risk and ramifications of an earthquake are described by
Karthick Pathman97 who states that “over the next 10 years, research suggests
that there is a 2.5% probability that a structurally damaging earthquake could
strike Metro Vancouver. Over the next 50 and 100 years, this probability
increases to 12% and 22%, respectively”98. This risk is due to the tectonic
setting of Vancouver, which is located near the boundary between the oceanic
plate of Juan de Fuca and the North American plate.
94
Transport Canada, “TDM strategies during transportation disruptions and episodic events”, Transport Canada, 2010, <http://www.tc.gc.ca/eng/programs/environment-utsp-casestudy-cs75etdmstrategies-890.htm>
95 Ibid.
96 Ibid.
97 Karthick Pathman, Urban change and transportation vulnerability to earthquakes: the case of metro Vancouver, Masters thesis, University of British Columbia, Vancouver, 2010
98 Ibid., pg. 1 Pathman cites research by Onur and Seemann, 2004
40
The ramifications of damage to Metro Vancouver bridges is described by
Pathman who points out that because of Metro Vancouver‟s unique geography,
the region relies on a suite of bridges. This is especially true with downtown
Vancouver, which is served by four bridges. Pathman also makes the point that
earthquakes can cause damage to public transit infrastructure. In Vancouver,
this infrastructure would consist of SkyTrain guideways and stations, many of
which are elevated, as well as the SkyBridge, which is a bridge for SkyTrain that
spans the Fraser River. Moreover, Vancouver‟s trolley bus fleet, which has been
described as the “backbone of transit service in Vancouver”99 as trolleys serve on
some of the busiest routes in Vancouver, could be affected as the trolley wires
that support Vancouver‟s trolley bus fleet could be at risk.
As well, accidents have occurred in the past on vital transportation
infrastructure. For example, a fire in 2009 on the Pattullo Bridge, which connects
New Westminster and Surrey in the Metro Vancouver region and is used by
80,000 users a day, caused the closure of the bridge for a week for repairs100.
TDM was one strategy used to mitigate the impacts of the bridge closure.
Commuters were encouraged to use transit with extra transit service being
provided and temporary park and rides being set up. Commuters were also
encouraged to telecommute if possible and to rideshare.
99
Harold Munro, “Replace old trolley buses, officials say: They recommend replacing Vancouver‟s fleet of 244 by 2006, at a cost of more than $300 million”, Vancouver Sun, Jun 16, 2000
100 Vancouver Sun, “Pattullo Bridge Closed”, Vancouver Sun, Jan 19, 2009
41
Special Events
As exemplified by the use of TDM strategies during the 2010 Olympics,
TDM also appears to have applications for addressing the transportation
challenges associated with hosting special events. Derek Robbins et al101 outline
the challenges and importance that transportation plays in the hosting of events.
They state that transportation plays a key role in events because for an event to
be successful, it is essential that participants and customers be able to travel to
and from the event. However, the addition of these participants and out of town
visitors attending the event can increase the demand for travel. Robbins et al.
describe this demand as heavily constrained in both space and time because
visitors share common locations and very similar optimal times of travel. Thus,
the impacts of this transportation demand created by a special event are
profound and cities need to provide the additional capacity to meet the demand.
Failure to do so could lead to high levels of congestion and overcrowding.
Solutions may come from the construction of additional infrastructure but may
also come from the use of TDM strategies.
The use of TDM has been suggested as a solution to the problems posed
by special events. As outlined by Todd Litman102, TDM can be used to reduce
traffic and parking problems, improve safety and security, reduce stress, and
improve transportation options particularly for non-drivers. Litman makes this
point by providing an example that illustrates how the same number of
101
Derek Robbins, Janet Dickinson, and Steven Calver, “Planning transport for special events: A conceptual framework and future agenda for research”, International Journal of Tourism, 9, (2009) 303-314
102 Todd Litman, “Special Event Transport Management”, Victoria Transport Policy Institute, 2010 <http://www.vtpi.org/tdm/tdm48.htm>
42
participants arriving at a sports stadium by bus will only need a fifth of the parking
area and a sixth of the time to fill and empty the parking lot compared to a
situation where all participants arrived by automobile.
Being an international city, the relevance for Vancouver of having to deal
with the challenges of hosting large events is high. Vancouver does play host to
events on a regular basis such as sporting events involving local sports teams
like the BC Lions and Vancouver Canucks. Vancouver also hosts a variety of
large annual events like the Celebration of Light fireworks show. As well, in the
past, Vancouver has hosted major events like the World Expo and the Molson
Indy. TDM strategies have been used during some of these events. Strategies
included closing down roads to vehicles and encouraging residents to purchase
transit fares in advance.
3.2.3 State of Research on TDM Strategies
Although research on TDM strategies has been an interest for many
decades, researchers have suggested that there still exist a number of research
gaps. Articles by Sara J. Hendricks and Nevine Labib Georggi103 and Jochen
Richter et al.104 suggest a need to better understand the factors that contribute to
the effectiveness of TDM strategies. Specifically, there is the need to understand
how successful TDM programs can be duplicated. As well Hendricks and
Georggi suggest the need to collect baseline information about prior commuting
103
Sara J. Hendricks and Nevine Labib Georggi, “Documented Impact of Transportation Demand Management Programs Through the Case Study Method”, Journal of Public Transportation, 10.4, (2007) 79-98
104 Jochen Richter, Margareta Friman, and Tommy Gärling, “Review of Evaluations of Soft Transport Policy Measures”, Transportation: Theory and Application, 2.1, (2010) 5-18
43
characteristics. This is important so that travel behaviour can be compared after
the implementation of the TDM program.
Furthermore, the study prepared for the National Cooperative Highway
Research Program105 suggests that one of the topic areas where information is
particularly lacking and most needed is understanding the impacts of non-work
TDM programs. Philip L. Winters106 makes a similar assertion as he notes that
research has been focused on forecasting commuter changes at the employer
level. He suggests for future research the value of looking at impacts from a
larger scale.
In addition, I have noticed that it appears much research conducted on
TDM has been focused in the United States and has tended to concentrate on
only a few select strategies such as ridesharing, HOV lanes, and tolling. While
Vancouver‟s OTP incorporates some of these TDM elements, there is little
research that focuses on Canadian cities and that has looked at the other TDM
components of the OTP such as closing down roads to traffic, creating pedestrian
corridors, and providing improved communications.
As well, despite the potentially important role that TDM could play in
addressing transportation challenges brought on by episodic events, many
researchers have noted the very fragmented nature of research. Noland et al.107
point out that the TDM literature has focused on estimating effects of strategies
105
Cambridge Systematics Inc., Evaluate the interactions 106
Philip L. Winters, “Transportation Demand Management”, Transportation Research Board, (2000), Available: <http://www.trb.org/publications/millennium/00123.pdf>
107 Noland, “Travel demand policies”
44
under normal conditions and not under disruptive conditions. Yet, the effects of
TDM strategies might be different under disruptive conditions.
Furthermore, despite the key role that transportation plays in the
successful staging of special events, Robbins et al.108 argue that transportation
has not emerged as a core focus in event management literature. One of the
reasons for this is that there is more impetus for organizers and funding agencies
to fund predictive economic impact studies to help justify the event rather than
focus on potentially negative transportation issues. Perhaps for this reason,
there has been a lack of funding for research into transportation during special
events. Moreover, Robbins et al. note that most studies conducted do little to
advance conceptual knowledge and have limited application beyond the event
itself.
This fragmented state of research is one of the reasons why Robbins et al.
gear the purpose of their research towards informing future research directions.
They argue that much might be accomplished by quantitative surveys or
structured observations. Research could map out critical issues related to event
typology where different events attract different profiles of visitors and event
destination geography where location is a significant contributor to modal choice
and local impact. However, this research should be supplemented with
qualitative research to offer insight into the experience of travel during events.
108
Robbins, “Planning transport for special events”
45
3.2.4 Applicability of Olympic Lessons
Before identifying the parallels that exist between the transportation
challenges facing cities and those experienced during the 2010 Winter Olympics,
it is important first to point out some key differences. One notable difference
between the challenges of an energy crisis or a disaster and the challenges of
the Olympics is the opportunity for planning ahead. There was much more
information and time available for planners and residents ahead of the 2010
Olympics to properly plan and prepare for the challenges brought on by the
event. In contrast, energy crises and disasters can hit suddenly and the location
and magnitude of damage caused by these events can be unpredictable. Thus, I
think the predictability of the situation could be an important factor in influencing
the effectiveness of TDM and the types of strategies that could be implemented.
Another difference involves the time scale of change. The Olympics
involves dealing with a sudden increase in travel demand from a large number of
people travelling to and from the downtown. This surge can be contrasted to the
gradual change in travel demand that occurs from the relatively slower growth of
population and employment levels that planners address in the long term. These
types of differences are key to understanding the limitations of lessons that can
be learned from the Olympics.
While there are limitations, there also appear to be opportunities for
lessons to be generated that are relevant and useful to planners. A consistent
theme across the challenges noted in the literature review is that policy makers
are placing an emphasis on promoting a modal shift towards more sustainable
46
modes of travel in order to make more efficient use of existing transportation
infrastructure. Furthermore, one common feature of these challenges is a
restriction in the amount of new infrastructure that could be built. Thus, it
appears that the 2010 Olympics can produce conditions comparable in many
respects to those of other transportation challenges facing cities.
3.3 Olympic Transportation
The relevance of examining Olympic transportation is argued by
Genevieve Giuliano et al.109 who state that the Olympic Games provide a unique
opportunity to test the effectiveness of transportation management practices
under extreme conditions. The reason is that extensive transportation strategies,
especially TDM measures, are often implemented in the host cities of Olympic
Games due to the high level of travel demand brought on by the Games and their
festivities. Thus, Giuliano et al. state that valuable lessons about what worked
and what did not can be generated from an Olympics transportation experience.
These lessons can be important for helping inform future transportation policy
decisions and answering the „obvious‟ question of whether the strategies
employed during the Olympics could be implemented on a more permanent level
for addressing urban transportation problems.
A number of lessons have indeed been generated in the past from
studying transportation during the Olympics. The evaluation of the 1984 Olympic
109
Genevieve Giuliano, Kevin Habolan, Joseph Prashker, and Will Recker, Evaluation of 1984 Los Angeles Summer Olympics Traffic Management, Institute of Transportation Studies, University of California, (1987)
47
Summer Games in Los Angeles by Giuliano et al.110 noted the flexibility of
residents who made a number of voluntary travel reductions. The experience
also showed that a unique institutional environment was key to the success of the
TDM program. For the 2000 Olympic Summer Games in Sydney, Hensher and
Brewer state that the most powerful lesson was the “apparent willingness of
individuals, under special circumstances, to use public transport and leave their
cars at home”.111 In reflecting on this lesson, the authors point out a lingering
question of why people behave differently under the special circumstances
experienced during the Olympics?
However, even though the Olympics provide an opportunity to examine
transportation choices of residents, many studies that look at Olympic
transportation do not directly examine the impacts of transportation strategies on
residents and their everyday travel patterns. Rather, many studies have focused
on the transportation behaviours of spectators and the Olympic family. This is
noted in Hensher and Brewer‟s study112 where the authors were only able to
examine people travelling to and from events but not residents travelling to and
from work. As well, past studies appear to have focused mainly on assessing the
changes of travel conditions on roads and freeways with relatively little attention
paid to pedestrian and cycling conditions.
110
Genevieve Giuliano, “Transportation Demand Management: Promise or Panacea?”, Journal of the American Planning Association, 58.3, (1992) 327-335
111 David A. Hensher and Ann M. Brewer, “Going for Gold at the Sydney Olympics: how did transport perform?”, Transport Reviews, 22.4, (2002) 381-399, 393
112 Ibid.
48
This gap in research may be due to the reasons noted earlier by Robbins
et al.113 regarding the lack of funding available for these studies. As a
consequence, Hensher and Brewer note, “There is often little recorded of
strategic value with a loss of corporate memory as the event fades away and
officials move on.”114 Eva Kassens115 has also pointed out the lack of attention
towards generating lessons from the Olympic experience. She notes in her
paper that there is the potential to leverage knowledge of transportation
operations during the Games. However, most cities leverage only physical
changes and neglect operational ones. In fact, Kassens suggests that so far,
only Sydney has reapplied its knowledge and experience gained from the staging
of the Olympics, which it does for the Royal Easter show.
For the 2010 Games, the IOC has mandated the Olympic Games Impact
study be conducted to monitor, measure, and report on the long term impact of
hosting the Olympic Games. The results of the study will be used by the IOC to
make future Games more sustainable. Transportation is one area that is covered
in this study. However, while this study is useful for assessing the sustainability
of the Games, it does not focus on assessing the actual transportation strategies
used during the Games or directly informs future transportation planning in the
host cities after the Games.
113
Robbins, “Planning transport for special events” 114
Hensher, “Going for Gold”, 381 115
Eva Kassens, Transportation Planning for Mega-Events: A model for urban change, PhD. Thesis, Massachusetts Institute of Technology, 2009
49
4: METHODOLOGY
4.1 Research Design
Past research on TDM and Olympic transportation was used to provide
insight into the research design of this project. The importance of pre-planning is
emphasized in one framework116 as being an important step to generating
credible and reliable findings. This framework was developed for assessing the
economic impacts of special events but is generic enough to be applied to this
research. It suggests that researchers should obtain as much information as
possible before the event about likely impacts and about available data. It
advises that during this stage, researchers should make predictions and identify
respondent groups.
In terms of analyzing the transportation experience, Hensher and Brewer‟s
study117 on transportation during the Sydney Olympic Games provides a useful
framework for developing a comprehensive analysis. They looked at each mode
of transportation separately; from buses and trains to taxis and airports. As well,
they structured their analysis by first determining expectations regarding travel on
each mode of transportation and then documenting and comparing the Olympic
experience with expectations. This structure is useful in helping to understand
the Olympic transportation experience and its overall success.
116
UK Sport, “The Economic Impact of Major Events”, Staging Major Events: The Guide, UK Sport, 2005
117 Hensher, “Going for Gold”
50
Hensher and Brewer118 also employed a mixed methods approach to
produce a comprehensive picture of the Olympics experience, which is also a
goal for this research project. Media reports were used to gain broad coverage
of transportation events. Interviews were used as a source of more detailed
information and quantitative data was gathered to provide empirical evidence.
Data collected by public authorities and organizations were used heavily by
Hensher and Brewer as well as previous studies on Olympic transportation.
Similar to past studies, the public sector was relied upon for data in this project.
4.2 Pre-Planning
Approximately six months prior to the Olympics, I contacted various
organizations and agencies to determine the availability of data for this study. A
number of potential sources for data relating to travel behaviour and travel
conditions were identified including questionnaires conducted by TransLink;
traffic, bus, pedestrian, and cyclist counts collected by the City of Vancouver; and
accident rates produced by the Insurance Corporation of British Columbia
(ICBC).
This initial contact was useful for two reasons. It helped firstly to identify
the amount of data that could be available for this research and in doing so,
suggested that there might be a lack of data describing transit conditions. Given
the important role that transit has played in previous Olympic Games and the role
it was expected to play in Vancouver, I decided to also make some structured
observations about transit during the Olympics. Secondly, the initial contact was
118
Ibid.
51
useful for identifying potential interviewees who provided valuable insight for this
study.
In addition, I scanned local media reports for potential data sources,
statements made by commentators, and potential problems that were raised in
respect to travel conditions. One item that I found to be significant was the
concern expressed in a CBC News report119 over the potential increase in
accidents in downtown Vancouver during the Olympics. This prompted my
attention to accident rates.
Using the guidance provided from the literature review and the knowledge
of the potential data that might be available, I developed a detailed methodology
for data collection and analysis.
4.3 Data Sources
4.3.1 Media Reports
The local media represented a valuable source for information. I
examined and analyzed media reports for data such as surveys, interview
responses, observations, expectations over changes to travel conditions during
the Olympics, and details of any major transportation incidents during the
Olympics such as major traffic delays and bomb threats. Media outlets that were
chosen included two major local newspapers: the Province and the Vancouver
Sun. I also examined news reports from News1130, an official broadcaster of the
2010 Games, and CBC News. In addition, media from the City of Vancouver and
119
CBC News, “Olympics could boost insurance costs,” CBC, Sept 30th, 2009. The estimates
presented in the report indicate a possible increase in accident rates of 30%.
52
TransLink were gathered which included information, releases, and links made
available from the websites, blogs, and twitter accounts associated with those
organizations. These media sources also provided links to blogs and online
posts made by various commentators including those of Brent Toderian, Director
of Planning at the City of Vancouver; Jarrett Walker, an international consultant in
public transit network design and policy; John Calimente, who writes the
TransitFan column for re:place Magazine; and Frances Bula, a journalist
specializing in urban issues in the Vancouver region.
Findings from media reports served a number of purposes. Firstly, they
provided details about transportation plans and initiatives that were implemented
during the Olympics such as details of road closures. These reports also helped
to establish expectations for travelling during the Olympics and provided a source
for projections and targets related to Olympic transportation. Secondly, these
media reports were instrumental in providing information about what travelling
during the Olympics was actually like including delays that commuters might
have faced and changes to the general travel conditions in the downtown. Lastly,
media reports aided in assessing the resulting transportation experience by
providing valuable viewpoints on the experience and about potential
transportation lessons for Vancouver.
4.3.2 Travel Survey
Two online surveys sent out by TransLink provided data on mode share
and reductions of trips during the Olympics from residents in Metro Vancouver.
These surveys were sent out to TransLink Listens participants who are a group of
53
residents that have signed up to take TransLink‟s online surveys120. One
important issue about this data source is that it may not be as representative of
Metro Vancouver residents as other sources such as a telephone survey121.
Typically, it appears that those who answer TransLink‟s online surveys are more
aware of transportation issues and more amenable to taking transit. Thus,
caution should be exercised when interpreting and projecting the findings onto
the general population. Summaries of findings from these surveys were made
available to TransLink Listens participants122.
The first survey was completed from October 27th to November 1st,
2009123. This survey collected data on people‟s expectations and plans in
relation to travelling during the Olympics. The second survey was completed
from March 15th to March 22nd, 2010124. This survey collected data on people‟s
travel experience in Metro Vancouver during the Olympics. Findings from these
two surveys provided useful quantitative data, which I used to gain an
understanding of the travel experience of residents during the Olympics and to
evaluate the overall Olympic downtown transportation experience.
4.3.3 Data Describing Driving Conditions
Traffic counts for downtown Vancouver were collected by the City of
Vancouver, which helped to provide an idea of the changes in traffic volumes and
120
An incentive of being entered into a draw for cash prizes is provided. 121
This issue is noted among findings released from TransLink Listens surveys. 122
The author is a participant in the TransLink Listens panel and thus able to access the findings. 123
Synovate, TransLink Olympic Travel Survey – Final, (TransLink, 2009) 124
NRG Research, Transit Service Quality During the Olympics, (TransLink, 2010)

54
traffic congestion levels that occurred in the downtown. Statistics on traffic
accidents during the Olympics in the downtown were also released by ICBC.
4.3.4 Data Describing Transit Conditions
With the use of automatic passenger counters, TransLink collected data
on the number of riders that boarded buses and SkyTrain. To aid in the
interpretation of changes to transit use, I made structured observations about
travel conditions on SkyTrain. These observations were made during the AM
peak and PM peak periods of two Wednesdays in October 2009. I observed
passengers and trains heading towards downtown Vancouver from platform 3 at
Commercial-Broadway SkyTrain station and passenger and trains heading out of
downtown Vancouver from platform 2 at Waterfront SkyTrain station. These
stations were chosen because they were identified as being the busiest stations
during the AM and PM peak periods respectively125.
The goal of my observations was to provide a snapshot of the travel
conditions faced by transit users who took SkyTrain into and out of the
downtown. In attempting to establish baseline conditions, I was able to stand on
the platforms of the two stations where I collected data on the type of train that
arrived at the station to determine changes in capacity; the time of arrival, which I
used to determine the frequency of trains; and the presence of line-ups outside of
the platform, which were used to get a rough idea of the wait times that a transit
user might have faced.
125
City of Vancouver, “Central Waterfront Hub: Transit”, (City of Vancouver) Available: <http://vancouver.ca/commsvcs/currentplanning/whitecaps/pdf/Board3_Transportation%20sm.pdf>
55
During the Olympic period, I was not able to get permission to be on the
platform due to security reasons. Thus, I had to slightly alter my observation
strategy but I was still able to collect enough data to provide satisfactory results.
On the first Wednesday of the Olympic period, I stood outside Commercial-
Broadway station in a location where I could clearly see the trains leaving the
station for downtown Vancouver during the AM peak and trains arriving to the
station from downtown Vancouver during the PM peak. I was able to note the
type of trains being operated and the frequency of service. I made adjustments
to the times that I noted down so that they reflected the times that the trains
would have left Commercial-Broadway station during the AM peak period and
Waterfront station during the PM peak period.
To determine whether commuters had to face significant changes in wait
times, I also rode SkyTrain during the second Wednesday of the Olympic period.
I took the SkyTrain from Commercial-Broadway station to Main Street station and
then back again over the course of the AM peak period. Similarly, I took the
SkyTrain from Waterfront station to Burrard Station over the course of the PM
peak period. During these times, I made notes regarding the presence of line-
ups, the times that trains arrived, and difficulty of boarding trains. In addition, I
made general observations about the presence of crowd control.
4.3.5 Data Describing Walking and Cycling Conditions
The City of Vancouver collected pedestrian and cycling counts, which
provided information about changes to the volume of pedestrians and cyclists
downtown. As well, I made structured observations during the Olympics about

56
the pedestrian and cycling environments. I took note of changes that were made
to the public realm, which was mentioned in the OTP. To do this, I walked along
the four Olympic pedestrian corridors and listed the amenities that were located
on each block of the corridors in January and again during the Olympics. These
amenities included signage, wayfinding, street furniture, and public art.
4.3.6 Interviews with Experts
After completing a large portion of my Olympic data collection and
analysis, I was able to get a good sense of what occurred during the Olympics.
This was the time when I began contacting planners and experts. Getting their
input and opinions was valuable for helping to get a comprehensive perspective
on the transportation issues raised in the project. They were also able to speak
about some items that were not featured in the media and provided stories about
the process of developing and implementing the OTP.
In total, six experts were interviewed. The interviewees were Mike Madill
who is Vice President of Olympic Transportation at TransLink and was
responsible for assembling the team at TransLink for the Olympics; JoAnn
Woodhall who is a Transportation Demand Management Officer at TransLink and
chaired the working group that created the Olympic Transportation Plan; Dale
Bracewell, who is the Director of Olympic Transportation at the City of Vancouver
and spent approximately 4 years working on the Olympic Transportation Plan;
Kevin Wallinger, who is Director of Emergency Management at the City of
Vancouver and previously worked with the provincial Integrated Public Safety
Unit; Charles Gauthier, who is Executive Director of the Downtown Vancouver
57
Business Improvement Association; and Clark Lim, who is Manager of Data and
Methodology for the Olympics Games Impact research team at the University of
British Columbia and previously had roles at what is now Metro Vancouver and
TransLink.
Through semi-structured interviews, I was able to seek their individual
expert views on evaluating the outcome of the Olympic downtown transportation
experience and the OTP itself. As well, I sought their opinions on what they
thought worked well and did not work as well during the Olympics. Furthermore,
I attempted to get their views on the parallels they saw between the challenges
experienced during the Olympics and the challenges identified in the literature
review.
Then, I attempted to get their views on what they thought would be some
possible transportation lessons that can be taken away from the Olympic
experience. Lastly, I attempted to obtain their advice on how future host cities
could leverage mega-events to generate relevant transportation lessons for their
localities. This involved asking about their satisfaction with the data and
information that has been collected in Vancouver.
58
5: OLYMPIC TRANSPORTATION ANALYSIS
5.1 Pre-Olympic Expectations, Issues, and Targets
Public reaction to the OTP and public expectations regarding travel during
the Olympics were summed up in the media by one word: gridlock. Major traffic
disruptions and gridlock conditions appeared to be the primary theme of reports
from the local media. For example, one report on the closing of the Cambie
Street bridge for the opening and closing ceremonies of the Olympics began with
the exclamation, “Let the gridlock begin!”126 These reports suggested that an
influx of tourists, media, and officials would bring 30% more vehicles onto
downtown streets127. As noted in the media, one implication was that buses
would struggle128. As well, experts contacted by one media outlet projected that
traffic accidents would rise by 30% during the Olympics in the downtown129.
The target set in the OTP was to achieve “a minimum 30 percent reduction
in vehicle traffic”130 in the downtown. Leading up to the start of the Olympics, the
prospect of achieving this target appeared bleak. A series of pre-Games trial
runs took place for four weeks in January 2010. For the first week, the City of
Vancouver set a goal for a 5% reduction in vehicle use but results indicated only
a 2.5% reduction was achieved. For the second week, a 10% goal was set but
126
Damian Inwood, “Expect bridge closures on Cambie St. in Feb., March”, The Province, Jan 13, 2010
127 Kelly Sinoski, “Drivers alerted as viaducts set to close”, Vancouver Sun, Feb 3, 2010
128 The Province, “Tip to avoid the all-day rush hour”, The Province, Feb 10, 2010
129 CBC News, “Olympics could boost insurance costs”
130 VANOC, Fact Sheet
59
only a 4% reduction was achieved. In the final week, the City aimed for a 20%
reduction but only a 4% reduction in vehicle use was achieved131. There was
also media attention given to drivers who were taking chances in restricted
Olympic lanes despite potential fines.
During the Games, transit ridership was projected to increase by 33% from
750,000 riders daily to 1 million riders132. Early reports from TransLink suggested
that commuters could face high wait times of two to three hours during peak
periods. This projection was later revised to be only one hour. Expectations
from TransLink were that transit use would be heavy but smooth.
In the months leading up to the Games, media reports suggested that
there was confusion among some spectators over transit service during the
Olympics including routes and service hours. There was also some confusion
regarding SkyTrain station closures due to incorrect information circulating that
King George SkyTrain station and Stadium-Chinatown SkyTrain station would be
closed during the Games. In response, TransLink had to make it clear that those
stations would indeed stay open.
While the goal of gradually reducing vehicle use prior to the Games was
not achieved, there were some encouraging signs. There were indeed more
people using transit and more pedestrians and cyclists were counted crossing the
Burrard, Granville, and Cambie bridges. Nevertheless, a mass exodus of
Vancouverites was still expected due to concerns over gridlock conditions during
131
Sinoski, “Drivers alerted” 132
VANOC, Fact Sheet

60
the Olympics. One survey indicated that approximately 12% of people in Metro
Vancouver were planning to leave the region for either all or some parts of the
Games period133. Moreover, travel agents stated that there was a 30% jump in
the number of trips booked during the month of February134. Reasons for this
were linked to reports about traffic tie-ups and chaos during the Olympics and the
incentive to rent homes to Olympic visitors.
The travel survey conducted by TransLink in late-October135 revealed that
83% of respondents thought that it would be „somewhat difficult‟ or „very difficult‟
to get around downtown Vancouver during the Olympics. This was mostly
because of road closures (43%) and crowds (31%). However, responses
suggested that 55% of SOV downtown trips during the weekday would be
changed for the Olympics. 6% of those trips would be eliminated because
respondents would work from home and 13% would simply be eliminated. The
rest would switch to alternative modes including transit, walking, cycling, and
carpooling.
5.2 Olympic Downtown Transportation Experience
5.2.1 Transportation Initiatives
Many details of transportation initiatives were revealed after the release of
the OTP. As part of their effort to help businesses prepare for the Olympics, the
OPTT and organizations like the DVBIA created various documents such as
133
Mustel poll in Jim Goddard, “Poll: Twelve per cent of people in Greater Vancouver planning to leave town during Olympics”, News1130, Jan 19, 2010
134 The Province, “Lots of Vancouverites making plans to escape Winter Olympics”, The Province, Nov 5, 2009
135 Synovate, TransLink Olympic Travel Survey
61
checklists that helped to encourage and support changes to travel behaviour.
These changes include using sustainable modes of transportation and modifying
work hours to avoid peak travel times. Also, businesses that committed to the
TravelSmart Olympic Pledge to help reduce vehicle traffic were entered into a
weekly draw for two packages of 50 tickets to the Victory Ceremonies as an
incentive. By January, over 200 companies had signed up136. It was also
revealed that the disincentive for disobeying Olympic lanes was a fine of $121
and 2 demerit points. For stopping or parking in the lanes, drivers received $100
fines and an automatic tow137.
During the Olympics, a special train was operated between Waterfront and
Commercial-Broadway SkyTrain stations to ease loads on the system138. There
was also an extra bus being operated between Denman and Davie to Pacific
Boulevard139. Efforts were made to keep transit users entertained and
comfortable over the Olympic period. Free hot chocolate and water were being
given out at select SkyTrain stations by the Salvation Army. As well, additional
buskers were employed by TransLink to play music at SkyTrain stations. To
improve communication, changes to announcements on the SkyTrain network
were made with transit service hours of SkyTrain and venues nearby SkyTrain
stations also being announced. Lastly, there were transit hosts stationed in and
136
Sheila Scott, “VANOC TravelSmart Challenge hopes to reduce traffic leading up to Olympics”, News1130, Jan 6, 2010
137 Cheryl Rossi, “Tow trucks report no Games increase”, Vancouver Courier, Feb 10, 2010
138 Kelly Sinoski, “Record weekend expected for transit as Vancouver Olympic fever deepens”, Vancouver Sun, Feb 20, 2010
139 Jhenifer Pabillano, “New reroutes for the 5, 6, and N6 during the Olympics”, The Buzzer Blog, Feb 16, 2010, <http://buzzer.translink.ca/index.php/2010/02/new-reroutes-for-the-5-6-and-n6-during-the-olympics/>
62
around all SkyTrain stations in the downtown to provide assistance and direct
crowds.
While Canada Place Way was closed to vehicles during the Olympics,
pedestrians were not excluded from the street. Free bike valet services were set
up near LiveCity sites and Olympic venues to encourage people to use their
bikes. By storing their bikes at the valet, people would not have to worry about
their bikes being stolen. However, bikes were not allowed onboard SkyTrain
during the Olympic period.
5.2.2 Driving Experiences
In comparison to the pre-Games expectations, many have described the
Olympic travel experience as a success and not the commuter nightmare that
was predicted. Evidence that the transportation plans were working came from
many areas. First and foremost, the 30% reduction in vehicle traffic was
achieved on the day of the opening ceremonies and appeared to have persisted
throughout the Games. In the end, compared to the normal average morning
weekday, traffic into the downtown was down by 35%140. As well, for trips to and
from the downtown, the average vehicle occupancy increased by 14%141.
In addition, there were no major traffic problems reported in the media. In
contrast to gridlock conditions, it appeared that some drivers experienced near-
congestion free conditions during their commutes. Numbers from ICBC suggest
that accidents were not up by 30% but were actually down by 20% compared to
140
VANOC, “2010 Olympic Transportation Plan a success”, VANOC, Mar 3, 2010 141
Dale Bracewell, Host City Olympic Transportation Plan: A Sustainable Legacy for Vancouver, (Vancouver, Olympic Transportation Branch, 2010)
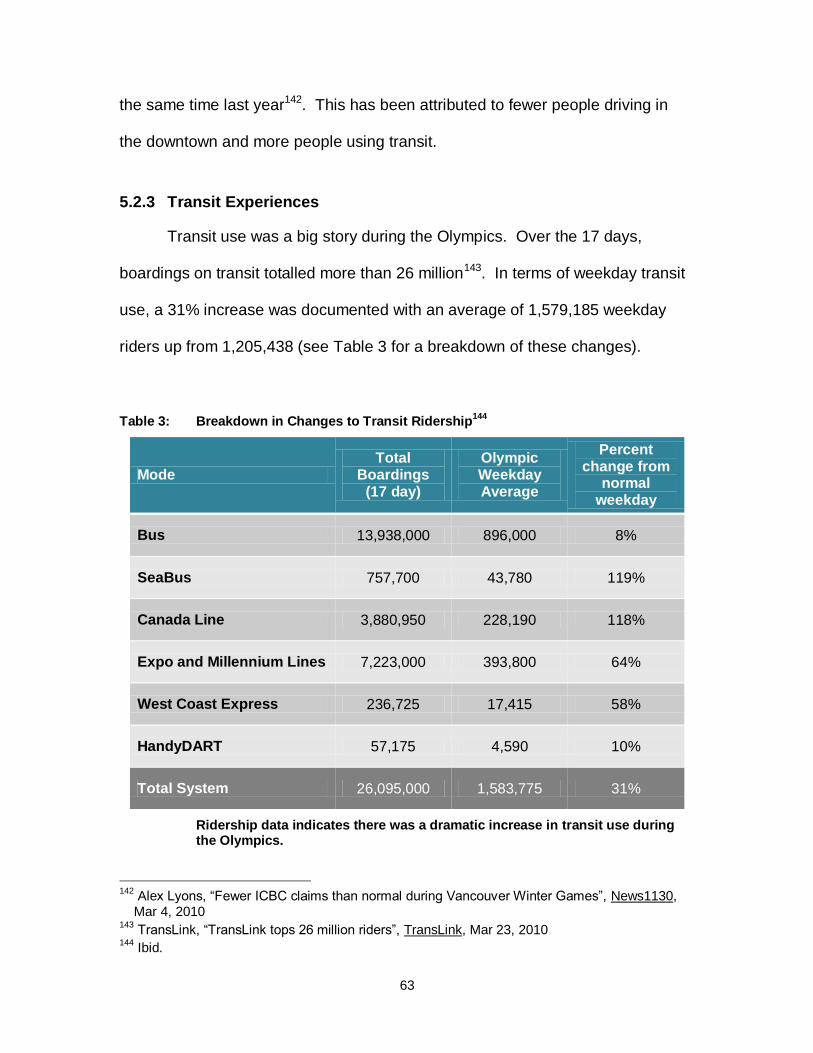
63
the same time last year142. This has been attributed to fewer people driving in
the downtown and more people using transit.
5.2.3 Transit Experiences
Transit use was a big story during the Olympics. Over the 17 days,
boardings on transit totalled more than 26 million143. In terms of weekday transit
use, a 31% increase was documented with an average of 1,579,185 weekday
riders up from 1,205,438 (see Table 3 for a breakdown of these changes).
Table 3: Breakdown in Changes to Transit Ridership144
Mode Total
Boardings (17 day)
Olympic Weekday Average
Percent change from
normal weekday
Bus 13,938,000 896,000 8%
SeaBus 757,700 43,780 119%
Canada Line 3,880,950 228,190 118%
Expo and Millennium Lines 7,223,000 393,800 64%
West Coast Express 236,725 17,415 58%
HandyDART 57,175 4,590 10%
Total System 26,095,000 1,583,775 31%
Ridership data indicates there was a dramatic increase in transit use during the Olympics.
142
Alex Lyons, “Fewer ICBC claims than normal during Vancouver Winter Games”, News1130, Mar 4, 2010
143 TransLink, “TransLink tops 26 million riders”, TransLink, Mar 23, 2010
144 Ibid.
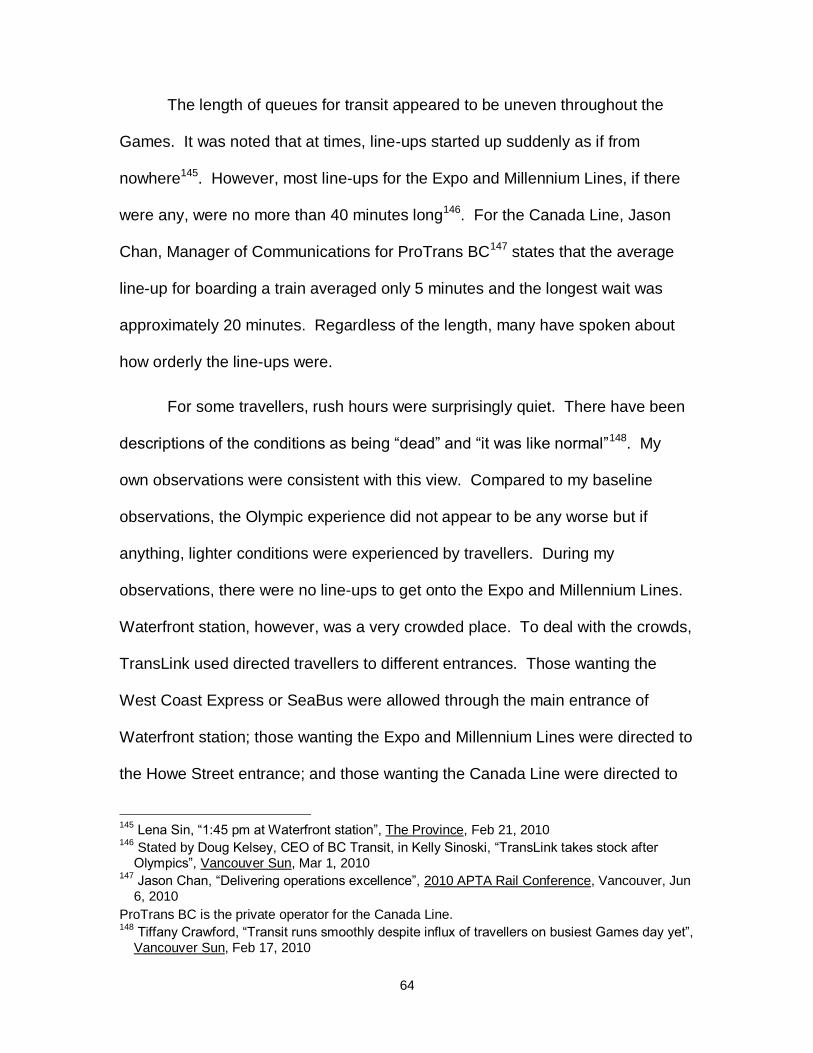
64
The length of queues for transit appeared to be uneven throughout the
Games. It was noted that at times, line-ups started up suddenly as if from
nowhere145. However, most line-ups for the Expo and Millennium Lines, if there
were any, were no more than 40 minutes long146. For the Canada Line, Jason
Chan, Manager of Communications for ProTrans BC147 states that the average
line-up for boarding a train averaged only 5 minutes and the longest wait was
approximately 20 minutes. Regardless of the length, many have spoken about
how orderly the line-ups were.
For some travellers, rush hours were surprisingly quiet. There have been
descriptions of the conditions as being “dead” and “it was like normal”148. My
own observations were consistent with this view. Compared to my baseline
observations, the Olympic experience did not appear to be any worse but if
anything, lighter conditions were experienced by travellers. During my
observations, there were no line-ups to get onto the Expo and Millennium Lines.
Waterfront station, however, was a very crowded place. To deal with the crowds,
TransLink used directed travellers to different entrances. Those wanting the
West Coast Express or SeaBus were allowed through the main entrance of
Waterfront station; those wanting the Expo and Millennium Lines were directed to
the Howe Street entrance; and those wanting the Canada Line were directed to
145
Lena Sin, “1:45 pm at Waterfront station”, The Province, Feb 21, 2010 146
Stated by Doug Kelsey, CEO of BC Transit, in Kelly Sinoski, “TransLink takes stock after Olympics”, Vancouver Sun, Mar 1, 2010
147 Jason Chan, “Delivering operations excellence”, 2010 APTA Rail Conference, Vancouver, Jun 6, 2010
ProTrans BC is the private operator for the Canada Line. 148
Tiffany Crawford, “Transit runs smoothly despite influx of travellers on busiest Games day yet”, Vancouver Sun, Feb 17, 2010
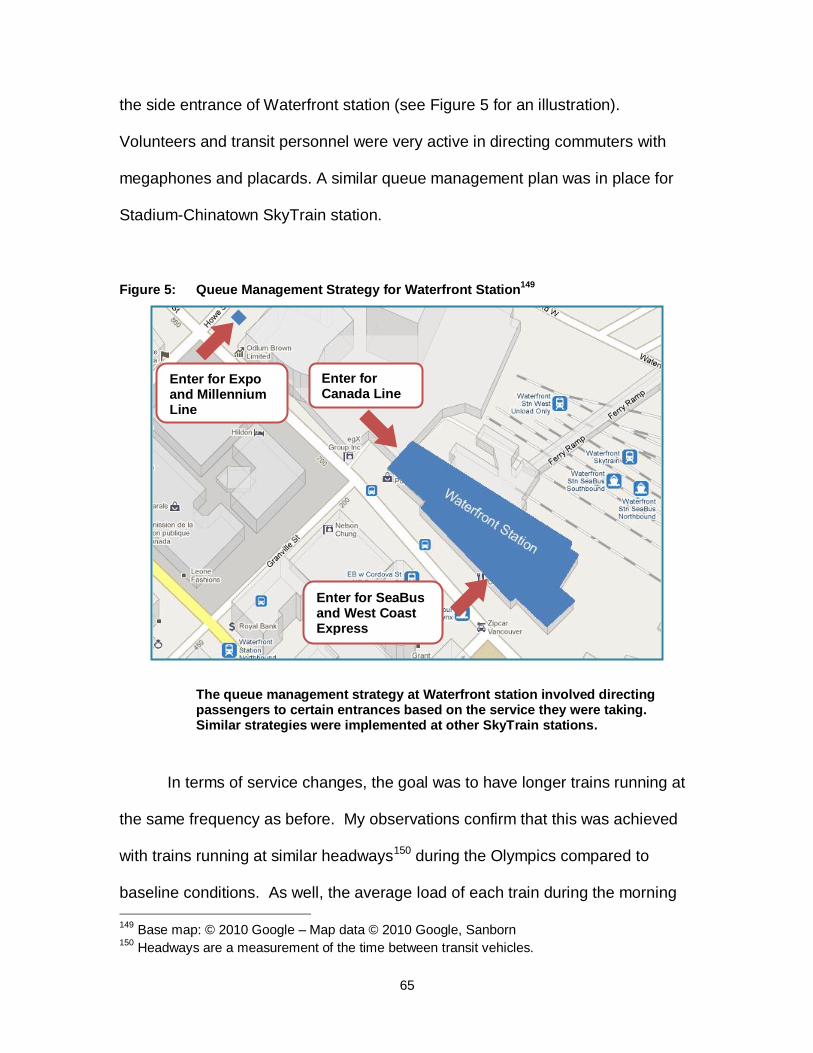
65
the side entrance of Waterfront station (see Figure 5 for an illustration).
Volunteers and transit personnel were very active in directing commuters with
megaphones and placards. A similar queue management plan was in place for
Stadium-Chinatown SkyTrain station.
Figure 5: Queue Management Strategy for Waterfront Station149
The queue management strategy at Waterfront station involved directing passengers to certain entrances based on the service they were taking. Similar strategies were implemented at other SkyTrain stations.
In terms of service changes, the goal was to have longer trains running at
the same frequency as before. My observations confirm that this was achieved
with trains running at similar headways150 during the Olympics compared to
baseline conditions. As well, the average load of each train during the morning
149
Base map: © 2010 Google – Map data © 2010 Google, Sanborn 150
Headways are a measurement of the time between transit vehicles.
Enter for Canada Line
Enter for SeaBus and West Coast Express
Enter for Expo and Millennium Line

66
peak of the Olympics was calculated to be 423 people compared to the combined
average of 345 people from baseline observations. The load of the total trains
over the AM peak hour during the Olympics was 15,220 people, which was up
from 13,285 during the baseline observations. Similarly, the average load of
trains during the Olympic PM peak hour was calculated to be 423 people
compared to the combined average of 337 people from the baseline
observations. The total load of the trains over the peak hour during the Olympics
was 16,080 people, which was up from 11,450 during the baseline observations.
5.2.4 Walking and Cycling Experiences
Pedestrian and cyclist volumes were also up during the Olympics. An
average of 3,669 pedestrians were counted going over the Burrard Bridge into
and out of downtown Vancouver daily during the Games. This was 2,011 more
than was counted in January. There was also an average of 2,696 cyclists who
crossed the three bridges daily during the Olympics compared to 1,472 in
January151 (see Figure 6 for graphical representations of these changes for the
Burrard Bridge). Overall, it appeared that pedestrian volumes were exceeding
summertime levels throughout the Games while cyclist levels saw a more modest
increase. Screenline counts for walking and cycling across downtown also
revealed an increase in trips per day from 20,000 in November 2009 to 65,000
during the Olympics152.
151
Data downloaded from City of Vancouver, “Burrard Bridge Statistics”, City of Vancouver, <http://vancouver.ca/projects/burrard/statistics.htm>
152 Bracewell, Host City Olympic Transportation Plan

67
Figure 6: Burrard Bridge Monthly Pedestrian and Bicycle Volumes153
Pedestrian and bicycle volumes on the Burrard Bridge increased with the former exceeding summertime levels during the Olympics.
153
Data source: City of Vancouver, “Burrard Bridge Statistics”, City of Vancouver, 2010, <http://vancouver.ca/projects/burrard/statistics.htm>
0
20000
40000
60000
80000
100000
120000
140000
160000
180000
Aug 2009 Sep 2009 Oct 2009 Nov 2009 Dec 2009 Jan 2010 Feb 2010 Mar 2010 Apr 2010 May 2010 Jun 2010 Jul 2010
Trip
s P
er
Mo
nth
Aug 2009 Sep 2009 Oct 2009 Nov 2009 Dec 2009 Jan 2010 Feb 2010 Mar 2010 Apr 2010 May 2010 Jun 2010 Jul 2010
Pedestrians 76817 67582 57888 46093 48003 51400 87865 58804 57305 63324 63778 84982
Bicycles 130418 107284 69771 42711 33533 45624 70731 67796 76686 103416 116644 161964
67

68
Along Granville Street, new amenities were installed as the Granville
Street Redesign project was completed at about the same time as the start of the
Olympics. One of the goals of the project was to enhance the street for
pedestrians and transit users. These enhancements included the addition of
benches, bike racks, and streetlights. Temporary public art in the form of lighted
totem poles, cut outs of athletes, and wooden trees were installed along one
block of Granville Street. This appeared to be a very attractive installation.
While I noticed a tendency of people to keep to the sidewalks of other pedestrian
corridors and only use the middle of the street to cross from one side to another,
the presence of public art along that block of Granville Street helped to attract
people towards using the entire street. As well, I noticed many people were
enjoying the interactive nature of the wooden trees with many people stomping
and jumping along the wooden platforms to make noise.
Along the Robson Street corridor, there was one additional water fountain
installed, six information kiosks, and one sign near BC Place Stadium pointing to
SkyTrain. Along Beatty Street, there were two information kiosks and larger
signs with directions to hotels, SkyTrain, BC Place Stadium, and Canada Hockey
Place. Finally, along the Hamilton/Mainland corridor, two information kiosks and
three bike valet signs were put up.
In addition to those changes, clear plastic bags for garbage were installed
throughout the downtown and additional signs directing people to points of
interest such as celebration sites and venues were installed. I counted 29 signs
installed along the four pedestrian corridors. However, aside from bike valets,

69
there were no additional bike facilities. Signs at intersections appeared to have
small fonts and information kiosks were not lit for viewing at night. Beyond
Granville Street, there was no additional street furniture installed. As for bus
shelters, they were occupied by families looking for a place to sit and some were
occupied by pin traders who set up their pins on the benches.
Overall, the streets in the downtown were animated and full of energy.
There were lines of people outside of pavilions throughout the downtown. There
were also events and activities that took place on the streets themselves. These
included videos that were projected onto walls, pin trading, ticket scalping, street
performances, and live music.

70
6: ANALYSIS OF THE DOWNTOWN TRANSPORTATION EXPERIENCE
6.1 Post-Games Assessment
When compared to the expectations prior to the Games, the Olympic
downtown transportation experience has been considered a success by many
commentators. The gridlock and major traffic disruptions that were conceived of
in local media reports were, for the most part, non-existent. Those who drove
were said to have experienced lighter driving conditions. More importantly, the
target for reducing vehicle traffic by a minimum of 30% was met. Those who
took transit did not, for the most part, have to face hour-long waits. In fact, it
appeared that people using transit during peak hours experienced lighter than
usual conditions although line-ups did appear to be a slightly unpredictable at
times. Transit use surged considerably and pedestrian and cyclist volumes
increased with numbers reaching summertime levels for the former.
The positive assessment of the Olympics was expressed by planners and
experts who I interviewed. Charles Gauthier, Executive Director of the DVBIA,
stated that the Plan went “better than expected”. For example, he noted that
transit was able to meet the extra travel demand from residents who were
encouraged to make the switch to transit. As a result, large numbers of people
were seen taking transit, walking, and cycling in the downtown during the
Olympics. He also stated that generally, it appeared that people were not
71
inconvenienced during the Olympics and this resulted in positive media attention
that also reflected well on the Olympic Games itself.
For Dale Bracewell, Director of Olympic Transportation at the City of
Vancouver, this increase in transit, walking, and cycling trips was also a very
important indicator of the success of the OTP. This is because although the
target was to reduce vehicle volumes in the downtown by a minimum of 30%,
which was exceeded with reductions of 35%, achieving that target would not
have signalled a successful Olympic Games by itself. The reason is that the
reduction in vehicles could have meant that people were avoiding trips to the
downtown and this was not a goal of the OTP. Rather, the goal was to ensure
that people who wanted to go downtown to enjoy the festivities, attend events,
work, shop, or play would be able to do so.
This goal appeared to have been achieved with the dramatic rise of
transit, walking, and cycling levels, which indicates that overall trips to the
downtown went up considerably. These two changes, a reduction in vehicle
traffic and an increase in overall trips, represented key signals of success to Dale
Bracewell. Similarly, Mike Madill, Vice President of Olympic Transportation at
TransLink, pointed out, “What made it successful was trying to make sure
everyone got to where they needed to get to, when they needed to get to or
before.”
Another factor that indicated success according to interviewees was
feedback from the public about their overall transportation experience. This
feedback was expressed in media outlets such as local news reports, which

72
lauded Vancouver‟s ability to ensure that residents, tourists, and members of the
Olympic family were able to travel easily throughout the downtown154. Members
of the media visiting from Seattle and London also commended Vancouver for
their positive transportation experience155. As well, TransLink received awards at
the annual Canadian Urban Transit Association conference for their role in
providing exceptional transit service during the Olympics156.
Positive feedback from the public was also seen throughout Vancouver‟s
transportation network. The presence of people who were joyous and who filled
the streets of the downtown was one indicator of success that was suggested by
JoAnn Woodhall, TDM officer at TransLink. As well, there were numerous
accounts of people who were singing and giving each other high-fives on transit.
The joyous nature of people on transportation represented a great indicator of
success because it signalled that getting around during the Games was not a
burden.
In addition, positive responses were received from the survey conducted
by TransLink after the Olympics157. This customer survey represented an
important piece of feedback as stated by JoAnn Woodhall. Results indicated a
very high rating for the performance of transit during the Olympics. 69% of
respondents gave a „good‟ to „excellent‟ rating with a mean value of 8/10. This 154
For example, see Daniel Foutaine, “Traffic congestion eases while transit system over capacity”, CityCaucus, Feb 21, 2010, Available: <http://www.citycaucus.com/2010/02/traffic-congestion-disappears-as-transit-system-taxed-to-the-max>
155 For example, see Ian Farrell, “Learning to navigate downtown Vancouver”, The Seattle Times, Feb 15, 2010 and Adrian Warner, “Can London 2012 succeed on transport like Vancouver?”, BBC, Feb 18, 2010, Available: <http://www.bbc.co.uk/blogs/adrianwarner/2010/02/can_vancouvers_transport_succe.html>
156 TransLink, “Accolades for TransLink Olympic efforts”, TransLink, May 25, 2010
157 NRG Research, Transit service quality during the Olympics

73
was compared to a survey conducted in the fourth quarter of 2009 where 54%
gave a „good‟ to „excellent‟ rating and a mean value of 7.3/10. Moreover, the
survey that was conducted after the Olympics showed that 73% of respondents
indicated that service exceeded their expectations.
Lastly, success was indicated by the high degree of engagement reached
between partners of the OPTT, organizations such as the DVBIA, and individual
businesses. As indicated through interviews, partners of the OPTT were
successful in being able to disseminate information to businesses and generate a
dialogue about preparing for the Olympics. This was achieved through
presentations that were made by partners of the OPTT as well as organizations
like the DVBIA who the OPTT also engaged. In addition, tools and resources
were developed and given to businesses. The combination of presentations and
resources helped enable businesses to create Games-time travel plans.
While many things did go well during the Olympics, there were a few items
I tracked down that may not have gone as well. The process of planning for
crowd management outside of transit stations was one item that was brought up
in an interview. It was noted that planning for crowd management began
relatively late and led to the need to assemble a team for crowd management
very quickly. People had to be pulled from different organizations to help control
crowds, which led to some management issues; however, none of these issues
were seen by the public. In terms of public feedback, respondents from
TransLink‟s survey after the Olympics158 suggested some items that failed to
158
Ibid.
74
meet expectations were „more crowding‟, „less frequency service‟, and „more
waiting and delays‟. Lastly, some businesses expressed concern over the lack of
on-street parking during the Games, which they say adversely affected their
business. However, for some, this lack of on-street parking probably would have
helped business so there likely was mixed assessments about this aspect of the
transportation experience.
6.2 Factors Contributing to the Outcome of the Olympic Downtown Transportation Experience
While the transportation experience can be viewed as an overall success
and there are discussions to have some components of the OTP implemented
permanently, it is important to point out there were many factors during the
Olympic period that contributed to the positive experience. Some of these
factors could be replicated in future situations but others may be unique to the
Olympic period. Thus, when thinking about the success of the Olympic
downtown transportation experience, the impact of the implementation of the
OTP on travel behaviour, and lessons that can be learned, it is important to
consider these factors and to understand their contribution to the overall
outcome. With the diverse range of transportation strategies employed during
the Olympics and with money, power, and words all being used, it is important to
examine structural, psychological, and random factors as discussed in the
literature review159.
159
Structural factors can include the quantity of goods and services available and the user cost of travel; psychological factors can include people‟s beliefs, attitudes, and values; and random factors can include media coverage and initial conditions.
75
6.2.1 Structural Factors
The cost of parking was one factor that may have played a role in the
outcome of the Olympic downtown transportation experience. It was noted in the
media that higher parking rates were being charged by some privately owned
parking lots. One lot near the Olympic venues of BC Place Stadium and Canada
Hockey Place charged an Olympic rate of $12.50/hour during the Olympic period
compared to their normal event rate of $10/hour and usual rate of $4.50/hour.
The daily rate was $95 compared to its usual rate of $17 a day. Some cheaper
rates could still be found though; for example, at Pacific Centre mall, the daily
rate was $12.50/day160. In addition, on January 1st, 2010, the off-street parking
tax in Metro Vancouver rose from 7% to 21% and the City of Vancouver
extended parking meter hours from 9am-8pm to 9am-10pm. These increases
were not part of the OTP but could have had an impact on people‟s travel
behaviour.
Additional funding that allowed for improvements in transit service levels
was another factor that may have contributed to the success of the Olympics
downtown transportation experience. Media reports stated that TransLink was
supplied with $17 million from VANOC. Mike Madill elaborated on this
arrangement by breaking down the figures. He stated that VANOC had
purchased advertising space from TransLink for approximately $14 million, which
VANOC then resold to Olympic sponsors. A cash contribution of approximately
$3 million was made by VANOC, which was collected through ticket sales. As
160
Kelly Sinoski, “Impark ups parking rate to $95 a day at two lots”, Vancouver Sun, Feb 13, 2010
76
well, there were value-in-kind contributions from VANOC where some services
provided by sponsors such as CP Rail were turned over to TransLink to offset
costs.
In addition, it appeared that existing policies that allowed the transit
system to adapt to the changing needs of the Olympics was also important as
was the dedication and capabilities of transit personnel. Dale Bracewell
indicated that the ability of the BC Rapid Transit Company (BCRTC) and
ProTrans BC to step up and increase the frequency of SkyTrain by keeping trains
running at capacity was an important part of the success of the Olympics. Jason
Chan of ProTrans BC161 stated that original service plans for the Canada Line
were to run 16-18 trains during the Olympics. However, that plan went out the
window three hours into the first day when it became apparent that they had to
put their full fleet into service with 20 trains in operation all day. Jason Chan
stated that being able to get all the trains back into the maintenance centre after
service and then back onto the tracks for the first train was a real testament to
the field staff. Similarly, BCRTC was able to put every Expo and Millennium Line
train into service at times to meet demand.
As for bus transit, Michael Shiffer162, Vice President of Planning, Strategy,
and Technology at TransLink stated that one of the keys to success was
maintaining an effective and young fleet so that many buses were available for
the Olympics. Charlotte Boychuk from CMBC‟s employee communications team
161
Chan, “Delivering operations excellence” 162
Michael Shiffer, “It Takes a Region: Integrating rail investment in multimodal plans and programs”, 2010 APTA Rail Conference, Vancouver, Jun 6, 2010
77
illustrated the commitment and effort of maintenance crews who ensured the bus
fleet was ready every day. Mechanics and staff at the Oakridge Transit Centre
worked around the clock to ensure that they were “ready to fix any of the Olympic
fleet that comes in for minor repairs such as broken lights, mirrors, or other „quick
fixes‟ under two hours”163.
In addition to the personnel who were maintaining the transit network,
there were dedicated volunteers and personnel on the streets and in the transit
stations of the downtown. These included personnel from TransLink, the City of
Vancouver, and the Vancouver Police Department and volunteers from VANOC
who were instrumental in providing excellent customer service. They took on the
task of directing people to transit services, answering questions about Olympic
sites and transportation, and helping out in any way possible. The response from
people in Vancouver to these changes was very positive. Survey respondents
noted train frequency, bus frequency, and TransLink‟s employee service were
some of the top items that were done well164.
6.2.2 Psychological Factors
The coordinated messaging that took place leading up to the Olympics
was one of the keys to success that was suggested in an interview. It began with
messages that stated that travelling during the Olympics was going to be
different and that people are advised to come up with a Games-time travel plan.
163
Charlotte Boychuk, “Maintaining our extra Olympic buses during the Games”, The Buzzer Blog, Mar 3, 2010 <http://buzzer.translink.ca/index.php/2010/03/maintaining-our-extra-olympic-buses-during-the-games/#more-8690>
164 NRG Research, Transit service quality during the Olympics

78
Then, the messaging suggested how people could do that – by shifting modes to
transit, walking, and/or cycling; shifting travel times; and/or not commuting at all
(i.e. telecommuting). It was this coordinated messaging that was reinforced by
all partners that worked very well and contributed to the success of the Games.
As well, JoAnn Woodhall stated that the timing of the messaging was also
appropriate because the messaging was not put forth to the public too early or
too late. Similarly, Doug Kelsey, CEO of BCRTC, credited the TravelSmart
campaign for contributing to the success of the Games. He notes that the
campaign helped people to prepare ahead of time for queues or delays on the
system165.
Travellers themselves played an important role in the success. Ian Jarvis,
CEO of TransLink, highlighted the collective effort and role of citizens who left
their cars home and decided to take transit166. People in Vancouver were noted
to have been friendly, engaging, willing to help out, patient, and orderly especially
on transit. The transportation system was also animated. In transit stations and
on the streets, there was singing, music playing from the addition of more
buskers, and performing artists, which were factors that engaged and entertained
travellers. This culture, fever, or buzz has been contrasted to Vancouver‟s
normally reserved individualism by one commentator167.
165
Sinoski, “TransLink takes stock after Olympics” 166
In TransLink, “Moving the world record numbers ride transit in Olympic week 1”, TransLink, Feb 20, 2010
167 Lorena Dexter, “The New Canada Line Culture: more urban, more engaged”, VPSN, Feb 19, 2010
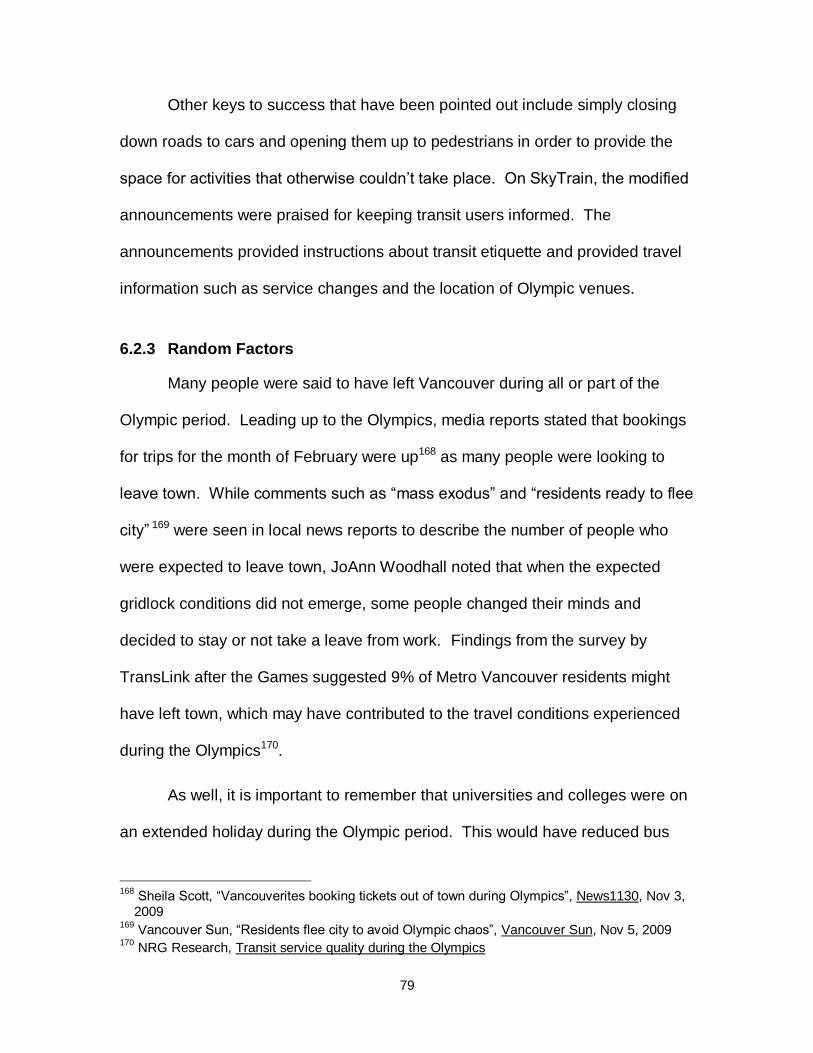
79
Other keys to success that have been pointed out include simply closing
down roads to cars and opening them up to pedestrians in order to provide the
space for activities that otherwise couldn‟t take place. On SkyTrain, the modified
announcements were praised for keeping transit users informed. The
announcements provided instructions about transit etiquette and provided travel
information such as service changes and the location of Olympic venues.
6.2.3 Random Factors
Many people were said to have left Vancouver during all or part of the
Olympic period. Leading up to the Olympics, media reports stated that bookings
for trips for the month of February were up168 as many people were looking to
leave town. While comments such as “mass exodus” and “residents ready to flee
city” 169 were seen in local news reports to describe the number of people who
were expected to leave town, JoAnn Woodhall noted that when the expected
gridlock conditions did not emerge, some people changed their minds and
decided to stay or not take a leave from work. Findings from the survey by
TransLink after the Games suggested 9% of Metro Vancouver residents might
have left town, which may have contributed to the travel conditions experienced
during the Olympics170.
As well, it is important to remember that universities and colleges were on
an extended holiday during the Olympic period. This would have reduced bus
168
Sheila Scott, “Vancouverites booking tickets out of town during Olympics”, News1130, Nov 3, 2009
169 Vancouver Sun, “Residents flee city to avoid Olympic chaos”, Vancouver Sun, Nov 5, 2009
170 NRG Research, Transit service quality during the Olympics

80
ridership and vehicle traffic significantly because bus transit and driving are two
of the main ways that students, faculty, and staff travel to and from campuses.
This can be seen from screenline data obtained in 2008 for trips to and from
UBC. Data indicates that in the period of September to December 2008, 51,000
trips were made on a typical weekday by transit and 61,000 trips were made in a
typical weekday by SOVs or ridesharing (see Table 4). As well, a demonstration
streetcar line was in operation just outside of downtown Vancouver, which could
have had an effect in decreasing both vehicle use and bus ridership.
As well, as suggested by Kitamura et al,171 the media and initial conditions
are two chance factors that could play a role in changes to travel behaviour. In
the case of the Olympic downtown transportation experience in Vancouver, both
appear to have contributed to the overall outcome. The media painted a bleak
picture of what driving would be like during the Olympics with the image of
gridlock conditions. They were consistent in their reporting and really sent home
the message about the importance of leaving vehicles at home and making other
plans such as taking transit.
171
Kitamura, “Self-reinforcing motorization”
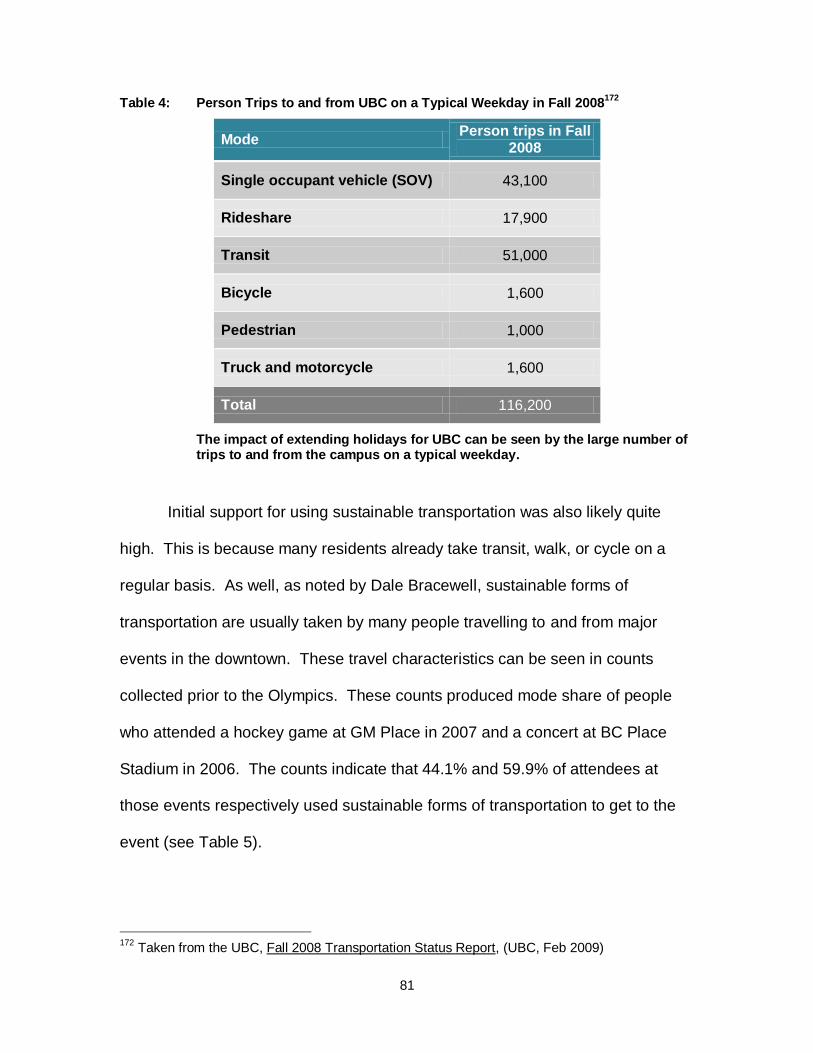
81
Table 4: Person Trips to and from UBC on a Typical Weekday in Fall 2008172
Mode Person trips in Fall
2008
Single occupant vehicle (SOV) 43,100
Rideshare 17,900
Transit 51,000
Bicycle 1,600
Pedestrian 1,000
Truck and motorcycle 1,600
Total 116,200
The impact of extending holidays for UBC can be seen by the large number of trips to and from the campus on a typical weekday.
Initial support for using sustainable transportation was also likely quite
high. This is because many residents already take transit, walk, or cycle on a
regular basis. As well, as noted by Dale Bracewell, sustainable forms of
transportation are usually taken by many people travelling to and from major
events in the downtown. These travel characteristics can be seen in counts
collected prior to the Olympics. These counts produced mode share of people
who attended a hockey game at GM Place in 2007 and a concert at BC Place
Stadium in 2006. The counts indicate that 44.1% and 59.9% of attendees at
those events respectively used sustainable forms of transportation to get to the
event (see Table 5).
172
Taken from the UBC, Fall 2008 Transportation Status Report, (UBC, Feb 2009)
82
Table 5: Summary of Stadium Event Transportation Survey Mode Split173
Travel Mode GM Place
Thursday, March 15, 2007
BC Place Saturday
November 25, 2006
Event Hockey Game Concert
Crowd Size 18,325 47,182
Car 55.9% 40.1%
Transit 27.4% 35.3%
Charter bus/taxi/limousine 5.2% 14.0%
Bike/Walk 11.6% 10.7%
Total 100.0% 100.0%
These counts collected prior to the Olympics suggest that many people typically use sustainable modes of transportation to travel to and from major events in the downtown.
Lastly, the presence of the Olympic Games themselves was another
factor. There was Olympic fever and a large number of sporting events, cultural
events, and activities taking place in downtown Vancouver. For example, every
day throughout the Olympic period, pavilions were free and open to the public.
As a result, people crowded the streets and spaces of downtown Vancouver
every day during the Olympics. This is not the case normally. For example,
events do not normally take place for extended periods at Robson Square or at
David Lam Park. The number of events and the buzz on the streets was likely
one significant factor that helped to get people onto the streets walking, cycling,
or taking transit and contributed to the good attitude and spirit of travellers. As
173
Taken from Dale Bracewell, “The Road to the 2010 Olympic and Paralympic Games – Transportation Findings of Large Public Events in Downtown Vancouver”, 2008 Annual Conference of the Transportation Association of Canada, Toronto
83
well, many people may not have made the daily trips they would have made
normally had the Olympics not been in town. Certainly, many would have
continued with their everyday activities downtown but many were also able to
eliminate or push back some trips during the 17 days.
When interpreting the success of the Olympic downtown transportation
experience, it is important to take into consideration the structural, psychological,
and random factors outlined above. As noted by Charles Gauthier, it would be
“foolhardy” to believe that the result of the Olympics could be replicated without
considering the impact that these factors had on the outcome. This was also
pointed out after the Olympic Games with regard to the suggestion of
permanently closing the Dunsmuir and Georgia Viaducts. Although the Olympics
“demonstrated what the city could look like without them”174, a development
consultant suggested that the “Olympics might not be the best real demonstration
of what life without the viaducts might be like”175 because enough residents left
town during the Olympics to reduce traffic on the viaducts.
When thinking about potential transportation lessons for Vancouver,
interviewees noted that the presence of these factors does not mean that
important and relevant lessons for future transportation planning cannot be
generated. They pointed out that it simply means that the structural,
psychological, and random factors noted earlier should be included in future
discussions.
174
Derrick Penner, “Vancouver contemplates life without the viaducts”, Vancouver Sun, Mar 22, 2010
175 Ibid.

84
7: TRANSPORTATION LESSONS
7.1 Applicability of Olympic Lessons
7.1.1 Long Term Transportation Planning
Interviewees suggested that long term transportation planning was the
area where there might be many opportunities for lessons learned from the
Olympics. Mike Madill suggested that although the Olympics occurred for a
specific defined period, the road capacity issues and transportation issues that
were raised during the Olympics did give an indication of what it might be like in
the future when there are more people. For example, it indicated the higher level
of transit that would be needed to accommodate the additional travel demand.
Dale Bracewell also stated that there were opportunities for lessons
learned for long term transportation planning but cautioned that it was important
not to stretch the learning. For example, he noted the need to acknowledge that
people did leave town during the Olympics. Charles Gauthier pointed out that
residents were asked to make travel changes for a short period of time. He
cautioned that it would be more challenging to replicate the results on a more
sustained basis. Clark Lim also weighed in by saying that there could be some
limits on extrapolating the lessons learned in the city to more suburban areas.
He suggested that in the city and especially in downtown Vancouver, transit is a
mode that could be leveraged to encourage sustainable travel. However, this
may not be the case in more suburban areas where transit may not be a realistic

85
option for travellers. Therefore, lessons relating to transit may not be very
relevant to these areas. However, he adds that there are still opportunities for
encouraging walking and cycling in the suburbs and this could be the area where
lessons would be relevant.
7.1.2 Planning for Episodic Events
In terms of episodic events, interviewees noted many limitations for
generating lessons learned. When thinking about emergency situations, Kevin
Wallinger, Director of Emergency Management at the City of Vancouver, stated
that during the Olympics, everything was working properly. The road network
was intact and transit system was working with minimal delays on SkyTrain. In
fact, one of the points made by Jason Chan176 of ProTrans BC was that for the
entire 17 days, there was only one minor delay on the Canada Line and that was
due to a door fault, which was the most minor delay a transit system could have.
Similarly, a news release from TransLink noted that there were“[n]o significant
train failures or operational problems” for the Expo and Millennium Lines.
However, this would not be the case during certain episodic events when
parts of the transportation system could be damaged. Furthermore, people in
Vancouver were given a lot of time to prepare for the changes that were going to
happen during the Olympics. As indicated earlier, the public was given advance
notice about the staging of the Olympics and details about road closures and
transit service changes. As well, they were given time and resources to prepare
and make plans for the event. This luxury would not be available in disasters or
176
Chan, “Delivering operations excellence”
86
even in energy crises. In fact, Kevin Wallinger noted the potential difficulty of
getting information out to people during emergencies.
As well, Charles Gauthier stated that the presentations made to
businesses were focused on the preparation of business-readiness plans, which
are different from preparing crisis plans. These presentations focused on getting
businesses to plan and do things differently from a business perspective such as
scheduling employees for work and getting supplies to the worksite. Businesses
were encouraged to adjust their schedules where possible by, for example,
ordering their supplies weeks in advance177 and helping staff to avoid travel
during peak times.
Dale Bracewell also weighed in by stating that there were limited lessons
for dealing with the transportation challenges posed by episodic events. He
stated that the OTP was customized in respect to where the security closures
and competition sites were located as well as the time of day that people were
expected to travel. He noted, “In all types of natural disasters, you don‟t know
what remaining part of your transportation network you‟re going to have left.”
This is not to say that there are not any opportunities for lessons. Clark
Lim pointed out the potential for the Olympics to validate plans and models that
have been developed for responding to and recovering from events like natural
disasters. He noted that methodology and techniques for modelling and planning
for normal circumstances need to be modified when it comes to high-level
177
Interview in Linda Solomon, “Charles Gauthier: Preparing businesse for the Olympic Games”, Vancouver Observer, Jun 8, 2009, Available: <http://www.vancouverobserver.com/2009/06/08/charles-gauthier-preparing-businesses-olympic-games>

87
intense events. As well, he stated the Olympics might represent an opportunity
to learn more about the flows of crowds and what can cause jams at transit
stations. These are potential lessons that could be integrated into contingency
plans for future episodic events.
7.2 Transportation Lessons for Vancouver
In reflecting on the Olympic experience, many commentators have noted
how the two-week period was a good test for our transportation system.
Comments have been made about how the Olympics were a “cool experiment”178
and perhaps the largest traffic trial ever in North America179. It has been pointed
out that the thing on everyone‟s minds in Vancouver after the Games was what
did we learn?
Using input obtained from experts in interviews, insight from media
reports, and personal analysis of data and observations, ten lessons for
Vancouver have emerged from the Olympic downtown transportation experience
(Table 6 summarizes these lessons and their applications). This is not an
exhaustive list but rather a list of lessons that have emerged from my research
that captures a lot of the discussions and ideas that have been generated. As
well, although TDM was a core component of the OTP, the lessons generated
here do not apply exclusively to TDM initiatives but potentially could be applied to
all areas of transportation planning.
178
John Calimente, “Vancouver becomes a transit city for 17 days”, re:place magazine, Mar 31, 2010 Available: <http://regardingplace.com/?p=8014>
179Brent Toderian, “Vancouver Olympics a Living Laboratory for Urbanism!”, Planetizen, Feb 25, 2010 Available <http://www.planetizen.com/node/43096>
88
When it comes to building a more resilient city and transportation system,
which can continue to function in the face of changes such as those associated
with peak oil and natural disasters, I think there are two lessons that are
particularly valuable. Lesson number one about the possibility of achieving
higher than current levels of sustainable mode use is valuable because it
provides a vision of resilience that is powerful and shared among people in
Vancouver. This vision is useful for informing transportation discussions and
guiding planning decisions. The second is lesson number five about the
effectiveness of working together. I think this lesson is critical for the success of
transportation planning in Vancouver because working together is not necessarily
easy to do under normal circumstances away from the Olympic Games.
Another question is whether lessons have been learned from the
Olympics? I think a proper assessment of this question should be done in 2-3
years (i.e. at the end of 2012 to beginning of 2013). This is the period when a
number of plans and reports that are currently being developed could be
completed. For example, 2011 is when the new Regional Growth Strategy by
Metro Vancouver is expected to be adopted. As well, the Olympic Games Impact
study for Vancouver is expected to be completed in 2013 and the City of
Vancouver is in the process of working on a long-term transportation plan that
looks beyond the year 2021. The completion of these initiatives could lead to
transportation changes in the coming years and I think this would be a good time
to determine whether Vancouver has actually learned from its Olympic
experience.

89
Table 6: List of Transportation Lessons for Vancouver
Lesson Planning for Sustainable
Transportation
Planning for Episodic Events
1. It is possible to achieve higher than current levels of sustainable mode use
●
2. Transit has the potential to attract almost anyone
● ●
3. Minimizing the space that transportation takes up can create valuable public spaces
●
4. Our transportation system is resilient but could be improved with some additional TDM strategies
● ●
5. We are effective when we work together ● ●
6. Set a date for change and celebrate ●
7. Define what „normal‟ travel conditions will be like
● ●
8. Modelling changes to the transportation system provides valuable insight
●
9. There are many ways of disseminating travel information
● ●
10. We gained improved operational knowledge for our transportation system
●
7.2.1 It is Possible to Achieve Higher than Current Levels of Sustainable Mode Use
There were many initial worries noted in the local media that having more
people in the city and having more trips being made would lead to congestion for
all modes and gridlock conditions on the road. What the Olympics showed is that
this equation is not always true. It is possible to not increase road capacity while
accommodating more trips and greater travel demand from a larger population.

90
For long term transportation planning, this can be seen as confirmation of the
possibilities of achieving higher than current levels of sustainable mode use and
encouragement for governments, businesses, and local agencies to continue to
encourage and provide sustainable modes of transportation.
Ian Jarvis, CEO of TransLink, summed up this view for transit by stating
that “[w]hile the Games themselves were unique in terms of the impact on the
transit system, the Olympics proved that our ultimate vision for Metro
Vancouver‟s transportation system [as described in Transport 2040] is
achieveable”.180 He elaborates by pointing out that “there were a number of
conditions present during the Games that contributed to transit‟s overall
performance, and with those same elements in place across the region,
TransLink will be able to deliver the same people-moving capacity as it did
throughout the Olympics.”181
As well, the experience sets a benchmark and helps set a target that we
can aim for. Clark Lim suggested that the Olympics established an upper bound
for sustainable mode use while current conditions represent a lower bound. For
long term transportation planning, Vancouver can use those bounds to establish
a goal somewhere in between.
For the entire transportation system, the Olympics helped to provide a
vision of what Vancouver‟s future could be like. As Jarrett Walker puts it, the
Olympics provided “an imperfect but vivid glimpse of what “normal” might be like
180
TransLink, “TransLink tops 26 million riders” 181
Ibid.
91
10, 20, 30 years in the future, when there will be that many people moving every
day.”182 This vision can be described as one involving increased use of
sustainable modes and continuing mobility for travellers. During the Olympics,
many automobile and bus operators noted how pleased they were about driving
conditions. Reduced vehicle traffic meant that buses were able to move faster,
more smoothly, and more efficiently. The conditions were so good that according
to John Calimente183, bus operators constantly had to slow down because their
schedules had traffic delays built into them.
When planning for the future of Vancouver, the data gathered about the
Olympics could become useful in forecasting change. Jarrett Walker elaborates
by saying, “When planning the city of the future, people can say "we'll have 1.7
million people on transit every day," and it won't be just a number. Everyone will
remember what that looked like, how it felt, and the effort required to achieve
it.”184 Similarly, Clark Lim and Dale Bracewell have stated that the mode share
during the Olympics sets a precedent for what can be achieved in the future in
terms of sustainable mode use. The impact of TDM during the Olympics also
suggests the importance of considering TDM at the front end of the planning
process for transportation. This is because, as noted in Transport 2021, the use
of TDM can modify or postpone investment needed for transportation supply.
182
Jarrett Walker, “Vancouver: Olympic transit payoffs”, Human Transit, Mar 1, 2010, Available: <http://www.humantransit.org/2010/03/vancouver-olympic-transit-payoffs.html>
183 Calimente, “Vancouver becomes a transit city for 17 days”
184 Walker, “Vancouver: Olympic transit payoffs”
92
7.2.2 Transit Has the Potential to Attract Almost Anyone
With record numbers of people on transit throughout the Olympics, many
Vancouverites certainly decided to make the switch to transit. The survey from
TransLink indicated that regardless of the main mode of transportation used
normally, the majority of residents used transit with 79% of Metro Vancouver
residents saying that they used transit during the Olympics185. JoAnn Woodhall
stated that this experience suggests that transit in Vancouver has the ability to
attract “more than just the low hanging fruit” and for Dale Bracewell, this high
level of transit use sets a benchmark regarding what could be achieved in future
scenarios. It showed that it is not just a subset of people who are willing to adapt
and make changes to their transportation decisions at least during special
circumstances.
It also showed what was needed to attract riders including noticeable
improvements in the level of service provided. Charles Gauthier made the point
that during the Olympics, travelling on transit was comfortable and enjoyable.
The Olympic level of service involved increased frequency throughout the day
and longer hours of service. Charles Gauthier states that it would be unrealistic
to expect the same level of transit use without the same level of service provided.
However, currently that level of service may not be warranted because of the
size of the population in Metro Vancouver.
While some may not be willing to make the switch to transit for all 52
weeks of the year, they may consider doing it for some trips they regularly do by
185
NRG Research, Transit service quality during the Olympics
93
automobile. With transit being a mode that could play an important role in long-
term and short-term scenarios, this lesson has applicability to many
transportation challenges. It shows that for episodic events, people are willing to
switch to transit if that service is available. For long term transportation planning,
it illustrates the potential mode share for transit that could be targeted.
One commentator also raised a view about the positive feedback of
having more people riding transit. John Calimente suggested, “When everyone
is riding transit, it becomes more acceptable to the average person. The crowds
on the SkyTrain lines didn‟t discourage people from riding. On the contrary, it
may have actually encouraged more riders. Regardless of what people often say,
we like being around other people. But people need to feel comfortable on
transit, especially those that rarely take it. Since the transit system was surging
with middle-class folks going to Olympic events, it became acceptable for more
people to ride.”186 This view links back to ideas in the literature review that
suggests there is a relationship between changing values and attitudes and
attracting people to transit and supporting sustainable mode use.
7.2.3 Minimizing the Space That Transportation Takes Up Can Create Valuable Public Spaces
One of the points made by Mike Madill was that the process of closing
down roads to traffic also had the effect of creating spaces where exchanges
between individuals and between individuals and businesses could take place.
Closing down major sections of streets like Granville Street to vehicle traffic
186
Calimente, “Vancouver becomes a transit city for 17 days”

94
allowed for successful spaces to be created that contributed to the activity, the
buzz, and gathering of people noted by Brent Toderian who referred to the
spaces as “the best example of great urbanism” 187. This view highlights the
value of minimizing the amount of space that transportation takes up and using
that space for exchanges. According to Mike Madill, a good way to do that while
still preserving mobility is to utilize transit, walking, and cycling.
This is an idea that the DVBIA is already exploring through discussions
with the City of Vancouver to have Granville Street converted into a pedestrian
space on weekends. As well, City Councillor David Cadman has suggested that
something similar be done to Robson Street188. Of course, what the Olympics
also showed is that simply having the space available will not necessarily make it
successful. This is a point made clearly by Dale Bracewell. He stated that it
takes a critical mass of people out on the streets enjoying the festivities to make
a space successful. He adds that certainly, people enjoy food and having the
vendors out there adds value. The same can also be said about having
improved wayfinding, washrooms, and public art, which were present during the
Olympics. However, simply having those features is not enough. He continues
by pointing out that it is important to also have a generator, which was the role
played by the competition venues and live sites. This is a good point because
there were not drastic improvements to the public realm during the Olympics
according my observations especially relative to the dramatic increase in
187
Toderian, “Vancouver Olympics a Living Laboratory for Urbanism!” 188
Lori Culbert, “Councillor wants city to consider closing down Robson Street on summer weekends”, Vancouver Sun, Apr 2, 2010
95
pedestrian activity. It was the presence of Olympic venues, pavilions, and
scheduled activities that appeared to be key to getting people to use the streets
and public spaces in the downtown.
Minimizing the space taken up by transportation is a good first step in that
process though. In line with this is Dale Bracewell‟s point that having a generator
is also not enough. It is important to make sure that people do not simply find all
the parking they need in and around the downtown. For example, getting a mass
of people to travel to and from a site and from transit stations is also valuable.
This lesson has relevance for planning over the long term. For example,
minimizing space taken up by vehicles could create successful public spaces
during weekends and holidays when typically there are more events taking place,
which could encourage more travel by sustainable modes.
7.2.4 Our Transportation System is Resilient but Could Be Improved With Additional TDM Strategies
The experience during the Olympics allowed Vancouverites and local
planners to evaluate the region and city‟s transportation system under the crunch
of Olympic travel demand. The result appears to be a passing grade. The
experience appears to help confirm that the transportation system that has been
developed is a resilient one meaning that it was able to “to accommodate
variable and unexpected conditions without catastrophic failure”189. Many
commentators noted how well the system performed under pressure and how
well it handled the large numbers of travellers over the Olympic period. One
189
Definition of resilience taken from Todd Litman, “Evaluating Transportation Resilience”, Victoria Transport Policy Institute, 2010 Available: <http://www.vtpi.org/tdm/tdm88.htm>
96
commentator noted that “the transit system is amazingly efficient. The 31% jump
in ridership was handled as smoothly as could be expected. Of course there
were delays and waits, but considering the huge strains put on the system, there
were no major failures.”190
Although the transportation system performed admirably according to
many, the Olympic experience also suggests possible improvements and
additions that can be made to incrementally improve the system. For example,
for TransLink, it has shown that linking transit fares with events could be effective
in encouraging transit use to events. As such, an initiative is currently being tried
by TransLink for BC Lions games during the 2010 season. This initiative
involves offering a discounted transit pass to BC Lions season ticket holders that
provides holders with unlimited transit use on game days.
The Olympic experience has also raised and highlighted issues that might
be important to address in the future as the region and city continue to grow. For
example, at Waterfront station, travellers were directed by transit hosts using
placards and megaphones to multiple entrances of the station depending on
which transit service they were looking for. This was done to better manage the
flow of passengers. While that strategy worked during the Olympics, getting
people to walk around the building to side entrances in order to manage the flows
of passengers may not be a long-term solution for the future.
It has also been suggested that the routing of buses in Vancouver might
be too complicated for some to understand. John Calimente noted, “When
190
Calimente, “Vancouver becomes a transit city for 17 days”
97
people are unfamiliar with transit, they overwhelmingly chose the easiest
systems to understand, which were the rail-based systems. Bus ridership was
up only a few percentage points. TransLink staff at the SkyTrain stations said
that many people only wanted to hear options that involved SkyTrain. The routing
of buses was often seen as too complicated, or unappealing for longer
distances.”191
As well, praise was given to the instructional public announcements that
were made on the SkyTrain system throughout the Games. These
announcements provided information such as operating changes to SkyTrain
during the Olympics and information about Olympic venues. Improved
announcements and better information is one initiative that could be considered
on a more permanent basis.
7.2.5 We Are More Effective When We Work Together
Dale Bracewell emphasised that the OPTT was a partnership and that it
was this feature that led to the eventual success of the OTP. This success of this
partnership was consistently reiterated by interviewees who were part of the
development and implementation of the OTP. Mike Madill stated that the
success of the Games demonstrated “how effective we can be when we‟re
working together” and this is an important lesson because we “all have a lever to
pull in the transportation machine.” He continues, “If we‟re all working in concert
together, we‟re a lot better than if we‟re just doing our own thing.” Similarly,
Kevin Wallinger states that the Olympic experience illustrates the level of
191
Ibid.

98
integration required in planning between sectors such as transportation and
police to deal with different situations. Thus, the experience has demonstrated
the need to come together to get things done.
However, it is important to highlight the different institutional environment
that was present during the planning process for the OTP. There was arguably a
larger spotlight and greater media attention given to the performance of
transportation during the Olympics compared to normal circumstances.
Essentially, the world was watching and judging Vancouver with any negative
transportation event potentially becoming a black eye for the city and the region.
This Olympic environment is described by Giuliano et al. in their study192 of the
Los Angeles Games. Giuliano et al. explain that there was an atmosphere of
cooperation and leadership present for the Olympics, which brought people
together and helped to implement successful transportation strategies. A similar
sentiment about the level of cooperation that was achieved for the Games was
expressed by interviewees who worked on the Vancouver‟s OTP.
For Los Angeles, this environment did not appear to last beyond the
Games. Giuliano et al. described the institutional environment as being “unique”
and characterized by an “unusual level of consensus”193. They continue that
when the problems posed by the Olympics were over, the planning environment
that was experienced did not continue. I think this speaks to the importance of
needing to make an effort to preserve this cooperative environment for
Vancouver. One suggestion for doing this is to embed transportation
192
Giuliano, Evaluation of 1984 Los Angeles Summer Olympics 193
Ibid., pg. 142

99
experiences and stories from the Games and/or lessons learned from the Games
into some of the planning documents currently being developed in the region.
Next, the Olympic experience generated many internal lessons for
organizations that were involved with the OTP. For instance, through the
process of working together, members were able to better understand the roles
and responsibilities of each other. This was true for members who were part of
different organizations as well as members within the same organization. This
was an important lesson as noted by Kevin Wallinger and JoAnn Woodhall. The
result was that the Olympics helped to improve understanding and respect for
one another, which is a lesson that can be brought back to the workplace for
future projects.
Relationship building is another important lesson. This is because the
Olympics helped to generate the knowledge that different organizations can
count on one another during different episodic events. This is what Kevin
Wallinger refers to as building trust-based relationships, which he describes as
being “able to pick up the phone and get things done that need to be done.” For
Kevin Wallinger, having these trust-based relationships is “probably more
important than any plan you would have on the shelf”.
In addition, the Olympic downtown transportation experience highlighted
the importance and value of engagement and consultation. The City of
Vancouver tracked approximately 160 stakeholder meetings that they attended.
These meetings took place over the course of planning the OTP and included
consultation and dissemination of information to stakeholders from business

100
associations to truckers‟ associations. Consultation with stakeholders and
meetings with partners were very successful and helped to generate good
conversations that contributed to the success of the OTP. Dale Bracewell
illustrated this point with one story about a successful meeting between planners
from the City of Vancouver and members of the Integrated Security Unit (ISU).
For this meeting, poker chips and maps of transportation routes into downtown
Vancouver were brought in. These poker chips represented the number of trips
that are made on each of the different bridges and routes into the downtown.
Dale Bracewell explained that as each of the bridges or streets were closed
down one by one, these poker chips were reallocated to other routes. This
reallocation helped members of the ISU to understand the planner‟s world.
Furthermore, JoAnn Woodhall stated that during the Olympics, staff who
might usually be doing deskwork were allowed to get out on the ground to
interact and connect with residents and visitors. These included personnel from
all levels such as senior management from the partner Olympic organizations.
JoAnn Woodhall stated that staff really enjoyed the opportunity and that it gave
them a chance to gain a fresh perspective from a customer lens. In particular,
the experience allowed them to get more direct feedback about what is working
well with the system and what could be improved.
In summary, working together is an important lesson to come out of the
Olympic experience, especially given common goals in the region to promote
sustainable transportation in the long term and minimize disruptions caused by

101
future episodic events. In fact, one of the lessons from Dale Bracewell is to
“engage and partner with everyone”.
7.2.6 Set a Date for Change and Celebrate
The opening ceremony for the XXI Olympic Winter Games not only
marked the start of the Games but the start of a dramatic shift towards
sustainable transportation in Vancouver. Dale Bracewell stated that one of the
reasons why the OTP was effective was that everything absolutely had to be
ready by February 12th, 2010 – the date of the opening ceremony for the
Olympics. This was a date that could not be changed and the Olympics were
going to take place regardless of what happened with the OTP. Thus, having the
opening ceremony forced a commitment among organizations for action.
This is a lesson that Dale Bracewell suggests could be valuable and has
direct applicability for future long term planning. The specific lesson put forth by
Dale Bracewell was “commit to an opening ceremony.” While setting goals and
targets for mode share is important, it is also useful to set a date. This date
would represent something for people to reach for and could create a sense of
urgency. Dale Bracewell suggested that, for example, if a 50% mode share for
transit, walking, and cycling is a goal then set a date and commit to it now.
Before setting the date, I think it is also valuable to have proper workplans in
place to ensure that there is sufficient time to plan for these changes. This is
important because there could be consequences in rushing to meet a deadline
including cutting corners on projects.
102
Another aspect of the opening ceremony is that it is a cerebration that is
meant to make people feel good and excited about something. Clark Lim
highlighted the benefits of also celebrating a transportation achievement. He
notes that celebrating and recognizing an achievement like meeting a target for
sustainable mode use can boost morale and make people feel like they have
accomplished something important. This is significant because it can further
support and encourage the change towards higher levels of sustainable mode
use.
7.2.7 Define What ‘Normal’ Travel Conditions Will Be Like
One of the key messages prior to the Olympics was for people in
Vancouver to get ready for the unusual. The transfer of knowledge
programme194 from the International Olympic Committee helped the OPTT
recognize that during the staging of the Olympics, there were not going to be any
weekdays or weekends. It was going to be a 24-hour operation for 17 days.
Consequently, effort was put into defining what it was going to be like during
those 17 days and helping people and businesses to prepare for travel conditions
that were going to be „unusual‟.
On the Host City website195, a section was devoted to the question of what
to expect? It was clear what conditions commuters and businesses had to adapt
to: “Residents, businesses and visitors can expect rush hour conditions and
194
The transfer of knowledge program was set up “to contribute to maintaining the unique value and success of the Games product and experience through transferring knowledge and expertise from one edition of the Games to the next”. Source: International Olympic Committee, Factsheet: OKGM and the Vancouver 2010 debrief, (IOC, 2010).
195 City of Vancouver, “What to expect”, City of Vancouver, 2010, <http://olympichostcity.vancouver.ca/gettingaround/whattoexpect.htm>

103
parking restrictions in Downtown Vancouver 24 hours a day during Games time.
We encourage everyone coming Downtown during Games time to walk, cycle,
take public transit or carpool rather than drive alone. This will not only ease traffic
pressures at Games time, but will be faster and easier for everyone to get around
the city.”196
For the Olympics, Dale Bracewell noted that through the process of
defining the unusual, it became clear that pedestrian corridors would be needed
but not for the entire 24 hours each day. These corridors only needed to be in
operation for 12 hours for the LiveCity sites and this allowed the roads to be open
the rest of the time for deliveries. That was part of the redefinition of normal
conditions for businesses. For commuters, it was stated through messaging that
people could have a difficult time driving downtown and that high levels of
congestion could be a reality during the Olympics. These conditions were
conveyed through presentations to businesses to ensure that they understood
what the reality of the Olympics would be like. This communication ensured that
businesses would be prepared and ready for the changes once they came.
Similarly, many messages were delivered to the public through media like
advertisements and brochures to encourage residents to modify their travel
behaviour and help prevent potentially congested travel conditions.
For Dale Bracewell, “redefine business as usual” is one lesson that can be
used to help shape the processes for planning for Vancouver‟s long term
transportation. He notes that especially as the downtown and the city continue to
196
Ibid.
104
grow, businesses and commuters may have to adapt and make changes to their
transportation decisions. Like the Olympics, in order to properly prepare for this
change, it is important to define what „normal‟ will be like in the future.
Developing different scenarios of future conditions could be one approach that is
used for this process of defining the normal.
7.2.8 Modelling Change to the Transportation System Provides Valuable Insight
As illustrated in the literature review, there exists an abundance of
strategies and plans that have been developed for cities to handle transportation
challenges. The success and effectiveness of these strategies are dependent on
numerous factors and variables with random factors also playing a role. One of
the reasons why the OTP worked so well according to Dale Bracewell was the
amount of modelling that was done to help inform the development of the OTP.
He noted that the City did data collection prior to the Olympics during sporting
events in downtown Vancouver to understand how people usually travel to and
from those events. From the analysis of data, the City was able to develop
vehicle, transit, and pedestrian models that were customized for the Olympics.
It was out of these models that the target for a minimum 30% reduction in
vehicle traffic for the downtown was born. Dale Bracewell stated that without the
aid of the model, they might have guessed a 20% reduction would be sufficient
and that would have led to a misdirected information campaign. Similarly, the
models that were developed showed that approximately 14,300 pedestrians
would use Robson Street during the Olympics and thus, space had to be freed
105
up for them which took the form of the pedestrian corridor. To help evaluate the
model, counts were conducted during the Olympics for Robson Street. The
counts totalled approximately 14,000, which was not far off from the projections.
Similarly, the modelling showed that arriving in downtown before 7am and
leaving by 2pm would allow downtown workers to avoid the busiest times on the
transportation network.
Dale Bracewell suggests that “engineering for success” is an important
lesson to come out of the Olympic experience. Dale Bracewell states that it is
important when developing transportation strategies to do it in a way that is
robust and measurable. Modelling provides an important tool that can be used to
produce an image of what the city might be like in the future. This helps to
foresee difficulties as accurately as possible. For long term planning, this lesson
points to the importance of not simply taking transportation strategies that appear
to be successful in other cities, implementing them in Vancouver, and then
expecting similar results.
7.2.9 There Are Many Ways of Disseminating Travel Information
The 2010 Olympic experience was characterized by a heightened use of
the Internet for travel information. For the Olympics, a number of different tools
were created for commuters to make informed travel decisions. These tools
provided information about different travel modes and the travel conditions that
travellers might face. Made available on websites of TransLink, the City of
Vancouver, and VANOC was information such as routes to take, levels of service
to expect, and potential delays. Information was also made available on
106
TransLink‟s Buzzer Blog and on several twitter accounts of TransLink
representatives. As well, special websites like the travelsmart2010.ca website
provided additional sources for travel information. JoAnn Woodhall remarked
that these were tools that people felt comfortable using and that the take up of
these tools was “incredible”.
The response and uptake of these tools suggests the value of continuing
to develop social media and finding ways to connect with customers as well as
the value of providing travel information in real-time for travellers. It was also
suggested during interviews that mobile alerts were a good way of getting the
word out because people could be moving away from traditional sources like the
radio. As well, having transit hosts in and around transit stations was also
effective and helped to boost customer service and improve communication and
trust with customers. This is an initiative that TransLink will plan for during large
and special events. As well, the significant increase in calls to customer
service197 at TransLink exemplifies the important role of communications to
travellers.
Furthermore, there were many rumours about travelling during the
Olympics that were simply not true. These rumours included a ban on driving in
the downtown, the shutting down of Stadium-Chinatown and King George
SkyTrain Stations, and the belief that everyone using SkyTrain would be required
197
As described in Tyler Heshka, “Our customer call centre sets their own Games records”, The Buzzer Blog, Feb 25, 2010, Available: <http://buzzer.translink.ca/index.php/2010/02/our-customer-call-centre-sets-their-own-games-records/>
107
to go through security checks198. As such, another important role played by
communications to the public was for dispelling these rumours and ensuring that
everyone had proper information about travel conditions.
Lastly, exploring different ways of communicating amongst staff could be
valuable too. Ken Hardie pointed out that “having a central communications
centre during the Games, where complaints from the public could be forwarded
and checked out, allowed TransLink to address problems such as bus delays or
tie-ups on certain routes fairly quickly. The use of social media such as Twitter
also enabled TransLink to move staff where they were needed.”199
As Kitamura et al.200 suggested, information can play a potentially
powerful role in shaping people‟s beliefs, attitudes, and values regarding
transportation and ultimately, shaping people‟s travel behaviour. One of the keys
to success of the Olympic transportation experience was the ability of the OPTT
to give commuters clear information about travel conditions. This suggests that
continuing to ensure that travel information is disseminated properly to residents
and transportation staff may be valuable for future transportation planning in
Vancouver.
198
Jhenifer Pabillano, “TransLink‟s Olympic Story, part 4: reducing car traffic and offering travel options”, The Buzzer Blog, Feb 2, 2010, Available: <http://buzzer.translink.ca/index.php/2010/02/translinks-olympic-story-part-4-reducing-car-traffic-and-offering-travel-options/>
199 Sinoski, “TransLink takes stock”
200 Kitamura, “Self-reinforcing motorization”
108
7.2.10 We Gained Improved Operational Knowledge of Our Transportation System
There were a number of operational lessons learned during the Olympics.
Mike Madill suggested that the Olympics provided a playbook of some
contingency plans that were developed for the Olympics but could be utilized in
other applications in the future. One example of this contingency plan that was
implemented was on the last day of the Olympics. This was when crowds were
so huge downtown that it would have been ineffective to keep sending buses into
the area. As such, buses simply made it to the edge of the downtown, dropped
off passengers, and then turned around so that they did not get caught in the
gridlock. In addition, Mike Madill stated that there has been an improved
knowledge of how to handle large crowds.
Dale Bracewell noted that the Olympics showed what was necessary to
close down a road and turn it into a pedestrian street. He noted that the Olympic
experience showed that it does not take much signage or many traffic cones to
close roads to vehicles. As crews were setting up the corridors everyday, they
also became better operationally at the task and gained a better understanding of
the effort needed to complete the task. This could be beneficial if and when
conversion to pedestrian streets becomes a necessary strategy such as in
response to the disruptions brought on by episodic events.
109
7.3 Transportation Lessons for Future Host Cities
7.3.1 Generating Transportation Lessons
The Olympic transportation experience in downtown Vancouver
exemplifies the valuable lessons that could be generated from the hosting of
mega-events like the Olympics. The lessons from the analysis above show the
potential that exists for generating lessons about many aspects of transportation
planning that could be useful and relevant to the future planning of cities.
For Vancouver and its residents, the implementation of the various
transportation strategies allowed the public, planners, and politicians to see how
those strategies in the OTP worked in real life. The Olympics helped to
demonstrate the workings of the strategies and the effects on mode share. It has
allowed us to see what happens when roads are closed to vehicles and transit
service is improved. The data collected also appears to be valuable but so too is
the potential change in people‟s perceptions and attitudes regarding
transportation changes.
As well, the Olympic experience has helped planners assess Vancouver‟s
transportation system and illustrated what might be valuable additions to the
transportation system. Also important, the Olympic experience has provided the
public with a glimpse of what future travel conditions in Vancouver could be like
and has spurred discussions about the future of the city and region‟s
transportation system. These discussions may not simply revolve around just
projections and numbers but could also involve memories and experiences that
people will draw upon from the Olympics.
110
However, these lessons did not simply appear out of nowhere. Data
collection, documentation of events, and insightful discussions from many
commentators contributed to the lessons that have been generated in this paper.
For future host cities that wish to leverage mega-events to generate
transportation lessons that are valuable for their locality, it will be important to
develop their own monitoring plan to understand their respective experiences.
In particular, it will be important both to collect sufficient data of good
quality and to develop strong evaluation criteria beforehand. Having one without
the other would not be of much value. In illustration, Clark Lim compared data
collection and evaluation criteria to two components that complete a wheel. If
one were missing, a circle would not be formed and in turn, the wheel would not
be able to go very far. In the case of the 2010 Olympics, the City of Vancouver
made a commendable effort to collect data throughout the Games through
counts on vehicles, pedestrians, and cyclists. There were also intercept surreys
and screenline surveys. TransLink was also active in collecting and presenting
data about transit use during the Olympics. This data collection provided
valuable empirical evidence about what actually occurred during the Olympics
including changes to vehicle traffic, changes to transit ridership, and changes to
the number of people walking and cycling over the Burrard Bridge.
Overall, it appears that there is satisfaction in Vancouver with the data
collected. However, given additional funding and resources, some interviewees
have suggested that it would have been valuable to do some things slightly
differently. Charles Gauthier has suggested that a survey sent out to businesses
111
would be valuable in understanding the impact of the Olympics on businesses.
In the past, this type of business-oriented survey has been conducted for the
1984 Olympics in Los Angeles201. This survey was designed to examine all
aspects of work trip travel and was valuable in determining how the Olympics
travel experience of workers compared to normal conditions. Similarly, Dale
Bracewell has suggested that it would have been valuable to conduct a resident
and work specific travel diary during the Olympics but such a travel diary could
cost several million dollars.
In terms of improving the data collection process, Clark Lim adds that if
additional funding were available, he would have made a few improvements. He
suggested possibly replacing human data collectors with automatic counters in
some areas to improve data quality. As well, resources to support students who
were out in the field collecting data would have been beneficial. In particular,
resources to help keep students warm, safe, and dry were suggested.
One area where I think there could have been improvement was the
evaluation criteria. There did not appear to be many metrics or detailed criteria
developed beforehand to formally evaluate the outcome of the OTP and the
overall transportation experience. One target was the reduction in vehicles,
which was set out early in the development of the OTP. Certainly, many other
indicators of success were noted in my conversations with experts. However,
many of these indicators did not appear to be explicitly established beforehand.
One of the reasons for this lack of criteria is probably the fact that Vancouver has
201
Giuliano, Evaluation of 1984 Los Angeles Summer Olympics
112
never hosted the Olympics before and may not have known what exactly to
expect. As well, JoAnn Woodhall noted a lack of transfer of knowledge in this
area from previous Olympics.
Thus, I think setting out a strong set of criteria will be an important step for
future host cities in generating their own transportation lessons. As Hensher and
Brewer202 point out, it is important to have criteria so that transportation
performance can be properly assessed, which can help determine the level of
success. One suggestion is contained in an article by Timo Finke and Eric N.
Schreffler203. The article presents a toolkit that has been developed for
evaluating TDM projects and could provide some insight into the development of
useful criteria for analyzing future TDM projects.
In developing the monitoring plan, cities should make sure that the results
that will be generated would be useful and relevant to the locality. The plan
should take into consideration the context including the types of infrastructure
and land use that characterize the city. Just because one city uses certain
indicators does not necessarily mean they are appropriate for another.
7.3.2 Transportation Planning for the Olympics
In terms of actually planning for transportation for the Olympics Games,
interviewees have suggested a few items. One was that it might have been
valuable to start some stages of planning earlier to allow for more time to prepare
202
Hensher, “Going for Gold at the Sydney Games” 203
Timo Finke and Eric N. Schreffler, “Using Multiple Assessment Levels for Evaluating Transportation Demand Management Projects: Monitoring and Evaluation Toolkit”, Transportation Research Record: Journal of the Transportation Research Board, 1864, 2004, 135-143
113
and iron out details. However, this does not necessarily mean going to the public
earlier because if that happens, planners and communicators might not be able
to get their attention.
Dale Bracewell offers up the advice of leaving no mode unexplored when
developing an Olympic transportation plan. He stated that he never felt
comfortable ignoring a mode because it could turn into the Achilles heel of the
plan. As a result, he thought about everything from trucking to armoured cars to
doctors on call and how they would all play into the mix. While it is important to
consider these different modes of transportation, Dale Bracewell stated that
planning for these modes does not have to be comprehensive, meaning that
every mode does not necessarily have to be modelled or studied extensively.
Rather, just ensure that they are considered and explored.
Charles Gauthier has suggested having a lot of consultation and engaging
with stakeholders. It was this consultation that helped to ensure that no
businesses represented by the DVBIA were behind the security zone and that
businesses and the public were well notified about the transportation changes in
advance. According to Charles Gauthier, being repetitive and getting the word
out was key to the success of the Olympics.
Lastly, Clark Lim suggested that making the link explicitly with disasters
could be an opportunity that could be leveraged during the Olympics. He noted
that the Olympic period could be a time to get businesses and the public to think,
experiment, and create an emergency preparedness strategy for dealing with
other episodic events.

114
8: CONCLUSION
This research project has illustrated the potential of generating lessons
from the Olympic downtown transportation experience that could be useful to
future transportation planning in Vancouver. It has also suggested that other
host cities could be able to leverage mega-events like the Olympics to improve
their transportation system and learn lessons that are directly applicable to their
localities. There is the potential for lessons that provide insight into long term
transportation planning as well as planning for episodic events. As well, there
are lessons at both macro and micro levels, lessons internal to organizations,
and lessons for operations. However, the types of lessons generated will be
determined by the commitment of governments to putting in resources to collect
necessary data and to document events and experiences.
The value of learning from the Olympics is important given the many
challenges facing cities. As Transport Canada puts it, “learning from past
experience is often one of the best ways to move forward”204. For Vancouver, it
appears that the Olympics did have an effect in building on the existing
momentum previous to the Olympics by spurring some transportation changes.
As outlined earlier, some initiatives during the Olympics are being considered by
the City of Vancouver and TransLink for permanent implementation.
204
Transport Canada, “TDM Strategies”
115
As well, following the Olympics, there appears to be momentum for
increased transit use and increased programming of public activities in downtown
Vancouver. A lot of summer programming was developed for Granville Street to
keep it a pedestrian-active space including hosting broadcasts of the World
Cup.205 While buses have returned to Granville Street206 as originally planned,
they are now rerouted off Granville Street after 9pm on Fridays, Saturdays,
Sundays, holidays, and evenings before holidays to create an “appropriate
balance between transit corridor and entertainment district.”207
In addition, a release from TransLink in May 2010 presented statistics on
transit use208 after the Olympics. It stated that transit use prior to the Olympics in
January 2010 rose 3.1% from January 2009. After the Olympics, transit use rose
by 19.3% in March 2010 compared to March 2009 (see Table 7). It remains to
be seen how long that momentum can be sustained and whether initiatives in the
OTP will be implemented permanently. Regardless, I think the Olympics were
valuable in at least showing what successful transportation could look like and
providing insight into how successful transportation can be achieved.
205
Graeme Wood, “Crowds gather for World Cup and „car free‟ events on Granville”, Vancouver Sun, Jul 10, 2010
206 They were originally taken off in April 2006 for the construction of the Canada Line.
207 Jhenifer Pabiliano, “Trolley service returns to Granville Mall on Tue Sept 7”, The Buzzer Blog, Aug 11, 2010 <http:buzzer.translink.ca/index.php/2010/08/trolley-service-returns-to-granville-mall-on-tue-sept-7>
208 TransLink, “Transit ridership post-Olympics”, TransLink, May 25, 2010
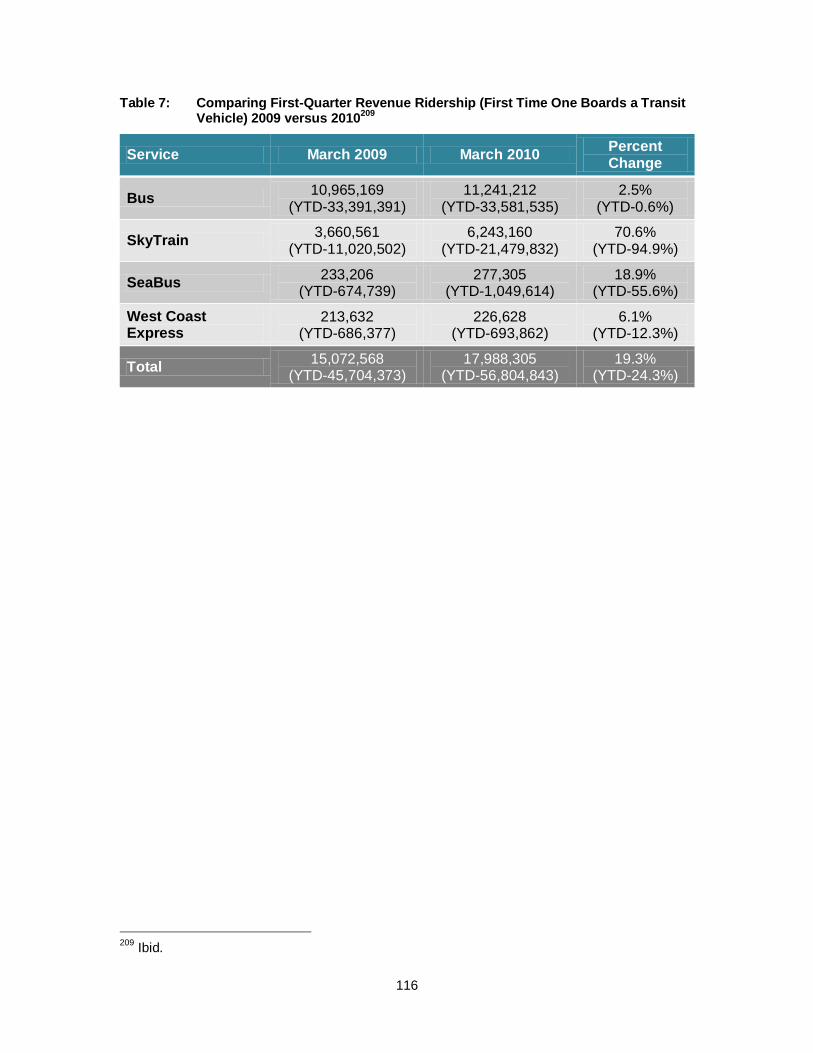
116
Table 7: Comparing First-Quarter Revenue Ridership (First Time One Boards a Transit Vehicle) 2009 versus 2010
209
Service March 2009 March 2010 Percent Change
Bus 10,965,169
(YTD-33,391,391) 11,241,212
(YTD-33,581,535) 2.5%
(YTD-0.6%)
SkyTrain 3,660,561
(YTD-11,020,502) 6,243,160
(YTD-21,479,832) 70.6%
(YTD-94.9%)
SeaBus 233,206
(YTD-674,739) 277,305
(YTD-1,049,614) 18.9%
(YTD-55.6%)
West Coast Express
213,632 (YTD-686,377)
226,628 (YTD-693,862)
6.1% (YTD-12.3%)
Total 15,072,568
(YTD-45,704,373) 17,988,305
(YTD-56,804,843) 19.3%
(YTD-24.3%)
209
Ibid.
117
REFERENCE LIST
Adams, John. “The social implications of hypermobility.” in The Economic and Social Implications of Sustainable Transportation: Proceedings from the Ottawa Workshop. (OECD, 2000)
BC Hydro. “Press Release: Report released on downtown Vancouver power outage.” BC Hydro. Sept 29, 2008, <http://www.bchydro.com/news/articles/press_releases/2008/report_released_on.html>
Boychuk, Charlotte. “Maintaining our extra Olympic buses during the Games.” The Buzzer Blog. Mar 3, 2010 <http://buzzer.translink.ca/index.php/2010/03/maintaining-our-extra-olympic-buses-during-the-games/#more-8690>
Bracewell, Dale. Host City Olympic Transportation Plan: A Sustainable Legacy for Vancouver. (Vancouver, Olympic Transportation Branch, 2010)
Bracewell, Dale. “The Road to the 2010 Olympic and Paralympic Games – Transportation Findings of Large Public Events in Downtown Vancouver.” 2008 Annual Conference of the Transportation Association of Canada, Toronto
Calimente, John. “Vancouver becomes a transit city for 17 days.” re:place magazine. Mar 31, 2010 Available: <http://regardingplace.com/?p=8014>
Cambridge Systematics Inc. and Eastern Research Group Inc. Evaluate the Interactions between Transportation-Related Particulate Matter, Ozone, Air Toxics, Climate Change, and Other Air-Pollutant Control Strategies. (National Cooperative Highway Research Program, 2010)
CBC News. “Olympics could boost insurance costs.” CBC. Sept 30th, 2009
Chan, Jason. “Delivering operations excellence.” 2010 APTA Rail Conference, Vancouver, Jun 6, 2010
City of Vancouver. “[3] Principles, Policies and Priorities.” (City of Vancouver, Engineering Services, 2010) Available: <http://vancouver.ca/engsvcs/transport/plan/1997report/3-1.htm>
City of Vancouver. “Background to the Downtown Transportation Plan.” (City of Vancouver, 2010) Available: <http://vancouver.ca/dtp/transportationchallenge.htm>

118
City of Vancouver. “Burrard Bridge Statistics.” City of Vancouver, 2010, <http://vancouver.ca/projects/burrard/statistics.htm>
City of Vancouver. “Central Waterfront Hub: Transit.” City of Vancouver. Available: <http://vancouver.ca/commsvcs/currentplanning/whitecaps/pdf/Board3_Transportation%20sm.pdf>
City of Vancouver. Downtown Transportation Plan. (City of Vancouver, 2002) Available: <http://vancouver.ca/dtp/dtpfinalplan.htm>
City of Vancouver. Transportation Trends – 2006 Census and Central Business District Counts. (City of Vancouver, 2008)
City of Vancouver. Vancouver Transportation Plan, Progress Report. (City of Vancouver, 2006)
City of Vancouver. “What to expect.” City of Vancouver, 2010, <http://olympichostcity.vancouver.ca/gettingaround/whattoexpect.htm>
Crawford, Tiffany. “Transit runs smoothly despite influx of travellers on busiest Games day yet.” Vancouver Sun. Feb 17, 2010
Culbert, Lori. “Councillor wants city to consider closing down Robson Street on summer weekends.” Vancouver Sun. Apr 2, 2010
Dexter, Lorena. “The New Canada Line Culture: more urban, more engaged.” VPSN, Feb 19, 2010
Dhariwal, Rajan. “Downtown Vancouver Blackout 2008: Assessing Disruptions to Businesses.” UBC Centre for Human Settlements. March 16th, 2010
Dill, Jennifer and Erin Wardell. “Factors affecting worksite mode choice: findings from Portland, Oregon.” Transportation Research Record: Journal of the Transportation Research Board. 1994, (2007) 51-57
Farrell, Ian. “Learning to navigate downtown Vancouver.” The Seattle Times, Feb 15, 2010
Federation of Canadian Municipalities. Improving Travel Options with Transportation Demand Management (TDM). (FCM, 2008)
Finke, Timo and Eric N. Schreffler. “Using Multiple Assessment Levels for Evaluating Transportation Demand Management Projects: Monitoring and Evaluation Toolkit.” Transportation Research Record: Journal of the Transportation Research Board, 1864, 2004, 135-143
Foutaine, Daniel. “Traffic congestion eases while transit system over capacity.” CityCaucus, Feb 21, 2010, Available: <http://www.citycaucus.com/2010/02/traffic-congestion-disappears-as-transit-system-taxed-to-the-max>
119
Frank, Lawrence D., Martin A. Andresen, and Thomas L. Schmid. “Obesity Relationships with Community Design, Physical Activity, and Time Spent in Cars.” American Journal of Preventive Medicine. 27.2, (2004) 87-96
Fujii, Satoshi. “Retrospectives and Perspectives on Travel Behavioural Modification Research: A report of the “Behavioural Modification” Workshop.” in The expanding sphere of travel behaviour research and selected papers from the 11th International Conference on Travel Behaviour Research, edited by Ryuichi Kitamura, Toshio Yoshii, and Roshiyuki Yamamoto, (UK: Emerald Group Publishing Limited, 2009)
Gärling, Tommy and Satoshi Fujii. “Travel behaviour modification: theories, methods, and programs.” in The expanding sphere of travel behaviour research and selected papers from the 11th International Conference on Travel Behaviour Research, edited by Ryuichi Kitamura, Toshio Yoshii, and Roshiyuki Yamamoto, (UK: Emerald Group Publishing Limited, 2009)
Gärling, Tommy, Anita Gärling, and Peter Loukopoulos. “Forecasting Psychological Consequences of Car Use Reduction: A Challenge to an Environmental Psychology of Transportation.” Applied Psychology: An International Review. 51.1, (2002) 90-106
Gärling, Tommy and Geetrtje Schultema. “Travel demand management targeting reduced private car use: effectiveness, public acceptability, and political feasibility.” Journal of Social Issues. 63.1, (2007) 139-153
Gifford, Robert and Linda Steg. “The impact of automobile traffic on quality of life. ” in Threats from Car Traffic to the Quality of Life edited by Tommy Gärling and Linda Steg, (Netherlands: Elsevier, 2007)
Gilbert, Robert and Anthony Perl. Transport revolutions: moving people and freight without oil. (Sterling: Earthscan, 2008)
Giuliano, Genevieve. “Transportation Demand Management: Promise or Panacea?” Journal of the American Planning Association. 58.3, (1992) 327-335
Giuliano, Genevieve and Jacqueline Golob. “Impacts of the Northridge earthquake on transit and highway use.” Journal of Transportation and Statistics. 1.2, (1998) 1-20
Giuliano, Genevieve, Kevin Habolan, Joseph Prashker, and Will Recker. Evaluation of 1984 Los Angeles Summer Olympics Traffic Management. (Institute of Transportation Studies, University of California, 1987)
Goddard, Jim. “Poll: Twelve per cent of people in Greater Vancouver planning to leave town during Olympics.” News1130. Jan 19, 2010
Greater Vancouver Regional District. Greater Vancouver Region Transportation Demand Management Project: Final Report. (GVRD, 1996)
120
Greater Vancouver Regional District. Livable Region Strategic Plan. (Burnaby: Policy and Planning; 1999)
Greater Vancouver Regional District and the Province of BC. A Long-Range Transportation Plan for Greater Vancouver: Transport 2021 Report. (GVRD and Province of BC, 1993)
Harcourt, Mike, Ken Cameron, and Sean Rossiter. City Making in Paradise: Nine Decisions that Saved Vancouver. (Vancouver: Douglas & McIntyre, 2007)
Hensher, David A. and Ann M. Brewer. “Going for Gold at the Sydney Olympics: how did transport perform?” Transport Reviews. 22.4, (2002) 381-399
Heshka, Tyler. “Our customer call centre sets their own Games records.” The Buzzer Blog, Feb 25, 2010, Available: <http://buzzer.translink.ca/index.php/2010/02/our-customer-call-centre-sets-their-own-games-records/>
Inwood, Damian. “Expect bridge closures on Cambie St. in Feb., March.” The Province. Jan 13, 2010
International Olympic Committee. Factsheet: OKGM and the Vancouver 2010 debrief. (IOC, 2010)
Kassens, Eva. Transportation Planning for Mega-Events: A model for urban change. PhD. Thesis, Massachusetts Institute of Technology, 2009
Kitamura, Ryuichi, S. Nakayama, and T. Yamamoto. “Self-reinforcing motorization: can travel demand management take us out of the social trap?” Transport Policy. 6, (1999) 135-145
Kitamura, Ryuichi, T. Yamamoto, and Satoshi Fujii. “Impacts of the Hanshin-Awaji earthquake on traffic and travel.” in S. Cairns, C. Hass-Klau, and PB Goodwin, Traffic Impact of Highway Capacity Reductions: Assessment of the Evidence. (London: Landor, 1998)
Litman, Todd. “Evaluating Transportation Resilience.” Victoria Transport Policy Institute. 2010 Available: <http://www.vtpi.org/tdm/tdm88.htm>
Litman, Todd. “Special Event Transport Management.” Victoria Transport Policy Institute. 2010 <http://www.vtpi.org/tdm/tdm48.htm>
Litman, Todd. “Success stories: Examples of TDM Programs that work.” Victoria Transport Policy Institute, 2010, <http://www.vtpi.org/tdm/tdm71.htm>
Lyons, Alex. “Fewer ICBC claims than normal during Vancouver Winter Games.” News1130. Mar 4, 2010
Meyer, Michael D. “Demand management as an element of transportation policy: using carrots and sticks to influence travel behaviour”. Transportation Research Part A. 33, (1999) 575-599
121
Munro, Harold. “Replace old trolley buses, officials say: They recommend replacing Vancouver‟s fleet of 244 by 2006, at a cost of more than $300 million.” Vancouver Sun. Jun 16, 2000
Newman, Peter, Timothy Beatley, and Heather Boyer. Resilient Cities: Responding to Peak Oil and Climate Change. (Washington: Island Press, 2009)
Noland, Robert B., William A. Cowart, and Lewis M. Folton. “Travel demand policies for saving oil during a supply emergency.” Energy Policy. 34 (2006) 2994-3005
NRG Research. Transit Service Quality During the Olympics. (TransLink, 2010)
OECD, Towards Sustainable Transportation, (OECD, 1996)
Office of the Premier. “U-Pass BC to save students on transit fares”. Ministry of Transportation and Infrastructure. June 9, 2010
Pabillano, Jhenifer. “How we manage the SkyTrain lineups at Waterfront Station.” The Buzzer Blog, Feb 18, 2010 <http://buzzer.translink.ca/index.php/2010/02/how-we-manage-the-skytrain-lineups-at-waterfront-station>
Pabillano, Jhenifer. “New reroutes for the 5, 6, and N6 during the Olympics.” The Buzzer Blog, Feb 16, 2010, <http://buzzer.translink.ca/index.php/2010/02/new-reroutes-for-the-5-6-and-n6-during-the-olympics/>
Pabillano, Jhenifer. “TransLink‟s Olympic Story, part 4: reducing car traffic and offering travel options.” The Buzzer Blog, Feb 2, 2010, <http://buzzer.translink.ca/index.php/2010/02/translinks-olympic-story-part-4-reducing-car-traffic-and-offering-travel-options/>
Pabillano, Jhenifer. “Trolley service returns to Granville Mall on Tue Sept 7.” The Buzzer Blog, Aug 11, 2010 <http:buzzer.translink.ca/index.php/2010/08/trolley-service-returns-to-granville-mall-on-tue-sept-7>
Pathman, Karthick. Urban change and transportation vulnerability to earthquakes: the case of metro Vancouver. Masters thesis, University of British Columbia, Vancouver, 2010
Penner, Derrick. “Vancouver contemplates life without the viaducts.” Vancouver Sun, Mar 22, 2010
Poudenx, Pascal. “The effect of transportation policies on energy consumption and greenhouse gas emission from urban passenger transportation.” Transportation Research Part A. 42, (2008) 901-909
122
Robbins, Derek, Janet Dickinson, and Steven Calver. “Planning transport for special events: A conceptual framework and future agenda for research.” International Journal of Tourism. 9, (2009) 303-314
Robinson, Russ. “Transportation demand management in Canada: an overview.” Energy policy. 25, (1997) 1189-1191
Rossi, Cheryl. “Tow trucks report no Games increase.” Vancouver Courier, Feb 10, 2010
Saleh, Wafaa. “Success and failure of transportation demand management: Is congestion charging the way forward?” Transportation Research Part A. 41, (2007) 611-614
Scott, Sheila. “VANOC TravelSmart Challenge hopes to reduce traffic leading up to Olympics.” News1130. Jan 6, 2010
Scott, Sheila. “Vancouverites booking tickets out of town during Olympics.” News1130, Nov 3, 2009
Senft, Graham. U-pass at the University of British Columbia: Lessons for Effective Demand Management in the Campus Context. 2005 Annual Conference of the Transportation Association of Canada, Calgary, 2005
Shiffer, Michael. “It Takes a Region: Integrating rail investment in multimodal plans and programs.” 2010 APTA Rail Conference. Vancouver, Jun 6, 2010
Sin, Lena. “1:45 pm at Waterfront station.” The Province. Feb 21, 2010
Sinoski, Kelly. “Drivers alerted as viaducts set to close.” Vancouver Sun. Feb 3, 2010
Sinoski, Kelly. “Impark ups parking rate to $95 a day at two lots.” Vancouver Sun, Feb 13, 2010
Sinoski, Kelly. “Nine major downtown Vancouver traffic routes to close for the Olympics.” Vancouver Sun. Oct 14, 2009
Sinoski, Kelly. “Record weekend expected for transit as Vancouver Olympic fever deepens.” Vancouver Sun, Feb 20, 2010
Sinoski, Kelly. “TransLink expecting nearly a million passengers a day during 2010 Games.” Vancouver Sun. Mar 3, 2009
Sinoski, Kelly. “TransLink takes stock after Olympics.” Vancouver Sun. Mar 1, 2010
Solomon, Linda. “Charles Gauthier: Preparing businesse for the Olympic Games.” Vancouver Observer, Jun 8, 2009, Available: <http://www.vancouverobserver.com/2009/06/08/charles-gauthier-preparing-businesses-olympic-games>

123
Souche, Stéphanie. “Measuring the structural determinants of urban travel demand.” Transport Policy. 17, (2010) 127-134
Statistics Canada, Employed labour force by mode of transportation, both sexes, percentage distribution, for Canada, census metropolitan areas and census agglomerations, and component census subdivisions (municipalities) of residence - 20% sample data, 2006 Census, Ottawa, 2009, Available from <http://www12.statcan.gc.ca/census-recensement/2006/dp-pd/hlt/97-561/T603-eng.cfm?SR=1>
Steg, Linda and Robert Gifford. “Sustainable transportation and quality of life.” Journal of Transport Geography. 13, (2005) 59-69
Synovate, TransLink Olympic Travel Survey – Final, (TransLink, 2009)
The Province. “Tip to avoid the all-day rush hour”, The Province, Feb 10, 201
The Province. “Lots of Vancouverites making plans to escape Winter Olympics”, The Province. Nov 5, 2009
Toderian, Brent. “Vancouver Olympics a Living Laboratory for Urbanism!” Planetizen, Feb 25, 2010 Available <http://www.planetizen.com/node/43096>
TransLink. “Accolades for TransLink Olympic efforts”. TransLink, May 25, 2010
TransLink. “Moving the world record numbers ride transit in Olympic week 1”. TransLink, Feb 20, 2010
TransLink. “Transit ridership post-Olympics”. TransLink. May 25, 2010
TransLink. “TransLink tops 26 million riders”. TransLink. Mar 23, 2010
TransLink. Transport 2040, (TransLink, 2008)
TransLink. “TravelSmart Pilot Project.” TransLink. <http:www.translink.ca/en/Plans-and-Projects/Urban-Showcase/Travel-Smart-Pilot-Project.aspx>.
Transport Canada. “TDM definition, overview, and rationale.” Transport Canada, 2010. <http://www.tc.gc.ca/eng/programs/environment-utsp-tdmintro-1039.htm>
Transport Canada. “TDM strategies during transportation disruptions and episodic events”. Transport Canada, 2010, <http://www.tc.gc.ca/eng/programs/environment-utsp-casestudy-cs75etdmstrategies-890.htm>
Transport Canada. “Targeted marketing and outreach.” Transport Canada. <http://www.tc.gc.ca/eng/programs/environment-utsp-tdm-prj49e-953.htm>
124
Transport Canada. “Transportation Demand Management (TDM) Resource Centre.” 2010, <http://www.tc.gc.ca/eng/programs/environment-utsp-tdmresources-1051.htm>
UK Sport. “The Economic Impact of Major Events”. Staging Major Events: The Guide, UK Sport, 2005
Ungemiah, David and Casey Dusza. “Transportation Demand Management Benchmark: Results from 2008 TDM Program Survey.” Transportation Research Record: Journal of the Transportation Research Board. 2118, (2009) 55-66
University of British Columbia. Fall 2008 Transportation Status Report. (UBC, Feb 2009)
Vancouver Sun. “Pattullo Bridge Closed”. Vancouver Sun. Jan 19, 2009
Vancouver Sun. “Power outage causes chaos downtown”. Vancouver Sun. Aug 26th, 2006
Vancouver Sun. “Residents flee city to avoid Olympic chaos”. Vancouver Sun. Nov 5, 2009
VANOC. Fact Sheet: Transportation Planning for the 2010 Olympic Winter Games. (VANOC, 2009)
VANOC. “2010 Olympic Transportation Plan a success”. VANOC. Mar 3, 2010
Wachs, Martin. “Policy Implications of Recent Behavioural Research in Transportation Demand Management.” Journal of Planning Literature. 5, (1991) 333-341
Walker, Jarrett. “Vancouver: Olympic transit payoffs.” Human Transit. Mar 1, 2010, Available: <http://www.humantransit.org/2010/03/vancouver-olympic-transit-payoffs.html>
Warner, Adrian. “Can London 2012 succeed on transport like Vancouver?” BBC, Feb 18, 2010. Available: <http://www.bbc.co.uk/blogs/adrianwarner/2010/02/can_vancouvers_transport_succe.html>
Williams, M.E. and K.L. Petrait. “U-Pass: A model transportation management program that works.” Transportation Research Record. 1404, (1993) 73-81
Winters, Philip L. “Transportation Demand Management.” Transportation Research Board. (2000)
Wood, Graeme. “Crowds gather for World Cup and „car free‟ events on Granville.” Vancouver Sun. Jul 10, 2010