heat roadmap europe: methodologies for spatial analysis in ... · halmstad university (se) 2nd eulf...
TRANSCRIPT

This project has received funding from the European
Union's Horizon 2020 research and innovation
programme under grant agreement No. 695989.
www.heatroadmap
.eu
@HeatRoadmapE
U
Heat Roadmap Europe:
Methodologies for Spatial
Analysis in Demand and
Resource Mapping Urban Persson
Halmstad University (SE)
2nd EULF Workshop, JRC Ispra (IT)

This project has received funding from the European
Union's Horizon 2020 research and innovation
programme under grant agreement No. 695989.
www.heatroadmap
.eu
@HeatRoadmapE
U
Background - General

This project has received funding from the European
Union's Horizon 2020 research and innovation
programme under grant agreement No. 695989.
www.heatroadmap
.eu
@HeatRoadmapE
U
Background - General
Source: Frederiksen S, Werner S. District Heating and Cooling: Studentlitteratur AB, Lund; 2013.

This project has received funding from the European
Union's Horizon 2020 research and innovation
programme under grant agreement No. 695989.
www.heatroadmap
.eu
@HeatRoadmapE
U
Background - General
Source: Persson U, Werner S. Heat distribution and the future competitiveness of district heating. Applied Energy. 2011;88:568-76.
This project has received funding from the European
Union's Horizon 2020 research and innovation
programme under grant agreement No. 695989.
www.heatroadmap
.eu
@HeatRoadmapE
U
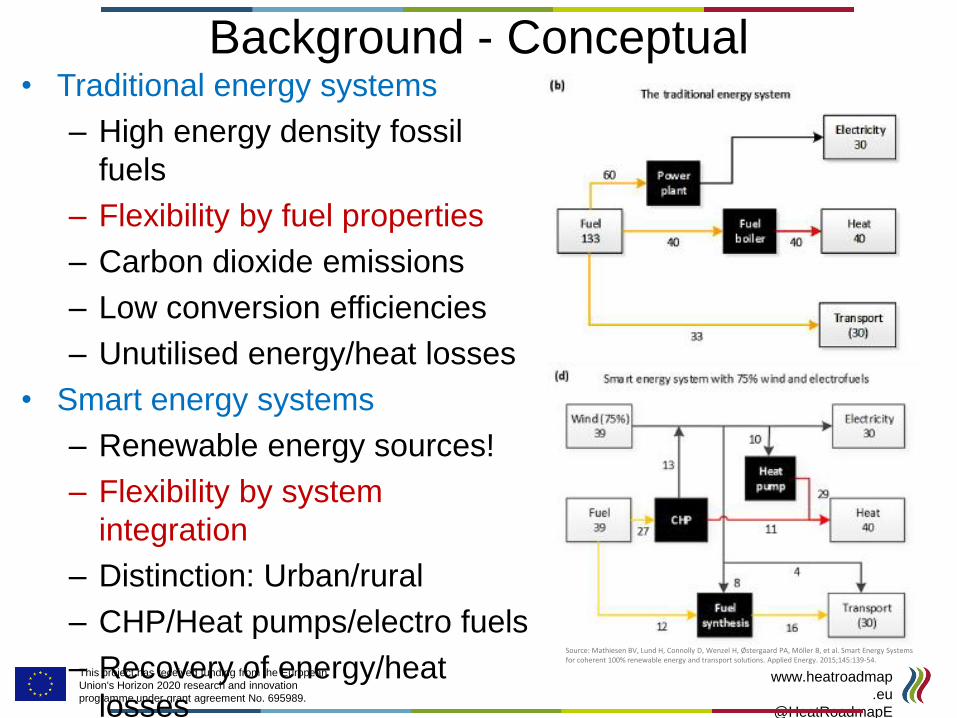
• Traditional energy systems
– High energy density fossil
fuels
– Flexibility by fuel properties
– Carbon dioxide emissions
– Low conversion efficiencies
– Unutilised energy/heat losses
• Smart energy systems
– Renewable energy sources!
– Flexibility by system
integration
– Distinction: Urban/rural
– CHP/Heat pumps/electro fuels
– Recovery of energy/heat
losses
Source: Mathiesen BV, Lund H, Connolly D, Wenzel H, Østergaard PA, Möller B, et al. Smart Energy Systems for coherent 100% renewable energy and transport solutions. Applied Energy. 2015;145:139-54.
Background - Conceptual

This project has received funding from the European
Union's Horizon 2020 research and innovation
programme under grant agreement No. 695989.
www.heatroadmap
.eu
@HeatRoadmapE
U
• Energy storages
– Access upon demand
(flexibility) is a key property of
any energy system!
– Smart energy systems provide
flexibility by increased
transferability between main
infrastructures (power grids,
gas networks, thermal
networks)
– Gas and power infrastructures
are continental!
– Heat infrastructures are local!
– Feasible heat distribution in
cities
– Cities and urban zones have
lead roles to play in energy
Source: Mathiesen BV, Lund H, Connolly D, Wenzel H, Østergaard PA, Möller B, et al. Smart Energy Systems for coherent 100% renewable energy and transport solutions. Applied Energy. 2015;145:139-54.
Background - Conceptual

This project has received funding from the European
Union's Horizon 2020 research and innovation
programme under grant agreement No. 695989.
www.heatroadmap
.eu
@HeatRoadmapE
U
Main methodological approach • Heat Roadmap Europe
• European studies
combining mapping of local
conditions with energy
system modelling to
identify, quantify, and
assess cost- and resource
efficient solutions for the
future! • Opportunities for district heating , excess heat
recovery, and renewable heat sources are present on
local scales!
• How to include local conditions in energy system
modeling?
• Spatial mapping and use of GIS!
This project has received funding from the European
Union's Horizon 2020 research and innovation
programme under grant agreement No. 695989.
www.heatroadmap
.eu
@HeatRoadmapE
U
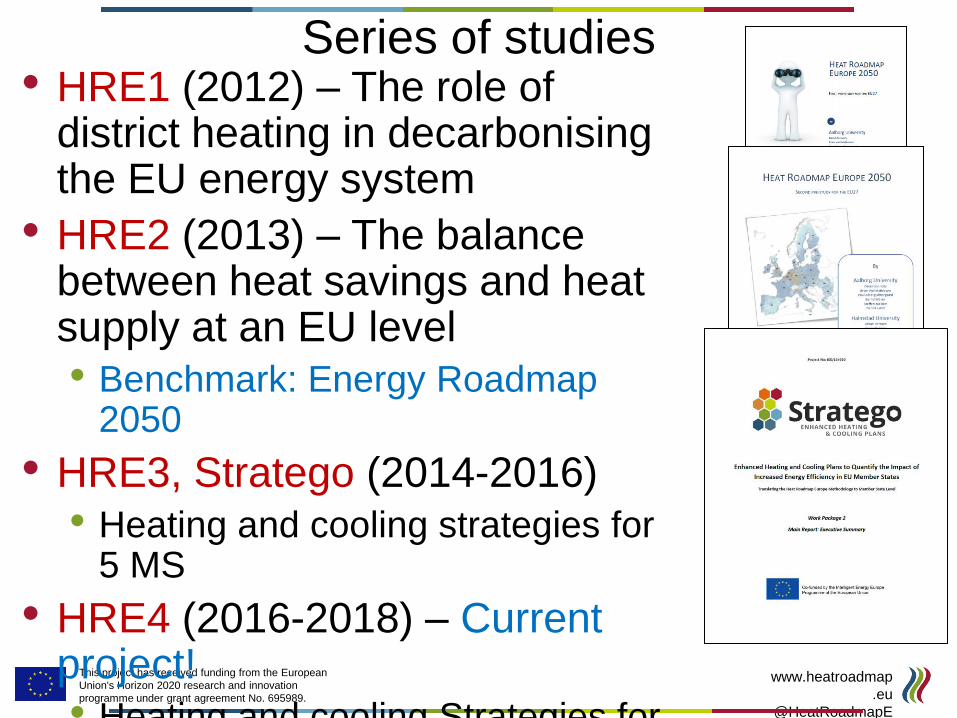
• HRE1 (2012) – The role of district heating in decarbonising the EU energy system
• HRE2 (2013) – The balance between heat savings and heat supply at an EU level
• Benchmark: Energy Roadmap 2050
• HRE3, Stratego (2014-2016)
• Heating and cooling strategies for 5 MS
• HRE4 (2016-2018) – Current project!
• Heating and cooling Strategies for
Series of studies
This project has received funding from the European
Union's Horizon 2020 research and innovation
programme under grant agreement No. 695989.
www.heatroadmap
.eu
@HeatRoadmapE
U
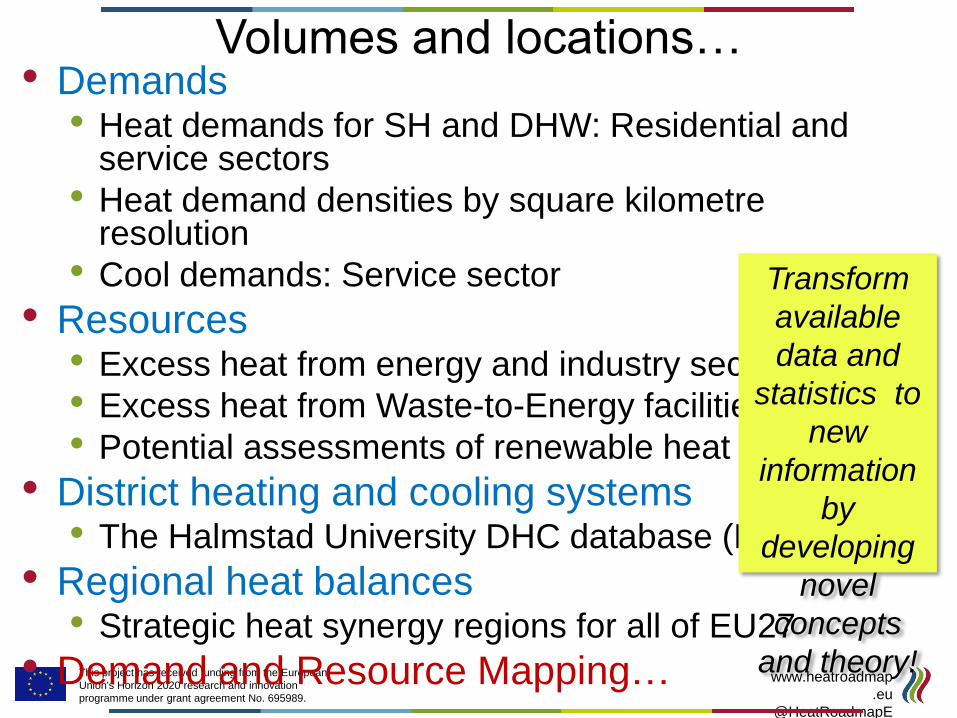
Volumes and locations… • Demands
• Heat demands for SH and DHW: Residential and service sectors
• Heat demand densities by square kilometre resolution
• Cool demands: Service sector
• Resources • Excess heat from energy and industry sectors
• Excess heat from Waste-to-Energy facilities
• Potential assessments of renewable heat sources
• District heating and cooling systems • The Halmstad University DHC database (HUDHC)
• Regional heat balances • Strategic heat synergy regions for all of EU27
• Demand and Resource Mapping…
Transform
available
data and
statistics to
new
information
by
developing
novel
concepts
and theory!

This project has received funding from the European
Union's Horizon 2020 research and innovation
programme under grant agreement No. 695989.
www.heatroadmap
.eu
@HeatRoadmapE
U
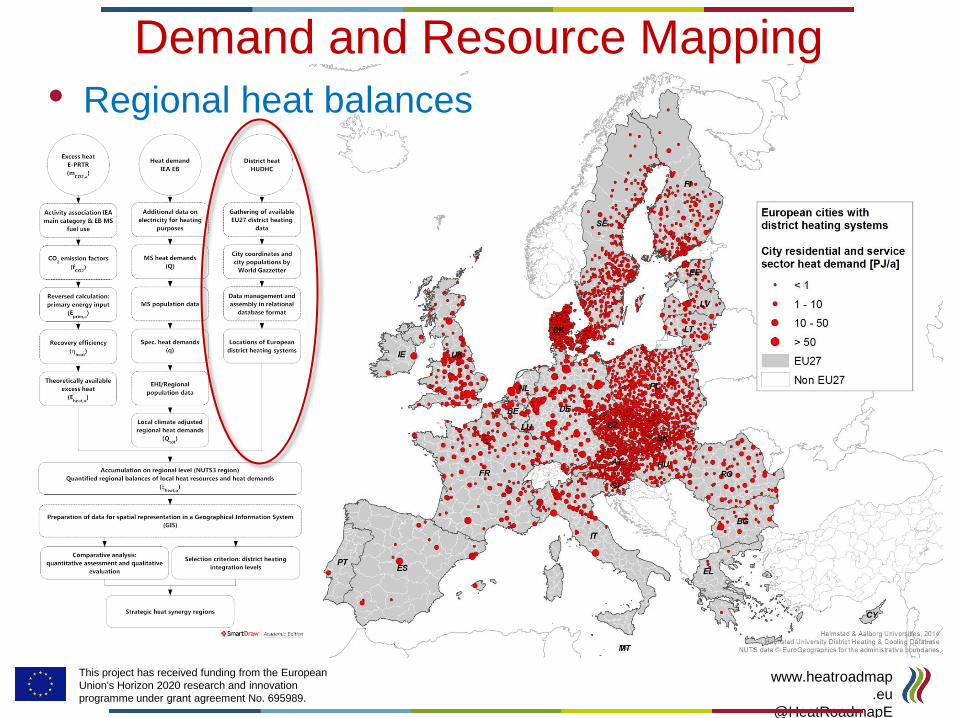
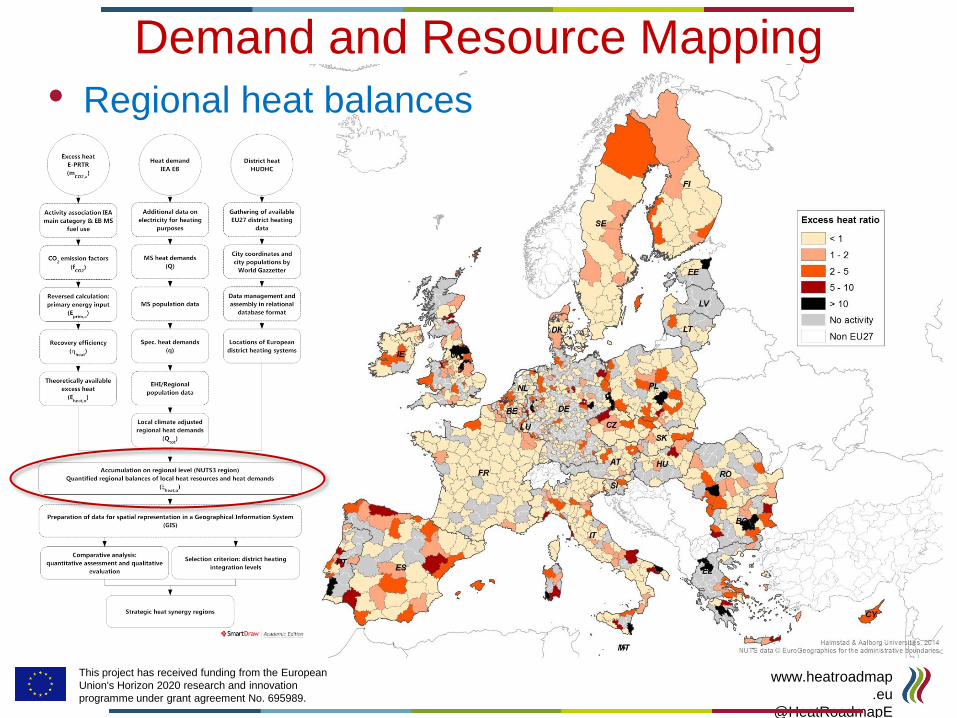
• Regional heat balances
Demand and Resource Mapping

This project has received funding from the European
Union's Horizon 2020 research and innovation
programme under grant agreement No. 695989.
www.heatroadmap
.eu
@HeatRoadmapE
U
• Regional heat balances
Demand and Resource Mapping

This project has received funding from the European
Union's Horizon 2020 research and innovation
programme under grant agreement No. 695989.
www.heatroadmap
.eu
@HeatRoadmapE
U
• Regional heat balances
Demand and Resource Mapping

This project has received funding from the European
Union's Horizon 2020 research and innovation
programme under grant agreement No. 695989.
www.heatroadmap
.eu
@HeatRoadmapE
U
• Regional heat balances
Demand and Resource Mapping

This project has received funding from the European
Union's Horizon 2020 research and innovation
programme under grant agreement No. 695989.
www.heatroadmap
.eu
@HeatRoadmapE
U
• Regional heat balances
Demand and Resource Mapping
This project has received funding from the European
Union's Horizon 2020 research and innovation
programme under grant agreement No. 695989.
www.heatroadmap
.eu
@HeatRoadmapE
U
• Regional heat balances
Demand and Resource Mapping
This project has received funding from the European
Union's Horizon 2020 research and innovation
programme under grant agreement No. 695989.
www.heatroadmap
.eu
@HeatRoadmapE
U
• Regional heat balances
Demand and Resource Mapping

This project has received funding from the European
Union's Horizon 2020 research and innovation
programme under grant agreement No. 695989.
www.heatroadmap
.eu
@HeatRoadmapE
U
• Regional heat balances
Demand and Resource Mapping
This project has received funding from the European
Union's Horizon 2020 research and innovation
programme under grant agreement No. 695989.
www.heatroadmap
.eu
@HeatRoadmapE
U
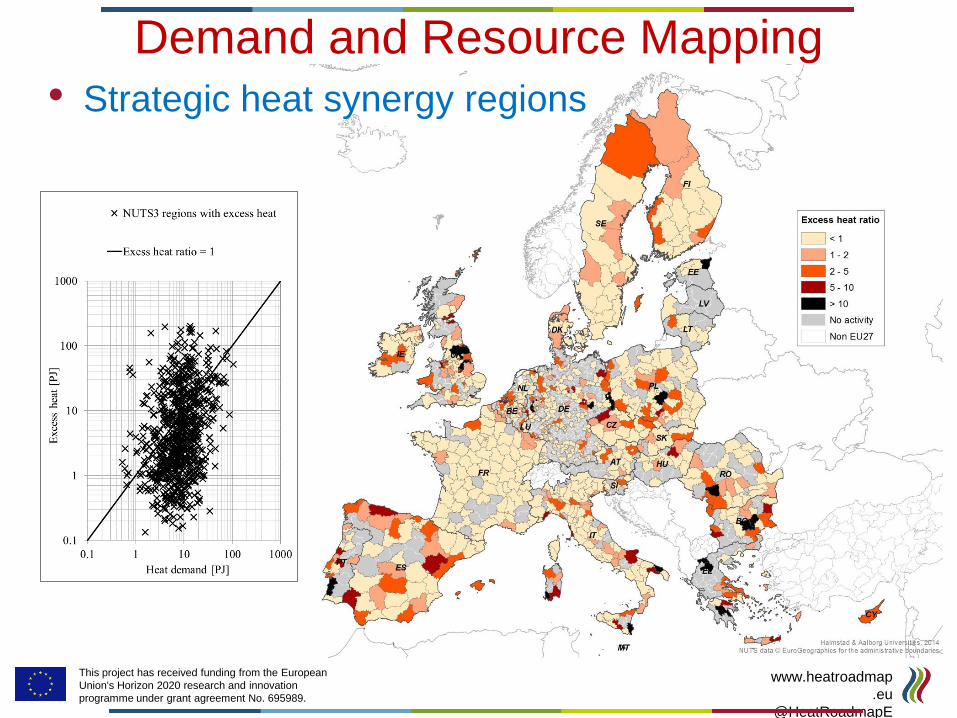
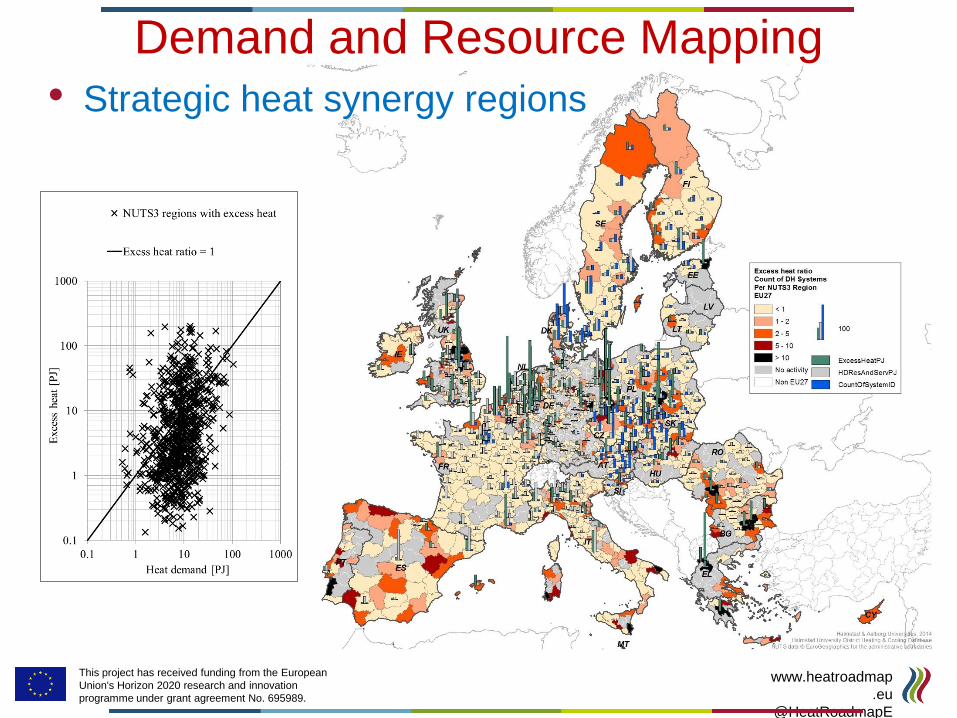
• Strategic heat synergy regions
Demand and Resource Mapping
This project has received funding from the European
Union's Horizon 2020 research and innovation
programme under grant agreement No. 695989.
www.heatroadmap
.eu
@HeatRoadmapE
U
• Strategic heat synergy regions
Demand and Resource Mapping

This project has received funding from the European
Union's Horizon 2020 research and innovation
programme under grant agreement No. 695989.
www.heatroadmap
.eu
@HeatRoadmapE
U
• Strategic heat synergy regions
Demand and Resource Mapping

This project has received funding from the European
Union's Horizon 2020 research and innovation
programme under grant agreement No. 695989.
www.heatroadmap
.eu
@HeatRoadmapE
U
Demand and Resource Mapping
• Strategic heat synergy regions

This project has received funding from the European
Union's Horizon 2020 research and innovation
programme under grant agreement No. 695989.
www.heatroadmap
.eu
@HeatRoadmapE
U
Demand and Resource Mapping
• Strategic heat synergy regions

This project has received funding from the European
Union's Horizon 2020 research and innovation
programme under grant agreement No. 695989.
www.heatroadmap
.eu
@HeatRoadmapE
U
Demand and Resource Mapping
• Strategic heat synergy regions

This project has received funding from the European
Union's Horizon 2020 research and innovation
programme under grant agreement No. 695989.
www.heatroadmap
.eu
@HeatRoadmapE
U
Demand and Resource Mapping
• Strategic heat synergy regions

This project has received funding from the European
Union's Horizon 2020 research and innovation
programme under grant agreement No. 695989.
www.heatroadmap
.eu
@HeatRoadmapE
U
• Key energy modelling outputs
• End use building heat demands in 2050 (HRE2)
• EU-EE: 5.7 EJ (high energy savings scenario)
• HRE-EE: 9.5 EJ
Demand and Resource Mapping

This project has received funding from the European
Union's Horizon 2020 research and innovation
programme under grant agreement No. 695989.
www.heatroadmap
.eu
@HeatRoadmapE
U
• Key energy modelling outputs
• End use building heat demands in 2050 (HRE2)
• EU-EE: 5.7 EJ (high energy savings scenario)
• HRE-EE: 9.5 EJ
• Costs for heating and cooling of buildings
• Avoids most expensive end use efficiency investments
• ~15% lower total heat sector costs
• Total energy system costs
• ~10% lower in 2050 (~100 B€/a)
Demand and Resource Mapping

This project has received funding from the European
Union's Horizon 2020 research and innovation
programme under grant agreement No. 695989.
www.heatroadmap
.eu
@HeatRoadmapE
U
Energy efficiency measures introduced
on both supply and demand sides of
the energy system results in equal
decarbonisation as heat savings alone -
but at lower total energy system costs!
• Key energy modelling outputs
• End use building heat demands in 2050 (HRE2)
• EU-EE: 5.7 EJ (high energy savings scenario)
• HRE-EE: 9.5 EJ
• Costs for heating and cooling of buildings
• Avoids most expensive end use efficiency investments
• ~15% lower total heat sector costs
• Total energy system costs
• ~10% lower in 2050 (~100 B€/a)
Demand and Resource Mapping

This project has received funding from the European
Union's Horizon 2020 research and innovation
programme under grant agreement No. 695989.
www.heatroadmap
.eu
@HeatRoadmapE
U
• European Waste-to-Energy
plants
• HRE WTE list v5!
• Oct, 2013 (Ref. year 2010)
• 432 facilities in operation
• Capacity: ~86 Mt/a
Demand and Resource Mapping
0%
10%
20%
30%
40%
50%
60%
70%
80%
90%
100%
EU
27
Au
str
ia
Be
lgiu
m
Bu
lga
ria
Cyp
rus
Cze
ch
Re
pu
blic
De
nm
ark
Esto
nia
Fin
lan
d
Fra
nce
Ge
rma
ny
Gre
ece
Hu
ng
ary
Ire
lan
d
Ita
ly
La
tvia
Lith
ua
nia
Lu
xe
mb
ou
rg
Ma
lta
Ne
the
rla
nd
s
Po
lan
d
Po
rtu
ga
l
Ro
ma
nia
Slo
va
k re
pu
blic
Slo
ve
nia
Sp
ain
Sw
ed
en
Un
ite
d K
ing
do
m
Incinerated and
landfilled volumes
Recovery efficiency Absorption efficiency

This project has received funding from the European
Union's Horizon 2020 research and innovation
programme under grant agreement No. 695989.
www.heatroadmap
.eu
@HeatRoadmapE
U
• European Waste-to-Energy plants
• Investigating model projections for future EU MSW
generation
• EU ref. model (Sc. 4), 2030: 294 Mt treatment (308 Mt generation,
95.6%)
• Linear interpolation:
• 70% recycling: 206 Mt
• 5% landfilling: ~15 Mt
• 25% Incineration: ~74 Mt
Demand and Resource Mapping

This project has received funding from the European
Union's Horizon 2020 research and innovation
programme under grant agreement No. 695989.
www.heatroadmap
.eu
@HeatRoadmapE
U
• European Waste-to-Energy plants
• Investigating model projections for future EU MSW
generation
• EU ref. model (Sc. 4), 2030: 294 Mt treatment (308 Mt generation,
95.6%)
• Linear interpolation:
• 70% recycling: 206 Mt
• 5% landfilling: ~15 Mt
• 25% Incineration: ~74 Mt
HRE WTE List v5: 86 Mt EU27
capacity!
MSW incineration in 2010: 58-65
Mt
MSW Heat gen. in 2010: ~16 Mt
(159 PJ)
ηheat Heat recovery capacity!
Demand and Resource Mapping
This project has received funding from the European
Union's Horizon 2020 research and innovation
programme under grant agreement No. 695989.
www.heatroadmap
.eu
@HeatRoadmapE
U
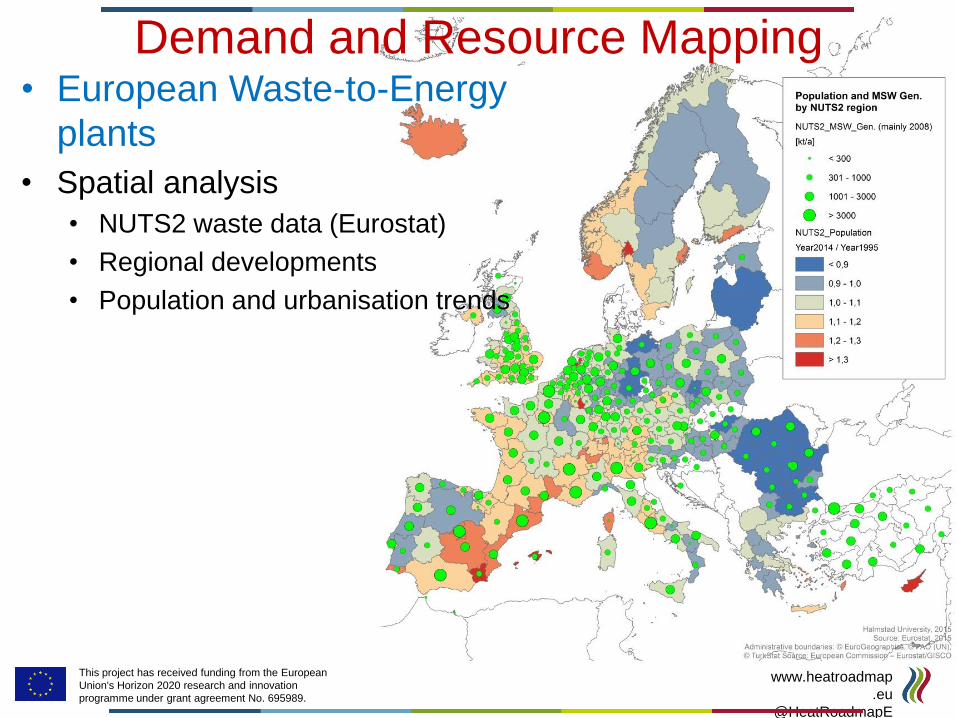
• European Waste-to-Energy
plants
• Spatial analysis
• NUTS2 waste data (Eurostat)
• Regional developments
• Population and urbanisation trends
Demand and Resource Mapping
This project has received funding from the European
Union's Horizon 2020 research and innovation
programme under grant agreement No. 695989.
www.heatroadmap
.eu
@HeatRoadmapE
U
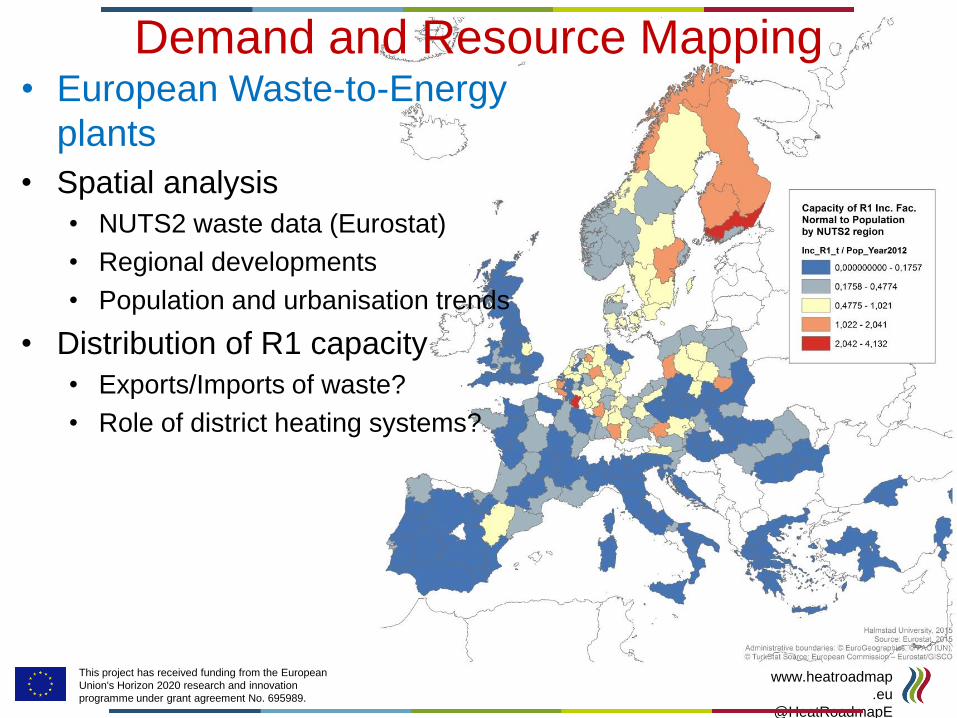
• European Waste-to-Energy
plants
• Spatial analysis
• NUTS2 waste data (Eurostat)
• Regional developments
• Population and urbanisation trends
• Distribution of R1 capacity
• Exports/Imports of waste?
• Role of district heating systems?
Demand and Resource Mapping

This project has received funding from the European
Union's Horizon 2020 research and innovation
programme under grant agreement No. 695989.
www.heatroadmap
.eu
@HeatRoadmapE
U
• European Waste-to-Energy
plants
• Spatial analysis
• NUTS2 waste data (Eurostat)
• Regional developments
• Population and urbanisation trends
• Distribution of R1 capacity
• Exports/Imports of waste?
• Role of district heating systems?
Demand and Resource Mapping
District heating
systems – key
infrastructures for
higher heat
recovery
efficiencies in WTE!

This project has received funding from the European
Union's Horizon 2020 research and innovation
programme under grant agreement No. 695989.
www.heatroadmap
.eu
@HeatRoadmapE
U
• Heat demand density • Main input to assess DHC investment costs
• Cost-supply curves
Source: Stratego, WP2, Background report 6, 2016
Demand and Resource Mapping
This project has received funding from the European
Union's Horizon 2020 research and innovation
programme under grant agreement No. 695989.
www.heatroadmap
.eu
@HeatRoadmapE
U
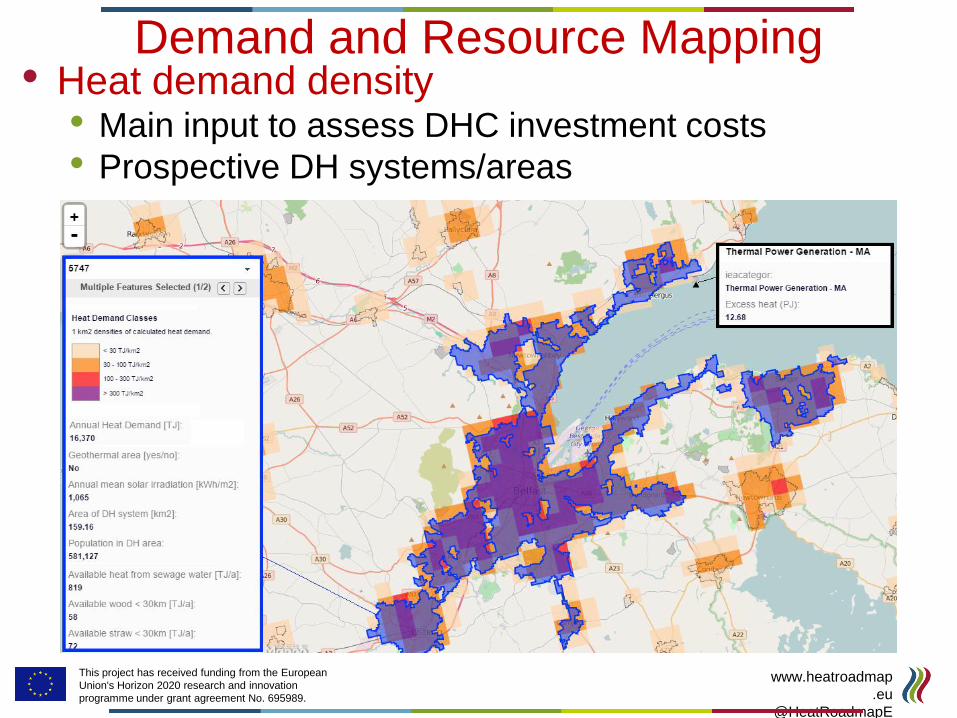
Demand and Resource Mapping • Heat demand density
• Main input to assess DHC investment costs
• Prospective DH systems/areas
This project has received funding from the European
Union's Horizon 2020 research and innovation
programme under grant agreement No. 695989.
www.heatroadmap
.eu
@HeatRoadmapE
U
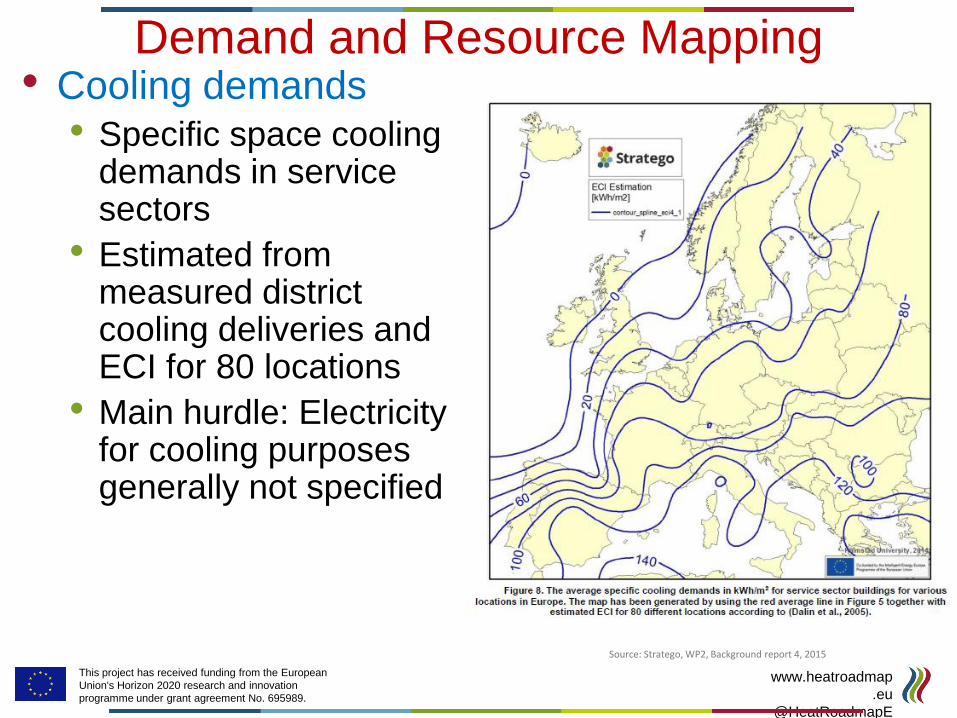
• Cooling demands
• Specific space cooling demands in service sectors
• Estimated from measured district cooling deliveries and ECI for 80 locations
• Main hurdle: Electricity for cooling purposes generally not specified
Demand and Resource Mapping
Source: Stratego, WP2, Background report 4, 2015
This project has received funding from the European
Union's Horizon 2020 research and innovation
programme under grant agreement No. 695989.
www.heatroadmap
.eu
@HeatRoadmapE
U
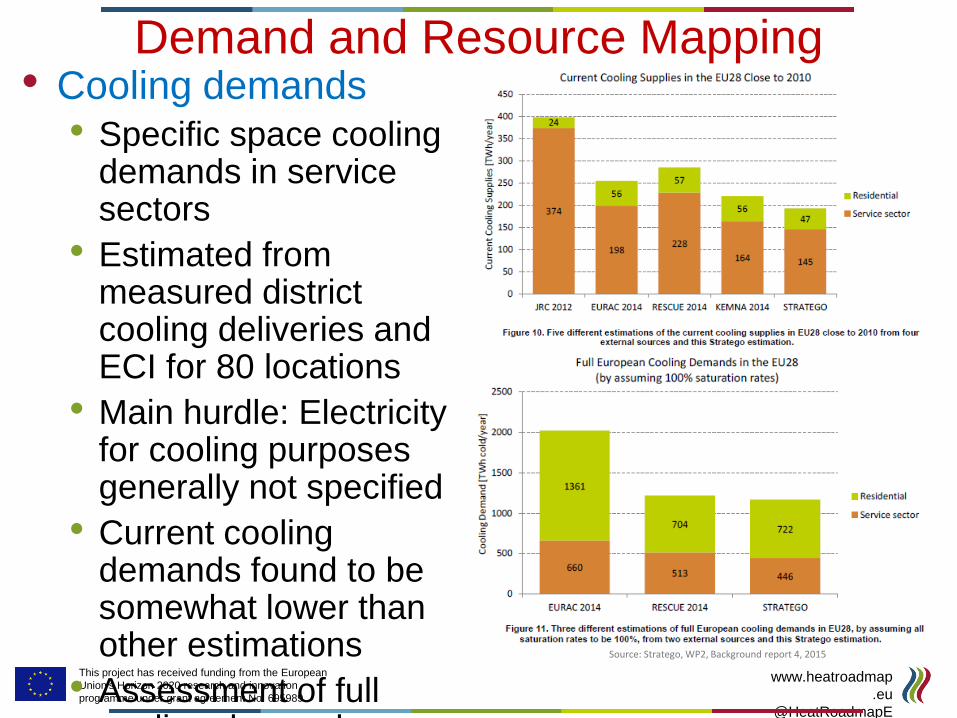
• Cooling demands
• Specific space cooling demands in service sectors
• Estimated from measured district cooling deliveries and ECI for 80 locations
• Main hurdle: Electricity for cooling purposes generally not specified
• Current cooling demands found to be somewhat lower than other estimations
• Assessment of full cooling demand
Source: Stratego, WP2, Background report 4, 2015
Demand and Resource Mapping

This project has received funding from the European
Union's Horizon 2020 research and innovation
programme under grant agreement No. 695989.
www.heatroadmap
.eu
@HeatRoadmapE
U
Demand and Resource Mapping • Cooling demands
• Specific space cooling demands in service sectors
• Cool demand density by km2
This project has received funding from the European
Union's Horizon 2020 research and innovation
programme under grant agreement No. 695989.
www.heatroadmap
.eu
@HeatRoadmapE
U
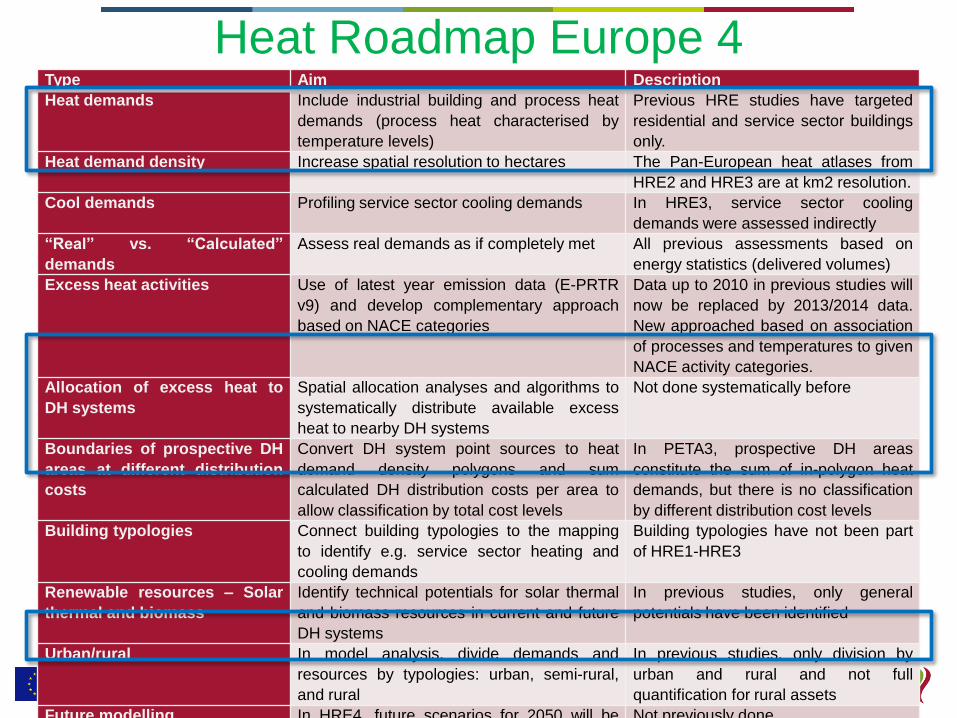
Heat Roadmap Europe 4 Type Aim Description
Heat demands Include industrial building and process heat
demands (process heat characterised by
temperature levels)
Previous HRE studies have targeted
residential and service sector buildings
only.
Heat demand density Increase spatial resolution to hectares The Pan-European heat atlases from
HRE2 and HRE3 are at km2 resolution.
Cool demands Profiling service sector cooling demands In HRE3, service sector cooling
demands were assessed indirectly
“Real” vs. “Calculated”
demands
Assess real demands as if completely met All previous assessments based on
energy statistics (delivered volumes)
Excess heat activities Use of latest year emission data (E-PRTR
v9) and develop complementary approach
based on NACE categories
Data up to 2010 in previous studies will
now be replaced by 2013/2014 data.
New approached based on association
of processes and temperatures to given
NACE activity categories.
Allocation of excess heat to
DH systems
Spatial allocation analyses and algorithms to
systematically distribute available excess
heat to nearby DH systems
Not done systematically before
Boundaries of prospective DH
areas at different distribution
costs
Convert DH system point sources to heat
demand density polygons and sum
calculated DH distribution costs per area to
allow classification by total cost levels
In PETA3, prospective DH areas
constitute the sum of in-polygon heat
demands, but there is no classification
by different distribution cost levels
Building typologies Connect building typologies to the mapping
to identify e.g. service sector heating and
cooling demands
Building typologies have not been part
of HRE1-HRE3
Renewable resources – Solar
thermal and biomass
Identify technical potentials for solar thermal
and biomass resources in current and future
DH systems
In previous studies, only general
potentials have been identified
Urban/rural In model analysis, divide demands and
resources by typologies: urban, semi-rural,
and rural
In previous studies, only division by
urban and rural and not full
quantification for rural assets
Future modelling In HRE4, future scenarios for 2050 will be Not previously done

This project has received funding from the European
Union's Horizon 2020 research and innovation
programme under grant agreement No. 695989.
www.heatroadmap
.eu
@HeatRoadmapE
U
• District heating may realistically contribute to improved
energy system efficiency and reduced carbon dioxide
emissions in future Europe
• Efficient energy system design
• Energy efficiency measures on both the demand and the
supply side is a more cost-effective and resource-efficient
solution
• Urban/Rural – Structural/Individual – Flexibility/Complexity
• Location data and spatial analysis decisive to properly map
and model local resources, technologies, and opportunities
Some comments…
This project has received funding from the European
Union's Horizon 2020 research and innovation
programme under grant agreement No. 695989.
www.heatroadmap
.eu
@HeatRoadmapE
U
Thank you for your attention!