heat-and-mass transfer relationship to determine shear - vbn
TRANSCRIPT
Aalborg Universitet
Heat-And-Mass Transfer Relationship to Determine Shear Stress in Tubular MembraneSystems
Ratkovich, Nicolas Rios; Nopens, Ingmar
Published in:International Journal of Heat and Mass Transfer
DOI (link to publication from Publisher):10.1016/j.ijheatmasstransfer.2012.06.035
Publication date:2012
Document VersionAccepted author manuscript, peer reviewed version
Link to publication from Aalborg University
Citation for published version (APA):Ratkovich, N. R., & Nopens, I. (2012). Heat-And-Mass Transfer Relationship to Determine Shear Stress inTubular Membrane Systems. International Journal of Heat and Mass Transfer, 55(21-22), 6152–6162.https://doi.org/10.1016/j.ijheatmasstransfer.2012.06.035
General rightsCopyright and moral rights for the publications made accessible in the public portal are retained by the authors and/or other copyright ownersand it is a condition of accessing publications that users recognise and abide by the legal requirements associated with these rights.
- Users may download and print one copy of any publication from the public portal for the purpose of private study or research. - You may not further distribute the material or use it for any profit-making activity or commercial gain - You may freely distribute the URL identifying the publication in the public portal -
Take down policyIf you believe that this document breaches copyright please contact us at [email protected] providing details, and we will remove access tothe work immediately and investigate your claim.
Elsevier Editorial System(tm) for International Journal of Heat and Mass Transfer Manuscript Draft Manuscript Number: Title: Heat-And-Mass Transfer Relationship to Determine Shear Stress in Tubular Membrane Systems Article Type: Full Length Article Keywords: Membrane bioreactor; heat-and-mass transfer analogy; shear stress; Sherwood number; empirical model. Corresponding Author: Mr. Nicolas Ratkovich, Ph.D Corresponding Author's Institution: First Author: Nicolas Ratkovich, Ph.D Order of Authors: Nicolas Ratkovich, Ph.D; Pierre Berube, Professor; Ingmar Nopens, Professor Abstract: The main drawback of Membrane Bioreactors (MBRs) is the fouling of the membrane. One way to reduce this fouling is through controlling the hydrodynamics of the two-phase slug flow near the membrane surface. It has been proven in literature that the slug flow pattern has a higher scouring effect to remove particulates due to the high shear rates and high mass transfer between the membrane surface and the bulk region. However, to calculate the mass transfer coefficient in an efficient and accurate way is not straightforward. Indeed, for accurate determination, numerous complex experimental measurements are required. Therefore, this work proposes an alternative method that uses already existing heat transfer relationships for two phase flow and links them through a dimensionless number to the mass transfer coefficient (Sherwood number) to obtain an empirical relationship which can be used to determine the shear stress.
Heat-And-Mass Transfer Relationship to Determine Shear Stress in
Tubular Membrane Systems
N. Ratkovicha,*
, P.R. Berubeb, I. Nopens
a
a BIOMATH - Department of Applied Mathematics, Biometrics and Process Control, Ghent
University, Coupure Links 653, B-9000, Ghent, Belgium.
b Department of Civil Engineering, The University of British Columbia, 6250 Applied Science
Lane, Vancouver, BC, V6T 1Z4, Canada.
* Corresponding author: Tel: +32 9 264 59 35, Fax: +32 9 264 62 20, E-mail:
ABSTRACT
The main drawback of Membrane Bioreactors (MBRs) is the fouling of the membrane. One way
to reduce this fouling is through controlling the hydrodynamics of the two-phase slug flow near
the membrane surface. It has been proven in literature that the slug flow pattern has a higher
scouring effect to remove particulates due to the high shear rates and high mass transfer
between the membrane surface and the bulk region. However, to calculate the mass transfer
coefficient in an efficient and accurate way is not straightforward. Indeed, for accurate
determination, numerous complex experimental measurements are required. Therefore, this
work proposes an alternative method that uses already existing heat transfer relationships for
two phase flow and links them through a dimensionless number to the mass transfer coefficient
(Sherwood number) to obtain an empirical relationship which can be used to determine the
shear stress.
Keywords
Membrane bioreactor, heat-and-mass transfer analogy, shear stress, Sherwood number,
empirical model
1. INTRODUCTION
Bearing in mind the more stringent effluent quality standards imposed by the EU Water
Framework Directive (EU-WFD), wastewater treatment efficiencies need to be improved. These
improvements can be achieved both in terms of biological removal efficiency as well as in the
sludge-water separation step. For the last step two types of technologies exist, the Conventional
Activated Sludge (CAS) systems where the separation is brought about by gravity and the
Membrane Bioreactors (MBR) where the separation is achieved by filtration. The last one has
proven to be a good alternative to achieve high effluent quality compared to the CAS system.
A common problem encountered with MBR systems is the fouling of the membrane resulting in
a need for its frequent cleaning and replacement [1]. Membrane fouling is the main bottleneck of
Manuscript

full-scale application of membrane bioreactors (MBRs) and has restricted its market
breakthrough due to the reduction of productivity and increased maintenance and operational
cost. Literature has shown that, next to the composition of the sludge, the hydrodynamics near
the membrane surface play an important role. In search for better control of fouling, literature
has focused on the determination of the fouling constituents. However, it has been shown that
the hydrodynamics near the membrane surface play an as important role. To reduce the fouling
on the membrane air is often introduced in the sludge flow to create a gas-liquid two-phase
cross-flow, to increase the surface shear stress to remove foulants that are already attached
and to increase the mass transfer between the cake layer and the bulk region [2]. However, the
governing mechanisms are not yet completely understood, which results in a trial and error
approach to optimize hydrodynamic control of fouling
Due to the complexity involved in mass transfer measurements for two-phase flows, some
studies have focused on developing relationships between heat and mass transfer. This is
possible because of the analogies between heat and mass transfer models in dimensionless
form which are based on the transport of momentum, mass, heat and energy, and more
specifically in the Lewis number ( Le ). The latter is a dimensionless number defined as the ratio
of thermal to mass diffusivity [3,4]:
3
13
1
PrLe
Sc
Nu
Sh
(1)
where Sh , Nu , Sc and Pr are the Sherwood, Nusselt, Schmidt and Prandtl numbers
respectively. They are defined in Tab. 1. In Tab. 1, h is the convection coefficient, d is the tube
diameter, ck is the thermal conductivity,
pc is the specific heat, is the viscosity, mk the mass
transfer coefficient, fD is the diffusion coefficient and is the density.
These kinds of analogies are commonly used in cases where it is easier to obtain heat transfer
data rather than mass transfer data. The work presented here focuses on a better
understanding of the mass transfer coefficient near the membrane surface using a heat transfer
analogy for two-phase slug flow for side-stream MBR.
2. MATERIAL AND METHODS
2.1 Description of the setup
A description of the setup that was used to collect shear stress information is given in Fig. 1. A
plexiglas tube with a length of 2 m and an inner diameter of 9.9 mm was used. This tube is
similar in geometry to the airlift tubular membranes of interest. A flow cell, located in the middle
of the plexiglas tube (1 m) has two electrochemical shear probes, which are used to measure
surface shear stresses. A temperature controlled water bath (20°C) is used to keep the
temperature of the electrolyte solution flowing through the system constant. A peristaltic pump
(Masterflex LS, USA) is used to recirculate the electrolytic solution from the gas-liquid separator
tank to the plexiglass tube at controlled liquid flow rates. Two flow meters (Cole-Parmer, N082-
03, USA) are used to monitor the liquid and gas flow rates. Five liquid flow rates (0.1, 0.2, 0.3,
0.4 and 0.5 L min-1) and three gas flow rates (0.1, 0.2 and 0.3 L min
-1) were investigated, resulting
in a total of 15 combinations. These ranges of flow rates correspond to those expected in full-scale
airlift tubular membrane systems [5]. For each experimental condition, surface shear stresses are
measured for a period of 10 seconds, and recorded at a frequency of 1000 Hz [6]. All experimental
conditions are replicated six times.
The electrochemical probes are made from two platinum wires imbedded flush to the inside
surface of the tube wall to avoid them having an effect on the flow field. A detailed description of
the directional electrochemical probes is presented in [7]. Measurements from the directional
electrochemical probes are measured as volt and can be converted to a mass transfer
coefficient (mk ), which can be used to calculate shear stresses using the following equation [7]:
3
2W
561.1τ m
f
eL k
D
d (2)
where ed is the diameter of the probe (m),
fD is the diffusion coefficient of ferricyanide
(7.14·10-10
m2 s
-1 [8]) and
L is the dynamic viscosity of the solution (= 0.001 Pa s). The
detailed procedure to obtain Eq. (2) can be found in [5]. Eq. (2) correlates mass transfer to
shear stress, which is the objective of this work.
2.2 Slug flow
To reduce the fouling on the membrane, air is introduced to create a two-phase flow. In vertical
tubes, there are four specific flow patterns: bubbly, slug, churn and annular flow. Their
respective structure depends on the superficial velocities, surface tension and densities of the
fluids. It was found that the setup under study is operated in the slug flow region (Taylor
bubbles). In the slug flow that typically builds up, three different zones can be distinguished (Fig.
2): 1) the falling film zone, i.e. the zone where the bubble is passing, 2) the wake zone, i.e. the
zone just behind the bubble where mixing of liquid and gas takes place and 3) the liquid zone
[2].
2.3 Mass Transfer Coefficient
Single-phase flow: During the filtration process, the separation between the sludge and the
solute occurs at the membrane, giving an increase in the solute concentration near the
membrane surface. This is called concentration polarization [9] which is function of the mass
transfer coefficient. The latter can be obtained by electrochemical methods as presented in
section 2.1 or by using dimensionless relationships function of the Sh and depending on the
flow regime (Tab. 2). However, it is important to note that the relationships are for smooth tubes
only and they are not defined in the transition regime (2000<Re<4000). A weighting factor
approach can be used here to determine the Sh number in the transition regime [10].
Two-phase flow: In a slug flow, each zone has its own mass transfer coefficient. Fig. 3 illustrates
the mass transfer coefficients for each zone. It is possible to observe that if the flow would be
single phase the value of the mass transfer coefficient in the liquid slug would be lower
compared to the falling film and wake zone due to higher liquid velocities. Therefore, the mass
transfer coefficient increases due to the two-phase cross flow. [2] and [11] proposed equations
for each zone based on hydrodynamics models and mass balances of slug flow. However,
these models require extensive experimental measurements and mathematical derivation.
2.4 Heat Transfer Coefficient
Single-phase flow: The heat transfer for single phase flow in a tube depends on the Nu number
and the flow regime (Tab 2). The Nu number is the ratio of convective to conductive heat
transfer normal to the boundary and the Pr number is the ratio of the momentum diffusivity and
the thermal diffusivity. They are the thermal counterpart for the Sh and Sc the number.
Comparing the heat and mass transfer analogies for single phase flow, it is possible to observe
that the structure is the same but coefficients in the equations are slightly different (Tab. 2).
Two-phase flow: The Nu number for two phase flow (tpNu ) is defined by
tpctptp kdhNu , [12].
Where tph is the heat transfer coefficient for two-phase flow and
tpck , is the thermal conductivity
coefficient for two-phase flow, which is defined by GcLctpc kxkxk ,,, 1 . Here, Lck , and
Gck , are
the thermal conductivity of the liquid and gas respectively and x is the vapour quality. The heat
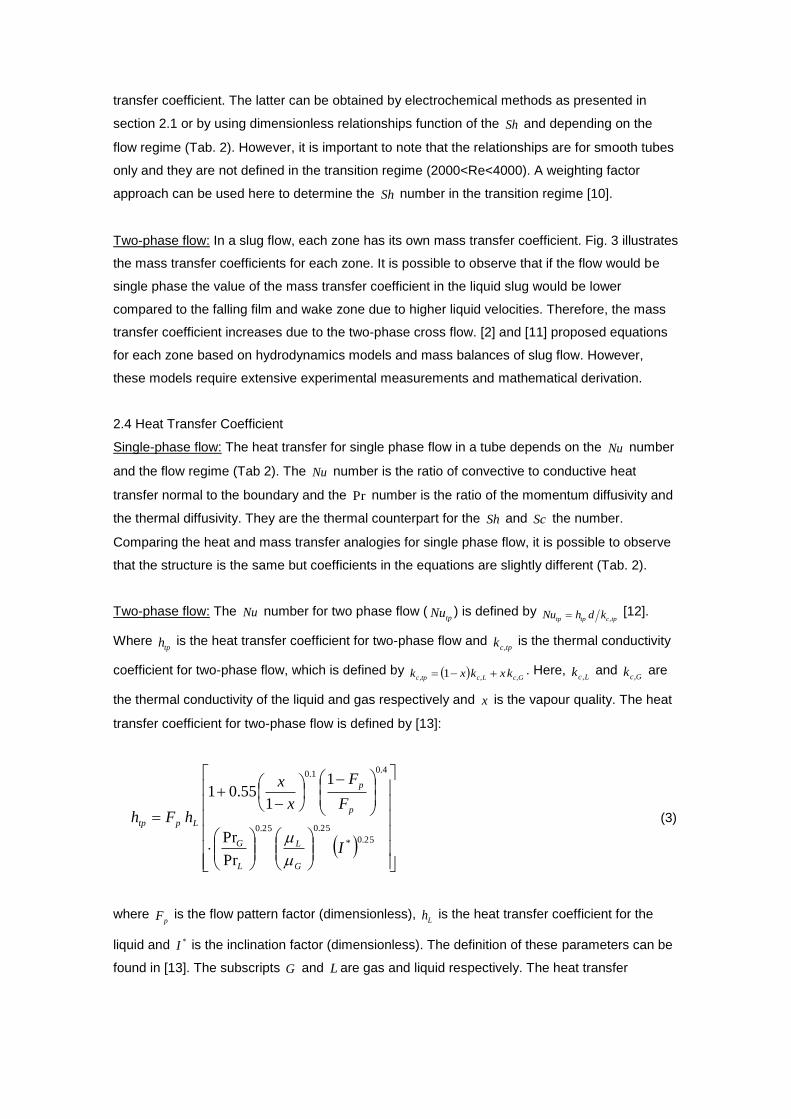
transfer coefficient for two-phase flow is defined by [13]:
25.0*
25.025.0
4.01.0
Pr
Pr
1
155.01
I
F
F
x
x
hFh
G
L
L
G
p
p
Lptp
(3)
where pF is the flow pattern factor (dimensionless),
Lh is the heat transfer coefficient for the
liquid and *I is the inclination factor (dimensionless). The definition of these parameters can be
found in [13]. The subscripts G and L are gas and liquid respectively. The heat transfer
coefficient for the liquid (Lh ) in single phase flow are given in Tab 2 as function of the Nu
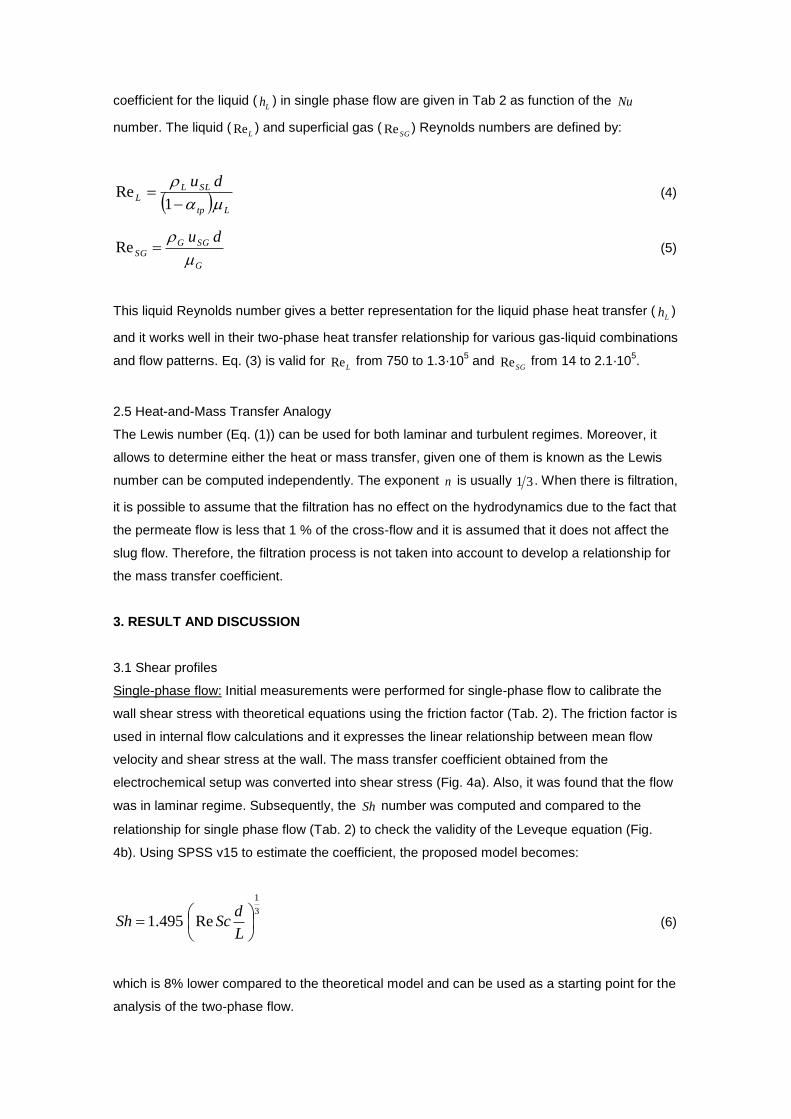
number. The liquid (LRe ) and superficial gas (
SGRe ) Reynolds numbers are defined by:
Ltp
SLLL
du
1Re (4)
G
SGGSG
du
Re (5)
This liquid Reynolds number gives a better representation for the liquid phase heat transfer (Lh )
and it works well in their two-phase heat transfer relationship for various gas-liquid combinations
and flow patterns. Eq. (3) is valid for LRe from 750 to 1.3·10
5 and
SGRe from 14 to 2.1·105.
2.5 Heat-and-Mass Transfer Analogy
The Lewis number (Eq. (1)) can be used for both laminar and turbulent regimes. Moreover, it
allows to determine either the heat or mass transfer, given one of them is known as the Lewis
number can be computed independently. The exponent n is usually 31 . When there is filtration,
it is possible to assume that the filtration has no effect on the hydrodynamics due to the fact that
the permeate flow is less that 1 % of the cross-flow and it is assumed that it does not affect the
slug flow. Therefore, the filtration process is not taken into account to develop a relationship for
the mass transfer coefficient.
3. RESULT AND DISCUSSION
3.1 Shear profiles
Single-phase flow: Initial measurements were performed for single-phase flow to calibrate the
wall shear stress with theoretical equations using the friction factor (Tab. 2). The friction factor is
used in internal flow calculations and it expresses the linear relationship between mean flow
velocity and shear stress at the wall. The mass transfer coefficient obtained from the
electrochemical setup was converted into shear stress (Fig. 4a). Also, it was found that the flow
was in laminar regime. Subsequently, the Sh number was computed and compared to the
relationship for single phase flow (Tab. 2) to check the validity of the Leveque equation (Fig.
4b). Using SPSS v15 to estimate the coefficient, the proposed model becomes:
3
1
Re1.495
L
dScSh (6)
which is 8% lower compared to the theoretical model and can be used as a starting point for the
analysis of the two-phase flow.
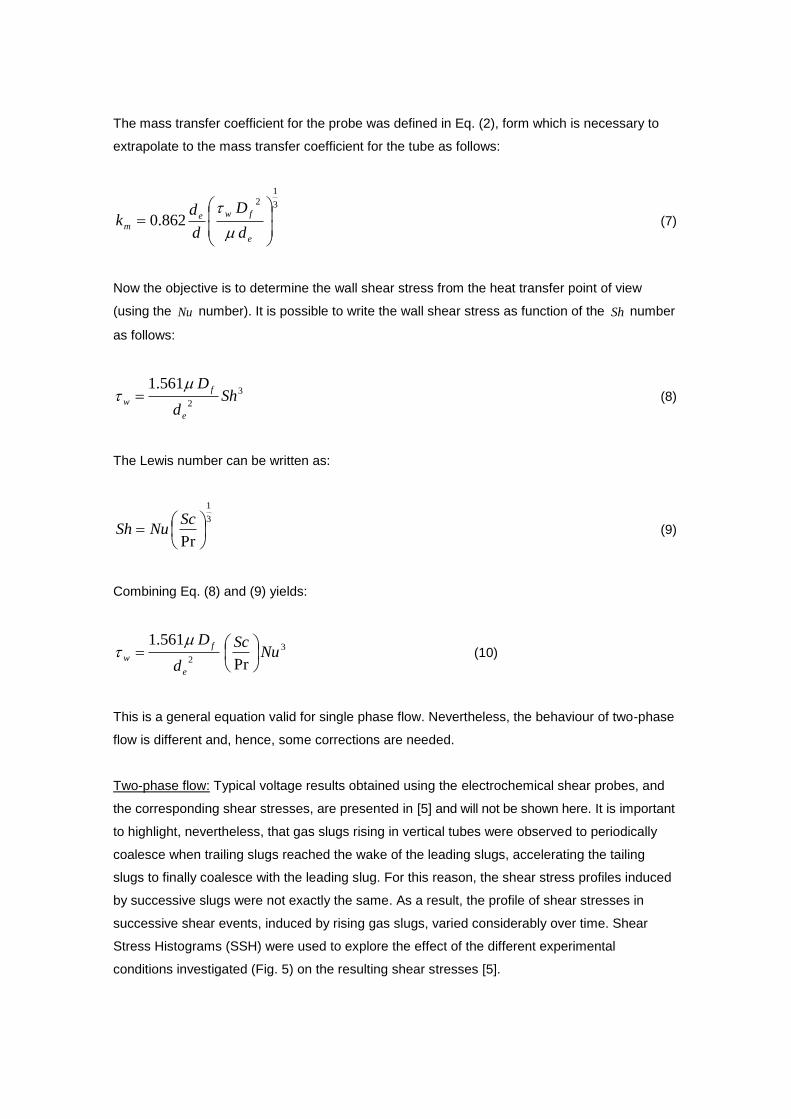
The mass transfer coefficient for the probe was defined in Eq. (2), form which is necessary to
extrapolate to the mass transfer coefficient for the tube as follows:
3
12
862.0
e
fwem
d
D
d
dk
(7)
Now the objective is to determine the wall shear stress from the heat transfer point of view
(using the Nu number). It is possible to write the wall shear stress as function of the Sh number
as follows:
3
2
561.1Sh
d
D
e
f
w
(8)
The Lewis number can be written as:
3
1
Pr
ScNuSh (9)
Combining Eq. (8) and (9) yields:
3
2 Pr
561.1Nu
Sc
d
D
e
f
w
(10)
This is a general equation valid for single phase flow. Nevertheless, the behaviour of two-phase
flow is different and, hence, some corrections are needed.
Two-phase flow: Typical voltage results obtained using the electrochemical shear probes, and
the corresponding shear stresses, are presented in [5] and will not be shown here. It is important
to highlight, nevertheless, that gas slugs rising in vertical tubes were observed to periodically
coalesce when trailing slugs reached the wake of the leading slugs, accelerating the tailing
slugs to finally coalesce with the leading slug. For this reason, the shear stress profiles induced
by successive slugs were not exactly the same. As a result, the profile of shear stresses in
successive shear events, induced by rising gas slugs, varied considerably over time. Shear
Stress Histograms (SSH) were used to explore the effect of the different experimental
conditions investigated (Fig. 5) on the resulting shear stresses [5].
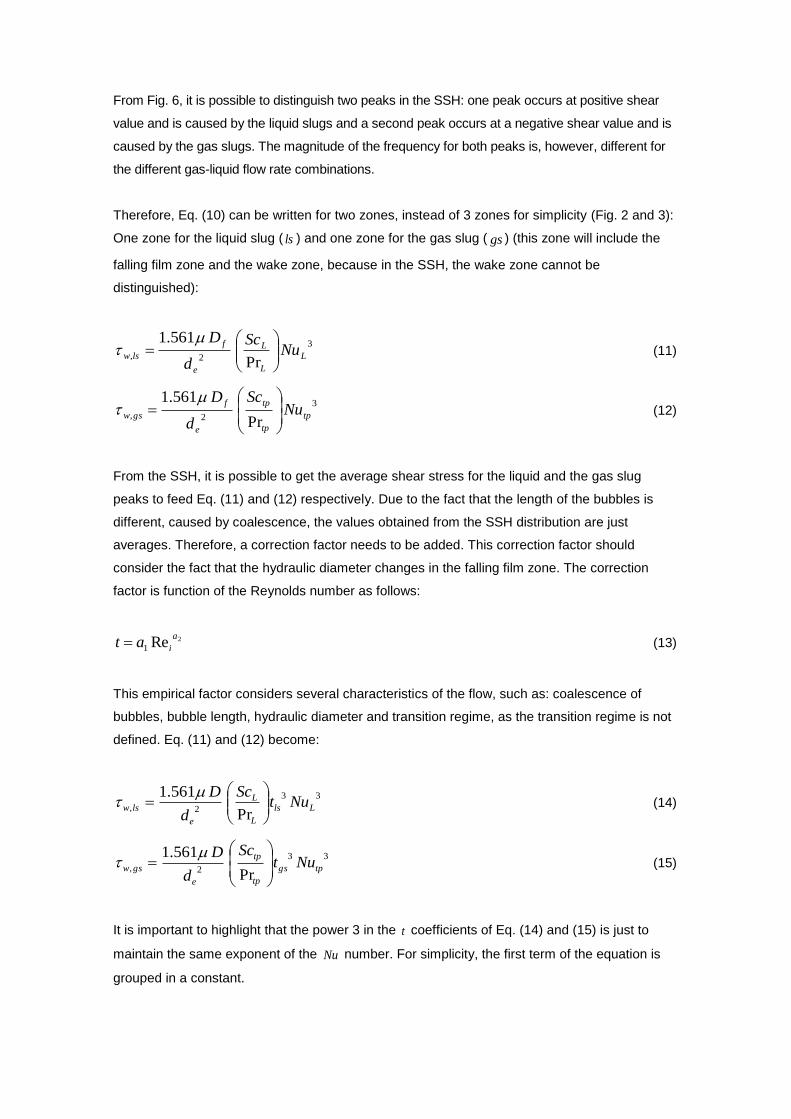
From Fig. 6, it is possible to distinguish two peaks in the SSH: one peak occurs at positive shear
value and is caused by the liquid slugs and a second peak occurs at a negative shear value and is
caused by the gas slugs. The magnitude of the frequency for both peaks is, however, different for
the different gas-liquid flow rate combinations.
Therefore, Eq. (10) can be written for two zones, instead of 3 zones for simplicity (Fig. 2 and 3):
One zone for the liquid slug ( ls ) and one zone for the gas slug ( gs ) (this zone will include the
falling film zone and the wake zone, because in the SSH, the wake zone cannot be
distinguished):
3
2,Pr
561.1L
L
L
e
f
lsw NuSc
d
D
(11)
3
2,Pr
561.1tp
tp
tp
e
f
gsw NuSc
d
D
(12)
From the SSH, it is possible to get the average shear stress for the liquid and the gas slug
peaks to feed Eq. (11) and (12) respectively. Due to the fact that the length of the bubbles is
different, caused by coalescence, the values obtained from the SSH distribution are just
averages. Therefore, a correction factor needs to be added. This correction factor should
consider the fact that the hydraulic diameter changes in the falling film zone. The correction
factor is function of the Reynolds number as follows:
2Re1
a
iat (13)
This empirical factor considers several characteristics of the flow, such as: coalescence of
bubbles, bubble length, hydraulic diameter and transition regime, as the transition regime is not
defined. Eq. (11) and (12) become:
33
2,Pr
561.1Lls
L
L
e
lsw NutSc
d
D
(14)
33
2,Pr
561.1tpgs
tp
tp
e
gsw NutSc
d
D
(15)
It is important to highlight that the power 3 in the t coefficients of Eq. (14) and (15) is just to
maintain the same exponent of the Nu number. For simplicity, the first term of the equation is
grouped in a constant.
tp
tp
e
f
L
L
e
f Sc
d
DSc
d
Da
Pr
561.1
Pr
561.1223
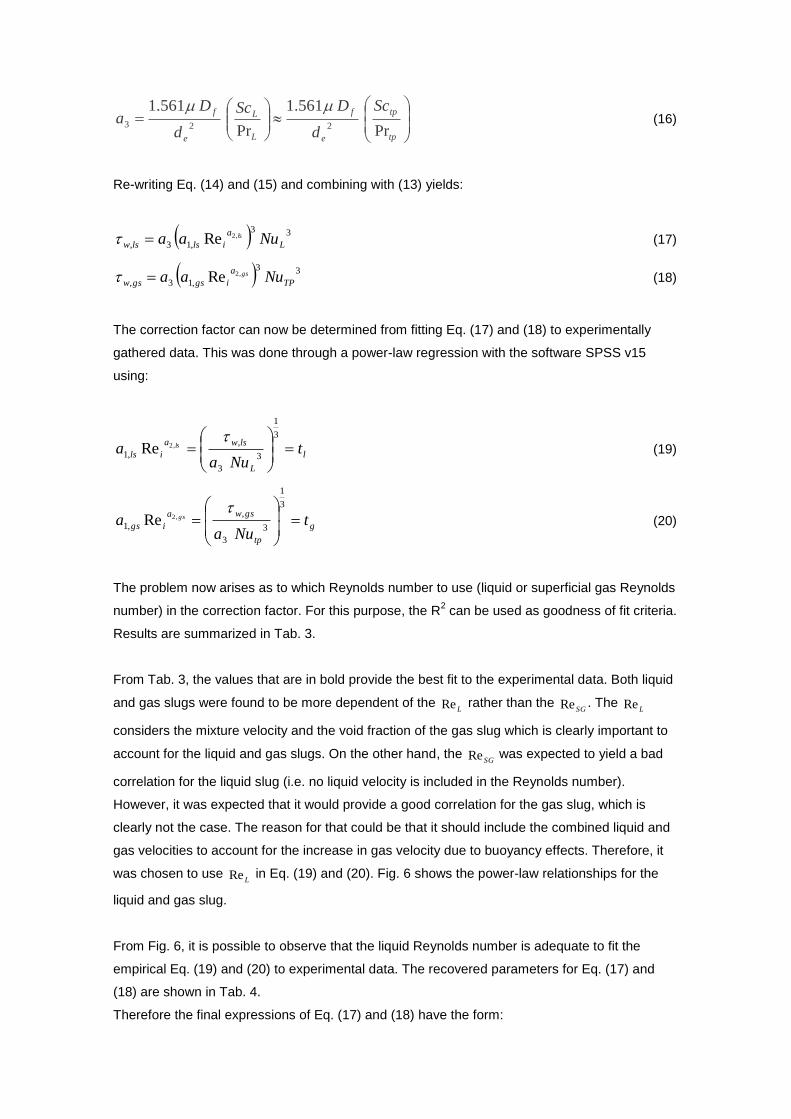
(16)
Re-writing Eq. (14) and (15) and combining with (13) yields:
33
,13,,2Re L
a
ilslsw Nuaa ls (17)
33
,13,,2Re TP
a
igsgsw Nuaa gs (18)
The correction factor can now be determined from fitting Eq. (17) and (18) to experimentally
gathered data. This was done through a power-law regression with the software SPSS v15
using:
l
L
lswa
ils tNua
a ls
3
1
3
3
,
,1,2Re
(19)
g
tp
gswa
igs tNua
a gs
3
1
3
3
,
,1,2Re
(20)
The problem now arises as to which Reynolds number to use (liquid or superficial gas Reynolds
number) in the correction factor. For this purpose, the R2 can be used as goodness of fit criteria.
Results are summarized in Tab. 3.
From Tab. 3, the values that are in bold provide the best fit to the experimental data. Both liquid
and gas slugs were found to be more dependent of the LRe rather than the
SGRe . The LRe
considers the mixture velocity and the void fraction of the gas slug which is clearly important to
account for the liquid and gas slugs. On the other hand, the SGRe was expected to yield a bad
correlation for the liquid slug (i.e. no liquid velocity is included in the Reynolds number).
However, it was expected that it would provide a good correlation for the gas slug, which is
clearly not the case. The reason for that could be that it should include the combined liquid and
gas velocities to account for the increase in gas velocity due to buoyancy effects. Therefore, it
was chosen to use LRe in Eq. (19) and (20). Fig. 6 shows the power-law relationships for the
liquid and gas slug.
From Fig. 6, it is possible to observe that the liquid Reynolds number is adequate to fit the
empirical Eq. (19) and (20) to experimental data. The recovered parameters for Eq. (17) and
(18) are shown in Tab. 4.
Therefore the final expressions of Eq. (17) and (18) have the form:
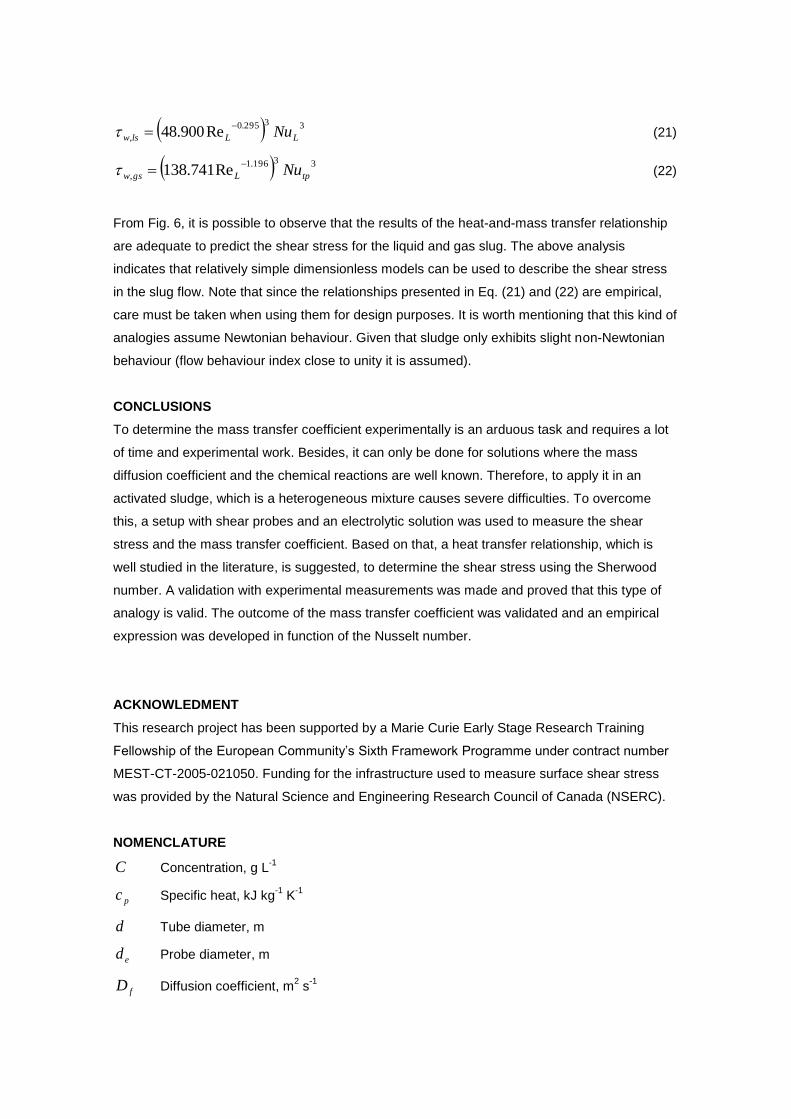
33295.0
, Re900.48 LLlsw Nu
(21)
33196.1
, Re741.138 tpLgsw Nu
(22)
From Fig. 6, it is possible to observe that the results of the heat-and-mass transfer relationship
are adequate to predict the shear stress for the liquid and gas slug. The above analysis
indicates that relatively simple dimensionless models can be used to describe the shear stress
in the slug flow. Note that since the relationships presented in Eq. (21) and (22) are empirical,
care must be taken when using them for design purposes. It is worth mentioning that this kind of
analogies assume Newtonian behaviour. Given that sludge only exhibits slight non-Newtonian
behaviour (flow behaviour index close to unity it is assumed).
CONCLUSIONS
To determine the mass transfer coefficient experimentally is an arduous task and requires a lot
of time and experimental work. Besides, it can only be done for solutions where the mass
diffusion coefficient and the chemical reactions are well known. Therefore, to apply it in an
activated sludge, which is a heterogeneous mixture causes severe difficulties. To overcome
this, a setup with shear probes and an electrolytic solution was used to measure the shear
stress and the mass transfer coefficient. Based on that, a heat transfer relationship, which is
well studied in the literature, is suggested, to determine the shear stress using the Sherwood
number. A validation with experimental measurements was made and proved that this type of
analogy is valid. The outcome of the mass transfer coefficient was validated and an empirical
expression was developed in function of the Nusselt number.
ACKNOWLEDMENT
This research project has been supported by a Marie Curie Early Stage Research Training
Fellowship of the European Community’s Sixth Framework Programme under contract number
MEST-CT-2005-021050. Funding for the infrastructure used to measure surface shear stress
was provided by the Natural Science and Engineering Research Council of Canada (NSERC).
NOMENCLATURE
C Concentration, g L-1
pc Specific heat, kJ kg-1
K-1
d Tube diameter, m
ed Probe diameter, m
fD Diffusion coefficient, m2 s
-1
pF Flow pattern factor, dimensionless
h heat transfer coefficient, W m-2
K-1
*I Inclination factor, dimensionless
J Flux, m2 s
-1
ck Thermal conductivity, W m-1
K-1
mk Mass transfer coefficient, m s-1
Nu Nusselt number, dimensionless
Pr Prandtl number, dimensionless
Re Reynolds number, dimensionless
Sc Schmidt number, dimensionless
Sh Sherwood number, dimensionless
t Correction factor, dimensionless
x Vapour quality, dimensionless
Greek symbols
Void fraction, dimensionless
Density, kg m-3
Viscosity, Pa s
Wall shear stress, Pa
Subscript
B Bulk
G Gas
gs Gas slug
L Liquid
ls Liquid slug
M Membrane
SG Superficial gas
tp Two-phase
W Wall
REFERENCES
[1] S. Judd, The MBR book, Elsevier 2006.
[2] R. Ghosh, Z.F. Cui, Mass transfer in gas-sparged ultrafiltration: Upward slug flow in tubular membranes, J.Membr.Sci. 162 (1999) 91-102.
[3] S.A. Shirazi, E. Al-Adsani, J.R. Shadley, E.F. Rybicki, A mechanistic model for predicting heat and mass transfer in vertical two-phase flow, Proceedings of the ASME Heat Transfer/Fluids Engineering Summer Conference 2004, HT/FED 2004, Jul 11-15 2004. 3 (2004) 685-693.
[4] E. Adsani, S.A. Shirazi, J.R. Shadley, E.F. Rybicki, Validation of mass transfer coefficient models used in predicting CO 2 corrosion in vertical two-phase flow in the oil and gas production, Corrosion 2006, September 10, 2006 - September 14, 2006. (2006) 65731-657312.
[5] N. Ratkovich, C.C.V. Chan, P.R. Berube, I. Nopens, Experimental study and CFD modelling of a two-phase slug flow for an airlift tubular membrane, Chemical Engineering Science. 64 (2009) 3576-3584.
[6] C.C.V. Chan, P.R. Berube, E.R. Hall, Shear profiles inside gas sparged submerged hollow fiber membrane modules, J.Membr.Sci. 297 (2007) 104-120.
[7] L.P. Reiss, T.J. Hanratty, An Experimental Study of the Unsteady Nature of the Viscous Sublayer, AICHE J. 9 (1963) 154-160.
[8] J.M. Rosant, Liquid-wall shear stress in stratified liquid/gas flow, J.Appl.Electrochem. 24 (1994) 612-618.
[9] M. Mulder, Basic Principles of Membrane Technology, Springer 1998.
[10] N.S. Cheng, Formulas for friction factor in transitional regimes, J.Hydraul.Eng. 134 (2008) 1357-1362.
[11] D. Zheng, D. Che, Experimental study on hydrodynamic characteristics of upward gas-liquid slug flow, Int.J.Multiphase Flow. 32 (2006) 1191-1218.
[12] D. Kim, A.J. Ghajar, R.L. Dougherty, Robust heat transfer correlation for turbulent gas-liquid flow in vertical pipes, J.Thermophys.Heat Transfer. 14 (2000) 574-578.
[13] A.J. Ghajar, C.C. Tang, Importance of Non-Boiling Two-Phase Flow Heat Transfer in Pipes for Industrial Applications, Heat Transfer Eng. 31 (2010) 711-732.
[14] T. Taha, Z.F. Cui, CFD modelling of slug flow in vertical tubes, Chemical Engineering Science. 61 (2006) 676-687.
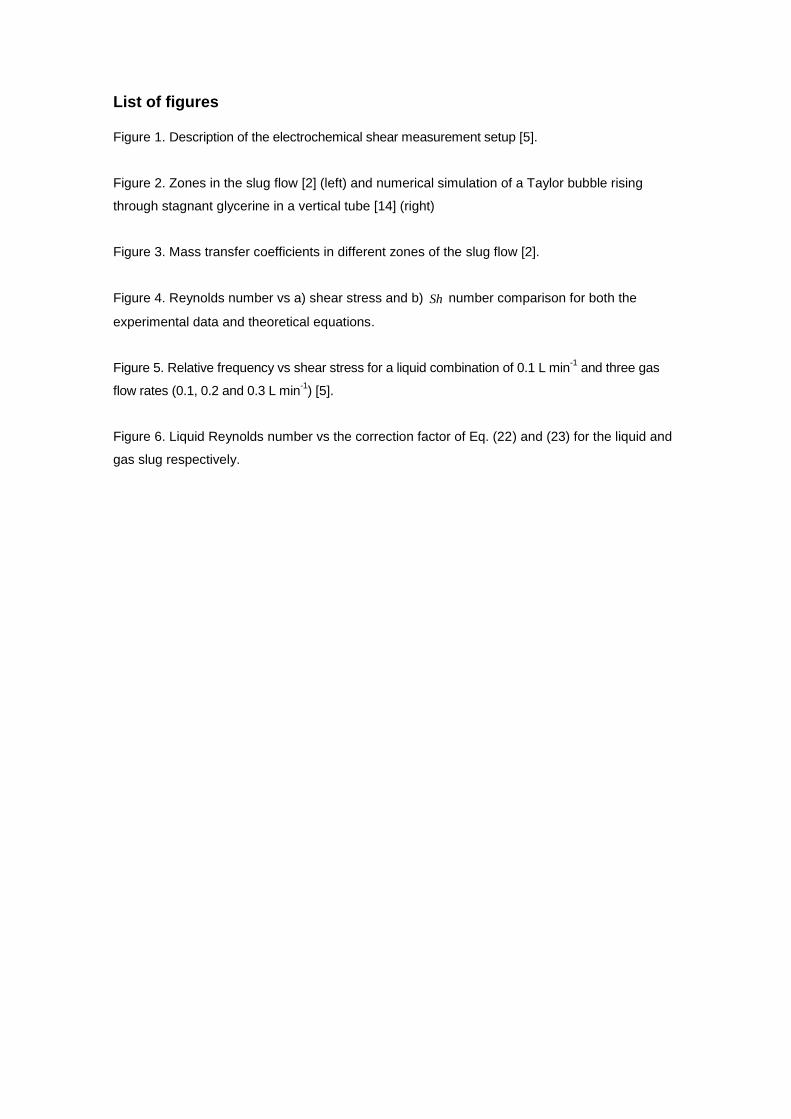
List of figures Figure 1. Description of the electrochemical shear measurement setup [5].
Figure 2. Zones in the slug flow [2] (left) and numerical simulation of a Taylor bubble rising
through stagnant glycerine in a vertical tube [14] (right)
Figure 3. Mass transfer coefficients in different zones of the slug flow [2].
Figure 4. Reynolds number vs a) shear stress and b) Sh number comparison for both the
experimental data and theoretical equations.
Figure 5. Relative frequency vs shear stress for a liquid combination of 0.1 L min-1 and three gas
flow rates (0.1, 0.2 and 0.3 L min-1) [5].
Figure 6. Liquid Reynolds number vs the correction factor of Eq. (22) and (23) for the liquid and
gas slug respectively.

Heat-And-Mass Transfer Relationship to Determine Shear Stress in Tubular
Membrane Systems
Corresponding Author: Nicolas Ratkovich Address: Department of Civil Engineering, Aalborg University,
Sohngaardsholmsvej 57, DK-9000 Aalborg, Denmark Telephone: +45 9940 8572 Fax: +45 9814 2555 Email address: [email protected]
Dear editor The breakthrough of membrane bioreactors (MBR) in wastewater treatment is still hampered by poor understanding of the fouling phenomena and of the air scouring used to cure it. Mathematical models combined with experimental data have proven to be a good combination to build up process knowledge and eventually optimize the system in terms of design and operation. The objective of this study was to calculate the mass transfer coefficient in an efficient and accurate way. Indeed, for accurate determination, numerous complex experimental measurements are required. Therefore, this work proposes an alternative method that uses already existing heat transfer relationships for two phase flow and links them through a dimensionless number to the mass transfer coefficient (Sherwood number) to obtain an empirical relationship which can be used to determine the shear stress. Sincerely, Nicolas Ratkovich
Cover Letter
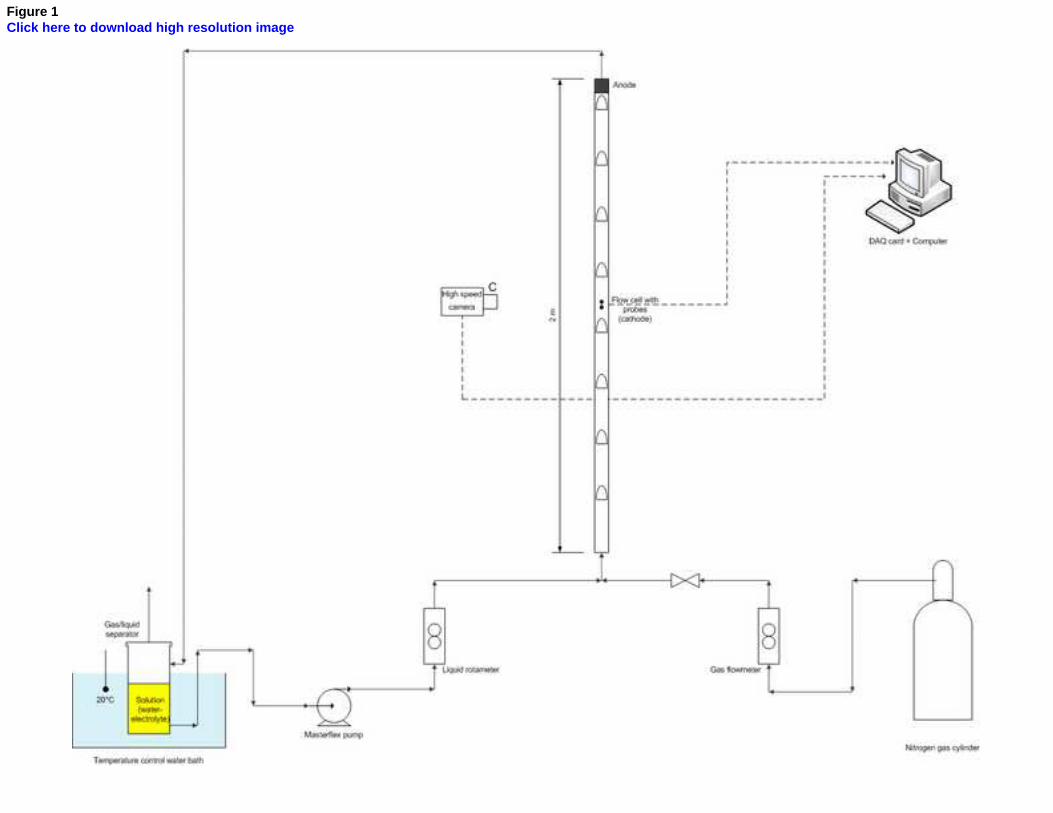
Figure 1Click here to download high resolution image

Figure 2Click here to download high resolution image
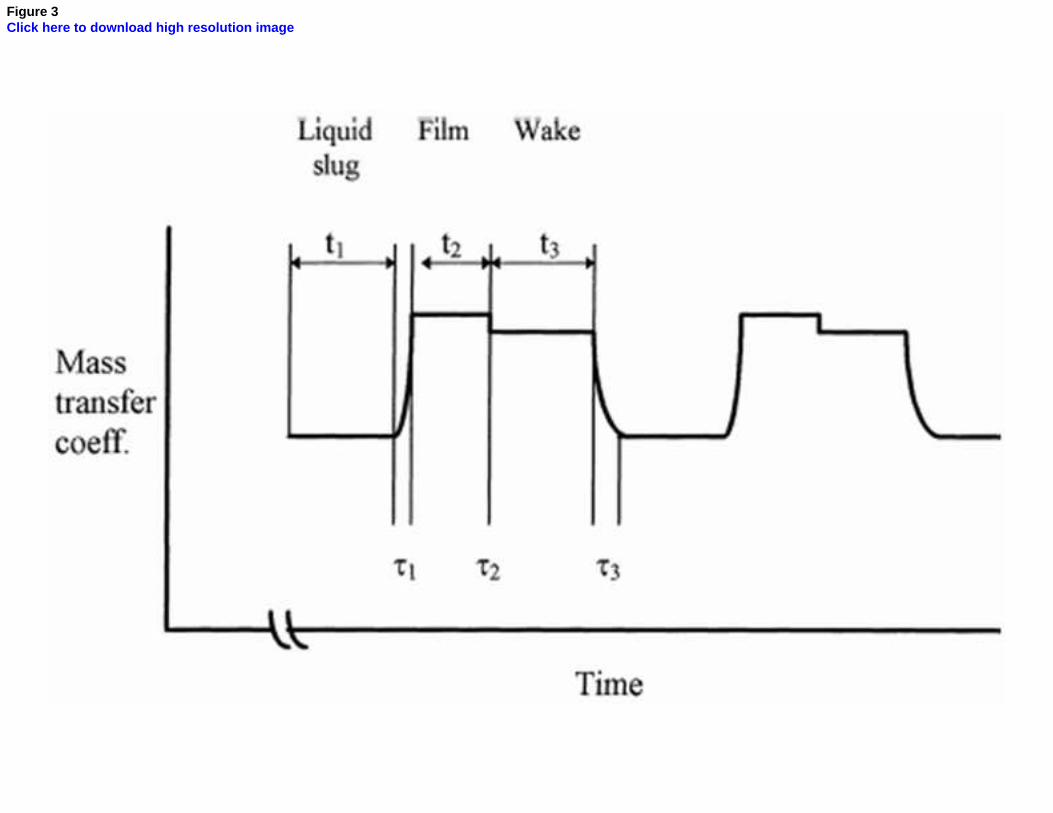
Figure 3Click here to download high resolution image
Figure 4aClick here to download high resolution image
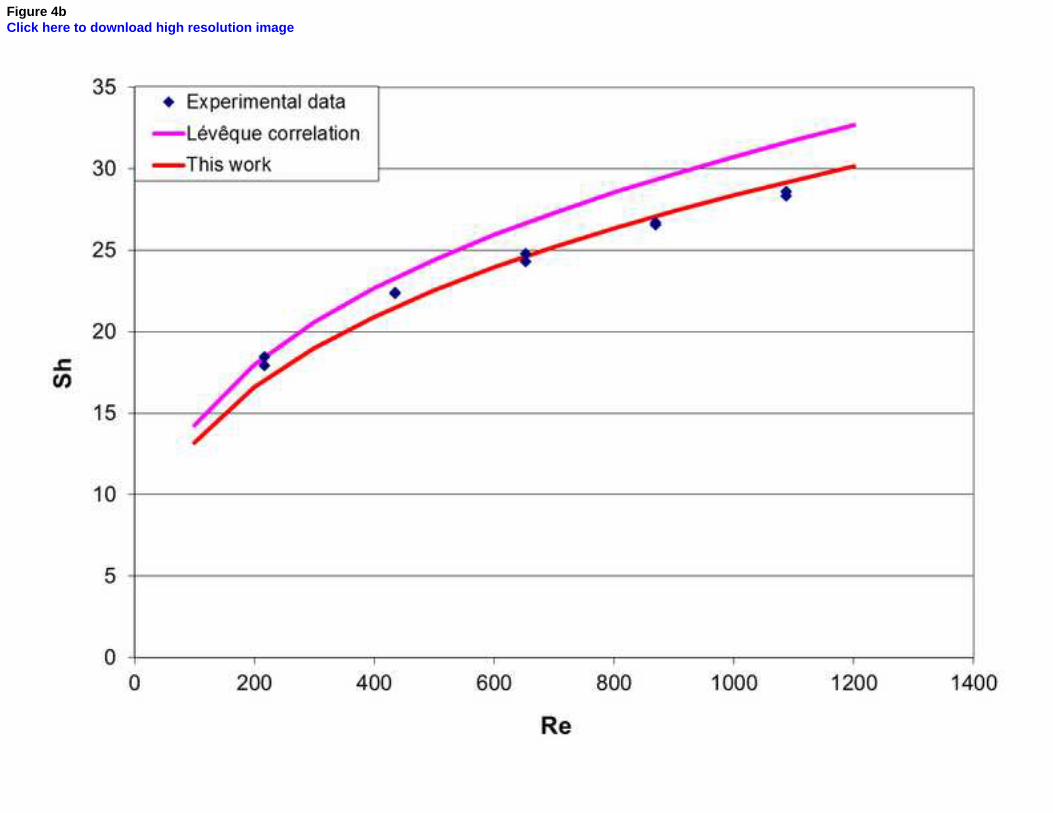
Figure 4bClick here to download high resolution image

Figure 5Click here to download high resolution image
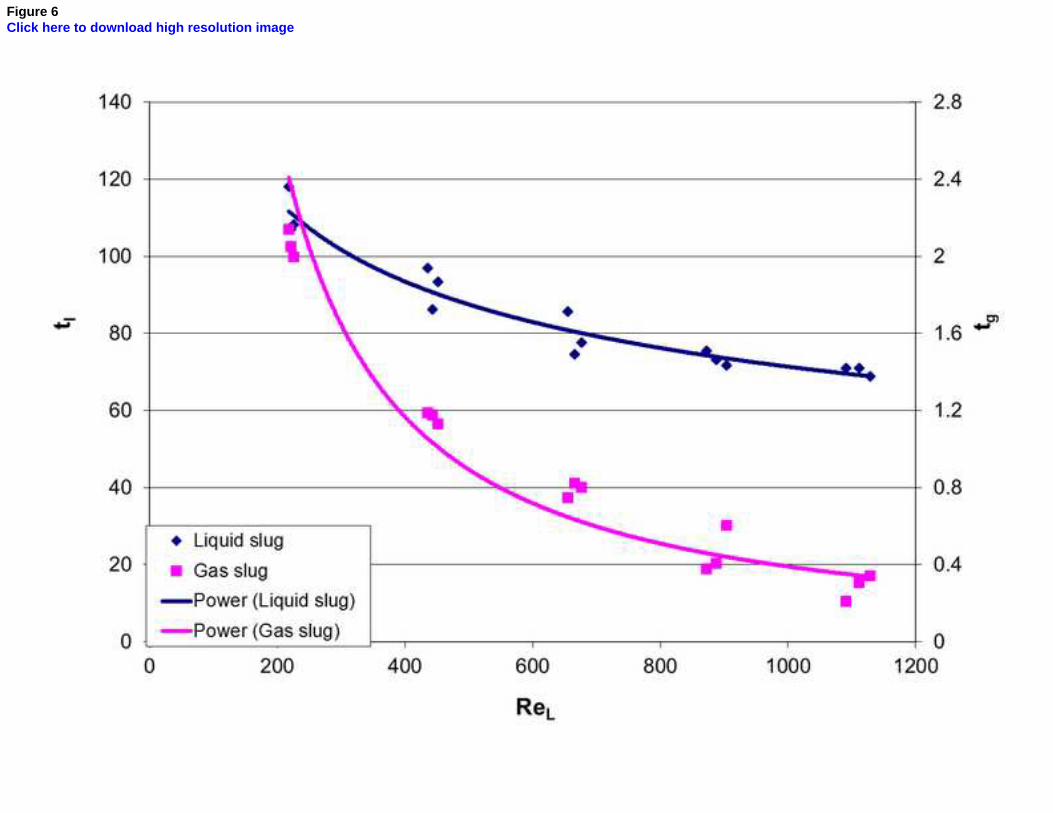
Figure 6Click here to download high resolution image

There are not any actual or potential conflict of interest of this work
*Conflict of Interest Statement
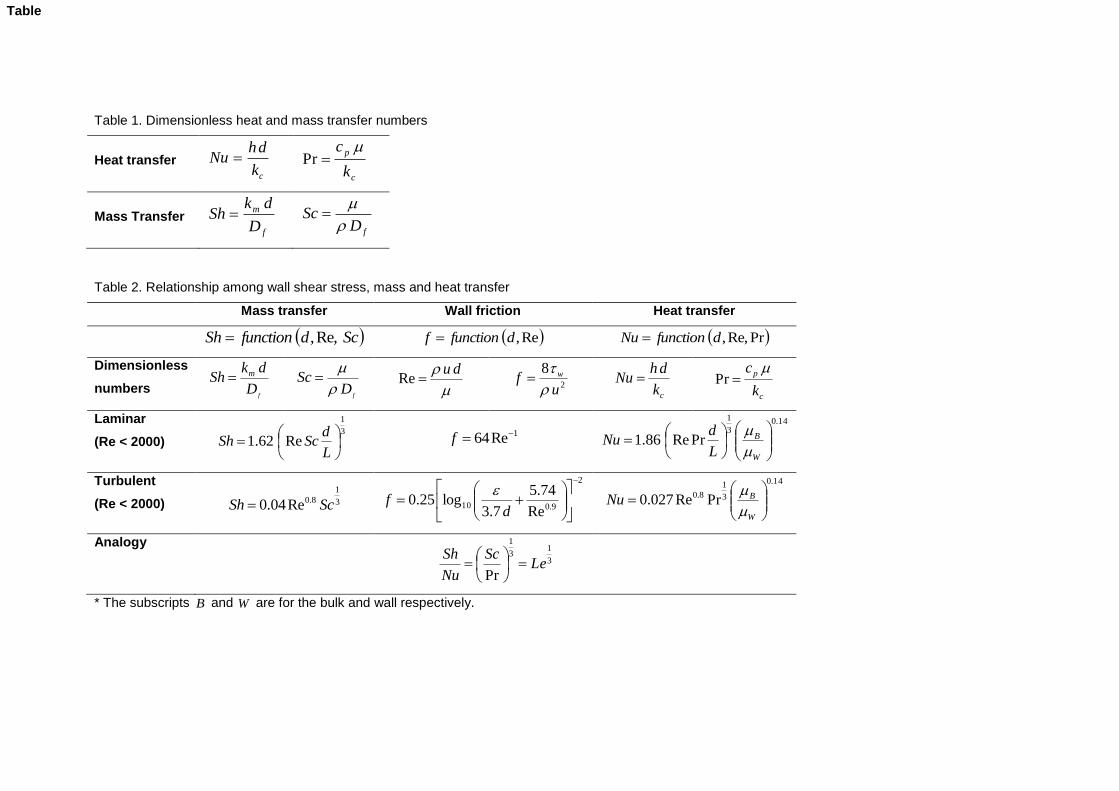
Table 1. Dimensionless heat and mass transfer numbers
Heat transfer ck
dhNu
c
p
k
c Pr
Mass Transfer f
m
D
dkSh
fDSc
Table 2. Relationship among wall shear stress, mass and heat transfer
Mass transfer Wall friction Heat transfer
ScdfunctionSh Re,, Re,dfunctionf PrRe,,dfunctionNu
Dimensionless
numbers f
D
dkSh m
fD
Sc
duRe
2
8
uf w
ck
dhNu
c
p
k
c Pr
Laminar
(Re < 2000) 3
1
Re62.1
L
dScSh
1Re64 f
14.03
1
PrRe86.1
W
B
L
dNu
Turbulent
(Re < 2000) 3
1
8.0Re04.0 ScSh
2
9.010Re
74.5
7.3log25.0
df
14.0
3
1
8.0 PrRe027.0
W
BNu
Analogy
3
13
1
PrLe
Sc
Nu
Sh
* The subscripts B and W are for the bulk and wall respectively.
Table
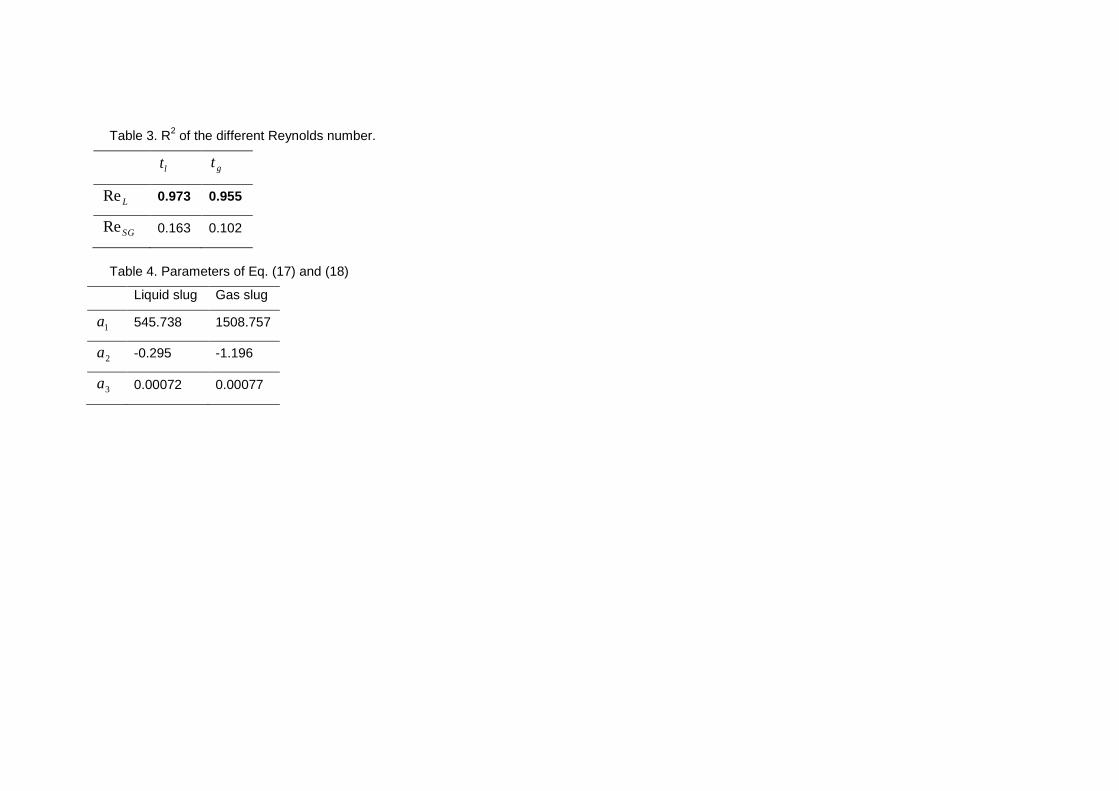
Table 3. R2 of the different Reynolds number.
lt gt
LRe 0.973 0.955
SGRe 0.163 0.102
Table 4. Parameters of Eq. (17) and (18)
Liquid slug Gas slug
1a 545.738 1508.757
2a -0.295 -1.196
3a 0.00072 0.00077