finding motion primitives in human body gestures - vbn
TRANSCRIPT
Aalborg Universitet
Finding Motion Primitives in Human Body Gestures
Reng, Lars; Moeslund, Thomas B.; Granum, Erik
Published in:GW 2005
Publication date:2006
Document VersionPublisher's PDF, also known as Version of record
Link to publication from Aalborg University
Citation for published version (APA):Reng, L., Moeslund, T. B., & Granum, E. (2006). Finding Motion Primitives in Human Body Gestures. In S.Gibet, N. Courty, & J. F. Kamp (Eds.), GW 2005 (pp. 133-144). IEEE Computer Society Press. Lecture Notes InArtificial Intelligence No. 3881
General rightsCopyright and moral rights for the publications made accessible in the public portal are retained by the authors and/or other copyright ownersand it is a condition of accessing publications that users recognise and abide by the legal requirements associated with these rights.
? Users may download and print one copy of any publication from the public portal for the purpose of private study or research. ? You may not further distribute the material or use it for any profit-making activity or commercial gain ? You may freely distribute the URL identifying the publication in the public portal ?
Take down policyIf you believe that this document breaches copyright please contact us at [email protected] providing details, and we will remove access tothe work immediately and investigate your claim.
Downloaded from vbn.aau.dk on: December 04, 2021
Finding Motion Primitives in Human Body Gestures
Lars Reng, Thomas B. Moeslund, and Erik Granum
Laboratory of Computer Vision and Media Technology,Aalborg University, Denmark
Abstract. In the last decade speech processing has been applied in commer-cially available products. One of the key reasons for its success is the identifi-cation and use of an underlying set of generic symbols (phonemes) constitutingall speech. In this work we follow the same approach, but for the problem ofhuman body gestures. That is, the topic of this paper is how to define a frame-work for automatically finding primitives for human body gestures. This is doneby considering a gesture as a trajectory and then searching for points where thedensity of the training data is high. The trajectories are re-sampled to enable adirect comparison between the samples of each trajectory, and enable time in-variant comparisons. This work demonstrates and tests the primitive’s abilityto reconstruct sampled trajectories. Promising test results are shown for sam-ples from different test persons performing gestures from a small one armedgesture set.
1 Introduction
In the last decade speech synthesis and speech recognition have transferred from onlybeing research topics into core technologies in commercially available products. Oneof the key reasons for this transfer is the identification and use of an underlying set ofgeneric symbols constituting all speech, the phonemes. Phonemes are basically smallsound samples that put together in the correct order can generate all the words in aparticular language, for example English.
It is widely accepted that more than half of the information transmitted in a human-human interaction is done by other means than speech, and that the human body languageis responsible for most of this information. Furthermore, for better human-computer in-terfaces to be build the computer might need to be equipped with the ability to understandthe human body language [15]. Since automatic recognition of human body language isa desired ability research has been conducted in this area. Much of this research is basedon defining a subset of the human body language, normally denoted ”actions”, and thenbuilding a classifier based on some kind of learning scheme applied to some trainingdata. The result of the training is a sequence of values in some state-space for each ac-tion. The different learnt sequences are compared to the input data during run-time anda classification is carried out.
In some systems, however, a different approach is followed1. This approach is basedon the idea that an action can be represented by a set of shorter (in terms of time du-ration) primitives. These primitives take different names such as movemes [4], atomic
1 These approaches are sometimes motivated directly by the notion of finding ”phonemes” inthe human body language.
S. Gibet, N. Courty, and J.-F. Kamp (Eds.): GW 2005, LNAI 3881, pp. 133–144, 2006.c© Springer-Verlag Berlin Heidelberg 2006
134 L. Reng, T.B. Moeslund, and E. Granum
movements [5], activities [2], behaviors [12, 17], snippets [9], dynamic instants [16],states [3], and examplars [14].
Besides the different names used to describe the notion of motion primitives, theapproaches also differ in another way, namely whether a primitive is dependent or in-dependent on time. The approaches based on independence find their inspiration inkey-frame animation. Key-frame animation is based on the idea that animating an artic-ulated object in a time sequence is a matter of defining the configurations for a numberof distinct frames (key-frames) and then interpolate all in-between frames using e.g.,inverse kinematics. Mapping this concept to the problem of recognizing human bodylanguage converts the problem to a matter of recognizing a number of single configura-tions and ignoring all in-between configurations. This concept is sound but introducesa number of problems including the problem of defining which configurations (or key-frames) that best represent an action.
In the work by Rao et al. [16] the problem of recognizing dynamic hand gestures isaddressed. They track a hand over time and hereby generate a trajectory in 3D space (x-and y-position, and time). They search the trajectory for significant changes, denoteddynamic instants, which are defined as instants with a high curvature. In the work byJordi [8] the problem of finding key-frames for cyclic actions, like walking and running,is addressed. They capture the joint angles using an optical motion capture system andcompactly represent a time sequence of such data using a point distribution model.Since the actions are cyclic they argue that the likelihood of a configuration being partof an action can be measured as the Mahalanobis distance to the mean. The key-framesare then defined as configurations where the Mahalanobis distance locally is maximum,i.e., key-frames are the least likely configurations!
The alternative to the key-frame approach is to represent the entire trajectory (oneaction), but doing so using a number of smaller sub-trajectories. That is, the entire tra-jectory through a state space is represented as opposed to only representing a numberof single points. Several problems are associated with this approach, for example, howto define the length of the sub-trajectories. If too long then the primitives will not begeneric. If too short the compactness of the representation is lost. In the work by Hod-gins et al. [7] different approaches to find such sub-trajectories for full body motion arecompared, and show promising results. Their comparison of three different approachesfinds Probabilistic PCA as a very efficient tool for finding transitions between differentbehaviours.
In the work by Howe et al. [9] the problem of capturing the 3D motion of a hu-man using only one camera is addressed. The main body parts are tracked in 2D andcompared to learned motion patterns in order to handle the inherent ambiguities wheninferring 3D configurations from 2D data. The learned motion patterns are denoted”snippets” and consist of 11 consecutive configurations. These are learned by group-ing similar motion patterns in the training data. In the work by Bettinger et al. [1] theproblem of modeling how the appearance of a face changes over time is addressed.They use an active appearance model to represent the shape and texture of a face,i.e., one point in their state-space corresponds to one instant of the shape and tex-ture. They record and annotate a number of sequences containing facial changes. Eachsequence corresponds to a trajectory in their state space. The states with the high-
Finding Motion Primitives in Human Body Gestures 135
est densities are found and used to divide the data into sub-trajectories. These sub-trajectories are modeled by Gaussian distributions each corresponding to a temporalprimitive.
The different approaches found in the literature that uses the notion of motion prim-itives more or lees follow the structure below.
Temporal content. Either only a single time instant define a primitive or a primitive isbased on a consecutive number of temporal instants.
Motion capture. In order to find the primitives the motion data needs to be captured.This could for example be done by an optical system or electromagnetic sensors.
Data representation. What is measured by the motion capture system is normally the3D position of the different body parts. These measurements are often representedused normalized angles. Furthermore, the velocity and acceleration might also beconsidered.
Preprocessing. The captured data can have a very high dimensionality and can there-fore be represented more compactly using, e.g., PCA. Furthermore, the data mightbe noisy and is therefore often filtered before further processing.
Primitives. It needs to be decided how to define a primitive. Often this is done via acriteria function which local minima/maxima defines the primitives.
Application. The chosen method needs to be evaluated. This can be with respect to thenumber of primitives versus the recognition rate, but it can also be a comparisonbetween the original data and data synthesized using the primitives.
Our long term goal is to find a set of generic primitives that will enable us to describeall (meaningful) gestures conducted by the upper body of a human. Our approach is toinvestigate different data representations together with different criteria functions. Weseek to find primitives for both recognition and synthesis, and evaluate the relationshipbetween the two.
This particular paper presents the initial work towards our goal and the focus of thepaper is to obtain experiences with all the topics listed above. Concretely we define anumber of one-armed gestures and for each gesture we evaluate a method used to findprimitives. The criteria function is based on a combination of two concepts, namely thecurvature and density of a trajectory.
The paper is structured as follows. In section 2 the gesture data and the appliedmotion capture technique are presented. In section 3 we describe how the data is nor-malized. In section 4 the concept behind the primitives is given. In section 5 we presentthe density measure used in the criteria function, and in section 6 we combine this witha distance measure and defined how the criteria function is evaluated in order to selectthe primitives. In section 7 the test results are presented and in section 8 a conclusion isgiven.
2 The Gesture Data
The gestures we are working with are inspired by the work of [13] where a set ofhand gestures are defined. The gestures in [13] are primarily two-hand gestures, but wesimplify the setup to one-hand gestures in order to minimize the complexity and focus
136 L. Reng, T.B. Moeslund, and E. Granum
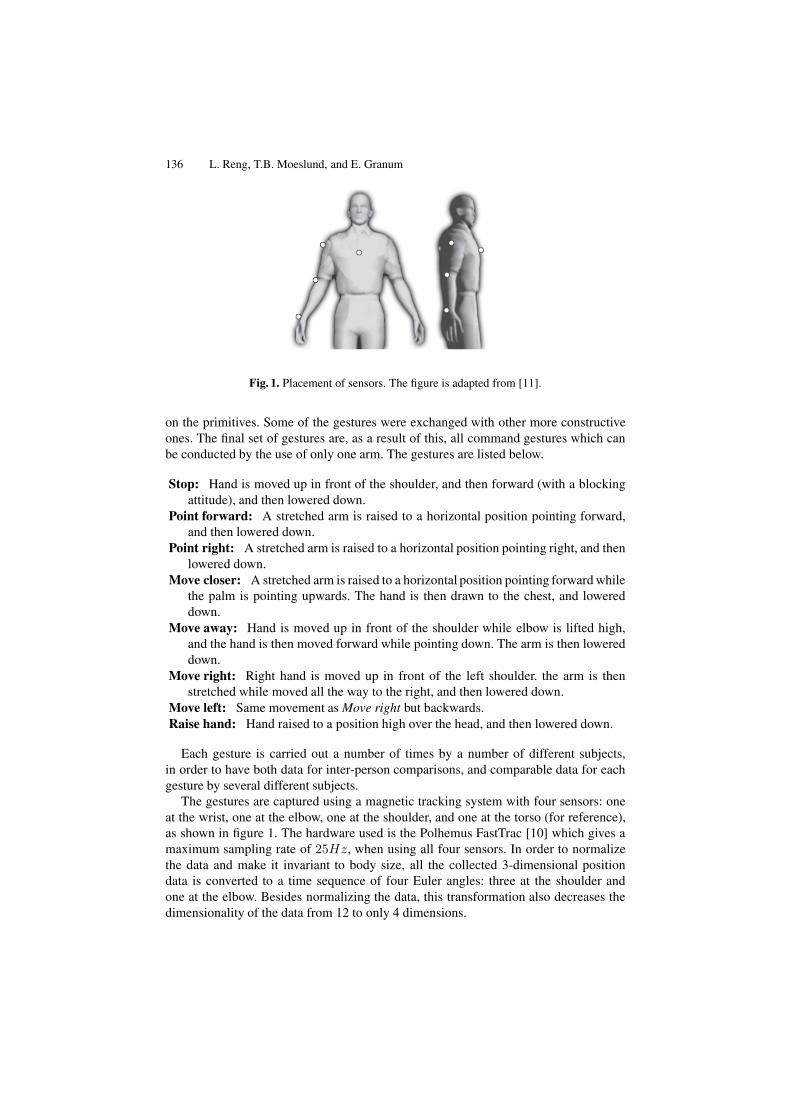
Fig. 1. Placement of sensors. The figure is adapted from [11].
on the primitives. Some of the gestures were exchanged with other more constructiveones. The final set of gestures are, as a result of this, all command gestures which canbe conducted by the use of only one arm. The gestures are listed below.
Stop: Hand is moved up in front of the shoulder, and then forward (with a blockingattitude), and then lowered down.
Point forward: A stretched arm is raised to a horizontal position pointing forward,and then lowered down.
Point right: A stretched arm is raised to a horizontal position pointing right, and thenlowered down.
Move closer: A stretched arm is raised to a horizontal position pointing forward whilethe palm is pointing upwards. The hand is then drawn to the chest, and lowereddown.
Move away: Hand is moved up in front of the shoulder while elbow is lifted high,and the hand is then moved forward while pointing down. The arm is then lowereddown.
Move right: Right hand is moved up in front of the left shoulder. the arm is thenstretched while moved all the way to the right, and then lowered down.
Move left: Same movement as Move right but backwards.Raise hand: Hand raised to a position high over the head, and then lowered down.
Each gesture is carried out a number of times by a number of different subjects,in order to have both data for inter-person comparisons, and comparable data for eachgesture by several different subjects.
The gestures are captured using a magnetic tracking system with four sensors: oneat the wrist, one at the elbow, one at the shoulder, and one at the torso (for reference),as shown in figure 1. The hardware used is the Polhemus FastTrac [10] which gives amaximum sampling rate of 25Hz, when using all four sensors. In order to normalizethe data and make it invariant to body size, all the collected 3-dimensional positiondata is converted to a time sequence of four Euler angles: three at the shoulder andone at the elbow. Besides normalizing the data, this transformation also decreases thedimensionality of the data from 12 to only 4 dimensions.
Finding Motion Primitives in Human Body Gestures 137
3 Normalizing the Data
In order to compare the different sequences they each need to be normalized. The goal isto normalize all the gesture trajectories so each position on a trajectory can be describedby one variable t, where t ∈ [0; 1].
The first step is to determine approximately where the gestures’ endpoints are. Inthis experiment we have chosen to do so by defining a gesture set where all gestures areconsidered to both start and stop when the arm is hanging relaxed from the shoulder. Avelocity threshold ensures that the small movements done between gestures is added toneither, and simplifies the separation of the individual gestures.
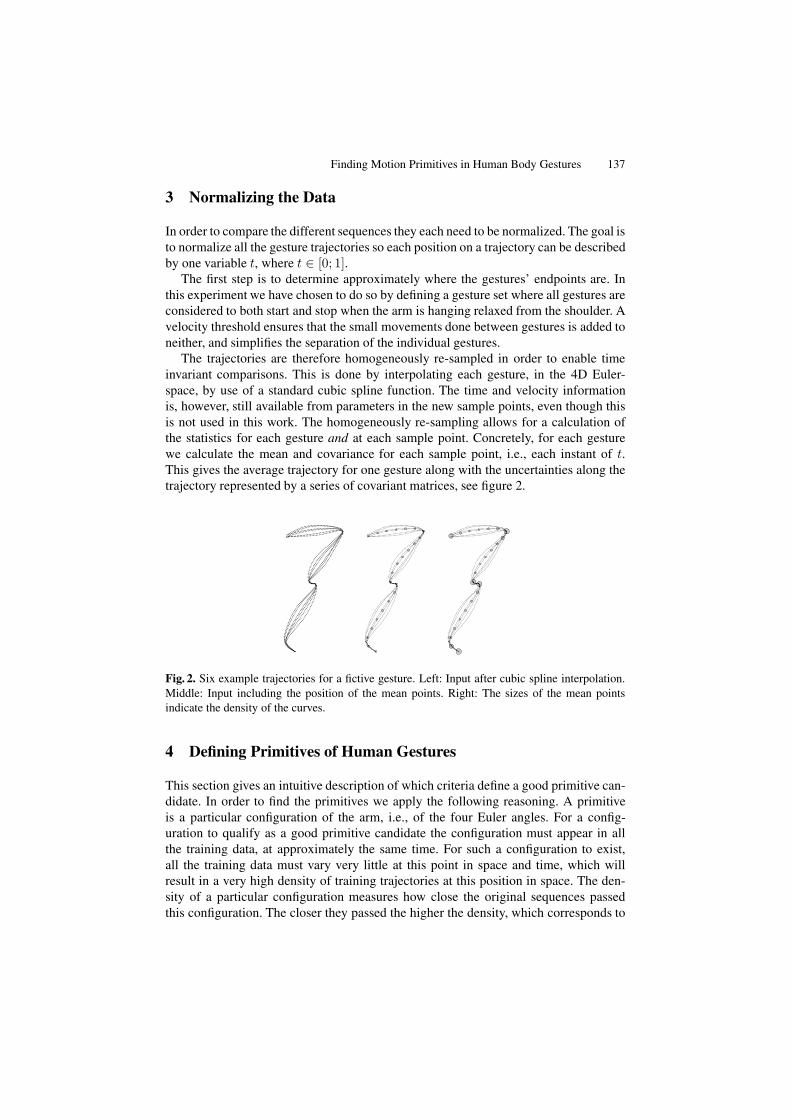
The trajectories are therefore homogeneously re-sampled in order to enable timeinvariant comparisons. This is done by interpolating each gesture, in the 4D Euler-space, by use of a standard cubic spline function. The time and velocity informationis, however, still available from parameters in the new sample points, even though thisis not used in this work. The homogeneously re-sampling allows for a calculation ofthe statistics for each gesture and at each sample point. Concretely, for each gesturewe calculate the mean and covariance for each sample point, i.e., each instant of t.This gives the average trajectory for one gesture along with the uncertainties along thetrajectory represented by a series of covariant matrices, see figure 2.
Fig. 2. Six example trajectories for a fictive gesture. Left: Input after cubic spline interpolation.Middle: Input including the position of the mean points. Right: The sizes of the mean pointsindicate the density of the curves.
4 Defining Primitives of Human Gestures
This section gives an intuitive description of which criteria define a good primitive can-didate. In order to find the primitives we apply the following reasoning. A primitiveis a particular configuration of the arm, i.e., of the four Euler angles. For a config-uration to qualify as a good primitive candidate the configuration must appear in allthe training data, at approximately the same time. For such a configuration to exist,all the training data must vary very little at this point in space and time, which willresult in a very high density of training trajectories at this position in space. The den-sity of a particular configuration measures how close the original sequences passedthis configuration. The closer they passed the higher the density, which corresponds to
138 L. Reng, T.B. Moeslund, and E. Granum
a good candidate. The logic behind this is very simple; only at the points where wehave selected a primitive can we be sure that our new interpolated curve will parsedirectly though. Even though this paper does not go into detail with the recognitionpart, the main reasons for selecting primitives where the density is high is, that itmakes good sense to compare an unknown curve to our known interpolated curve,at exactly the points where all the training data trajectories laid closest, see figure 2.However, just selecting the n points with the highest density will result in very ineffi-cient primitives, since one primitive is enough to direct the interpolated curve throughthis area. So selecting primitives in places where the curve already passes by, willoffer little to the reconstruction of the original curve. In the next two sections wedescribe how we calculate the density measure, and how this is used to select ourprimitives.
5 Measuring the Density
In section 3 the points constituting each trajectory were normalized so that the trajecto-ries for different test subjects can be compared. That is, each trajectory was re-sampledso that they each consist of the same amount of points which are aligned. We can there-fore calculate the covariance matrix for each time instant. The covariance matrices foreach time instant express both how data are correlated but also how they are spreadout with respect to the mean. The Mahalanobis distance expresses this relationship bydefining a distance in terms of variances from a data point to the mean. It is defined as
r2 = (x − µ)T C−1(x − µ) (1)
where x is a data point, µ is the mean for this particular time instant, and C is thecovariance matrix. If r is constant then equation 1 becomes a hyper ellipsoid in 4Dspace. The data points on its surface have the same variance-distance to the mean. Thevolume of a hyper ellipsoid with fixed Mahalanobis distance is a direct measure ofthe density of the data at this time instant. A big volume corresponds to a low densitywhere the points are spread out, whereas a small volume corresponds to a high densityas the same amount of data are located at a much smaller space. The volume of a hyperellipsoid which is expressed as in equation 1 is given as [6]
V =π2 · r4
2|C|
12 (2)
where |C| is the determinant of the covariance matrix. We are not interested in theactual value of the volume but rather the relative volume with respect to the other time
instants. Therefore equation 2 can be reduced to V = |C|12 and is illustrated in figure
2. Below we give an intuitive interpretation of this measure.
5.1 Geometrical Interpretation
Due to the inherent difficulty of illustrating in 4D we give the geometric interpretation
of |C|12 in 2D and then generalize to higher dimensions.
Finding Motion Primitives in Human Body Gestures 139
Imagine that we have N samples in the 2D X-Y plan. For simplicity we assume thatthe mean of the data is the origin. The covariance matrix is given as
C =[
c2x c2
xy
c2yx c2
y
](3)
where entries are calculated as
c2x =
Σx2
n − 1c2y =
Σy2
n − 1c2xy = c2
yx =Σxy
n − 1(4)
We can think of {x1, x2, x3, · · · , xn} and {y1, y2, y3, · · · , yn} as two vectors in anN-dimensional space, see figure 3.
N-dim. space
θ
x
y
x
y
N-dim. space
Areal
A B
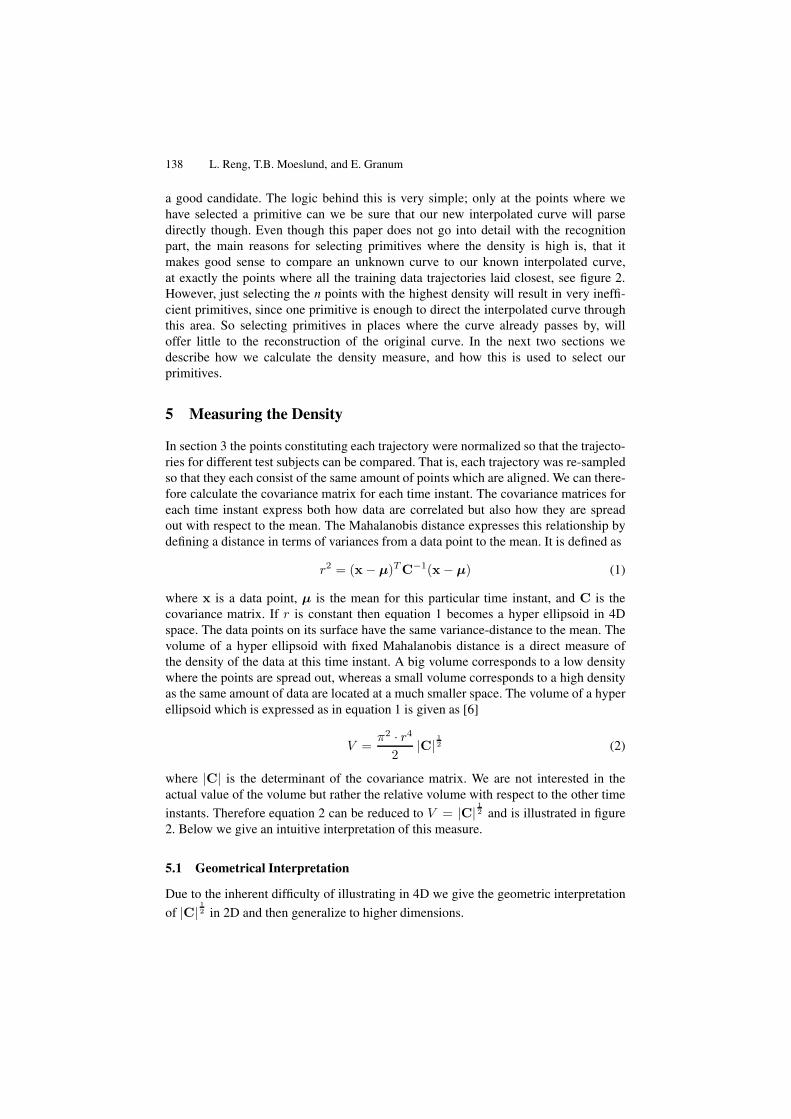
Fig. 3. A: An illustration of the 2D data interpreted as vectors in an N -dimensional space. B: Thearea of the parallelogram spanned by the two vectors.
The angle, θ, between the two vectors expresses the correlation between the twovariables, x and y. The smaller the angle the higher correlation. The correlation is of-ten normalized to the interval [0, 1] using trigonometry, i.e., the correlation is given ascos(θ). Relating this to the two vectors yields
cos(θ) =xT y|x||y| =
Σxy√∑x2
√∑y2
(5)
Inserting this into the covariances yields
c2xy = c2
yx =
√∑x2
√∑y2 cos(θ)
n − 1(6)
We can now calculate the determinant of the covariance matrix as
|C| = c2x · c2
y − c2xy · c2
yx ⇒ (7)
|C| =∑
x2 ∑y2
(n − 1)2−
(1
n − 1
)2 (√∑x2
)2 (√∑y2
)2
cos(θ)2 ⇒ (8)
|C| =(
1n − 1
)2 ∑x2
∑y2 (
1 − cos(θ)2)
⇒ (9)
|C| = c2x · c2
y · sin(θ)2 = (cx · cy · sin(θ))2 (10)
140 L. Reng, T.B. Moeslund, and E. Granum
This equation can be interpreted in a geometrical manner as illustrated in figure 3.B. Thearea, A, of the parallelogram (shaded area) is given as A = cxcy sin(θ), i.e., the areadepends on the standard deviation of the two variables, x and y, and the correlationbetween them. The higher the correlation the smaller the area. The 2D interpretationof |C| 1
2 is the area of the parallelogram in the fourth potent. In the 3D case the geo-metric interpretation of the determinant of the covariance matrix is the volume of theparallelepiped spanned by three variables and their correlation. In 3D+ the geometricinterpretation becomes less intuitive and is sometimes expressed as the generalizationof the concept of variance.
6 Selecting the Primitives
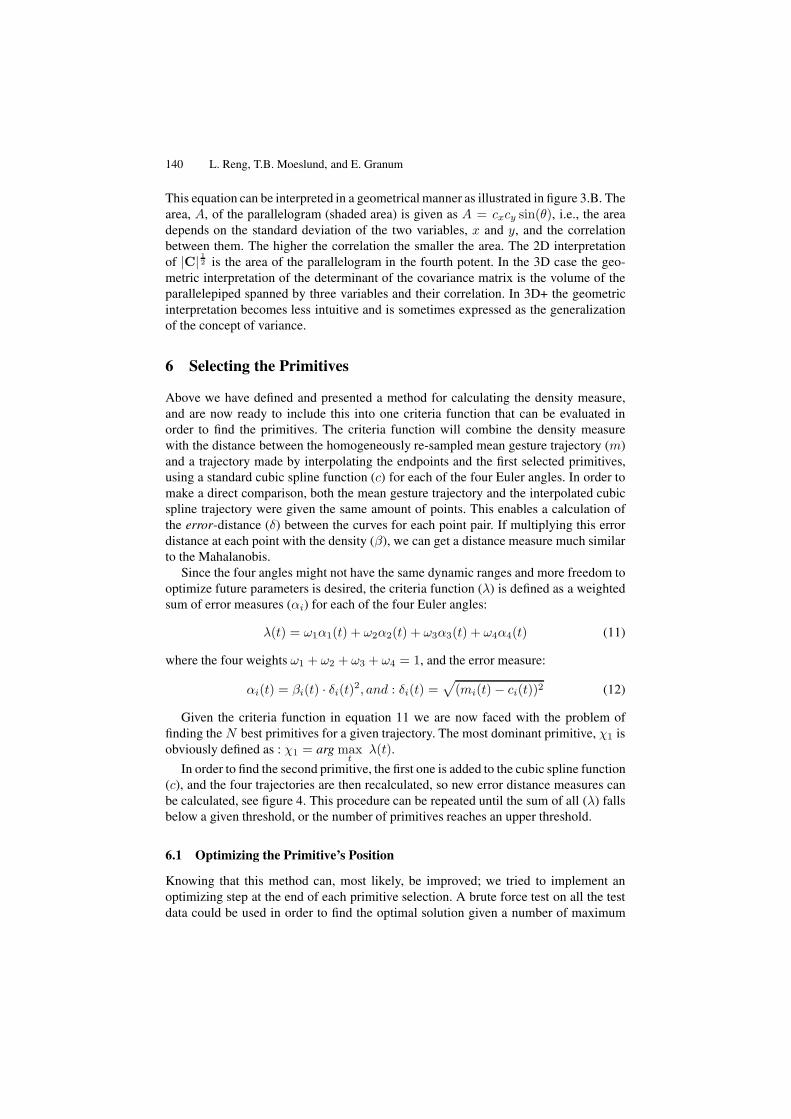
Above we have defined and presented a method for calculating the density measure,and are now ready to include this into one criteria function that can be evaluated inorder to find the primitives. The criteria function will combine the density measurewith the distance between the homogeneously re-sampled mean gesture trajectory (m)and a trajectory made by interpolating the endpoints and the first selected primitives,using a standard cubic spline function (c) for each of the four Euler angles. In order tomake a direct comparison, both the mean gesture trajectory and the interpolated cubicspline trajectory were given the same amount of points. This enables a calculation ofthe error-distance (δ) between the curves for each point pair. If multiplying this errordistance at each point with the density (β), we can get a distance measure much similarto the Mahalanobis.
Since the four angles might not have the same dynamic ranges and more freedom tooptimize future parameters is desired, the criteria function (λ) is defined as a weightedsum of error measures (αi) for each of the four Euler angles:
λ(t) = ω1α1(t) + ω2α2(t) + ω3α3(t) + ω4α4(t) (11)
where the four weights ω1 + ω2 + ω3 + ω4 = 1, and the error measure:
αi(t) = βi(t) · δi(t)2, and : δi(t) =√
(mi(t) − ci(t))2 (12)
Given the criteria function in equation 11 we are now faced with the problem offinding the N best primitives for a given trajectory. The most dominant primitive, χ1 isobviously defined as : χ1 = arg max
tλ(t).
In order to find the second primitive, the first one is added to the cubic spline function(c), and the four trajectories are then recalculated, so new error distance measures canbe calculated, see figure 4. This procedure can be repeated until the sum of all (λ) fallsbelow a given threshold, or the number of primitives reaches an upper threshold.
6.1 Optimizing the Primitive’s Position
Knowing that this method can, most likely, be improved; we tried to implement anoptimizing step at the end of each primitive selection. A brute force test on all the testdata could be used in order to find the optimal solution given a number of maximum
Finding Motion Primitives in Human Body Gestures 141
0 10 20 30 40 50 60 70 80 90 10020
40
60
80
Sample
Ang
le
Fig. 4. Calculating the error-distance in one direction. Solid: The mean gesture trajectory. Dashed:Interpolated cubic spline. Dotted: Variance of training data. Circles: Selected primitives and end-points.
primitives and number of samples. This is, however, very time consuming, and onlyvaluable for the given data set, and was therefore not considered.
Instead, tests were done with another much faster method. After each new primitivewas selected, all the selected primitives were tested in a position one step to each sidealong the mean gesture trajectory. Only if they could lower the total error sum, will theymove to this position, and as long as just one primitive could be moved, all other wouldbe tested again. This method will bring the error sum to a local minimum, but not to aguarantied global minimum.
See the following section for tests results on both previous described methods.
7 Results
The tests described in this section were made on a training data set based on the eightone arm gestures described in section 2. Three tests persons conducted each gesture noless than ten times resulting in a total of 240 gestures2. The evaluation of our approachconsists of two tests for each action:
– Investigate how many primitives are required in order to reconstruct the originalgestures.
– Evaluate the optimization step, and determine whether or not this should be used inour continuous work.
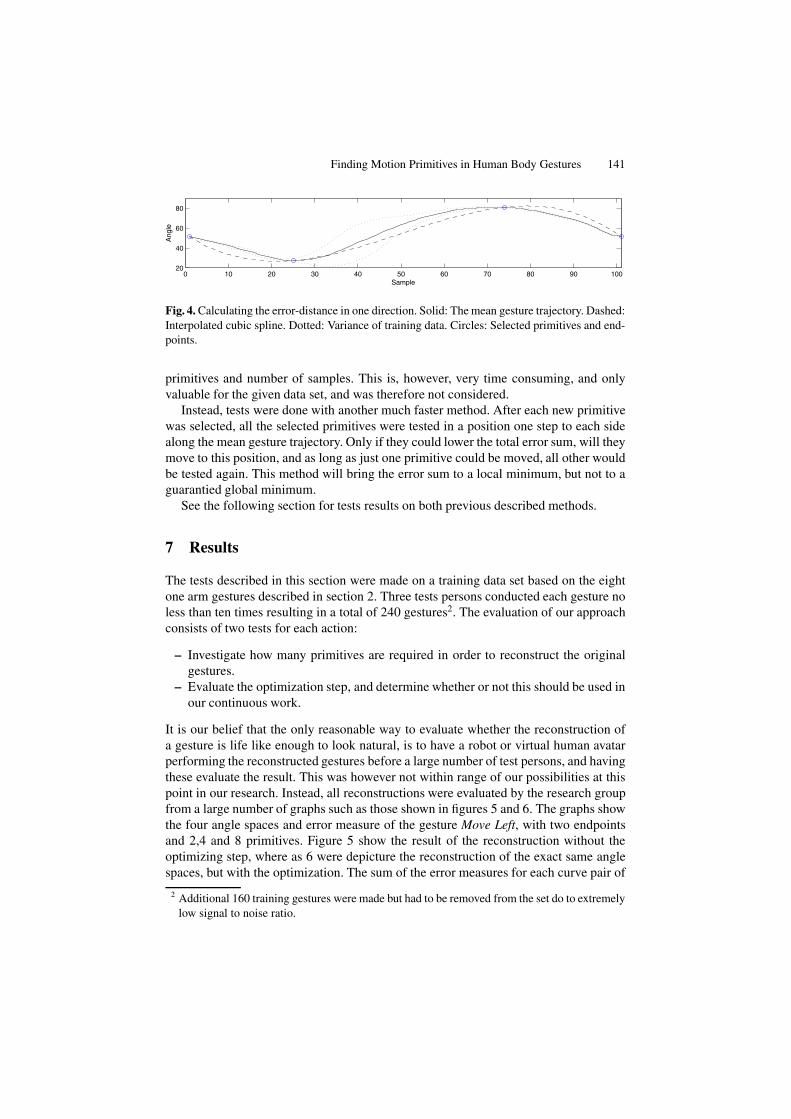
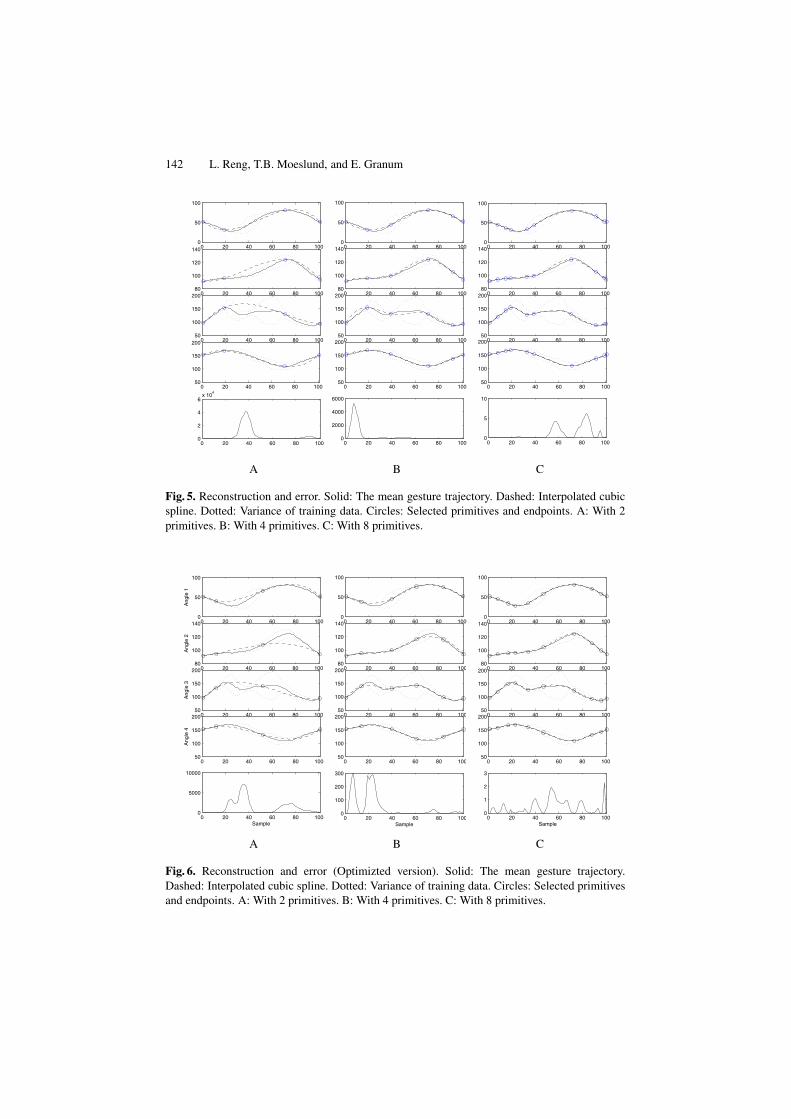
It is our belief that the only reasonable way to evaluate whether the reconstruction ofa gesture is life like enough to look natural, is to have a robot or virtual human avatarperforming the reconstructed gestures before a large number of test persons, and havingthese evaluate the result. This was however not within range of our possibilities at thispoint in our research. Instead, all reconstructions were evaluated by the research groupfrom a large number of graphs such as those shown in figures 5 and 6. The graphs showthe four angle spaces and error measure of the gesture Move Left, with two endpointsand 2,4 and 8 primitives. Figure 5 show the result of the reconstruction without theoptimizing step, where as 6 were depicture the reconstruction of the exact same anglespaces, but with the optimization. The sum of the error measures for each curve pair of
2 Additional 160 training gestures were made but had to be removed from the set do to extremelylow signal to noise ratio.
142 L. Reng, T.B. Moeslund, and E. Granum
0 20 40 60 80 1000
50
100
0 20 40 60 80 10080
100
120
140
0 20 40 60 80 10050
100
150
200
0 20 40 60 80 10050
100
150
200
0 20 40 60 80 1000
2
4
6x 10
4
0 20 40 60 80 1000
50
100
0 20 40 60 80 10080
100
120
140
0 20 40 60 80 10050
100
150
200
0 20 40 60 80 10050
100
150
200
0 20 40 60 80 1000
2000
4000
6000
0 20 40 60 80 1000
50
100
0 20 40 60 80 10080
100
120
140
0 20 40 60 80 10050
100
150
200
0 20 40 60 80 10050
100
150
200
0 20 40 60 80 1000
5
10
A B C
Fig. 5. Reconstruction and error. Solid: The mean gesture trajectory. Dashed: Interpolated cubicspline. Dotted: Variance of training data. Circles: Selected primitives and endpoints. A: With 2primitives. B: With 4 primitives. C: With 8 primitives.
0 20 40 60 80 1000
50
100
Ang
le 1
0 20 40 60 80 10080
100
120
140
Ang
le 2
0 20 40 60 80 10050
100
150
200
Ang
le 3
0 20 40 60 80 10050
100
150
200
Ang
le 4
0 20 40 60 80 1000
5000
10000
Sample
0 20 40 60 80 1000
50
100
0 20 40 60 80 10080
100
120
140
0 20 40 60 80 10050
100
150
200
0 20 40 60 80 10050
100
150
200
0 20 40 60 80 1000
100
200
300
Sample
0 20 40 60 80 1000
50
100
0 20 40 60 80 10080
100
120
140
0 20 40 60 80 10050
100
150
200
0 20 40 60 80 10050
100
150
200
0 20 40 60 80 1000
1
2
3
Sample
A B C
Fig. 6. Reconstruction and error (Optimizted version). Solid: The mean gesture trajectory.Dashed: Interpolated cubic spline. Dotted: Variance of training data. Circles: Selected primitivesand endpoints. A: With 2 primitives. B: With 4 primitives. C: With 8 primitives.
Finding Motion Primitives in Human Body Gestures 143
1 2 3 4 5 6 7 8 9 1010
3
104
105
106
107
108
Number of Primitives
Err
or (
Log)
Error vs. number of primitives
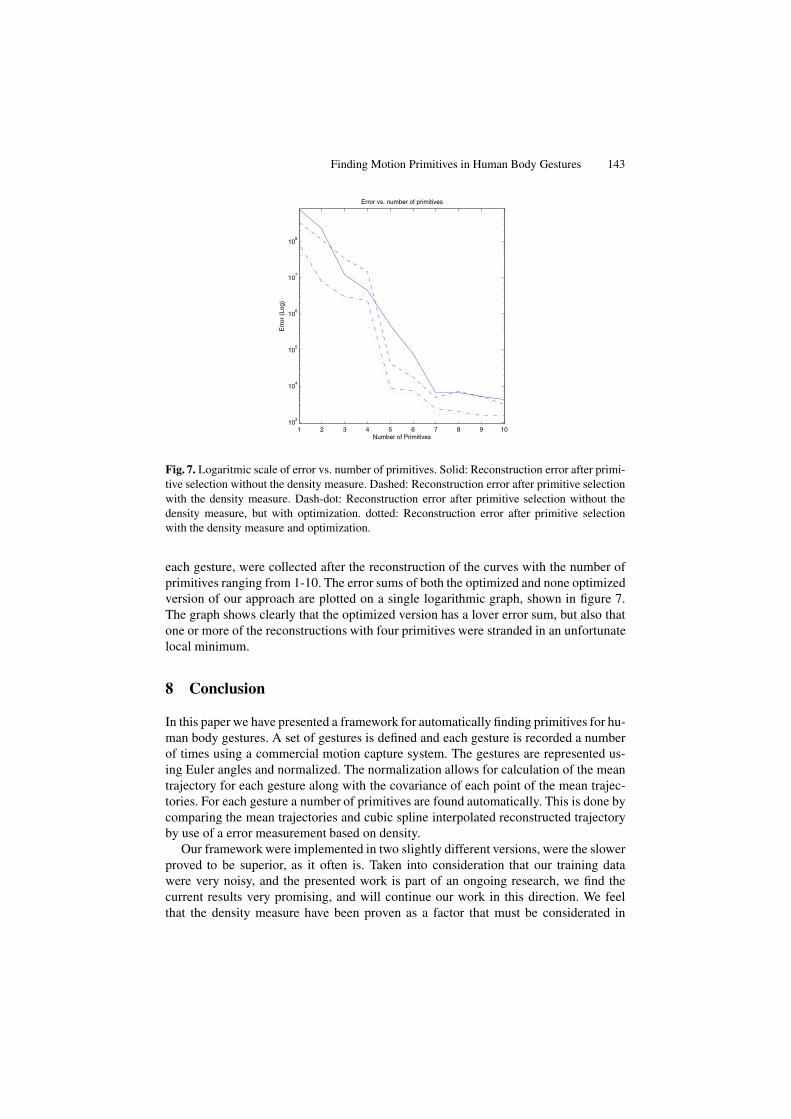
Fig. 7. Logaritmic scale of error vs. number of primitives. Solid: Reconstruction error after primi-tive selection without the density measure. Dashed: Reconstruction error after primitive selectionwith the density measure. Dash-dot: Reconstruction error after primitive selection without thedensity measure, but with optimization. dotted: Reconstruction error after primitive selectionwith the density measure and optimization.
each gesture, were collected after the reconstruction of the curves with the number ofprimitives ranging from 1-10. The error sums of both the optimized and none optimizedversion of our approach are plotted on a single logarithmic graph, shown in figure 7.The graph shows clearly that the optimized version has a lover error sum, but also thatone or more of the reconstructions with four primitives were stranded in an unfortunatelocal minimum.
8 Conclusion
In this paper we have presented a framework for automatically finding primitives for hu-man body gestures. A set of gestures is defined and each gesture is recorded a numberof times using a commercial motion capture system. The gestures are represented us-ing Euler angles and normalized. The normalization allows for calculation of the meantrajectory for each gesture along with the covariance of each point of the mean trajec-tories. For each gesture a number of primitives are found automatically. This is done bycomparing the mean trajectories and cubic spline interpolated reconstructed trajectoryby use of a error measurement based on density.
Our framework were implemented in two slightly different versions, were the slowerproved to be superior, as it often is. Taken into consideration that our training datawere very noisy, and the presented work is part of an ongoing research, we find thecurrent results very promising, and will continue our work in this direction. We feelthat the density measure have been proven as a factor that must be considerated in

144 L. Reng, T.B. Moeslund, and E. Granum
this line of work. Its is still hard to say exactly how many primitives are needed to get anatural reconstruction of a given gesture. But our tests indicate that somewhere betweenfive and ten should be sufficient. It is obvious that other kind of curve-reconstructiontechniques should result in much better reconstruction. But since the key-frames areto be used for recognition as well, it is important to have our key-frames at the pointswhere the density is highest.
References
1. F. Bettinger and T.F. Cootes. A Model of Facial Behaviour. In IEEE International Confer-ence on Automatic Face and Gesture Recognition, Seoul, Korea, May 17 - 19 2004.
2. A.F. Bobick. Movemnet, Activity, and Action: The Role of Knowledge in the Perception ofMotion. In Workshop on Knowledge-based Vision in Man and Machine, London, England,Feb 1997.
3. A.F. Bobick and J. Davis. A Statebased Approach to the Representation and Recognition ofGEstures. IEEE Trans. on Pattern Analysis and Machine Intelligence, 19(12), 1997.
4. C. Bregler. Learning and Recognizing Human Dynamics in Video Sequences. In Conferenceon Computer Vision and Pattern Recognition, San Juan, Puerto Rico, 1997.
5. L. Campbell and A.F. Bobick. Recognition of Human Body Motion Using Phase SpaceConstraints. In International Conference on Computer Vision, Cambridge, Massachusetts,1995.
6. R.O. Duda, P.E. Hart, and D.G. Stork. Pattern Classification. Wiley & Sons, Inc., 2 edition,2001.
7. Hodgins et al. Segmenting Motion Capture Data into Dstinct Behaviors. Unknown, 2004.8. J. Gonzalez. Human Sequence Evaluation: The Key-Frame Approach. PhD thesis, Universi-
tat Autonoma de Barcelona, Barcelona, Spain, 2004.9. N.R. Howe, M.E. Leventon, and W.T. Freeman. Bayesian Reconstruction of 3D Human
Motion from Single-Camera Video. In Advances in Neural Information Processing Systems12. MIT Press, 2000.
10. http://polhemus.com/. Polhemus, three-dimensional scanning, position/orientation trackingsystems, eye tracking and head tracking systems., January 2005.
11. http://www.3dcrimescene.com/. Typical cold case reconstruction., January 2005.12. O.C. Jenkins and M.J. Mataric. Deriving Action and Behavior Primitives from Human Mo-
tion Data. In International Conference on Intelligent Robots and Systems, Lausanne, Switzer-land, Sep 2002.
13. A. Just and S. Marcel. HMM and IOHMM for the Recognition of Mono- and Bi-Manual3D Hand Gestures. In ICPR workshop on Visual Observation of Deictic Gestures (POINT-ING’04), August 2004.
14. A. Kale, N. Cuntoor, and R. Chellappa. A Framework for Activity-Specific Human Recog-nition. In International Conference on Acoustics, Speech and Signal Processing, Orlando,Florida, May 2002.
15. T.B. Moeslund and E. Granum. A Survey of Computer Vision-Based Human Motion Cap-ture. Computer Vision and Image Understanding, 81(3), 2001.
16. C. Rao, A. Yilmaz, and M. Shah. View-Invariant Representation and Recognition of Actions.International Journal of Computer Vision, 50(2), 2002.
17. C.R. Wren and A.P. Pentland. Understanding Purposeful Human Motion. In InternationalWorkshop on Modeling People at ICCV’99, Corfu, Greece, September 1999.