has uber made it easier to get a ride in the rain? · a description of uber and surge pricing. in...
TRANSCRIPT

CAHIER DE RECHERCHE #1708E WORKING PAPER #1708E
Département de science économique Department of Economics
Faculté des sciences sociales Faculty of Social Sciences
Université d’Ottawa University of Ottawa
Abel Brodeur† and Kerry Nield‡
May 2017
* We are grateful to Cristina Blanco-Perez, Pierre Brochu, Jason Garred, Anthony Heyes, Kim Huynh, Louis-
Philippe Morin, Matt Webb and seminar participants at the Bank of Canada and SCSE for very useful remarks and
encouragement. We thank Mitch Prior for outstanding research assistance. The paper was written while Kerry Nield
was completing graduate studies at Carleton University. The views expressed in this paper are those of the authors.
No responsibility for them should be attributed to the Bank of Canada. All errors are our own. † Corresponding author. Department of Economics, University of Ottawa, 120 University Private, Ottawa, Ontario,
Canada, K1N 6N5; e-mail; [email protected]. ‡ Currency Department, Bank of Canada, 234 Wellington Street, Ottawa, Ontario K1A 0G9, Canada. Phone: +1
(613) 782 8907. E-mail: [email protected].
Has Uber Made It Easier to Get
a Ride in the Rain?*
Abstract
In New York City (NYC), it has been a common complaint that it is difficult to find a taxi in the rain.
Using all Uber rides in NYC from April to September 2014 and January 2015 to December 2016, we
show that the number of Uber rides is significantly correlated with whether it rained. The number of Uber
rides per hour is about 18 percent higher when it is raining, suggesting that surge pricing encourages an
increase in supply. During the same time period, the number of taxi rides per hour increases by only 5
percent in rainy hours. We then show that the number of taxi rides, passengers and fare income all
significantly decreased after Uber entered the New York market in May 2011, suggesting that Uber is
depressing taxi demand. Last, we test whether the total (Uber plus taxi) number of rides in rainy hours
increased since May 2011. Our estimates suggest that it is relatively easier to get a ride in rainy than in
non-rainy hours in post-Uber years.
Key words: Rain, Uber, Taxi, Dynamic Pricing.
JEL Classification: D01, D03, L92, J22.
1 Introduction
Standing or walking in the rain is an activity best avoided. In New York
City (NYC), when faced with such inclement weather, the demand for
personal transportation naturally increases. During such scenarios, taxi
drivers spend less time searching for customers and could thus earn a higher
wage. Nonetheless, it has been a common complaint that it is difficult to
find a taxi in the rain.
One plausible explanation for the difficulty of finding a taxi in the rain
is that taxi drivers have a daily income target and stop working once they
reached this target.1 On rainy days taxi drivers reach their target faster
and work less hours.2 This view, however, has been called into question
by Farber (2015). In this recent study, he rejects the idea that target
earnings behavior explains the difficulty to find taxis when it rains. Instead,
Farber (2015) provides evidence that some drivers stop working because of
the worsening driving conditions associated with rain; unfavorable working
conditions for which there is no compensating differential.
As an alternative service to taxis, Uber entered the NYC market in May
2011 with surge pricing and mobile driver-passenger matching technology.
Surge pricing is a pricing scheme implemented by Uber where passengers
pay a higher rate for the Uber service during times of high demand; this
higher pricing scheme gives incentives to Uber drivers to provide rides in
inclement conditions. Uber could thus be a logical response to unmet de-
mand during adverse conditions.
Previous studies on intertemporal substitution of labor supply find
mixed evidence of temporal substitution effects. (See Blundell and MaCurdy
(1999) for a review of the literature.) Fehr and Goette (2007) conduct a
field experiment at a bicycle messenger service in Switzerland in which
they vary temporarily the piece rate paid to messengers. They find a large
positive elasticity of hours of work, but a negative elasticity of effort per
hour. In another experiment, Chang and Gross (2014) document that pear
packers in California respond to unexpected overtime by decreasing their
1 See Koszegi and Rabin (2006) for a model of reference-dependent preferences andloss aversion. They build on the work of Kahneman and Tversky (1979) and Tversky andKahneman (1991) and develop a model where a person’s utility depends on a referencepoint.
2In a seminal article, Camerer et al. (1997) present evidence suggesting that taxidrivers have income reference-dependent preferences, so that taxi drivers have a dailyincome target and stop working once they reached this target. Note that Camerer et al.(1997) were not particularly interested in rain and did not claim that on rainy daystaxi drivers reach their target faster and work less hours. We thank Colin Camerer forpointing this out.
2

effort. In Oettinger (1999), the author studies labor supply of stadium ven-
dors at baseball games and finds that the number of vendors who worked
in a game is positively related to changes in expected wages. In contrast to
earlier studies, we have the unique opportunity of comparing two groups
of workers, Uber and taxis in NYC, who are facing different unanticipated
wage increases in response to exogenous circumstances. Another key fea-
ture of our analysis is that we can test whether the taxi market changed
since Uber entered the on-demand transportation network in NYC.
This paper makes four contributions. First, we provide an empirical
examination of whether the number of Uber rides increases more than the
number of taxi rides when it rains. For this analysis, we rely on all Uber
and taxi rides in NYC from April-September 2014 and January 2015 to
December 2016 and merge the Uber and taxi data with weather data from
the National Weather Service Observatory in Central Park. The results
suggest that the number of Uber rides per hour is significantly correlated
with whether it rained. More precisely, the number of Uber rides per hour
is about 18 percent higher when it is raining, suggesting that surge pricing
encourages an increase in supply.3 This increase in transactions when it
rains likely reflects a large increase in both demand and supply. On the
other hand, the number of taxi rides per hour increases by only 5 percent
in rainy hours during this time period.
Second, we test whether rain increases the number of daily rides. We
provide evidence that the number of Uber rides increases by approximately
8 percent during rainy days and that an additional hour of rain increases
the number of Uber rides per day by approximately 2 percent. On the
other hand, there is weak evidence that the daily number of taxi rides is
related to rain. The number of taxi rides increases by approximately 2
percent during rainy days. This is suggestive evidence that Uber drivers
do not have a daily target income level and that Uber driver labor supply
is best characterized by the neoclassical model.
Third, we use data for all trips taken in NYC taxi cabs before (January
2010-April 2011) and after (2014-2016) Uber’s rise in popularity, and show
that the number of taxi rides per hour decreased by approximately 27
percent after Uber entered the New York market in May 2011. The results
indicate that the number of taxi rides in both rainy and non-rainy hours
have similarly decreased since Uber entered the market. Moreover, we show
that hourly fare income and the number of passengers per hour for taxis
3Unfortunately, our data set does not allow us to test whether the increase in laborsupply of Uber drivers during rainy hours is due to the extensive or intensive margin.
3
significantly decreased after Uber entered the market, suggesting that Uber
is depressing taxi demand.
Finally, we document whether it is easier to find a ride since Uber
entered the market. For this exercise, we combine Uber and taxi rides for
2014-2016 and compare the total number of rides post-Uber to the number
of taxi rides during the pre-Uber period (January 2010-April 2011). We
find that the total number of rides remained stable since May 2011, but
that it was relatively easier to get a ride in rainy than in non-rainy hours
in 2014-2016.
This paper contributes to the literature analyzing labor supply of taxi
drivers (Agarwal et al. (2015), Buchholz (2016), Camerer et al. (1997),
Chou (2002), Crawford and Meng (2011), Doran (2014), Farber (2008),
Haggag and Paci (2014) and Haggag et al. (2017)). Two relevant papers
using NYC data are Farber (2005) and Ashenfelter et al. (2010). Farber
(2005) studies the stopping behavior of NYC taxi drivers and finds that
the decision to stop working is primarily related to cumulative daily hours.
Ashenfelter et al. (2010) also study the labor supply of taxi drivers. They
analyze the impact of two permanent fare increases and find an elasticity
of labor supply of −0.2 in response to these fare increases.
Our work also contributes to a small economic literature on the Uber
platform. Despite its media attention, few research papers analyze the im-
pact of Uber on the labor supply of taxi drivers. The dearth of research
on this issue is mainly driven by the lack of publicly available data. In
this paper, we rely on Uber data in NYC that were recently made publicly
available. Two recent papers using different Uber data are Chen and Shel-
don (2015) and Cramer and Krueger (2016). In Chen and Sheldon (2015),
the authors use a randomly drawn subset of UberX driver-partners in a few
American cities.4 They find that UberX partners are less likely to quit at
times with high surge prices. Cramer and Krueger (2016) compare capacity
utilization for taxis and UberX drivers in five American cities. They pro-
vide evidence that the capacity utilization rates of taxi and UberX drivers
are very similar in NYC.5 They point out that this may be due to the high
4UberX cars can carry up to four riders and have four doors. The full list of Ubervehicle classes is available here: http : //driveubernyc.com/vehicles/full − list.
5Hall and Krueger (2016) compare Uber’s driver-partners labor market demographicto taxi drivers. They find that Uber’s driver-partners are more similar to the generalworkforce than taxi drivers and chauffeurs. In particular, Uber drivers are comparativelymore educated and younger. Cohen et al. (2016) estimate consumer surplus for UberXin four U.S. cities. They rely on Uber’s surge pricing algorithm to estimate demandelasticities and find that demand is quite inelastic (i.e., price elasticities between -0.4and -0.6).
4
population density which supports more efficient matching of taxis.
The paper is structured as follows. In the following section, we provide
a description of Uber and surge pricing. In Section 3, we detail the data
sets and provide descriptive statistics. Section 4 presents the model speci-
fication. Section 5 discusses our findings of the impact of rain on Uber and
taxi rides. The last section concludes.
2 Conceptual Framework
This section provides insights on how rain might impact the number of Uber
and taxi rides in theory. We consider two alternative mechanisms. The first
builds on standard neoclassical intertemporal models of labor supply (e.g.,
Fehr and Goette (2007); Oettinger (1999)) and treats surge pricing as a
transitory wage change for Uber drivers. The second is based on models
of reference-dependent preferences in which drivers stop working once they
reach their target income level (e.g., Camerer et al. (1997); Koszegi and
Rabin (2006)).
A key hypothesis in this study is that adverse weather conditions cause
an increase in the demand for alternative on-demand sources of transport
such as taxis or Uber cars.6 During rainfall, it is generally considered to
be undesirable to be outside (Connolly (2008)). As such, individuals who
would generally walk or wait for public transit may wish to utilize taxis or
Uber cars. Importantly, we assume that the increase in demand for rides
during rainy hours is similar in pre- and post-Uber years.
2.1 Intertemporal Models of Labor
A simple neoclassical intertemporal model of labor predicts that workers
respond positively to earnings opportunities. This model implies that unan-
ticipated increases in earnings opportunities such as rain would positively
affect labor supply elasticities. In other words, this model predicts that
drivers would be working more on high-wage days and less on low-wage
days.
A rational choice model with reference-dependent preferences suggests
that workers who temporarily earn higher wages will eventually decrease
their effort. For instance, cab and Uber drivers who have a reference level
of daily income would work more in rainy hours. As they get closer to their
6The New York subway provided significantly more rides than Uber andtaxi drivers. Subway and bus ridership statistics are available here: http ://web.mta.info/nyct/facts/ridership/.
5
daily reference level, the marginal utility of income would be decreasing
which in turn would reduce their effort.
The neoclassical model and the model with reference-dependent pref-
erences that exhibit loss aversion around a daily target income level both
suggest that rain increases hourly rides. On the other hand, only the former
predicts that rain increases daily rides. Using all trips taken in NYC taxis
from 2009-2013, Farber (2015) tests whether rain affects earnings, utiliza-
tion rates and the number of hacks on the streets. He finds that rain has no
effect on hourly earnings, but does cause higher utilization of cabs, and in
general shorter trips. This is indicative of increased demand for rides when
it rains. However, there is also a decreased number of taxis on the streets
which is, arguably, due to the disutility experienced by taxi drivers driving
in uncomfortable weather conditions. Farber (2015) concludes that these
results are “sufficient to reject the hypothesis that target earnings behavior
contributes to the difficulty of finding a taxi in the rain [...]”
Unlike taxis, the Uber platform adjusts its prices using a realtime dy-
namic algorithm (Chen and Sheldon (2015)).7 The Uber fare rates auto-
matically increase when demand is higher than supply of drivers within a
fixed geographic area. Customers are informed of the higher fare before
requesting the Uber car. Uber drivers are also aware of surge pricing and
have access to maps displaying the locations currently surge pricing.8 Uber
drivers may freely choose when they work and they can drive as long as
they like. This is thus an ideal setting for studying intertemporal models
of labor (Fehr and Goette (2007)).
As there is no rain surcharge for taxis, taxi drivers may be less likely to
respond to the increased demand for rides. Uber platforms could then ben-
efit consumers if Uber drivers respond to the unmet demand when it rains.
The extra compensation that Uber drivers receive through surge pricing
may incentivize them to overcome the disutility of adverse conditions.
Factors other from surge pricing may explain why Uber drivers work
more (or are more likely to work) when it rains. First, while driving is a
primary occupation for most traditional cab drivers, it is a secondary job
for many Uber drivers (Chen et al. (2017)). Arguably, hours supplied to a
secondary job are more elastic than hours supplied to a primary job. Sec-
ond, the restricted supply of taxi cabs available to drive in the rain may
limit the behavioral response of (potential) taxi drivers. Another explana-
7A major difference between taxis and Uber is that Uber drivers do not need topurchase one of the city’s prized taxi medallions. The cost of a taxi medallion is oftenhundreds of thousands of dollars.
8Surge multipliers are discrete and there is no cap in NYC.
6

tion is that taxi and Uber drivers have a different aversion to driving in
inclement weather. For instance, Hall and Krueger (2016) find that there is
a greater representation of younger people among Uber drivers than among
taxi drivers. The response to weather conditions could then be due to both
surge pricing and drivers’ aversion to risk.
2.2 Evaluating the Effect of Rain
We test four hypotheses in what follows. First, we test whether the number
of Uber rides increases significantly more than the number of taxi rides in
rainy hours. Due to surge pricing, among other reasons, we expect that the
number of rides given by Uber drivers increases significantly more than the
number of taxi rides in the rain. Such a result would provide some evidence
that the wage increase caused an increase in Uber drivers’ labor supply.
Second, we investigate whether rain increases the number of daily rides
for both taxis and Uber. The neoclassical model predicts that rain increases
significantly the number of daily rides. On the other hand, if drivers have
a daily target income level, then we should find that rainy days are not
significantly related to taxi and Uber rides. Note that it is possible that
drivers have a weekly or monthly target income level. Unfortunately, the
sample size is too small to estimate precisely whether this is the case.
Third, we test whether taxi drivers’ supply response to rain changed
since Uber entered the market. The lack of rain surcharge for taxis and the
increasing presence of Uber drivers when it rains may increase the difficulty
of finding customers for taxi drivers. We test this using taxi rides data pre-
and post-Uber.
Last, we test whether the total (Uber plus taxi) number of rides in-
creased or decreased since May 2011. We also test whether it was rela-
tively easier to get a ride in rainy than in non-rainy hours in post-Uber
years. Note that the presence of Uber does not automatically increase the
total number of rides. As mentioned before, there might be a substitu-
tion of rides from taxi to Uber and the disutility of adverse conditions for
taxi drivers might have changed since May 2011. It thus remains unclear
whether the total number of rides in the rain increased proportionally more
than the total number of rides in non-rainy hours since Uber entered the
market.
7

3 Data Sources
3.1 Data on Uber and Taxi Rides
This study relies on all trip level data of Uber pickups in NYC from April
to September 2014 and January 2015 to December 2016. This data set
was made available by the New York Taxi Commission (TLC). This data
set includes approximately 110 million rides reported from the dispatching
bases Uber utilizes in NYC. Uber cars are classified as for-hire vehicles by
the TLC.
Individual trip level data for taxi rides are also available for this time
frame. TLC has publicly released trip level data for all yellow taxi rides
dating back to 2009. This is when the TLC started to require that digital
trip records be kept through car GPS devices. For this time period, we
calculated the number of rides that occurred hourly for both Uber and taxis.
This was done using the time of the pick up. For taxis, we also compute
the hourly number of passengers and the total time-and-distance fare as
calculated by the taxi meter per hour. Note that taxi rides going to the
airport are excluded for these two additional variables. The total time-and-
distance fare does not include extra charges, such as the rush hour ($.50)
and overnight charges ($1), the $.50 MTA tax, or the $.30 improvement
surcharge that started in 2015. It also does not include tip amount, or tolls
amount. Unfortunately, we cannot compute these additional variables for
Uber since we do not observe the price of each ride nor surge price.
Figure 1 shows the number of rides per quarter since 2009 for taxis and
over the period April to September 2014 and January 2015 to December
2016 for Uber. Note that Uber entered the New York market in May 2011.
What emerges is that the number of taxi rides is much larger than the num-
ber of Uber rides in 2014. During the second quarter of 2014, when Uber
had been in the market for nearly three years, there were approximately 23
times more taxi rides than Uber rides. But this gap has decreased sharply.
During the last quarter of 2016, the most recent quarter in our analysis,
there were approximately 1.4 times more taxi rides than Uber rides. Figure
1 suggests that this decreasing gap is due both to an increase in Uber rides
and a decrease in taxi rides.
Figure 2 displays the number of taxi passengers and total time-and-
distance fare as calculated by the taxi meter per quarter for the period
2010-2016. The number of passengers per quarter for taxis decreased by
approximately 16 million passengers from 2010 to 2016 while total time-
8

and-distance fare per quarter decreased by approximately $30 million in
2010 dollars.9
The differential in rides during rainy hours also decreased during this
time period. During the second and third quarters of 2014, there were
respectively 3.9 million taxi rides and 236,000 Uber rides during rainy hours
(i.e., 16 times more taxi rides than Uber rides). During the second and third
quarters of 2016, the gap was down to 1.2 million, with 1.4 million Uber
rides and 2.6 million taxi rides (i.e., less than two times more taxi rides
than Uber rides in rainy hours).
For our analysis, two subsets of the taxi data set are used. A first taxi
data from April to September 2014 and January 2015 to December 2016
(2014-2016 henceforth) is used, as it is a direct comparison to the time
frame for which Uber data are available. A second subset, from January
2010-April 2011 (2010-2011 henceforth), is used as well. We rely on this
second subset which covers a period before Uber entered the NYC market
as a comparison for taxi drivers’ response in post-Uber market conditions.
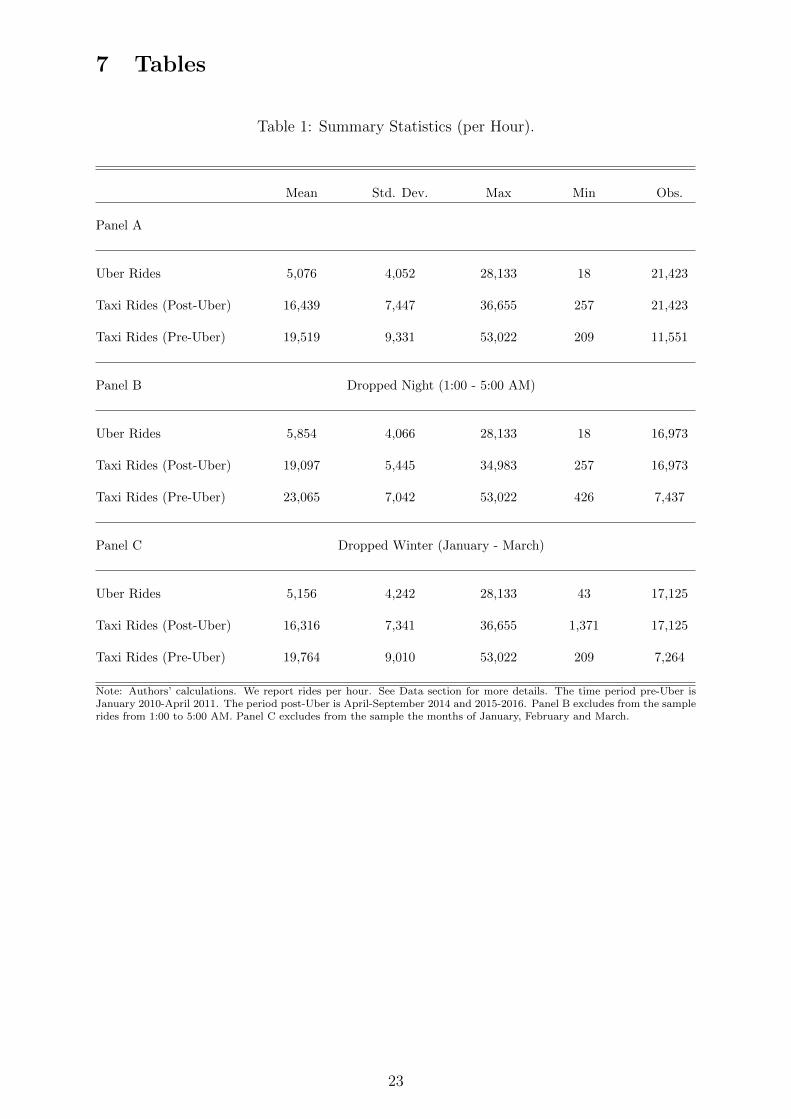
We provide descriptive statistics for Uber and taxi rides per hour in
Panel A of Table 1. (See Appendix Table A1 for Uber and taxi rides
per day.) The average number of Uber rides per hour is 5,076 over the
period 2014-2016. During the same time period, the average number of
taxi rides per hour was 16,439. This is a small decrease in comparison
to the average number of taxi rides over the period 2010-2011 (19,519).
The standard deviation of taxi rides has also decreased in this same time
frame. Panels B and C provide the same summary statistics as in Panel
A, but for two sub-samples: 1) excluding nighttime observations (1:00 to
5:00 AM), and 2) excluding winter months (January-March). The average
number of rides per hour is higher when we exclude nighttime observations
and the number of Uber and taxi rides is somewhat similar for winter and
non-winter months.10
3.2 Weather Data
The above data sets are combined with weather data from the National
Weather Service Observatory in Central Park. This data set was collected
using scraping techniques from www.wunderground.com. The observatory
9We use the Consumer Price Index for All Urban Consumers (All items) in NewYork-Northern New Jersey-Long Island to deflate prices.
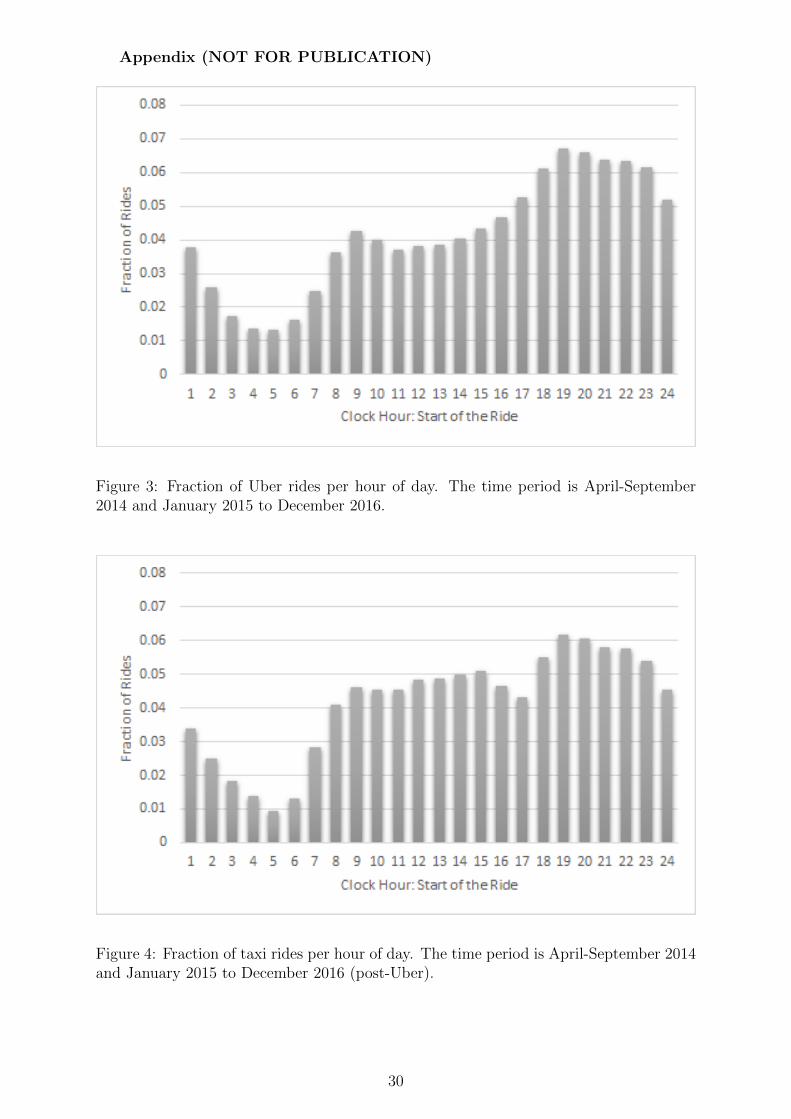
10Appendix Figures 3 and 4 confirm that the fraction of rides is lower for nighttimeobservations by showing the fraction of rides per hour of day for Uber and taxis (post-Uber). The fraction of Uber rides from 5:00 to 10:00 PM is slightly larger than thefraction of taxi rides while this is the opposite from 8:00 AM to 1:00 PM.
9
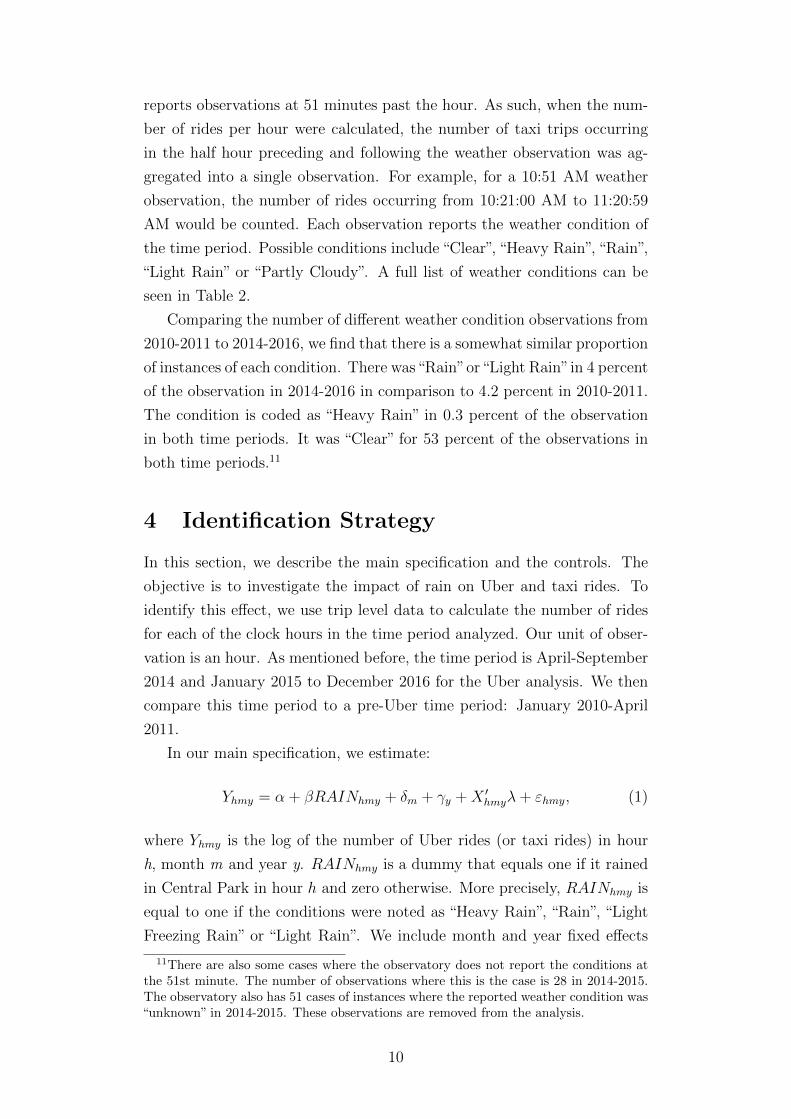
reports observations at 51 minutes past the hour. As such, when the num-
ber of rides per hour were calculated, the number of taxi trips occurring
in the half hour preceding and following the weather observation was ag-
gregated into a single observation. For example, for a 10:51 AM weather
observation, the number of rides occurring from 10:21:00 AM to 11:20:59
AM would be counted. Each observation reports the weather condition of
the time period. Possible conditions include “Clear”, “Heavy Rain”, “Rain”,
“Light Rain” or “Partly Cloudy”. A full list of weather conditions can be
seen in Table 2.
Comparing the number of different weather condition observations from
2010-2011 to 2014-2016, we find that there is a somewhat similar proportion
of instances of each condition. There was“Rain”or“Light Rain”in 4 percent
of the observation in 2014-2016 in comparison to 4.2 percent in 2010-2011.
The condition is coded as “Heavy Rain” in 0.3 percent of the observation
in both time periods. It was “Clear” for 53 percent of the observations in
both time periods.11
4 Identification Strategy
In this section, we describe the main specification and the controls. The
objective is to investigate the impact of rain on Uber and taxi rides. To
identify this effect, we use trip level data to calculate the number of rides
for each of the clock hours in the time period analyzed. Our unit of obser-
vation is an hour. As mentioned before, the time period is April-September
2014 and January 2015 to December 2016 for the Uber analysis. We then
compare this time period to a pre-Uber time period: January 2010-April
2011.
In our main specification, we estimate:
Yhmy = α + βRAINhmy + δm + γy +X ′hmyλ+ εhmy, (1)
where Yhmy is the log of the number of Uber rides (or taxi rides) in hour
h, month m and year y. RAINhmy is a dummy that equals one if it rained
in Central Park in hour h and zero otherwise. More precisely, RAINhmy is
equal to one if the conditions were noted as “Heavy Rain”, “Rain”, “Light
Freezing Rain” or “Light Rain”. We include month and year fixed effects
11There are also some cases where the observatory does not report the conditions atthe 51st minute. The number of observations where this is the case is 28 in 2014-2015.The observatory also has 51 cases of instances where the reported weather condition was“unknown” in 2014-2015. These observations are removed from the analysis.
10

and Xhmy is a vector of other regressors that includes indicators for hour of
day by day of week, snow and major holiday.12 The coefficient of interest
here is β.
We check the robustness of our results by removing outliers. First,
we check that the association of rain and the number of rides per hour is
robust to using a subset of the data set that removes the winter months.
The winter months are identified in this research as January, February and
March. Second, we exclude nighttime observations since the number of
rides is lower during that time of the day. Last, we test the robustness of
our findings by excluding from the analysis the more severe weather events
“Heavy Rain” and “Light Freezing Rain”.
Our econometric model for testing the effect of Uber’s rise in popularity
on the number of taxi rides in rainy hours is as follows:
Yhmy = α + βRAINhmy + θPostUberhmy
+ σRAINhmy × PostUberhmy + δm +X ′hmyλ+ Z ′
myµ+ εhmy, (2)
where the dependent variable is the log of the number of taxi rides in an
hour h, month m and year y. PostUber is a variable that takes the value 1
if the year is after 2011. The interaction of RAIN and PostUber shows the
effect of the introduction of Uber’s platform in NYC on taxi rides in rainy
hours. We include month fixed effects, our vector of time dummies (Xhmy)
and control for demand-side factors such as the natural log of population
(18 years and over) at the year level and the monthly unemployment rate
(Zmy).
The interpretation relies on the identification condition that there are
no other time-varying shocks that affect the number of taxi rides. Our
analysis of taxi drivers’ labor supply pre- and post-Uber should thus be
viewed with caution since there were at least two changes in the New York
taxi market during the time frame of investigation. First, Green taxi cabs
(i.e., Boro taxis), which are able to serve the boroughs of New York and
drop passengers off in the Manhattan core, began operating in 2013. Note
that these cabs are unable to pick up trips in the south of Manhattan. We
thus exclude Green taxi cabs from the analysis. Note that the introduc-
tion of Green taxi cabs may also encourage taxi drivers to compete more
vigorously. Second, from September 4, 2012 through December 31, 2013 a
12The dummy for snow is equal to one if the conditions were noted as “Snow”, “HeavySnow” or“Light Snow” and zero otherwise. Major holidays include New Years Day, Mar-tin Luther King Day, Lincoln’s Birthday, President’s Day, Memorial Day, IndependenceDay, Labor Day, Columbus Day, Veterans Day, Thanksgiving and Christmas Day.
11

higher rate for fifth of a mile was enacted (Farber (2015)).
5 Results
5.1 Impact of Rain on Hourly Rides Post-Uber
We first estimate the effect of rain on taxi rides per hour. While our time
period and dependent variables are different than in Farber (2015) (2009-
2013), his results provide a useful benchmark. Farber (2015) finds that
there are approximately 7.1 percent less cabs in NYC when it is raining,
but that taxi utilization rates (i.e., time with passengers) in the rain are 4.8
percent higher, and trips take 2.4 percent less time. We then test whether
the effect of rain is similar for the number of Uber rides. If the demand is
unmet in rainy hours, then Uber’s surge pricing could encourage an increase
in supply.
Table 3 contains OLS estimates of equation (1) for Uber and taxi rides
over the April-September 2014 and January 2015 to December 2016 periods
(i.e., post-Uber period). The sample size is 21,423 observations (i.e., hours).
The dependent variables are, respectively, the log of the number of taxi
rides per hour in columns 1-3 and the log of the number of Uber rides per
hour in columns 4-6. We report standard errors clustered by hour of day
by day of week (168 clusters) in parentheses. What clearly emerges is that
rainy hours are associated with a small increase in taxi rides and a large
increase in Uber rides. In columns 1 and 4, we do not include any fixed
effects and find that Uber rides increase by approximately 14 percent while
taxi rides increase by only 1 percent. We include our set of time fixed
effects in columns 2 and 5. The number of Uber rides is about 19 percent
higher when it is raining and the estimate is significant at the 1 percent
level. On the other hand, the number of taxi rides per hour increases by
only 5 percent. In columns 3 and 6, we test the robustness of our estimates
by excluding nighttime observations. The estimates are slightly larger for
Uber rides, but the difference is not statistically significantly different from
the estimates including nighttime observations.
Table 4 provides additional robustness checks. The structure of the
table is similar to Table 3. We exclude respectively hours of heavy rain and
light freezing rain in columns 1 and 4 and the months of January, February
and March in columns 2 and 5. These specification checks confirm that
Uber rides increase by approximately 18 percent in rainy hours while taxi
rides increase by only 5 percent.
12
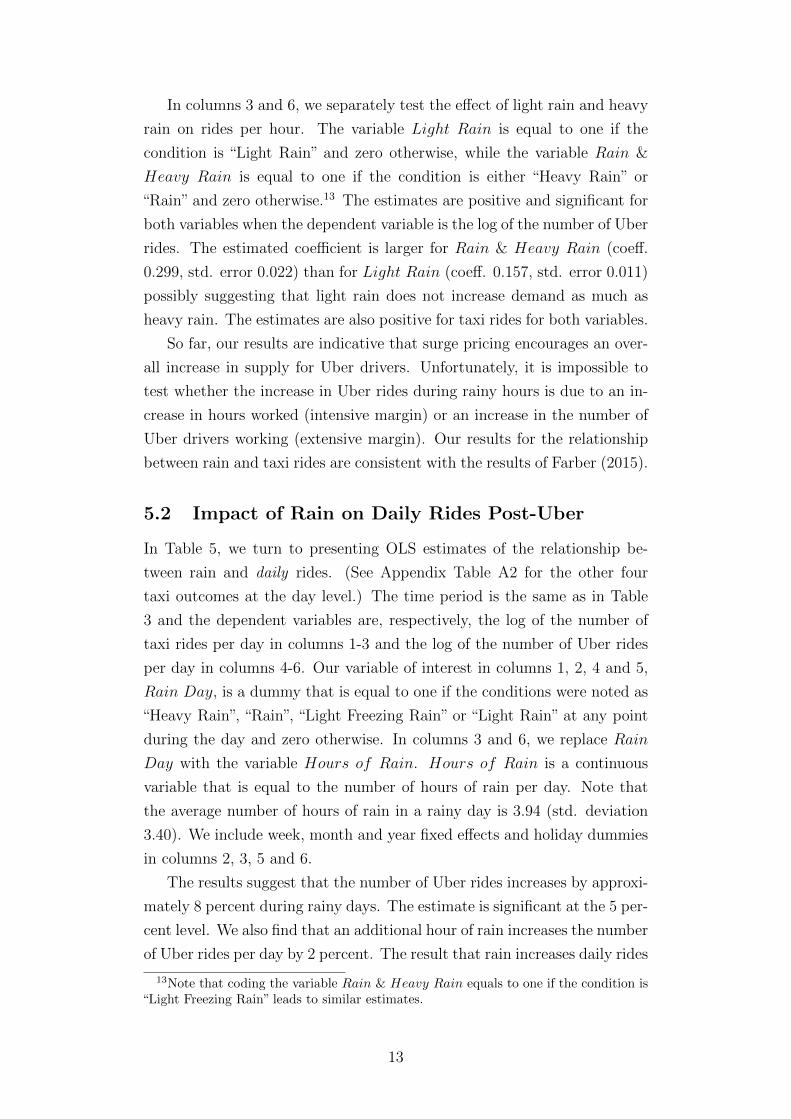
In columns 3 and 6, we separately test the effect of light rain and heavy
rain on rides per hour. The variable Light Rain is equal to one if the
condition is “Light Rain” and zero otherwise, while the variable Rain &
Heavy Rain is equal to one if the condition is either “Heavy Rain” or
“Rain” and zero otherwise.13 The estimates are positive and significant for
both variables when the dependent variable is the log of the number of Uber
rides. The estimated coefficient is larger for Rain & Heavy Rain (coeff.
0.299, std. error 0.022) than for Light Rain (coeff. 0.157, std. error 0.011)
possibly suggesting that light rain does not increase demand as much as
heavy rain. The estimates are also positive for taxi rides for both variables.
So far, our results are indicative that surge pricing encourages an over-
all increase in supply for Uber drivers. Unfortunately, it is impossible to
test whether the increase in Uber rides during rainy hours is due to an in-
crease in hours worked (intensive margin) or an increase in the number of
Uber drivers working (extensive margin). Our results for the relationship
between rain and taxi rides are consistent with the results of Farber (2015).
5.2 Impact of Rain on Daily Rides Post-Uber
In Table 5, we turn to presenting OLS estimates of the relationship be-
tween rain and daily rides. (See Appendix Table A2 for the other four
taxi outcomes at the day level.) The time period is the same as in Table
3 and the dependent variables are, respectively, the log of the number of
taxi rides per day in columns 1-3 and the log of the number of Uber rides
per day in columns 4-6. Our variable of interest in columns 1, 2, 4 and 5,
Rain Day, is a dummy that is equal to one if the conditions were noted as
“Heavy Rain”, “Rain”, “Light Freezing Rain” or “Light Rain” at any point
during the day and zero otherwise. In columns 3 and 6, we replace Rain
Day with the variable Hours of Rain. Hours of Rain is a continuous
variable that is equal to the number of hours of rain per day. Note that
the average number of hours of rain in a rainy day is 3.94 (std. deviation
3.40). We include week, month and year fixed effects and holiday dummies
in columns 2, 3, 5 and 6.
The results suggest that the number of Uber rides increases by approxi-
mately 8 percent during rainy days. The estimate is significant at the 5 per-
cent level. We also find that an additional hour of rain increases the number
of Uber rides per day by 2 percent. The result that rain increases daily rides
13Note that coding the variable Rain & Heavy Rain equals to one if the condition is“Light Freezing Rain” leads to similar estimates.
13

provides evidence that Uber drivers do not have reference-dependent pref-
erences in which workers have a reference level of daily income. Additional
information on utilization rates and length of trips is required to confirm
this result. There is also weak evidence that rain increases the number
of taxi rides per day. The estimates are small, positive and statistically
significant at the 10 percent level.
5.3 Impact of Uber on Taxi Rides and Income
In this subsection, we investigate whether the number of taxi rides, pas-
sengers and hourly fare income decreased after Uber entered the market.
We also test whether the estimated effects of rain on these outcomes are
similar in the pre-Uber era.
In Table 6, we test explicitly whether the number of taxi rides per
hour reacts more to rain in the pre-Uber period than in 2014-2016. (See
Appendix Table A3 for the analysis at the day level.) All columns include
our time fixed effects. Column 1 first shows the relationship between the
number of taxi rides and the variable PostUber. Column 1 shows that the
number of taxi rides per hour decreased by approximately 27 percent in
the post-Uber period. This result suggests that the market entry of Uber
led to a significant decrease in taxi rides.
Column 2 adds our dummy variable for rain, but without the interaction
with PostUber. Over the full period of study, the number of taxi rides in
rainy hours increases by roughly 5 percent. Column 3 presents estimates
of equation (2) where we include PostUber, the dummy for rain and the
interaction term.14 The interaction term, σ, is positive, but not statistically
significant at the 10 percent level. This means that the number of taxi rides
in rainy hours has not decreased by more than in non-rainy hours since Uber
entered the market. In column 4, we check the robustness of this result by
interacting our month fixed effects (δm) with the indicator PostUber. The
interaction term is negative and statistically insignificant.
Table 7 shows the effect of Uber on the other two taxi outcomes. The
dependent variables are respectively the natural log of the number of taxi
14The interaction of RAIN and PostUber shows the additional effect of Uber enteringthe market on the variation of taxi rides in rainy hours. A negative estimate couldsuggest that there is a substitution of taxi rides to Uber rides, and especially so whenit rains. A negative effect could also be indicative that that the disutility of driving inthe rain for taxi drivers has increased since May 2011. If the increasing number of Uberdrivers in rainy hours results in more competition to find passengers, this may decreasethe time spent with a passenger and decrease the willingness to work in the rain for taxidrivers.
14
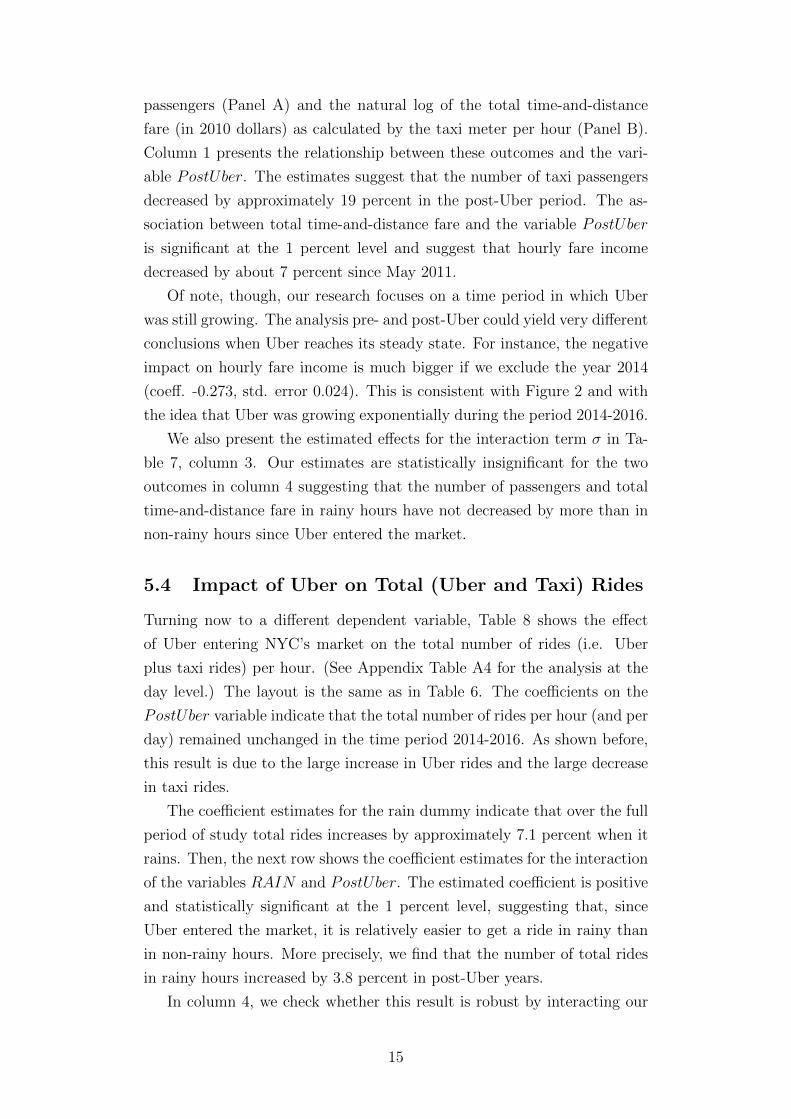
passengers (Panel A) and the natural log of the total time-and-distance
fare (in 2010 dollars) as calculated by the taxi meter per hour (Panel B).
Column 1 presents the relationship between these outcomes and the vari-
able PostUber. The estimates suggest that the number of taxi passengers
decreased by approximately 19 percent in the post-Uber period. The as-
sociation between total time-and-distance fare and the variable PostUber
is significant at the 1 percent level and suggest that hourly fare income
decreased by about 7 percent since May 2011.
Of note, though, our research focuses on a time period in which Uber
was still growing. The analysis pre- and post-Uber could yield very different
conclusions when Uber reaches its steady state. For instance, the negative
impact on hourly fare income is much bigger if we exclude the year 2014
(coeff. -0.273, std. error 0.024). This is consistent with Figure 2 and with
the idea that Uber was growing exponentially during the period 2014-2016.
We also present the estimated effects for the interaction term σ in Ta-
ble 7, column 3. Our estimates are statistically insignificant for the two
outcomes in column 4 suggesting that the number of passengers and total
time-and-distance fare in rainy hours have not decreased by more than in
non-rainy hours since Uber entered the market.
5.4 Impact of Uber on Total (Uber and Taxi) Rides
Turning now to a different dependent variable, Table 8 shows the effect
of Uber entering NYC’s market on the total number of rides (i.e. Uber
plus taxi rides) per hour. (See Appendix Table A4 for the analysis at the
day level.) The layout is the same as in Table 6. The coefficients on the
PostUber variable indicate that the total number of rides per hour (and per
day) remained unchanged in the time period 2014-2016. As shown before,
this result is due to the large increase in Uber rides and the large decrease
in taxi rides.
The coefficient estimates for the rain dummy indicate that over the full
period of study total rides increases by approximately 7.1 percent when it
rains. Then, the next row shows the coefficient estimates for the interaction
of the variables RAIN and PostUber. The estimated coefficient is positive
and statistically significant at the 1 percent level, suggesting that, since
Uber entered the market, it is relatively easier to get a ride in rainy than
in non-rainy hours. More precisely, we find that the number of total rides
in rainy hours increased by 3.8 percent in post-Uber years.
In column 4, we check whether this result is robust by interacting our
15
month dummies and the indicator PostUber. The coefficient of interest
remains positive and significant, suggesting that the result presented in
column 3 is robust. In column 5, we test whether the effect is significant for
interaction of the variables Light Rain and PostUber and Rain & Heavy
Rain and PostUber. The estimates are both positive and statistically
significant.
Our findings suggest that Uber has made it easier to get a ride in the
rain. The results are consistent with a substitution from taxi rides to Uber
rides and suggest that surge pricing encourages an increase in supply for
Uber drivers.
6 Conclusion
Using all Uber rides in NYC from April-September 2014 and January 2015
to December 2016, we investigated the effect of rain on the labor supply of
Uber drivers and found that the number of Uber rides per hour increases
by approximately 18 percent when it is raining. During the same time
period, the number of taxi rides per hour increases significantly less than
the number of Uber rides in rainy hours. We also provided evidence that
during rainy days, the number of rides increases by about 8 percent for
Uber. On the other hand, the number of taxi rides per day is only weakly
related to rain. That rain would have a different effect on taxi and Uber
rides is in line with a neoclassical intertemporal model of labor, given that
only Uber rides are subject to rain surge pricing.
Looking at the impact of Uber on taxis, we found that the number of
taxi rides per hour decreased by 27 percent after Uber entered the New
York market in May 2011. There was also a significant decrease in hourly
fare income and the number of passengers per hour. These results are
consistent with a substitution from taxis to Uber cars.
We then checked whether it was easier to find a ride in the rain after
the entry of Uber in May 2011. We first compared the total (Uber plus
taxi) number of rides in a post-Uber period to the number of taxi rides
in a pre-Uber period and found that the total number of rides remained
quite stable in post-Uber years. We then tested whether it was relatively
easier to get a ride in rainy than in non-rainy hours in 2014-2016. Our
results indicated that the total number of rides significantly increased in
rainy hours in comparison to non-rainy hours.
The results have important implications for the ongoing debate on
whether Uber is depressing taxi demand and whether Uber increases con-
16
sumers’ welfare. In particular, they highlight that Uber is substituting for
taxi cabs in NYC and that surge pricing seems effective in increasing labor
supply. Future research could study in more details whether Uber driver
labor supply is best characterized by standard neoclassical intertemporal
models of labor supply or models of reference-dependent preferences using
hourly data on occupancy and number of hacks.
17
References
Agarwal, S., Diao, M., Pan, J. and Sing, T. F.: 2015, Are Singaporean
Cabdrivers Target Earners? Mimeo: University of Singapore.
Ashenfelter, O., Doran, K. and Schaller, B.: 2010, A Shred of Credi-
ble Evidence on the Long-run Elasticity of Labour Supply, Economica
77(308), 637–650.
Blundell, R. and MaCurdy, T.: 1999, Labor Supply: A Review of Alter-
native Approaches, in O. Ashenfelter and D. Card (eds), Handbook of
Labor Economics, Vol. 3A, Amsterdam: North-Holland, pp. 1559–1695.
Buchholz, N.: 2016, Spatial Equilibrium, Search Frictions and Efficient
Regulation in the Taxi Industry. Mimeo: University of Texas at Austin.
Camerer, C., Babcock, L., Loewenstein, G. and Thaler, R.: 1997, Labor
Supply of New York City Cabdrivers: One Day at a Time, Quarterly
Journal of Economics 112(2), 407–441.
Chang, T. and Gross, T.: 2014, How Many Pears Would a Pear Packer Pack
if a Pear Packer Could Pack Pears at Quasi-Exogenously Varying Piece
Rates?, Journal of Economic Behavior & Organization 99(C), 1–17.
Chen, M. K., Chevalier, J. A., Rossi, P. E. and Oehlsen, E.: 2017, The
Value of Flexible Work: Evidence from Uber Drivers. NBER Working
Papers 23296.
Chen, M. K. and Sheldon, M.: 2015, Dynamic Pricing in a Labor Market:
Surge Pricing and Flexible Work on the Uber Platform. Mimeo: UCLA
Anderson School of Management.
Chou, Y. K.: 2002, Testing Alternative Models of Labour Supply: Evidence
from Taxi Drivers in Singapore, Singapore Economic Review 47(01), 17–
47.
Cohen, P., Hahn, R., Hall, J., Levitt, S. and Metcalfe, R.: 2016, Using Big
Data to Estimate Consumer Surplus: The Case of Uber. NBER Working
Papers 22627.
Connolly, M.: 2008, Here Comes the Rain Again: Weather and the
Intertemporal Substitution of Leisure, Journal of Labor Economics
26(1), 73–100.
18
Cramer, J. and Krueger, A. B.: 2016, Disruptive Change in the Taxi Busi-
ness: The Case of Uber, American Economic Review, Papers and Pro-
ceedings 106(5), 177–182.
Crawford, V. P. and Meng, J.: 2011, New York City Cab Drivers’ Labor
Supply Revisited: Reference-Dependent Preferences with Rational Ex-
pectations Targets for Hours and Income, American Economic Review
101(5), 1912–1932.
Doran, K.: 2014, Are Long-Term Wage Elasticities of Labor Supply More
Negative than Short-Term Ones?, Economics Letters 122(2), 208–210.
Farber, H. S.: 2005, Is Tomorrow Another Day? The Labor Supply of New
York City Cabdrivers, Journal of Political Economy 113(1), 46–82.
Farber, H. S.: 2008, Reference-Dependent Preferences and Labor Supply:
The Case of New York City Taxi Drivers, American Economic Review
98(3), 1069–1082.
Farber, H. S.: 2015, Why you Can’t Find a Taxi in the Rain and Other
Labor Supply Lessons from Cab Drivers, Quarterly Journal of Economics
130(4), 1975–2026.
Fehr, E. and Goette, L.: 2007, Do Workers Work More if Wages Are High?
Evidence from a Randomized Field Experiment, American Economic
Review 97(1), 298–317.
Haggag, K., McManus, B. and Paci, G.: 2017, Learning by Driving: Pro-
ductivity Improvements by New York City Taxi Drivers, American Eco-
nomic Journal: Applied Economics 9(1), 70–95.
Haggag, K. and Paci, G.: 2014, Default Tips, American Economic Journal:
Applied Economics 6(3), 1–19.
Hall, J. V. and Krueger, A. B.: 2016, An Analysis of the Labor Market
for Uber’s Driver-Partners in the United States. NBER Working Papers
22843.
Kahneman, D. and Tversky, A.: 1979, Prospect Theory: An Analysis of
Decision under Risk, Econometrica 47(2), 263–292.
Koszegi, B. and Rabin, M.: 2006, A Model of Reference-Dependent Pref-
erences, Quarterly Journal of Economics 121(4), 1133–1165.
19
Oettinger, G.: 1999, An Empirical Analysis of the Daily Labor Supply of
Stadium Vendors, Journal of Political Economy 107(2), 360–392.
Tversky, A. and Kahneman, D.: 1991, Loss Aversion in Riskless
Choice: A Reference-Dependent Model, Quarterly Journal of Economics
106(4), 1039–1061.
20
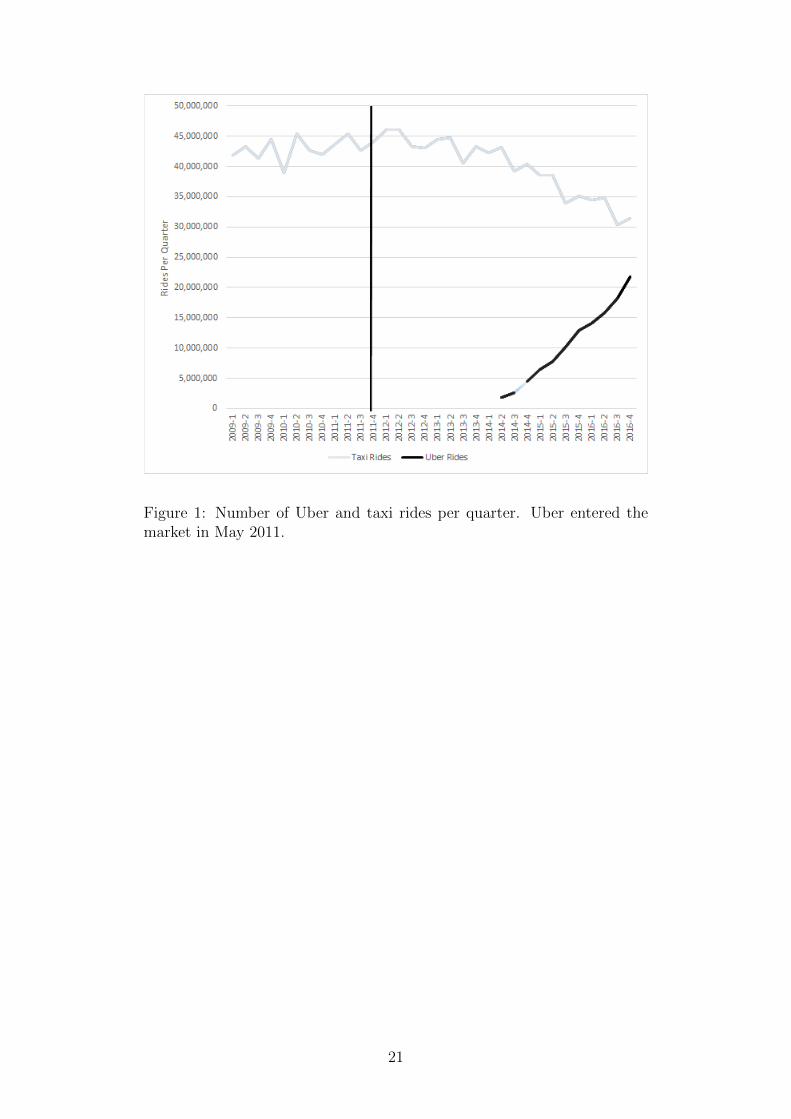
Figure 1: Number of Uber and taxi rides per quarter. Uber entered themarket in May 2011.
21

Figure 2: Number of number of taxi passengers and total time-and-distancefare (in 2010 dollars) as calculated by the taxi meter per quarter. Uberentered the market in May 2011.
22
7 Tables
Table 1: Summary Statistics (per Hour).
Mean Std. Dev. Max Min Obs.
Panel A
Uber Rides 5,076 4,052 28,133 18 21,423
Taxi Rides (Post-Uber) 16,439 7,447 36,655 257 21,423
Taxi Rides (Pre-Uber) 19,519 9,331 53,022 209 11,551
Panel B Dropped Night (1:00 - 5:00 AM)
Uber Rides 5,854 4,066 28,133 18 16,973
Taxi Rides (Post-Uber) 19,097 5,445 34,983 257 16,973
Taxi Rides (Pre-Uber) 23,065 7,042 53,022 426 7,437
Panel C Dropped Winter (January - March)
Uber Rides 5,156 4,242 28,133 43 17,125
Taxi Rides (Post-Uber) 16,316 7,341 36,655 1,371 17,125
Taxi Rides (Pre-Uber) 19,764 9,010 53,022 209 7,264
Note: Authors’ calculations. We report rides per hour. See Data section for more details. The time period pre-Uber isJanuary 2010-April 2011. The period post-Uber is April-September 2014 and 2015-2016. Panel B excludes from the samplerides from 1:00 to 5:00 AM. Panel C excludes from the sample the months of January, February and March.
23
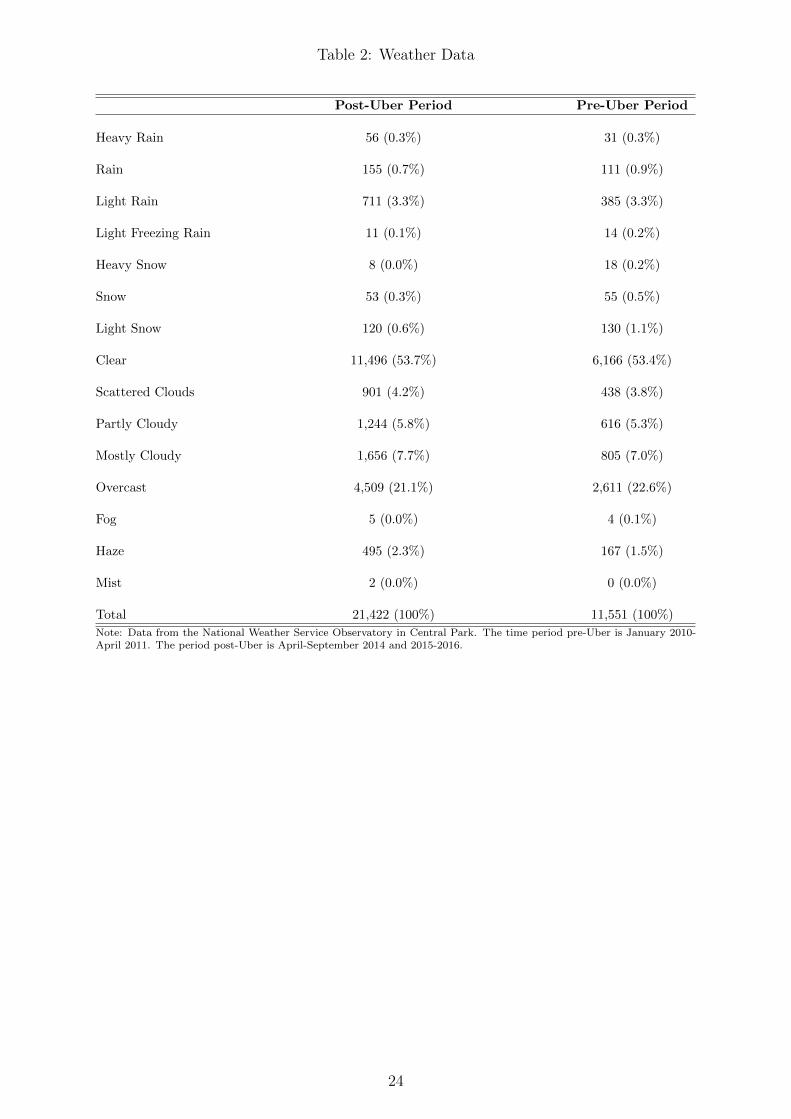
Table 2: Weather Data
Post-Uber Period Pre-Uber Period
Heavy Rain 56 (0.3%) 31 (0.3%)
Rain 155 (0.7%) 111 (0.9%)
Light Rain 711 (3.3%) 385 (3.3%)
Light Freezing Rain 11 (0.1%) 14 (0.2%)
Heavy Snow 8 (0.0%) 18 (0.2%)
Snow 53 (0.3%) 55 (0.5%)
Light Snow 120 (0.6%) 130 (1.1%)
Clear 11,496 (53.7%) 6,166 (53.4%)
Scattered Clouds 901 (4.2%) 438 (3.8%)
Partly Cloudy 1,244 (5.8%) 616 (5.3%)
Mostly Cloudy 1,656 (7.7%) 805 (7.0%)
Overcast 4,509 (21.1%) 2,611 (22.6%)
Fog 5 (0.0%) 4 (0.1%)
Haze 495 (2.3%) 167 (1.5%)
Mist 2 (0.0%) 0 (0.0%)
Total 21,422 (100%) 11,551 (100%)
Note: Data from the National Weather Service Observatory in Central Park. The time period pre-Uber is January 2010-April 2011. The period post-Uber is April-September 2014 and 2015-2016.
24
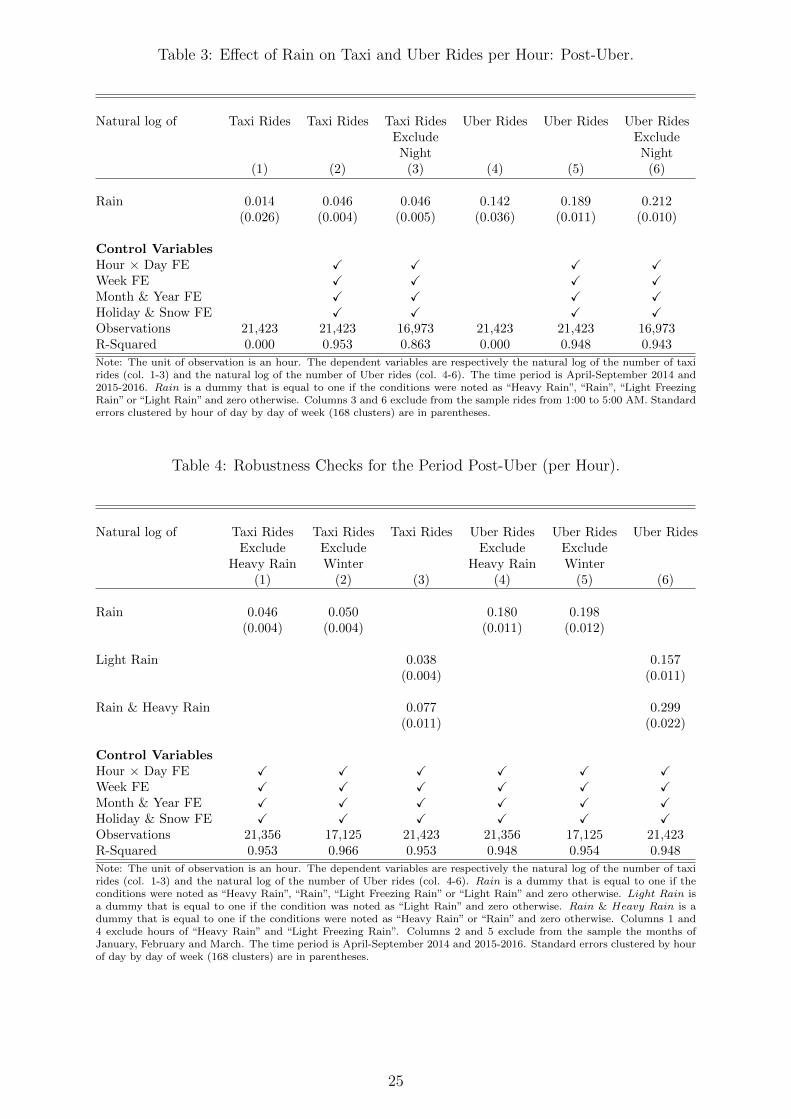
Table 3: Effect of Rain on Taxi and Uber Rides per Hour: Post-Uber.
Natural log of Taxi Rides Taxi Rides Taxi Rides Uber Rides Uber Rides Uber RidesExclude ExcludeNight Night
(1) (2) (3) (4) (5) (6)
Rain 0.014 0.046 0.046 0.142 0.189 0.212(0.026) (0.004) (0.005) (0.036) (0.011) (0.010)
Control VariablesHour × Day FE X X X XWeek FE X X X XMonth & Year FE X X X XHoliday & Snow FE X X X XObservations 21,423 21,423 16,973 21,423 21,423 16,973R-Squared 0.000 0.953 0.863 0.000 0.948 0.943
Note: The unit of observation is an hour. The dependent variables are respectively the natural log of the number of taxirides (col. 1-3) and the natural log of the number of Uber rides (col. 4-6). The time period is April-September 2014 and2015-2016. Rain is a dummy that is equal to one if the conditions were noted as “Heavy Rain”, “Rain”, “Light FreezingRain” or “Light Rain” and zero otherwise. Columns 3 and 6 exclude from the sample rides from 1:00 to 5:00 AM. Standarderrors clustered by hour of day by day of week (168 clusters) are in parentheses.
Table 4: Robustness Checks for the Period Post-Uber (per Hour).
Natural log of Taxi Rides Taxi Rides Taxi Rides Uber Rides Uber Rides Uber RidesExclude Exclude Exclude Exclude
Heavy Rain Winter Heavy Rain Winter(1) (2) (3) (4) (5) (6)
Rain 0.046 0.050 0.180 0.198(0.004) (0.004) (0.011) (0.012)
Light Rain 0.038 0.157(0.004) (0.011)
Rain & Heavy Rain 0.077 0.299(0.011) (0.022)
Control VariablesHour × Day FE X X X X X XWeek FE X X X X X XMonth & Year FE X X X X X XHoliday & Snow FE X X X X X XObservations 21,356 17,125 21,423 21,356 17,125 21,423R-Squared 0.953 0.966 0.953 0.948 0.954 0.948
Note: The unit of observation is an hour. The dependent variables are respectively the natural log of the number of taxirides (col. 1-3) and the natural log of the number of Uber rides (col. 4-6). Rain is a dummy that is equal to one if theconditions were noted as “Heavy Rain”, “Rain”, “Light Freezing Rain” or “Light Rain” and zero otherwise. Light Rain isa dummy that is equal to one if the condition was noted as “Light Rain” and zero otherwise. Rain & Heavy Rain is adummy that is equal to one if the conditions were noted as “Heavy Rain” or “Rain” and zero otherwise. Columns 1 and4 exclude hours of “Heavy Rain” and “Light Freezing Rain”. Columns 2 and 5 exclude from the sample the months ofJanuary, February and March. The time period is April-September 2014 and 2015-2016. Standard errors clustered by hourof day by day of week (168 clusters) are in parentheses.
25

Table 5: Effect of Rain on Taxi and Uber Rides per Day: Post-Uber.
Natural log of Taxi Rides Taxi Rides Taxi Rides Uber Rides Uber Rides Uber Rides(1) (2) (3) (4) (5) (6)
Rain Day 0.0227 0.0246 0.0201 0.0781(0.0151) (0.0130) (0.0767) (0.0310)
Hours of Rain 0.0033 0.0195(0.0019) (0.0034)
Control VariablesWeek FE X X X XMonth & Year FE X X X XHoliday & Snow FE X X X XObservations 789 789 789 789 789 789R-Squared 0.002 0.351 0.350 0.000 0.876 0.878
Note: The unit of observation is a day. The dependent variables are respectively the natural log of the number of taxirides (col. 1-3) and the natural log of the number of Uber rides (col. 4-6). The time period is April-September 2014and 2015-2016. Rain Day is a dummy that is equal to one if the conditions were noted as “Heavy Rain”, “Rain”, “LightFreezing Rain” or “Light Rain” at any point during the day and zero otherwise. Hours of Rain is a variable that is equalto the number of hours in which the conditions were noted as “Heavy Rain”, “Rain”, “Light Freezing Rain” or “Light Rain”.Robust standard errors are in parentheses.
26

Table 6: Effect of Rain on Taxi Rides per Hour: Pre- and Post-Uber.
Natural log of Taxi Rides Taxi Rides Taxi Rides Taxi Rides Taxi Rides(1) (2) (3) (4) (5)
Post-Uber -0.269 -0.268 -0.269 -0.436 -0.270(0.018) (0.018) (0.018) (0.018) (0.018)
Rain 0.048 0.039 0.048(0.004) (0.009) (0.009)
Rain × Post-Uber 0.014 0.005(0.010) (0.010)
Light Rain 0.031(0.010)
Light Rain 0.015× Post-Uber (0.011)
Rain & Heavy Rain 0.062(0.013)
Rain & Heavy Rain 0.019× Post-Uber (0.018)
Control VariablesHour × Day FE X X X X XWeek & Month FE X X X X XMonth × Post-Uber XHoliday & Snow FE X X X X XPopulation & UE Rate X X X X XObservations 32,974 32,974 32,974 32,974 32,974R-Squared 0.926 0.926 0.926 0.928 0.926
Note: The unit of observation is an hour. The dependent variable is the natural log of the number of taxi rides. Thetime period is January 2010-April 2011, April-September 2014 and 2015-2016. Rain is a dummy that is equal to one ifthe conditions were noted as “Heavy Rain”, “Rain”, “Light Freezing Rain” or “Light Rain” and zero otherwise. Light Rainis a dummy that is equal to one if the condition was noted as “Light Rain” and zero otherwise. Rain & Heavy Rain isa dummy that is equal to one if the conditions were noted as “Heavy Rain” or “Rain” and zero otherwise. Post Uber isa dummy that is equal to one for the period April-September 2014 and 2015-2016 and zero otherwise. Standard errorsclustered by hour of day by day of week (168 clusters) are in parentheses.
27
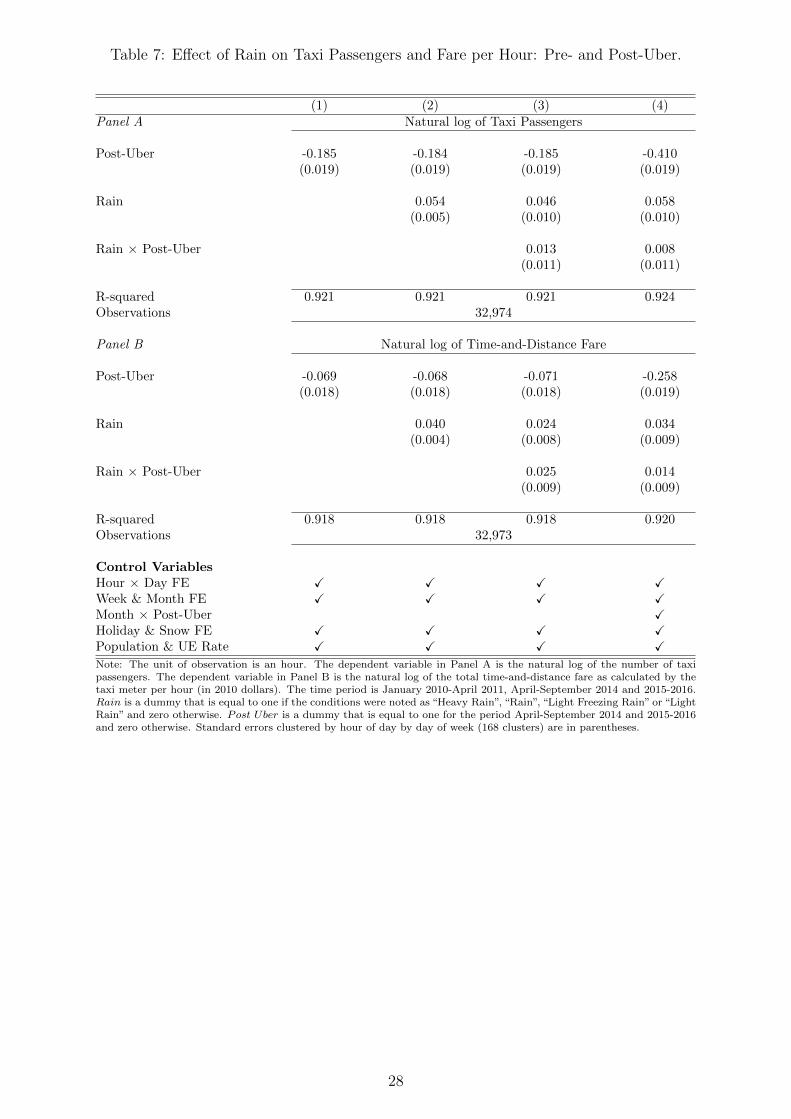
Table 7: Effect of Rain on Taxi Passengers and Fare per Hour: Pre- and Post-Uber.
(1) (2) (3) (4)Panel A Natural log of Taxi Passengers
Post-Uber -0.185 -0.184 -0.185 -0.410(0.019) (0.019) (0.019) (0.019)
Rain 0.054 0.046 0.058(0.005) (0.010) (0.010)
Rain × Post-Uber 0.013 0.008(0.011) (0.011)
R-squared 0.921 0.921 0.921 0.924Observations 32,974
Panel B Natural log of Time-and-Distance Fare
Post-Uber -0.069 -0.068 -0.071 -0.258(0.018) (0.018) (0.018) (0.019)
Rain 0.040 0.024 0.034(0.004) (0.008) (0.009)
Rain × Post-Uber 0.025 0.014(0.009) (0.009)
R-squared 0.918 0.918 0.918 0.920Observations 32,973
Control VariablesHour × Day FE X X X XWeek & Month FE X X X XMonth × Post-Uber XHoliday & Snow FE X X X XPopulation & UE Rate X X X XNote: The unit of observation is an hour. The dependent variable in Panel A is the natural log of the number of taxipassengers. The dependent variable in Panel B is the natural log of the total time-and-distance fare as calculated by thetaxi meter per hour (in 2010 dollars). The time period is January 2010-April 2011, April-September 2014 and 2015-2016.Rain is a dummy that is equal to one if the conditions were noted as “Heavy Rain”, “Rain”, “Light Freezing Rain” or “LightRain” and zero otherwise. Post Uber is a dummy that is equal to one for the period April-September 2014 and 2015-2016and zero otherwise. Standard errors clustered by hour of day by day of week (168 clusters) are in parentheses.
28
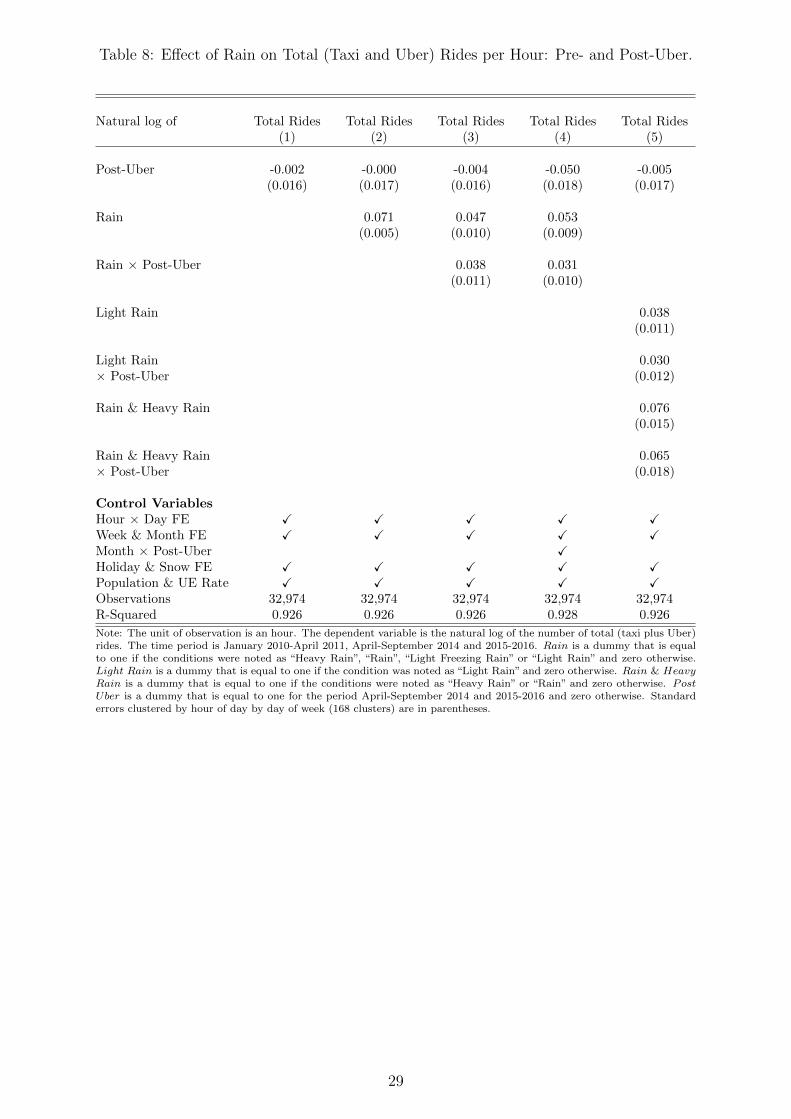
Table 8: Effect of Rain on Total (Taxi and Uber) Rides per Hour: Pre- and Post-Uber.
Natural log of Total Rides Total Rides Total Rides Total Rides Total Rides(1) (2) (3) (4) (5)
Post-Uber -0.002 -0.000 -0.004 -0.050 -0.005(0.016) (0.017) (0.016) (0.018) (0.017)
Rain 0.071 0.047 0.053(0.005) (0.010) (0.009)
Rain × Post-Uber 0.038 0.031(0.011) (0.010)
Light Rain 0.038(0.011)
Light Rain 0.030× Post-Uber (0.012)
Rain & Heavy Rain 0.076(0.015)
Rain & Heavy Rain 0.065× Post-Uber (0.018)
Control VariablesHour × Day FE X X X X XWeek & Month FE X X X X XMonth × Post-Uber XHoliday & Snow FE X X X X XPopulation & UE Rate X X X X XObservations 32,974 32,974 32,974 32,974 32,974R-Squared 0.926 0.926 0.926 0.928 0.926
Note: The unit of observation is an hour. The dependent variable is the natural log of the number of total (taxi plus Uber)rides. The time period is January 2010-April 2011, April-September 2014 and 2015-2016. Rain is a dummy that is equalto one if the conditions were noted as “Heavy Rain”, “Rain”, “Light Freezing Rain” or “Light Rain” and zero otherwise.Light Rain is a dummy that is equal to one if the condition was noted as “Light Rain” and zero otherwise. Rain & HeavyRain is a dummy that is equal to one if the conditions were noted as “Heavy Rain” or “Rain” and zero otherwise. PostUber is a dummy that is equal to one for the period April-September 2014 and 2015-2016 and zero otherwise. Standarderrors clustered by hour of day by day of week (168 clusters) are in parentheses.
29
Appendix (NOT FOR PUBLICATION)
Figure 3: Fraction of Uber rides per hour of day. The time period is April-September2014 and January 2015 to December 2016.
Figure 4: Fraction of taxi rides per hour of day. The time period is April-September 2014and January 2015 to December 2016 (post-Uber).
30
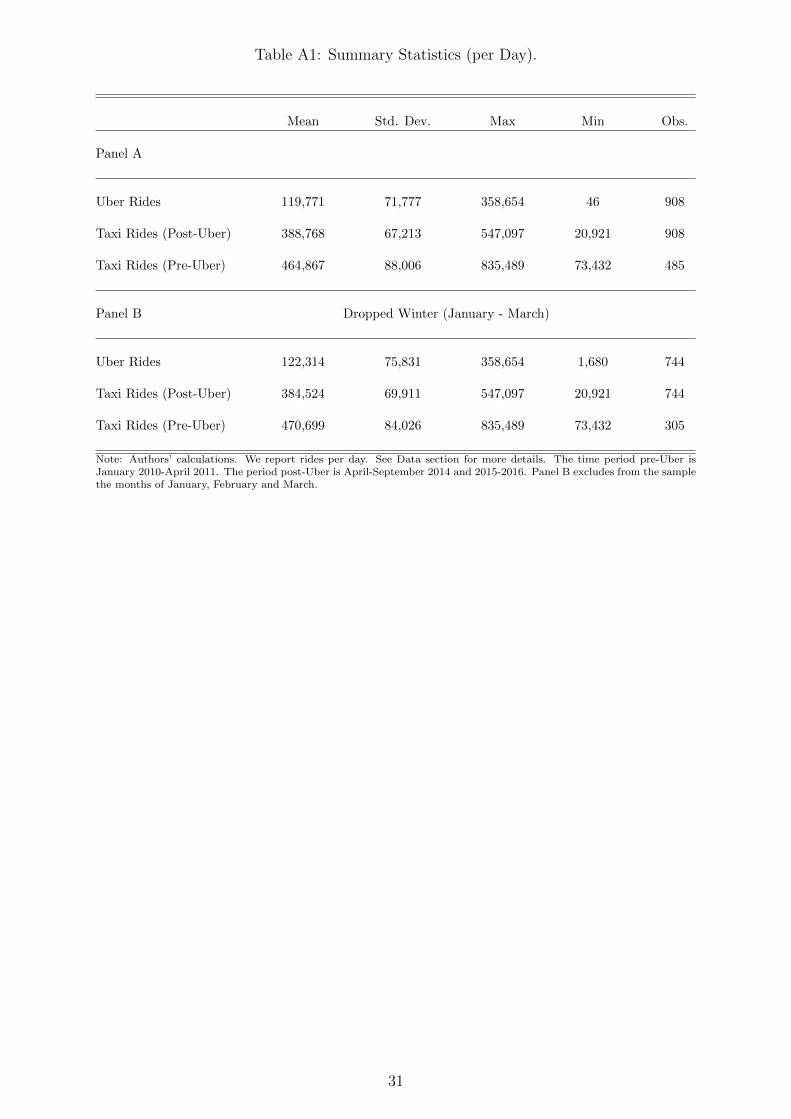
Table A1: Summary Statistics (per Day).
Mean Std. Dev. Max Min Obs.
Panel A
Uber Rides 119,771 71,777 358,654 46 908
Taxi Rides (Post-Uber) 388,768 67,213 547,097 20,921 908
Taxi Rides (Pre-Uber) 464,867 88,006 835,489 73,432 485
Panel B Dropped Winter (January - March)
Uber Rides 122,314 75,831 358,654 1,680 744
Taxi Rides (Post-Uber) 384,524 69,911 547,097 20,921 744
Taxi Rides (Pre-Uber) 470,699 84,026 835,489 73,432 305
Note: Authors’ calculations. We report rides per day. See Data section for more details. The time period pre-Uber isJanuary 2010-April 2011. The period post-Uber is April-September 2014 and 2015-2016. Panel B excludes from the samplethe months of January, February and March.
31

Table A2: Effect of Rain on Taxi Passengers and Fare per Day: Post-Uber.
(1) (2) (3)Panel A Natural log of Taxi Passengers
Rain Day 0.0247 0.0256(0.0154) (0.0133)
Hours of Rain 0.0032(0.0020)
R-squared 0.002 0.365 0.364Observations 789
Panel B Natural log of Time-and-Distance Fare
Rain Day 0.0197 0.0211(0.0158) (0.0135)
Hours of Rain 0.0030(0.0019)
R-squared 0.001 0.343 0.343Observations 789
Control VariablesWeek FE X XMonth & Year FE X XHoliday & Snow FE X XNote: The unit of observation is a day. The dependent variable in Panel A is the natural log of the number of taxipassengers. The dependent variable in Panel B the natural log of the total time-and-distance fare (in 2010 dollars) ascalculated by the taxi meter per hour. The time period is April-September 2014 and 2015-2016. Rain Day is a dummythat is equal to one if the conditions were noted as “Heavy Rain”, “Rain”, “Light Freezing Rain” or “Light Rain” at anypoint during the day and zero otherwise. Hours of Rain is a variable that is equal to the number of hours in whichthe conditions were noted as “Heavy Rain”, “Rain”, “Light Freezing Rain” or “Light Rain”. Robust standard errors are inparentheses.
32
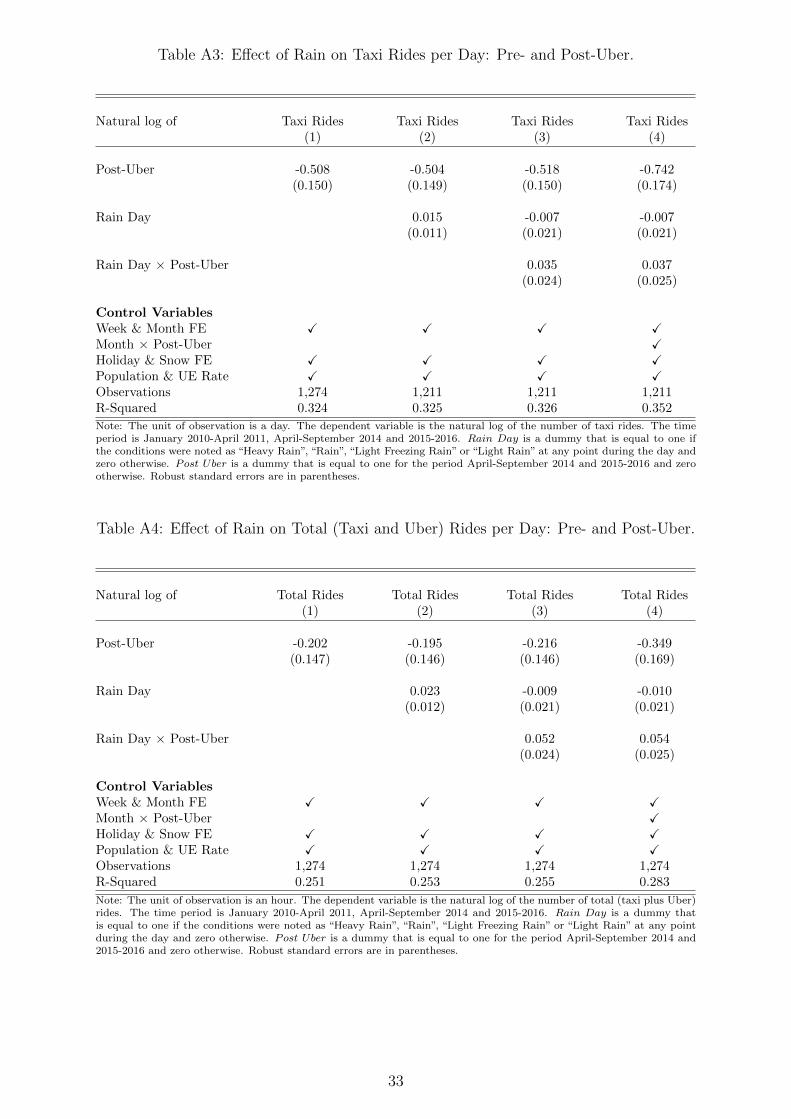
Table A3: Effect of Rain on Taxi Rides per Day: Pre- and Post-Uber.
Natural log of Taxi Rides Taxi Rides Taxi Rides Taxi Rides(1) (2) (3) (4)
Post-Uber -0.508 -0.504 -0.518 -0.742(0.150) (0.149) (0.150) (0.174)
Rain Day 0.015 -0.007 -0.007(0.011) (0.021) (0.021)
Rain Day × Post-Uber 0.035 0.037(0.024) (0.025)
Control VariablesWeek & Month FE X X X XMonth × Post-Uber XHoliday & Snow FE X X X XPopulation & UE Rate X X X XObservations 1,274 1,211 1,211 1,211R-Squared 0.324 0.325 0.326 0.352
Note: The unit of observation is a day. The dependent variable is the natural log of the number of taxi rides. The timeperiod is January 2010-April 2011, April-September 2014 and 2015-2016. Rain Day is a dummy that is equal to one ifthe conditions were noted as “Heavy Rain”, “Rain”, “Light Freezing Rain” or “Light Rain” at any point during the day andzero otherwise. Post Uber is a dummy that is equal to one for the period April-September 2014 and 2015-2016 and zerootherwise. Robust standard errors are in parentheses.
Table A4: Effect of Rain on Total (Taxi and Uber) Rides per Day: Pre- and Post-Uber.
Natural log of Total Rides Total Rides Total Rides Total Rides(1) (2) (3) (4)
Post-Uber -0.202 -0.195 -0.216 -0.349(0.147) (0.146) (0.146) (0.169)
Rain Day 0.023 -0.009 -0.010(0.012) (0.021) (0.021)
Rain Day × Post-Uber 0.052 0.054(0.024) (0.025)
Control VariablesWeek & Month FE X X X XMonth × Post-Uber XHoliday & Snow FE X X X XPopulation & UE Rate X X X XObservations 1,274 1,274 1,274 1,274R-Squared 0.251 0.253 0.255 0.283
Note: The unit of observation is an hour. The dependent variable is the natural log of the number of total (taxi plus Uber)rides. The time period is January 2010-April 2011, April-September 2014 and 2015-2016. Rain Day is a dummy thatis equal to one if the conditions were noted as “Heavy Rain”, “Rain”, “Light Freezing Rain” or “Light Rain” at any pointduring the day and zero otherwise. Post Uber is a dummy that is equal to one for the period April-September 2014 and2015-2016 and zero otherwise. Robust standard errors are in parentheses.
33