harmonizing circumpolar monitoring of arctic fox: … harmonizing circumpolar monitoring of arctic...
TRANSCRIPT
Polar Research
ISSN: (Print) 1751-8369 (Online) Journal homepage: http://www.tandfonline.com/loi/zpor20
Harmonizing circumpolar monitoring of Arcticfox: benefits, opportunities, challenges andrecommendations
Dominique Berteaux, Anne-Mathilde Thierry, Ray Alisauskas, AndersAngerbjörn, Eric Buchel, Liliya Doronina, Dorothee Ehrich, Nina E. Eide,Rasmus Erlandsson, Øystein Flagstad, Eva Fuglei, Olivier Gilg , MikhailGoltsman, Heikki Henttonen, Rolf A. Ims, Siw T. Killengreen, AlexanderKondratyev, Elena Kruchenkova, Helmut Kruckenberg, Olga Kulikova, ArildLanda, Johannes Lang, Irina Menyushina, Julia Mikhnevich, Jukka Niemimaa,Karin Norén, Tuomo Ollila, Nikita Ovsyanikov, Liya Pokrovskaya, IvanPokrovsky, Anna Rodnikova, James D. Roth, Brigitte Sabard, Gustaf Samelius,Niels M. Schmidt , Benoit Sittler, Aleksandr A. Sokolov, Natalya A. Sokolova,Alice Stickney, Ester Rut Unnsteinsdóttir & Paula A. White
To cite this article: Dominique Berteaux, Anne-Mathilde Thierry, Ray Alisauskas, AndersAngerbjörn, Eric Buchel, Liliya Doronina, Dorothee Ehrich, Nina E. Eide, Rasmus Erlandsson,Øystein Flagstad, Eva Fuglei, Olivier Gilg , Mikhail Goltsman, Heikki Henttonen, Rolf A. Ims, Siw T.Killengreen, Alexander Kondratyev, Elena Kruchenkova, Helmut Kruckenberg, Olga Kulikova, ArildLanda, Johannes Lang, Irina Menyushina, Julia Mikhnevich, Jukka Niemimaa, Karin Norén, TuomoOllila, Nikita Ovsyanikov, Liya Pokrovskaya, Ivan Pokrovsky, Anna Rodnikova, James D. Roth,Brigitte Sabard, Gustaf Samelius, Niels M. Schmidt , Benoit Sittler, Aleksandr A. Sokolov, NatalyaA. Sokolova, Alice Stickney, Ester Rut Unnsteinsdóttir & Paula A. White (2017) Harmonizingcircumpolar monitoring of Arctic fox: benefits, opportunities, challenges and recommendations,Polar Research, 36:sup1, 2, DOI: 10.1080/17518369.2017.1319602
To link to this article: http://dx.doi.org/10.1080/17518369.2017.1319602
© 2017 The Author(s). Published by InformaUK Limited, trading as Taylor & FrancisGroup.
View supplementary material
Published online: 16 Aug 2017.
Submit your article to this journal
Full Terms & Conditions of access and use can be found athttp://www.tandfonline.com/action/journalInformation?journalCode=zpor20
Download by: [Universite du Quebec a Rimousk] Date: 18 August 2017, At: 11:37
Article views: 15
View related articles
View Crossmark data
Citing articles: 4 View citing articles
Dow
nloa
ded
by [
Uni
vers
ite d
u Q
uebe
c a
Rim
ousk
] at
11:
37 1
8 A
ugus
t 201
7
PERSPECTIVE
Harmonizing circumpolar monitoring of Arctic fox: benefits, opportunities,challenges and recommendationsDominique Berteauxa, Anne-Mathilde Thierrya,b, Ray Alisauskasc, Anders Angerbjörnd, Eric Buchele,Liliya Doroninaf,g, Dorothee Ehrichh, Nina E. Eideb, Rasmus Erlandssond, Øystein Flagstadb, Eva Fugleii,Olivier Gilg e,j, Mikhail Goltsmang, Heikki Henttonenk, Rolf A. Imsh, Siw T. Killengreenh,Alexander Kondratyevl, Elena Kruchenkovag, Helmut Kruckenbergm, Olga Kulikovan, Arild Landab,Johannes Lange,o, Irina Menyushinap, Julia Mikhnevichg, Jukka Niemimaak, Karin Norénd, Tuomo Ollilaq,Nikita Ovsyanikovp, Liya Pokrovskayag, Ivan Pokrovskyr, Anna Rodnikovag, James D. Roths, Brigitte Sabarde,Gustaf Sameliust, Niels M. Schmidt u, Benoit Sittlere,v, Aleksandr A. Sokolovn,w, Natalya A. Sokolovan,w,Alice Stickneyx, Ester Rut Unnsteinsdóttiry & Paula A. Whitez
aCanada Research Chair on Northern Biodiversity and Centre for Northern Studies, Université du Québec à Rimouski, Rimouski, Québec,Canada; bNorwegian Institute for Nature Research, Trondheim, Norway; cPrairie and Northern Wildlife Research Centre, EnvironmentCanada, Saskatoon, Saskatchewan, Canada; dDepartment of Zoology, Stockholm University, Stockholm, Sweden; eArctic EcologyResearch Group, Francheville, France; fInstitute of Experimental Pathology, University of Münster, Münster, Germany; gDepartment ofVertebrate Zoology, Faculty of Biology, Lomonosov Moscow State University, Moscow, Russia; hDepartment of Arctic and MarineBiology, University of Tromsø, Tromsø, Norway; iNorwegian Polar Institute, Fram Centre, Tromsø, Norway; jLaboratoire deBiogéosciences, Université de Bourgogne, Dijon, France; kNatural Resources Institute Finland, Vantaa, Finland; lInstitute of BiologicalProblems of the North, Far-East Branch Russian Academy of Sciences, Magadan, Russia; mInstitute for Waterbird and Wetlands Research,Verden (Aller), Germany; nArctic Research Station of Institute of Plant and Animal Ecology, Ural Branch of Russian Academy of Sciences,Yamal, Russia; oWorking Group for Wildlife Biology, Justus Liebig University Giessen, Giessen, Germany; pMoscow, Russia; qParks andWildlife, Metsähallitus, Rovaniemi, Finland; rDepartment of Migration and Immuno-ecology, Max Planck Institute for Ornithology,Radolfzell, Germany; sDepartment of Biological Sciences, University of Manitoba, Winnipeg, Manitoba, Canada; tGrimsö WildlifeResearch Station, Swedish University of Agricultural Sciences, Riddarhyttan, Sweden; uArctic Research Centre, Aarhus University,Roskilde, Denmark; vChair for Landscape Management, University of Freiburg, Freiburg, Germany; wScience Center for Arctic Studies,State Organization of Yamal-Nenets Autonomous District, Salekhard, Russia; xEster, AK, USA; yThe Icelandic Institute of Natural History,Garðabær, Iceland; zCenter for Tropical Research, Institute of the Environment and Sustainability, University of California Los Angeles,Los Angeles, CA, USA
ABSTRACTThe biodiversity working group of the Arctic Council has developed pan-Arctic biodiversitymonitoring plans to improve our ability to detect, understand and report on long-termchange in Arctic biodiversity. The Arctic fox (Vulpes lagopus) was identified as a target offuture monitoring because of its circumpolar distribution, ecological importance and relianceon Arctic ecosystems. We provide the first exhaustive survey of contemporary Arctic foxmonitoring programmes, describing 34 projects located in eight countries. Monitored popu-lations covered equally the four climate zones of the species’ distribution, and there werelarge differences between populations in long-term trends, multi-annual fluctuations, dietcomposition, degree of competition with red fox and human interferences. Den density,number of active dens, number of breeding dens and litter size were assessed in almost allpopulations, while projects varied greatly with respect to monitoring of other variablesindicative of population status, ecosystem state or ecosystem function. We review thebenefits, opportunities and challenges to increased integration of monitoring projects. Weargue that better harmonizing protocols of data collection and data management wouldallow new questions to be addressed while adding tremendous value to individual projects.However, despite many opportunities, challenges remain. We offer six recommendations thatrepresent decisive progress toward a better integration of Arctic fox monitoring projects.Further, our work serves as a template that can be used to integrate monitoring efforts ofother species, thereby providing a key step for future assessments of global biodiversity.
KEYWORDSAlopex lagopus; Arcticecosystems; biodiversityassessment; biodiversityindicator; data management;protocol harmonization
ABBREVIATIONSCAFF: Conservation of ArcticFlora and Fauna; IUCN:International Union forConservation of Nature
The Arctic is in a state of rapid environmental transi-tions, with a plethora of derived ecological effects (Postet al. 2009). In this context, pan-Arctic biodiversitymonitoring is critical to detect, understand and reporton biodiversity changes (Meltofte 2013). CAFF, the
biodiversity working group of the Arctic Council, hasdeveloped circumpolar biodiversity monitoring plansfor the marine, terrestrial, freshwater and coastal eco-systems (Petersen et al. 2004; Barry et al. 2013).However, successful implementation of these plans
CONTACT Dominique Berteaux [email protected] Canada Research Chair on Northern Biodiversity and Centre for NorthernStudies, Université du Québec à Rimouski, 300 Allée des Ursulines, Rimouski, Québec G5L 3A1, Canada.
Supplemental data for this article can be accessed here.
POLAR RESEARCH, 2017VOL. 36, 2https://doi.org/10.1080/17518369.2017.1319602
© 2017 The Author(s). Published by Informa UK Limited, trading as Taylor & Francis Group.This is an Open Access article distributed under the terms of the Creative Commons Attribution-NonCommercial License (http://creativecommons.org/licenses/by-nc/4.0/),which permits unrestricted non-commercial use, distribution, and reproduction in any medium, provided the original work is properly cited.
Dow
nloa
ded
by [
Uni
vers
ite d
u Q
uebe
c a
Rim
ousk
] at
11:
37 1
8 A
ugus
t 201
7
will entail overcoming considerable challenges due tothe fragmentary and incomplete monitoring capacity inthe Arctic. In particular, most Arctic biodiversity initia-tives are national or sub-national in scope, while thefield protocols and data reporting and archiving techni-ques of existing monitoring programmes are heteroge-neous. For these reasons, there is a need to establishcircumpolar connections among teams monitoringsimilar ecological indicators, and to harmonizemethodsas much as possible to enable robust, integrated pan-Arctic data analysis and reporting.
Petersen et al. (2004) identified 11 important cri-teria for selecting possible ecological indicators in theArctic region. Meeting the following criteria, theArctic fox (Vulpes lagopus) was identified as onetarget species for future monitoring (Christensenet al. 2013): generalist feeding regime both potentiallyimpacting and reflecting the state of the tundra eco-system (Ehrich et al. 2015); circumpolar distributionand reliance on Arctic ecosystems (Angerbjörn &Tannerfeldt 2014); endangered status in parts of itsrange (e.g., IUCN’s Red List in Europe; Temple &Terry 2007); flagship status for measuring climatechange (IUCN 2009); economic, scientific or culturalimportance (Gagnon & Berteaux 2009); the availabil-ity of historical data on the species (e.g., Hersteinsson& Macdonald 1992; Gallant et al. 2012); and theexistence of national monitoring programmes alreadyin place (Herfindal et al. 2010).
The objective of individual Arctic fox monitor-ing programmes can be to support advances inbasic ecological science and/or to address specificconservation concerns, e.g., evaluation of popula-tion status. A healthy Arctic fox population mightalso require a monitoring programme for manage-ment of hunting and trapping or to evaluate exploi-tation of resources affecting the species. Dependingon the objectives, the focus of the monitoring maybe at the ecosystem, species, population or indivi-dual scale.
Our goal is to survey contemporary Arctic foxmonitoring projects and reflect on the harmoniza-tion of their methods and databases. To achievethis goal, we identified four objectives: (1) to sur-vey and describe all contemporary Arctic foxmonitoring projects; (2) to summarize the benefitsthat could be derived through better integration ofthese projects; (3) to describe the opportunities forsuch integration; and (4) to identify the challengesof harmonizing methods and databases. We con-clude with recommendations to better integratecurrent and future Arctic fox monitoring pro-grammes. Our approach may serve as a templatefor improved integration of data collection forother species or other indicators of biodiversity.
Methods
We define Arctic fox monitoring as the process ofgathering information about some variables describ-ing an Arctic fox population and its ecological con-text, at different points in time, to assess the status ofthe population and draw inferences about its changesover time (adapted from Yoccoz et al. 2001). Wefollow Krebs (2008) in defining a population as agroup of individuals occupying a particular space(here, a study area) at a particular time (here, amonitoring period).
An informal circumpolar network of Arctic foxbiologists was established through four internationalconferences in Arctic fox biology that took place inSweden (1991 and 2009), the UK (2001) and Iceland(2013), as well as through the 2007–09 InternationalPolar Year project Arctic Wildlife ObservatoriesLinking Vulnerable Ecosystems (Gauthier &Berteaux 2011). Within this informal network, 25scientists from 10 countries were initially contactedin 2015 through a Google Form survey to collectmetadata about contemporary Arctic fox monitoringprojects. Sixteen additional scientists (for a total of41) were invited to participate as active team mem-bers of existing projects or when new monitoringefforts were identified. The survey also polled respon-dents regarding the benefits, opportunities and chal-lenges to integrating Arctic fox monitoring at thecircumpolar scale. Data categories and responseswere refined when compiling the current synthesis.
Whereas the monitoring of some species is struc-tured according to distinct herds (caribou [Rangifertarandus]; Russell & Kofinas 2004), managementunits (polar bears [Ursus maritimus]; Vongraven &Peacock 2011) or breeding colonies (murres [Uriaspp.]; CAFF 1996), no such units are used for Arcticfoxes. The global population has weak genetic struc-ture (Dalén et al. 2005; Carmichael et al. 2007; Geffenet al. 2007; Norén et al. 2011), with the exception ofthe diverged Commander Islands populations(Ploshnitsa et al. 2012; Ploshnitsa et al. 2013). Nomanagement regime has identified distinct popula-tion clusters at the global scale. Arctic fox monitoringactivities are therefore best described using the con-cept of “monitoring site”, where a group of indivi-duals is monitored over multiple years for research ormanagement objectives. A monitoring site usuallycorresponds to a well-defined study area in whichfox dens, which are long-lasting reproductive struc-tures used repeatedly by territorial individuals(Frafjord 2003; Tannerfeldt et al. 2003; Szor et al.2008), are visited by scientists every year to assessthe presence and reproduction of foxes.
Most Arctic fox monitoring sites were easily dis-tinguished from each other as they corresponded to
2 D. BERTEAUX ET AL.
Dow
nloa
ded
by [
Uni
vers
ite d
u Q
uebe
c a
Rim
ousk
] at
11:
37 1
8 A
ugus
t 201
7
discrete study areas used by independent teams ofscientists. In Fennoscandia, however, Arctic fox dis-tribution is fragmented into >25 units that sometimeshave unclear boundaries between them (Herfindalet al. 2010). Monitoring has been conducted by sev-eral teams with various objectives and levels of effort,and monitored units have been under various man-agement regimes. We therefore identified a posteriori12 monitoring sites for Fennoscandia, each beingrelatively homogeneous in terms of monitoring his-tory, scientific objectives and management regime.This allowed effective comparison of Arctic fox mon-itoring activities in Fennoscandia with those fromother parts of the world.
The large-scale monitoring performed in Icelandrepresented a special case because it relied mostly onfox hunting at dens to reduce economic losses asso-ciated with sheep (Ovis aries) husbandry and harvest-ing of down from eider (Somateria mollissima)colonies (Hersteinsson 1992). We included Icelandin our survey despite this methodological singularity,although we excluded Icelandic data from someanalyses.
We use the terms “harmonization” and “standardiza-tion” as synonyms throughout the paper. All summarystatistics are presented as mean ± standard deviation.
Description of Arctic fox monitoring projects
Spatial distribution and field effort
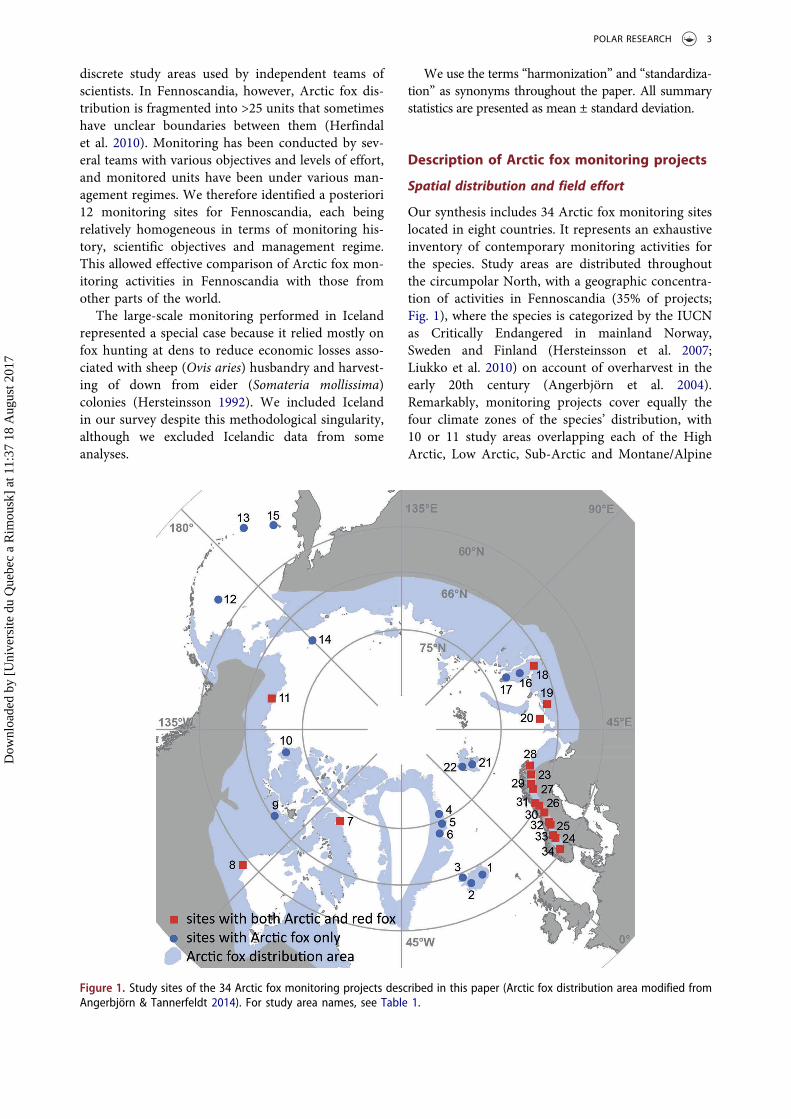
Our synthesis includes 34 Arctic fox monitoring siteslocated in eight countries. It represents an exhaustiveinventory of contemporary monitoring activities forthe species. Study areas are distributed throughoutthe circumpolar North, with a geographic concentra-tion of activities in Fennoscandia (35% of projects;Fig. 1), where the species is categorized by the IUCNas Critically Endangered in mainland Norway,Sweden and Finland (Hersteinsson et al. 2007;Liukko et al. 2010) on account of overharvest in theearly 20th century (Angerbjörn et al. 2004).Remarkably, monitoring projects cover equally thefour climate zones of the species’ distribution, with10 or 11 study areas overlapping each of the HighArctic, Low Arctic, Sub-Arctic and Montane/Alpine
Figure 1. Study sites of the 34 Arctic fox monitoring projects described in this paper (Arctic fox distribution area modified fromAngerbjörn & Tannerfeldt 2014). For study area names, see Table 1.
POLAR RESEARCH 3
Dow
nloa
ded
by [
Uni
vers
ite d
u Q
uebe
c a
Rim
ousk
] at
11:
37 1
8 A
ugus
t 201
7
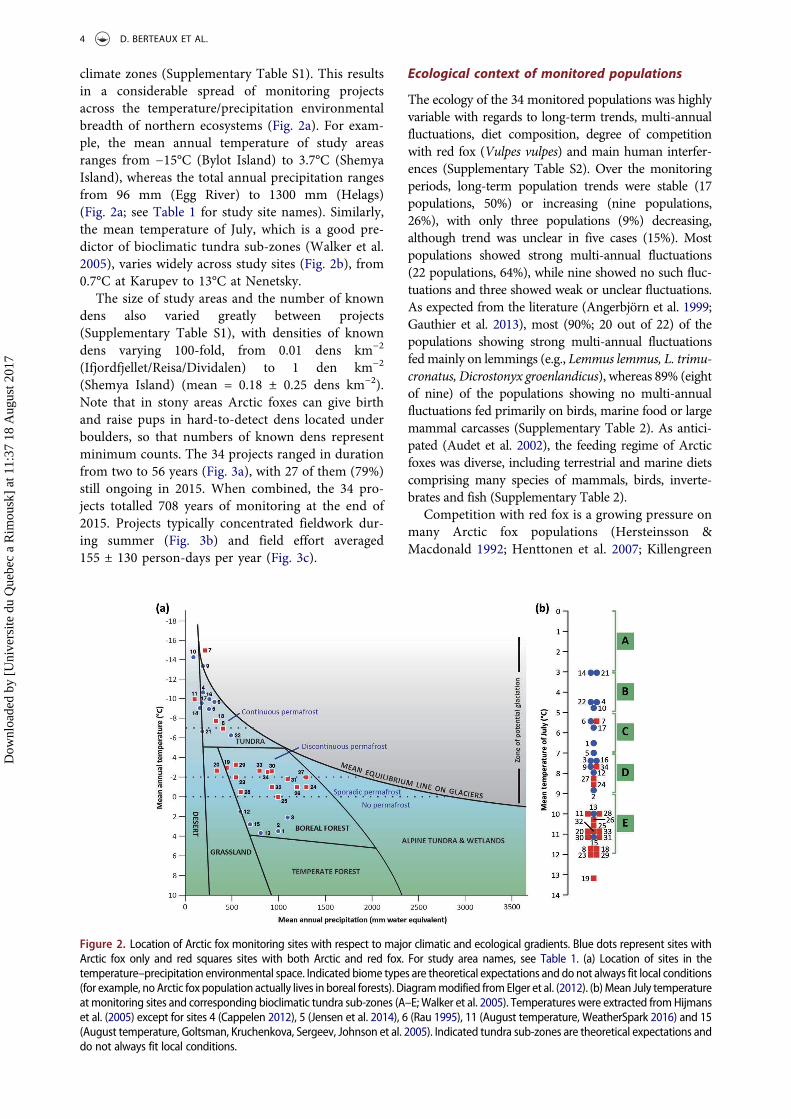
climate zones (Supplementary Table S1). This resultsin a considerable spread of monitoring projectsacross the temperature/precipitation environmentalbreadth of northern ecosystems (Fig. 2a). For exam-ple, the mean annual temperature of study areasranges from −15°C (Bylot Island) to 3.7°C (ShemyaIsland), whereas the total annual precipitation rangesfrom 96 mm (Egg River) to 1300 mm (Helags)(Fig. 2a; see Table 1 for study site names). Similarly,the mean temperature of July, which is a good pre-dictor of bioclimatic tundra sub-zones (Walker et al.2005), varies widely across study sites (Fig. 2b), from0.7°C at Karupev to 13°C at Nenetsky.
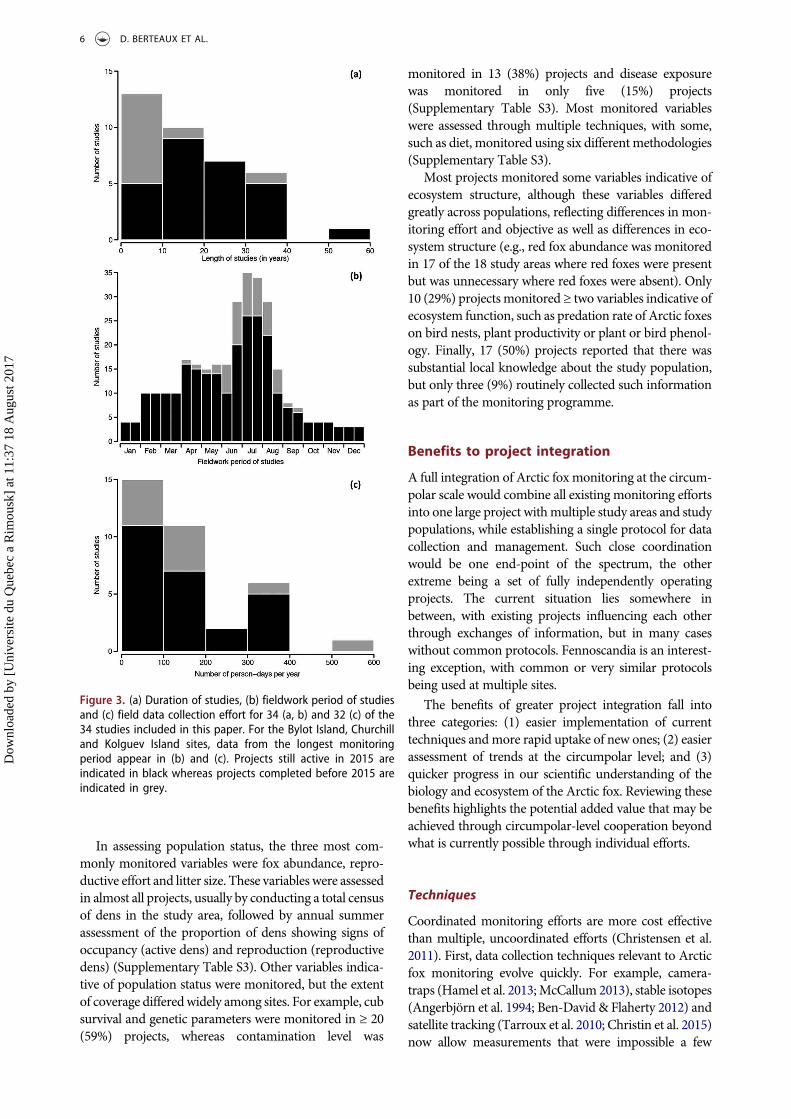
The size of study areas and the number of knowndens also varied greatly between projects(Supplementary Table S1), with densities of knowndens varying 100-fold, from 0.01 dens km−2
(Ifjordfjellet/Reisa/Dividalen) to 1 den km−2
(Shemya Island) (mean = 0.18 ± 0.25 dens km−2).Note that in stony areas Arctic foxes can give birthand raise pups in hard-to-detect dens located underboulders, so that numbers of known dens representminimum counts. The 34 projects ranged in durationfrom two to 56 years (Fig. 3a), with 27 of them (79%)still ongoing in 2015. When combined, the 34 pro-jects totalled 708 years of monitoring at the end of2015. Projects typically concentrated fieldwork dur-ing summer (Fig. 3b) and field effort averaged155 ± 130 person-days per year (Fig. 3c).
Ecological context of monitored populations
The ecology of the 34 monitored populations was highlyvariable with regards to long-term trends, multi-annualfluctuations, diet composition, degree of competitionwith red fox (Vulpes vulpes) and main human interfer-ences (Supplementary Table S2). Over the monitoringperiods, long-term population trends were stable (17populations, 50%) or increasing (nine populations,26%), with only three populations (9%) decreasing,although trend was unclear in five cases (15%). Mostpopulations showed strong multi-annual fluctuations(22 populations, 64%), while nine showed no such fluc-tuations and three showed weak or unclear fluctuations.As expected from the literature (Angerbjörn et al. 1999;Gauthier et al. 2013), most (90%; 20 out of 22) of thepopulations showing strong multi-annual fluctuationsfedmainly on lemmings (e.g., Lemmus lemmus, L. trimu-cronatus, Dicrostonyx groenlandicus), whereas 89% (eightof nine) of the populations showing no multi-annualfluctuations fed primarily on birds, marine food or largemammal carcasses (Supplementary Table 2). As antici-pated (Audet et al. 2002), the feeding regime of Arcticfoxes was diverse, including terrestrial and marine dietscomprising many species of mammals, birds, inverte-brates and fish (Supplementary Table 2).
Competition with red fox is a growing pressure onmany Arctic fox populations (Hersteinsson &Macdonald 1992; Henttonen et al. 2007; Killengreen
Figure 2. Location of Arctic fox monitoring sites with respect to major climatic and ecological gradients. Blue dots represent sites withArctic fox only and red squares sites with both Arctic and red fox. For study area names, see Table 1. (a) Location of sites in thetemperature–precipitation environmental space. Indicated biome types are theoretical expectations and donot always fit local conditions(for example, noArctic fox population actually lives in boreal forests). Diagrammodified fromElger et al. (2012). (b)Mean July temperatureatmonitoring sites and corresponding bioclimatic tundra sub-zones (A–E;Walker et al. 2005). Temperatures were extracted fromHijmanset al. (2005) except for sites 4 (Cappelen 2012), 5 (Jensen et al. 2014), 6 (Rau 1995), 11 (August temperature, WeatherSpark 2016) and 15(August temperature, Goltsman, Kruchenkova, Sergeev, Johnson et al. 2005). Indicated tundra sub-zones are theoretical expectations anddo not always fit local conditions.
4 D. BERTEAUX ET AL.
Dow
nloa
ded
by [
Uni
vers
ite d
u Q
uebe
c a
Rim
ousk
] at
11:
37 1
8 A
ugus
t 201
7
et al. 2012; Gallant et al. 2014; Stickney et al. 2014;Elmhagen et al. 2015). Arctic foxes lived in sympatrywith red foxes in 18 (53%) of the 34 monitoredpopulations (Fig. 1), mostly at study sites wheresummer temperatures were above 8°C (Fig. 2b). Insympatric settings, the proportion of Arctic to redfoxes in the study area ranged from <1% (FinnishLapland) to >97% (Bylot Island) as estimated fromthe maximum numbers of Arctic and red fox breed-ing pairs observed in the study area (SupplementaryTable S2).
Human interferences with Arctic foxes were alsofound to be variable both in terms of magnitude andeffect. In nine of 34 populations (26%), no measured orsuspected effects of humans on population size or trendwere reported (Supplementary Table S2). In other popu-lations, human interferences were all positive (14 popula-tions), all negative (four) or a combination of positive andnegative (five). Eleven of 14 projects reporting only posi-tive human interferenceswere fromFennoscandia, whereconsiderable conservation actions were undertaken overthe last decades (Angerbjörn et al. 2013). SupplementaryTable S2 shows that human interferences take manyforms, from feeding (14 populations) to removal of com-petitors (seven populations) and release of captive-bredindividuals (three populations) in the case of positiveinterferences, and from direct killing of individuals (10
populations) to transmission of diseases from pets (twopopulations) in the case of negative interferences.Additionally, some human interferences, e.g., feeding,may constitute positive interference when conducted asa controlled part of a fox conservation programme, butrepresent a negative interference in other circumstances,e.g., foxes feeding on garbage at a dump. One caveat ofour analysis of human interferences, however, is thathistorical (e.g., early 20th century trapping) and global(e.g., climate change) human interferences were nottaken into account.
Monitoring objectives, techniques and variables
Nineteen (56%) of the 34 Arctic fox monitoring projectsincluded management objectives usually referred to as“conservation”. In 89%of the projects citingmanagementobjectives, management of Arctic fox was the primarygoal (Supplementary Table S3).
Few projects attempted to mark and follow individualfoxes; tagging of individuals was conducted in only six(18%) populations. The Mednyi Island project wasunique in monitoring the life histories of a large repre-sentative sample (up to 80%) of individually recognizableanimals over several generations (Goltsman,Kruchenkova, Sergeev, Volodin et al. 2005;Kruchenkova et al. 2009).
Table 1. Summary of Arctic fox monitoring sites. Details about identification of sitesand delineation of areas are provided in Supplementary Table S1. Sites are mappedin Fig. 1.Site reference numberand name Region Country
1. East Iceland Eastern regions of Iceland Iceland2. West Iceland Western regions of Iceland Iceland3. Hornstrandir Westfjords Iceland4. Kap Rink Hochstetter Forland Greenland5. Zackenberg Valley Wollaston Forland Greenland6. Karupelv Valley Traill Island Greenland7. Bylot Island Nunavut Canada8. Churchill Manitoba Canada9. Karrak Lake Nunavut Canada10. Egg River Northwest Territories Canada11. Prudhoe Bay Alaska USA12. Pribilof Islands Pribilof Islands USA13. Shemya Island Aleutian Islands USA14. Wrangel Island Chukotka Russia15. Mednyi Island Commander Islands Russia16. Sabetta Yamal Peninsula Russia17. Belyi Island Yamal Peninsula Russia18. Erkuta Yamal Peninsula Russia19. Nenetsky Nenets Autonomous Okrug Russia20. Kolguev Island Nenets Autonomous Okrug Russia21. Longyear-byen Svalbard Norway22. Ny-Ålesund Svalbard Norway23. Finnish Lapland Lapland Finland24. Helags Jämtland Sweden25. Borga Jämtland/Västbotten Sweden26. Vindelfjällen/Arjeplog Västerbotten/Norrbotten Sweden27. Norrbotten Norrbotten Sweden28. Varanger Varanger Peninsula Norway29. Ifjordfjellet/Reisa/Dividalen Troms/Finnmark Norway30. Saltfjellet Nordland Norway31. Børgefjell Nordland/Nord-Trøndelag Norway32. Lierne/Sylane Nord-Trøndelag/Sør-Trøndelag Norway33. Snøhetta/Knutshø/Finse Sør-Trøndelag/Oppland/Buskerud Norway34. Hardangervidda Buskerud/Sogn/Hordaland Norway
POLAR RESEARCH 5
Dow
nloa
ded
by [
Uni
vers
ite d
u Q
uebe
c a
Rim
ousk
] at
11:
37 1
8 A
ugus
t 201
7
In assessing population status, the three most com-monly monitored variables were fox abundance, repro-ductive effort and litter size. These variables were assessedin almost all projects, usually by conducting a total censusof dens in the study area, followed by annual summerassessment of the proportion of dens showing signs ofoccupancy (active dens) and reproduction (reproductivedens) (Supplementary Table S3). Other variables indica-tive of population status were monitored, but the extentof coverage differedwidely among sites. For example, cubsurvival and genetic parameters were monitored in ≥ 20(59%) projects, whereas contamination level was
monitored in 13 (38%) projects and disease exposurewas monitored in only five (15%) projects(Supplementary Table S3). Most monitored variableswere assessed through multiple techniques, with some,such as diet, monitored using six differentmethodologies(Supplementary Table S3).
Most projects monitored some variables indicative ofecosystem structure, although these variables differedgreatly across populations, reflecting differences in mon-itoring effort and objective as well as differences in eco-system structure (e.g., red fox abundance was monitoredin 17 of the 18 study areas where red foxes were presentbut was unnecessary where red foxes were absent). Only10 (29%) projectsmonitored ≥ two variables indicative ofecosystem function, such as predation rate of Arctic foxeson bird nests, plant productivity or plant or bird phenol-ogy. Finally, 17 (50%) projects reported that there wassubstantial local knowledge about the study population,but only three (9%) routinely collected such informationas part of the monitoring programme.
Benefits to project integration
A full integration of Arctic foxmonitoring at the circum-polar scale would combine all existing monitoring effortsinto one large project withmultiple study areas and studypopulations, while establishing a single protocol for datacollection and management. Such close coordinationwould be one end-point of the spectrum, the otherextreme being a set of fully independently operatingprojects. The current situation lies somewhere inbetween, with existing projects influencing each otherthrough exchanges of information, but in many caseswithout common protocols. Fennoscandia is an interest-ing exception, with common or very similar protocolsbeing used at multiple sites.
The benefits of greater project integration fall intothree categories: (1) easier implementation of currenttechniques andmore rapid uptake of new ones; (2) easierassessment of trends at the circumpolar level; and (3)quicker progress in our scientific understanding of thebiology and ecosystem of the Arctic fox. Reviewing thesebenefits highlights the potential added value that may beachieved through circumpolar-level cooperation beyondwhat is currently possible through individual efforts.
Techniques
Coordinated monitoring efforts are more cost effectivethan multiple, uncoordinated efforts (Christensen et al.2011). First, data collection techniques relevant to Arcticfox monitoring evolve quickly. For example, camera-traps (Hamel et al. 2013;McCallum 2013), stable isotopes(Angerbjörn et al. 1994; Ben-David & Flaherty 2012) andsatellite tracking (Tarroux et al. 2010; Christin et al. 2015)now allow measurements that were impossible a few
Figure 3. (a) Duration of studies, (b) fieldwork period of studiesand (c) field data collection effort for 34 (a, b) and 32 (c) of the34 studies included in this paper. For the Bylot Island, Churchilland Kolguev Island sites, data from the longest monitoringperiod appear in (b) and (c). Projects still active in 2015 areindicated in black whereas projects completed before 2015 areindicated in grey.
6 D. BERTEAUX ET AL.
Dow
nloa
ded
by [
Uni
vers
ite d
u Q
uebe
c a
Rim
ousk
] at
11:
37 1
8 A
ugus
t 201
7

decades ago, and additional technologies, e.g., automaticclassification of camera-trapping images, continue todevelop rapidly (Yu et al. 2013). Increased coordinationof data collection protocols assists in the timely dissemi-nation of new technology (Barry et al. 2013), and helps toresolve relatively minor differences in protocols that canhave large effects on data interpretation.
Second, requirements from funding agencies andscientific journals regarding the archiving, updating,sharing and visualization of data also evolve quickly asthey follow changes in digital capacities and publicdemand (British Ecological Society 2014). Scientistsstudying Arctic foxes create similar types of data andface similar problems in managing these data. For exam-ple, 22 of the 34 described projects use automatic cameras(Supplementary Table S3) and face the same computa-tional and memory challenges when managing imagesequences. Coordinating data management protocolswould result in substantial economies of scale for indivi-dual projects.
Trend assessment
There is an increasing demand for easily accessible andaccurate information on biodiversity trends in the Arctic(Gill et al. 2008). Assembling such information requiresintegration of circumpolar data on specific indicators ofbiodiversity.
Our description of Arctic fox monitoring showed thatthere are long-term data on status, trends and drivers ofchange for many populations throughout the circumpo-lar Arctic. Yet there is no assessment of the species takinginto account all this available information. For example,Angerbjörn et al. (2012) used data from < 40% of theprojects described in this study (and from only onepopulation located outside Fennoscandia) when report-ing on Arctic fox trends at the global level.
The time needed to locate and obtain data frommulti-ple populations, and the difficulties of comparing dataacross projects, explain this underuse of existing data.Stronger integration of data collection and managementprotocols is needed to allow large-scale assessment ofstatus and trends for the species.
Scientific understanding
Harmonization of monitoring projects would facilitatescientific progress in Arctic biology (Petersen et al. 2004).Spatially replicated experiments (Reid et al. 2012) andcomparisons along gradients (McKinnon et al. 2010;Legagneux et al. 2014) are powerful approaches to testecological hypotheses, and common variables assessedover the long term at multiple sites provide an idealplatform to design such studies (Ims et al. 2013).Although there is no clear definition of what constitutesa long-term study, assessment of demographic trendsrequires at least 10 years of monitoring in Arctic fox
populations driven by three- to four-year cyclic outbreaksof tundra rodents.
Because many of the changes affecting Arctic andred foxes have a global perspective it is important thatthe research and action programmes are coordinatedover a global scale (Berteaux et al. 2011). In thatrespect, the geographic breadth and variability ofenvironmental conditions of monitored Arctic foxpopulations (Supplementary Tables S1, S2, Figs. 1, 2)offer a wealth of research opportunities.
Research on the evolution of litter size in Arctic foxes(Tannerfeldt et al. 1998), on the genetic structure ofArctic canids (Carmichael et al. 2007; Geffen et al. 2007;Norén et al. 2011), and studies using stable isotopes(Angerbjörn et al. 1994; Ehrich et al. 2015) are amongthe first works to expose the vast and varied opportunitiespresented by the diversity of Arctic fox monitoring sites.Development of stronger integration of methods andresults across projects has tremendous potential forgreater synthesis of data from ongoing monitoringefforts, identification of data gaps and improved effi-ciency in designing new comparative studies.
Cross-project comparisons also provide for a criticalevaluation of the effectiveness of different managementactions. For example, Angerbjörn et al. (2013) showed inFennoscandia that variations in population productivityof Arctic foxes could be explained by coupling replicatedmanagement actions to long-termmonitoring. This com-parison was possible because of the close integration ofmonitoring activities within Fennoscandia and offers astrong argument for increased project integration at acircumpolar scale. Similarly, the anthropogenic footprintdiffers across the Arctic and could be used as a compara-tive factor to assess changes in Arctic fox populationslocated in impacted versus non-impacted sites(Christensen et al. 2013).
Opportunities to better integrate projects
To allow future efforts to build from existingstrengths, we now describe the circumstances thatfavour a better integration of Arctic fox monitoringat the circumpolar scale. We see four main oppor-tunities: (1) an informal network of Arctic foxspecialists already exists; (2) contemporary moni-toring projects share characteristics facilitatingincreased integration; (3) data sharing capacitiesare already in place; and (4) initiatives towardincreased integration of monitoring activities inthe Arctic benefit from a highly supportive institu-tional environment.
Arctic fox network
As described in Methods, a circumpolar network ofpeople active in Arctic fox biology and managementemerged during the last decades. Strong connections
POLAR RESEARCH 7
Dow
nloa
ded
by [
Uni
vers
ite d
u Q
uebe
c a
Rim
ousk
] at
11:
37 1
8 A
ugus
t 201
7
were first established in Fennoscandia, where theArctic fox was protected by law in all countries by1940 and where the species’ situation deterioratedfurther during the 1980s and 1990s (Angerbjörnet al. 1995; Angerbjörn et al. 2013). This network ofuniversity researchers, students, governmental biolo-gists and conservationists then expanded to encom-pass all northern countries. Although informal at thecircumpolar scale, it has allowed exchanges of infor-mation between projects through collaborations, con-ferences and workshops, and visits to field sites.
The existence of such informal networks offersirreplaceable opportunities for further collabora-tions such as those needed to better integratemonitoring activities through shared protocols. Anetwork contributes to building trust, reciprocityand shared values among its participants. Theseare important assets to act together effectivelytowards shared goals (Pelling & High 2005). Inparticular, trust among individuals provides peo-ple with the confidence to invest in collectiveactivities (such as sharing protocols and data),knowing that others will also do so (Pretty &Ward 2001). Networks are also critical to attractyoung scientists into a field of enquiry, becausenetworks efficiently demonstrate the many oppor-tunities for future research in that field.
Characteristics of monitoring projects
The findings presented in this paper show thatconsiderable experience has been accumulatedthrough individual Arctic fox monitoring projects.For example, data have been collected for ≥10 years for 26 (76%) of the 34 monitored popula-tions (Fig. 3a); nearly 80% were still active in 2015(Supplementary Table S1, Fig. 3). Arctic fox mon-itoring is, thus, carried out at the circumpolarlevel by a research community that is both experi-enced and dynamic. This provides unparalleledopportunities to build on practical field experienceand the continuity of research projects in planningfuture studies.
Another valuable characteristic of projects is thecommon approach of basing fox population status onden visits. This commonality of a few key variables,i.e., den density, number of active dens, number ofbreeding dens and litter size, provides a basis forinitial harmonizing of protocols. Once harmonizationof these basic procedures is established, challengesposed by standardizing more complex variables canbe approached with greater chance of success. Forexample, one complex variable is the measure of foxabundance not based on den visits alone, but alsoincluding observations of non-breeding adults whichmay represent the majority of adults in some years(e.g., Samelius et al. 2011).
Data sharing capacities
Modern technologies increasingly provide for sharingdata for decentralized analyses and visualization. Forexample, the Polar Data Catalogue is a database thatdescribes and provides access to diverse metadata anddata generated by polar researchers, whereas the ArcticBiodiversity Data Service (CAFF 2016) disseminatesinformation on the status and trends in Arctic biodi-versity. In the case of Arctic fox, baseline data frommonitoring projects in Norway and Sweden are storedin a common database (Rovbase 2017). Having dataarchived in a centralized repository to which accesscan be granted and use tracked can greatly expeditedata sharing when new collaborations are instigated.For example, several teams use telemetry to collectdata on Arctic fox distribution and movement.Although no plan to coordinate these data is cur-rently in place, data portals that allow for down-loading of animal movement data already exist andcould be readily applied for the purpose of projectintegration (Max Planck Institute for Ornithology2016). Arctic research communities interested insharing data can, thus, launch new projects withthe added benefit of building on strong existingplatforms.
Researchers may have reservations about providingunrestricted access to their data, as promoted by theCircumpolar Biodiversity Monitoring Program(Christensen et al. 2011). However, controlled sharing,temporary restrictions or partial access can allowresearchers to retain publishing rights, providing bene-fits of data sharing while imparting necessary levels ofprotection for proprietary data ownership. Fullyaddressing the topic of data sharing goes beyond theobjectives of this paper, but our take-home message isthat existing data-sharing capacities create vast oppor-tunities for the integration of Arctic fox monitoringprojects. Mills et al. (2015) have discussed in a broadercontext the benefits of, apprehensions about and solu-tions for archiving and sharing data from long-termstudies.
Institutional environment
The Intergovernmental Platform on Biodiversity andEcosystem Services was established in 2012 tostrengthen the science–policy interface for the con-servation and sustainable use of biodiversity (Díazet al. 2015). A priority need of this platform is aglobal system of harmonized biodiversity observa-tions to inform scientists and policy-makers (Pereiraet al. 2013). In the Arctic, the Terrestrial MonitoringPlan of the Circumpolar Biodiversity MonitoringProgram (Barry et al. 2013) is designed to provide aframework for the harmonization of existing Arctic
8 D. BERTEAUX ET AL.
Dow
nloa
ded
by [
Uni
vers
ite d
u Q
uebe
c a
Rim
ousk
] at
11:
37 1
8 A
ugus
t 201
7
monitoring data in addition to standardizing futureterrestrial ecosystem-based biodiversity monitoring.
Because of the wide distribution of the Arctic foxin the circumpolar North, its major role in thetrophic dynamics of the tundra, and the strong sen-sitivity of its relationship to climate change (IUCN2009), this species is recognized as a focal species forthe Circumpolar Biodiversity Monitoring Program.Similarly, the Terrestrial Steering Group of CAFF(2014) has identified Arctic fox as an important spe-cies to focus on in the future. There is, therefore, noquestion that initiatives toward increased integrationof Arctic fox monitoring activities will be met with ahighly supportive institutional environment.
Challenges to project integration
Despite clear needs and opportunities, there are alsochallenges to a better integration of Arctic fox mon-itoring projects. Some of these challenges are specificto Arctic fox monitoring, whereas others are com-mon to most ecological monitoring. We examinethem in turn, with emphasis on heterogeneity acrossprojects in objectives, ecological context, logisticsconstraints and data management strategies.
Project objectives
Objectives and priorities of Arctic fox monitoringprojects differ. For example, some projects are dri-ven by Arctic fox conservation, with efforts focusedon fox monitoring (e.g., Fennoscandian sites). Inother cases, where objectives are driven by ecosys-tem science, fox monitoring may represent one ofmany project components (e.g., Greenland sites,Erkuta). Size of the area studied, complexity of thedata sampled and temporal sustainability of projectsalso differ according to financial and organizationalsupport. For example, monitoring can be: (1)mostly sustained by volunteer work (Hornstrandir,Karupelv Valley); (2) fit a government mandate andthus benefit from dedicated staff (Longyearbyen,Finnish Lapland); (3) be part of an environmentalassessment (Prudhoe Bay); or (4) pertain to anacademic project funded through competitivegrant proposals (Churchill, Bylot Island). Such adiversity of contexts challenges harmonization ofprotocols and objectives because interests, resourcesand long-term commitment of principal investiga-tors differ.
Ecological contexts
Correlating trends in Arctic fox populations withecological drivers is only possible if likely drivers ofchange are measured. Projects should therefore takean ecosystem-based approach and use appropriate
hypotheses to guide the selection of drivers that willbe monitored (Lindenmayer & Likens 2009).However, as shown in Supplementary Tables S1 andS2 and Figs. 1 and 2, Arctic foxes use all northernhabitats (from polar deserts to oceanic islands andfrom Arctic sea ice to Alpine tundra) and feed from ahighly heterogeneous prey base. As recognized byChristensen et al. (2013), the opportunity to standar-dize monitoring protocols and hypotheses can there-fore be limited by the natural heterogeneity amongsites. Given limited funds and time, determining theneed-to-have and the nice-to-have in a coordinatedfashion is a difficult, although potentially rewarding,task.
Logistic constraints
The remoteness of many Arctic locations adds uniquelogistical challenges to information gathering. Forexample, in Russia there is no national organizationcoordinating field logistics in support of scientificactivities (although this is developing regionally,such as in Yamalo-Nenets Autonomous Okrug).Projects across the Arctic face severe constraints tofield logistics that may impede harmonization of datacollection protocols. For example, litter size is evalu-ated in June–July by counting cubs soon after theyemerge from the den, at three to four weeks of age(Garrott et al. 1984; Eide et al. 2015). However,because the whole litter is rarely observed simulta-neously, litter size estimates increase with time spentobserving the den. Ideally, a shared protocol wouldinvolve long observation periods at each den (e.g.,24 hours). Unfortunately this is not always compati-ble with strict helicopter or boat schedules, longwalking distances between dens and camp or lack ofpersonnel due to budget constraints.
Long-term funding whereby ecological monitoringis supported for decades without interruptions isanother major challenge, as grant committees requirecontinuing evidence that projects are remaining pro-ductive and innovative (Lindenmayer & Likens 2009;Clutton-Brock & Sheldon 2010). Funding may also bemore readily provided for some activities over others.For example, the costs of data collection are easy todemonstrate, while the costs of scientific oversight,training, data management and reporting are oftenmuch more difficult to justify to funders (Caughlan &Oakley 2001).
Data management strategies
Arctic fox monitoring projects store data on varioussupport platforms, including field notebooks, standardpaper forms, Excel tables and Access and SQL databases.These differences in data storage challenge the consoli-dation of data across projects. In addition, cooperation
POLAR RESEARCH 9
Dow
nloa
ded
by [
Uni
vers
ite d
u Q
uebe
c a
Rim
ousk
] at
11:
37 1
8 A
ugus
t 201
7
among entities for sharing data is not always straightfor-ward. For example, one oil company operating in theNorth Slope oilfields of Alaska requires that any requestfor Arctic fox data go through its legal office to be vetted.Restrictions to sharing data can also differ according towhether a project is based at a university or a governmentagency.
Adoption of new protocols can break long time-seriesif data collected with the new protocols cannot be com-pared to past data. This can be avoided by running the oldand new protocols simultaneously and establishing cor-rection factors between time-series, but this entails addi-tional time and financial costs that some projects may beunable to support.
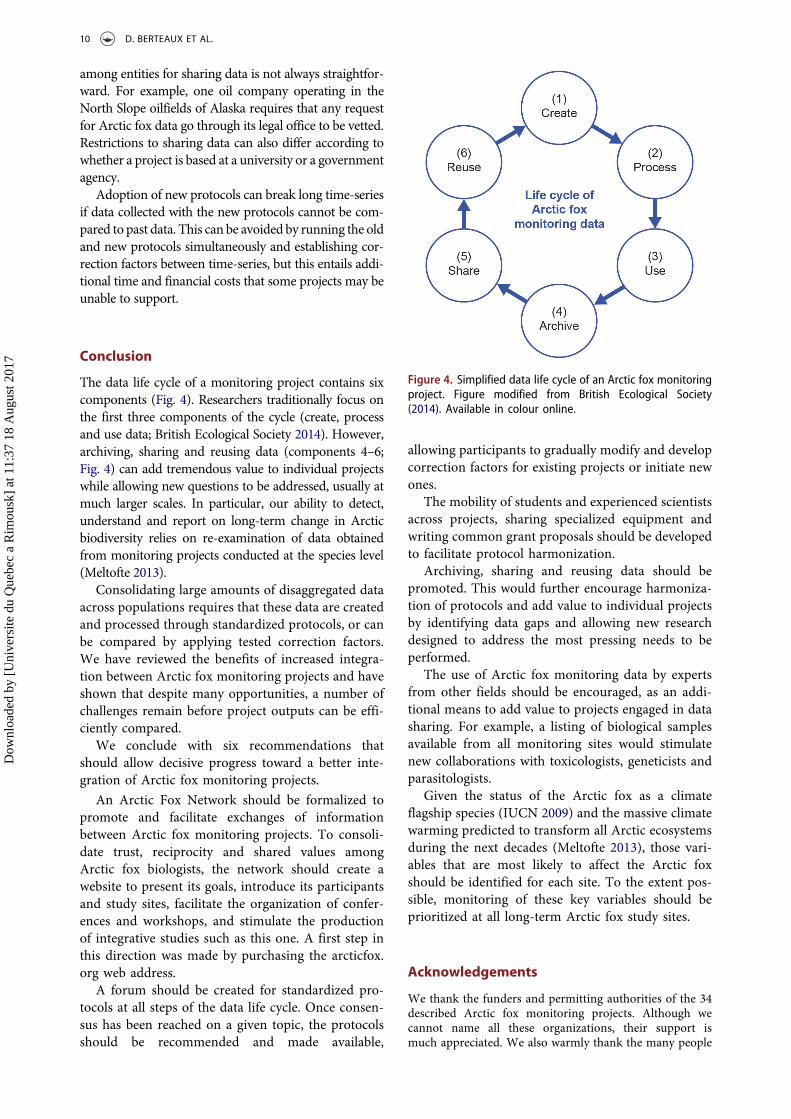
Conclusion
The data life cycle of a monitoring project contains sixcomponents (Fig. 4). Researchers traditionally focus onthe first three components of the cycle (create, processand use data; British Ecological Society 2014). However,archiving, sharing and reusing data (components 4–6;Fig. 4) can add tremendous value to individual projectswhile allowing new questions to be addressed, usually atmuch larger scales. In particular, our ability to detect,understand and report on long-term change in Arcticbiodiversity relies on re-examination of data obtainedfrom monitoring projects conducted at the species level(Meltofte 2013).
Consolidating large amounts of disaggregated dataacross populations requires that these data are createdand processed through standardized protocols, or canbe compared by applying tested correction factors.We have reviewed the benefits of increased integra-tion between Arctic fox monitoring projects and haveshown that despite many opportunities, a number ofchallenges remain before project outputs can be effi-ciently compared.
We conclude with six recommendations thatshould allow decisive progress toward a better inte-gration of Arctic fox monitoring projects.
An Arctic Fox Network should be formalized topromote and facilitate exchanges of informationbetween Arctic fox monitoring projects. To consoli-date trust, reciprocity and shared values amongArctic fox biologists, the network should create awebsite to present its goals, introduce its participantsand study sites, facilitate the organization of confer-ences and workshops, and stimulate the productionof integrative studies such as this one. A first step inthis direction was made by purchasing the arcticfox.org web address.
A forum should be created for standardized pro-tocols at all steps of the data life cycle. Once consen-sus has been reached on a given topic, the protocolsshould be recommended and made available,
allowing participants to gradually modify and developcorrection factors for existing projects or initiate newones.
The mobility of students and experienced scientistsacross projects, sharing specialized equipment andwriting common grant proposals should be developedto facilitate protocol harmonization.
Archiving, sharing and reusing data should bepromoted. This would further encourage harmoniza-tion of protocols and add value to individual projectsby identifying data gaps and allowing new researchdesigned to address the most pressing needs to beperformed.
The use of Arctic fox monitoring data by expertsfrom other fields should be encouraged, as an addi-tional means to add value to projects engaged in datasharing. For example, a listing of biological samplesavailable from all monitoring sites would stimulatenew collaborations with toxicologists, geneticists andparasitologists.
Given the status of the Arctic fox as a climateflagship species (IUCN 2009) and the massive climatewarming predicted to transform all Arctic ecosystemsduring the next decades (Meltofte 2013), those vari-ables that are most likely to affect the Arctic foxshould be identified for each site. To the extent pos-sible, monitoring of these key variables should beprioritized at all long-term Arctic fox study sites.
Acknowledgements
We thank the funders and permitting authorities of the 34described Arctic fox monitoring projects. Although wecannot name all these organizations, their support ismuch appreciated. We also warmly thank the many people
Figure 4. Simplified data life cycle of an Arctic fox monitoringproject. Figure modified from British Ecological Society(2014). Available in colour online.
10 D. BERTEAUX ET AL.
Dow
nloa
ded
by [
Uni
vers
ite d
u Q
uebe
c a
Rim
ousk
] at
11:
37 1
8 A
ugus
t 201
7
who contributed to the data life cycles of the projects.Nicolas Casajus created Figs. 1–4 and Helen Wheeler andthe discussion group of the Canada Research Chair onNorthern Biodiversity provided helpful comments on anearlier draft.
Disclosure statement
No potential conflict of interest was reported by theauthors.
ORCID
Olivier Gilg http://orcid.org/0000-0002-9083-4492Niels M. Schmidt http://orcid.org/0000-0002-4166-6218
References
AngerbjörnA., BerteauxD.& ImsR.A. 2012. Arctic fox (Vulpeslagopus). InM.O. Jeffries et al. (eds.):Arctic report card 2012.National Oceanic and Atmospheric Administration, USDepartment of Commerce. Accessed on the internet athttp://www.arctic.noaa.gov/reportcard on 4 April 2016
Angerbjörn A., Eide N.E., Dalén L., Elmhagen B., Hellström P.,Ims R.A., Killengreen S., Landa A., Meijer T., Mela M.,Niemimaa J., Norén K., Tannerfeldt M., Yoccoz N.G. &Henttonen H. 2013. Carnivore conservation in practice:replicated management actions on a large spatial scale.Journal of Applied Ecology 50, 59–67.
Angerbjörn A., Hersteinsson P., Liden K. & Nelson E.1994. Dietary variation in Arctic foxes (Alopex lagopus)– an analysis of stable carbon isotopes. Oecologia 99,226–232.
Angerbjörn A., Hersteinsson P. & Tannerfeldt M. 2004.Arctic fox. In C. Silero-Zubiri et al. (eds.): Canids:foxes, wolves, jackals and dogs. Status survey and actionplans. Pp. 117–123. Gland: International Union forConservation of Nature.
Angerbjörn A. & Tannerfeldt M. 2014. Vulpes lagopus. TheIUCN Red List of threatened species: e.T899A57549321.Version 2014.3. Accessed on the internet at http://www.iucnredlist.org/details/899/0 on 11 April 2017
Angerbjörn A., Tannerfeldt M., Bjarvall A., EricsonM., FromJ. & Noren E. 1995. Dynamics of the Arctic fox populationin Sweden. Annales Zoologici Fennici 32, 55–68.
Angerbjörn A., Tannerfeldt M. & Erlinge S. 1999.Predator–prey relationships: Arctic foxes and lemmings.Journal of Animal Ecology 68, 34–49.
Audet A.M., Robbins C.B. & Larivière S. 2002. Alopexlagopus. Mammalian Species 713, 1–10.
Barry T., Christensen T., Payne J. & Gill M. 2013. StrategicPlan 2013-2017. Phase II implementation of theCircumpolar Biodiversity Monitoring Program. CAFFMonitoring Series Report 8. Akureyri: CAFFInternational Secretariat.
Ben-David M. & Flaherty E.A. 2012. Stable isotopes in mam-malian research: a beginner’s guide. Journal of Mammalogy93, 312–328.
Berteaux D., Angerbjörn A., Ehrich D., Eide N.E., Fuglei E.,Gallant D., Ims R.A., Kruchenkova E., Lecomte N.,Menyushina I.E., Norén K., Ovsjanikov N., Rodnikova A.Y., Tarroux A. & Yoccoz N.G. 2011. Chapter 8. Arctic andred foxes. In G. Gauthier & D. Berteaux (eds.):ArcticWOLVES: Arctic Wildlife Observatories Linking
Vulnerable Ecosystems. Final synthesis report. Pp. 133.Quebec City: Centre for Northern Studies, University ofLaval.
British Ecological Society 2014. A guide to data managementin ecology and evolution. London: British EcologicalSociety.
CAFF 1996. International Murre conservation strategy andaction plan. Ottawa: CAFF.
CAFF 2016. Arctic Biodiversity Data Service. Accessedon the internet at http://www.abds.is/on on 25 January2016
Cappelen J. 2012. Weather and climate data fromGreenland 1958-2011. Observation data with description.Copenhagen: Danish Meteorological Institute.
Carmichael L.E., Krizan J., Nagy J.A., Fuglei E., Dumond M.,Johnson D., Veitch A., Berteaux D. & Strobeck C. 2007.Historical and ecological determinants of genetic structurein Arctic canids. Molecular Ecology 16, 3466–3483.
Caughlan L. & Oakley K.L. 2001. Cost considerations forlong-term ecological monitoring. Ecological Indicators 1,123–134.
Christensen T., Payne J., Doyle M., Ibarguchi G., Taylor J.,Schmidt N.M., Gill M., Svoboda M., Aronsson M., BeheC., Buddle C., Cuyler C., Fosaa A.M., Fox A.D.,Heiðmarsson S., Henning Krogh P., Madsen J.,McLennan D., Nymand J., Rosa C., Salmela J.,Shuchman R., Soloviev M. & Wedege M. 2013. TheArctic terrestrial biodiversity monitoring plan. Akureyri:CAFF.
Christensen T., Payne J., Schmidt N.M., Madsen J.,Taylor J.J., Doyle M., Gill M., Nymand J., SvobodaM., Rosa M., Shuchman B., Soloviev M., Aronsson M.,Paakko E., Heidmarsson S. & Solberg B.Ø. 2011.Terrestrial expert monitoring plan – backgroundpaper. Akureyri: CAFF.
Christin S., St-Laurent M.-H. & Berteaux D. 2015.Evaluation of Argos telemetry accuracy in the High-Arctic and implications for the estimation of home-range size. Plos One 10, e0141999, doi: 10.1371/journal.pone.0141999
Clutton-Brock T. & Sheldon B.C. 2010. Individuals andpopulations: the role of long-term, individual-based stu-dies of animals in ecology and evolutionary biology.Trends in Ecology & Evolution 25, 562–573.
Dalén L., Fuglei E.V.A., Hersteinsson P., Kapel C.M., RothJ.D., Samelius G., Tannerfeldt M. & Angerbjörn A. 2005.Population history and genetic structure of a circumpo-lar species: the Arctic fox. Biological Journal of theLinnean Society 84, 79–89.
Díaz S., Demissew S., Carabias J., Joly C., Lonsdale M., AshN., Larigauderie A., Adhikari J.R., Arico S. & Báldi A. &Others 2015. The IPBES conceptual framework – con-necting nature and people. Current Opinion inEnvironmental Sustainability 14, 1–16.
Ehrich D., Ims R.A., Yoccoz N.G., Lecomte N., KillengreenS.T., Fuglei E., Rodnikova A.Y., Ebbinge B.S.,Menyushina I.E., Nolet B.A., Pokrovsky I.G., Popov I.Y., Schmidt N.M., Sokolov A.A., Sokolova N.A. &Sokolov V.A. 2015. What can stable isotope analysis oftop predator tissues contribute to monitoring of tundraecosystems? Ecosystems 18, 404–416.
Eide N.E., Ulvund K., Kleven O., Rød-Eriksen L., LandaA. & Flagstad Ø. 2015. Arctic fox in Norway 2015.Results from the national monitoring programme forArctic fox. NINA Rapport 1219. Trondheim:Norwegian Institute for Nature Research.
POLAR RESEARCH 11
Dow
nloa
ded
by [
Uni
vers
ite d
u Q
uebe
c a
Rim
ousk
] at
11:
37 1
8 A
ugus
t 201
7
Elger K., Opel T., Topp-Jørgensen E. & Rasch M. (eds.)2012. INTERACT station catalogue. Aarhus: DanishCentre for Environment and Energy, AarhusUniversity.
Elmhagen B., Kindberg J., Hellström P. & Angerbjörn A.2015. A boreal invasion in response to climate change?Range shifts and community effects in the borderlandbetween forest and tundra. Ambio 44, 39–50.
Frafjord K. 2003. Ecology and use of Arctic fox Alopex lagopusdens in Norway: tradition overtaken by interspecific compe-tition? Biological Conservation 111, 445–453.
Gagnon C.A. & Berteaux D. 2009. Integrating traditionalecological knowledge and ecological science: a questionof scale. Ecology and Society 14, 19.
Gallant D., Reid D.G., Slough B.G. & Berteaux D. 2014. Natalden selection by sympatric Arctic and red foxes on HerschelIsland, Yukon, Canada. Polar Biology 37, 333–345.
Gallant D., Slough B.G., Reid D.G. & Berteaux D. 2012.Arctic fox versus red fox in the warming Arctic: fourdecades of den surveys in north Yukon. Polar Biology 35,1421–1431.
Garrott R.A., Eberhardt L.E. & Hanson W.C. 1984. Arcticfox denning behavior in northern Alaska. CanadianJournal of Zoology 62, 1636–1640.
Gauthier G. & Berteaux D. 2011. ArcticWOLVES: ArcticWildlife Observatories Linking Vulnerable Ecosystems.Final synthesis report. Quebec City: Centre forNorthern Studies, University of Laval.
Gauthier G., Bety J., Cadieux M.-C., Legagneux P., DoironM., Chevallier C., Lai S., Tarroux A. & Berteaux D. 2013.Long-term monitoring at multiple trophic levels suggestsheterogeneity in responses to climate change in theCanadian Arctic tundra. Philosophical Transactions ofthe Royal Society B 368, article no. UNSP 20120482,doi: 10.1098/rstb.2012.0482
Geffen E., Waidyaratne S., Dalen L., Angerbjoern A., VilaC., Hersteinsson P., Fuglei E., White P.A., Goltsman M.,Kapel C.M.O. & Wayne R.K. 2007. Sea ice occurrencepredicts genetic isolation in the Arctic fox. MolecularEcology 16, 4241–4255.
Gill M.J., Raillard M.C., Zöckler C. & Smith R.B. 2008.CBMP five-year implementation plan. Developing anintegrated and sustained Arctic biodiversity monitoringnetwork. CAFF CBMP Report 14. Akureyri: CAFF.
Goltsman M., Kruchenkova E.P., Sergeev S., Johnson P.J. &Macdonald D.W. 2005. Effects of food availability ondispersal and cub sex ratio in the Mednyi Arctic fox.Behavioral Ecology and Sociobiology 59, 198–206.
Goltsman M., Kruchenkova E.P., Sergeev S., Volodin I. &Macdonald D.W. 2005. “Island syndrome” in a popula-tion of Arctic foxes (Alopex lagopus) from MednyiIsland. Journal of Zoology 267, 405–418.
Hamel S., Killengreen S.T., Henden J.-A., Eide N.E., Roed-Eriksen L., Ims R.A. & Yoccoz N.G. 2013. Towards goodpractice guidance in using camera-traps in ecology:influence of sampling design on validity of ecologicalinferences. Methods in Ecology and Evolution 4, 105–113.
Henttonen H., Mela M., Niemimaa J. & Kaikusalo A. 2007.Naalikannan tilanne ja suojelu Suomessa jaFennoskandiassa. (Arctic fox in Finland andFennoscandia: status and conservation). Suomen Riista53, 15–24.
Herfindal I., Linnell J.D.C., Elmhagen B., Andersen R., EideN.E., Frafjord K., Henttonen H., Kaikusalo A., Mela M.,Tannerfeldt M., Dalén L., Strand O., Landa A. &Angerbjörn A. 2010. Population persistence in a
landscape context: the case of endangered Arctic foxpopulations in Fennoscandia. Ecography 33, 932–941.
Hersteinsson P. 1992. Demography of the Arctic fox (Alopexlagopus) population in Iceland. InD.R.McCullough&R.H.Barrett (eds.): International conference on populationdynamics and management of vertebrates. Wildlife 2001:populations. Pp. 954–964. London: Elsevier.
Hersteinsson P., Landa A., Eide N.E., Linnell J.D.C.,Henttonen H., Tikhonov A. & Angerbjörn A. 2007.Vulpes lagopus. The IUCN Red List of Threatened Species2007: e.T899A13090095. Accessed on the internet at http://www.iucnredlist.org/details/899/1 on 5 December 2016
Hersteinsson P. & Macdonald D.W. 1992. Interspecificcompetition and the geographical distribution of redand Arctic foxes Vulpes vulpes and Alopex lagopus.Oikos 64, 505–515.
Hijmans R.J., Cameron S.E., Parra J.L., Jones P.G. & JarvisA. 2005. Very high resolution interpolated climate sur-faces for global land areas. International Journal ofClimatology 25, 1965–1978.
Ims R.A., Jepsen J.U., Stien A. & Yoccoz N.G. 2013. Scienceplan for COAT: Climate–ecological Observatory for ArcticTundra. Fram Center Report Series 1. Tromsø: FramCentre.
IUCN2009. Species and climate change:more than just the polarbear. Cambridge: IUCN/Species Survival Commission.
Jensen L.M., Christensen T.R. & Schmidt N.M. 2014.Zackenberg ecological research operations. 19th AnnualReport 2013. Aarhus: Danish Centre for Environmentand Energy, Aarhus University.
Killengreen S.T., Strømseng E., Yoccoz N.G. & Ims R.A.2012. How ecological neighbourhoods influence thestructure of the scavenger guild in Low Arctic tundra.Diversity and Distributions 18, 563–574.
Krebs C.J. 2008. Ecology: the experimental analysis of dis-tribution and abundance. 6th edn. San Francisco:Benjamin Cummings.
Kruchenkova E.P., GoltsmanM., Sergeev S. &Macdonald D.W. 2009. Is alloparenting helpful forMednyi Island Arcticfoxes, Alopex lagopus semenovi? Naturwissenschaften 96,457–466.
Legagneux P., Gauthier G., Lecomte N., Schmidt N.M.,Reid D., Cadieux M.-C., Berteaux D., Bêty J., Krebs C.J., Ims R.A., Yoccoz N.G., Morrison R.I.G., Leroux S.J.,Loreau M. & Gravel D. 2014. Arctic ecosystem structureand functioning shaped by climate and herbivore bodysize. Nature Climate Change 4, 379–383.
Lindenmayer D.B. & Likens G.E. 2009. Adaptive monitor-ing: a new paradigm for long-term research and mon-itoring. Trends in Ecology & Evolution 24, 482–486.
Liukko U.-M., Henttonen H., Hanski I.K., Kauhala K.,Kojola I. & Kyheröinen E.-M. 2010. Mammals. In P.Rassi et al. (eds.): The 2010 Red List of Finnish species.Pp. 311–319. Helsinki: Ympäristöministeriö & SuomenYmpäristökeskus.
Max Planck Institute for Ornithology 2016. Movebank.Accessed on the internet at https://www.movebank.org/on 30 June 2016
McCallum J. 2013. Changing use of camera traps in mam-malian field research: habitats, taxa and study types:camera trap use and development in field ecology.Mammal Review 43, 196–206.
McKinnon L., Smith P.A., Nol E., Martin J.L., Doyle F.I.,Abraham K.F., Gilchrist H.G., Morrison R.I.G. & Bety J.2010. Lower predation risk for migratory birds at highlatitudes. Science 327, 326.
12 D. BERTEAUX ET AL.
Dow
nloa
ded
by [
Uni
vers
ite d
u Q
uebe
c a
Rim
ousk
] at
11:
37 1
8 A
ugus
t 201
7
Meltofte H. (ed.) 2013. Arctic biodiversity assessment. Statusand trends in Arctic biodiversity. Akureyri: CAFF.
Mills J.A., Teplitsky C., Arroyo B., Charmantier A., BeckerP.H., Birkhead T.R., Bize P., Blumstein D.T., BonenfantC., Boutin S., Bushuev A., Cam E., Cockburn A., Côté S.D., Coulson J.C., Daunt F., Dingemanse N.J., Doligez B.,Drummond H., Espie R.H.M., Festa-Bianchet M.,Frentiu F., Fitzpatrick J.W., Furness R.W., Garant D.,Gauthier G., Grant P.R., Griesser M., Gustafsson L.,Hansson B., Harris M.P., Jiguet F., Kjellander P.,Korpimäki E., Krebs C.J., Lens L., Linnell J.D.C., LowM., McAdam A., Margalida A., Merilä J., Møller A.P.,Nakagawa S., Nilsson J.-Å., Nisbet I.C.T., van NoordwijkA.J., Oro D., Pärt T., Pelletier F., Potti J., Pujol B., RéaleD., Rockwell R.F., Ropert-Coudert Y., Roulin A.,Sedinger J.S., Swenson J.E., Thébaud C., Visser M.E.,Wanless S., Westneat D.F., Wilson A.J. & Zedrosser A.2015. Archiving primary data: solutions for long-termstudies. Trends in Ecology & Evolution 30, 581–589.
Norén K., Carmichael L., Dalén L., Hersteinsson P.,Samelius G., Fuglei E., Kapel C.M.O., Menyushina I.,Strobeck C. & Angerbjörn A. 2011. Arctic fox Vulpeslagopus population structure: circumpolar patterns andprocesses. Oikos 120, 873–885.
Pelling M. & High C. 2005. Understanding adaptation:what can social capital offer assessments of adaptivecapacity? Global Environmental Change 15, 308–319.
Pereira H.M., Ferrier S., Walters M., Geller G.N., JongmanR.H.G., Scholes R.J., Bruford M.W., Brummitt N.,Butchart S.H.M., Cardoso A.C., Coops N.C., Dulloo E.,Faith D.P., Freyhof J., Gregory R.D., Heip C., Höft R.,Hurtt G., Jetz W., Karps D.S., McGeoch M.A., Obura D.,Onoda Y., Pettorelli N., Reyers B., Sayre R., ScharlemannJ.P.W., Stuart S.N., Turak E., Walpole M. & WegmannM. 2013. Essential biodiversity variables. Science 339,277–278.
Petersen A., Zöckler C. & Gunnarsdóttir M.V. 2004.Circumpolar Biodiversity Monitoring Program.Framework document. CAFF CBMP Report 1. Akureyri:CAFF.
Ploshnitsa A.I., GoltsmanM.E., HappG.M., Macdonald D.W.& Kennedy L.J. 2013. Historical and modern neutralgenetic variability in Mednyi Arctic foxes passed througha severe bottleneck. Journal of Zoology 289, 68–76.
PloshnitsaA.I., GoltsmanM.E.,MacdonaldD.W., Kennedy L.J.& Sommer S. 2012. Impact of historical founder effects and arecent bottleneck onMHC variability in Commander Arcticfoxes (Vulpes lagopus). Ecology and Evolution 2, 165–180.
Post E., Forchhammer M.C., Bret-Harte M.S., Callaghan T.V., Christensen T.R., Elberling B., Fox A.D., Gilg O., HikD.S., Hoye T.T., Ims R.A., Jeppesen E., Klein D.R.,Madsen J., McGuire A.D., Rysgaard S., Schindler D.E.,Stirling I., Tamstorf M.P., Tyler N.J.C., Van Der Wal R.,Welker J., Wookey P.A., Schmidt N.M. & Aastrup P.2009. Ecological dynamics across the Arctic associatedwith recent climate change. Science 325, 1355–1358.
Pretty J. & Ward H. 2001. Social capital and the environ-ment. World Development 29, 209–227.
Rau F. 1995.Geoökologische und ydrologische Untersuchungenin einem hocharktischen Tundrenökosystem auf Traill Ö,Nordost-Grönland. (Geo-ecological and hydrological inves-tigations in a high altitude tundra ecosystem on TraillIsland, north-east Greenland.) Freiburg: Albert LudwigUniversity of Freiburg.
Reid D.G., Bilodeau F., Krebs C.J., Gauthier G., Kenney A.J., Gilbert B.S., Leung M.C.-Y., Duchesne D. & Hofer E.2012. Lemming winter habitat choice: a snow-fencingexperiment. Oecologia 168, 935–946.
Rovbase 2017. Carnivore database. Norwegian EnvironmentAgency and Swedish Environmental Protection Agency.Accessed on the internet at http://www.rovbase.se/ on 7April 2017.
Russell D. & Kofinas G. 2004. Rangifers expert network mon-itoring plan. Supporting publication to the CAFFCircumpolar Biodiversity Monitoring Program. Frameworkdocument. Akureyri: CAFF.
Samelius G., Alisauskas R.T. & Larivière S. 2011. Seasonalpulses of migratory prey and annual variation in smallmammal abundance affect abundance and reproductionby Arctic foxes. Polar Biology 34, 1475–1484.
Stickney A.A., Obritschkewitsch T. & Burgess R.M. 2014.Shifts in fox den occupancy in the Greater Prudhoe BayArea, Alaska. Arctic 67, 196–202.
Szor G., Berteaux D. & Gauthier G. 2008. Finding the righthome: distribution of food resources and terrain char-acteristics influence selection of denning sites and repro-ductive dens in Arctic foxes. Polar Biology 31, 351–362.
Tannerfeldt M., Angerbjörn A. & Angerbjorn A. 1998.Fluctuating resources and the evolution of litter sin theArctic fox. Oikos 83, 545–559.
Tannerfeldt M., Moehrenschlager A. & Angerbjörn A.2003. Den ecology of swift, kit and Arctic foxes: areview. In M.A. Sovada & L. Carbyn (eds.): The swiftfox: ecology and conservation of swift foxes in a changingworld. Pp. 167–181. Regina, Saskatchewan: CanadianPlains Research Center.
Tarroux A., Berteaux D. & Bêty J. 2010. Northern nomads:ability for extensive movements in adult Arctic foxes.Polar Biology 33, 1021–1026.
Temple H.J. & Terry A. (compilers) 2007. The status anddistribution of European mammals. Luxembourg: Officefor Official Publications of the European Communities.
Terrestrial Steering Group of CAFF 2014. Arctic terrestrialbiodiversity monitoring plan: implementation and workplan. Akureyri, Iceland, February 25-27, 2014. Firstimplentation of the Circumpolar BiodiversityMonotoring Program’s Terrestrial Steering Group. CAFFMonitoring Series Report 11. Akureyri: CAFF.
Vongraven D. & Peacock E. 2011. Development of a pan-Arctic monitoring plan for polar bears. Background paper.CAFF Monitoring Series Report 1. Akureyri: CAFF.
Walker D.A., Raynolds M.K., Daniëls F.J.A., Einarsson E. &Elvebakk A., Gould W.A., Katenin A.E., Kholod S.S.,Markon C.J., Melnikov E.S., Moskalenko N.G., TalbotS.S., Yurtsev B.A. & the other members of the CAVMTeam 2005. The circumpolar Arctic vegetation map.Journal of Vegetation Science 16, 267–282.
WeatherSpark. 2016. Average weather for Shemya Island,Alaska, USA. Accessed on the internet at https://weatherspark.com/averages/33066/Shemya-Island-Alaska-United-Stateson 27 June 2016
Yoccoz N.G., Nichols J.D. & Boulinier T. 2001. Monitoringof biological diversity in space and time. Trends inEcology & Evolution 16, 446–453.
YuX.,Wang J., KaysR., JansenP.A.,WangT.&HuangT. 2013.Automated identification of animal species in camera trapimages. EURASIP Journal on Image and Video Processing2013, article no. 52, doi: 10.1186/1687-5281-2013-52
POLAR RESEARCH 13
Dow
nloa
ded
by [
Uni
vers
ite d
u Q
uebe
c a
Rim
ousk
] at
11:
37 1
8 A
ugus
t 201
7
1
Supplementary material for: Berteaux D., Thierry A.-M., Alisauskas R., Angerbjörn A., Buchel E., Doronina L., Ehrich D., Eide
N.E., Erlandsson R., Flagstad Ø., Fuglei E., Gilg O., Goltsman M., Henttonen H., Ims R.A., Killengreen S.T., Kondratyev A.,
Kruchenkova E., Kruckenberg H., Kulikova O., Landa A., Lang J., Menyushina I., Mikhnevich J., Niemimaa J., Norén K., Ollila T.,
Ovsyanikov N., Pokrovskaya L., Pokrovsky I., Rodnikova A., Roth J.D., Sabard B., Samelius G., Schmidt N.M., Sittler B., Sokolov
A.A., Sokolova N.A., Stickney A., Unnsteinsdóttir E.R. & White P.A. 2017. Harmonizing circumpolar monitoring of Arctic fox:
benefits, opportunities, challenges and recommendations. Polar Research 36. Contact: Dominique Berteaux, Canada Research Chair
on Northern Biodiversity and Centre for Northern Studies, Université du Québec à Rimouski, 300 Allée des Ursulines, Rimouski,
Québec G5L 3A1, Canada. E-mail: [email protected]
Supplementary Table S1. Summary of Arctic fox monitoring sites with geographic characteristics and indicators of monitoring
effort. Values indicating monitoring effort were averaged across the monitoring period when they varied through time. Sites are
mapped in Fig. 1.
Site reference
number and
name
Area Country Coordinates
Climate zonea
Size of
study
area
(km2)
Number
of
known
densb
Monitoring
period
Fieldwork
season
Number of
person
days/year
in the field
Hig
h A
rcti
c
Lo
w A
rcti
c
Su
b-A
rcti
c
Mo
nta
ne/
alp
ine
1. East Iceland Eastern regions
of Icelandc
Iceland 65°N, 18°W ● ● 82000 1000 1979–ongoing all year round NAd
2. West Iceland Western regions
of Icelandc
Iceland 65°N, 21°W ● ● 21000 500 1979–ongoing all year round NAd
2
3. Hornstrandir Westfjords Iceland 66°N, 22°W ● ● 77 40 1998–ongoing Jun–Aug 110
4. Kap Rink Hochstetter
Forland
Greenland 75°N, 20°W ● 38 4 2010–ongoing 1 Jul–10 Aug 180
5. Zackenberg
Valley
Wollaston
Forland
Greenland 74°N, 21°W ● 50 17 1996–ongoing mid-May–late Oct 330
6. Karupelv
Valley
Traill Island Greenland 72°N, 24°W ● 75 8 1988–ongoing 25 Jun–5 Aug 240
7a. Bylot Island Nunavut Canada 73°N, 80°W ● 200 30 1993–2003 1 Jun–5 Aug 100
7b. Bylot Island Nunavut Canada 73°N, 80°W ● 600 100 2004–ongoing 10 May–5 Aug 330
8a. Churchill Manitoba Canada 59°N, 94°W ● ● 600 100 1994–97 Apr, June–Aug 80
8b. Churchill Manitoba Canada 59°N, 94°W ● ● 700 110 2010–ongoing Apr, Jun, Aug 200
9. Karrak Lake Nunavut Canada 67°N, 100°W ● 70 12 2000–ongoing 10–31 May 60
10. Egg River Northwest
Territories
Canada 72°N, 124°W ● 75 28 1995–98 June 120
11. Prudhoe
Bay
Alaska USA 70°N, 148°W ● 792 51 2005–2014 late Jun–mid-Jul 43
12. Pribilof
Islands
Pribilof Islands USA 57°N, 170°W ● 125 100 1988–ongoing May–Sep or Jul 30
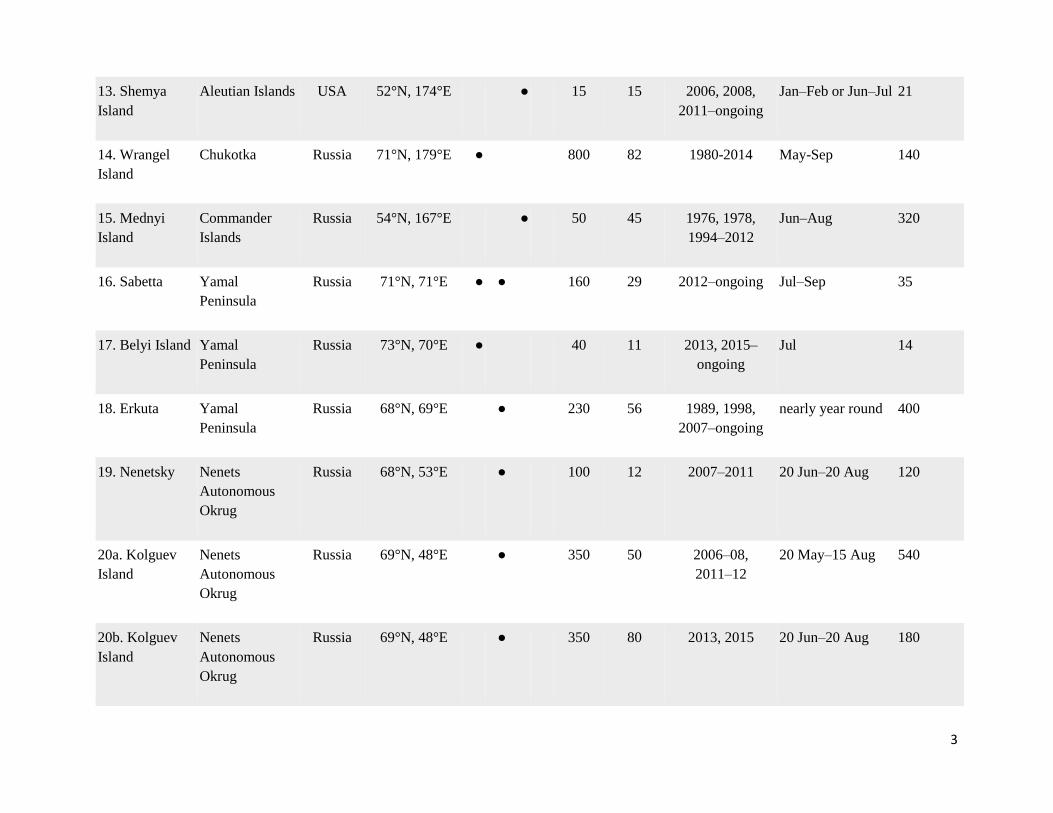
3
13. Shemya
Island
Aleutian Islands USA 52°N, 174°E ● 15 15 2006, 2008,
2011–ongoing
Jan–Feb or Jun–Jul 21
14. Wrangel
Island
Chukotka Russia 71°N, 179°E ● 800 82 1980-2014 May-Sep 140
15. Mednyi
Island
Commander
Islands
Russia 54°N, 167°E ● 50 45 1976, 1978,
1994–2012
Jun–Aug 320
16. Sabetta Yamal
Peninsula
Russia 71°N, 71°E ● ● 160 29 2012–ongoing Jul–Sep 35
17. Belyi Island Yamal
Peninsula
Russia 73°N, 70°E ● 40 11 2013, 2015–
ongoing
Jul 14
18. Erkuta Yamal
Peninsula
Russia 68°N, 69°E ● 230 56 1989, 1998,
2007–ongoing
nearly year round 400
19. Nenetsky Nenets
Autonomous
Okrug
Russia 68°N, 53°E ● 100 12 2007–2011 20 Jun–20 Aug 120
20a. Kolguev
Island
Nenets
Autonomous
Okrug
Russia 69°N, 48°E ● 350 50 2006–08,
2011–12
20 May–15 Aug 540
20b. Kolguev
Island
Nenets
Autonomous
Okrug
Russia 69°N, 48°E ● 350 80 2013, 2015 20 Jun–20 Aug 180
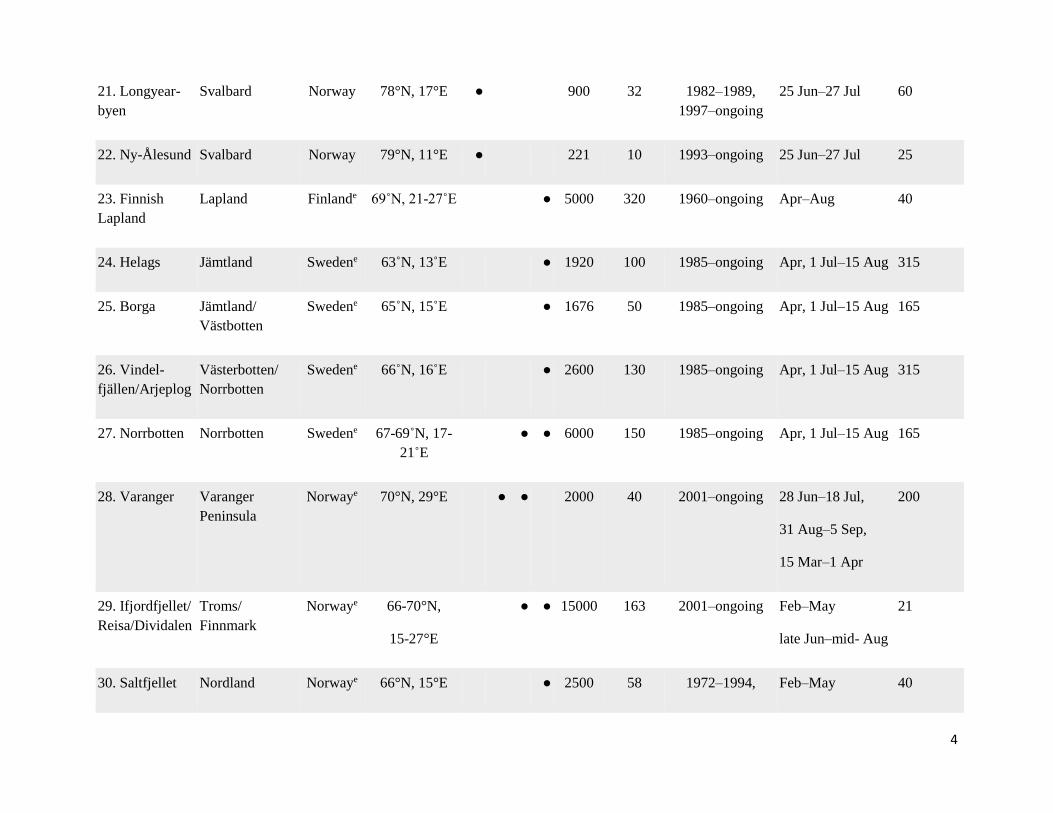
4
21. Longyear-
byen
Svalbard Norway 78°N, 17°E ● 900 32 1982–1989,
1997–ongoing
25 Jun–27 Jul 60
22. Ny-Ålesund Svalbard Norway 79°N, 11°E ● 221 10 1993–ongoing 25 Jun–27 Jul 25
23. Finnish
Lapland
Lapland Finlande 69˚N, 21-27˚E ● 5000 320 1960–ongoing Apr–Aug 40
24. Helags Jämtland Swedene 63˚N, 13˚E ● 1920 100 1985–ongoing Apr, 1 Jul–15 Aug 315
25. Borga Jämtland/
Västbotten
Swedene 65˚N, 15˚E ● 1676 50 1985–ongoing Apr, 1 Jul–15 Aug 165
26. Vindel-
fjällen/Arjeplog
Västerbotten/
Norrbotten
Swedene 66˚N, 16˚E ● 2600 130 1985–ongoing Apr, 1 Jul–15 Aug 315
27. Norrbotten Norrbotten Swedene 67-69˚N, 17-
21˚E
● ● 6000 150 1985–ongoing Apr, 1 Jul–15 Aug 165
28. Varanger Varanger
Peninsula
Norwaye 70°N, 29°E ● ● 2000 40 2001–ongoing 28 Jun–18 Jul,
31 Aug–5 Sep,
15 Mar–1 Apr
200
29. Ifjordfjellet/
Reisa/Dividalen
Troms/
Finnmark
Norwaye 66-70°N,
15-27°E
● ● 15000 163 2001–ongoing Feb–May
late Jun–mid- Aug
21
30. Saltfjellet Nordland Norwaye 66°N, 15°E ● 2500 58 1972–1994, Feb–May 40
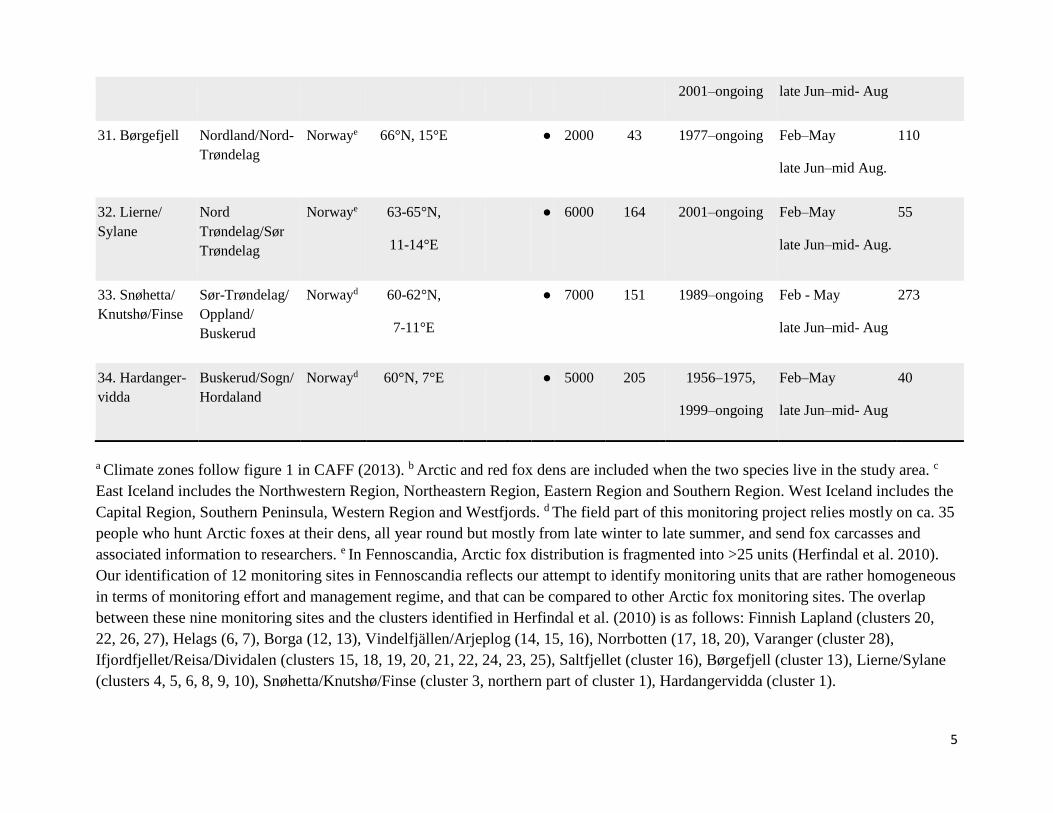
5
2001–ongoing late Jun–mid- Aug
31. Børgefjell Nordland/Nord-
Trøndelag
Norwaye 66°N, 15°E ● 2000 43 1977–ongoing Feb–May
late Jun–mid Aug.
110
32. Lierne/
Sylane
Nord
Trøndelag/Sør
Trøndelag
Norwaye 63-65°N,
11-14°E
● 6000 164 2001–ongoing Feb–May
late Jun–mid- Aug.
55
33. Snøhetta/
Knutshø/Finse
Sør-Trøndelag/
Oppland/
Buskerud
Norwayd 60-62°N,
7-11°E
● 7000 151 1989–ongoing Feb - May
late Jun–mid- Aug
273
34. Hardanger-
vidda
Buskerud/Sogn/
Hordaland
Norwayd 60°N, 7°E ● 5000 205 1956–1975,
1999–ongoing
Feb–May
late Jun–mid- Aug
40
a Climate zones follow figure 1 in CAFF (2013). b Arctic and red fox dens are included when the two species live in the study area. c
East Iceland includes the Northwestern Region, Northeastern Region, Eastern Region and Southern Region. West Iceland includes the
Capital Region, Southern Peninsula, Western Region and Westfjords. d The field part of this monitoring project relies mostly on ca. 35
people who hunt Arctic foxes at their dens, all year round but mostly from late winter to late summer, and send fox carcasses and
associated information to researchers. e In Fennoscandia, Arctic fox distribution is fragmented into >25 units (Herfindal et al. 2010).
Our identification of 12 monitoring sites in Fennoscandia reflects our attempt to identify monitoring units that are rather homogeneous
in terms of monitoring effort and management regime, and that can be compared to other Arctic fox monitoring sites. The overlap
between these nine monitoring sites and the clusters identified in Herfindal et al. (2010) is as follows: Finnish Lapland (clusters 20,
22, 26, 27), Helags (6, 7), Borga (12, 13), Vindelfjällen/Arjeplog (14, 15, 16), Norrbotten (17, 18, 20), Varanger (cluster 28),
Ifjordfjellet/Reisa/Dividalen (clusters 15, 18, 19, 20, 21, 22, 24, 23, 25), Saltfjellet (cluster 16), Børgefjell (cluster 13), Lierne/Sylane
(clusters 4, 5, 6, 8, 9, 10), Snøhetta/Knutshø/Finse (cluster 3, northern part of cluster 1), Hardangervidda (cluster 1).
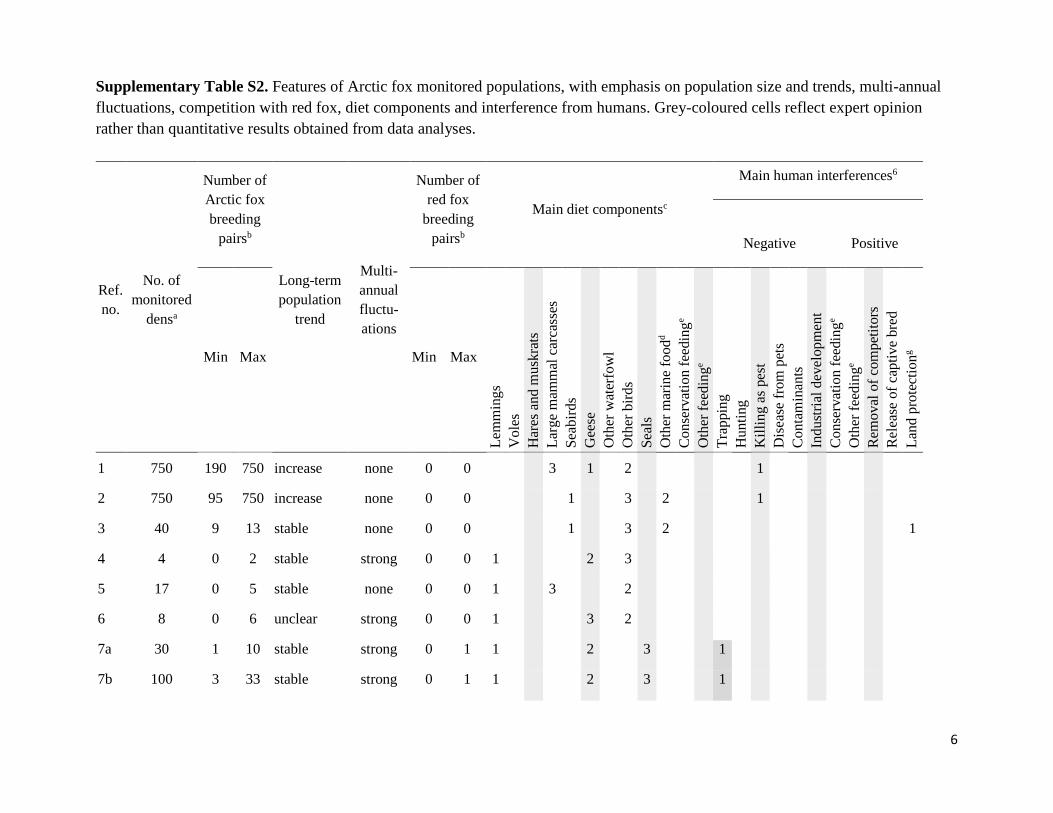
6
Supplementary Table S2. Features of Arctic fox monitored populations, with emphasis on population size and trends, multi-annual
fluctuations, competition with red fox, diet components and interference from humans. Grey-coloured cells reflect expert opinion
rather than quantitative results obtained from data analyses.
Ref.
no.
No. of
monitored
densa
Number of
Arctic fox
breeding
pairsb
Long-term
population
trend
Multi-
annual
fluctu-
ations
Number of
red fox
breeding
pairsb
Main diet componentsc
Main human interferences6
Negative Positive
Min Max Min Max
Lem
min
gs
Vole
s
Har
es a
nd m
usk
rats
Lar
ge
mam
mal
car
cass
es
Sea
bir
ds
Gee
se
Oth
er w
ater
fow
l
Oth
er b
irds
Sea
ls
Oth
er m
arin
e fo
od
d
Conse
rvat
ion f
eedin
ge
Oth
er f
eedin
ge
Tra
ppin
g
Hunti
ng
Kil
ling a
s pes
t
Dis
ease
fro
m p
ets
Conta
min
ants
Indust
rial
dev
elopm
ent
Conse
rvat
ion f
eedin
ge
Oth
er f
eedin
ge
Rem
oval
of
com
pet
itors
Rel
ease
of
capti
ve
bre
d
Lan
d p
rote
ctio
ng
1 750 190 750 increase none 0 0 3 1 2 1
2 750 95 750 increase none 0 0 1 3 2 1
3 40 9 13 stable none 0 0 1 3 2 1
4 4 0 2 stable strong 0 0 1 2 3
5 17 0 5 stable none 0 0 1 3 2
6 8 0 6 unclear strong 0 0 1 3 2
7a 30 1 10 stable strong 0 1 1 2 3 1
7b 100 3 33 stable strong 0 1 1 2 3 1
7
8a 100 3 35 stable strong 3 9 1 2 3 1
8b 110 4 40 stable unclear 3 9 1 2 3 1
9 12 0 6 stable strong 0 0 1 2 3
10 28 1 17 stable strong 0 0 1 2
11 51 1 11 decrease strong 2 15 1 3 2 2 1
12 100 20 55 decrease none 0 0 2 1 3 1 2 3
13 14 8 14 stable none 0 0 3 1 2 2 1
14 82 2 74 stable strong 0 0 1 2 3 1
15 45 8 14 stable none 0 0 1 3 2 2 3 1
16 21 0 14 unclear strong 0 0 1 3 2 2 1 3
17 9 1 1 unclear unclear 0 0 2 3 1
18 33 0 8 stable weak 0 2 3 1 2 2 4 2 1 3
19 12 1 4 stable weak 1 1 2 1 3 1 2
20a 50 6 14 stable strong 0 1 2 1 3 1
20b 80 11 25 stable strong 0 1 2 1 3 1
21 32 3 16 stable none 0 0 1 2 3 1
22 10 0 9 stable none 0 0 1 2 3 1
23 220 0 1 stable strong 30 100 1 3 2 1 2
24 100 0 30 increase strong 0 30 1 2 3 1 2 3
25 60 0 25 increase strong 0 30 1 2 3 1 2
26 100 0 30 increase strong 0 30 1 2 3 1 2 3
8
27 50 0 10 unclear strong 0 30 1 2 3 3 1
28 40 0 4 unclear strong 5 20 1 2 2
29 62 0 5 decrease strong 0 ≥17 1 2 3
30 43 0 10 increase strong 0 ≥3 1 2 3 3 1 1
31 26 0 14 stable strong 0 ≥3 1 2 3
32 48 0 13 increase strong 0 ≥5 1 2 3 3 1 2
33 100 0 23 increase strong 0 ≥5 1 2 3 3 2 1
34 37 0 2 increase strong 0 ≥7 1 2 3 3 2 1
a The number of monitored dens can differ from the number of known dens reported in Supplementary Table S1 if only a proportion of
known dens were monitored. Monitored dens include reproductive and non-reproductive dens, as well as active and inactive dens. b
Minimum and maximum numbers can reflect multi-annual fluctuations, long-term changes in fox abundance, or variation in
monitoring effort. c Each monitoring team ranked a maximum of three diet components (1 = main diet component). d Includes marine
invertebrates and all beachcast marine edibles. e Conservation feeding includes regular provisioning of significant quantities of food to
enhance fox reproduction and survival. Contribution of conservation feeding to the diet of foxes is not quantified, but is known to be
higher when rodents are rare. Other feeding includes provisioning of significant quantities of food with no aim to enhance fox
reproduction and survival (e.g., allowing access to human garbage, providing large quantities of baits to attract foxes, providing
reindeer carcasses through husbandry practices). Note that “Other feeding” can have negative effects on fox populations, for example,
through disease or contaminant transfer. f Each monitoring team ranked a maximum of three human interferences (1 = main human
interference). We considered humans to interfere with Arctic foxes if they had some measured or suspected effects on population size
or trend. To simplify the table, we did not consider distant anthropogenic influences such as climate change or artificial increases in
goose densities. g Land protection (e.g., national park or reserve) was considered as human interference only if it had measured or
suspected effects on Arctic fox population size.
9
Supplementary Table S3. Monitoring objectives, variables, techniques, and local knowledge at 34 Arctic fox monitoring sites. A
variable was considered as monitored when data collection followed a protocol and sample sizes allow data interpretation. The list of
variables and techniques is not exhaustive. Standardization of protocols across study sites was not fully assessed. Open circles indicate
partial monitoring of a given variable. Partial monitoring was subjectively defined as monitoring during less than 50% of the study
period, monitoring on less than 50% of the known dens, or monitoring over less than 50% of the study area, as appropriate.
Sites
1.
Eas
t Ic
elan
d
2.
Wes
t Ic
elan
d
3.
Ho
rnst
rand
ir
4.
Kap
Rin
k
5.
Zac
ken
ber
g
6.
Kar
up
elv
7a.
By
lot
Isla
nd
7b
. B
ylo
t Is
lan
d
8a.
Chu
rch
ill
8b
. C
hu
rch
ill
9.
Kar
rak
Lak
e
10
. E
gg
Riv
er
11
. P
rud
ho
e B
ay
12
. P
rib
ilo
f Is
lan
ds
13
. S
hem
ya
Isla
nd
14
. W
ran
gel
Isl
and
15
. M
edn
yi
Isla
nd
16
. S
abet
ta
17
. B
ely
i Is
lan
d
18
. E
rku
ta
19
. N
enet
sky
20
a. K
olg
uev
Isl
and
20
b. K
olg
uev
Isl
and
21
. L
on
gy
earb
yen
22
. N
y-Å
lesu
nd
23
. F
inn
ish
Lap
lan
d
24
. H
elag
s
25
. B
org
a
26
. V
ind
elfj
älle
n/A
rjep
log
27
. N
orr
bo
tten
28
. V
aran
ger
29
. If
jord
fjel
let/
Rei
sa/D
ivid
alen
30
. S
altf
jell
et
31
. B
ørg
efje
ll
32
. L
iern
e/S
yla
ne
33
. S
nø
het
ta/K
nu
tshø
/Fin
se
34
. H
ard
ang
erv
idd
a
1. Monitoring
objectivesa
Scientific 2 2 1 ● ● ● ● ● ● ● ● ● ● 1 2 ● ● ● ● ● ● ● ● 2 2 2 2 2 2 2 2 1 2 1 2 1 2
Management 1 1 2 2 1 1 1 1 1 1 1 1 1 1 1 1 1 1 1
2. Monitored
variables
3. Monitoring techniques
10
Arctic foxes
Abundance Total census of dens in study
area
● ● ● ● ● ● ● ○ ● ● ● ● ● ● ● ● ● ● ● ● ● ● ● ● ● ○ ● ● ● ● ● ● ●
Proportion of active dens in
summer
● ● ● ● ● ● ● ● ● ● ● ● ● ● ● ● ● ● ● ● ● ● ● ● ● ○ ● ● ● ● ● ● ●
Proportion of active dens in
winter
● ● ● ● ○ ○ ○ ○ ● ● ● ● ● ● ●
Capture–mark–recapture ● ● ● ● ● ●
Number of observed foxes ● ● ● ● ○ ● ● ● ● ● ● ● ● ●
Number of foxes per sampling
effort
● ● ● ● ● ●
Reproductive effort Proportion of reproductive
dens
● ● ● ● ● ● ● ● ● ● ○ ● ● ● ● ● ● ● ● ● ● ● ● ● ● ● ● ● ● ○ ● ● ● ● ● ● ●
Number of fetuses/placental
scars
● ● ● ● ○ ● ● ● ● ● ● ● ●
Litter size Visual observations ● ● ● ● ● ● ● ● ○ ● ● ● ● ● ● ● ● ● ● ● ● ● ● ● ● ● ● ● ● ● ● ● ●
Automatic cameras ○ ● ○ ○ ○ ○ ○ ○ ○ ○ ● ● ● ○ ○ ○ ○ ● ○ ○ ○ ● ○
Age structure Tooth condition of live
individuals
● ● ● ●
Programme of carcass
collection
● ● ○ ● ● ● ● ○ ● ● ● ● ● ● ● ●
Harvest statistics ● ● ● ● ● ●
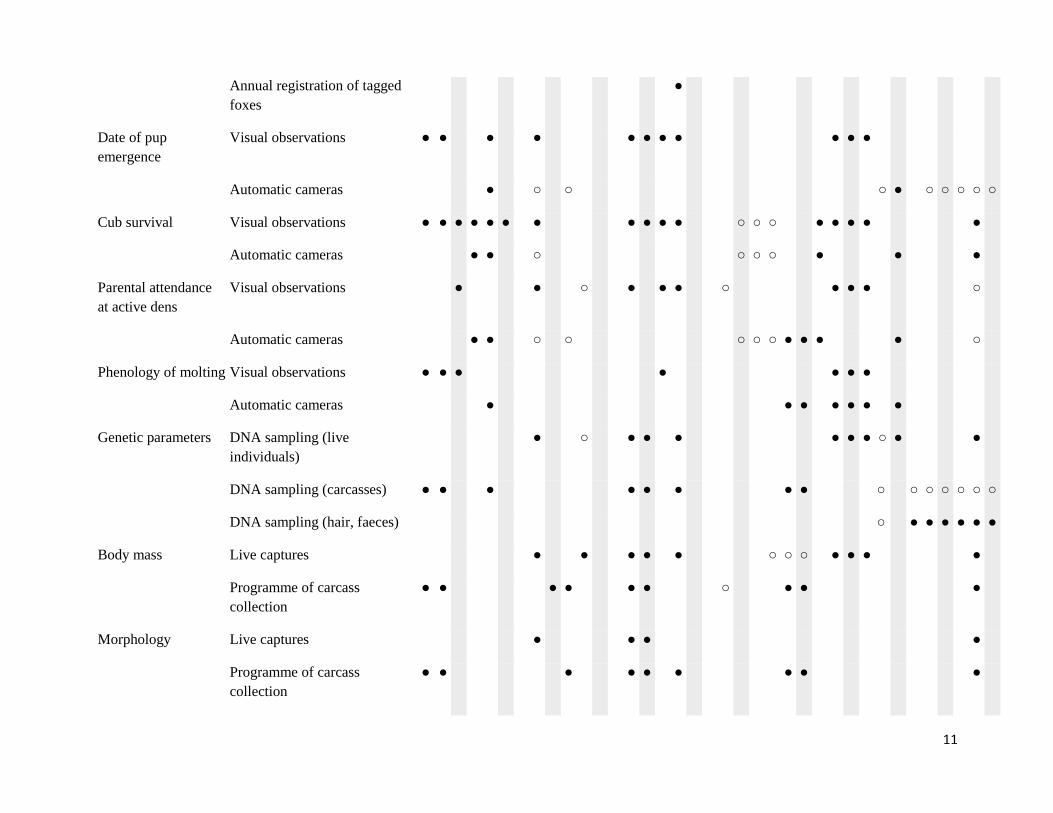
11
Annual registration of tagged
foxes
●
Date of pup
emergence
Visual observations ● ● ● ● ● ● ● ● ● ● ●
Automatic cameras ● ○ ○ ○ ● ○ ○ ○ ○ ○
Cub survival Visual observations ● ● ● ● ● ● ● ● ● ● ● ○ ○ ○ ● ● ● ● ●
Automatic cameras ● ● ○ ○ ○ ○ ● ● ●
Parental attendance
at active dens
Visual observations ● ● ○ ● ● ● ○ ● ● ● ○
Automatic cameras ● ● ○ ○ ○ ○ ○ ● ● ● ● ○
Phenology of molting Visual observations ● ● ● ● ● ● ●
Automatic cameras ● ● ● ● ● ● ●
Genetic parameters DNA sampling (live
individuals)
● ○ ● ● ● ● ● ● ○ ● ●
DNA sampling (carcasses) ● ● ● ● ● ● ● ● ○ ○ ○ ○ ○ ○ ○
DNA sampling (hair, faeces) ○ ● ● ● ● ● ●
Body mass Live captures ● ● ● ● ● ○ ○ ○ ● ● ● ●
Programme of carcass
collection
● ● ● ● ● ● ○ ● ● ●
Morphology Live captures ● ● ● ●
Programme of carcass
collection
● ● ● ● ● ● ● ● ●
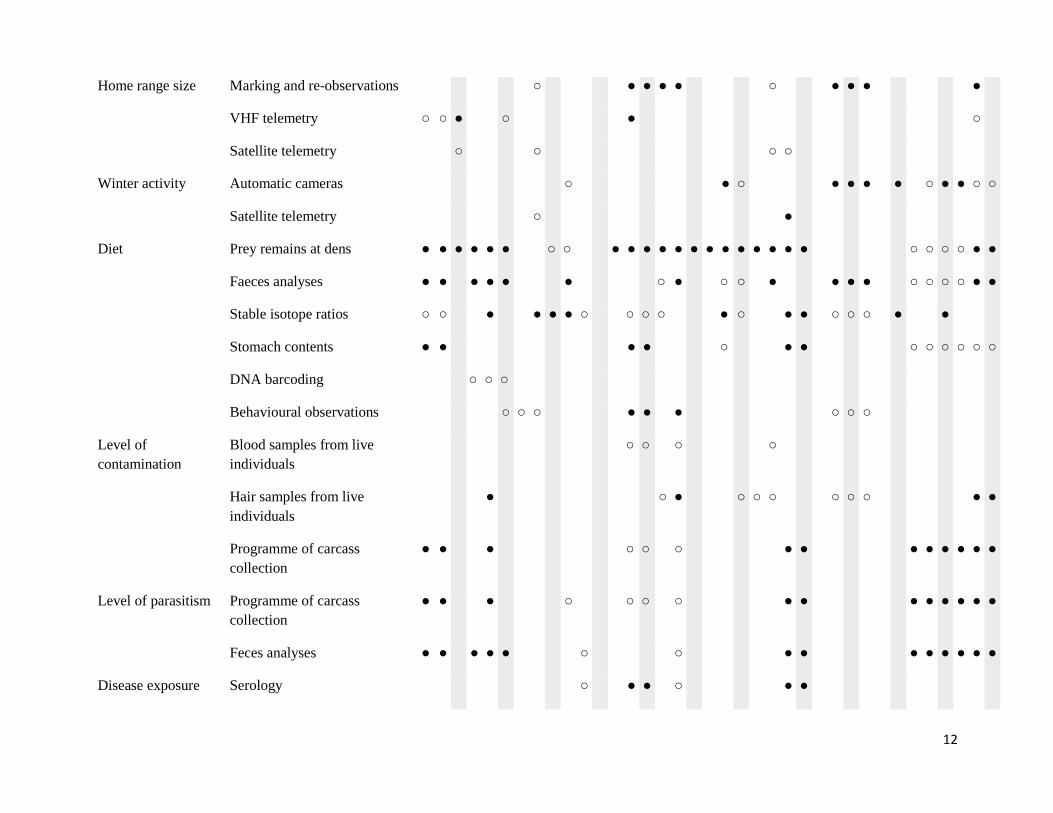
12
Home range size Marking and re-observations ○ ● ● ● ● ○ ● ● ● ●
VHF telemetry ○ ○ ● ○ ● ○
Satellite telemetry ○ ○ ○ ○
Winter activity Automatic cameras ○ ● ○ ● ● ● ● ○ ● ● ○ ○
Satellite telemetry ○ ●
Diet Prey remains at dens ● ● ● ● ● ● ○ ○ ● ● ● ● ● ● ● ● ● ● ● ● ● ○ ○ ○ ○ ● ●
Faeces analyses ● ● ● ● ● ● ○ ● ○ ○ ● ● ● ● ○ ○ ○ ○ ● ●
Stable isotope ratios ○ ○ ● ● ● ● ○ ○ ○ ○ ● ○ ● ● ○ ○ ○ ● ●
Stomach contents ● ● ● ● ○ ● ● ○ ○ ○ ○ ○ ○
DNA barcoding ○ ○ ○
Behavioural observations ○ ○ ○ ● ● ● ○ ○ ○
Level of
contamination
Blood samples from live
individuals
○ ○ ○ ○
Hair samples from live
individuals
● ○ ● ○ ○ ○ ○ ○ ○ ● ●
Programme of carcass
collection
● ● ● ○ ○ ○ ● ● ● ● ● ● ● ●
Level of parasitism Programme of carcass
collection
● ● ● ○ ○ ○ ○ ● ● ● ● ● ● ● ●
Feces analyses ● ● ● ● ● ○ ○ ● ● ● ● ● ● ● ●
Disease exposure Serology ○ ● ● ○ ● ●
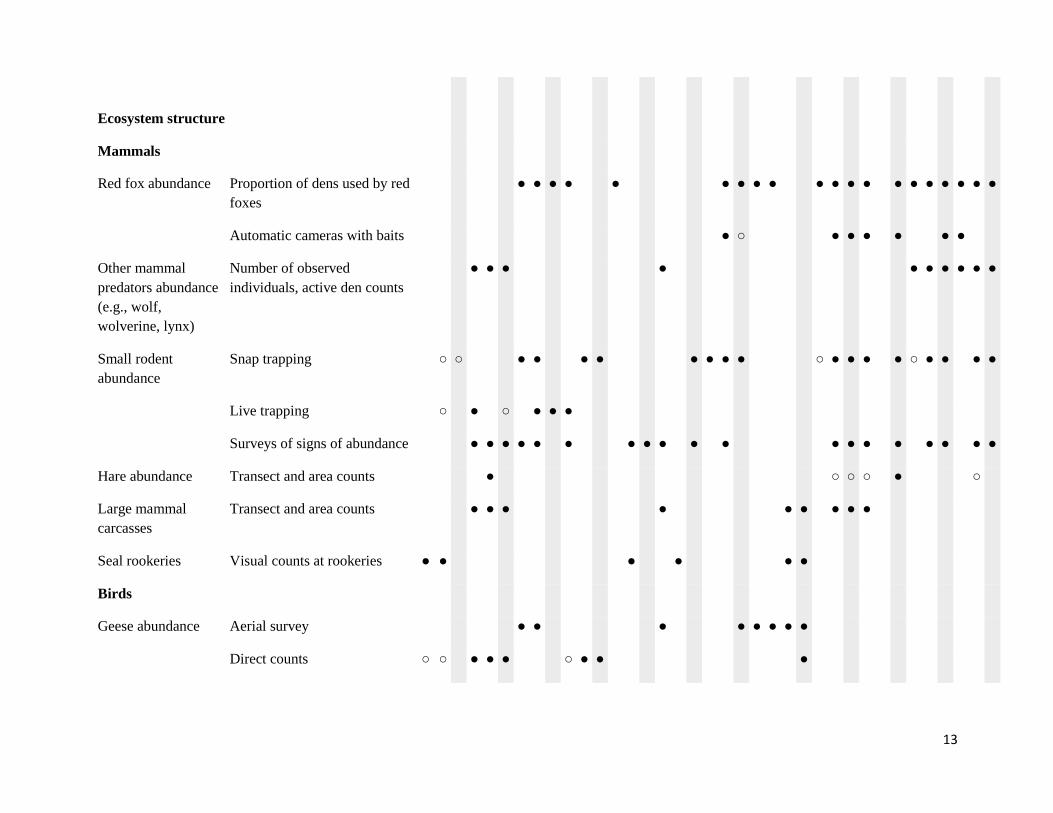
13
Ecosystem structure
Mammals
Red fox abundance Proportion of dens used by red
foxes
● ● ● ● ● ● ● ● ● ● ● ● ● ● ● ● ● ● ● ●
Automatic cameras with baits ● ○ ● ● ● ● ● ●
Other mammal
predators abundance
(e.g., wolf,
wolverine, lynx)
Number of observed
individuals, active den counts
● ● ● ● ● ● ● ● ● ●
Small rodent
abundance
Snap trapping ○ ○ ● ● ● ● ● ● ● ● ○ ● ● ● ● ○ ● ● ● ●
Live trapping ○ ● ○ ● ● ●
Surveys of signs of abundance ● ● ● ● ● ● ● ● ● ● ● ● ● ● ● ● ● ● ●
Hare abundance Transect and area counts ● ○ ○ ○ ● ○
Large mammal
carcasses
Transect and area counts ● ● ● ● ● ● ● ● ●
Seal rookeries Visual counts at rookeries ● ● ● ● ● ●
Birds
Geese abundance Aerial survey ● ● ● ● ● ● ● ●
Direct counts ○ ○ ● ● ● ○ ● ● ●
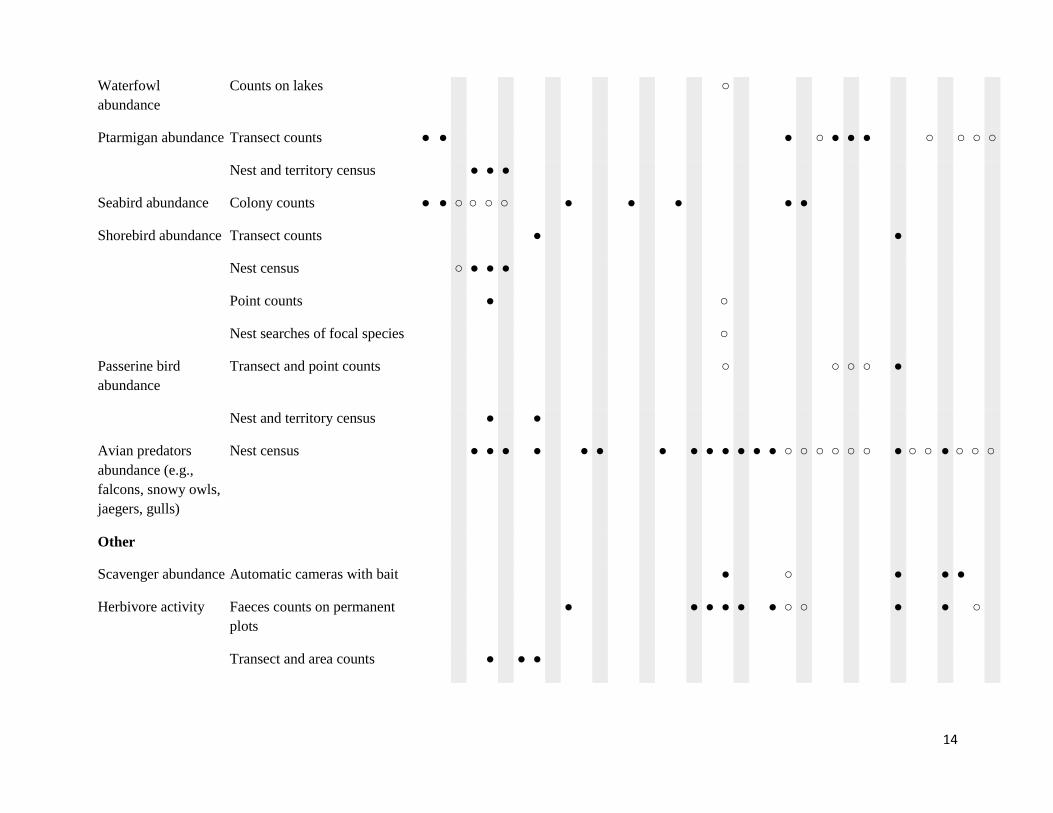
14
Waterfowl
abundance
Counts on lakes ○
Ptarmigan abundance Transect counts ● ● ● ○ ● ● ● ○ ○ ○ ○
Nest and territory census ● ● ●
Seabird abundance Colony counts ● ● ○ ○ ○ ○ ● ● ● ● ●
Shorebird abundance Transect counts ● ●
Nest census ○ ● ● ●
Point counts ● ○
Nest searches of focal species ○
Passerine bird
abundance
Transect and point counts ○ ○ ○ ○ ●
Nest and territory census ● ●
Avian predators
abundance (e.g.,
falcons, snowy owls,
jaegers, gulls)
Nest census ● ● ● ● ● ● ● ● ● ● ● ● ● ○ ○ ○ ○ ○ ○ ● ○ ○ ● ○ ○ ○
Other
Scavenger abundance Automatic cameras with bait ● ○ ● ● ●
Herbivore activity Faeces counts on permanent
plots
● ● ● ● ● ● ○ ○ ● ● ○
Transect and area counts ● ● ●
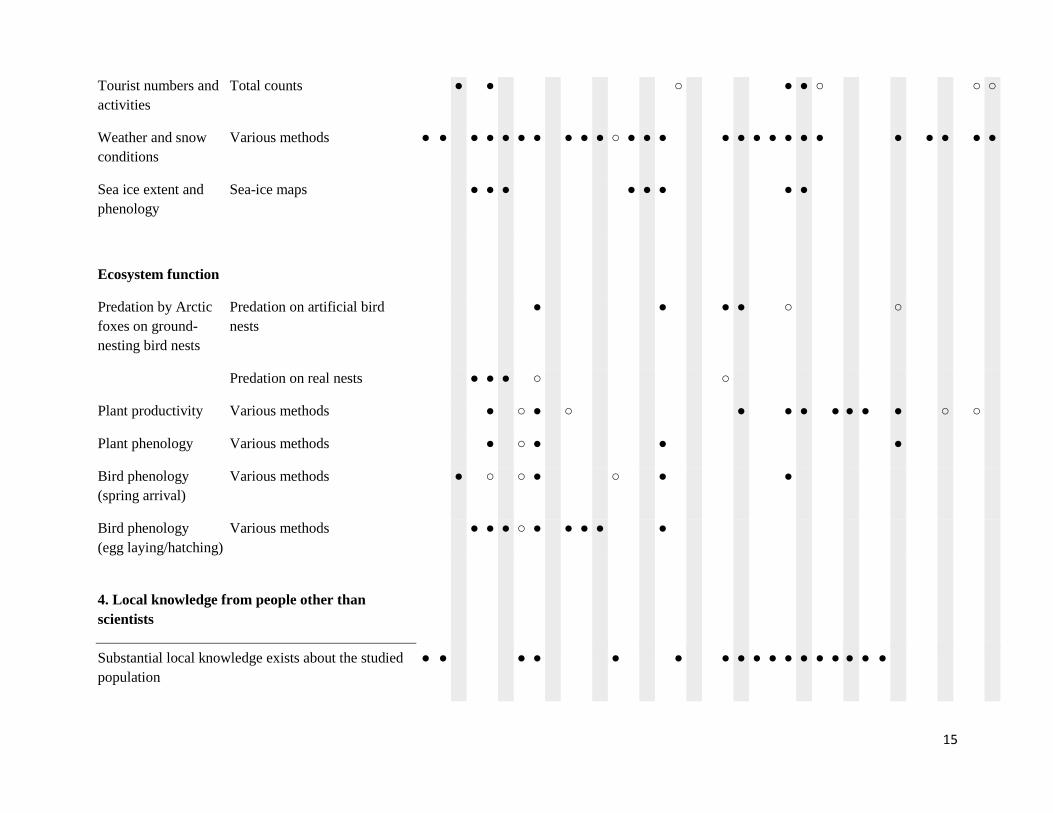
15
Tourist numbers and
activities
Total counts ● ● ○ ● ● ○ ○ ○
Weather and snow
conditions
Various methods ● ● ● ● ● ● ● ● ● ● ○ ● ● ● ● ● ● ● ● ● ● ● ● ● ● ●
Sea ice extent and
phenology
Sea-ice maps ● ● ● ● ● ● ● ●
Ecosystem function
Predation by Arctic
foxes on ground-
nesting bird nests
Predation on artificial bird
nests
● ● ● ● ○ ○
Predation on real nests ● ● ● ○ ○
Plant productivity Various methods ● ○ ● ○ ● ● ● ● ● ● ● ○ ○
Plant phenology Various methods ● ○ ● ● ●
Bird phenology
(spring arrival)
Various methods ● ○ ○ ● ○ ● ●
Bird phenology
(egg laying/hatching)
Various methods ● ● ● ○ ● ● ● ● ●
4. Local knowledge from people other than
scientists
Substantial local knowledge exists about the studied
population
● ● ● ● ● ● ● ● ● ● ● ● ● ● ● ● ●
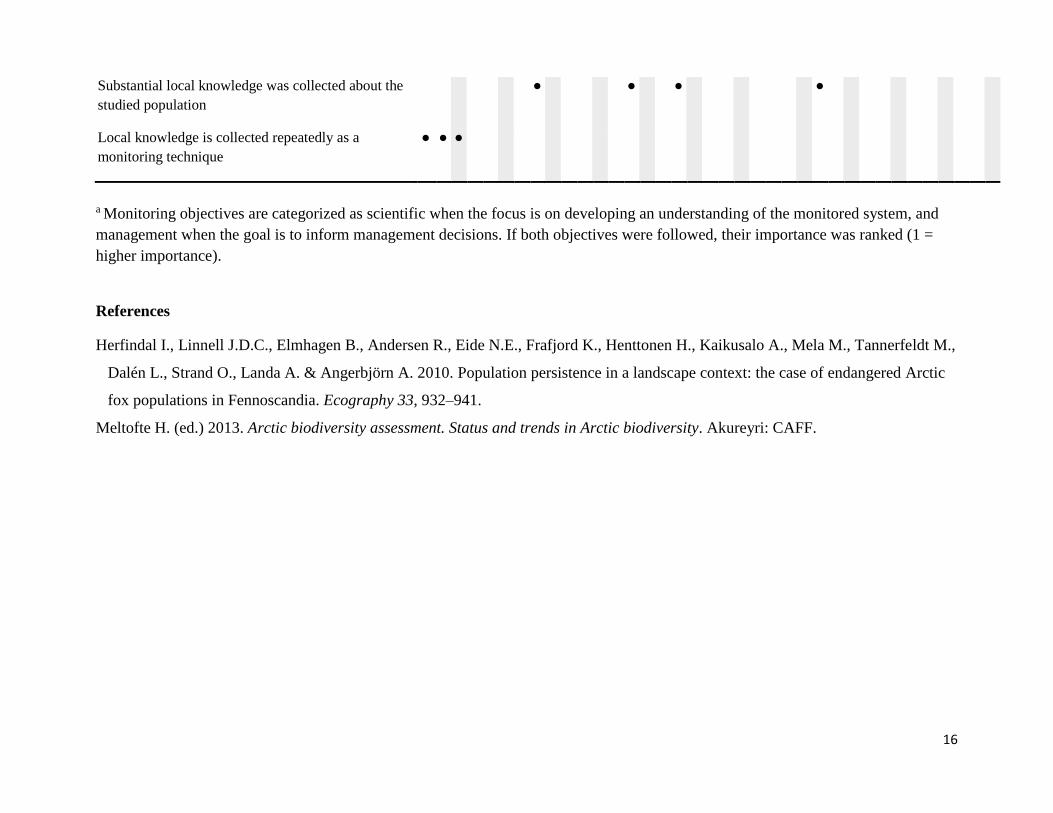
16
Substantial local knowledge was collected about the
studied population
● ● ● ●
Local knowledge is collected repeatedly as a
monitoring technique
● ● ●
a Monitoring objectives are categorized as scientific when the focus is on developing an understanding of the monitored system, and
management when the goal is to inform management decisions. If both objectives were followed, their importance was ranked (1 =
higher importance).
References
Herfindal I., Linnell J.D.C., Elmhagen B., Andersen R., Eide N.E., Frafjord K., Henttonen H., Kaikusalo A., Mela M., Tannerfeldt M.,
Dalén L., Strand O., Landa A. & Angerbjörn A. 2010. Population persistence in a landscape context: the case of endangered Arctic
fox populations in Fennoscandia. Ecography 33, 932–941.
Meltofte H. (ed.) 2013. Arctic biodiversity assessment. Status and trends in Arctic biodiversity. Akureyri: CAFF.