harmonisation in cost accounting practices at wavinessay.utwente.nl/61469/1/msc_r_kroes.pdf ·...
TRANSCRIPT

Master Thesis
Business Administration
Ruben Kroes
March 2012
Public Version
Harmonisation in cost accounting practices at Wavin

1
Creating harmonisation in cost accounting practices at
Wavin
Student: R.J.B. Kroes S0189588 Business Administration Track: Financial Management Supervisors University: Dr. T. de Schryver Ir. H. Kroon
Supervisor Wavin: Mr. V. Diepmaat Controller Operations
Enschede, 12 March 2012

2
Preface
This report is written to graduate for my Master of Science degree in Business Administration. I
followed the track financial management during the master. In order to deepen en broader my
knowledge about business finance I wanted to perform my thesis on a financial topic for an
international operating company. Wavin has given me the opportunity to execute my thesis for them
and to develop myself and gain more financial knowledge in a challenging environment.
I would like to thank several persons for the support during the research and writing the thesis. I
would like to thank Vincent Diepmaat for the opportunity to perform my thesis within Wavin. Every
two weeks we had a meeting to reflect on the process and discuss relevant topics of the research.
These discussions had an added value to the research and helped to broader and deeper my
knowledge about cost accounting. Next I would like to thank Cong Phung Nguyen who guided me
throughout Wavin, was always available for questions and helped me to retrieve the necessary data.
I also would like to thank the supervisors of the University of Twente. I would like to thank Dr. Tom
Schryver for his critical look to the research and interesting conversations in order to bring the thesis
to a higher level. Next I also would like to thank Ir. Henk Kroon for the valuable adjustments to the
report.
Finally I would like to thank all the persons of the controlling department of Belgium, Germany and
the Netherlands who have provided me the necessary information to elaborate the research.
Especially thank to the department of Hardenberg for the pleasant working environment where I
have worked the last months.
Ruben Kroes,
Enschede, March 2012

3
Summary
This master thesis analyses differences in cost accounting practices and explorers opportunities to
increase harmonisation between Belgium, Germany and the Netherlands. Wavin had a decentralised
organisation structure in the past, which caused diverging cost accounting practices. Wavin would
like to harmonise cost accounting practices to reduce costs, improve communication and create
transparency. Wavin has three types of cost price calculations the standard, IFRS adjustment and
fiscal cost price, these are analysed to improve harmonisation.
The thesis provides insights about the cost prices namely the functions, definitions, calculations
differences and a proposal for creating harmonisation. The problem definition of the thesis is:
analysing differences in cost accounting practices and a proposal for the harmonisation of the cost
accounting system. In order to answer the problem first the definitions, functions and calculations of
the standard cost price, IFRS adjustment and fiscal cost price have to be known.
The standard cost price is the price for a product which is determined on forecasted raw materials,
the budgeted direct production cost and depreciation costs (Accounting Manual Wavin, 2008).
Budgeted direct production costs are energy, labour, maintenance, packaging and other costs. Other
costs incorporated in the standard cost price are direct materials, depreciation based on replacement
value and a mark up. The function of the standard cost price is used for profit measurement,
inventory valuation and to support managerial decision making.
The IFRS adjustment calculation caused confusion, because among employees it was first known as
the commercial cost price and the accounting manual of Wavin does not prescribes the right
definition. The IFRS adjustment is calculated every month for inventory valuation, the total costs of
sales have to match with the inventory value. To arrive at the IFRS adjustment the following
calculations have to be performed an adjustment for raw materials, adjustment for direct
depreciation, adjustment for indirect costs such as indirect production, storage & distribution and
depreciation and finally an adjustment for intercompany products.
The fiscal cost price is calculated for external financial reporting to value inventory based on the
international financial reporting standards (IFRS) and general accepted accounting principles (GAAP).
The IFRS requires finished products to be valued at the absorption price or lower net realisable value.
The fiscal cost price incorporates the similar costs as the standard cost price, but is based on actual
costs. Depreciation is based on historical costs instead of replacement value. Besides actual indirect
costs have to be added, these are the same as in the IFRS adjustment.
The standard cost price differs because of the different allocation methods of costs. Depreciation is
in Belgium, Germany and the Netherlands not calculated according to the accounting manual and
energy is in Belgium differently allocated in comparison to the other countries. Overall there are
limited differences, because Wavin has already been started with the harmonisation of the standard
cost price.

4
The IFRS adjustment was the most difficult to grasp. Each country has its own calculation model
which causes inconsistencies. Costs for indirect storage & distribution are not allocated in Belgium
and the Netherlands. Germany does not incorporate an adjustment for direct depreciation and the
Netherlands bases their figures on average budgeted figures instead of actual figures. Remarkable
contains the accounting manual mistakes about the definition and calculation of the IFRS adjustment,
which creates ambiguity.
The Fiscal cost price differs because of rules, regulations and different calculation models. The most
practices within Wavin are according to the rules of the International Financial Reporting Standards,
but for inventory valuation countries have to follow to Local Accepted Accounting Principles.
Germany has to calculate inventory according to net realisable value in contradiction to Belgium and
the Netherlands, who value inventory according to current costs. In Belgium it is prohibited to
incorporate indirect costs for inventory valuation.
Harmonisation in cost accounting practices can be achieved through eliminating the differences as
much as possible. The harmonisation should lead to improved communication, prevents different
interpretations, creates uniformity and reduces costs. This can be achieved by creating
harmonisation in calculations and allocation of costs for all countries. The accounting manual should
have an important role in the harmonisation, it should be the leading format where all important
knowledge can be retrieved. Harmonisation of the standard cost price can be achieved by allocating
costs according to an unified method. This means that depreciation has to be based on 80% of
planned operating time and energy should be allocated based on production volume in all countries.
For the IFRS adjustment it is recommended to create a redesign which incorporates all necessary
costs. A redesign for the IFRS adjustment is elaborated in the thesis and could be applied for all
countries. Benefits of the redesign are harmonisation of procedures, improvement of quality,
employees can be exchanged between countries and calculations are simplified. The fiscal cost price
is currently a very extensive calculation mainly the German method. It is recommended to redesign
this calculation to improve efficiency and transparency. The redesign should consist of similar steps
for all countries. The model of the standard cost price can be used to allocate actual costs, but
instead of budgeted costs actual costs have to be used and indirect costs have to be added.
Depreciation has to be based on historical value instead of replacement value. In Belgium it is
prohibited to incorporate indirect costs, which makes the calculation less complex. After these steps
Belgium and the Netherlands are finished and could upload the costs into SAP, Germany has to
perform additional steps to meet the local requirements. Currently the calculation files of the cost
prices are out dated and have to be updated with the newest functions of excel or replaced by SAP
technology.
To overcome problems with the management of knowledge, it is recommended to improve storage
of knowledge. The accounting manual should be the leading format which contains clear definitions
and prescribes which cost components have to be incorporated. Without a clear accounting manual
harmonisation will be impeded. Improved management of knowledge could prevent different
interpretations, mistakes will be prevented and harmonisation will be stimulated.

5
Table of Content
Summary ................................................................................................................................................. 2
Table of Content ...................................................................................................................................... 5
1. Introduction of company ..................................................................................................................... 7
1.1 Background Wavin .................................................................................................................. 7
1.2 Introduction to problem .......................................................................................................... 8
1.3 Problem Analysis ..................................................................................................................... 9
1.4 Stakeholders .......................................................................................................................... 12
1.5 Objectives .............................................................................................................................. 13
1.6 Problem definition and research questions .......................................................................... 13
2. Theoretical framework .................................................................................................................. 14
3. Research design ............................................................................................................................. 23
3.1 Research method .................................................................................................................. 26
3.2 Data Collection ...................................................................................................................... 27
3.3 Relevance of research ........................................................................................................... 28
4. Definitions, functions and calculations of the standard cost price, IFRS adjustment and fiscal cost
price ............................................................................................................................................... 29
4.1 Standard cost price ................................................................................................................ 29
4.2 IFRS Adjustment .................................................................................................................... 32
4.3 Fiscal Cost Price ..................................................................................................................... 33
4.4 Comparison of cost prices ..................................................................................................... 35
5. Analysing differences between Cost Prices of Belgium, Germany, Netherlands and Accounting
manual ........................................................................................................................................... 36
5.1 Standard cost price ................................................................................................................ 36
5.2 IFRS Adjustment .................................................................................................................... 38
5.3 Fiscal cost price...................................................................................................................... 41
5.4 Differences between Standard, IFRS and Fiscal Cost Price ................................................... 43

6
5.5 Conclusion ............................................................................................................................. 44
Table 3 Overview differences cost prices .............................................................................................. 46
6. Creating harmonisation in accounting practices ........................................................................... 51
6.1 Standard Cost Price ............................................................................................................... 51
6.2 IFRS Adjustment .................................................................................................................... 52
6.3 Fiscal Cost Price ..................................................................................................................... 53
6.4 General recommendations for increasing convergence ....................................................... 54
6.5 Conclusion ............................................................................................................................. 56
7. Redesign of IFRS Adjustment ........................................................................................................ 58
7.1 Impact of redesign IFRS ......................................................................................................... 60
7.2 Benefits of the redesign ........................................................................................................ 62
8. Conclusions .................................................................................................................................... 63
8.1 Recommendations for harmonisation .................................................................................. 67
8.2 Reflection of objectives ......................................................................................................... 68
8.3 Future Research .................................................................................................................... 69
References ............................................................................................................................................. 70
Articles and books ............................................................................................................................. 70
Other Information ............................................................................................................................. 71
Appendix................................................................................................................................................ 72

7
Belgium; Aalter, Sint-Niklaas
Extrusion
1. Introduction of company
1.1 Background Wavin
Wavin is an international operating company which produces plastic solutions for below and above
the ground for hot & cold tap water, surface heating and cooling, soil and waste, rainwater
management and last mile telecom. With offices in 26 European countries and 16 manufacturing
plants Wavin is leader in Europe (Wavin annual report, 2010). To serve customers overseas Wavin
has a network of agents in Asia, America, Africa and Middle East. The turnover was 1.2 billion
worldwide in 2010. Wavin is listed on the Amsterdam stock exchange (Amsterdam midcap index).
The strategy of Wavin is to bring the company back on the path to sustainable and profitable growth
and the benefits when the markets return to normal levels (www.wavin.com). Priorities of Wavin are
to continuously build on extending their market position in all markets, to offer a complete portfolio
of products, produce 95% of the orders in time, reduce their carbon footprint and be innovative
(wavin.com).
The company is active in two distinctive market segments above and below the ground. Above the
ground products are plastic pipe and fitting systems for hot and cold tap water, surface heating and
cooling, soil and waste discharge and electrical conduit applications. Below the ground products are
plastic pipe and fitting systems for foul water discharge, water management, cable ducting as well as
water and gas distribution. Products for the two market segments are produced in all countries. The
plants of interest for this research are Hardenberg (Netherlands), Aalter and Sint-Niklaas (Belgium),
Twist and Westeregeln (Germany). Plants are geographically located to serve customers in a range
around the plant and because of the relatively high logistical costs per product due to the size,
products can only be distributed within a range otherwise distribution costs would be too high.
Production processes are injection moulding, extrusion and special products.
Figure 1 Plants Wavin Belgium, Germany and the Netherlands
Germany; Twist &
Westeregeln
Extrusion
Injection Moulding
Handmade
The Netherlands; Hardenberg
Extrusion
Injection Moulding
Handmade

8
Injection moulding is the production of plastic fittings using the injection moulding process. This is a
manufacturing method where melted material is forced into a mould (which is the inverse of the
product's shape), usually under high pressure, and then cooled so the material takes on the shape of
the mirror image of the mould (Accounting manual, 2008).
Extrusion is the production of plastic pipes using the extrusion process. Extrusion is a manufacturing
method where a material is pushed through a die to forming the desired product (pipes).
Specials consist of handmade products; “Handmade” is the department where plastic pipes, fittings
or other products are manually manufactured or assembled. Examples: manholes, bends made from
extruded pipe, handmade fittings, assemblies of injection moulded fittings, inspection chambers,
reworked bought-in products, sewage treatment units (IBA’s), non-standard drains (Tegra’s),
etcetera.
1.2 Introduction to problem
In the past Wavin was a decentralised organisation and consisted of a geographical structure, this
caused that activities and processes were designed independently and performed to satisfy the
needs of customers. In terms of responsibility centres Wavin had investment centres, local centres
were responsible for revenue, costs, profit and investments. A major advantage was the
responsiveness to local market conditions and greater accountability. Disadvantages of investment
centres are problems with coordination, communication between responsibility centres and with the
head quarter and unfairness in allocation of costs between responsibility centres. Since the
globalization of the markets and decline in the housing market, the competition has increased and
selling prices are under pressure. Existing practices have to be reviewed in order to be competitive.
Wavin has started this process by reducing costs through centralising support functions as the
purchase, HRM, planning and financial departments. These supporting functions are now centralised
per region. The finance & controlling department which has the interest of this thesis, supports
functions for Belgium, Germany and the Netherlands and is transferred to Hardenberg (Netherlands).
The process of centralisation of the finance and controlling department revealed that the Belgian,
German and Dutch centres have all their distinctive cultures, procedures, calculations and
interpretations. Mainly cost accounting practices have major differences between the countries. In
order to reap the benefits of the centralisation of the finance and controlling department,
harmonisation between cost accounting practices have to be created. The harmonisation should lead
to synergy effects, higher efficiency and reduce of costs finally.

9
Other reasons for harmonisation are to standardise practices, increase transparency, create
uniformity across the organisation and improve communication. The aim of the thesis is to explore
opportunities to reduce the differences in cost accounting practices in order to increase
harmonisation.
The thesis is limited to the controlling department with special interest to cost price calculations.
Wavin has three distinctive types of cost price calculations the standard cost price, commercial cost
price and the fiscal cost price. The standard cost price is the price for a product which is determined
on the forecasted prices of PVC and PE1 (raw materials), budgeted direct production costs and
depreciation costs (Accounting Manual Wavin, 2008). The standard is used as input for selling prices,
variances analysis, profit measurement and managerial decision making.
The fiscal cost price is calculated for external financial reporting to value inventory based on actuals
on the international financial reporting standards (IFRS) and general accepted accounting principles
(GAAP). The IFRS requires finished products to be valued at absorption costing which comprises the
costs of raw materials, actual direct production costs, actual direct depreciation based on historical
costs and the actual indirect costs.
The Commercial cost price is for inventory revaluation each month. A decisive definition of the
commercial cost price has not yet defined, because employees have different interpretations and the
accounting manual does not defines the commercial cost price. The first research questions should
clarifies the definition of the cost prices.
The aim of the thesis is to identify international differences between the standard, commercial and
fiscal, propose a plan for harmonisation for the three cost prices and to find possibilities to create
more integration between the three cost prices (standard, commercial and fiscal). First the problems
will be further analysed, secondly literature will be reviewed, third the research questions will be
answered through a gap analysis, a proposal for convergence will presented and finally one of the
proposed solutions will be further elaborated and the impact will be analysed.
1.3 Problem Analysis
The problems will now be further analysed to underpin the need for harmonisation within Wavin.
The most important findings related to the problem are:
Wavin has a decentralised structure from the history
Differences in allocation of costs
Different interpretations about the commercial cost price
Limited information/ knowledge is stored and therefore difficult to retrieve
Limited integration between standard, commercial and fiscal cost price
Efficiency of fiscal cost price 1 Polyvinylchloride and Polyether

10
History & Culture Wavin was a decentralised organisation in the past, countries worked independently of each other
and communications was limited. An example is the introduction of the ERP system2 SAP in the
Netherlands, German employees have already been using the system for a while, but have not been
consulted. The lack of communication between Germany and the Netherlands caused differences in
the use of SAP. The lack of collaboration and communication was not limited to the SAP system, but
effected also the calculations of the cost price runs. Cost price excel files were independently
designed and have differences. Each country has its own process, format/ lay-out, which makes
comparison difficult. For example German cost accounting procedures are more extensive in
comparison to Belgian and Dutch cost price practices. The diverging formats causes differences in
allocation of costs, which could have seriously impact on the performance of the responsibility
centres. If there is arbitrary allocation, inaccurate assignment of costs will appear and the
responsibility centres will have inaccurate estimations of costs.
Commercial cost price The commercial cost price caused the most ambiguity between the countries. Through interviewing
Belgian, German and Dutch employees (assistant controllers, controller operations) I noticed
different interpretations about the commercial cost price. Different interpretations are caused
through limited communication between the countries, and the lack of storage of knowledge in the
accounting manual. Employees are lacking the limited guidelines and are depending on past
experiences and other employees. At this stage of the research a decisive definition and overview of
the right calculation has not yet be identified. Another remarkable finding concerning the
commercial cost price is that it has not been calculated in the Netherlands for the last two years.
According to the controller operations this is caused through the huge fluctuations of raw materials
and production costs, which caused large deviations between the budgeted and actual prices and
finally led to large re- devaluations of inventories. In December inventories were valuated according
to the commercial cost price principle, which incorporates a comparison between the actual and
budgeted costs. In the case of Wavin a huge revaluation occurred in December, because of the
deviation between budgeted and actual costs (higher price raw materials and production costs). In
January inventory was again revaluated against standard cost price, which caused a huge devaluation
of inventory. Based on these fluctuations in value of inventory, there is decided not to calculate the
commercial cost price anymore. In Belgium and Germany the commercial cost price is still calculated.
Storage of information The limited storage of information mainly about the fiscal and commercial cost price is not beneficial
for the comprehensiveness. The accounting manual of Wavin (2008 & 2010) describes the function of
the standard and fiscal cost price and gives an overview of the cost components incorporated in the
calculations, but does not prescribe how costs should be allocated and failed to incorporate the
commercial cost price. The accounting manual describes the planning and control organisation,
intercompany trade procedures, accounting and valuation principles, other reporting definitions,
core parts of balance sheet and profit loss account, cost centre structure and examples of accounting
2 SAP is an ERP system which is an integrated system and makes it possible to share and access information
directly and helps processing and managing business information.

11
topics. The undefined definitions (fiscal and commercial cost price) form a grey area and are thus
susceptible for interpretations. Currently employees obtain their knowledge from other employees.
Efficiency The decentralised structure and the diverging practices have affected the efficiency. There are major
differences in efficiency, mainly concerning the fiscal cost price (interviews assistant controllers).
German employees spend on average one week on calculating the fiscal cost price and in contrast
Dutch employees spend only one or two days. In the past the German calculation took two weeks,
thus the efficiency has been increased. According to assistant controller’s possible explanations for
these differences are the complexity of the German calculation, amount of production lines in
Germany and the requirements of the accountants. The requirements of the local accountants have
affected the design of the fiscal cost price seriously in each country. The different working methods,
experience and rules have caused an extremely extensive German fiscal cost price file according to
the former German assistant controller. Wavin assumes that there opportunities to increase
efficiency. Wavin would like to explore if integration between the different cost prices increases
efficiency. Through exchanging and integrating data of the different calculation it might be possible
that the calculation of the fiscal cost price could be simplified. For instance parts of the standard cost
price could be used for the fiscal or commercial cost price or reversed.
Improvements Since the last years, there have been significant improvements regarding the cost price runs. The SAP
system is now similar for Germany and the Netherlands, which has increased the harmonisation.
Since a few years ago the controller operations has started the process of harmonizing the cost price
calculations through the design of a standard template for the standard cost price of extrusion.
Compared with the past this template breaks costs down into separate cost elements. For example
there is now a distinction between the allocation of set-up costs and packaging costs for each
production process. In the past the set-up costs of a production line were not known and set-up costs
were allocated over all products. As a consequence the selling price of some products increased or
decreased, which affected Wavin’s competiveness position. For example small batches of customized
products have relative high set-up costs and large batches relatively low set-up costs. In the past
there was no distinction between customized products and standardised products. This caused a
higher price of standard products and a lower price of customized products compared with
competitors. The existing template allows Wavin to allocate set-up costs per production line, which
improves the allocation and competiveness.
The template for the standard cost price has already been used for the calculation of the standard
cost price of extrusion in Belgium and the Netherlands and will be implemented in Germany in the
next months. Employees of the controlling department have already made efforts to implement the
template for other production process such as injection moulding and special products. Wavin would
like to implement the format for all standard cost price calculations of North West European
countries.

12
Conclusion Cost prices calculations are different between Belgium, Germany and the Netherlands. Costs are
allocated differently and procedures are diverging. Formats are not transparent enough which makes
it difficult for employees to perform, understand calculations or make comparisons. Employees have
different interpretations about the commercial cost price, there are no clear guidelines how cost
prices should be calculated, limited information is stored and cost price runs are not designed
efficiently. As a consequence the cost price calculation takes more time in one country than in
another and the analysis of figures is more sophisticated. The purpose of the thesis is to explore
possibilities to eliminate differences between the countries and create more integration between the
different kinds of cost price systems. Based on literature divergence and convergence in cost
accounting practices will be explored and framework to analyse the differences will be presented.
1.4 Stakeholders
Actors and stakeholders involved in the project are employees within the organization who have an
interest in the research or will be affected by research. The master thesis will be performed for the
department finance and controlling for Wavin Belgium, Germany and Netherland. These countries
are part of North West Europe region (NWE), other countries in this region are Denmark, Finland,
Norway and Sweden. One of the main offices of the NWE region is located at Hardenberg, from
where I perform my thesis. The most important stakeholders are mentioned in figure 2 and in the
thesis you will find references to those stakeholders.
Stakeholders of Wavin directly involved in the process are:
Vincent Diepmaat
Controller Operations NWE
Location: Hardenberg
Georg Kieft
Assistant Controller Finance and controlling Germany, Location: Hardenberg & Twist (Germany)
Cong Phung Nguyen
Assistant Controller Finance and Controlling Netherlands,
Location: Hardenberg
Alain Van Ryckeghem
Controller Belgium
Location: Aalter
Horst Bender
Former Assistant Controller Germany Location Twist
(currently demand manager North West Europe)
Jan Lubbers
Administrator management/ cost price information Finance
and controlling Location: Hardenberg
Figure 2 stakeholders

13
1.5 Objectives
Objectives are defined beforehand in collaboration with the supervisor of Wavin. The objectives
should be achieved at the end of the Master Thesis. The objectives are:
Describe extensively the standard, commercial and fiscal cost prices of Wavin Belgium,
Germany and the Netherlands
Compose a detailed overview of differences in cost price calculation especially the
commercial and fiscal cost price
Identify causes and consequences of the difference between countries
Elaborate a proposal to solve the problems; include a proposal for convergence of the
international cost price system and a proposal for the integration of the different cost
prices systems to achieve harmonisation and efficiency
Create a redesign for the IFRS adjustment
1.6 Problem definition and research questions
During the exploratory analysis problems and causes are identified. Important findings are cost prices
are calculated differently in countries, different formats are used, limited information is stored,
efficiency varies strong across countries and different interpretations exists of the commercial cost
price. Based on these findings the following problem definition is defined.
“Analysing differences in cost accounting practices and a model/ proposition for the harmonisation
of the cost accounting system”
To answer the problem definition and to meet the objectives there are several sub questions
developed. The research questions should provide the necessary information to answer the problem
definition and meet the objectives.
1. What is the definition and function of the commercial, fiscal and standard cost price at
Wavin?
2. How are the standard, commercial and fiscal cost price calculated and how should they be
calculated according to the accounting manual?
3. What describes the theory about harmonisation, theoretical concepts of cost accounting,
convergence and divergence of cost accounting practices?
4. What are differences and similarities in the calculation of the standard, commercial and
fiscal cost price between Wavin Belgium, Germany, the Netherlands and the accounting
manual and why?
5. How can the system of cost price calculation improved or redesigned in order to create more
convergence and increase efficiency?
6. How can the IFRS adjustment redesigned?

14
2. Theoretical framework
The purpose of this chapter is to consult existing literature about international accounting
differences and find possibilities to create more convergence within Wavin. Frameworks will be
reviewed in order to obtain more comprehensive knowledge of convergence and divergence in cost
accounting practices and to improve the cost accounting system of Wavin. Different perspectives
described in the literature could provide a different angle of incidence, which might be beneficial for
the research. Frameworks are selected based on suitability, feasibility and relevance for the thesis.
First existing research and theoretical concepts are reviewed, secondly frameworks are selected and
applied to Wavin in order to analyse differences.
International harmonisation of accounting standards has been the goal of many professional
accountants (Baker & Barbu, 2007), despite their efforts and the introduction of International
Accounting Standards (IAS) and International Financial Reporting Standards (IFRS) there are still
international differences. The goal of achieving international harmonisation is to create uniformity
between international accounting practices. Factors which might impede this harmonisation are
cultural, education, traditions, economic and legal differences among countries.
Many researchers found differences in accounting systems because of Hofstede (1980) cultural
dimensions, institutional variables (Powell & DiMaggio, 1983), contextual and economic variables
(Granlund & Lukka, 1999). The field of comparative management accounting is extensive, most
research focuses on e.g. control systems, market based accounting, activity based costing, guiding
techniques and financial accounting differences. In contrast to previous studies our study focus on
seeking explanations for exclusively cost accounting differences between national cost accounting
systems (Belgium, Germany, and Netherlands). Limited papers have investigated the differences
between cost accounting practices within countries, therefore this study might advance the field of
research. Another benefit is the inclusion of Belgium, Germany and the Netherlands, most research
focus on contradictions between UK, USA, Germany and Japan.
Most research focus on general management control systems, accounting management, financial
reporting accounting (IFRS, IAS, and GAAP) and market based accounting research. E.g. Saudagran &
Meek (1997), Tay & Parker (1990), van der Tas (1998) have developed a link between variables such
as tax systems, inflations patterns, political and economic ties and education and differences in
accounting systems. Doupnik and Salter (1995) included in their study environmental, institutional
and cultural variables for explaining differences in national accounting system. Most research has
compared management accounting practices between Germany, Japan, Australia and Anglophone
countries (UK, VS). Krumwiede (1998) investigated activity based costing between Germany and
Anglophone countries and Augst (1999) compared the degree of uncertainty avoidance between
Japan and Germany in relation with their cost accounting system.
First the most relevant theoretical concepts are discussed which are recurring in many management
accounting research. The concepts are based on the papers and books of Bhimani (1999, 2005, and
2007), Powell & DiMaggio (1983) and Hofstede (1987). Bhimani proposes several perspectives to
explain international differences in management accounting practices, according to these

15
perspectives explanations for differences in accounting practices will be briefly discussed. Bhimani
examines the following conceptual approaches: the contingency theory, the cultural contingency
approach, the new institutionalism perspective and the societal effects approach. Each concept will
be described independently, but it’s possible to merge concepts to provide a broader perspective on
cross national differences. A limitation of the studies of Bhimani is that he presents only the
methodological perspectives and does not specify the differences in cost accounting.
The contingency theory states that contextual factors influence organization structure and hereby
management accounting system. Contextual factors which can influence organisations are size,
technology, culture, environment and strategy. The contingency approach mainly focus on analysing
macro perspective. Through understanding contextual factors organizations are better enables to
design their cost accounting system. Bhimani has collected and published results of management
accounting practices based on the contingency theory of diverse nations in Europe, but did not
elaborate on the differences and similarities in detail.
The cultural contingency approach emphasizes that culture is seen as the dominant factor that
explains variation in management accounting across countries (Hofstede, 1987). Many researches
who have investigated cultural variations have applied Hofstede’s cultural variables. Hofstede
identifies four dimensions which explain differences between countries, namely individualism versus
collectivism, uncertainty avoidance, power distance and masculinity. Hofstede defines the
dimensions: Individualism refers to the extent to which individuals are integrated into groups.
Uncertainty avoidance refers to the degree of avoidance of uncertainty, organisations with a high
degree of uncertainty avoidance have more strict control systems. Power distance is viewed as the
extent to which the less powerful members of organizations and institutions expect and accept that
power is distributed unequally. Masculinity refers to competitiveness and assertiveness versus
modesty and caring. According to Schultz et al (2001), cultural factors play a dominant role in the
development of accounting systems. Uncertainty avoidance is seen as the most important feature of
explaining diversity among countries (Doupnik & Salter, 1995). Doupnik & Salter investigated
uncertainty in Germany, Japan, UK and USA and concluded that Germany and Japan are uncertainty
avoided countries compared to Anglophone countries (UK, USA). German and Japanese companies
have detailed and timely cost information available and using complex accounting systems (Aust,
1999). Anglophone countries are focusing on more simple systems for their cost accounting practices
in comparison to Germany and Japan.
New institutionalism studies how institutions interact and the way they affect each other and
explains why organization have the same isomorphism. Institutionalism isomorphism can be
distinguished by the literature of DiMaggio & Powell (1983) and incorporates the dimensions
coercive, normative and mimetic. Coercive is related with political and informal influence e.g. rules
and regulations. Mimetic pressures results from response to uncertainty and leads to the imitation of
practices of other companies. Accounting and consultancy companies do often imitate each other
practices. Companies imitate e.g. their activity based costing system, ERP software. Normative
pressures are associated with professionalization, e.g. accounting practice can be homogeneous
through professional institutions like Universities or professional networks who adapt the same
practices. Different educational systems between countries could affect cost accounting systems and
leads to divergence.

16
For further explanation of the institutional perspective the model of Granlund (1999) is used.
Granlund & Lukka (1999) developed a framework (Figure 3 Granlund & Lukka (1999)) which includes
both economic and institutional factors to identify convergence and divergence of management
accounting practices. The framework is an appropriate tool for systematic analysing convergence in
organisations and will therefore be used to analyse Wavin. Economic pressure are economic reasons
for convergence or divergence of management accounting practices e.g. global economic
fluctuations or increased market competition. The framework focuses on explanations for similarities
and dissimilarities of management accounting practices and is a helpful tool to analyse economic and
institutional pressures at Wavin. The model of Granlund & Lukka is chosen, because one of the
objectives of Wavin is to create convergence between cost accounting practices. The model can be
beneficial to explore possibilities for convergence.
Figure 3 Granlund & Lukka (1999)
First the pressures of the framework (Figure 3 Granlund & Lukka (1999)) will be briefly discussed and
compared with Wavin. Coercive factors for divergence are national legislation and national
institutions. Legislation can be IFRS, GAAP and other accounting standards. Normative pressures are
national culture and corporate cultures which are according to Bhimani (2007) the dominant factors
for explaining differences in management accounting system. You might not expect that culture still
dominates divergence, because the globalization has already diminished the impact of national
cultures (Bhimani, 2008). Pressures of the framework of Granlund and Lukka are projected on Wavin
to investigate if those pressures are also affecting the practices of Wavin. Through this exploration it
should be clear which factors causes divergence in cost accounting practices and thus can be
improved or adjusted. Based on the economic, coercive, normative and mimetic pressure practices
are investigated at Wavin.

17
Economic Economic pressures that can drive Wavin for convergence are production technology, economic
climate, competition and information technology. Wavin has already made efforts for convergence of
accounting practices because of globalization and competiveness. The SAP system is a good example
of convergence. This system has already been operational in Germany, Belgium and the Netherlands
and will be implemented in the Scandinavian countries in the next years. Through the SAP system,
accounting practices are becoming more similar, standardization of data collection formats and tasks
can be performed more efficiently. The increased competition through the globalization supported
the need for convergence in cost accounting practices in the last ten years. Harmonisation of cost
accounting practices should results in a reduction of costs and an improved competitive position. An
example is the implementation of a harmonized SAP system. In order to utilize the benefits of SAP,
working standards with the ERP system should be the same in all countries. Otherwise it could lead
to divergence as it was the case by the implementation of SAP in the Netherlands. Other examples of
increased convergence to reduce costs are centralised purchasing, exchange of employees and
outsourcing of production to other Wavin countries.
Coercive Coercive pressures for convergence at Wavin are legislation and pressure of head quarter of Wavin.
Convergence through legislation can be achieve by the adoption of accounting standards like
international financial report standards (IFRS), international accounting standards (IAS), general
accepted accounting principles (GAAP). Since 2005 the use of IFRS is mandatory for companies who
are listed. The introduction of the reporting standards have already increased the convergence
between the countries of Wavin. The accounting manual of Wavin is based on the rules of IFRS, with
some exceptions due to GAAP. Thus legislation could cause convergence through the adaption of
accounting standard and divergence if local accounting standards are required (GAAP). The following
practices are different between IFRS and GAAP (accounting manual Wavin, 2010):
Bad debt provision
Fixed Assets
Defined benefit pension plans
Financial lease
Inventory valuation
Inventory valuation will be only further explored, because the other practices are not related to our
topic and thus not relevant for this research. Wavin has three types of cost price calculations
(standard, commercial and fiscal) especially the IFRS adjustment (commercial cost price) and the
fiscal cost price are affected by the IFRS regulations. The IFRS adjustment is calculated for cost
recognition purpose, to revalue inventory. This calculation is performed to check the total costs of
sales with the inventory value, these figures should be corresponding. To achieve this calculation
IFRS requires finished products to be valued at absorption price (accounting manual Wavin, 2010). To
arrive at absorption costing the following components should be calculated:
Raw materials shall be valued according to FIFO method (last three months) and compared
with the replacement value of raw materials
Indirect production costs

18
Indirect storage & distribution in cost of sales
Indirect depreciation3
Direct depreciation4
Regulations for the IFRS adjustment are similar and might thus be harmonised for Belgium, Germany
and the Netherlands. In the next chapters the calculations will be investigated if they are indeed
similar between countries.
The fiscal cost price is calculated for external reporting and is based on GAAP or IFRS. Each country
has its own local GAAP requirements for the calculation of the fiscal cost price (Table 1 Inventory
valuation differences IFRS vs. local GAAP). The use of GAAP or IFRS regulations could explain
differences within Wavin. In table 1 regulations of IFRS and GAAP for Belgium, Germany and the
Netherlands for inventory valuation are presented. The Belgian GAAP does not allow the inclusion of
indirect costs for the fiscal cost price, whereas Germany and the Netherlands should incorporate
indirect costs. The IFRS requires that inventories shall be valued at lower of cost and net realizable
value whereas GAAP does not requires both lower of cost and net realizable value in all countries.
IFRS German GAAP Dutch GAAP Belgian GAAP
*Inventory shall be
valued at the lower of
cost and net realizable
value (selling price less
costs to complete and
sell)
To value costs three
techniques can be
used standard cost
method, retail method
and most recent
purchase price
*Inventories shall be
valued at cost or lower
value according to
types of inventories:
replacement value,
selling price less arising
expenses, or the lower
or both
*Inventory shall be
valued at the lower of
costs and net
realisable value or at
current cost
(“replacement value”)
* Comparable to IFRS,
except that:
it is allowed not to
include indirect
production
The use of LIFO is
prohibited. Cost of
inventories shall be
assigned by using FIFO
or weighted average
cost formula
Costs can be assigned
by using FIFO, LIFO, or
weighted average
costs
LIFO, FIFO, weighted
average costs are
permitted. LIFO is not
recommended
LIFO, FIFO, weighted
average costs are
permitted.
*PWC, KPMG, Deloitte *PWC Germany *PWC, KPMG, Deloitte *PWC Belgium
Table 1 Inventory valuation differences IFRS vs. local GAAP
3 Depreciation for indirect assets as production buildings and building related installations (Accounting manual,
2010) 4 Depreciation of fixed assets used in the production process (Accounting manual, 2010)

19
IFRS mentions lower of cost and net realisable value. The lower of cost method includes a
comparison between the replacement value and the historical value. The lowest figure of the two
can be used for valuation. This method is often applied if replacement value is lower than historical
value. The net realisable value (NRV) is the selling price less the estimated costs of completion and
sale. The costs of sale include marketing and distribution costs. The NRV will be compared with the
historical costs of goods in stock, if the NRV is lower than it will be used for inventory valuation
(KPMG, 2010).
Another important coercive pressure to create convergence in accounting practices of Wavin is the
head quarter. As mentioned in the introduction the decentralised organisation structure in the past
caused divergence between the different countries. Through increasing the influence of the head
quarter Wavin could become a more centralised organisation and harmonisation might be improved.
The head quarter could prescribe accounting practises and working procedures in order to create
uniformity across the whole organisation and increases convergence (Carlile, 2004).
Normative Normative pressures which lead to convergence are education and professional networks at Wavin.
Education leads to convergence if employees have the same training. Convergence in training
practices can be achieved by e.g. traineeships or intern education. Currently Wavin has already
traineeships for German employees, but not for other employees. German employees are located at
Dutch and German offices, this increases the exchange of knowledge and stimulates uniformity in
working procedures.
The European educational system has becoming more and more harmonized, students can be
transferred between countries which leads to more convergence between international universities
and finally could lead to more convergence in organisations. Culture is another normative pressure
for divergence. Wavin had a decentralised organisation in the past, which have caused distinctive
corporate cultures. An examples of divergence in national cultural is that German employees are very
accurate and perform tasks extensively whereas Dutch employees are accurate, but are trying do
tasks as practical as possible to get maximum results. This is also mentioned by Jones and Luther
(2004), who states that German accounting is highly educationally oriented, whereas Anglo-Saxon
countries are based on a professional environment. Another example of divergence in national
cultures is that there is limited collaboration between Belgium, German and Dutch employees, tasks
are designed and performed independently.
Mimetic Mimetic behaviour is based on social science, which states that under circumstance of uncertainty
people are imitating the behaviour of others (DiMaggio & Powell, 1983). This behaviour leads to
convergence in practices and is also applicable for organisations. Organisations as Wavin are using
advice of international operating consultancy firms such as PWC. The relatively small set of major
consulting firms leads to convergence in practices within organisations. Practices like activity based
costing, working procedures, the SAP system have been adapted by Wavin and causes convergence.
All the forces for convergence of the framework of Granlund & Lukka (1999) have been discussed.
Despite the increased convergence in the last years, there are still opportunities to create more
convergence in cost accounting practices at Wavin. Opportunities for convergence are inventory

20
valuation, procedures and organisation structure. The findings above-mentioned can be helpful as a
guideline to analyse the cost prices.
The societal effect perspective studies cultural characteristics of organizations that reflect
institutional features in which they are located. This viewpoint studies social, economic and political
factors. Education for example varies strongly across countries and could therefore influence
accounting practices strongly and could explain variation. German management accountants are
mainly trained in university, Anglophone by professionals and Japanese on the job (Jones & Luther,
2004). German management accounts are theoretically educated and very narrow specialized and
focus on theoretical solutions to develop comprehensive cost accounting systems. In comparison
British and Japanese management accountants focus rather on practical solutions (Ahrens &
Chapman, (1999), Hoffjan et al, (2007). Based on this information Ahrens & Chapman (1999)
concluded that German companies run more complex cost accounting systems than Anglophone and
Japanese countries.
Another view point for analysing differences is the framework of Carlile (2004) based on
organizational science. The framework can be used to specify practical and political mismatches and
describes how common knowledge and domain specific knowledge can be managed effectively
under different circumstances. The framework can be used in a setting of new product
developments, inter organizational change or innovation to specify practical and political
contradictions in order to create shared understanding. The framework is useful for analysing the
current situation of Wavin, because Wavin would like to harmonise their existing cost accounting
system (inter organizational change) and has problems with managing knowledge. Problems related
to the management of knowledge mentioned in the problem analysis are limited information is
stored and employees have different interpretations of the commercial cost price. The framework
could help to map those issues and find solutions for dissolving the problems.
Figure 4 Framework for managing knowledge Carlile (2004)
The framework describes three processes
namely transfer, translation and
transformation and three boundaries
syntactic, semantic and pragmatic (Figure 4
Framework for managing knowledge Carlile
(2004). Besides these features there are
three properties of knowledge described at
every boundary namely differences,
dependence and novelty. Differences
refers to the differences in amount of
knowledge acquired, if new knowledge is
acquired the knowledge should be shared and assessed. Dependence refers to the relations
between actors, if dependence is high there is a high need for sharing knowledge, if there is limited
dependence differences in knowledge are not important. The last relational property of knowledge is
about the novelty of the circumstances. If novelty is high, there will be a high need for sharing and
assessing knowledge.

21
Besides the three properties of knowledge there are as mentioned three categories to scale the
complexity of managing knowledge syntactic, semantic and pragmatic (Shannon and Weaver’s,
1949).
The framework can be seen as a vector (Figure 4 Framework for managing knowledge Carlile (2004)),
if novelty increases then a boundary will be crossed and a new more complex stage will be entered.
Each stage has its own circumstances, solutions and challenges to deal with problems. The
circumstance and challenges of each stage are described.
1. The first stage is the syntactic / information transferring boundary. At this stage knowledge has
to be shared and assessed through specifying differences and dependencies between actors. This
can be achieved by storage and retrieval of knowledge (Davenport and Prusak, 1988). Problems
can occur when differences and dependence between actors are not known and no information
is stored.
2. The next stage is the semantic boundary which focuses on translating knowledge. In this stage
differences and dependencies which are unclear can cause different interpretations. In this stage
it’s important that differences are recognized and discrepancies are dissolved through the
creation of shared meanings. In order to create common meanings it is possible that trade-offs
between systems/ knowledge have to be made. Helpful tools to create common meanings are
cross functional teams, translators and interaction. A treat in the process can be the presence of
different interests among employees; this endangers the process of creating common meanings.
3. The last stage from the semantic to the pragmatic stage will be entered when different interests
of actors have to be resolved (Carlile, 2004). Shareholders have different interest, but are still
dependent on each other. This can be resolved through the transformation of common
knowledge and domain specific knowledge in order to share and assess knowledge effectively.
Solutions can be achieved through jointly collaboration.
If a border of complexity is crossed the problems in prior complexity levels can recur and should
therefore first be dissolved. E.g. if the semantic stage is entered problems of the syntactic stage have
to be first dissolved. The framework is a useful tool for analysing divergence in order to create
convergence. Certain characteristics described in the framework can be identified at Wavin.
Wavin is currently positioned in the second stage the semantic boundary. This means that Wavin has
to deal with problems occurring in the first and second stage. Problems related to these stages are
differences between employees and actors are unknown, because information is not available and
employees have different interpretations. Existing problems within Wavin related to the framework
are limited information is stored about the fiscal and commercial cost price, which causes different
interpretations. It is known that differences are present between cost price calculations, but there is
a lack of insight in the differences. Employees in the different countries do not know how cost price
calculations are performed in other countries. Sharing and storage of information about cost prices
procedures is limited and could be improved.
The first stage consist of transferring knowledge, knowledge should be transferred across employees.
Problems related to this stage are unknown differences between actors, differences in level of

22
knowledge and dependencies are not known between actors. Wavin has problems related to storage
of knowledge as is mentioned in the problem analysis. Limited information is stored about the
calculations of the cost prices, the accounting manual only prescribes which conversion costs
(production costs) should be allocated. Most knowledge is only known by experienced employees,
which can be a treat for the organisation. Knowledge of cost prices should be stored, in order to
make it possible to retrieve information if necessary. Through the storage of information, divergence
can be identified, knowledge can be transferred and common understanding improves (Carlile,
2004).
The semantic boundary focuses on creating common meanings. Problems in this boundary are
related to different interpretations between actors. Wavin has different interpretations about the
commercial cost price which leads to different interpretations. The commercial cost price is
calculated differently between countries and employees have different interpretations. Problems can
be solved by identifying differences through interaction between actors. The interaction should
create common meanings about the commercial cost price. In order to find the best practice it might
be possible that a trade of between the different interpretations have to be made to create common
meanings. This could lead to the implementation of an unified commercial cost price for all countries.
Several perspectives and frameworks have been discussed the contingency theory, cultural theory,
new institutionalism, societal perspective and organizational science. The framework of Granlund &
Lukka (1999) and the framework of Carlile (2004) have been used to analyse the current situation of
Wavin. The framework of Granlund et all presented an overview with both institutional and
economic pressures for divergences and convergence and is therefore comprehensive in comparison
to other perspective which only have incorporated one viewpoint e.g. social (Hofstede, 1987),
contextual (Bhimani, 2006), institutional (Powell & DiMaggio, 1983). The framework is suitable for
Wavin, because it explains mimetic, coercive, normative and economic pressures for driving
convergence. Coercive factors could seriously affect the process of harmonisation, because local
general accepted accounting principles are diverging (table 1). In the next chapters the normative
pressures will be compared with Wavin in order to analyse if normative pressures also diverging for
Wavin. Normative pressures which are causing divergence are national and corporate culture, which
lead e.g. to diverging working methods. The framework will be used to determine international
differences and find opportunities to create convergence in the cost accounting practices at Wavin.
The framework of Carlile (2004) provides an overview to effectively manage knowledge in
organisation and is based on organisational science which provides a different angle of incidence. As
in the problem analysis is mentioned Wavin has problems related to the management of knowledge,
there are different interpretations about the commercial cost price and limited knowledge about
cost prices is stored. The framework can be used to set-up a proposal to deal with problems related
to the management of knowledge at Wavin. The frameworks (Carlile, Granlund ET all) are both
beneficial to analyse difference and can be used as a guideline to increase convergence in accounting
practices.

23
3. Research design
This chapter explains the design of the research and describes how this research will be conducted,
research questions will be answered and how a proposal for the problem definition will be designed.
The main focus of the research will be on analysing differences between cost price calculations and
find possibilities for convergence between Belgium, Germany and the Netherlands. The thesis is
based on the defined research questions, which will be answer the problems and should lead to
harmonisation (Figure 5 Research Design).
Figure 5 Research Design
Problem analysis
•Problem analysis
•Objectives
•Research questions
Research Design
•Research method
•Data collection
•Relevance of research
Theoritical Framework
•Contingency theory (Bhimani, 1999), Cultural theory (Hofstede, 1987), New Institutionalism (Granlund & Lukka 1999), Societal perspective (Jones & Luther, 2004., Ahrens & Chapman, 1999., Hoffjan, 2007), Organizational science (Carlile, 2004)
Definiton and Fucntions
•What is the definition and function of the commercial, fiscal and standard cost price at Wavin?
Calculations
•How are the standard, commercial and fiscal cost price calculated and how should they be calculated according to the accounting manual?
Analysing Differences
•What are differences and similarities in the calculation of the standard, commercial and fiscal cost price between Wavin Belgium, Germany, the Netherlands and the accounting manual and why?
Creating Harmonisation
•How can the system of cost price calculation improved or redesigned in order to create more convergence and increase efficiency?
Redesign
•How can the IFRS adjustment be redesigned?
Conclusions
•Problem defintion
•Recommendations
•Future research
24
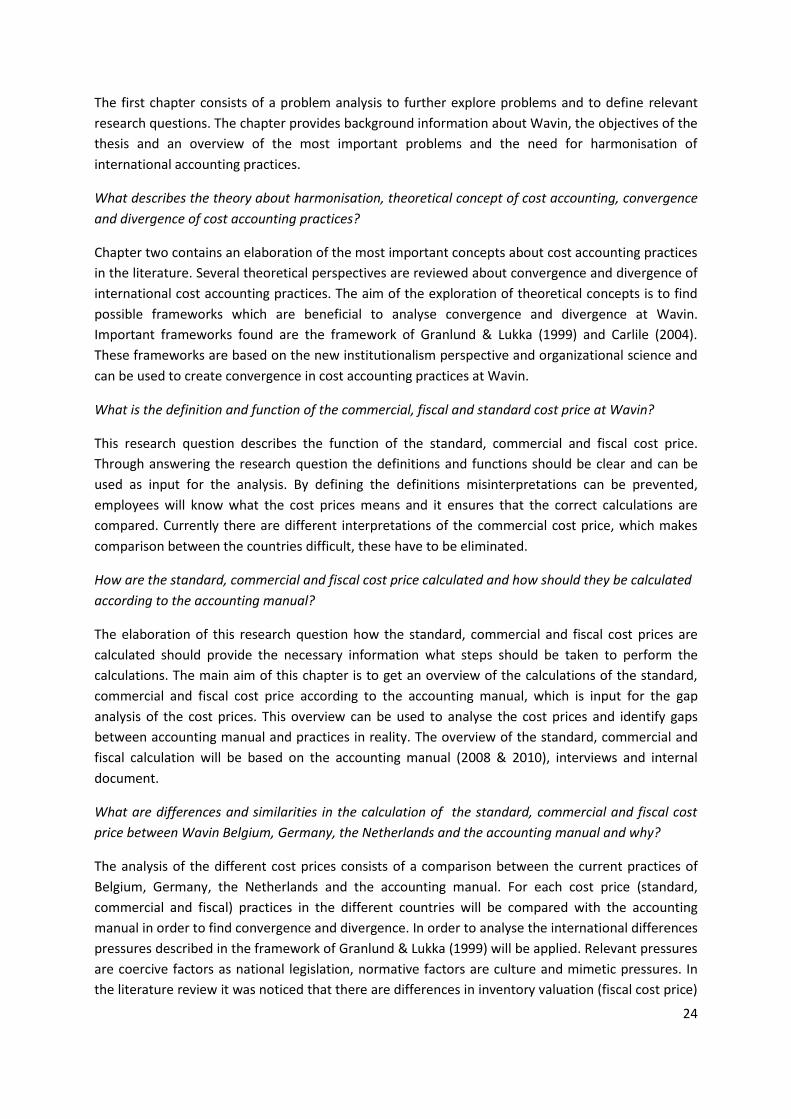
The first chapter consists of a problem analysis to further explore problems and to define relevant
research questions. The chapter provides background information about Wavin, the objectives of the
thesis and an overview of the most important problems and the need for harmonisation of
international accounting practices.
What describes the theory about harmonisation, theoretical concept of cost accounting, convergence
and divergence of cost accounting practices?
Chapter two contains an elaboration of the most important concepts about cost accounting practices
in the literature. Several theoretical perspectives are reviewed about convergence and divergence of
international cost accounting practices. The aim of the exploration of theoretical concepts is to find
possible frameworks which are beneficial to analyse convergence and divergence at Wavin.
Important frameworks found are the framework of Granlund & Lukka (1999) and Carlile (2004).
These frameworks are based on the new institutionalism perspective and organizational science and
can be used to create convergence in cost accounting practices at Wavin.
What is the definition and function of the commercial, fiscal and standard cost price at Wavin?
This research question describes the function of the standard, commercial and fiscal cost price.
Through answering the research question the definitions and functions should be clear and can be
used as input for the analysis. By defining the definitions misinterpretations can be prevented,
employees will know what the cost prices means and it ensures that the correct calculations are
compared. Currently there are different interpretations of the commercial cost price, which makes
comparison between the countries difficult, these have to be eliminated.
How are the standard, commercial and fiscal cost price calculated and how should they be calculated
according to the accounting manual?
The elaboration of this research question how the standard, commercial and fiscal cost prices are
calculated should provide the necessary information what steps should be taken to perform the
calculations. The main aim of this chapter is to get an overview of the calculations of the standard,
commercial and fiscal cost price according to the accounting manual, which is input for the gap
analysis of the cost prices. This overview can be used to analyse the cost prices and identify gaps
between accounting manual and practices in reality. The overview of the standard, commercial and
fiscal calculation will be based on the accounting manual (2008 & 2010), interviews and internal
document.
What are differences and similarities in the calculation of the standard, commercial and fiscal cost
price between Wavin Belgium, Germany, the Netherlands and the accounting manual and why?
The analysis of the different cost prices consists of a comparison between the current practices of
Belgium, Germany, the Netherlands and the accounting manual. For each cost price (standard,
commercial and fiscal) practices in the different countries will be compared with the accounting
manual in order to find convergence and divergence. In order to analyse the international differences
pressures described in the framework of Granlund & Lukka (1999) will be applied. Relevant pressures
are coercive factors as national legislation, normative factors are culture and mimetic pressures. In
the literature review it was noticed that there are differences in inventory valuation (fiscal cost price)

25
between countries due to the use of GAAP or IFRS regulations. Wavin will be analysed if those rules
are affecting or applicable for cost accounting practices of Wavin.
Besides the comparison between the countries there will be an analysis performed between the
different kinds of cost price calculations, to explore if there are similarities between the cost prices
themselves. The analysis between the different kinds of cost prices will be performed in order to find
possibilities to harmonize these calculations. It might be possible that the calculation of the standard
cost price can be used for the calculation of the fiscal and commercial cost price or reverse.
Differences between countries will be analysed based on the founded calculations of standard,
commercial and fiscal cost price (research question two).
Another problem which is mentioned in the problem analysis is the difference in efficiency (amount
of time spend on calculations). Assistant controllers (German, Dutch) have mentioned some causes
which might explain the differences in efficiency e.g. the different calculations for fiscal cost price,
amount of production lines included and in the past developed practices. These causes will be
analysed in order to underpin them and find explanations for divergence. Finally a table will be
presented with all current practices of Belgium, Germany and the Netherlands of the standard,
commercial and fiscal cost price and analysed and compared with the accounting manual. The table
should provide a clear overview of the differences and similarities and can be used as input for the
solution stage.
How can the system of cost price calculation improved or redesigned in order to create more
convergence and increase efficiency?
The solution stage will be based on the literature review, answers on research questions and other
relevant information. The solution stage consists of an advice for dissolving the problems related to
the different interpretations of the commercial cost price, storage of information, efficiency of fiscal
cost price. It should also contain a solution to bridge the differences between the countries and the
three cost prices. This will be done by a proposal for creating convergence in accounting practices,
which should lead to more harmonisation internationally and more integration between the three
types of cost price calculation. International harmonisation should lead to similar accounting
practices for the standard, commercial and fiscal cost price. Integration between cost prices should
lead to an increase in efficiency and simplified calculations.
How can the IFRS adjustment be redesigned?
The former step consists of a proposal for creating harmonisation. This research question focuses on
creating a redesign for the IFRS adjustment and the implementation of this redesign. Based on the
required knowledge in the former research questions a redesign for the IFRS adjustment will be
presented. The redesign shall be discussed with the stakeholders of Wavin in order to create a best
practice of the IFRS adjustment and will be finally implemented. The proposed solution will be
compared with the current situation to determine the impact of the redesign.

26
Conclusions; problem definition
The final part of the thesis consists of an answer on the problem definition, most important findings,
recommendations, future research and the objectives will be reflected. The problem definition will
be answered based on the required information. The most remarkable findings will be reviewed and
explained. Recommendations for Wavin will be presented and future research to increase
harmonisation shall be discussed.
The methodology of the research has been discussed, the following paragraphs comprises the
research method, data collection method, data analysis method, limitations and relevance of the
research. This should provide a clear overview of how the research will be performed.
3.1 Research method
Scientific research has many methods to solve problems, such as experimental research, survey
research, cross sectional, inter temporal or a case study (Shadish, Cook & Campbell, 2001). The type
of research that best fits is a case study. This research method fits the best, because it focus on
descriptive and exploratory research based on limited information to uncover problems, this is the
case for Wavin. Advantages of a case study are the flexibility and the use of different insights from
many disciplines. Flexibility refers to the different information sources which can be chosen.
Disadvantage of this method is that it is difficult to make generalisations (Shadish, Cook & Campbell,
2001). The unit of analysis are the standard, commercial and fiscal cost accounting systems in
Belgium Aalter, Germany; Westeregeln and Twist and the Netherlands; Hardenberg. All of these
production locations are part of the Wavin North West Europe (Figure 6 Wavin North West Europe).
Figure 6 Wavin North West Europe

27
3.2 Data Collection
The research will primarily consist of qualitative data. Qualitative data methods are interviews, focus
groups, documentation, observations or diaries (Aaken et al, 2007). For this research interviews and
documentation are the primarily data sources. Data will be gathered through semi-structured
interviews, analysis of internal documents, books and existing theory.
Semi structured interviews will be used to further explorer the problems, define definitions and to
identify underlying causes for differences between cost price calculations. Semi structured interviews
are used instead of structured interviews, this makes it possible to further elaborate on a specific
topic and you are better enable to find causes for divergence by asking (Aaken, 2007).
Internal documents are accounting manuals, management accounting reports, annual reports, excel
spreadsheets and other internal document which might be beneficial for the research. The excel
spreadsheets are major sources, because they contain the calculations for standard, commercial and
fiscal cost price and are input for SAP software to calculate the final cost price. External documents
which might advance the research are documents about accounting regulations e.g. IFRS or GAAP.
Regulations should be known, because countries have to deal with IFRS rules and local rules. Those
documents are retrieved from the major accountancy organizations as PWC, KPMG and Ernst &
Young.
Excel sheets are clustered by type of production process. Products can be divided in four distinctive
production processes namely extrusion, injection moulding, special products and trading goods. The
production process extrusion, injection moulding and special products have each a separate standard
cost price calculation, but not all countries have those production lines. Belgium has no injection
moulding and special products, but only extrusion. The calculations of the commercial and fiscal cost
price are all incorporated in one file for each country.
The area of our research is related to literature about international cost accounting or management
accounting practices. Scientific literature will be used to discuss existing theoretical concepts and to
review existing literature about cost accounting practices, which might be applicable for Wavin. The
focus will be mainly on finding explanations for convergence and divergence in accounting practices
internationally.
Analysis of data will be based on critical examining the gathered data, the use of extensive schedules
with differences in cost accounting practices and theoretical frameworks will be used to critical
discuss the findings. In order to prevent mistakes and misinterpretations all findings related to the
cost price calculations will be discussed with the supervisor of Wavin and assistant controller of the
Netherlands each week. A time schedule is made to manage the process. Differences between
countries will be discussed and effects will be analysed in order to determine the impact.

28
3.3 Relevance of research
Limited research has investigated the differences between cost accounting within countries, most
research focuses on differences in accounting and the effects for valuation, book value of equity and
other effect for market based measures. In contrast to previous studies our study focus on seeking
explanations for exclusively cost accounting differences between national cost accounting systems
(Belgium, Germany, and Netherlands). Limited papers have investigated the differences between
cost accounting practices in countries, therefore this study might advance the field of research.
Another advantage of this research is that previous studies focus on management accounting
practices in Germany, Japan and Anglophone countries. This research focus on the countries
Belgium, Germany and the Netherlands, this can be an addition to existing literature.
A limitation of our study might be the generalisation of the results, because only results of Wavin are
applied. This limits the generalisation of the results to other industries. This is a logical consequence,
because the thesis is elaborated especially for Wavin.

29
4. Definitions, functions and calculations of the standard cost
price, IFRS adjustment and fiscal cost price
This chapter provides an overview of the definitions, functions and calculations of the standard,
commercial5 and fiscal cost price of Wavin. The definitions should provide the required knowledge to
understand the complex theory of cost price calculation and should dissolve the problems related to
the management of knowledge. Problems related to managing knowledge are described in chapter
two according to the framework of Carlile (2004). It was identified that Wavin has problems related
to the storage of cost accounting information and different interpretations are existing of the
commercial cost price. In order to solve problems related to managing knowledge Carlile (2004)
states that knowledge should be shared and stored and differences between actors should be
specified. Problems related to unclear differences and interpretations can be resolved by creating
common meanings. Interpretations will be eliminated through defining a corporate definition for the
commercial cost price. To improve the management of knowledge this chapter presents definitions,
functions and calculations. The knowledge stored in this chapter will be necessary for analysing
differences between the countries, without valid knowledge analysing for gaps will be impossible.
The information of the cost prices are based on the accounting manual, excel spreadsheets and other
internal documents.
4.1 Standard cost price
The standard cost price is the price for a product which is determined on forecasted raw materials,
the budgeted direct production costs and depreciation costs (Accounting Manual Wavin, 2008). Raw
materials are PCV and PE, the price of those materials is determined based on the expected price for
the upcoming month. The standard cost price is based on budgeted costs instead of actual costs in
order to avoid fluctuations of selling prices due to unexpected costs, irregularities or one-time-costs
and is based on normal conditions (Drury, 2008).
The standard cost price incorporates budgeted direct costs. Direct costs incorporated in Wavin’s
standard cost price are direct production costs. Indirect costs according to Wavin are expenses with
no nature or direct relationship with production output and sales levels and are directly assigned to
the profit and loss account (see appendix for overview of direct and indirect costs i). Direct costs as
defined by Wavin are diverging from the theory, which states that direct costs are directly related to
a product (Drury, 2008). Wavin defines direct costs as costs which are directly connected to the
production process of the product. The distinction with the theory is that Wavin assigns costs as
direct, but these costs (e.g. depreciation) are not directly connected with the product.
The function of the standard cost price is for profit measurement, inventory valuation and to support
managerial decision making. Profit can be estimated based on the standard cost price. Stock can be
valued through the value of finished products based on standard cost price. In order to support
managerial decision making, variance analysis are performed to evaluate performance based on
5 The commercial cost price will be mentioned as the IFRS adjustment in the rest of the thesis

30
actuals vs. budgeted costs. Wavin executes variance analyses for production, raw materials, stock
adjustments and freight variances.
The calculation of the standard cost price comprises the forecasted (PVC) and forecasted (PE) costs of
the raw materials and the budgeted direct production costs and direct depreciation (Accounting
Manual Wavin, 2008). Production costs are direct labour, energy, packaging, maintenance and other
cost (Figure 7 Standard Cost Price).
Figure 7 Standard Cost Price
Direct materials consist of raw materials, components, additives and re-crushed materials. Raw
materials include the purchase price of the materials. These prices are based on prices at the
beginning of the month and are updated to the expected price. Other costs directly related with raw
materials are incoming freight costs, import duties and costs of external re-crushing (accounting
manual, 2008). Normal rebates have to be deducted from the purchase price of raw materials.
Components are bought-in from group companies or third parties examples are rubber rings, inserts,
metal sheeting.
Direct production costs are direct labour, maintenance, energy, packing and other costs. Direct
labour incorporates all personnel of mixing, crushing, production departments including shift leader,
direct maintenance and direct quality control personnel, internal transport and handling personnel
for production up to the delivery of finished products in the warehouse and finishing and packaging
personnel. Repacking is not included as direct labour costs. Personnel costs are salaries and wages,
social security costs, pensions and allowances. In contradiction to the theory Wavin defines
conversion costs as direct labour, energy, packaging, maintenance and other costs. The theory
defines conversion costs as direct labour plus manufacturing overhead costs (Drury, 2008). The
definition of Wavin will be used in the thesis.
Energy incorporates all energy used for production, energy for heating and lighting of the buildings is
excluded (indirect). Packing costs are costs for boxes, films, crates, reels etc. for products in
Direct Production Costs
• Labour
• Maintenance
• Energy
• Packing
• Other costs
Raw Materials
• Bill of materials (actual prices)
• Forecasted prices (PE, PVC)
Depreciation
• Based on replacement value
Standard Cost Price
(Budgeted costs)

31
production. Maintenance includes the costs of maintaining machinery, other costs are for example
lease costs of forklifts.
Depreciation costs of the standard cost price are the depreciation charges for the fixed assets used at
the production process. Examples of fixed assets are machinery for extrusion, injection moulding and
handmade equipment. Depreciation is based on the replacement value and should be based on 80%
of the planned operating time. The replacement value is the historical purchase price and should be
annually increased with an index. Planned operating time is the total available time minus the
utilisation losses. Utilisation losses are all losses of a structural nature, such as weekends, holidays
and including all scheduled downtime and planned maintenance (AM, 2010).
Finally a mark-up can be added to the standard cost price if necessary. A mark up could be
unexpected costs as standard overweight, production losses, incoming freight or mixing losses.
The process of calculating the standard cost price consists of the calculation of the costs above
mentioned in excel for each production line of a production process. Production processes are
extrusion, injection moulding and special product. A production process consists of multiple
production lines (machines), for which the production costs are calculated. First costs are identified
for a production process, secondly assigned to each line through the use of distribution keys (e.g.
production volume, consumption) and finally costs are assigned to an activity type. Wavin
differentiate the activity types EEL (labour), EEM (machine) or EES (set-up). In a separate file all
activity types and their costs are displayed, this file is used to upload the activity types and costs into
SAP. In SAP the price per product can be determined. Each production process has its own activity
type, with this activity type a price per product can be calculated. For example EEL001, EEM001,
EES001 are the costs for extrusion machine 1. Figure 8 Calculation of standard cost pricepresents the
allocation of costs to the activity types.
Figure 8 Calculation of standard cost price

32
4.2 IFRS Adjustment
The definition of the commercial cost price caused some inconsistency as is mentioned in the
problem analysis stage. During interviews with employees of finance and controlling department it
was identified that different interpretations existed of the commercial cost price. Beside there is
limited information prescribed in the accounting manual, therefore it was difficult to formulate a
clearly defined definition. The term “commercial cost price” was not even mentioned in the AM. It
took a while before finally more information was found about the commercial cost price. After
comparing the interpretations of all employees with each other and contacted the head quarter the
decisive definition has been captured. The commercial cost price is better known as IFRS adjustment
at the head office and is described in the newest accounting manual (31-12-2010). The term “IFRS
adjustment” will be used in the report from now on instead of commercial cost price. The term
commercial cost price has been used in the past, but is confused with the current IFRS adjustment.
The newest accounting manual prescribes the IFRS adjustment, but still limited and contained some
errors. The accounting manual (2010) states that IFRS adjustment is for recognition purpose; the
total cost of sales value have to match with the inventory value (IFRS). The IFRS adjustment consists
of a revaluation/devaluation of raw material based on FIFO correction, indirect production in cost of
sales, indirect storage in cost of sales, indirect depreciation in cost of sales and an adjustment for
direct depreciation. The re- or devaluation can be found on the balance sheet as IFRS revaluation
commercial book value and is calculated each month and at the end of the year an overview with the
total revaluation will be made. The total value of inventory each month consists of the value of
finished products, raw materials, commercial articles, other costs and the IFRS adjustment. Raw
materials are incorporated in the IFRS adjustment. The standard cost price plus the IFRS adjustment
are partially the inventory value.
The IFRS adjustment consists of an adjustment for raw materials, indirect production, indirect
storage & distribution, indirect depreciation and direct depreciation.
Figure 9 IFRS Adjustment
FIFO vs actual costs materials
• Differences between FIFO based on last three months and actual price (replacement value) of raw materials
Depreciation
• Differences between replacementvalue and historical value
Indirect costs
• Indirect storage
• Indirect depreciation
• Indirect production
IFRS Adjustment
(revaluation of stock)

33
The adjustment for raw materials is based on the difference between FIFO (last three months) value
versus actual price (replacement value) and is calculated each month.
Indirect costs are indirect storage, production and depreciation. Indirect production costs are costs
for production planning, production management, engineering, maintenance management quality
assurance and laboratory costs (accounting manual, 2010).
Indirect storage consists of costs to bring product in their current condition in the warehouse.
Indirect costs for storage are costs related to storage, dispatch and transport. Examples of costs are:
Internal movement of stock
Storage materials, additives, finished products, packaging material in warehouse and depots
Order picking
Customized packaging
Internal/ customized transport Indirect depreciation incorporates the depreciation of production building, building related
installations, silos and assets included in the overhead stock.
The adjustment for direct depreciation is the differences between depreciation based on
replacement value and depreciation on historical value.
The total adjustment for IFRS consists of sum up of all above mentioned costs and leads to the
revaluation of finished products.
4.3 Fiscal Cost Price
The fiscal cost price is calculated for external financial reporting to value inventory based on the
international financial reporting standards (IFRS) and general accepted accounting principles (GAAP).
The IFRS requires finished products to be valued at the absorption price or lower net realisable value
at end of year. Inventory valuation for the fiscal cost price according GAAP differs between countries
as mentioned before (chapter 2, coercive factors). According to Wavin’s accounting manual (2008)
absorption costing comprises the costs of the raw materials, the actual direct production costs the
actual direct depreciation based on historical costs and the actual indirect production or logistical
costs in order to bring the products in their current location and condition in the warehouse or stock
transfer point from production to the warehouse. Non-manufacturing costs are not allocated to
products, but are directly assigned to the profit and loss account. Wavin incorporates all
manufacturing costs to value inventory for fiscal purpose.
The lower net realisable value is the estimated selling price less the costs to sell the products
(Accounting manual, 2008), this calculation is used in Germany to value stock. Normally the lower net
realisable value will be used if the value of stock is less than the actual costs (historical costs). When
stock is re-valued at the net realisable value a loss has been made, because selling price is lower than
actual cost price these losses should be reported on the profit and loss account. The fiscal cost price
for inventory valuation based on actuals is booked on the balance sheet as for fiscal purpose. GAAP is
not mentioned in the accounting manual, because each country has its own local GAAP which

34
requires different methods to value inventory. An overview of existing practices to value inventory
practices will be presented in the next chapter.
The fiscal cost price requires finished product to be valued at absorption costing or lower net
realisable value. Absorption costing requires that actual direct production, actual direct depreciation
and indirect production or logistical costs are applied. All costs included in the fiscal cost price are
presented below.
Figure 10 Fiscal Cost Price
Actual direct costs Actual direct costs are direct material, labour, energy, packaging, maintenance and other direct costs. Labour, energy, packaging, maintenance and other direct costs are the same as the standard cost price, but are determined at actual prices. Raw materials Raw materials have to be valued at FIFO. Depreciation Depreciation is determined at historical costs and stops at zero. Indirect costs The indirect costs includes all costs in order to bring the products in their current location and
condition in the warehouse or stock transfer point from production to the warehouse. Indirect
production costs which have to be incorporated for valuation are production planning, production
management, engineering, maintenance management, quality assurance and laboratory costs.
Indirect storage costs are to transfer products into the warehouse or stock location. Indirect
depreciation incorporates costs for depreciation of indirect production or logistical functions.
Net realisable value Inventory can be valued according to the net realisable value this is a comparison between the selling
price and actual price, the lower should be used to value inventory. The selling price is the price
minus costs to complete sale. Costs for completion of sale are e.g. marketing and distribution costs.
Direct Production Costs
• Labour
• Maintenance
• Energy
• Packing
• Other costs
Raw Materials
• FIFO Value
Depreciation
• Based on historical costs
Indirect Costs
• Indirect storage
• Indirect depreciation
• Indirect production
Fiscal Cost Price
(Actual costs)

35
The comparison between actual costs and selling price should be executed for all products and
consists of many products for each country.
4.4 Comparison of cost prices
The standard, IFRS adjustment and fiscal cost prices are compared with each other to identify major
differences and similarities. The cost prices have each their distinctive use. The standard cost price is
namely used for profitability analysis, stock valuation and variances analysis and is calculated each
month. The IFRS adjustment for revaluation of inventory based on the differences between budgeted
and actuals. The fiscal cost price is calculated each end of the year to revalue stock at actual figures
for external financial reporting.
The standard cost price is based on budgeted costs in contrast to the fiscal which is based on actuals.
All calculations incorporates production costs, these are labour, maintenance, energy, packaging and
other costs. The prices of raw materials included in the standard cost price are determined on prices
of the last month and will be updated each month. The prices of the raw materials for the fiscal
calculation and IFRS adjustment are determined based at FIFO valuation. The IFRS adjustment does
not include production costs only direct depreciation.
Depreciation is incorporated in the standard and fiscal cost price, but the calculations diverge.
Depreciation for the standard cost price is determined on the replacement value and on 80% of the
planned operating time. In contrast the depreciation for the fiscal cost price is based at the historical
value and stops at zero. The depreciation of the standard cost price will never be zero and the
historical purchase price will be increased annually with an index. The depreciation included in the
fiscal cost price could be zero.
Besides the above-mentioned costs the IFRS adjustment and fiscal cost price include indirect costs.
The fiscal cost price incorporates all manufacturing costs; direct production, indirect production,
storage and indirect depreciation. In contrast the standard cost price only incorporates direct
production costs. The fiscal cost price is used to value stock according to the absorption method,
which means that indirect costs are incorporated in the calculation. The IFRS adjustment and fiscal
cost price both incorporates the same indirect costs; indirect production, indirect storage &
distribution and indirect depreciation.

36
5. Analysing differences between Cost Prices of Belgium,
Germany, Netherlands and Accounting manual The standard, IFRS adjustment and fiscal cost price are analysed for divergence in Belgium, Germany
and the Netherlands. The analysis should expose the major differences between countries and
between countries and the accounting manual. The analysis incorporates a comparison of the
standard cost price, IFRS adjustment and fiscal cost price between Belgium, Germany and the
Netherlands. Table 3 presents an overview of all differences between countries and the accounting
manual. Based on the results of the analysis a proposal for convergence can be elaborated.
5.1 Standard cost price
The standard cost price calculation has little deviations between the countries which are mainly
caused through the use of a standard template (Figure 11 Standard template standard cost price
calculation) for the countries. The standard template is an excel spread sheet with an allocation
model to allocate costs to production lines. The template has already been operational for the
Belgium and Netherlands and will be implemented in Germany the next year. Through the use of the
template convergence has increased between Belgium and the Netherlands. Despite the introduction
of this template there are still differences.
Figure 11 Standard template standard cost price calculation
The standard cost price should consist of raw materials, direct production costs, depreciation and a
mark-up. Raw materials are calculated based on forecasted prices in each country, there are no
differences between them. The calculation of the conversion costs (labour, maintenance, energy,
packaging, and other costs) contains differences. First of all the design of the German format is
different in comparison to Belgium and the Netherlands, because Germany has not applied the
standard template as already mentioned before.
Another factor for divergence is the calculation of the distribution key for energy. In Belgium is
energy calculated based on consumption KwH of the last year (Figure 12 Allocation energy Belgium

37
whereas in Germany and the Netherlands energy is based on budgeted production volume (Figure 13
Allocation energy Netherlands). Figures are not the actual reproductions of Wavin’s figures, but
fictitious.
Figure 12 Allocation energy Belgium
Figure 13 Allocation energy Netherlands
The Dutch method is more precise in comparison to Belgium, if production in Belgium would increase
more energy will be consumed. The current method will not assign higher costs, because the figures
are based on consumption of last year and not on production volume as in the Netherlands.

38
Direct depreciation is another factor which causes divergence between the countries. According to
the accounting manual (2010) depreciation should be calculated based on 80% of the planned
operating time6. When comparing Belgium, Germany and the Netherlands with the accounting
manual all countries have diverging methods. Belgium and the Netherlands calculate depreciation
based on replacement value, which is the replacement value divided by depreciation period (mostly
10 years). Germany calculates depreciation almost according to the accounting manual, but failed to
incorporate a correction for maintenance. Depreciation is calculated in Germany as follows:
(replacement value / depreciation period) ___________________________________ * machine hours = direct depreciation (planned operating time * 80% ) The difference in calculations influence the cost price, in Belgium and the Netherlands depreciation is
not based on 80% of operating time in contrast to Germany (does not incorporate a correction for
maintenance). If the same calculation in Germany was used as in Belgium and the Netherlands, the
total depreciation of all extrusion lines together would be higher and should thus affect the cost
price. In order to underpin the impact of the 80% rule, depreciation is calculated according to the
80% rule in the Netherlands. If the 80% rule will be applied deprecation shall drop with 39 and would
affect selling prices considerably.
Divergence in the standard cost price calculation is caused through the allocation of costs (e.g.
energy). In the Netherlands and Belgium depreciation costs are not allocated according to the
accounting manual, which affects the standard cost price. Germany allocates depreciation almost
correctly, but failed to incorporate a correction for maintenance. Overall there is limited variance
between the countries, due to the implementation of a standard template.
5.2 IFRS Adjustment
The IFRS adjustment is calculated in all three countries each month and should consist of an
adjustment for raw materials according to FIFO method, adjustment for indirect costs and direct
depreciation. There were immediately difficulties to compare the calculations between the countries,
because there are major differences between the excel files mainly due to the different formats
(appendixii, IFRS adjustment calculations).
Another major difference is that the Dutch calculation of indirect costs is based on average
percentage of last year, in contradiction Germany and Belgium bases their figures on actual absolute
figures updated monthly. Considering this finding the Dutch calculations is less precise in comparison
to the Belgium and German calculation. The Dutch IFRS adjustment method will be briefly explained
(Figure 14 IFRS Adjustment Netherlands). First the percentage production costs have been calculated
of finished products. Secondly the percentage indirect costs is calculated of production costs +
indirect IFRS costs. The value of finished products (last month) is multiplied with the percentage
conversion cost and then multiplied with the percentage of indirect costs (Figure 14 IFRS Adjustment
Netherlands, point 3). The increase of conversion costs in stock minus direct depreciation of the
6 Planned operating time is the total available time minus the utilisation losses. Utilisation losses are all losses of a
structural nature, such as weekends, holidays and including all scheduled downtime and planned maintenance (AM, 2010).

39
actual month is a percentage (adjustment finished products) of total finished products of last month
and will be used to revalue the actual month (4). The percentage will be multiplied with the value of
finished products in stock of the actual month, which is the IFRS adjustment of finished products.
According to the administrator of cost prices this method is used, because it is easier than the others.
But if you compare the Dutch method with the others, it is questionable if it is a simplified method.
The method has limited structure, figures are based on estimations and the calculation is less
understandable than the Belgian method.
Figure 14 IFRS Adjustment Netherlands
Raw materials should be calculated based on the differences between FIFO value versus the actual
prices. All the three countries do perform this calculation, but have distinctive formats. The FIFO
calculations of the Netherlands and Belgium are relatively simple in comparison to Germany. The
FIFO calculation in Belgium and the Netherlands are based on raw materials of the last three months
and compared with the total actual value of raw materials. Germany has more raw materials in
comparison to Belgium and the Netherlands which extends the file. Another explanation for the
extensiveness is that Germany makes limited use of formulas, which causes an extremely long list of
data.
Germany does not compares the FIFO value with the actual value, but compares the FIFO price of
materials with the price of 31-12-2010 this is not in accordance with the manual. The extensiveness
of the FIFO calculations in Germany causes also an increase in calculation time in comparison to
Belgium7 (Figure 15 FIFO Belgium and the Netherland).
7 Figures are not actual reproductions of Wavin’s accounting figures.

40
Figure 15 FIFO Belgium
Indirect production costs are incorporated in all countries, but not specified in all countries. In
Germany indirect production costs are specified and codes of SAP are displayed in order to upload
costs directly from the system. Germany does specify all indirect costs by indirect production costs,
indirect depreciation and indirect storage & distribution. Belgium has not specified the indirect costs,
but incorporates a total figure for all indirect costs. After examining the indirect costs through
uploading costs out of SAP and questioning the Belgian controller, I identified that they do include all
the indirect costs as mentioned in the accounting manual. The Dutch method has also not specified
the indirect costs as you could see in figure 12. Only the indirect production costs and indirect
depreciation are mentioned. Through interviewing the responsible employee (administrator cost
prices), it was discovered that indirect storage and distribution are not incorporated in the
calculation. According to the employee, that is because activities of storage and distribution are
performed by employees of the production departments. In Germany these activities are performed
by a separate crew and can therefore be allocate to indirect storage and distribution costs.
Belgium and the Netherlands have incorporated an adjustment for direct depreciation, which is
based on the difference between replacement value and historical value. Germany has not
incorporated this adjustment for depreciation, this is remarkable because the accounting manual
prescribes the adjustment for depreciation. The adjustment have to be incorporated, because the
standard cost prices values depreciation based on replacement value and reporting rules requires
depreciation based on historical value. The adjustment ensures thus that depreciation is based on
historical value.
The cost components are now discussed according to the accounting manual. When comparing the
calculations it is noticed that Belgium, Germany and the Netherlands all incorporated an additional
element in the calculation. All countries have incorporated an adjustment for intercompany finished
products. These are products which are traded intercompany. This mark-up for intercompany
products is 3.8% of total value finished products intercompany. Through interviewing all stakeholders
it became clear that this additional adjustment is charged by the head office, but remarkably not
prescribed in the accounting manual.

41
Major differences related to the IFRS adjustment are the deviating formats of all countries. Germany
compares FIFO with prices of 31-12-2010 instead of actual prices and does not incorporate an
adjustment for direct depreciation. The Dutch method bases their figures on average budgeted costs
instead of absolute figures. Besides Belgium and the Netherlands do not incorporate indirect costs
for storage & distribution, because it is not clear how it have to be comprised.
5.3 Fiscal cost price
The fiscal cost price is calculated for external financial reporting and incorporates a calculation for
inventory valuation based on actual figures, in comparison to the standard cost price and IFRS
adjustment. The fiscal cost price should consist of actual direct production costs, indirect production
costs and raw materials based on FIFO valuation (4.3 calculation fiscal cost price). The
abovementioned elements will now be analysed.
Wavin applies the principles of the international financial reporting standards (IFRS) for financial
reporting. IFRS should lead to convergence between countries, but entities in different countries still
have to deal with local general accepted accounting standards (GAAP), this causes differences. In
chapter two rules and regulations for inventories have been explored (Table 1 Inventory valuation
differences IFRS vs. local GAAP). Belgium, Germany and the Netherlands have all distinctive
requirements for the fiscal cost price. Belgium and the Netherlands have determined their figures on
actual prices to value inventory of the current year. Germany bases their figures on lower net
realisable value called “Niederstwert-prinzip” (NWP), which means that a comparison is made
between actual prices and selling prices. The lower of those two is chosen as input for inventory
valuation. The current method of Germany is in accordance with the rules of IFRS and the German
local accepted accounting principles (GAAP). The Belgian and Dutch methods are also in accordance
with local GAAP. The Dutch uses the method to value inventory at current costs, which means the
actual price of production costs and indirect costs are uses to value inventory. The Belgian GAAP
method requires inventory to be valued according to IFRS, but it is prohibited to include indirect
production costs. In reality they only include actual costs and do not incorporate indirect costs. The
local requirements for GAAP have thus a major effect on the determination of the fiscal cost price.
Raw materials should be valued based on actual prices. Germany calculates the actual price of raw
materials through the average price this year and compares it with last month and takes the lowest
one. This figure minus bonuses and cash discount is the actual price for raw materials. This is done
for each material and article in stock and comprises an extensive list. In the Netherlands the prices of
raw materials are based on replacement value and are uploaded out of SAP and do not incorporate
any other calculation. Belgium does not include actual prices of raw materials, they only incorporates
actual direct production costs (conversion costs).
Actual direct production costs (energy, labour, maintenance, depreciation, packaging, and other
costs) are incorporated in all countries, but Belgium excludes packaging and other costs. Germany
allocates actual direct production costs through the use of the format for calculating the standard
cost price, which makes it easier to perform the calculation. The Netherlands have designed a
different format for the allocation of the actual conversion costs instead of using the format of the
standard cost price in the Netherlands.

42
Indirect costs have not been allocated in Belgium as already mentioned before. In the Netherlands
indirect costs are uploaded from SAP and assigned to other costs. In Germany indirect costs are also
uploaded from SAP and are just as the actual costs allocated through the format for the standard
cost price. By using the model of the standard cost price, costs can be easily allocated, but it is
questionable if this is necessary, because for the fiscal cost price it is not necessary to assign indirect
costs per product. According to the accounting manual indirect production, storage & distribution
and indirect depreciation should be incorporated, but the Netherlands do also incorporate additional
indirect costs for storage and expedition.
Depreciation is based on historical costs in all countries. Germany uses again the same model as for
the standard cost price to allocate depreciation, this is based on 80% of total operating time *
depreciation of the machine. Belgium and the Netherland do not bases depreciation on 80% of
operating time, this causes thus again differences as in the standard cost price calculation.
The figures of Belgium and the Netherlands are based on the period January until 30 November.
Germany bases there figures on January until 31 October. You might expect that all countries bases
there figures on the same period, but this is not the case. Through interviewing the assistant
controllers of all countries, it was identified that the assistant controller of Germany spends more
time on the calculations then the other assistant controllers do and therefore starts one month
earlier with the calculation of the fiscal cost price. The German assistant controller spends one to two
weeks on the fiscal cost price. Belgian and Dutch employees spend one or two days on the
calculation. The difference in calculation time is remarkable and therefore it is decided in
consultation with the supervisor of Wavin to further explore this difference. What immediately is
noticed is the extensiveness of the German Excel file, it is comprised of multiple file tabs and an
extensive list of data. Whereas the Belgian and Dutch files are comprised of only a few file tabs. One
explanation is that the countries applying different methods due to regulations. By interviewing
assistant controllers it was noticed that the amount of products is playing an important factor in the
amount of time spend on calculations. For Germany the costs of each product have to be separately
defined if using the net realisable value. The extensive list of products and calculations to determine
the costs do not improve the comprehensiveness of the calculation. The most time of the fiscal cost
price run is spend on identifying new costs e.g. new production lines and adding them to the excel
files. The German assistant controller and former Dutch assistant controller underpin that the
assignment of new production line/ products increases their effort. New production lines/ products
have to be added in all excel files, and linkages have to be checked if everything is still working
properly. As already have been described in the theoretical part, German companies have more
complex cost accounting systems in comparison to other countries (Ahrens & Chapman, 1999). It
could be concluded that this is also the case German practices within Wavin.
Experience is another factor which affects the efficiency. The Dutch former assistant controller
operation has more experience than the German assistant controller and therefore spends less time
on the calculations. The fiscal cost price run is performed once a year and to obtain experience it
takes you a few years. These factors and the limited information causes differences in the efficiency.
The fiscal cost price diverges between the countries, the major differences are caused through rules
and regulations (IFRS and GAAP), the inclusion or exclusion of indirect costs and the specification of

43
costs. Germany specifies and allocates costs extensively in comparison to the Belgium and the
Netherlands.
5.4 Differences between Standard, IFRS and Fiscal Cost Price
The differences have now been analysed between the countries, but there are also differences
between the cost price runs themselves. This is of course caused by the distinctive functions of the
standard, IFRS adjustment and the fiscal cost price, but the calculations have characteristics in
common. Differences are briefly presented in Table 2 Differences between cost prices, the costs
components in the quadrants (chapter 4) are compared with each other.
Table 2 Differences between cost prices
The calculation of the direct production costs incorporate in the standard cost price returns in the
fiscal, but are based on actual costs instead of budgeted. Regarding these findings you might expect
that these calculations correspond and are instead of budgeted based on actual costs. If comparing
the standard with the fiscal cost prices for all countries, it is found that Germany does incorporate
the calculations for standard cost price in the fiscal cost price. The Netherlands have developed a
distinctive model for the fiscal cost price, which is not based on the standard cost price. The Belgian
fiscal cost price has no characteristics in common with the standard cost price. Another difference is
Standard cost price Fiscal Cost price IFRS Adjustment
Dif
fere
nce
s
Direct production costs
(labour, energy,
maintenance, packing,
other costs)
Direct production costs
(labour, energy,
maintenance, packing,
other costs)
Raw materials based on
forecasted prices
Raw materials valued
according to FIFO method
Adjustment for difference
FIFO and actual prices raw
materials
Direct depreciation based
on replacement value
Direct depreciation based
on historical value
Direct depreciation,
differences between
replacement value and
historical value
Indirect production, indirect
storage & distribution,
indirect depreciation
Adjustment of indirect
costs, indirect production,
indirect storage &
distribution, Indirect
depreciation
Adjustment for
intercompany products

44
that the standard cost price is calculated separately for each production process and line, in contrast
to the IFRS adjustment and fiscal cost price where there is no distinction made between production
processes (Belgium).
Costs of raw materials are recurring in the standard, fiscal cost price and IFRS adjustment, but are
composed differently. The standard consists of forecasted prices of raw materials (PVC, PE), the fiscal
determines prices based on the FIFO method and the IFRS adjustment compares the FIFO prices with
actual prices. Thus limited harmonisation between the calculations of raw materials is present.
The calculation of depreciation is similar for the standard and fiscal cost price, but instead of
replacement value the fiscal cost price is based on historical costs. In Germany the same model as in
the standard cost price has been used to determine depreciation costs of the fiscal cost price. The
Netherlands and Belgium are using a different model. Depreciation of the IFRS adjustment is the
difference between replacement value and historical value. You might expect that the difference
between the standard and fiscal cost price the IFRS adjustment is. Depreciation in the standard and
fiscal cost price is calculated per product in contradiction to IFRS adjustment which is the total sum of
direct depreciation.
Indirect cost components of the IFRS adjustment and the fiscal cost prices have similarities. The costs
are similar except the IFRS adjustment is calculated each month in comparison to the fiscal cost price
which is calculated once a year. You might expect that the cumulative year value of indirect costs of
the IFRS adjustment is similar compared with the fiscal, but this is not the reality. The IFRS
adjustment comprises all indirect costs together, where for the fiscal cost price indirect costs have to
be assigned to their production process and production lines, this makes it more comprehensive to
transfer the total indirect costs directly from the IFRS adjustment to the fiscal cost price. Overall the
same indirect costs can be uploaded from SAP, but for the fiscal cost price costs have to be further
allocated to products. Another remarkable finding is that the Dutch method incorporates additional
indirect costs for Storage and Expedition, which are not prescribed in the accounting manual.
Overall there is limited integration between the different kinds of cost price. Germany is the only
country which has integrated the standard cost price calculation into to fiscal cost price. Belgium and
the Netherlands have no integration between the standard, IFRS adjustment and fiscal cost price.
5.5 Conclusion
The standard, IFRS adjustment and fiscal cost price of Belgium, Germany and the Netherlands have
been analysed and compared with the accounting manual. A complete overview of all differences is
presented in Table 3 Overview differences cost prices. The different cost prices are also compared with
each other in order to find opportunities for integration. The standard cost price has small
differences, the IFRS adjustment and fiscal cost price have major differences between the countries.
International differences related to the standard cost price are the diverging calculations of
depreciation and the allocation of energy costs in Belgium. Belgium and the Netherlands do not
perform the calculation of depreciation according to the accounting manual, which has seriously
implications for the standard cost price.

45
The IFRS adjustment in particular differs between the countries and the accounting manual. The
calculations are partially in accordance with the accounting manual, but none of the countries has
completely implemented the guidelines of the accounting manual. The Dutch calculation is based on
average budgeted figures, the German method does not calculate FIFO according to the accounting
manual and does not incorporate an adjustment for direct depreciation. The Belgian method is
almost in accordance with the accounting manual, but has not specified indirect costs. The most
ambiguity caused the diverging formats of the countries.
The fiscal cost price has differences, but these are mainly caused by rules and regulations. The
German calculation incorporates the net realisable value method, the Dutch method is based on
current costs and the Belgian method does not incorporate indirect costs. The German method is
very extensive in comparison to the others. Differences are thus caused by rules and regulations,
different working processes and history.

Prescribed in Accounting Manual
In reality
Belgium Germany Netherlands
Standard Cost Price
Raw materials are updated
each month
Based on forecasted (PVC) and
forecasted (PE)
Based on forecasted (PVC) and
forecasted (PE)
Based on forecasted (PVC) and
forecasted (PE)
Based on budgeted direct
production costs: labour,
energy, packaging (not bill of
material), maintenance and
other costs (conversion costs)
Budgeted direct production
costs
Energy is different allocated in
comparison to Germany and
Netherlands
Format for calculations
diverge with NL and BE
All conversion costs are
incorporated
Allocation of costs is more
complex than Belgium e.g. NL
calculates energy based on
KWH per ton, energy for
Belgium is based on last year
consumption kWh
Depreciation should be based
on replacement value, which
is defined as the historical
purchase price to be increased
with annually with an index.
Direct depreciation for
machinery should be based on
80% of planned operating
time
! Depreciation is based on
replacement value, but not
on 80% of planned operating
time
! Depreciation is based on
replacement value and 80% of
planned operating time, but
they did not included a
correction for maintenance
! Depreciation based on
replacement, but should also
be based on 80% of planned
operating time
Table 3 Overview differences cost prices

47
Accounting Manual
In reality
Belgium Germany Netherlands
IFRS Adjustment
(commercial cost price)
Total cost of sales have to
match with inventory value,
each end of the year inventory
has to be valued according to
IFRS adjustments
IFRS is calculated each month
to adjust stock value and at
the end of the year an
overview of total IFRS is
comprised
Calculated each month, to
value stock according IFRS
IFRS is calculated each month
to adjust stock vale and at the
end of the year an overview of
total IFRS is comprised
Raw materials adjustment for
difference between FIFO
value versus actual prices
FIFO minus – actual prices
Separate file for FIFO
All countries have different
formats
FIFO value is compared with
price of 31/12 last year
FIFO of PVC incorporated and
compared with actual prices
Separate file for FIFO
calculations
Indirect production: production
planning, engineering,
maintenance, quality assurance,
laboratory costs
! Indirect costs are
incorporated, but not
specified by type of indirect,
uploaded from SAP
Indirect production costs are
incorporated, uploaded from
SAP
! Indirect costs are assigned, but
not updated based on actual
figures each month. Instead a
percentage of the beginning of
the year is used to determine
indirect costs
Indirect storage &
distribution: costs to bring
products in their current position
! Indirect costs are
incorporated, but not
specified by type of indirect
cost, based on SAP
Is incorporated; storage,
based on SAP
! Not included

48
IFRS Adjustment
Accounting Manual Belgium Germany Netherlands
Adjustment for depreciation:
differences between replacement
value and historical value
Adjustment for depreciation
based on replacement value
vs. actual.
No adjustment for direct
depreciation incorporate
! Adjustment for direct
depreciation, this is based on
replacement value and
budgeted historical value
Language ! Dutch ! German ! Dutch
Not defined in accounting
manual
A mark-up for finished
intercompany products
! Adjustment for intercompany
trade goods. A mark-up of
3.8% over intercompany
finished products
! Adjustment for intercompany
trade goods. A mark-up of
3.8% over intercompany
finished products
! Adjustment for intercompany
trade goods. A mark-up of 3.8%
over intercompany finished
products
Obsolete stock not prescribed in
accounting manual
Not incorporated Not incorporated in the IFRS
monthly, but in the year
overview
Obsolete stock is incorporated

49
Accounting manual Belgium Germany Netherlands
Fiscal Cost Price
Based on actual costs
! Actuals are based on figures
until 30-11
Compares actual costs with
the selling price minus rebates
(based on lower net realisable
value)
! Based on figures until 31-10
Actual figures are calculated
! Actuals are based on figures
until 30-11
Raw materials should be
valued at actual prices or
lowest value
Based on actuals, indirect
costs are not allowed
Raw materials are valued
according to net realisable
value, actual prices are
compared with average
cumulative price raw
materials, lowest value is
chosen
Based on actuals
Actual direct production costs Actual costs of depreciation,
labour, energy and
maintenance,
Packaging and other costs are
not incorporated
Actual direct production costs
Actual figures are calculated
based on standard cost price
model DE
Actual direct production costs (labour, maintenance, packaging, energy, other costs, depreciation
No costs allocated to activity type set-up
Indirect production costs;
Indirect production, indirect
storage, indirect depreciation
! Indirect costs are not
specified, probably because of
local GAAP which prescribes
the exclusion of indirect costs
Indirect costs are buildings,
fire protection, production
planning, water/heating
supply, energy maintenance,
trainees, and laboratory
Indirect costs are allocated to
other costs and consists of
Indirect costs of storage,
expedition, quality assurance,
overhead

50
Fiscal Cost Price
Accounting manual Belgium Germany Netherlands
Depreciation shall be based on
historical costs
Depreciation is not specified,
therefore unknown if
historical value is used
Depreciation is based on
historical value
Depreciation is based on
historical value
Type of inventory method, AM
prescribes the use of lower of
costs and net realisable value
(IFRS). Inventory valuation
depends on local GAAP
No lower value or net
realisable value,
Based on Belgian GAAP, is the
same as IFRS but indirect costs
are prohibited
Based on lower net realisable
value, selling price minus
rebates. IFRS or GAAP is
applied
Net realisable value principle
is not included
Inventory valuation based on
current costs (Dutch GAAP)
Process of calculation Very simplistic model for
calculation of Fiscal cost price,
only actual cost are
incorporated
Germany has a sophisticated
system of calculation
compared to others
Time spend on calculation
between one and two weeks
Many production lines are
included, this makes it less
organized
Less extensive as Germany,
blue cells marks the places
which have to be filled in
One or two days spend on
calculation
IFRS or GAAP Based on GAAP, there are no
indirect costs incorporated
Based on IFRS net realisable
value and lower cost method
are applied
Based on GAAP, inventories
are valued at current costs

51
6. Creating harmonisation in accounting practices
The previous chapter has exposed the differences in cost accounting practices between Belgium,
Germany and the Netherlands and between the different cost prices. The purpose of this chapter is
to find possibilities to create more convergence in the accounting practices of Wavin. Therefore first
the distinctive cost prices are reviewed to create convergence between the countries and secondly a
proposal for harmonisation between the cost prices is described.
6.1 Standard Cost Price
The standard cost price has already much convergence between the countries, because of the
implementation of the standard format for the calculations. Major differences are the allocation of
depreciation and energy in Belgium.
Convergence can be created by allocating costs in a harmonised way for all countries. The accounting
manual can be used as input for the calculation and should be the leading format. Calculations
should be in line with the accounting manual in order to prevent divergence. Depreciation is
prescribed in the accounting manual, but the method is not adopted by all countries. Belgium and
the Netherlands are not calculating depreciation based on 80% of planned operating time (chapter
5). If the allocation of depreciation would be in accordance with the accounting manual the costs of
depreciation of Belgium and the Netherlands would drop considerably which will have impact on the
standard cost price. An advantage of harmonisation of the allocation of depreciation costs is that
arbitrary allocation will be prevented and differences in financial performance will not be caused by
diverging allocation methods.
The allocation of energy costs in Belgium diverges from other countries. Belgium allocates energy
costs through the distribution key consumption in contradiction to Germany and the Netherlands
who allocates costs through the distribution key production volume. In other to create convergence
the allocation of energy costs should be similar for all countries. When analysing the accounting
manual there is no allocation method for energy costs. Different interpretations about the allocation
method cause discrepancies. Discrepancies should be resolved by creating shared meanings, which
can be achieved by making a trade off between the different methods. It is recommended to use the
production volume to determine energy costs. The use of the production volume is more precise,
because it is based on expected production for this year whereas consumption is based on the
consumption of last year. Through the use of one allocation method, understanding of each other
practices will be increased and common meanings will be created (Carlile, 2004).
The current format for the standard cost price has been implemented for Belgium and the
Netherlands. In order to utilize the benefits of this template it is recommended to implement it for
all production processes to further stimulate harmonisation of practices in each country.

52
6.2 IFRS Adjustment
The IFRS adjustment was the most difficult to grasp, first it was known as the commercial cost price
and finally it was the IFRS adjustment. The definition is now clear for everyone, but the calculations
of the countries have still major differences. There is limited convergence and therefore the IFRS
adjustment has to be harmonised. First of all each country should have incorporated the same cost
components in the calculation. In chapter five it was found that Belgium and the Netherlands do
incorporate a calculation for direct depreciation based on the difference between replacement value
and historical value. The German method does not incorporate this calculation. Germany does not
compare FIFO value with actual prices, but with prices of last year December. The Netherlands do not
use absolute figures, but bases their figures on average budgeted costs. To create convergence in the
calculation of the IFRS adjustment all countries should include the cost components mentioned in
the accounting manual. Each country has to deal with the IFRS rules and therefore there should be
no differences. This means that the following costs should be incorporated in the calculations (Table
4 IFRS Adjustment). The costs which should be incorporated in the IFRS Adjustment are based on the
accounting manual (2010) and discussed with the consolidation and reporting manager of Wavin.
Remarkably is the inclusion of an adjustment for intercompany finished products. The accounting
manual does not prescribe this cost component, but the head office requires each country to include
costs for intercompany products.
Table 4 IFRS Adjustment
IRFS Adjustment
1. FIFO raw material adjustment in cost of sales, which is the differences between FIFO value
and actual value
2. Direct depreciation; the difference between depreciation on replacement value and
depreciation on historical value
3. Indirect production; costs for production planning, production management, engineering,
maintenance management quality assurance and laboratory costs
4. Indirect storage & distribution; costs to bring product in their current condition in the
warehouse
5. Indirect depreciation; depreciation of production building, building related installations,
silos and assets included in the overhead stock
6. Adjustment Intercompany finished products
The next step to increase convergence is to create an unified format for the calculation of the IFRS
adjustment for all countries. The format should increase the transparency for employees and ensures
that practices are harmonised. When an unified format is used employees in Germany can perform
the calculations for Belgium and the Netherlands or reverse. Another advantage is that the format

53
can include instructions about which figures where have to be filled in and where data can be
retrieved in order to increase efficiency and simplifies the calculation.
The FIFO calculation is part of the IFRS Adjustment. Belgium, Germany and the Netherlands have all
their distinctive excel files to perform this calculation. The German method is extremely extensive
and the Dutch method is very simplistic. The FIFO calculation could be redesigned in order to create
convergence between the countries. Benefits of redesigning the FIFO calculation are efficiency will
increase, the calculation will be more comprehensible mainly for Germany and harmonisation will be
increased between the countries. The FIFO calculation should include all materials, prices of the last
three months and actual month, purchase volumes, stock value and actual volume in stock. The
proposal for redesigning the FIFO calculation should stimulate the process of harmonisation within
Wavin.
6.3 Fiscal Cost Price
The fiscal cost price has major differences between the countries, Wavin would like to eliminate the
differences as much as possible. Through the analysis of the fiscal cost price, it was identified that
differences between countries are mainly caused by rules & regulations. This fact does impede the
harmonisation of the fiscal cost price, because rules and regulations cannot be changed. Despite the
differences in rules and regulations there are still possibilities to increase harmonisation, especially
the design of the calculation can be improved.
As we have seen in the analysis of the cost prices certain components of the standard and IFRS
adjustment are recurring in the fiscal cost price. Currently those components are not integrated in
the fiscal cost price and this can be optimized. Components of other cost prices which can be
integrated are the calculation of the standard cost price to calculate actual prices and indirect costs
of the IFRS adjustment are recurring in the fiscal cost price.
The fiscal cost price should consist of actual direct production costs, raw materials based on FIFO
value, depreciation based on historical value and indirect costs. It was found that each country has
different requirements because local GAAP. Despite the diverging requirements, there are common
characteristics. Costs which are present in all countries are:
Actual direct production costs have to be allocated
Depreciation based on historical value
Indirect costs have to be included for Germany and the Netherlands in Belgium it is
prohibited
The procedure of the fiscal cost price should first consist of allocating actual costs to all cost centres
and depreciation based on historical value, secondly allocating indirect costs to the cost centres and
finally uploading the costs into SAP to calculate the fiscal cost price. Belgium does not incorporate
indirect costs. The first two steps can be simplified by using the model van the standard cost price to
calculate actual prices. Instead of budgeted prices actual prices have to be used to perform the
calculations. Costs are then finally allocated to activity types for each cost centre. Indirect costs have
to be allocated to the different cost centres and production lines and finally added to the activity

54
types. To calculate depreciation for the fiscal cost price instead of depreciation on replacement value
(standard cost price) depreciation on historical value has to be used. After these steps the calculation
for Belgium and the Netherlands is finished. The costs are then uploaded into SAP to calculate the
definitive fiscal cost price. Germany has to perform additional steps to meet accounting regulations
after uploading costs in SAP. The following steps are additional for Germany:
Raw materials are valued according to lowest value, prices of December are compared with
cumulative annually prices and the lowest price will be chosen.
Selling price has to be determined, this is the price per product minus rebates, cash discount,
freight, interest, stock
Selling prices are compared with actual prices the lower of the two is the net realisable value
and used to value inventory.
The additional steps of the German method do increase the complexity of the calculation and causes
an increase in the amount of time spend on the calculation. If possible these steps have to be
simplified by taking advantage of the benefits of excel and SAP, which saves time and procedures will
be less extensive. The German calculation is currently that incomprehensible that it is almost
impossible to understand. Therefore it is recommended to redesign the calculation to improve the
understand ability. One of the major improvements of the calculation should be the structure.
Currently it is not clear what steps are taken and where the information is retrieved. If the steps
above described will be chronologically followed the calculations would be more understandable.
Thus for each step above mentioned a new sheet has to be designed. The calculation would than
consist of the general steps which are applicable for all countries and then the country specific steps.
If this structure will be followed the calculation would be more comprehensible.
The calculations of the fiscal cost price have been developed years ago, limited information is stored
about which components should be incorporated in the calculations. Therefore it is recommended to
store the requirements for each country. Existing calculations are now based on in the past
developed practices, but nobody does know if they are still right. The Netherlands for example do
incorporate additional indirect costs (indirect constant costs) in comparison to the other countries.
Employees could not tell why, because this is the way it is done.
6.4 General recommendations for increasing convergence
The standard, IFRS adjustment and fiscal cost price haven been discussed in order to increase
convergence, beside these recommendations there are a few general issues which might increase
convergence at Wavin. In chapter two was found through using the framework of Carlile (2004) that
managing knowledge can be improved by transferring, translating and transforming knowledge. Now
the solutions to improve the management of knowledge according to Carlile (2004) will be
presented. Wavin has problems related to the first two stages with transferring and translating
knowledge. Problems related to those stages are differences between actors are not known and
there are different interpretations between actors. In the case of Wavin differences of the standard,
IFRS adjustment and fiscal cost price were not known between Belgium, Germany and the
Netherlands. In chapter five differences are analysed, this provided the necessary explanations. The

55
fiscal cost price has differences mainly because of normative pressures, which was beforehand not
know. Employees have now the knowledge why there are differences, which is beneficial to create
shared meanings.
Solutions according to Carlile in stage one are the storage of information in order to make it possible
to retrieve information when necessary. Convergence can be further created through the storage of
the definitions and calculations in the accounting manual. If Wavin improves the storage of the
definitions and calculations of the cost prices employees will know what is required to perform the
calculation. All employees are then capable to retrieve information and differences are known
between countries. Currently the limited storage of information is a risk for the continuity of Wavin,
only a few people have the required knowledge of cost price calculations if these employees leave
the organisation Wavin might have a problem.
Stage two deals with creating shared meanings by eliminating misinterpretations. Employees within
Wavin had different interpretations about the commercial cost price, which was actually the IFRS
adjustment. The IFRS adjustment and the cost components which have to be incorporated should be
defined in the accounting manual, this could prevent different interpretations. Other possibility to
increase convergence internationally is to create interaction between employees. Through the
interaction between employees of the different countries employees will know each other practices
and differences. This information can be input to make tradeoffs between practices and best
practices can be selected or designed. If Wavin would like to create convergence in practices a more
centralised information structure is recommended. Employees can then exchange information and
best practices can be developed for calculations and implemented. In the next chapter the
implementation of a template for the IFRS adjustment will be discussed.
Other general recommendations related to the creation of more harmonisation are the use of one
common language. Currently each country has their own native language to perform the calculations
and to communicate. If convergence in international accounting practices is the objective a common
language should be used. The accounting manual is written in English therefore it should be logic if
all calculations are in the English language. When the calculations are written and described in
English all employees are enable to share knowledge which stimulates convergence across all
countries.
Excel is an important tool for employees of the controlling department. You might expect that
employees have all the same level of knowledge of Excel, but this is not the case. Employees have
different levels of experience and knowledge. If employees knew all functions and benefits of excel
they would probably have improved the calculations and efficiency would have increased. Currently
employees are using complex formula’s e.g. the calculation of net realisable value can be done more
efficiently with the newest versions of excel. Therefore it is recommended to review existing
practices to increase efficiency.

56
6.5 Conclusion
Convergence in cost accounting practices can be achieved by creating convergence in the
calculations and procedures for Belgium, Germany and the Netherlands. The standard cost price has
already much convergence, the IFRS adjustment has to be redesigned to create convergence and the
fiscal cost price has limited possibilities to create convergence due to rules & regulations. The most
important recommendations for improving convergence in cost accounting practices across Wavin
will be briefly summarized.
Harmonisation of the standard cost price could be created trough implementing the template for all
countries and production processes. To increase convergence between the countries a few minor
adjustments should be made;
Allocation of deprecation in Belgium and the Netherlands should be according to the
accounting manual
Allocation of energy in Belgium is based on consumption instead of production volume
The IFRS adjustment needs the most adaption. To increase harmonisation of the IFRS adjustment the
following recommendations should be applied in all countries;
An unified format for all countries
Each country should incorporate the same cost components in the calculations
The FIFO calculations should be redesigned in order to create convergence and increase
efficiency
The fiscal cost price has international differences, mainly because of rules and regulations. To
increase harmonisation the calculations should be reviewed. This can be achieved by creating a
standard format for the calculations which can be implemented for all countries. The first step to
calculate the fiscal cost price is for all countries similar, namely the allocation of actual costs and
indirect costs (Germany and the Netherlands). The model of the standard cost price can be used, but
instead of budgeted costs actual costs plus indirect costs should be incorporated. After the first step
Germany has to do additional steps to be in line with the requirements of GAAP. Other
recommendations are;
Simplify the excel files of the fiscal cost price
Integrate the model of the standard cost price in the fiscal cost price to calculate actual
prices and add indirect costs
Perform the fiscal cost price according to the steps before mentioned (chronologically
structure)
Redesign the excel files which are used to perform the calculations

57
General recommendations are to improve the storage of information, definitions have to be defined
in the accounting without leaving room for interpretations. Cost components of the calculations
should be stored to provide the employees the necessary information to perform calculations. All
countries have to use the English language, this improves communications and prevents different
interpretations. The last point of interest is to review current practices, because current practices
have been developed in the past and are out dated. New technologies and functions in e.g. excel and
SAP could improve efficiency and the quality of work. Formulas could be simplified through new
functions in Excel files which increases efficiency.
Recommendations are done for all cost prices to create harmonisation between the countries. In
order to create harmonisation the recommendations have to be implemented. In accordance with
the supervisor of Wavin has been decided to create a redesign for the IFRS adjustment. The next
chapter will further elaborate on the process of redesigning the IFRS adjustment.

58
7. Redesign of IFRS Adjustment
This chapter presents a redesign of the IFRS adjustment for Belgium, Germany and the Netherlands.
The IFRS adjustment is redesigned, because as mentioned before currently the IFRS adjustment has
limited harmonisation between the countries. The standard cost price has already a standard
template for all countries and needs only a few small changes to achieve full harmonisation. The
fiscal cost price has differences because of local accepted accounting principles, which impede the
harmonisation. The fiscal cost price will therefore still have differences between the countries. In
collaboration with the supervisor of Wavin is decided to redesign the IFRS adjustment. The redesign
is based on specific requirements, which are determined in collaboration with the stakeholders and
according to the prescribed rules and regulations. Requirements are that the IFRS adjustment should
be applicable for Belgium, Germany and the Netherlands, has the same cost components according
to the IFRS, increases efficiency and should be transparent. Costs which have to be incorporated are
an adjustment for raw materials, direct depreciation, indirect production, indirect storage &
distribution, indirect depreciation and an adjustment for intercompany products (chapter 6, Table 4
IFRS Adjustment).
In order to design a new format for the IFRS adjustment, first the existing calculations were reviewed
to determine if one of the calculation spreadsheets would be suitable as redesign. After analysing all
calculation models it was decided that the Belgian method is the most suitable format to use as input
for the redesign. The format incorporates all cost components and is the most transparent and
efficient format. The model will not be fully implemented, because certain components are not
suitable for an unified format. The redesign has led to the following format see appendix iii. The
format consists of a part were the data have to be entered and contains information where the
necessary data can be found (Table 5 Data IFRS Adjustment). When the data is entered all costs
components will be automatically calculated. The format consists of five steps where all costs will be
calculated namely the FIFO calculation, adjustment direct depreciation, indirect costs, adjustment
intercompany products and an overview with all costs. For a complete overview of the proposed
format see appendix iii. Fictitious figures are used to present the calculations.
Table 5 Data IFRS Adjustment
SAP CODE
GENERAL DATA BELGIUM GERMANY NETHERLANDS
Production Volume Cumulative to current month SAP BW SAP BW SAP BW
Value Finished Products in Stock (KG)Current month
SAP BW SAP BW SAP BW
Value Intercompany Products (€)Current month
SAP (S_ALR_87012284)SAP (S_ALR_87012284) SAP (S_ALR_87012284)
Total Indirect cost; Sum total Indirect costs
Indirect Production; Production planning,
production management, engineering,
maintenance management, quality assurance
and laboratory costs
Cumulative to current month BE_IndProdi
(S_ALR_07013611)
DE_Indprod SAP NL_INDPROD
(S_ALR_07013611)Indirect storage & Distribution; costs to bring
products in their current condition in the
warehouse or stock transfer from production to
warehouse
Cumulative to current month
Indirect Depreciation; production buildings,
building related installations, silo's and assets
used by the departments
Cumulative to current month SAP SAP SAP
Direct depreciation Replacement (actual) valueCumulative to current month 28598000 28598000 28598000
Direct depreciation Historical value Cumulative to current month Depr_hist Depr_hist Depr_hist

59
The first step comprises the adjustment for raw materials, which is the difference between FIFO
value and actual price. Currently all countries are using a separate file for the calculation of the FIFO,
because of the extensiveness. The adjustment for raw materials has to be uploaded from the
separate FIFO file. The FIFO files of Belgium, Germany and the Netherlands have major differences as
before is discussed. When harmonising the IFRS adjustment it is also recommended to redesign the
FIFO adjustment to create convergence in this calculation. Therefore a redesign for the adjustment of
raw materials has to be developed, but first the IFRS adjustment is presented.
The second step comprises the difference between depreciation on replacement value and
depreciation on historical value (Table 6 Adjustment direct depreciation). The formula for the
adjustment of direct depreciation is:
(Historical value / Production Volume) – (Replacement Value / Production Volume) * Value Finished
Products in stock (KG) = Adjustment Direct Depreciation
Table 6 Adjustment direct depreciation
The third step is the calculation of the adjustment for indirect costs (Table 7 Indirect Costs). Indirect
costs are calculated through:
(Total Indirect Costs / Production Volume) * Finished Products in Stock (KG)
The blue cell presents the total adjustment for indirect costs.
Table 7 Indirect Costs

60
Step four is the calculation of intercompany products, which is calculated through the total value of
finished intercompany products (€) multiplied with 3.8%. The 3.8 per cent is determined by the head
office and is applicable for Belgium, Germany and the Netherlands.
Table 8 Adjustment Intercompany products
The final step (step five) consists of an overview of all adjustments and the differences between the
current month and last month (Table 9 Total IFRS Adjustment). The differences between the months
will be booked on the ledger account.
Table 9 Total IFRS Adjustment
7.1 Impact of redesign IFRS
The redesign of the IFRS adjustment is completed and should be tested, before it can be
implemented. Therefore data have to be gathered to compare the current situation with the
proposed redesign to determine the impact for all countries. To find the right data first it should be
known where the data can be retrieved. Therefore a table is designed with information about where
the data can be retrieved (appendix iv). After gathering and analysing the data which was an
extremely time consuming job, it was identified that each country retrieves remarkably their data
differently. The information source of the data of intercompany stocks is differently in each country,
Belgium retrieves there data from SAP BW (reporting and consolidation tool for management
information), Germany has developed an abap code to retrieve the value of finished products and
the Netherlands use using SAP to retrieve the data. An abap code is a code which is especially
developed by ICT to calculate the value of finished products intercompany and is a very expensive
way. Instead of using an abap code Germany could have used SAP or SAP BW to calculate the value
of intercompany products, because it should provide the same information. Another finding is that
Belgium has not incorporated the data of all plants in the calculation of direct depreciation, which is
remarkable. It was expected that the data used to perform the calculations can only be retrieved
from one source, but apparently different sources can be used. Another remarkable finding is that all
those sources have different values. The different data collection methods for the IFRS adjustment

61
do not make the calculation easier, therefore it is recommended to harmonise the method of data
collection. In collaboration with the stakeholders of Wavin is determined which data collection
method should be applied. Criteria for the selection were quality, efficiency and the method have to
be applicable for all countries. With quality is meant the precision and completeness of the data
collection method and efficiency is about how fast data can be collected. A proposal to collect data is
incorporated in the table in appendix iv.
The next step is to measure the impact of the redesign for Belgium, Germany and the Netherlands.
The current situation is compared with the proposed situation. First the data to perform the
calculations is compared with the proposed situation. Secondly a comparison is executed between
the current and proposed situation of the adjustment for depreciation, indirect costs, intercompany
products and total adjustment.
The redesign has limited impact on the IFRS adjustment in Belgium, overall are there small deviations
with the current situation. Differences between the current and proposed method can be explained
by the figures of depreciation, production volume and indirect costs. These figures are composed
differently in comparison with the current method. These different figures leads to a change in
variables in the formulas and finally to a different IFRS adjustment. An example is the calculation of
direct depreciation, costs are calculated per kg and multiplied with finished products in stock in KG.
In the proposed situation another value is used as production volume this affected immediately the
adjustment for direct depreciation. The adjustment for direct depreciation has a small deviation,
because currently the costs of only the plant Aalter are incorporated instead of all plants (Aalter and
Sint-Niklaas). The adjustment for indirect costs diverges, because currently there are no indirect
costs for depreciation allocated and the figure for indirect production is diverging through a
correction in the current situation. The impact of the redesign has affected the adjustment for
intercompany products the most. Currently the value of intercompany is retrieved from SAP BPC and
in the proposed from SAP. SAP has as advantage that information can be easily retrieved in
comparison to SAP BPC, where all kinds of variables have to be filled in order to get the right figure.
The redesign has a bigger impact on the practices of Germany in comparison to Belgium. Differences
are again caused because the values of the variables in the formulas are differently. The value of
finished products is diverging, because in the redesign the figures of SAP BPC are used and in the
current situation a correction is made. The total adjustment would decrease, this is mainly caused
through the difference in value of finished products (KG) which caused a decrease in the adjustment
for indirect production. Another important fact is that currently there are no costs assigned for direct
depreciation.
The Dutch IFRS adjustment will increase in comparison with the current situation. Important
differences between the proposed situation and current situation are the formulas. The current
situation calculates the adjustment based on average budgeted costs and the proposed situation
bases costs on actual figures which explains the differences. The proposed solution calculates the
adjustment through costs per kg multiplying with the current stock value in KG. The current situation
as analysed in chapter five calculates the IFRS adjustment according to a different method and do not
incorporate production volume and value finished products. The contradiction in indirect costs and

62
depreciation costs are caused through the use of budgeted costs in the current situation and actual
costs in the proposed situation.
The allocation of indirect storage & distribution is a point of discussion, no costs are in the current
and proposed situation allocated. To determine these costs it should be clear which costs have to be
incorporated, but remarkably this is not known. According to the accounting manual indirect storage
& distribution are costs to bring the products in their current condition in the warehouse or stock
transfer location from production to the warehouse (accounting manual, 2010). The question how to
determine those costs has been asked at the head quarter, but they could not give a decisive answer
and caused some interesting conversations. Therefore further steps have to be taken to create
understanding about which costs should be incorporated. The head quarter has already announced
to give a decisive answer about the problems with the allocation of indirect storage and distribution.
Overall the redesign has more impact in Germany and the Netherlands than in Belgium. The impact
for Germany can be explained by the fact that cost components which should be incorporated
according to the accounting manual are currently not incorporated (depreciation, indirect storage &
distribution). The Dutch method was first based on average budgeted costs and the proposed
situation incorporates actual costs.
7.2 Benefits of the redesign
Wavin would like to harmonise practices this has consequences for the IFRS adjustment. Therefore
the benefits of the redesign should overweight the doubts. The most important benefits of the
proposed design are practices will be harmonised, the quality improves, employees can be
exchanged and calculations are simplified.
The purpose of thesis is to create harmonisation between accounting practices, the proposed
redesign of the IFRS adjustment can contribute to this process. Each country will have a harmonised
format, calculations and data collection method. The format incorporates all cost components
according to the accounting manual and head quarter which eliminates differences between the
countries and prevents misinterpretations. The quality of the calculations will be improved, because
all costs are now incorporated and figures are based on actual costs instead of budgeted average
figures (Netherlands). Benefits for employees are that all employees can perform the calculations for
each other when necessary. Finally calculations are simplified, employees only have to enter the
correct data in excel and the calculations will be performed. In comparison with the current situation
the calculations will be more efficient, because limited steps have to be taken and it is prescribed
where employees can find the data and where they have to enter the data. This will lead to
harmonised and standardized working procedures and thus reduces the chance on errors.
63
8. Conclusions
This research focuses on analysing differences between Belgium, Germany and the Netherlands for
the standard cost price, IFRS adjustment and fiscal cost price and to explore possibilities to increase
harmonisation between the countries. In the past Wavin had a decentralised organisation structure
each country has designed independently its own calculations and procedures, which caused
differences in accounting practices. Wavin would like to harmonise their practices of the standard
cost price, IFRS adjustment and fiscal cost price. The harmonisation should create harmonisation
between cost accounting practices, which should lead to higher efficiency, transparency and finally a
reduction of costs. Problems which are identified and could impede the process of harmonisation are
different interpretations about the IFRS adjustment, differences in allocation of costs, limited
information is stored (IFRS adjustment and fiscal cost price), there is limited integration between the
different cost prices and the efficiency of the calculations could be improved. To arrive at a proposal
for harmonisation first the research questions have been answered and finally a proposal for creating
harmonisation is designed. The problem definition is:
Analysing differences in cost accounting practices and a proposition for the harmonisation of
the cost accounting system
Sub questions are;
1. What is the definition and function of the commercial, fiscal and standard cost price at
Wavin?
2. How are the standard, commercial and fiscal cost price calculated and how should they be
calculated according to the accounting manual?
3. What describes the theory about harmonisation, theoretical concepts of cost accounting,
convergence and divergence of cost accounting practices?
4. What are differences and similarities in the calculation of the standard, commercial and
fiscal cost price between Wavin Belgium, Germany, the Netherlands and the accounting
manual and why?
5. How can the system of cost price calculation improved or redesigned in order to create more
convergence and increase efficiency?
6. How can the IFRS adjustment redesigned?
The first section of the research focuses on the exploration of the standard, IFRS adjustment and
fiscal cost price the most important findings will be briefly discussed. These findings are related to
research question one, two and three. The standard cost price is the price for a product which is
determined on forecasted raw materials, the budgeted direct production costs and depreciation
costs (Accounting Manual Wavin, 2008). Raw materials are PCV and PE, the prices of those materials
are determined based on the expected price for the upcoming month. The function of the standard
cost price is for profit measurement, inventory valuation, support managerial decision making and is
input for the selling price. The IFRS is for revaluation of inventory. The IFRS adjustment updates the
value of finished products, because the total cost of sales value have to match with the inventory
value. The IFRS adjustment consists of a revaluation/devaluation of raw materials based on FIFO

64
correction, indirect production in cost of sales, indirect storage in cost of sales, indirect depreciation
in cost of sales, an adjustment for direct depreciation and an adjustment for intercompany products.
The head quarters requires including an adjustment for intercompany products. The fiscal cost price
is calculated for external financial reporting to value inventory based on the international financial
reporting standards (IFRS) and general accepted accounting principles (GAAP). The IFRS requires
finished products to be valued at the absorption price. Absorption costing comprises the costs of the
raw materials, the actual direct production costs the actual direct depreciation based on historical
costs and the actual indirect production or logistical costs in order to bring the products in their
current location and condition in the warehouse or stock transfer point from production to the
warehouse.
Wavin has problems related to the management of knowledge, which impede the process of
harmonisation. There are different interpretations among employees about the IFRS adjustment and
limited information is stored of the cost prices. The accounting manual failed to prescribe a decisive
definition and calculation of the cost prices. Remarkably there were even mistakes in the accounting
manual about the composition of the IFRS adjustment. In order to solve these problems the
framework of Carlile (2004) has been applied. Carlile states that management of knowledge can be
improved by creating shared meanings through explaining differences, sharing and storing of
knowledge. Knowledge of the cost prices can be stored through definitions functions and
calculations. Employees have now the access to information of cost price calculations, which
prevents different interpretations and improves the communication. Table 10 Cost components cost
prices provides an overview of the cost components of the three cost prices.
Standard cost price IFRS Adjustment Fiscal cost price
Direct production costs
Direct labour
Direct energy
Direct packaging
Direct maintenance
Other costs
Adjustment for FIFO
Adjustment for direct depreciation
Adjustment for intercompany products
Actual direct production costs
Direct labour
Direct energy
Direct packaging
Direct maintenance
Other costs
Direct materials
Depreciation (replacement value)
Mark up
Indirect storage & distribution
Indirect production
Indirect depreciation
Raw materials
Direct depreciation (historical value)
Indirect storage & distribution
Indirect production
Indirect depreciation Table 10 Cost components cost prices

65
Shared meanings can be created by indentifying differences between Belgium, Germany and the
Netherlands. The framework of Granlund & Lukka (1999) has been used to explain convergence and
divergence in cost accounting practices between Belgium, Germany and the Netherlands at Wavin.
The framework incorporates economic, coercive, normative and mimetic pressures to explain
convergence and divergence in accounting practices. An important finding is that coercive pressures
have a major impact on the practices of the fiscal cost prices, because each country has to deal with
local legislation about inventory valuation. The exploration of coercive pressures has led to better
insight in the rules and regulations of each country and explains partially the differences in
calculations, which were first not known. Normative pressures are affecting Wavin through culture
and have probably the most impact on current cost accounting practices. Culture affected Wavin
through the decentralised organisation structure in the past which caused diverging cost accounting
practices.
Differences between the countries are extensively described in chapter five. The standard cost price
has differences, because of allocation of costs.
Energy in Belgium is differently allocated
Depreciation in Germany, Belgium and the Netherlands is not calculated according to the
accounting manual
In Belgium energy costs are allocated based on consumption of last year, in comparison in Germany
and the Netherlands costs are allocated based on production volume. Allocation based on
production volume is more precise, because energy costs are then depending of expected volume. In
the case of Belgium energy costs will not change if volume will increase or decrease.
Depreciation is another point of interest, according to the accounting manual depreciation should be
based on 80% of planned operating time. Belgium and the Netherlands do not calculate depreciation
according to the accounting manual, they bases deprecation on replacement value. Germany applies
the 80% rule, but failed to incorporate a mark up for maintenance. This method makes that currently
more costs are incorporated in the standard cost price than when applying the method of the
accounting manual. If practices have to be harmonised than rules and requirements of the
accounting manual should be followed.
The IFRS adjustment caused the most ambiguity. The adjustment should consist of an adjustment for
raw materials, direct depreciation, indirect production, indirect storage & distribution, indirect
depreciation and an adjustment for intercompany products. The analysis of the IFRS adjustment
revealed many differences namely:
Currently each country has a different format, incorporates different cost components and
uses different calculations to calculate the adjustment
Belgium and the Netherlands do not incorporate costs for storage and distribution, because
it is not clear which costs should be incorporated
Germany does not perform a calculation for an adjustment for direct depreciation.
The Dutch method to calculate the IFRS is based on average budgeted costs, in comparison
the German and Belgian method are based on actual figures

66
Differences are caused because each country has developed independently its own calculation in the
past and the accounting manual failed to prescribes the cost components which should be
incorporated or contained mistakes. This lack of clarity caused the diverging methods.
The fiscal cost price was an extremely time consuming process to analyse, because it is comprised of
extensive excel files with limited structure. Mainly the German method caused difficulties to analyse
because of the complexity. International differences are mainly caused through coercive factors as
local rules and regulations. Rules and regulations require that:
The German method should based on the net realisable value, which is a comparison
between the actual value and selling prices minus rebates, the lower of the two will be used
to value inventory.
The Dutch method consists of the calculation of actual direct production costs and indirect
costs.
The Belgian method incorporates direct production costs and it prohibits the inclusion of
indirect costs.
When analysing the fiscal cost price it is noticed that there is no convergence between the countries.
Germany uses the model of the standard cost price to calculate actual costs, instead of budgeted
costs actual costs are used. The Netherlands have developed their own distinctive model with no
integration with the standard cost price. The Belgian method is a very simple model in comparison to
the other countries, it is comprised of only one table with actual costs.
Most research have analysed differences in cost accounting practices between Anglophone countries
and Japan or Germany (Krumwiede, 1998 and Aust, 1999). This study advances the literature by
analysing differences on a small scale between Belgium, Germany and the Netherlands. It is noticed
that there are even differences in cost accounting practices on a small scale between European
countries. According to many researchers those differences in accounting systems can be explained
by Hofstede (1980) cultural dimensions, institutional variables (Powell & DiMaggio, 1983), contextual
and economic variables (Granlund & Lukka, 1999). At Wavin differences in practices are mainly
caused through culture, each country has its own methods and procedures. Germany has a very
complex cost accounting system in comparison to Belgium and the Netherlands. Ahrens & Chapman
(1999) also found that German companies run more complex cost accounting system. Other
differences can be explained by the framework of Granlund & Lukka (1999), coercive pressures do
affect cost accounting practices through rules and regulations. Despite international rules to
harmonise reporting standards, it was found that for inventory valuation (fiscal cost price) still local
accepted accounting principles are applied. Those rules and regulations explain partially the
complexity of the Germany cost accounting system (fiscal cost price). Through the globalization and
increased competition practices have to be harmonised and thus differences will be reduced as much
as possible. Wavin has started this process by implementing the redesign of the IFRS adjustment and
will further continue to increase harmonisation between countries.

67
8.1 Recommendations for harmonisation
The harmonisation of cost accounting practices should lead to convergence between standard cost
price, IFRS adjustment and fiscal cost price. The standard cost price has already much convergence
between the countries. The allocation of depreciation and energy can be improved to increase the
harmonisation. Depreciation should be based on 80% of planned operating time, when this will be
implemented arbitrary allocation will be prevented. Another recommendation for the standard cost
price is to allocate energy costs based on production volume instead of consumption of last year for
Belgium. This would increase the harmonisation and the calculation will be more precise. The existing
template for the standard cost price is recommended to implement for all countries to further
stimulate harmonisation in practices. The process of implementation of the standard template has
already started and will be continued in the next months.
For the IFRS adjustment it is recommended to implement the proposed redesign. The proposed
redesign stimulates the process of harmonisation, all countries will have similar cost components and
perform the calculation in the same way. Through the redesign practices will be more transparent
and efficiency will be increased. The current FIFO calculation of Germany has to be reviewed,
because it is an inefficient and complex calculation in comparison to Belgium and the Netherlands.
The German FIFO calculation can be improved through by formulas which reduce the size of the excel
file. The redesign of the IFRS adjustment has already been operational in Germany and the
Netherlands.
The fiscal cost price has differences mainly because of rules and regulations. Still there are
possibilities to create more harmonisation between the countries. The first step the allocation of
actual costs and indirect costs are similar for all countries, except that is it prohibited to incorporate
indirect costs in Belgium. This step can be harmonised through the use of the model of the standard
cost price. Instead of using budgeted costs actual costs can be used and indirect costs should be
added. After this step Belgium and the Netherlands are finished, but Germany has to perform
additional steps to calculate the net realisable value. To achieve integration between the standard
cost price and fiscal cost price a new format has to be designed.
Other possibilities to increase harmonisation are to improve the management of knowledge. This can
be achieved by storage of information of cost prices, use the English language and increase
knowledge of excel. Employees should have the possibility to find the necessary information in the
accounting manual, definitions should be clear and cost components in the calculations should be
known. Misinterpretations and confusion have to be eliminated, these problems can be solved
through the storage of information and interaction between employees this will prevents different
interpretations and creates common meanings and differences will be revealed. Costs for indirect
storage & distribution in the IFRS adjustment are still not clarified, this have to be further explored.
The head quarter has already announced to start with this process end of January 2012.
The IFRS adjustment has been further explored and a redesign is developed. The design consists of
the following cost components: FIFO adjustment, direct depreciation, indirect production, indirect
storage & distribution, indirect depreciation and an adjustment for intercompany products. In excel a

68
format is developed which consists of a part where the data can be entered and where the
calculations are performed. The new format is in comparison with the current formats simpler for
the employees, they only have to enter the correct data and then the calculation will be performed.
Another advantage is that it is prescribed where the data can be found and which cost components
should be incorporated. Advantages of the redesign are:
Quality will improves, figures will be based on actuals instead of budgeted average figures
Efficiency increases, calculation is standardized and instructions are incorporated
Harmonised and transparent format, unified format for all countries
Employees can be exchanged, Germans can perform Dutch or Belgian calculations or reverse
The proposed design will affect the total IFRS adjustment. The impact on the IFRS adjustment for
Belgium is limited. The impact for Germany and the Netherlands is considerably. Differences are
caused through the calculation method especially the allocation of costs. Part of the IFRS Adjustment
is the FIFO calculation which is performed in a separate file because of the extensiveness. The
redesign of FIFO adjustment has already been started, but has not yet finished.
Stakeholders involved in the project are enthusiastic about the redesign and therefore is decided to
implement the redesign. In January 2012 will be started with the implementation of the IFRS
redesign for the Netherlands, Belgium and Germany. The recommendations for the standard cost
price will be implemented, except for depreciation in the Netherlands.
8.2 Reflection of objectives
The objectives determined at the start of the research are achieved. The cost prices are extensively
described, definitions, functions and calculations are now known. One remark the costs of storage
and distribution for the IFRS adjustment needs stills to be clarified. International differences and the
causes and consequences are analysed and compared with the accounting manual. A proposal for
creating harmonisation for the standard cost price, IFRS adjustment en fiscal cost price has been
elaborated for all countries. Finally a redesign is elaborated for the IFRS adjustment. The redesign is
presented and discussed with stakeholders of Wavin (reporting manager, financial director, and
controller) and they are satisfied with the proposal. The redesign shall be implemented in Germany,
Belgium and the Netherlands in the next months.
The thesis has contributed to the harmonisation of cost accounting practices at Wavin. The standard,
IFRS adjustment and fiscal cost price are more harmonised. First there was no overview of all cost
prices and no insight in the international differences. Employees did not even know that practices
were that diverging. The recommendations for the standard cost price, fiscal cost price and redesign
of the IFRS adjustment have stimulated the harmonisation of the finance and controlling
department. The Dutch assistant controller could now even perform the IFRS adjustment for all
countries.
69
8.3 Future Research
This research has presented several recommendations for creating harmonisation in cost accounting
practices for Belgium, Germany and the Netherlands. The Wavin group has many plants across
Europe. The recommendations might be suitable for Wavin plants in other European countries, this
might advance the harmonisation of cost accounting practices. Besides creating harmonisation in
cost accounting practices there are other fields of research which could be further explored to
increase convergence between Wavin plants. The process of redesigning the FIFO calculation part of
the IFRS adjustment is in progress, but has not yet finished. The FIFO redesign needs some further
adjustments and tests to make it applicable for Germany. The costs of storage and distribution
incorporate in the IFRS adjustment have to be clarified.
The fiscal cost price needs further research in order create more harmonisation between the
countries. Excel files have to be reviewed to increase convergence. Besides most practices within
Wavin are performed according to the rules of the IFRS, but for inventory valuation it is still
necessary to follow to rules and regulation of local general accepted accounting principles. It would
make sense if future practices are all according to the IFRS regulations in order to increase
convergence.
The last point of interest is Excel, which is an important tool for calculations within Wavin, but it is
susceptible for mistakes. It is recommended to perform the calculation in SAP or SAP BW in the
future if possible, to increase the quality and efficiency.
The thesis has contributed to the process of harmonisation. Recommendations for the standard, IFRS
adjustment and fiscal cost price have improved the efficiency, transparency and harmonisation. In
order to reap the benefits of the harmonisation Wavin should continue the process and should
review other practices within Wavin.

70
References
Articles and books
Aaken, J.E., Berends, H., Bij, H. (2007) Problem solving in organisations, Cambridge University
Press
Ahrens, T., Chapman, C.S., (1999), The role of Management Accountants in Britain and Germany,
Management accountants volume 77, no. 5 42 - 43
Aust, R. (1999), Kostenrechnung als unternehmensinterne Dienstleistung, Wiesbade: Dt. Univ.-
verl.
Baker, C.R, Barbu, E.M., (2007), Trends in research on international accounting harmonization,
the international journal of accounting 42, 272-304
Bimani, A., (1999), mapping methodological frontiers in cross-national management control
research, accounting organizations and society 24, 413-440
Carlile, P.R., (2004), Transferring, Translating, and Transforming: An Integrative Framework for
managing Knowledge Across Boundaries, Organization Science 15, No. 5, 555 – 568
Daft, R.L., (2007), Understanding the Theory and Design of Organizations, Thomson South-
Western
Davenport, T., Prusak, L., (1998), Working knowledge, Harvard Business School Press, Boston, MA
DiMaggio, P.J., Powell, W.W., (1983), The Iron Cage Revisited: Institutional Isomorphism and
Collective Rationality in Organizational Fields, American Sociological Review 48, 147-160
Doupnik, T.S., Salter, S.B., (1995) External environment, culture, and accounting practice: a
preliminary test of a general model of international accounting development, International
journal of Accounting 30, 189 – 207
Drury, C. (2008), Management and cost accounting, London: Cengage Learning EMEA, 7th edition
Granlund, M., Lukka, K., (1998), It’s a small world of management accounting practice, journal of
management accounting research volume 10, 153-179
Hofstede, G., (1984), Culture’s consequences. International differences in work-related values,
Journal of cross cultural Psychology, volume 15 no. 4, 417-433
Hoffjan, A., Nevries, P., Stieemann, R., (2007), Comparative Management Accounting Literature
review on Similarities and Differences between Management Accounting in Germanic and
Anglophone Countries, wiso.tu-dortmund.de
Jones, T.C., Luther, R., (2004), Contemporary Practices in German Controlling: Local and Global
Forces in Management Accounting, www.handels.gu.se/eaa2005, November 2005

71
Kajüter, P., Moeschler, M., (2011), Comparative management Accounting: A review of research in
international differences of cost accounting, working paper University of Münster
Kromwiede, K.R., (1998), The implementation Stages of Activity-based Costing and the Impact of
Contextual and Organizational Factors, journal of Management Accounting Research 10, 239-277
Schultz, J.J., Lopez, T.J., (2001), The impact of national influence on accounting estimates:
Implications for international accounting standard-setters, The international Journal of
Accounting 36, 271- 290
Shannon, C., Weaver, W., (1949), The Mathematical Theory of Communications, University of
Illinois Press, Urbana, IL.
Wijewardena, H., Zoysa, A de, (1999) A comparative analysis of management accounting
practices in Australia and Japan An empirical investigation, The international Journal of
Accounting, volume 34, no 1.
Other Information
Internal Documents
Deloitte (2011), IFRSs and NL GAAP a pocket comparison, September 2011
KPMG (2010), How to apply IFRS in a Retail environment, January 2010
PWC (2010), IFRS versus German GAAP similarities and differences, February 2010
Wavin Accounting manual (2008), version 14 November 2008
Wavin Accounting manual (2010), version 31 December 2010
Wavin Annual report, (2010)
Internet
http://www.wavin.com/com/Company_Strategy.html
http://nl.wavin.com/nl/Product_catalogus.html.
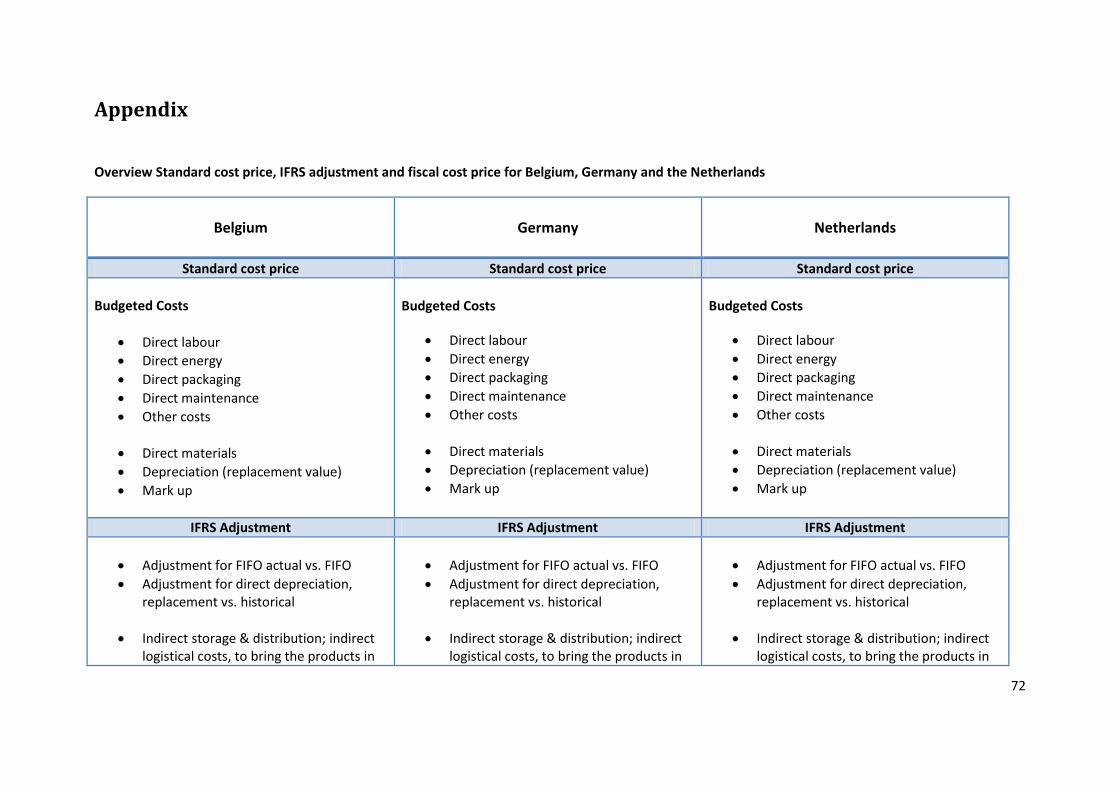
72
Appendix
Overview Standard cost price, IFRS adjustment and fiscal cost price for Belgium, Germany and the Netherlands
Belgium Germany
Netherlands
Standard cost price Standard cost price Standard cost price
Budgeted Costs
Direct labour
Direct energy
Direct packaging
Direct maintenance
Other costs
Direct materials
Depreciation (replacement value)
Mark up
Budgeted Costs
Direct labour
Direct energy
Direct packaging
Direct maintenance
Other costs
Direct materials
Depreciation (replacement value)
Mark up
Budgeted Costs
Direct labour
Direct energy
Direct packaging
Direct maintenance
Other costs
Direct materials
Depreciation (replacement value)
Mark up
IFRS Adjustment IFRS Adjustment IFRS Adjustment
Adjustment for FIFO actual vs. FIFO
Adjustment for direct depreciation, replacement vs. historical
Indirect storage & distribution; indirect logistical costs, to bring the products in
Adjustment for FIFO actual vs. FIFO
Adjustment for direct depreciation, replacement vs. historical
Indirect storage & distribution; indirect logistical costs, to bring the products in
Adjustment for FIFO actual vs. FIFO
Adjustment for direct depreciation, replacement vs. historical
Indirect storage & distribution; indirect logistical costs, to bring the products in

73
their current condition in the warehouse or stock transfer location from production to the warehouse
Indirect production, production planning, production management, engineering, maintenance management quality assurance and laboratory costs
Indirect depreciation; production building, building related installations, silos and assets included in the overhead stock
Adjustment for intercompany products; 3.8% of intercompany products
Fiscal cost price Fiscal cost price Fiscal cost price
Actual costs
Direct labour
Direct energy
Direct packaging
Direct maintenance
Other costs
Indirect costs are prohibited
Depreciation based on historical value and 80% planned operating time
Actual costs
Direct labour
Direct energy
Direct packaging
Direct maintenance
Other costs
Indirect storage & distribution
Indirect production
Indirect depreciation
Depreciation based on historical value and 80% planned operating time
Actual costs
Direct labour
Direct energy
Direct packaging
Direct maintenance
Other costs
Indirect storage & distribution
Indirect production
Indirect depreciation
Depreciation based on historical value and 80% planned operating time

74
Upload to SAP, this is the fiscal cost price
Upload to SAP
Raw materials are valued according to lowest value, prices of December are compared with cumulative annually price and the lowest price will be chosen.
Selling price has to be determined, this is to price per product minus rebates, cash discount, freight, interest, stock
Selling prices are compared with actual price the lower of the two is the net realisable value and used to value inventory. Actual value are uploaded figures in SAP
Upload to SAP, this is the fiscal cost price

75
Appendix i,ii,iii,iv
i

76
ii IFRS Adjustment Belgium

77

78
IFRS Adjustment Netherlands

79
IFRS Adjustment Germany

80
iii Format IFRS Adjustment
Month Country
SAP CODE
GENERAL DATA BELGIUM GERMANY NETHERLANDS
Production Volume SAP BW (production volume)
Value Finished Products in Stock (KG) SAP BW
Value Intercompany Products (€) SAP
Total Indirect cost Sum total indirect costs
Indirect Production
Indirect production are costs for
production planning, production
management, engineering,
maintenance management,
quality assurance and laboratory
costs.
Indirect storage & Distribution
Indirect logistical costs to bring
products in their current
condition in the warehouse or
stock transfer from production to
warehouse
Indirect Depreciation
Indirect depreciation are
production buildings, building
related installations, silo's and
assets used by the departments
Direct depreciation Replacement value SAP
Direct depreciation Historical value SAP
IFRS Adjustment
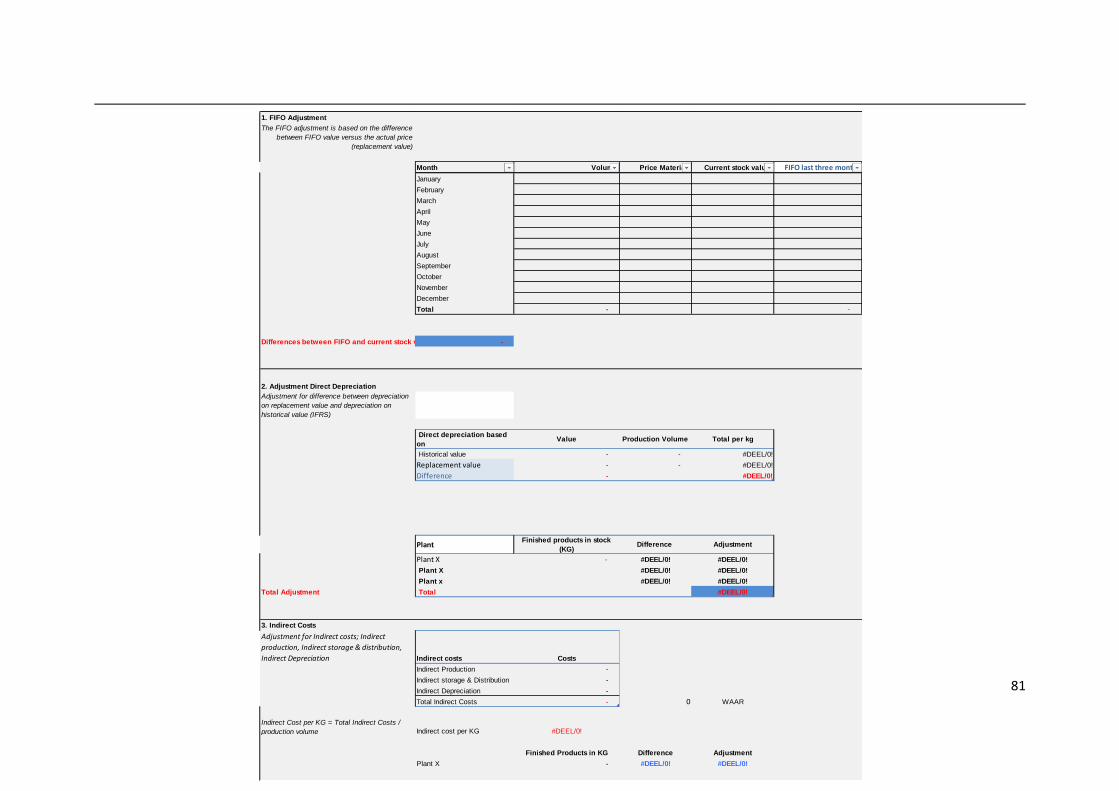
81
1. FIFO Adjustment
The FIFO adjustment is based on the difference
between FIFO value versus the actual price
(replacement value)
Month Volume Price Material Current stock value FIFO last three months
January
February
March
April
May
June
July
August
September
October
November
December
Total - -
Differences between FIFO and current stock value -
2. Adjustment Direct Depreciation
Adjustment for difference between depreciation
on replacement value and depreciation on
historical value (IFRS)
Direct depreciation based
on Value Production Volume Total per kg
Historical value - - #DEEL/0!
Replacement value - - #DEEL/0!
Difference - #DEEL/0!
PlantFinished products in stock
(KG)Difference Adjustment
Plant X - #DEEL/0! #DEEL/0!
Plant X #DEEL/0! #DEEL/0!
Plant x #DEEL/0! #DEEL/0!
Total Adjustment Total #DEEL/0!
3. Indirect Costs
Adjustment for Indirect costs; Indirect
production, Indirect storage & distribution,
Indirect Depreciation Indirect costs Costs
Indirect Production -
Indirect storage & Distribution -
Indirect Depreciation -
Total Indirect Costs - 0 WAAR
Indirect Cost per KG = Total Indirect Costs /
production volume Indirect cost per KG #DEEL/0!
Finished Products in KG Difference Adjustment
Plant X - #DEEL/0! #DEEL/0!

82
4. Adjustment Intercompany Finished Products
Adjustment for Intercompany products 3,8% of
total value intercompany products
Adjustment ICT ValueValue Finished Products
Intercompany -
3,80% -
Total Adjustment Intercompany Products -
5. Total IFRS Adjustment
AdjustmentLast Month Current Month Adjustment with last
month
1. FIFO Adjustment
2. Adjustment direct depreciation
3. Adjustment Indirect Costs
4. Adjustment Intercompany products
Total IFRS Adjustment

83
iv Table DATA IFRS Belgium, Germany and the Netherlands
Data Belgium Netherlands Germany Proposed
Production volume Tonnes are based on information Gert Kamphuis There is a difference between SAP BW and information Gert Kamphuis SAP BW (9.444 ton en 9.456)
Currently not used, SAP BW recommended
SAP BW is not in accordance with method Germany Production volume SAP BW is loaded into excel and then a certain correction is made which is the production volume
SAP BW
Finished products in stock (KG)
1. SAP BW Stock en GM analysis
2. Variant: BE IFRS Own finished prod in stock
1. S_ALR_87012284 2. Variant: NL_IFRS
12031000 finished products + 12032000 semi-finished
This is value in € and not KG
Based on calculation excel Georg, probably better to use SAP.
SAP BW Stock value KG
Direct depreciation on replacement value (actual)
BE 28598000
NL 28598000
DE 28598000
replacement value NWE
(28598000)
Direct depreciation on historical value depreciation
BE_ext_dir Depr_hist
Cannot be found, therefore
SAP use.
DE_Proddir
DEPR_HIST
Depr_hist
Indirect costs (sum all indirect costs)
Total indirect Total indirect Total indirect
Total indirect = indirect production + storage & distribution + indirect depreciation

84
.
Indirect production 1. S_ALR_07013611 - Cost Centres
2. Cost Centre BE_extindi / BE01_prodi
3. GRP_FE 4. Settings level 3
1. S_ALR_07013611 2. NL_INDPROD
1. S_ALR_07013611 2. Var DE_IFRS
(diverge with DE_Indprod) Totaal minus indirect depreciation (zie hieronder) 28412100 28421100 28423100 28431100 28455100 28456100 28459110 38412100 38421100 38423100 38431100 38455100 38456100 - minus H&C wordt apart berekend (stap 2), 12028622
BE_extindi NL_Indprod DE_Inprod??
Indirect storage & Distribution
Not inserted Not inserted Step 4: S_ALR_87013611 *30% Step 5 S_ALR_07013611 12023151 Divide by 6 (16,6667)
Which method can be used?
Indirect Depreciation Not inserted BPC no access 1. S_ALR_07013611 2. Var DE_IFRS
28412100 28421100

85
Indirect Depreciation Not inserted BPC no access 1. S_ALR_07013611 2. Var DE_IFRS
Sum of: 28412100 28421100 28423100 28431100 28455100 28456100 28459110 38412100 38421100 38423100 38431100 38455100 38456100
28412100 28421100 28423100 28431100 28455100 28456100 28459110 38412100 38421100 38423100 38431100 38455100 38456100 The cost element groups are applicable for all countries
Value intercompany products
SAP BW 1. S_ALR_87012284 2. Variant: NL_IFRS
121221 finished products i/c
ZFCO011 Variant: DE IC Stocks
SAP S_ALR_87012284 : Net value intercompany products = intercompany products – obsolescence stock