half-year financial report - amazon web services
TRANSCRIPT

Half-year financial reportJyri Luomakoski – President and CEOMaija Strandberg – CFO
1 –6 / 2017
© Uponor2
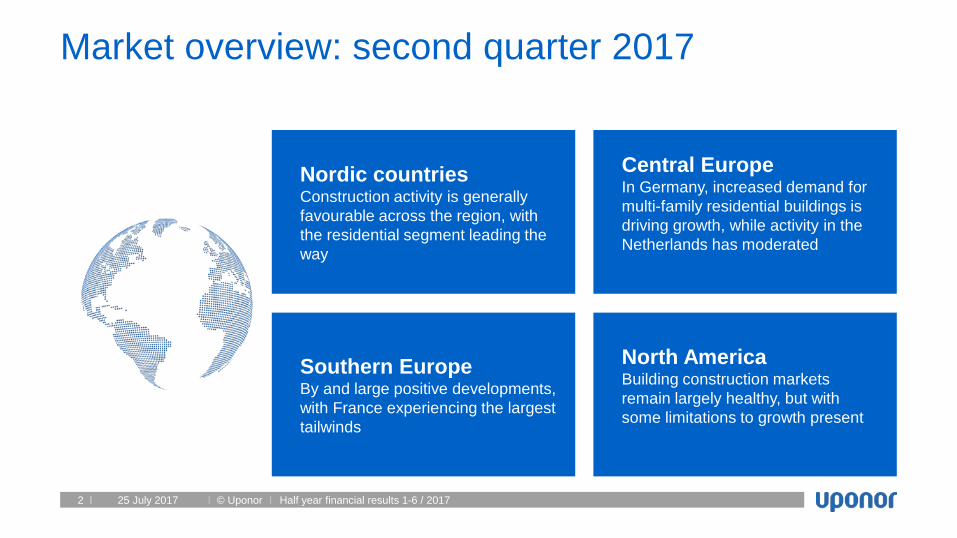
Market overview: second quarter 2017
25 July 2017 Half year financial results 1-6 / 2017
Nordic countriesConstruction activity is generally favourable across the region, with the residential segment leading the way
Southern EuropeBy and large positive developments, with France experiencing the largest tailwinds
Central EuropeIn Germany, increased demand for multi-family residential buildings is driving growth, while activity in the Netherlands has moderated
North AmericaBuilding construction markets remain largely healthy, but with some limitations to growth present

© Uponor3 25 July 2017 Half year financial results 1-6 / 2017
Net sales• Building Solutions – Europe suffered from weaker demand and competitive pressure in key markets • Building solutions demand in the U.S. remained healthy, but capacity constraints and a temporary production issue
curbed deliveries• Uponor Infra benefited from improving demand in North America and Sweden
Operating profit• Flat performance in Building Solutions – Europe, burdened by input costs that offset the savings achieved• Building Solutions – North America saw a sharp decline in operating profit, mainly due to a temporary production issue• Uponor Infra suffered from higher resin prices, sales mix and an increase in transformation spending
Q2/2017: Performance down from Q1 due to a production issue and volatility in demandApril - June, M€ 4-6/
20164-6/
2017 Change
Net sales 299.5 308.4 3.0%
Operating profit 26.5 22.9 -13.6%
Comparable operating profit 30.7 23.8 -22.6%

© Uponor4
Developments by segment: Building Solutions – Europe• Inconsistent sales development across the
European markets– Austria and Eastern European countries
top the list of best performers• Transformation programme completed
– Plan on Italian office consolidation introduced at the end of the 2nd quarter
• Marketing efforts continued in order to promote prefabricated solutions as the future choice in several European markets
25 July 2017 Half year financial results 1-6 / 2017
© Uponor5
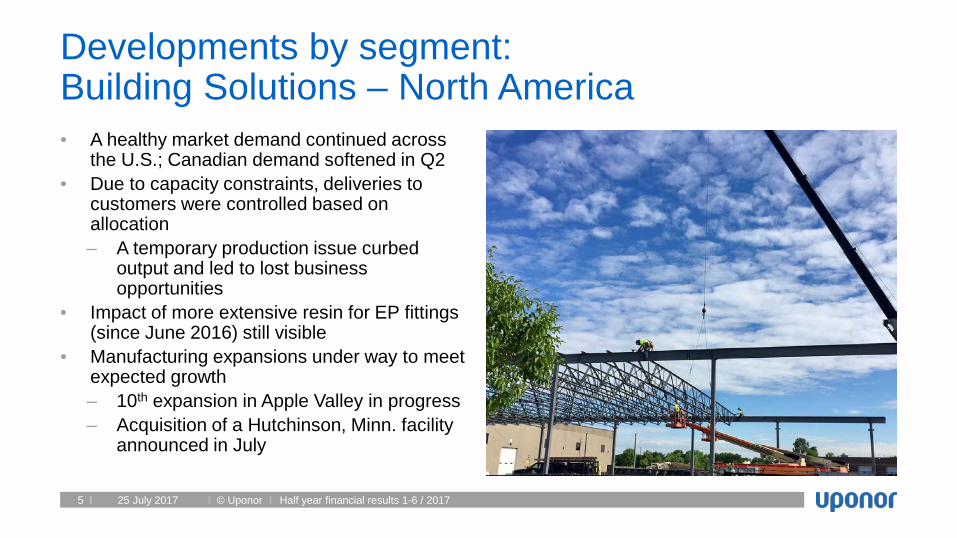
Developments by segment: Building Solutions – North America• A healthy market demand continued across
the U.S.; Canadian demand softened in Q2• Due to capacity constraints, deliveries to
customers were controlled based on allocation – A temporary production issue curbed
output and led to lost business opportunities
• Impact of more extensive resin for EP fittings (since June 2016) still visible
• Manufacturing expansions under way to meet expected growth– 10th expansion in Apple Valley in progress– Acquisition of a Hutchinson, Minn. facility
announced in July
25 July 2017 Half year financial results 1-6 / 2017
© Uponor6
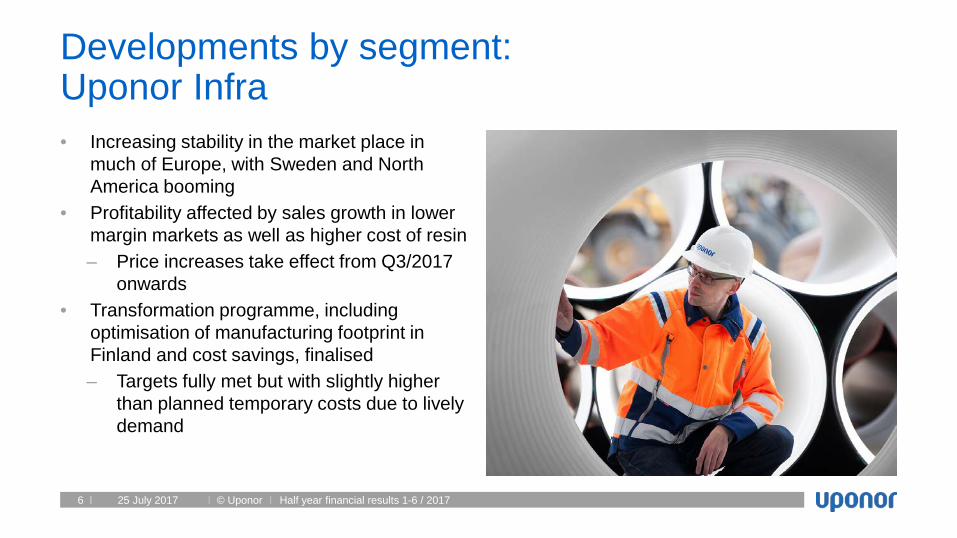
Developments by segment: Uponor Infra• Increasing stability in the market place in
much of Europe, with Sweden and North America booming
• Profitability affected by sales growth in lower margin markets as well as higher cost of resin– Price increases take effect from Q3/2017
onwards• Transformation programme, including
optimisation of manufacturing footprint in Finland and cost savings, finalised– Targets fully met but with slightly higher
than planned temporary costs due to lively demand
25 July 2017 Half year financial results 1-6 / 2017

© Uponor7
Uponor’s European transformation programmes completed with nearly expected resultsLaunched in November 2015 in Building Solutions – Europe and Uponor Infra, in order to:
– strengthen the basis for profitable growth, increase agility, reduce costs and address weak performance in Building Solutions –Europe
– consolidate Finnish manufacturing operations in Uponor Infra
25 July 2017 Half year financial results 1-6 / 2017

© Uponor8
Transformation programme: Building Solutions – Europe key deliverables• Implemented leaner management structure
with central function hubs in Frankfurt (DE); Vantaa (FI); and Warsaw (PL)
• Optimised warehouse, administrative and sales office network Europe-wide
• Transferred PEX and Ecoflex pipe production to Sweden
• Started consultation in Italy on office footprint optimisation (Q2/2017)
– European-wide, a total of 10 consolidated offices and one relocated
• Total workforce reduction to reach 246 by end of 2017 (target 250)
25 July 2017 Half year financial results 1-6 / 2017
© Uponor9
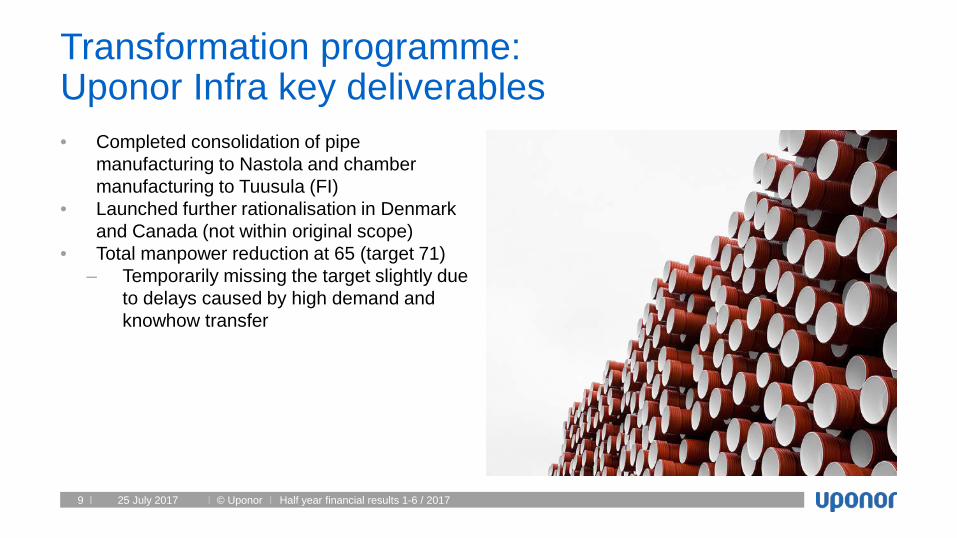
Transformation programme: Uponor Infra key deliverables• Completed consolidation of pipe
manufacturing to Nastola and chamber manufacturing to Tuusula (FI)
• Launched further rationalisation in Denmark and Canada (not within original scope)
• Total manpower reduction at 65 (target 71)– Temporarily missing the target slightly due
to delays caused by high demand and knowhow transfer
25 July 2017 Half year financial results 1-6 / 2017
© Uponor10
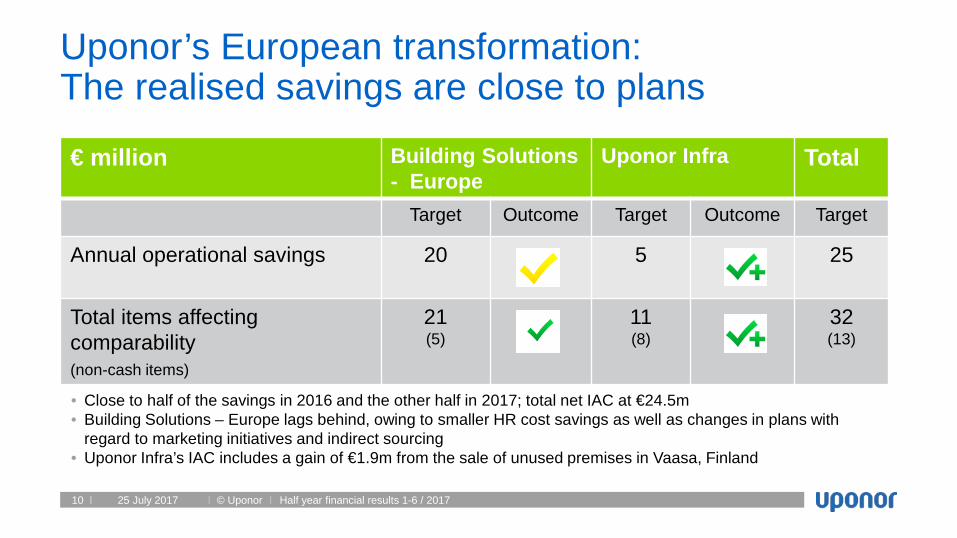
Uponor’s European transformation: The realised savings are close to plans
25 July 2017 Half year financial results 1-6 / 2017
€ million Building Solutions - Europe
Uponor Infra Total
Target Outcome Target Outcome Target
Annual operational savings 20 5 25
Total items affecting comparability (non-cash items)
21(5)
11(8)
32(13)
• Close to half of the savings in 2016 and the other half in 2017; total net IAC at €24.5m• Building Solutions – Europe lags behind, owing to smaller HR cost savings as well as changes in plans with
regard to marketing initiatives and indirect sourcing• Uponor Infra’s IAC includes a gain of €1.9m from the sale of unused premises in Vaasa, Finland

Financial statementsMaija Strandberg– CFO
1 –6 / 2017
© Uponor12
January – June 2017:
Key figures
25 July 2017 Half year financial results 1-6 / 2017
1-6 1-6 Change 1-122016 2017 Y/Y 2016
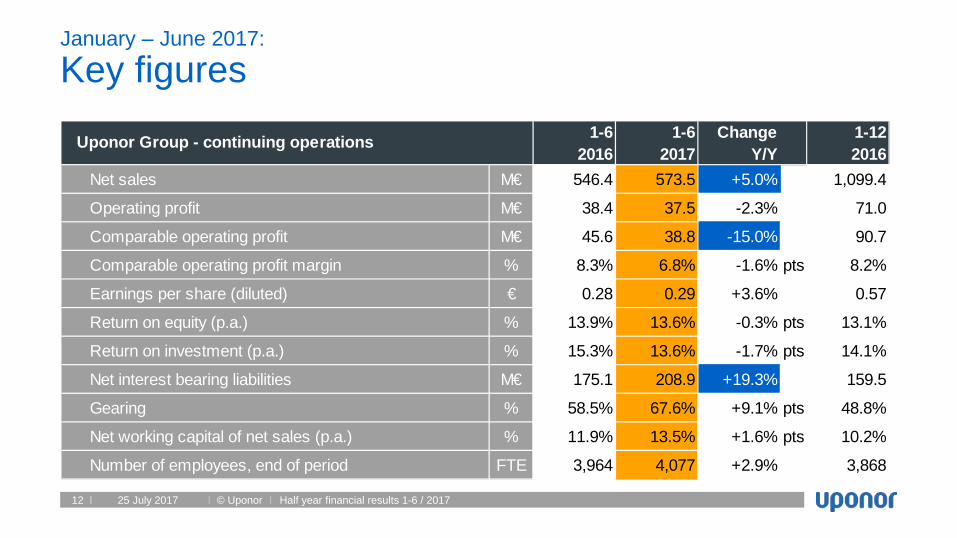
Net sales M€ 546.4 573.5 +5.0% 1,099.4
Operating profit M€ 38.4 37.5 -2.3% 71.0
Comparable operating profit M€ 45.6 38.8 -15.0% 90.7
Comparable operating profit margin % 8.3% 6.8% -1.6% pts 8.2%
Earnings per share (diluted) € 0.28 0.29 +3.6% 0.57
Return on equity (p.a.) % 13.9% 13.6% -0.3% pts 13.1%
Return on investment (p.a.) % 15.3% 13.6% -1.7% pts 14.1%
Net interest bearing liabilities M€ 175.1 208.9 +19.3% 159.5
Gearing % 58.5% 67.6% +9.1% pts 48.8%
Net working capital of net sales (p.a.) % 11.9% 13.5% +1.6% pts 10.2%
Number of employees, end of period FTE 3,964 4,077 +2.9% 3,868
Uponor Group - continuing operations
© Uponor13
April – June 2017:
Income statement
25 July 2017 Half year financial results 1-6 / 2017
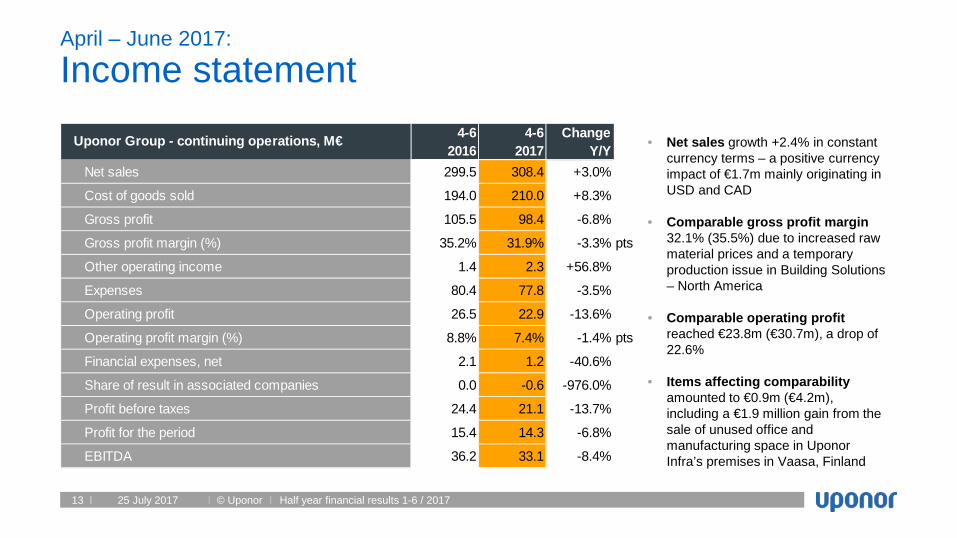
• Net sales growth +2.4% in constant currency terms – a positive currency impact of €1.7m mainly originating in USD and CAD
• Comparable gross profit margin 32.1% (35.5%) due to increased raw material prices and a temporary production issue in Building Solutions – North America
• Comparable operating profit reached €23.8m (€30.7m), a drop of 22.6%
• Items affecting comparability amounted to €0.9m (€4.2m), including a €1.9 million gain from the sale of unused office and manufacturing space in Uponor Infra’s premises in Vaasa, Finland
4-6 4-6 Change2016 2017 Y/Y
Net sales 299.5 308.4 +3.0%
Cost of goods sold 194.0 210.0 +8.3%
Gross profit 105.5 98.4 -6.8%
Gross profit margin (%) 35.2% 31.9% -3.3% pts
Other operating income 1.4 2.3 +56.8%
Expenses 80.4 77.8 -3.5%
Operating profit 26.5 22.9 -13.6%
Operating profit margin (%) 8.8% 7.4% -1.4% pts
Financial expenses, net 2.1 1.2 -40.6%
Share of result in associated companies 0.0 -0.6 -976.0%
Profit before taxes 24.4 21.1 -13.7%
Profit for the period 15.4 14.3 -6.8%
EBITDA 36.2 33.1 -8.4%
Uponor Group - continuing operations, M€

© Uponor14
January – June 2017:
Income statement
25 July 2017 Half year financial results 1-6 / 2017
• Net sales growth +4.5% in constant currency terms – a positive currency impact of €2.5m mainly driven by USD
• Comparable gross profit margin 33.3% (35.5%), mainly burdened by a temporary production issue in North America and competitive price pressure, particularly in the European building solutions business
• Comparable operating profit €38.8m which is 15.0% less than last year (€45.6m)
1-6 1-6 Change 1-122016 2017 Y/Y 2016
Net sales 546.4 573.5 +5.0% 1,099.4Cost of goods sold 353.1 383.7 +8.7% 723.4Gross profit 193.3 189.8 -1.8% 376.0Gross profit margin (%) 35.4% 33.1% -2.3% pts 34.2%Other operating income 2.0 2.6 +25.4% 4.2Expenses 156.9 154.9 -1.4% 309.2Operating profit 38.4 37.5 -2.3% 71.0Operating profit margin (%) 7.0% 6.5% -0.5% pts 6.5%Financial expenses, net 5.5 4.0 -27.1% 10.0Share of result in associated companies 0.1 -1.1 -974.2% -0.6Profit before taxes 33.0 32.4 -1.8% 60.4Profit for the period 20.8 21.7 +4.4% 41.5EBITDA 57.9 57.1 -1.3% 112.6
Uponor Group - continuing operations, M€

© Uponor15
January – June 2017:
Net sales & comparable operating profit by segment
25 July 2017 Half year financial results 1-6 / 2017
• Building Solutions – Europe:Modest net sales growth (+0.8%), while comparable operating profit declined (-3.9%) due to higher raw material prices and start-up expenses related to Asian operations
• Building Solutions – North America: Despite strong Q1, a temporary production issue in Q2 had a measurable impact on net sales (+4.3%) and operating profit (-17.9%)
• Uponor Infra: Strong net sales growth (+12.5%) but comparable operating profit stayed below last year (-46.9%) mainly due to higher resin costs and temporary inefficiencies related to production transfers
Currency: M€
Net sales Comparable operating profit
257.8
150.9139.9
259.9
157.5 157.4
0
50
100
150
200
250
300
Building Solutions - Europe Building Solutions - NorthAmerica
Uponor Infra
1-6 2016 1-6 2017
19.0
25.7
2.5
18.2
21.1
1.3
0
5
10
15
20
25
30
Building Solutions - Europe Building Solutions - NorthAmerica
Uponor Infra
1-6 2016 1-6 2017
© Uponor16
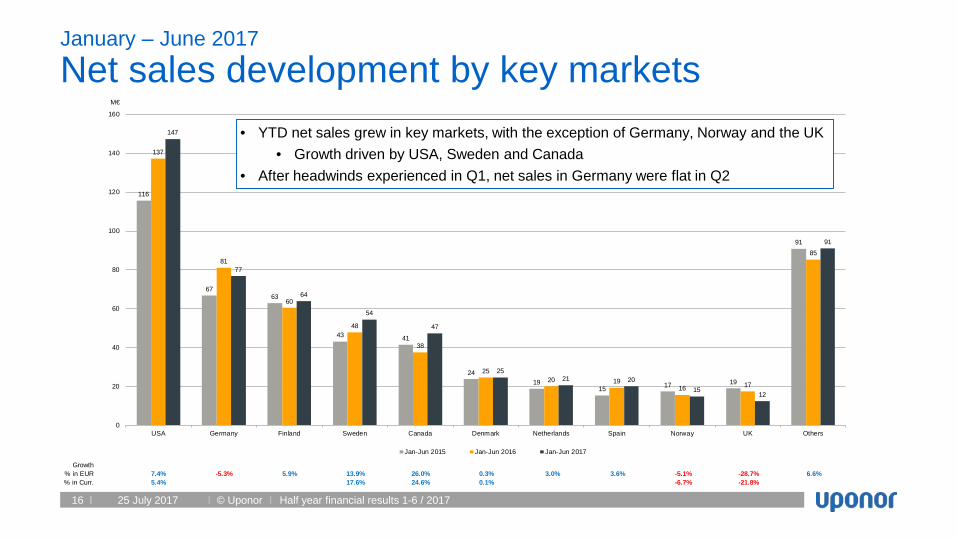
Growth% in EUR 7.4% -5.3% 5.9% 13.9% 26.0% 0.3% 3.0% 3.6% -5.1% -28.7% 6.6%% in Curr. 5.4% 17.6% 24.6% 0.1% -6.7% -21.8%
116
6763
43 41
2419
15 17 19
91
137
81
60
48
38
2520 19
16 17
85
147
77
64
54
47
2521 20
1512
91
0
20
40
60
80
100
120
140
160
USA Germany Finland Sweden Canada Denmark Netherlands Spain Norway UK Others
Jan-Jun 2015 Jan-Jun 2016 Jan-Jun 2017
M€
January – June 2017
Net sales development by key markets
25 July 2017 Half year financial results 1-6 / 2017
• YTD net sales grew in key markets, with the exception of Germany, Norway and the UK• Growth driven by USA, Sweden and Canada
• After headwinds experienced in Q1, net sales in Germany were flat in Q2
© Uponor17
January – June 2017:
Balance sheet
25 July 2017 Half year financial results 1-6 / 2017
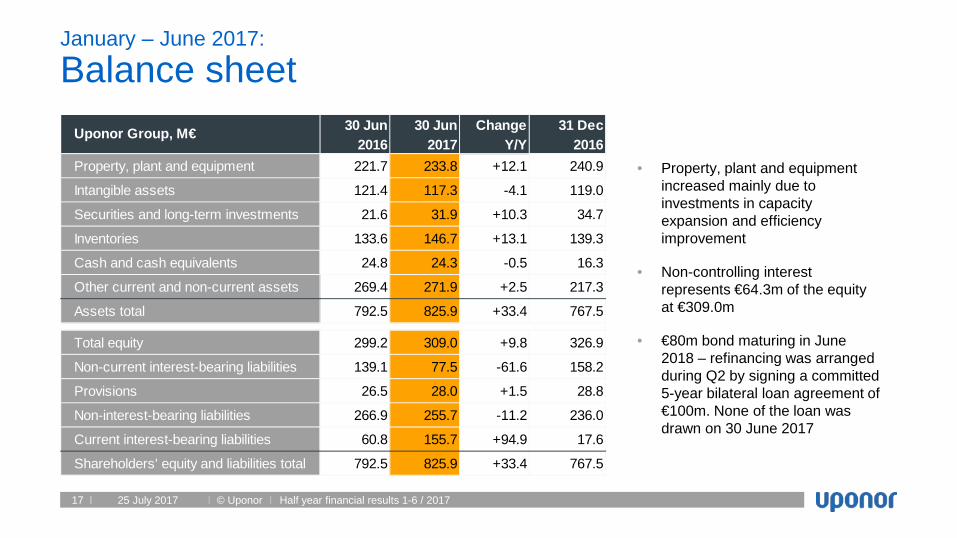
• Property, plant and equipment increased mainly due to investments in capacity expansion and efficiency improvement
• Non-controlling interest represents €64.3m of the equity at €309.0m
• €80m bond maturing in June 2018 – refinancing was arranged during Q2 by signing a committed 5-year bilateral loan agreement of €100m. None of the loan was drawn on 30 June 2017
30 Jun 30 Jun Change 31 Dec2016 2017 Y/Y 2016
Property, plant and equipment 221.7 233.8 +12.1 240.9
Intangible assets 121.4 117.3 -4.1 119.0
Securities and long-term investments 21.6 31.9 +10.3 34.7
Inventories 133.6 146.7 +13.1 139.3
Cash and cash equivalents 24.8 24.3 -0.5 16.3
Other current and non-current assets 269.4 271.9 +2.5 217.3
Assets total 792.5 825.9 +33.4 767.5
Total equity 299.2 309.0 +9.8 326.9
Non-current interest-bearing liabilities 139.1 77.5 -61.6 158.2
Provisions 26.5 28.0 +1.5 28.8
Non-interest-bearing liabilities 266.9 255.7 -11.2 236.0
Current interest-bearing liabilities 60.8 155.7 +94.9 17.6
Shareholders' equity and liabilities total 792.5 825.9 +33.4 767.5
Uponor Group, M€

© Uponor18
January – June 2017:
Cash flow
25 July 2017 Half year financial results 1-6 / 2017
• Gross investments came to €19.3 (15.7) million, remaining slightly below depreciation
• Cash flow from investments in the comparison period includes a net cash flow effect of -€31.4m from the acquisition of KaMo & Delta Group
1-6 1-6 Change 1-122016 2017 Y/Y 2016
Net cash from operations +55.1 +59.2 +4.1 +105.3
Change in NWC -41.9 -45.9 -4.0 -16.6
Net payment of income tax and interest -16.6 -11.8 +4.8 -28.8
Cash flow from operations -3.4 +1.5 +4.9 +59.9
Cash flow from investments -44.4 -16.8 +27.6 -91.8
Cash flow before financing -47.8 -15.3 +32.5 -31.9
Dividends paid -32.2 -33.6 -1.4 -32.2
Other financing +56.5 +57.3 +0.8 +32.0
Cash flow from financing +24.3 +23.7 -0.6 -0.2
Conversion differences +0.1 -0.4 -0.5 +0.2
Change in cash and cash equivalents -23.4 +8.0 +31.4 -31.9
Uponor Group, M€

© Uponor19
Outlook for the futureJyri Luomakoski – President and CEO
© Uponor20
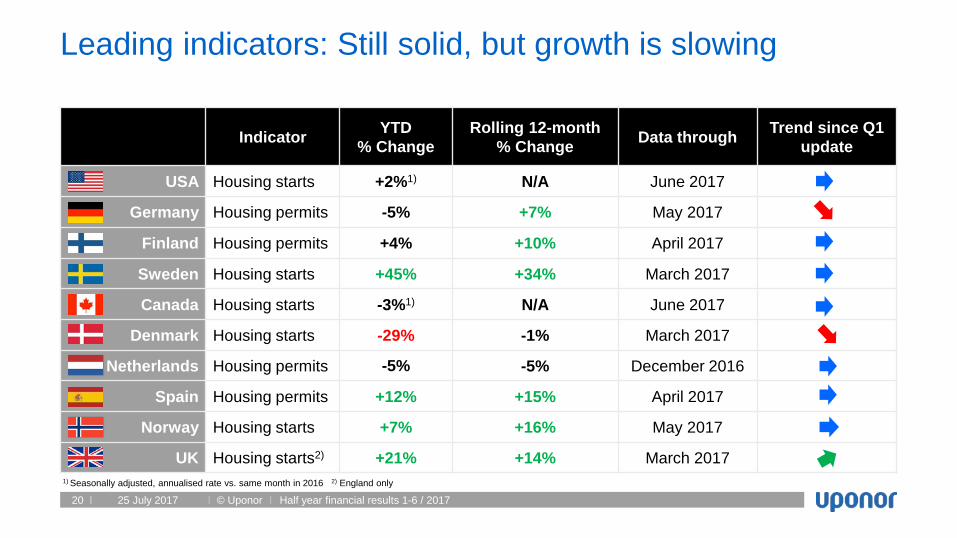
Leading indicators: Still solid, but growth is slowing
25 July 2017 Half year financial results 1-6 / 2017
Indicator YTD% Change
Rolling 12-month % Change Data through Trend since Q1
update
USA Housing starts +2%1) N/A June 2017
Germany Housing permits -5% +7% May 2017
Finland Housing permits +4% +10% April 2017
Sweden Housing starts +45% +34% March 2017
Canada Housing starts -3%1) N/A June 2017
Denmark Housing starts -29% -1% March 2017
Netherlands Housing permits -5% -5% December 2016
Spain Housing permits +12% +15% April 2017
Norway Housing starts +7% +16% May 2017
UK Housing starts2) +21% +14% March 20171) Seasonally adjusted, annualised rate vs. same month in 2016 2) England only

© Uponor21
60
80
100
120
140
160
180
200
Jan-
08Ju
n-08
Nov
-08
Apr-0
9Se
p-09
Feb-
10Ju
l-10
Dec
-10
May
-11
Oct
-11
Mar
-12
Aug-
12Ja
n-13
Jun-
13N
ov-1
3Ap
r-14
Sep-
14Fe
b-15
Jul-1
5D
ec-1
5M
ay-1
6O
ct-1
6M
ar-1
7
Residential Non-residential
Building permit activity in Europe points towards broad-based strengthening in the residential segment
• Data through March 2017 shows continued growth in residential building permits across Europe compared to the same time last year – One notable exception is in Germany,
where permit levels have fallen compared to 2016
• Developments in the non-residential segment have been mixed, with about half of all markets making gains while the other half have fallen since the same time last year
25 July 2017 Half year financial results 1-6 / 2017
European building permits index (Euro Area 19, seasonally adjusted)
Source: Eurostat (Base year = 2010)
© Uponor22
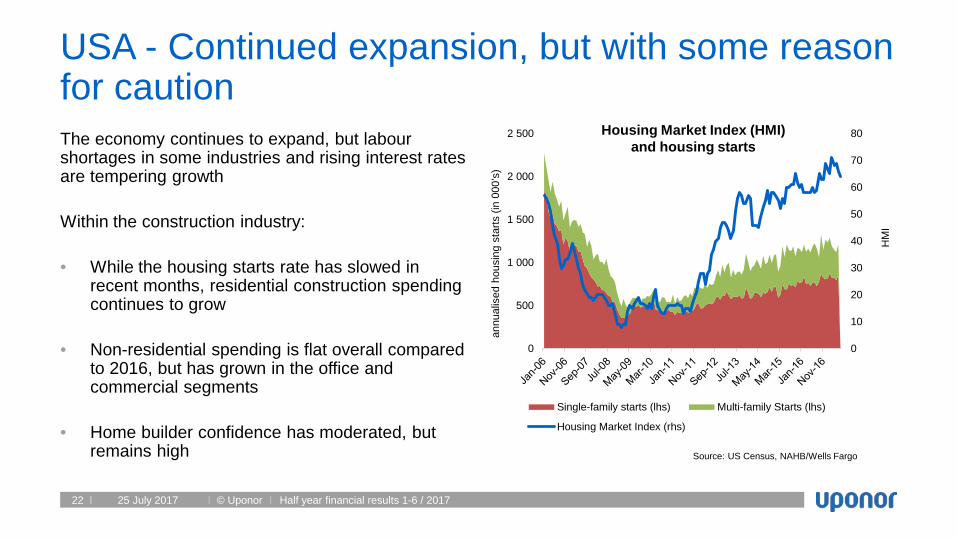
USA - Continued expansion, but with some reason for cautionThe economy continues to expand, but labour shortages in some industries and rising interest rates are tempering growth
Within the construction industry:
• While the housing starts rate has slowed in recent months, residential construction spending continues to grow
• Non-residential spending is flat overall compared to 2016, but has grown in the office and commercial segments
• Home builder confidence has moderated, but remains high
25 July 2017 Half year financial results 1-6 / 2017
0
10
20
30
40
50
60
70
80
0
500
1 000
1 500
2 000
2 500
Single-family starts (lhs) Multi-family Starts (lhs)
Housing Market Index (rhs)
Housing Market Index (HMI) and housing starts
Source: US Census, NAHB/Wells Fargo
HM
I
annu
alis
ed h
ousi
ng s
tarts
(in
000’
s)

© Uponor23
Germany - A strong labour market is supporting residential investment With unemployment at a record low and business confidence at a record high, the economy continues to expand at a moderate pace
Within the construction industry:
• Builders continue to be very positive with regard to the evolution of order books and current building activity
• Growth remains concentrated in the new, multi-family segment, while the renovation segment is essentially flat
• Residential building permits have moderated from their 2016 highs
25 July 2017 Half year financial results 1-6 / 2017
-35
-30
-25
-20
-15
-10
-5
0
5
10
15
140000
160000
180000
200000
220000
240000
260000
280000
300000
320000
340000
Jan-
09Ju
l-09
Jan-
10Ju
l-10
Jan-
11Ju
l-11
Jan-
12Ju
l-12
Jan-
13Ju
l-13
Jan-
14Ju
l-14
Jan-
15Ju
l-15
Jan-
16Ju
l-16
Jan-
17
Con
stru
ctio
n co
nfid
ence
indi
cato
r
Per
mits
(rol
ling
12-m
onth
tota
l)
Rolling 12-month permit total (lhs) Construction confidence (rhs)
German housing permits and builder confidence
Source: Destatis and Eurostat

© Uponor24
Management agenda for 2017
• Speed up the rollout of the strategic offerings in Building Solutions – Europe while fully utilising the renewed operational setup and market presence
• Satisfy the consistently high demand of pipe and fittings among the customers in North America, while securing smooth operations and increasing manufacturing capacity
• Establish stronger foothold in Asia with the new Chinese factory operational
• Promote Uponor’s digital transformation and launch new ground-breaking digital offerings
25 July 2017 Half year financial results 1-6 / 2017

© Uponor25 25 July 2017 Half year financial results 1-6 / 2017
• No sign of changes visible in the market place, which could materially change demand forecasts for 2017
• Subject to the acquisition of the U.S. manufacturing facility and real estate, announced on 20 July 2017, the Group's capital expenditure is estimated to exceed €60 million (excluding any investment in shares) in 2017
• Assuming that economic development in Uponor's key geographies continues undisturbed, Uponor reiterates earlier guidance from February 2017:
The Group’s net sales and comparable operating profit are expected to improve from 2016
Guidance 2017

Q&A Uponor IR site: investors.uponor.com
Uponor IR app:An updated version coming soon! Watchlist & Indices: monitor Uponor’s stock performance and
indices against other companies Create a profile for a more personalised service Webcasts: watch our quarterly release webcasts through the app
Follow us!Twitter: @UponorGroupLinkedIn: UponorYouTube: Uponor Group

Appendix
© Uponor28
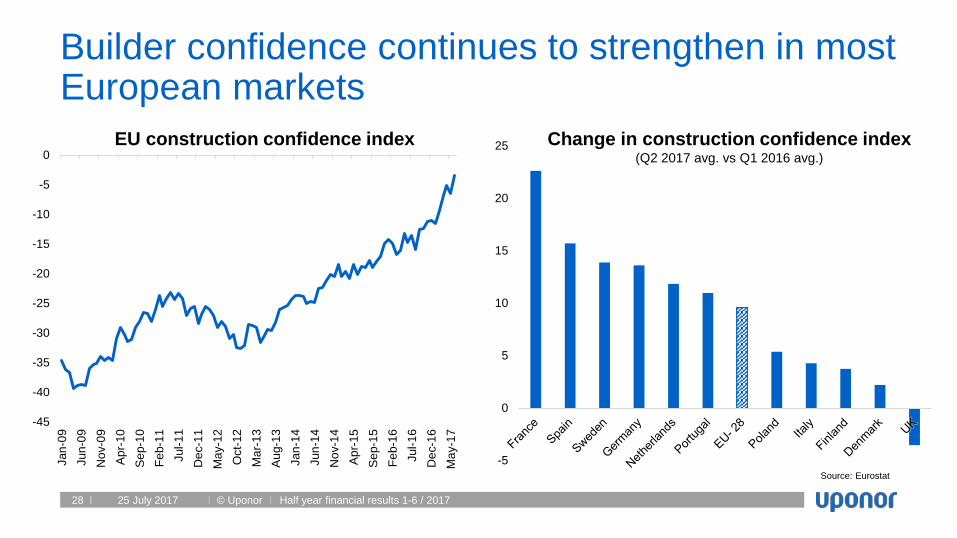
Builder confidence continues to strengthen in most European markets
25 July 2017 Half year financial results 1-6 / 2017
-5
0
5
10
15
20
25
-45
-40
-35
-30
-25
-20
-15
-10
-5
0
Jan-
09Ju
n-09
Nov
-09
Apr
-10
Sep
-10
Feb-
11Ju
l-11
Dec
-11
May
-12
Oct
-12
Mar
-13
Aug
-13
Jan-
14Ju
n-14
Nov
-14
Apr
-15
Sep
-15
Feb-
16Ju
l-16
Dec
-16
May
-17
Source: Eurostat
Change in construction confidence index(Q2 2017 avg. vs Q1 2016 avg.)
EU construction confidence index
© Uponor29
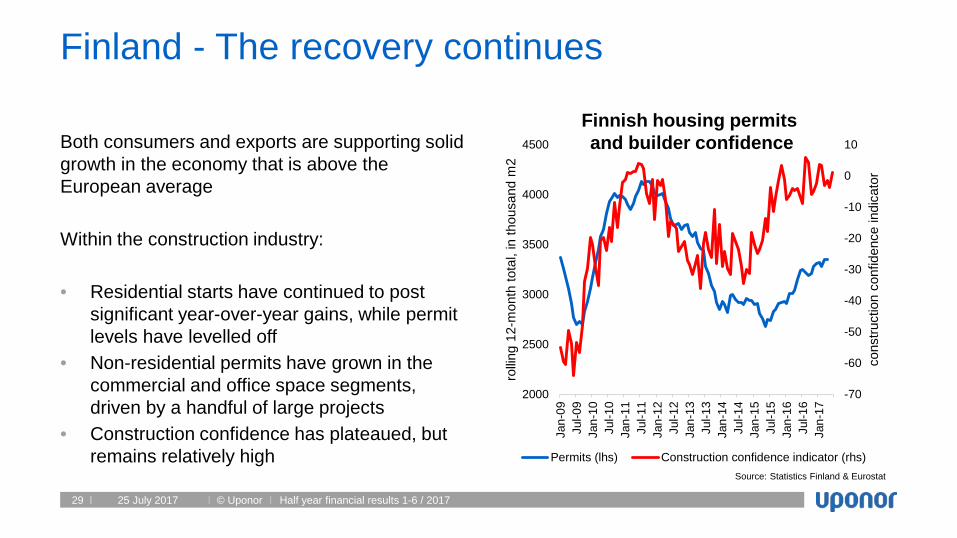
Finland - The recovery continues
Both consumers and exports are supporting solid growth in the economy that is above the European average
Within the construction industry:
• Residential starts have continued to post significant year-over-year gains, while permit levels have levelled off
• Non-residential permits have grown in the commercial and office space segments, driven by a handful of large projects
• Construction confidence has plateaued, but remains relatively high
25 July 2017 Half year financial results 1-6 / 2017
Finnish housing permits and builder confidence
Source: Statistics Finland & Eurostat
-70
-60
-50
-40
-30
-20
-10
0
10
2000
2500
3000
3500
4000
4500
Jan-
09Ju
l-09
Jan-
10Ju
l-10
Jan-
11Ju
l-11
Jan-
12Ju
l-12
Jan-
13Ju
l-13
Jan-
14Ju
l-14
Jan-
15Ju
l-15
Jan-
16Ju
l-16
Jan-
17
cons
truct
ion
conf
iden
ce in
dica
tor
rollin
g 12
-mon
th to
tal,
in th
ousa
nd m
2
Permits (lhs) Construction confidence indicator (rhs)

© Uponor30
Sweden - Fundamentals remain solid
Economic fundamentals remain solid and growth, although showing signs of moderating, is robust
In the construction industry:
• Housing starts continue to rise, especially in the multi-family segment
• Builders report strong order books and confidence
• Property prices have continued to rise, prompting some concerns
25 July 2017 Half year financial results 1-6 / 2017
Housing starts in Sweden
Source: Statistics Sweden
0
10 000
20 000
30 000
40 000
50 000
60 000
70 000
80 000
0
5 000
10 000
15 000
20 000
25 000
Q1 Q3 Q1 Q3 Q1 Q3 Q1 Q3 Q1 Q3 Q1 Q3 Q1 Q3 Q1 Q3 Q1 Q3 Q1
2008 2009 2010 2011 2012 2013 2014 2015 20162017
rolli
ng 4
-qua
rter
tota
l
quar
terly
am
ount
Quarterly (lhs) Rolling 4-quarter total (rhs)
© Uponor31
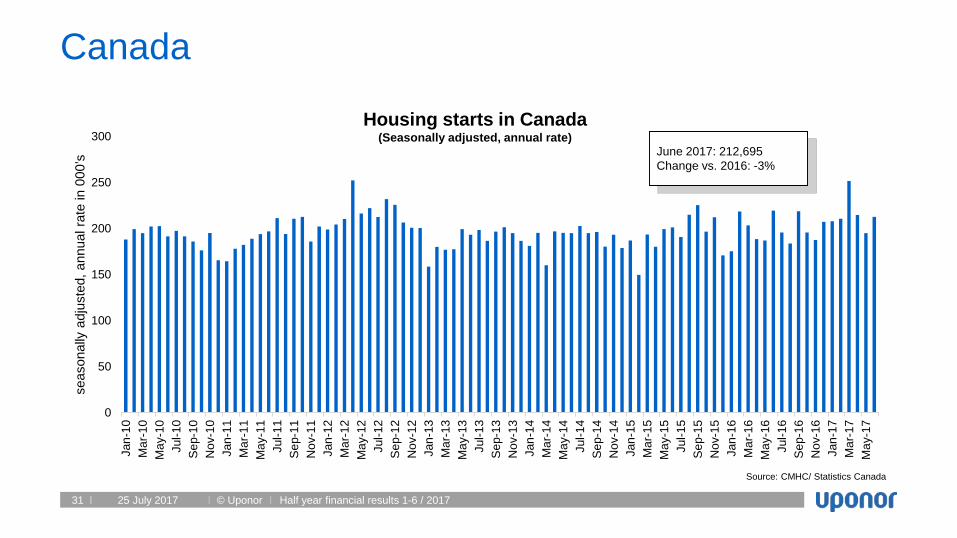
Canada
25 July 2017 Half year financial results 1-6 / 2017
Source: CMHC/ Statistics Canada
June 2017: 212,695Change vs. 2016: -3%
Housing starts in Canada(Seasonally adjusted, annual rate)
0
50
100
150
200
250
300Ja
n-10
Mar
-10
May
-10
Jul-1
0S
ep-1
0N
ov-1
0Ja
n-11
Mar
-11
May
-11
Jul-1
1S
ep-1
1N
ov-1
1Ja
n-12
Mar
-12
May
-12
Jul-1
2S
ep-1
2N
ov-1
2Ja
n-13
Mar
-13
May
-13
Jul-1
3S
ep-1
3N
ov-1
3Ja
n-14
Mar
-14
May
-14
Jul-1
4S
ep-1
4N
ov-1
4Ja
n-15
Mar
-15
May
-15
Jul-1
5S
ep-1
5N
ov-1
5Ja
n-16
Mar
-16
May
-16
Jul-1
6S
ep-1
6N
ov-1
6Ja
n-17
Mar
-17
May
-17
seas
onal
ly a
djus
ted,
ann
ual r
ate
in 0
00’s

© Uponor32
Denmark
25 July 2017 Half year financial results 1-6 / 2017
0
5000
10000
15000
20000
25000
0
500
1000
1500
2000
2500
3000
3500
4000
rollin
g 12
-mon
th to
tal
mon
thly
am
ount
Started Rolling 12-month total
Jan-Mar 2017: 4,004Change vs. 2016: -29%
Housing starts in Denmark
Source: Statistics Denmark
© Uponor33
0
5000
10000
15000
20000
25000
30000
35000
40000
0
500
1000
1500
2000
2500
3000
3500
4000
Jan-
09
Apr
-09
Jul-0
9
Oct
-09
Jan-
10
Apr
-10
Jul-1
0
Oct
-10
Jan-
11
Apr
-11
Jul-1
1
Oct
-11
Jan-
12
Apr
-12
Jul-1
2
Oct
-12
Jan-
13
Apr
-13
Jul-1
3
Oct
-13
Jan-
14
Apr
-14
Jul-1
4
Oct
-14
Jan-
15
Apr
-15
Jul-1
5
Oct
-15
Jan-
16
Apr
-16
Jul-1
6
Oct
-16
Jan-
17
Apr
-17
rollin
g 12
-mon
th to
tal
mon
thly
am
ount
Starts Rolling 12-month total
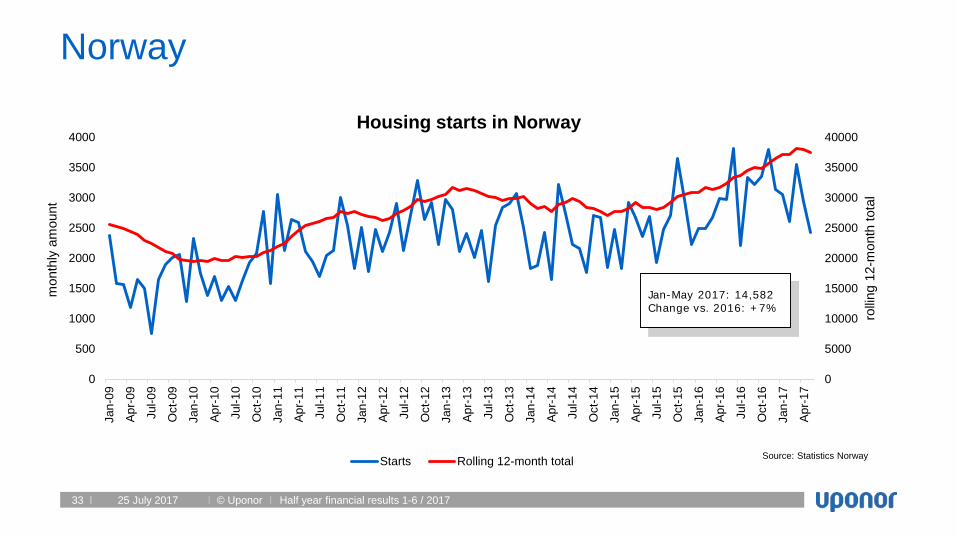
Norway
25 July 2017 Half year financial results 1-6 / 2017
Housing starts in Norway
Jan-May 2017: 14,582Change vs. 2016: +7%
Source: Statistics Norway