half-year financial
TRANSCRIPT

Klicken Sie hier, um Text einzugeben.
Half-Year
Financial
Statements
― BayWa Group 2021

BayWa Group – Contents
1 BayWa Group Half-Year Financial Statements 2021
Contents
Interim Management Report 2
Overview of Business Performance of the BayWa Group 2
Business Performance by Segment in the First Half of 2021 3
Energy Segment 3
Agriculture Segment 5
Building Materials Segment 7
Innovation & Digitalisation Segment 8
Other Activities 8
Assets, Financial Position and Earnings Position of the BayWa Group 9
Outlook 11
Condensed Interim Consolidated Financial Statements as at 30 June 2021 14
Consolidated Balance Sheet 14
Consolidated Income Statement 16
Consolidated Income Statement by Quarter 17
Consolidated Statement of Comprehensive Income – Transition 18
Condensed Consolidated Cash Flow Statement 19
Condensed Consolidated Statement of Changes in Equity 20
Selected Explanatory Notes to the Consolidated Financial Statements 22
Affirmation by the Legally Authorised Representatives 34
Financial Calendar 35
Note Amounts are stated in millions of euros and rounded to one decimal place unless otherwise stated. This may result in minor discrepancies in
sum totals and when calculating percentages.
For improved readability, gender-specific wording and formal reference to all gender identities are not used. The selected form stands for all
genders (m/f/other).

BayWa Group – Interim Management Report
2 BayWa Group Half-Year Financial Statements 2021
Interim Management Report
Overview of Business Performance of the BayWa Group
BayWa Group generates record-breaking half-year results
Consolidated revenues stood at roughly €9.3 billion after six months of the current financial year, up 13.3% year on year. Earnings before
interest and tax (EBIT) improved by €90.8 million to a total of €144.6 million. The BayWa Group achieved EBIT of roughly €99.5 million in
the second quarter alone. All three operating segments – Energy, Agriculture and Building Materials – recorded a significant year-on-year
increase in earnings (EBIT) in the first half of 2021. The Energy Segment posted the largest improvement in earnings, more than tripling its
EBIT compared to the same period in the previous year. This trend was driven solely by the Renewable Energies business unit, which
benefited from major project sales and strong photovoltaic (PV) component business. In the Building Materials Segment, EBIT improved by
a good 95% year on year in the reporting period. This rise was due to BayWa’s ability to deliver products almost without interruption during
the reporting period, despite disruption to supply chains, thanks to its inventories and established and stable network of suppliers. The
Agriculture Segment was able to achieve EBIT growth of just over 43% compared to the previous-year period. The international trade
activities of Cefetra Group (formerly: BayWa Agri Supply & Trade – BAST) and domestic agricultural business were the main contributors to
this earnings uptick, with the latter benefiting primarily from improved trade margins on product marketing and fertilizers. Overall, BayWa –
as an essential business – once again managed to hold its ground in the ongoing coronavirus crisis.
In € million
Q2/2021
Q2/2020
Change in %
Q1–2/2021
Q1–2/2020
Change in %
Revenues 5,011.3 4,323.6 15.9 9,283.4 8,193.7 13.3
EBIT 99.5 81.6 21.9 144.6 53.8 > 100
At €57.3 million, EBIT in the Energy Segment more than tripled year on year. This positive performance was solely due to the Renewable
Energies business unit, where major project sales with a total output of 137 megawatts (MW) were concluded in the first half of the year and
demand was consistently high in trade activities involving PV components. Compared to the same period in the previous year, the total
output of PV modules sold rose by around 57%. Sales of inverters also rose accordingly and were up 38% on the previous year’s figure. In
the Conventional Energy business unit, the operating result was down on the high previous-year figure as at 30 June 2021, as expected. This
decline was due in particular to weaker demand for heating oil in the first half of 2021. By contrast, sales of wood pellets and lubricants rose
year on year. In Regensburg and Karlsruhe, BayWa Mobility Solutions GmbH opened two further liquefied natural gas (LNG) filling stations,
expanding its range of CO2-optimised solutions and taking the total number of LNG filling stations to seven.
EBIT rose by just under 43.3% in the reporting period in the Agriculture Segment. Strong earnings growth was achieved in the Cefetra
Group and Agri Trade & Service business units. The Global Produce and Agricultural Equipment business units, on the other hand, were
unable to match their high previous-year figures. Both international and domestic product trading benefited from the positive price trend on
grain markets. In the Cefetra Group business unit, trade opportunities improved compared to the previous-year period, as uncertainty on
agricultural commodities markets triggered major price volatility and pushed prices up overall. Specialities business also performed well
and was able to increase its earnings contribution year on year. In terms of the agricultural input business, trading margins on fertilizers
improved to the greatest extent. Restructuring in domestic agricultural business also had a positive impact on earnings. Marketing volume
in the Global Produce business unit was down slightly on the high previous-year figure. Sales volumes in both Germany and BayWa’s
international markets fell short of the previous-year period. In Germany, the start of the summer fruit harvest was much later than usual,
which should cause delay effects moving into the second half of the year. In addition, weather conditions that were unfavourable to some
types and batches of fruit impacted quality and reduced harvest volumes.
In the Building Materials Segment, EBIT almost doubled compared to the previous year. The robust development of the construction
industry saw sales rise across the entire product range. In addition, the business unit is likely to have benefited from the fact that, as a key
part of the economy, the building materials locations in Germany remained unaffected by the temporary closures to stop the spread of the
coronavirus in the first half of 2021. BayWa Bau Projekt GmbH and building materials trade in Austria also contributed to the positive
BayWa Group – Interim Management Report
3 BayWa Group Half-Year Financial Statements 2021
earnings performance. The dynamic development of building materials prices also continued in the second quarter of 2021, with low
availability giving the trend additional momentum. Thanks to its inventories as well as its established and stable network of suppliers,
BayWa’s Building Materials Segment was able to deliver products almost without interruption and successfully generated higher trade
margins in the process.
Based on the segments’ operating earnings in the first half of 2021, the Board of Management has raised its forecast increase in the BayWa
Group’s full-year operating result for 2021 from “moderate” (1% to 5%) to “significant” (10% to 20%).
Business Performance by Segment in the First Half of 2021
Energy Segment
Market and industry development Investments in renewable solar and onshore wind energy were up 3% year on year in the first half of 2021 at just under USD125 billion.
Investments in solar energy increased by nearly 9% year on year to roughly USD78 billion, whereas investments in onshore wind energy
declined by approximately 5% to around USD46 billion. Global capacity expansion of onshore wind turbine capacities is likely to decline to
just under 78 gigawatts (GW) over the course of 2021 as a whole, which equates to a year-on-year decline of roughly 14%. This is due in
particular to the solid expansion figures in China and the US in the final quarter of the previous year. Given that subsidies for onshore wind
turbines expired in these two countries at the end of 2020, expansion rates picked up significantly towards the end of the year. According to
global forecasts, the field of solar energy can expect to see a capacity expansion of approximately 183 GW in 2021, which corresponds to an
increase of almost 27% year on year. Alongside the growth drivers of China, India and the US, some 19% of PV capacity expansion will likely
be attributable to the EMEA region.
Renewable energies covered around 43% of energy consumption in Germany in the first half of 2021, which works out to a decline of about
7 percentage points year on year. Weather conditions were the main reason for the lower share of gross electricity consumption attributable
to renewable energies. Record-breaking figures were recorded in the generation of solar and wind energy in the previous year, whereas both
the number of hours of sunshine and wind levels were down on long-term averages in the reporting period, particularly in the first quarter. In
addition, electricity consumption was also below average in the first half of 2020 on account of the lockdown, making the share of renewable
energies higher as a result. In total, 122 billion kilowatt-hours (kWh) of green electricity was fed into the grid in the first half of 2021, which
translates to an 11% decline year on year. Wind energy accounted for the largest share of renewable energy (48 billion kWh), followed by
solar energy with 28 billion kWh. At approximately 2.4 GW, solar energy capacity expansion in Germany surpassed the previous year’s figure
by 27% in the first five months of the calendar year 2021. Capacity expansion of onshore wind turbines came to 832 megawatts (MW) in the
same period, some 38% higher than the previous-year period. Despite this significant increase, wind energy capacity expansion was still
down on the figures recorded in previous years. Long planning and approval processes, as well as a shortage of designated land due to
minimum distance standards, are the main reasons for the sluggish capacity expansion. What is more, legal action against issued approvals
can lead to delays or even the suspension of some projects.
Crude oil prices continued to recover in the first half of 2021, rising back to over USD75 per barrel in June for the first time in more than two
years. The increase in the price of crude oil was due to positive expectations surrounding global economic development and rising demand
in major consumer economies such as the US and China, where the coronavirus pandemic has subsided markedly, leading to high demand
for crude oil and fuels. In addition, OPEC+ member states have only upped their production levels marginally since last year’s reduction,
which has reduced global crude oil stocks. Negotiations among OPEC+ member states in early July regarding an increase in oil production
volume initially came to nothing. But later on that month, the countries in question agreed to increase production from August, causing the
oil price to fall below USD70 per barrel. The price of crude oil averaged approximately USD65 per barrel in the first half of 2021, some 55%
higher than the previous-year period.
BayWa Group – Interim Management Report
4 BayWa Group Half-Year Financial Statements 2021
Heating oil prices in Germany have followed a similar trend. After bottoming out at approximately 41euro cents per litre in September 2020,
prices climbed back beyond 68 euro cents per litre by June 2021. The average price of heating oil increased by 15.5% year on year in the
first six months of 2021. Booming business in the previous year and the unfavourable price trend from a consumer perspective in the
reporting period saw sales of heating oil in Germany decline by 52.3% year on year in the period from January to April 2021. Coronavirus-
related restrictions in the first quarter of 2021 dampened demand for fuels and led to a 9.5% decline in sales. By contrast, demand for
lubricants climbed slightly by 2.9%. The average price of wood pellets was 7% lower than the previous-year period, primarily on account of
the fact that log prices remained favourable up to the end of 2020.
Business performance
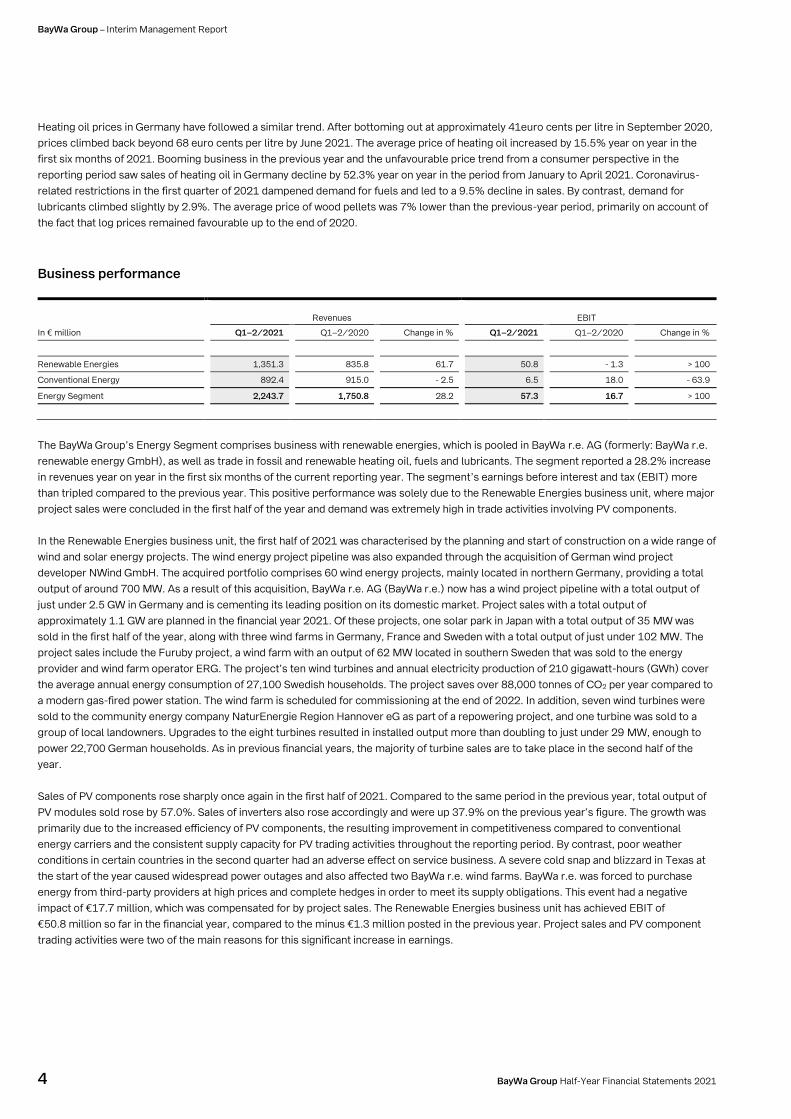
Revenues
EBIT
In € million Q1–2/2021 Q1–2/2020 Change in % Q1–2/2021 Q1–2/2020 Change in %
Renewable Energies 1,351.3 835.8 61.7 50.8 - 1.3 > 100
Conventional Energy 892.4 915.0 - 2.5 6.5 18.0 - 63.9
Energy Segment 2,243.7 1,750.8 28.2 57.3 16.7 > 100
The BayWa Group’s Energy Segment comprises business with renewable energies, which is pooled in BayWa r.e. AG (formerly: BayWa r.e.
renewable energy GmbH), as well as trade in fossil and renewable heating oil, fuels and lubricants. The segment reported a 28.2% increase
in revenues year on year in the first six months of the current reporting year. The segment’s earnings before interest and tax (EBIT) more
than tripled compared to the previous year. This positive performance was solely due to the Renewable Energies business unit, where major
project sales were concluded in the first half of the year and demand was extremely high in trade activities involving PV components.
In the Renewable Energies business unit, the first half of 2021 was characterised by the planning and start of construction on a wide range of
wind and solar energy projects. The wind energy project pipeline was also expanded through the acquisition of German wind project
developer NWind GmbH. The acquired portfolio comprises 60 wind energy projects, mainly located in northern Germany, providing a total
output of around 700 MW. As a result of this acquisition, BayWa r.e. AG (BayWa r.e.) now has a wind project pipeline with a total output of
just under 2.5 GW in Germany and is cementing its leading position on its domestic market. Project sales with a total output of
approximately 1.1 GW are planned in the financial year 2021. Of these projects, one solar park in Japan with a total output of 35 MW was
sold in the first half of the year, along with three wind farms in Germany, France and Sweden with a total output of just under 102 MW. The
project sales include the Furuby project, a wind farm with an output of 62 MW located in southern Sweden that was sold to the energy
provider and wind farm operator ERG. The project’s ten wind turbines and annual electricity production of 210 gigawatt-hours (GWh) cover
the average annual energy consumption of 27,100 Swedish households. The project saves over 88,000 tonnes of CO2 per year compared to
a modern gas-fired power station. The wind farm is scheduled for commissioning at the end of 2022. In addition, seven wind turbines were
sold to the community energy company NaturEnergie Region Hannover eG as part of a repowering project, and one turbine was sold to a
group of local landowners. Upgrades to the eight turbines resulted in installed output more than doubling to just under 29 MW, enough to
power 22,700 German households. As in previous financial years, the majority of turbine sales are to take place in the second half of the
year.
Sales of PV components rose sharply once again in the first half of 2021. Compared to the same period in the previous year, total output of
PV modules sold rose by 57.0%. Sales of inverters also rose accordingly and were up 37.9% on the previous year’s figure. The growth was
primarily due to the increased efficiency of PV components, the resulting improvement in competitiveness compared to conventional
energy carriers and the consistent supply capacity for PV trading activities throughout the reporting period. By contrast, poor weather
conditions in certain countries in the second quarter had an adverse effect on service business. A severe cold snap and blizzard in Texas at
the start of the year caused widespread power outages and also affected two BayWa r.e. wind farms. BayWa r.e. was forced to purchase
energy from third-party providers at high prices and complete hedges in order to meet its supply obligations. This event had a negative
impact of €17.7 million, which was compensated for by project sales. The Renewable Energies business unit has achieved EBIT of
€50.8 million so far in the financial year, compared to the minus €1.3 million posted in the previous year. Project sales and PV component
trading activities were two of the main reasons for this significant increase in earnings.

BayWa Group – Interim Management Report
5 BayWa Group Half-Year Financial Statements 2021
In the Conventional Energy business unit, EBIT was down on the high previous-year figure as at 30 June 2021, as expected. This was due in
particular to the decline of just under 44% in sales of heating oil in the first half of 2021 on account of the sharp rise in oil prices and
additional price increases caused by the introduction of carbon pricing. By contrast, the introduction of carbon pricing also means that solid
fuels such as wood pellets are becoming an increasingly attractive carbon-neutral energy carrier in the heating business. Sales of wood
pellets climbed by some 37%. Capacity expansion at the two pellet plants in Wunsiedel in the previous year also had a positive effect. In the
fuel business, sales volumes were marginally down on the previous year due to the nationwide restrictions to curb the spread of the
coronavirus in the first half of 2021. Sales of lubricants climbed by approximately 13% compared to the previous-year period. In Regensburg
and Karlsruhe, BayWa Mobility Solutions GmbH opened two further liquefied natural gas (LNG) filling stations, expanding its range of CO2-
optimised solutions and taking the total number of LNG filling stations to seven.
Agriculture Segment
Market and industry development According to a forecast by the US Department of Agriculture (USDA), global grain production (excluding rice) is expected to rise by just
under 4% year on year to around 2.29 billion tonnes in grain year 2021/22. Wheat production is set to increase by approximately 2.1%,
while corn production is forecast to increase by around 4.7%, primarily on account of the increase in land available for cultivation in the
Black Sea region and in Europe, particularly France. Due to the increased yield forecast, a slight rise in inventory stocks is expected in grain
year 2021/22 to just under 610 million tonnes (H1/2020: 601 million tonnes). The USDA is forecasting global oilseed harvest volume of
635 million tonnes, which equates to an increase of 5.9% compared to the previous year. The European grain harvest should increase by
roughly 4% year on year to approximately 292 million tonnes, especially as a result of the increase in wheat cultivation in France. Experts
also expect grain harvest to increase in Germany, but extreme weather such as the heatwave in June followed by storm, hail and heavy rain
have impaired the yield potential of some summer cultures. All in all, harvest volume is expected to stand at approximately 43.8 million
tonnes, up some 2% on the previous year. The German Raiffeisen Federation (Deutscher Raiffeisenverband) is forecasting a roughly 5%
year-to-year increase in the rapeseed harvest to around 3.7 million tonnes. Grain prices were significantly higher in the reporting period than
the previous year as a result of a range of factors, particularly robust demand from China and extreme weather events such as heatwaves in
the US and Canada as well as hail and heavy rain in Europe. The average price of wheat was up 16% year on year in the first six months of
2021, while the average prices of corn and rapeseed climbed by 58% and 30% respectively.
In fruit farming, the European apple market continues to be influenced by the previous year’s below-average harvest, which has caused
apple prices to be up on the long-term average in the current marketing season, as expected. In June, apple prices in Germany were just
under 28% higher than the five-year average at €0.78 per kilogramme. Apple stocks in Europe may have been around 25% higher than the
low previous-year figure in June 2021, but they were still down on 2019 levels by approximately 200,000 tonnes. The low stock levels in the
previous year were due to the increased demand for fruit on account of the coronavirus pandemic. No forecasts for the European apple
harvest in 2021 are available to date. Frosty nights at the start of April could have an adverse effect on the fruit harvest in a number of
European countries. In addition, the Bundesfachgruppe Obstbau (German federal expert group on fruit cultivation) believes that this year’s
apple harvest in Germany is likely to be delayed by up to two weeks compared to the five-year average. In New Zealand, the 2021 apple
harvest is significantly down on the previous year after a hail storm at the beginning of the year damaged large swathes of the cultivation
areas. Fruit sizes have also been impacted in New Zealand as a result of the cooler summer. Therefore, compared to normal years, a larger
part of this year’s apple production is expected to be used for processing purposes. Apple exports will also be down this year, as not all fruits
were able to be harvested at export quality due to the hail-related decline in harvest volume and the lack of seasonal workers caused by the
coronavirus pandemic.
In the agricultural input sector, sales of fertilizer declined as a result of political regulation such as the German Fertiliser Application
Ordinance (DüV) in spite of optimum weather conditions. In addition, high fertilizer prices saw farmers exercise restraint in terms of their
purchasing activities and not stock up as much for the new season. As a result, nitrogen fertilizers such as calcium ammonium nitrate (CAN)
were trading at €253 per tonne on average in the first half of 2021, some €60 per tonne higher than in the previous-year period. This price
rise is due to high energy and transport costs, as well as rising producer prices. In addition, potash prices continued to be driven upward by
sanctions against Belarus and a complete EU import ban. Sales of crop protection products were also down due to legal requirements and
restrictions on a growing number of substances, as well as the weather-related delayed and shorter application period in the first half of
2021. Frost had a particularly negative impact on sales of crop protection products, particularly those applied on speciality crops.

BayWa Group – Interim Management Report
6 BayWa Group Half-Year Financial Statements 2021
Sentiment among German farmers has increased marginally compared to spring 2021 due to rising harvest expectations, but remains at a
low level. The agricultural industry’s economic barometer stood at 14.7 points in June 2021, down 1.1 points on the previous year, due
primarily to uncertainty over political and legal frameworks, a lack of planning security and sharp rises in the price of agricultural inputs. That
being said, farmers’ propensity for investment has risen in spite of the uncertainty, partly due to the rise in producer prices. The German
government’s agricultural stimulus package, known as the “Bauernmilliarde” (farmers’ billion), is also likely to provide additional investment
incentives. The number of newly registered tractors in Germany increased noticeably year on year between January and June 2021 by some
15.4% to 17,157 vehicles. In the second half of the year, farmers in Germany plan to increase their investments by €0.4 billion year on year
to €4.3 billion. Investments in farm buildings such as machine halls and stables are expected to rise by a particularly high margin.
Business performance The Agriculture Segment is divided into four business units: Cefetra Group, Global Produce, Agri Trade & Service and Agricultural
Equipment. The Cefetra Group and Agri Trade & Service business units cover international and national trade in agricultural products and
agricultural inputs. Global Produce encompasses global trade with fruit and fruiting vegetables. The Agricultural Equipment business unit
trades in agricultural machinery and plants and offers a wide range of services.
Revenues
EBIT
In € million Q1–2/2021 Q1–2/2020 Change in % Q1–2/2021 Q1–2/2020 Change in %
Cefetra Group (formerly: BAST) 2,562.3 2,238.7 14.5 20.1 8.6 > 100
Global Produce 461.0 451.2 2.2 14.5 18.2 - 20.3
Agri Trade & Service 2,129.0 1,987.0 7.1 39.0 18.9 > 100
Agricultural Equipment 880.8 876.9 0.4 14.7 15.9 - 7.5
Agriculture Segment 6,033.1 5,553.8 8.6 88.3 61.6 43.3
The Agriculture Segment reported a year-on-year rise in revenues in the first half of 2021, mainly as a result of the positive development in
national and international product trading – and particularly the sharp rise in grain prices. Higher fertilizer prices also had a positive effect on
trade margins. The segment’s earnings before interest and tax (EBIT) improved by just under 43.3% in the reporting period.
In the Cefetra Group business unit, grain and oilseed sales volumes were down just under 3% on the previous-year figure in the first half of
2021. However, the reporting period offered improved trade opportunities compared to the previous-year period. Uncertainty on agricultural
commodities markets and low grain availability resulted in significant price volatility in the first half of 2021 and higher prices overall
compared to the previous-year period. The Cefetra Group business unit benefited from these developments, particularly with regard to
standard products. Higher prices were caused in particular by ongoing strong demand from China and poor weather conditions in the US
and Europe. In addition, rising demand for biofuels also boosted the positive price trend, for example in the case of corn. Specialities
business performed well and was able to increase its earnings contribution year on year. By contrast, rising freight rates caused by the
increase in global trading volume coupled with limited transport capacities due to the pandemic proved challenging from a logistics
perspective.
The performance of the Agri Trade & Service business unit improved considerably year on year, with domestic product trading benefiting
from a positive price trend on grain markets. Grain inventories from last year’s harvest were able to be marketed at improved trade margins.
Restructuring in domestic agricultural business also had a positive impact on earnings. There are delays to the current harvest due to the
large number of rainy days. In terms of agricultural input business, fertilizer sales were boosted by optimum weather conditions and
increased prices. The fertilizer stockpiled at lower prices in autumn 2020 was sold at better trade margins in the reporting period and played
a significant role in the positive earnings development. In the crop protection product business, low temperatures and high amounts of
precipitation resulted in a delayed start to the season and meant that not all crop protection measures were able to be taken in the first half
of 2021. The moist, warm climate at the current time should, however, have a positive effect on herbicide sales in the second half of the
year. On the other hand, the extended winter benefited business involving de-icing salt. Seed business also performed well, with sales
increasing year on year and margins benefiting from a good private brand strategy, shifts towards higher-margin product ranges and a broad
portfolio.

BayWa Group – Interim Management Report
7 BayWa Group Half-Year Financial Statements 2021
Marketing volume in the Global Produce business unit was not able to match the high previous-year figure. Sales volumes in both Germany
and BayWa’s international markets fell short of the previous-year period. In Germany, the start of the summer fruit harvest was much later
than usual due to the cool weather in May, which should cause delay effects moving into the second half of the year. In addition, weather
conditions that were unfavourable to some types and batches of fruit impacted quality and reduced harvest volumes. Early cherry varieties,
mirabelles and gooseberries suffered losses in the Lake Constance and Neckar regions due to frosty nights, whereas pome fruit was barely
affected, as blossoming was less advanced at the time of the frost. A normal pome fruit harvest is expected. At the subsidiary TFC Holland
B.V. (TFC), newly installed Softripe chambers for precision ripening of avocados and mangos at the Maasdijk location in the Netherlands
have been in operation since the start of 2021. This technology helps achieve a consistent ripening quality and allows products to be stored
for longer in stores, which is likely to help TFC secure additional competitive advantages. In the New Zealand apple business, hail damage
and the lack of seasonal workers caused by the coronavirus-related travel restrictions resulted in a decline in harvest volume. In addition,
business was additionally negatively impacted by increased costs for hygiene measures and logistical bottlenecks. Local business activities
in New Zealand were also affected by weather-related harvest losses for summer fruit and delays in deliveries on account of the pandemic.
By contrast, positive sales development was recorded in the UK export markets and in Asia.
The Agricultural Equipment business unit reported stable development in the current financial year. However, it has not been able to match
its performance in the previous year, when business boomed as BayWa was able to maintain its supply capabilities while coronavirus-related
closures affected CLAAS and Fendt plants and the rate of VAT was lowered in the second half of 2020. As a result, sales of new machinery
in the first half of 2021 were down by around 14% compared to the previous-year period. Sales of used machines, on the other hand, were
up by around 9% compared to the previous year. Marketing of Massey Ferguson tractors also developed positively. Sales here increased,
going against the general trend on the German market. The unveiling of new Fendt models is expected to have a positive impact on business
performance in the second half of the year. The service business is stable but remains down on the previous year due to bottlenecks in the
supply of spare parts.
Building Materials Segment
Market and industry development After the German construction industry managed to weather the coronavirus crisis better than many other sectors in the previous year, the
beginning of 2021 was rather subdued. Adverse weather conditions and a cold snap in the first quarter led to a slowdown in building activity,
particularly in northern Germany. In addition, anticipatory effects due to the reduced value added tax rate in the second half of 2020 had a
negative impact on revenues for many building companies in the current financial year. The slight recovery in construction activity in April
was not sufficient to compensate for this decline. Revenues in the German construction industry therefore decreased by 5.9% year on year
in nominal terms between January and April 2021. Furthermore, the prices of some building materials – such as wood, steel or insulation
materials – have risen sharply since the beginning of the year. Reasons for this development are a strong increase in demand, particularly
from China and the US, pandemic-related disruptions in supply chains and higher energy and transport costs. This then resulted in supply
bottlenecks for important primary products, which occasionally led to project delays for some companies. During the same period, order
intake for the construction industry was 3.7% higher year on year. That being said, the individual construction sectors saw varied
development. While demand in the residential construction segment increased by 13.4%, public construction saw a slight decline in
demand of 1.2%, mainly due to the coronavirus-related significant drop in construction spending by municipalities, with federal and state
governments not yet having compensated for trade tax losses in 2021. At 125,553 units, the number of residential building permits issued
was up by 13.8% year on year in the first four months of 2021 (2020: 110,368 units). The number of building permits for multi-family units
saw a particularly strong increase. For 2021 as a whole, the Confederation of the German Construction Industry (HDB – Hauptverband der
Deutschen Bauindustrie) forecasts nominal revenues roughly on a par with the previous year. Residential construction is likely to increase
by 3.0%, whereas commercial and public sector construction is expected to decline.

BayWa Group – Interim Management Report
8 BayWa Group Half-Year Financial Statements 2021
Business performance
Revenues
EBIT
In € million Q1–2/2021 Q1–2/2020 Change in % Q1–2/2021 Q1–2/2020 Change in %
Building Materials Segment 994.6 876.8 13.4 33.6 17.2 95.3
The Building Materials Segment mainly comprises Group trading activities involving building materials in Germany and Austria. In the
reporting period, both good capacity utilisation in the industry and sustained high demand for housing, as well as the rather mild spring in
BayWa’s core regions, led to a rise in sales across the whole range of products. The building construction, civil engineering and roofing
segments in particular posted strong growth. In addition, the business unit is likely to have benefited from the fact that, as a key part of the
economy, the building materials locations in Germany remained unaffected by the temporary closures to stop the spread of the coronavirus
in the first half of 2021. BayWa Bau Projekt GmbH was also able to make a positive contribution to business development, with the
remaining residential units from the Seeon-Ost project being sold, among other things. In addition, the high demand in the building materials
trade in Austria had a positive effect on revenues and earnings. Against this backdrop, revenues increased in the first six months of the
current financial year compared to the same period of last year. The dynamic development of building materials prices also continued in the
second quarter of 2021, with low availability giving the trend additional momentum. Thanks to its inventories as well as its established and
stable network of suppliers, BayWa’s Building Materials Segment was able to deliver products almost without interruption and successfully
generated higher trade margins in the process. Earnings before interest and tax (EBIT) almost doubled compared to the previous year.
Innovation & Digitalisation Segment
Market and industry development Digital applications are now an integral part of agriculture, as they provide support for daily work processes, not to mention operational
planning and management. According to a 2020 study on behalf of the digital association Bitkom, the German Farmers’ Association
(Deutscher Bauernverband – DBV) and Landwirtschaftliche Rentenbank (Germany’s development agency for agribusiness and rural areas),
some 82% of German farmers are already using digital technologies or applications. A further 10% of the farmers are discussing their
implementation or already have set plans for the implementation of digital applications on their farms. Digitalisation in the farming industry
largely comprises precision farming and smart farming. While precision farming focuses on the automation of agricultural processes, smart
farming goes one step further with the aim of digitally connecting all aspects of farming operations, from the barn and field work to harvest
marketing. Here, machines and systems often process information independently and make decisions with at least some degree of
autonomy. Satellites increasingly play a role as sources of data. The combination of satellite data with plant growth models makes it
possible to determine the yield potential of every field, estimate the economic benefits of working specific parts of fields and coming up with
concrete recommendations for field operations. If this information is linked with the technology in the tractor and attached implement by
way of relevant control software, farmers have the possibility of sowing or fertilizing specific parts of fields, for example. Greater use is being
made of farm management systems to connect all these work steps, which not only make administrative tasks easier for farmers but also
provide opportunities for analysis. Given the tougher requirements regarding documentation obligations and data protection as a result of
new laws, such as the European General Data Protection Regulation, experts expect to see double-digit percentage growth rates in the
years ahead, particularly for software solutions concerning these issues.
BayWa Group – Interim Management Report
9 BayWa Group Half-Year Financial Statements 2021
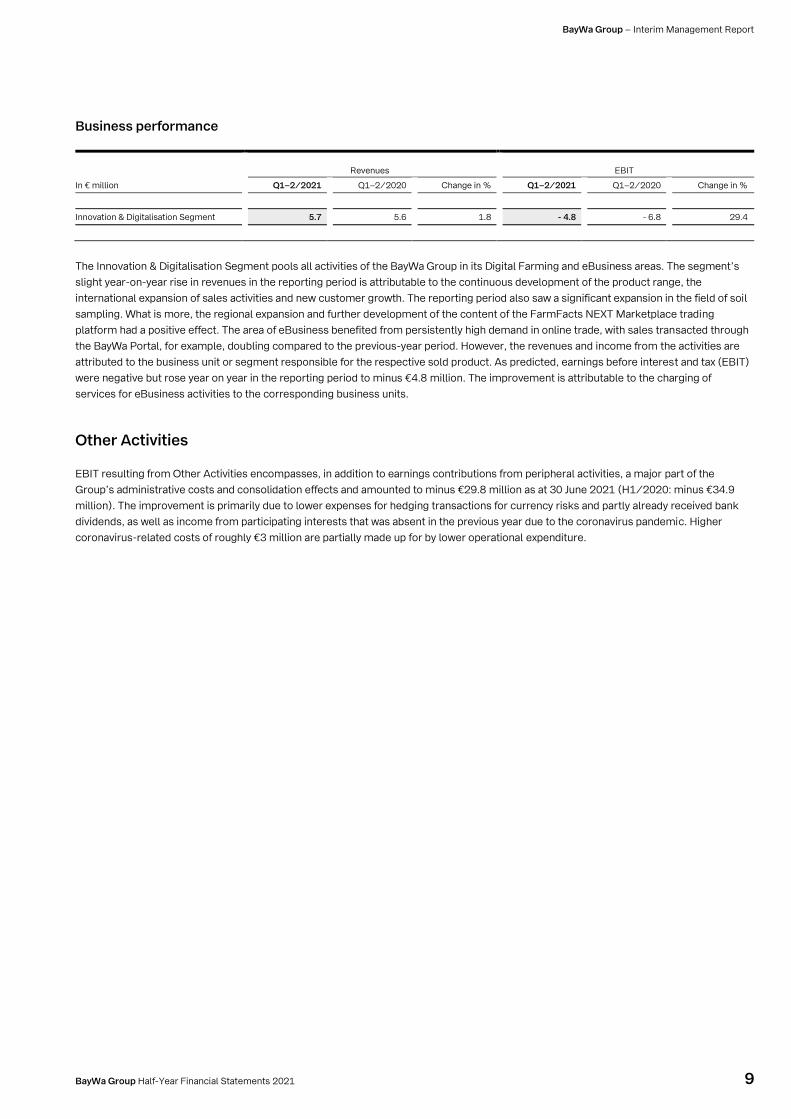
Business performance
Revenues
EBIT
In € million Q1–2/2021 Q1–2/2020 Change in % Q1–2/2021 Q1–2/2020 Change in %
Innovation & Digitalisation Segment 5.7 5.6 1.8 - 4.8 - 6.8 29.4
The Innovation & Digitalisation Segment pools all activities of the BayWa Group in its Digital Farming and eBusiness areas. The segment’s
slight year-on-year rise in revenues in the reporting period is attributable to the continuous development of the product range, the
international expansion of sales activities and new customer growth. The reporting period also saw a significant expansion in the field of soil
sampling. What is more, the regional expansion and further development of the content of the FarmFacts NEXT Marketplace trading
platform had a positive effect. The area of eBusiness benefited from persistently high demand in online trade, with sales transacted through
the BayWa Portal, for example, doubling compared to the previous-year period. However, the revenues and income from the activities are
attributed to the business unit or segment responsible for the respective sold product. As predicted, earnings before interest and tax (EBIT)
were negative but rose year on year in the reporting period to minus €4.8 million. The improvement is attributable to the charging of
services for eBusiness activities to the corresponding business units.
Other Activities
EBIT resulting from Other Activities encompasses, in addition to earnings contributions from peripheral activities, a major part of the
Group’s administrative costs and consolidation effects and amounted to minus €29.8 million as at 30 June 2021 (H1/2020: minus €34.9
million). The improvement is primarily due to lower expenses for hedging transactions for currency risks and partly already received bank
dividends, as well as income from participating interests that was absent in the previous year due to the coronavirus pandemic. Higher
coronavirus-related costs of roughly €3 million are partially made up for by lower operational expenditure.

BayWa Group – Interim Management Report
10 BayWa Group Half-Year Financial Statements 2021
Assets, Financial Position and Earnings Position of the BayWa Group
Asset position as at 30 June 2021
At the end of the first half of 2021, the BayWa Group had total assets of €10,067.2 million, corresponding to an increase compared to the
end of the financial year 2020 (€9,044.4 million). Non-current assets increased by €70.0 million since the start of the year and stood at
€3,777.6 million as at 30 June 2021. This development was due mainly to the increase in property, plant and equipment (plus €31.0 million)
and investments (plus €23.1 million). In addition, there was slight growth in intangible assets (plus €7.6 million) as well as in receivables and
other assets (plus €7.4 million), which was offset by the decline in participating interests recognised at equity (minus €4.3 million) and
investment property (minus €8.6 million). The BayWa Group’s current assets stood at €6,279.8 million as at 30 June 2021, representing a
significant increase on the value at the end of the financial year 2020 (€5,331.7 million). This development was due mainly to the typical
seasonal rise in trade receivables by €446.3 million to €1,446.2 million, as well as the €356.9 million increase in unfinished goods to
€1,323.5 million (H1/2020: €966.6 million).
In the first half of 2021, equity rose by €616.3 million compared to the end of the financial year 2020, or 49.1%, to €1,872.4 million. The rise
was primarily attributable to the capital increase at BayWa r.e. AG (BayWa r.e.), Munich, Germany. By way of an equity contribution of
€530 million, funds advised by Energy Infrastructure Partners AG (EIP) took over 49% of the shares in BayWa r.e. The positive consolidated
net result, as well as the actuarial gains from provisions for pensions and severance pay in the first two quarters of 2021, also contributed to
the development.
Non-current liabilities amounted to €3,140.1 million as at the end of the first half of 2021 and were therefore virtually on a par with the
comparable value as at the end of the financial year 2020 (€3,036.0 million). While finance lease obligations (plus €60.9 million) and debt
(plus €58.0 million) increased slightly, obligations from pension provisions fell by €51.7 million to €717.8 million.
Current liabilities increased by €302.4 million to €5,054.7 million compared to the end of the financial year 2020 (€4,752.3 million) due to
contrasting developments. While short-term debt decreased by €142.3 million to €2,074.8 million in the first half of 2021, trade payables
increased by €496.6 million to €1,460.8 million due to seasonal factors.
Financial position in the first half of 2021
Based on a €66.8 million net result for the period, cash earnings rose year on year by €75.5 million to €222.7 million. The rise in inventory
levels, trade receivables and other assets not allocable to investment and financing activities resulted in cash outflows of €694.9 million in
the first half of 2021. This was only partially compensated for by the increase in trade payables and other liabilities not allocable to investing
and financing activities amounting to €278.0 million. The cash flow from operating activities therefore stood at minus €176.1 million after
the first six months of the financial year 2021. Cash outflow from operating activities in the current reporting period was therefore
€408.4 million higher year on year.
The BayWa Group’s investment activity resulted in cash outflows of €80.5 million in the first six months of the financial year 2021. In
particular, funds of €96.8 million were used for the acquisition of intangible assets and property, plant and equipment. By contrast, cash
inflows of €29.6 million resulted from the disposal of intangible assets and property, plant and equipment. The disposal of financial assets
resulted in cash inflows of €1.1 million in the first half of the year, whereas the addition of financial investments led to cash outflows of
€11.7 million.
Cash flows from financing activities amounted to €284.2 million. The participation of the Swiss investor EIP in BayWa r.e. saw a capital
increase of €530.0 million. Opposing cash outflows are primarily due to the repayment of short-term debt. In 2020, cash flow from financing
activities stood at minus €219.3 million.
Total cash and cash equivalents have increased by €27.6 million since 31 December 2020 to €196.3 million due to the incoming and
outgoing cash payments from operating, investment and financing activities.

BayWa Group – Interim Management Report
11 BayWa Group Half-Year Financial Statements 2021
Earnings position in the first half of 2021
The BayWa Group’s revenues in the first half of the financial year 2021 came to €9,283.4 million, marking a year-on-year increase of
€1,089.7 million. The Energy Segment saw the biggest gains of €492.9 million. This increase is due to two opposing developments: The
€22.6 million decline in revenues in the Conventional Energy business unit to €892.4 million was more than compensated for by the €515.5
million growth in revenues in the Renewable Energies business unit to €1,351.3 million. The Agriculture Segment also achieved an increase
in revenues of €479.3 million to €6,033.1 million in the first half of 2021. This development is attributable to the growth in revenues in the
four business units Cefetra Group (plus €323.6 million), Agri Trade & Service (plus €142.0 million), Global Produce (plus €9.8 million) and
Agricultural Equipment (plus €3.9 million). The Building Materials Segment was also able to increase revenues by €117.8 million to €994.6
million. Revenues in the Innovation & Digitalisation Segment (€5.7 million) and in Other Activities (€6.3 million) were on a par with the
previous year.
The BayWa Group’s other operating income amounted to €158.3 million, up on the previous year’s figure of €139.4 million. This increase
was primarily due to the execution of foreign currency transactions. Taking into account a change in inventories of €149.7 million and a
slight rise in other own work capitalised of €8.1 million, the overall performance of BayWa Group climbed by €789.9 million to €9,599.5
million in the first half of 2021.
Despite an increase in the cost of materials of €585.9 million, gross profit for the BayWa Group improved by €204.0 million to
€1,232.8 million. Personnel expenses climbed by €52.4 million to €614.6 million in the first half of 2021. This rise is primarily the result of
the increase in employee numbers in the Renewable Energies business unit. At €118.3 million, depreciation and amortisation of property,
plant and equipment and intangible assets were up by €11.7 million year on year. Other operating expenses increased by €40.1 million in the
first half of 2021 to stand at €349.4 million. In particular, the execution of foreign currency transactions – along with legal, consulting and
auditing fees – contributed to the rise in other operating expenses.
These changes raised the result of operating activities by €99.8 million to €150.5 million in the first half of 2021.
At minus €5.9 million, the result of participating interests was down year on year by €9.0 million. This development is attributable to the
reduction in the result from participating interests measured at equity by €6.6 million to minus €8.5 million, as well as the €2.4 million drop
in other income from participating interests to €2.6 million.
The BayWa Group’s EBIT stood at €144.6 million in the first six months of the financial year 2021 and was therefore up by a significant
€90.8 million year on year.
Net interest in the first half of 2021 improved by €2.6 million to minus €50.6 million. Including tax expenses of €27.2 million, this resulted in
net income for the first half of the financial year 2021 of €66.8 million, which is significantly higher than in the same period of the previous
year (€0.4 million).
Employees
The BayWa Group recorded an increase in the number of employees in nearly all business units in the first half of 2021. As at the reporting
date, the number of employees had increased by 894 people to 20,801. This growth is mainly due to the increase in employee numbers in
the Renewable Energies business unit by 500 to 2,674.

BayWa Group – Interim Management Report
12 BayWa Group Half-Year Financial Statements 2021
Outlook
The BayWa Group developed very positively in the first half of 2021, despite the ongoing coronavirus pandemic. The Board of Management
is taking this positive business development as an opportunity to raise its year-on-year forecast for the increase earnings before interest and
tax (EBIT) for 2021 as a whole from “moderate” (1% to 5%) to “significant” (10% to 20%).
The BayWa Group’s operations are likely to continue developing very positively in the second half of 2021, in particular due to the upcoming
project sales in the Renewable Energies business unit. The Agriculture Segment should benefit from the currently low grain inventories and
continued high demand for grain from China. In addition, farmers’ propensity to invest should improve on account of the good producer
prices and the stimulus package, known as the “Bauernmilliarde” (farmers’ billion). The Building Materials Segment is expected to see
continued improvement in the second half of 2021 as is typical of the season. Investments in owner-occupied homes remain an attractive
alternative due to coronavirus-related effects and the increasing risk of inflation. A worsening of the coronavirus crisis or a fourth wave of the
pandemic could negatively impact the business development of the BayWa Group. Thanks to the high share of essential activities, however,
the BayWa Group has proven itself to be very resistant to the crisis, as demonstrated in the first half of the year.
The Energy Segment is poised for a significant increase in earnings in the second half of the year. The Renewable Energies business unit in
particular is expected to contribute to this development, as global sales of projects with a total output of up to 1.1 gigawatts (GW) have been
planned for the year as a whole. For most of the wind farms and solar parks intended for disposal, the sales process should be completed in
the fourth quarter of 2021. The core regions in which the majority of projects are built or sold are in Europe. Spain, in particular, has a
number of large-scale solar energy projects for sale, including the Illora solar park with nearly 150 megawatts (MW) on approximately 164
hectares. This solar park will provide the European AB InBev breweries with around 250 gigawatt-hours (GWh) of green power per year.
Furthermore, several projects in the Netherlands which were acquired by the GroenLeven Group are nearing completion. Sales from trading
in photovoltaic (PV) components in the second half of the year should also be able to match the strong development seen in the first six
months of the current financial year.
In the Conventional Energy business unit, the growth momentum in the wood pellets trade is likely to weaken in the second half of 2021 due
to bottlenecks. In addition, the price of wood pellets is expected to rise, which should lead to a reduction in the willingness to buy. The
development of crude oil prices will likely continue to dampen the demand for heating oil. The easing of measures against the coronavirus
and the associated normalisation of transport and travel activities, should help to raise demand for fuels in the second half of the year.
Growth is also expected in sales of liquefied natural gas (LNG), as the network of filling stations will be expanded from seven to twelve filling
stations before the current financial year is over. Overall, EBIT in the Conventional Energy business unit is not expected to reach the high
level of the previous year. However, this decline will be more than compensated for by the improvement in earnings in the Renewable
Energies business unit.
Trading opportunities in international trade involving grain and oilseed were characterised in the first half of 2021 by rising prices on the
markets. Increased uncertainties regarding the new harvest due to the heatwave in North America and torrential rainfall in Europe give little
cause to assume there will be falling producer prices. In addition, demand from China is likely to remain high. Furthermore, the speciality
business should also develop positively. Against this backdrop, the Cefetra Group business unit is expected to exceed the previous year’s
result.
In Germany, the outlook for the grain harvest has improved slightly compared to the previous year, though weather conditions are leading to
a delayed harvest. The German Raiffeisen Federation (Deutscher Raiffeisenverband) forecasts a harvest of 43.8 million tonnes,
corresponding to a rise of around 2% year on year. Harvest volume for rapeseed is even expected to see a year-on-year increase of 5%.
However, there are increasing concerns regarding quality due to humid and muggy weather, as well as the impairment of the plant growth
on account of hail damage. As a result, regional differences in quality are to be expected that could be advantageous for the Agri Trade &
Service business unit’s domestic products trading activities.
Furthermore, demand for crop protection – particularly herbicides – should increase due to the weather conditions. Hail damage also led to
the need for additional corn sowing, presenting potential for benefit for the agricultural input business. These factors are likely to have a
positive effect on business development in the Agri Trade & Service business unit on the whole. By contrast, early storage of fertilizers by
farmers is not to be expected, as fertilizer prices should remain high due to import restrictions on potash fertilizer from Belarus and high
energy costs. The Agri Trade & Service business unit should be able to maintain or even further expand its year-on-year earnings by the end
of the financial year.
The European harvest for summer fruits and pome fruits has also been delayed due to unfavourable weather conditions. In terms of
earnings, this will result in a shift in business into the second half of the year. The pome fruit harvest volume is expected to be average in
BayWa Group – Interim Management Report
13 BayWa Group Half-Year Financial Statements 2021
Germany. Summer fruits such as cherries, mirabelles and gooseberries suffered frost-related losses. This, coupled with above-average
prices, should result in good marketing opportunities for traders. The earnings contribution from international activities is likely to remain on
a par with the previous year’s level, as the harvest volume is lower due to hail damage and the lack of seasonal workers. However, this
volume effect is expected to be largely compensated through price developments and cost savings.
The Agricultural Equipment business unit is expected to develop positively in the second half of the year. This optimism is based on a higher
year-on-year level of incoming orders on the books after the first six months. In addition, new agricultural product campaigns at
AGCO/Fendt could provide additional incentives to buy. The stable producer and milk prices, the positive harvest forecasts and the
stimulus package known as the “Bauernmilliarde” (farmers’ billion) should favour investment projects.
The Building Materials Segment is expected to improve considerably in the second half of 2021 as is typical of the season. High order
backlog at the sector companies executing the orders and the ongoing construction boom point to strong demand for building materials.
The construction projects in Schrobenhausen and Borna, near Leipzig, are expected to provide additional earnings contributions. The
Building Materials Segment is able to offset supply bottlenecks and rising prices through efficient logistics structures. Against this
backdrop, the Building Materials Segment is expected to achieve a significant year-on-year increase in earnings.
The activities in the Innovation & Digitalisation Segment are mainly based on investments and development costs for future digital product
and service offerings. As a result, and as planned, a negative EBIT – which will likely be slightly above the previous year’s level – is expected.
For the Other Activities, positive and negative effects can be expected. Bank dividends should have a positive impact on earnings in the
reporting year. Because the further development of the coronavirus pandemic remains difficult to predict, additional expenses for the
occupational health and safety of the BayWa workforce cannot be ruled out. Such expenses would accordingly have a negative impact on
earnings in Other Activities.
Based on the segments’ operating earnings in the first half of 2021, the Board of Management has raised its forecast increase in the BayWa
Group’s full-year operating result for 2021 from “moderate” (1% to 5%) to “significant” (10% to 20%).
Please note: The statements and figures forecast in this document are based on assumptions and are subject to unforeseeable risk. In as much as the assumptions of the company should
prove to be inaccurate, or should other unforeseeable risks occur, the possibility of the actual assets, financial position and earnings position of the Group diverging negatively from the
forecast target figures cited in this report should not be discounted.

BayWa Group – Consolidated Balance Sheet
14 BayWa Group Half-Year Financial Statements 2021
Condensed Interim Consolidated Financial Statements of BayWa AG as at 30 June 2021
Consolidated Balance Sheet
Assets
In € million
30/06/2021
31/12/2020
Non-current assets
Intangible assets 444.3 436.7
Property, plant and equipment 2,499.5 2,468.5
Participating interests recognised at equity 240.0 244.3
Investments 217.1 194.0
Investment property 42.4 51.0
Income tax assets 0.0 0.0
Other receivables and other assets 35.4 28.0
Deferred tax assets 298.9 285.1
3,777.6 3,707.6
Current assets
Securities 1.2 1.2
Inventories 3,297.5 2,939.2
Biological assets 5.6 12.8
Income tax assets 56.4 58.4
Other current financial assets 434.5 496.0
Other receivables and other assets 2,288.3 1,655.7
Cash and cash equivalents 196.3 168.4
6,279.8 5,331.7
Non-current assets held for sale/disposal groups 9.8 5.1
Total assets
10,067.2 9,044.4

BayWa Group – Consolidated Balance Sheet
15 BayWa Group Half-Year Financial Statements 2021
Shareholders’ equity and liabilities
In € million
30/06/2021
31/12/2020
Equity
Subscribed capital 90.6 90.6
Capital reserve 121.7 121.7
Hybrid capital 296.3 296.3
Revenue reserves 585.6 369.3
Other reserves 21.6 50.5
Equity net of minority interest 1,115.8 928.4
Minority interest 756.6 327.7
1,872.4 1,256.1
Non-current liabilities
Pension provisions 717.8 769.5
Other non-current provisions 70.6 69.5
Long-term debt 1,172.2 1,114.2
Financial lease obligations 822.7 761.8
Trade payables and liabilities from inter-group business relationships 7.3 7.4
Income tax liabilities 0.0 0.1
Financial liabilities 28.4 17.2
Other liabilities 84.3 88.6
Deferred tax liabilities 236.8 207.7
3,140.1 3,036.0
Current liabilities
Pension provisions 29.7 31.4
Other current provisions 319.3 300.0
Short-term debt 2,074.8 2,217.1
Financial lease obligations 73.1 72.3
Trade payables and liabilities from inter-group business relationships 1,460.8 964.4
Income tax liabilities 37.2 38.1
Financial liabilities 379.1 507.3
Other liabilities 680.7 621.7
5,054.7 4,752.3
Liabilities from non-current assets held for sale/disposal groups – –
Total shareholders’ equity and liabilities 10,067.2 9,044.4

BayWa Group – Consolidated Income Statement
16 BayWa Group Half-Year Financial Statements 2021
Consolidated Income Statement
Continued operations
In € million
Q1–2/2021
Q1–2/2020
Revenues 9,283.4 8,193.7
Inventory changes 149.7 469.1
Other own work capitalised 8.1 7.4
Other operating income 158.3 139.4
Cost of materials - 8,366.7 - 7,780.8
Gross profit 1,232.8 1,028.8
Personnel expenses - 614.6 - 562.2
Depreciation/amortisation - 118.3 - 106.6
Other operating expenses - 349.4 - 309.3
Result of operating activities 150.5 50.7
Income from participating interests recognised at equity - 8.5 - 1.9
Other income from shareholdings 2.6 5.0
Interest income 6.8 5.3
Interest expenses - 57.4 - 58.5
Financial result - 56.5 - 50.1
Earnings before tax (EBT) 94.0 0.6
Income tax - 27.2 - 0.2
Consolidated net result for the period 66.8 0.4
thereof: profit share of minority interest 25.2 13.0
thereof: due to shareholders of the parent company 41.5 - 12.6
EBIT 144.6 53.8
EBITDA 262.9 160.4
Basic earnings per share (in €) 1.00 - 0.54
Diluted earnings per share (in €) 1.00 - 0.54

BayWa Group – Consolidated Income Statement by Quarter
17 BayWa Group Half-Year Financial Statements 2021
Consolidated Income Statement by Quarter
Continued operations
In € million
Q1/2021
Q2/2021
Q1/2020
Q2/2020
Revenues 4,272.1 5,011.3 3,870.1 4,323.6
Inventory changes 126.3 23.4 225.3 243.8
Other own work capitalised 3.5 4.6 2.6 4.8
Other operating income 75.0 83.3 118.7 20.7
Cost of Materials - 3,919.2 - 4,447.5 - 3,734.3 - 4,046.5
Gross profit 557.7 675.1 482.4 546.4
Personnel expenses - 295.5 - 319.1 - 271.5 - 290.7
Depreciation/amortisation - 57.9 - 60.4 - 52.9 - 53.7
Other operating expenses - 156.6 - 192.8 - 185.7 - 123.6
Result of operating activities 47.7 102.8 - 27.6 78.3
Income from participating interests recognised at equity - 2.8 - 5.7 - 1.4 - 0.5
Other income from shareholdings 0.2 2.4 1.2 3.8
Interest income 5.3 1.5 2.6 2.7
Interest expenses - 29.5 - 27.9 - 27.3 - 31.2
Financial result - 26.8 - 29.7 - 24.9 - 25.2
Earnings before tax (EBT) 20.9 73.1 - 52.5 53.1
Income tax - 6.2 - 21.0 13.0 - 13.2
Consolidated net result/loss for the period 14.7 52.1 - 39.5 39.9
thereof: profit share of minority interest 4.7 20.5 0.1 12.9
thereof: due to shareholders of the parent company 10.0 31.5 - 39.6 27.0
EBIT 45.1 99.5 - 27.8 81.6
EBITDA 103.0 159.9 25.1 135.3
BayWa Group – Consolidated Statement of Comprehensive Income – Transition
18 BayWa Group Half-Year Financial Statements 2021
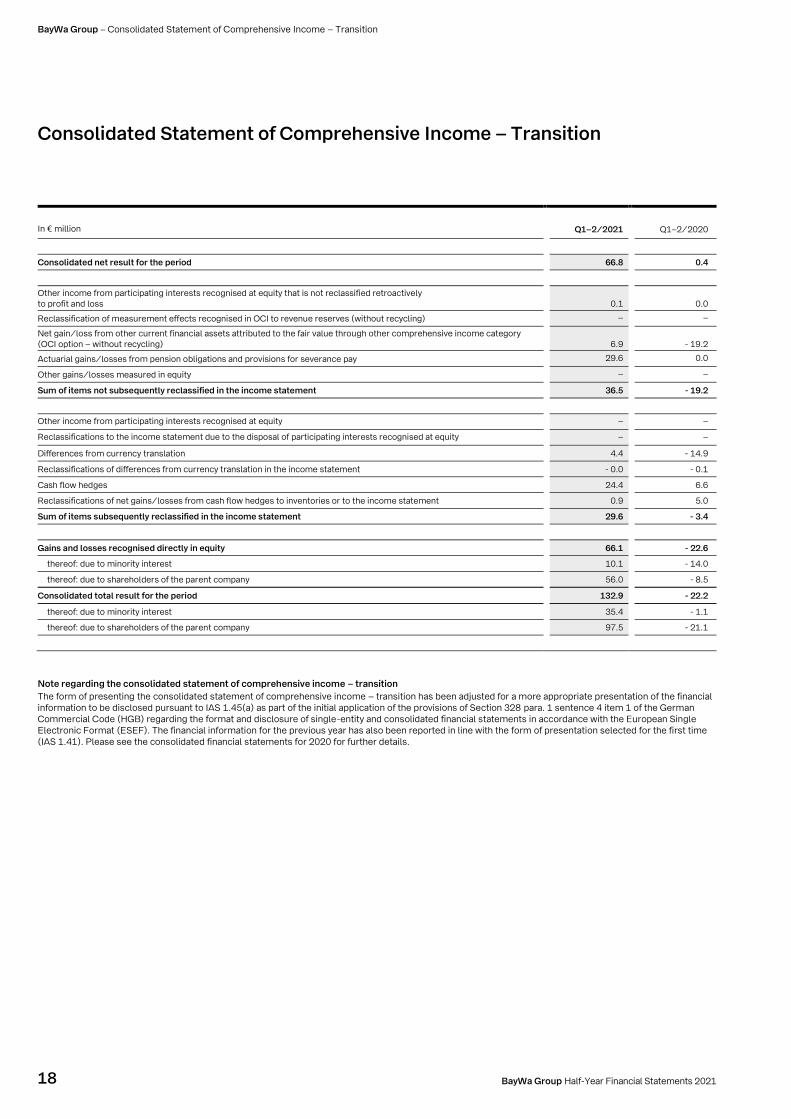
Consolidated Statement of Comprehensive Income – Transition
In € million
Q1–2/2021
Q1–2/2020
Consolidated net result for the period 66.8 0.4
Other income from participating interests recognised at equity that is not reclassified retroactively to profit and loss
0.1
0.0
Reclassification of measurement effects recognised in OCI to revenue reserves (without recycling) – –
Net gain/loss from other current financial assets attributed to the fair value through other comprehensive income category (OCI option – without recycling)
6.9
- 19.2
Actuarial gains/losses from pension obligations and provisions for severance pay 29.6 0.0
Other gains/losses measured in equity – –
Sum of items not subsequently reclassified in the income statement 36.5 - 19.2
Other income from participating interests recognised at equity – –
Reclassifications to the income statement due to the disposal of participating interests recognised at equity – –
Differences from currency translation 4.4 - 14.9
Reclassifications of differences from currency translation in the income statement - 0.0 - 0.1
Cash flow hedges 24.4 6.6
Reclassifications of net gains/losses from cash flow hedges to inventories or to the income statement 0.9 5.0
Sum of items subsequently reclassified in the income statement 29.6 - 3.4
Gains and losses recognised directly in equity 66.1 - 22.6
thereof: due to minority interest 10.1 - 14.0
thereof: due to shareholders of the parent company 56.0 - 8.5
Consolidated total result for the period 132.9 - 22.2
thereof: due to minority interest 35.4 - 1.1
thereof: due to shareholders of the parent company 97.5 - 21.1
Note regarding the consolidated statement of comprehensive income – transition
The form of presenting the consolidated statement of comprehensive income – transition has been adjusted for a more appropriate presentation of the financial information to be disclosed pursuant to IAS 1.45(a) as part of the initial application of the provisions of Section 328 para. 1 sentence 4 item 1 of the German Commercial Code (HGB) regarding the format and disclosure of single-entity and consolidated financial statements in accordance with the European Single Electronic Format (ESEF). The financial information for the previous year has also been reported in line with the form of presentation selected for the first time (IAS 1.41). Please see the consolidated financial statements for 2020 for further details.

BayWa Group – Condensed Consolidated Cash Flow Statement
19 BayWa Group Half-Year Financial Statements 2021
Condensed Consolidated Cash Flow Statement
In € million
Q1–2/2021
Q1–2/2020
Cash earnings 222.7 147.2
Cash flow from operating activities - 176.1 232.3
Cash flow from investment activities - 80.5 - 81.3
Cash flow from financing activities 284.2 - 219.3
Payment-related changes in cash and cash equivalents 27.6 - 68.3
Cash and cash equivalents at the start of the period 168.4 229.7
Inflow/outflow of funds due to changes in the group of consolidated companies and in exchange rates 0.3 - 2.0
Cash and cash equivalents at the end of the period 196.3 159.5
BayWa Group – Condensed Consolidated Statement of Changes in Equity
20 BayWa Group Half-Year Financial Statements 2021
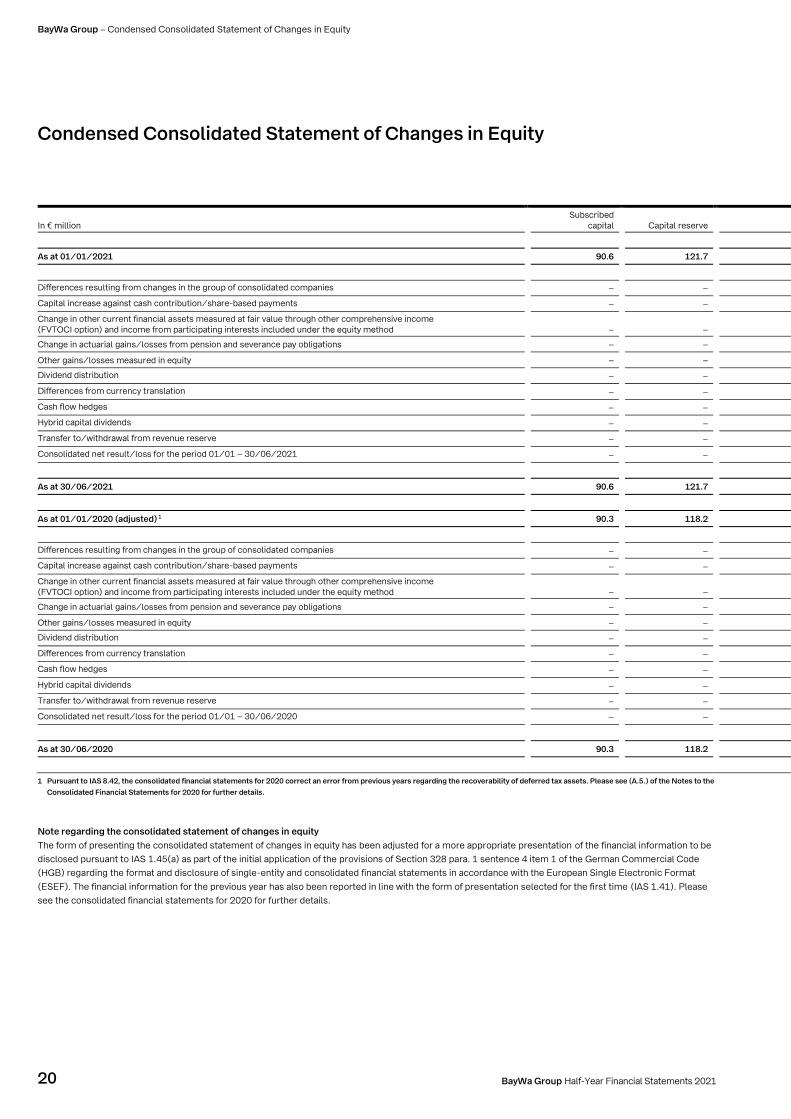
Condensed Consolidated Statement of Changes in Equity
In € million
Subscribed capital
Capital reserve
As at 01/01/2021 90.6 121.7
Differences resulting from changes in the group of consolidated companies – –
Capital increase against cash contribution/share-based payments – –
Change in other current financial assets measured at fair value through other comprehensive income (FVTOCI option) and income from participating interests included under the equity method
–
–
Change in actuarial gains/losses from pension and severance pay obligations – –
Other gains/losses measured in equity – –
Dividend distribution – –
Differences from currency translation – –
Cash flow hedges – –
Hybrid capital dividends – –
Transfer to/withdrawal from revenue reserve – –
Consolidated net result/loss for the period 01/01 – 30/06/2021 – –
As at 30/06/2021 90.6 121.7
As at 01/01/2020 (adjusted) 1 90.3 118.2
Differences resulting from changes in the group of consolidated companies – –
Capital increase against cash contribution/share-based payments – –
Change in other current financial assets measured at fair value through other comprehensive income (FVTOCI option) and income from participating interests included under the equity method
–
–
Change in actuarial gains/losses from pension and severance pay obligations – –
Other gains/losses measured in equity – –
Dividend distribution – –
Differences from currency translation – –
Cash flow hedges – –
Hybrid capital dividends – –
Transfer to/withdrawal from revenue reserve – –
Consolidated net result/loss for the period 01/01 – 30/06/2020 – –
As at 30/06/2020 90.3 118.2
1 Pursuant to IAS 8.42, the consolidated financial statements for 2020 correct an error from previous years regarding the recoverability of deferred tax assets. Please see (A.5.) of the Notes to the
Consolidated Financial Statements for 2020 for further details.
Note regarding the consolidated statement of changes in equity
The form of presenting the consolidated statement of changes in equity has been adjusted for a more appropriate presentation of the financial information to be
disclosed pursuant to IAS 1.45(a) as part of the initial application of the provisions of Section 328 para. 1 sentence 4 item 1 of the German Commercial Code
(HGB) regarding the format and disclosure of single-entity and consolidated financial statements in accordance with the European Single Electronic Format
(ESEF). The financial information for the previous year has also been reported in line with the form of presentation selected for the first time (IAS 1.41). Please
see the consolidated financial statements for 2020 for further details.

BayWa Group – Condensed Consolidated Statement of Changes in Equity
21 BayWa Group Half-Year Financial Statements 2021
Hybrid capital
Valuation reserve
Other revenue reserves
Other reserves
Equity net of minority interest
Minority interest
Equity
296.3 17.9 351.5 50.5 928.4 327.7 1,256.1
– - 3.2 138.3 - 9.9 125.2 400.7 525.8
– – – – – – –
–
3.3
0.0
–
3.4
3.5
6.9
– – 29.6 – 29.6 – 29.6
– – – – – – –
– – – - 35.3 - 35.3 - 7.1 - 42.4
– – – 3.0 3.0 1.3 4.3
– 20.0 – – 20.0 5.3 25.3
– – – – – – –
– – 28.2 - 28.2 0.0 0.0 0.0
– – – 41.5 41.5 25.2 66.8
296.3 38.0 547.6 21.6 1,115.8 756.6 1,872.4
296.3 18.6 429.7 51.1 1,004.2 334.8 1,339.0
– – - 10.0 - 2.4 - 12.4 - 6.1 - 18.5
– – – – – 0.0 0.0
–
- 9.3
- 0.0
–
- 9.3
- 9.9
- 19.2
– – – – – – –
– – – – – – –
– – – – – - 5.3 - 5.3
– – – - 11.4 - 11.4 - 3.6 - 15.0
– 12.1 – – 12.1 - 0.5 11.6
– – – – – – –
– – 3.1 - 3.1 0.0 0.0 0.0
– – – - 12.6 - 12.6 13.0 0.4
296.3 21.4 422.8 21.6 970.6 322.4 1,293.0

BayWa Group – Selected Explanatory Notes to the Consolidated Financial Statements
22 BayWa Group Half-Year Financial Statements 2021
Selected Explanatory Notes to the Consolidated Financial Statements
Accounting policies and valuation methods
This Interim Report of the BayWa Group as at 30 June 2021 was drawn up in compliance with the International Financial Reporting
Standards (IFRS) as applicable within the European Union. In accordance with IAS 34, the interim consolidated financial statements are
published in a condensed form compared to the annual consolidated financial statements and are therefore to be read together with the
BayWa AG Consolidated Financial Statements for the financial year 2020. All new or amended IFRS and interpretations by the IFRS
Interpretations Committee that were applicable for the BayWa Group for the first time as at 1 January 2021 were observed. For pre-existing
or unamended IFRS, the accounting, measurement, consolidation and disclosure principles, with the exception of the changes listed below,
comply with those that were applied when preparing the consolidated financial statements as at 31 December 2020. In this regard,
reference is made to the consolidated financial statements of BayWa AG as at 31 December 2020. BayWa AG’s reporting currency is the
euro.
Changes to IFRS 9/IAS 39/IFRS 7 and IFRS 16 in connection with the reform of interest rate benchmarks have been applicable since the
start of the financial year 2021. These have not had any significant negative effects on the BayWa Group.
Assumptions and estimates
In as much as assumptions and estimates were made in the context of reporting, they have remained unchanged as to the methodology
used during the financial year and between financial years. There are no reportable changes which have had a material impact on the current
reporting period.
Seasonal and economic influences on business activity
Seasonal influences typical to the business have an impact on almost all the core activities of the Group. Over the year, these lead to
fluctuations in revenues and profit which partly offset one another. In the Agriculture Segment, the main activities take place in the first
three quarters of the financial year, with the focus on the second quarter. The Conventional Energy business unit is impacted more by
economic influences which cause fluctuations in business. The price trend exerts a major impact on consumer behaviour and therefore on
the development of the business unit’s revenues. Backlogs in demand subsequently even out over a number of years. The Renewable
Energies business unit is subject to fluctuations depending on project sales. Business development may also be impacted by political
factors as a result of changes in promotion measures. In the Building Materials Segment, business picks up after the first quarter and slows
in the fourth quarter due to the weather.
Impact of the coronavirus pandemic on the BayWa Group
The BayWa Group continued to hold its ground in the first half of 2021 despite the continued coronavirus pandemic. Please see the
statements in the interim management report for more on the impact on the individual segments and business units. As in the financial year
2020, there have been no material negative balance-sheet implications for the BayWa Group.
Changes in the group of consolidated companies
Along with BayWa AG, the consolidated financial statements include all major companies over which it can exercise direct or indirect control
via subsidiaries.
As at 30 June 2021, a total of 475 companies were included in the consolidated financial statements in accordance with the standards
applicable to full consolidation; as at 31 December 2020, 442 companies were included in the consolidated financial statements. In addition,
BayWa Group – Selected Explanatory Notes to the Consolidated Financial Statements
23 BayWa Group Half-Year Financial Statements 2021
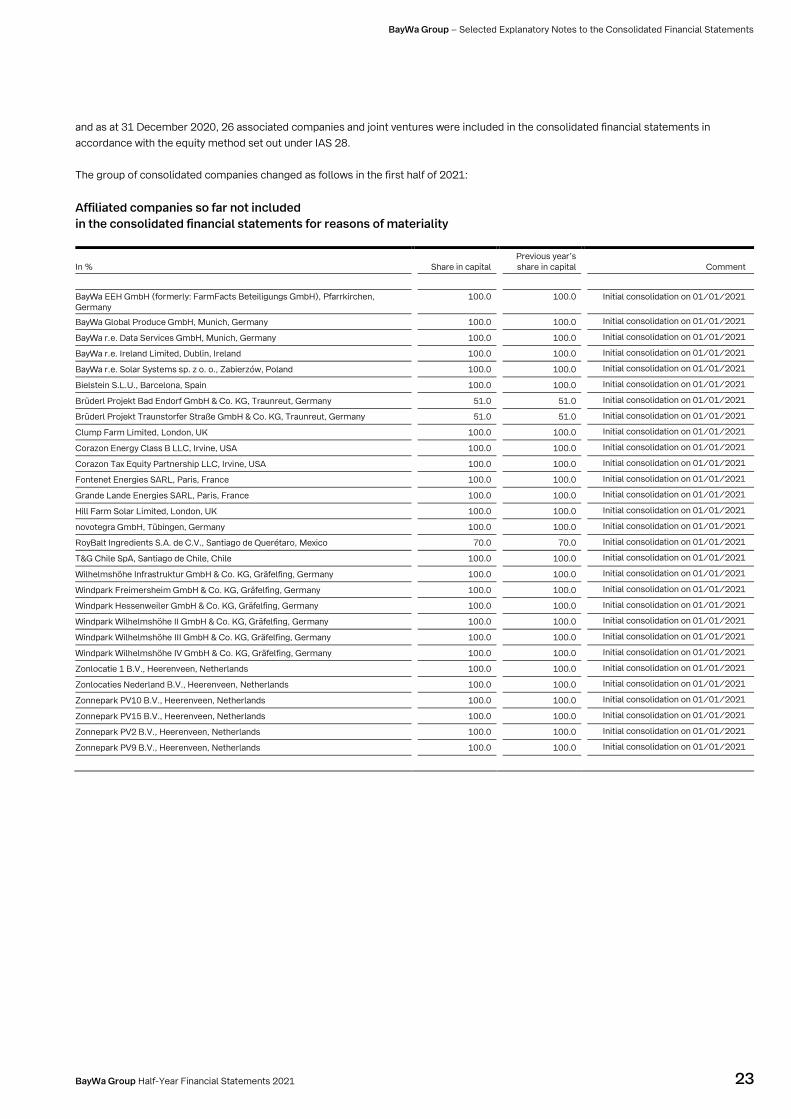
and as at 31 December 2020, 26 associated companies and joint ventures were included in the consolidated financial statements in
accordance with the equity method set out under IAS 28.
The group of consolidated companies changed as follows in the first half of 2021:
Affiliated companies so far not included
in the consolidated financial statements for reasons of materiality
In %
Share in capital
Previous year’s share in capital
Comment
BayWa EEH GmbH (formerly: FarmFacts Beteiligungs GmbH), Pfarrkirchen, Germany
100.0
100.0
Initial consolidation on 01/01/2021
BayWa Global Produce GmbH, Munich, Germany 100.0 100.0 Initial consolidation on 01/01/2021
BayWa r.e. Data Services GmbH, Munich, Germany 100.0 100.0 Initial consolidation on 01/01/2021
BayWa r.e. Ireland Limited, Dublin, Ireland 100.0 100.0 Initial consolidation on 01/01/2021
BayWa r.e. Solar Systems sp. z o. o., Zabierzów, Poland 100.0 100.0 Initial consolidation on 01/01/2021
Bielstein S.L.U., Barcelona, Spain 100.0 100.0 Initial consolidation on 01/01/2021
Brüderl Projekt Bad Endorf GmbH & Co. KG, Traunreut, Germany 51.0 51.0 Initial consolidation on 01/01/2021
Brüderl Projekt Traunstorfer Straße GmbH & Co. KG, Traunreut, Germany 51.0 51.0 Initial consolidation on 01/01/2021
Clump Farm Limited, London, UK 100.0 100.0 Initial consolidation on 01/01/2021
Corazon Energy Class B LLC, Irvine, USA 100.0 100.0 Initial consolidation on 01/01/2021
Corazon Tax Equity Partnership LLC, Irvine, USA 100.0 100.0 Initial consolidation on 01/01/2021
Fontenet Energies SARL, Paris, France 100.0 100.0 Initial consolidation on 01/01/2021
Grande Lande Energies SARL, Paris, France 100.0 100.0 Initial consolidation on 01/01/2021
Hill Farm Solar Limited, London, UK 100.0 100.0 Initial consolidation on 01/01/2021
novotegra GmbH, Tübingen, Germany 100.0 100.0 Initial consolidation on 01/01/2021
RoyBalt Ingredients S.A. de C.V., Santiago de Querétaro, Mexico 70.0 70.0 Initial consolidation on 01/01/2021
T&G Chile SpA, Santiago de Chile, Chile 100.0 100.0 Initial consolidation on 01/01/2021
Wilhelmshöhe Infrastruktur GmbH & Co. KG, Gräfelfing, Germany 100.0 100.0 Initial consolidation on 01/01/2021
Windpark Freimersheim GmbH & Co. KG, Gräfelfing, Germany 100.0 100.0 Initial consolidation on 01/01/2021
Windpark Hessenweiler GmbH & Co. KG, Gräfelfing, Germany 100.0 100.0 Initial consolidation on 01/01/2021
Windpark Wilhelmshöhe II GmbH & Co. KG, Gräfelfing, Germany 100.0 100.0 Initial consolidation on 01/01/2021
Windpark Wilhelmshöhe III GmbH & Co. KG, Gräfelfing, Germany 100.0 100.0 Initial consolidation on 01/01/2021
Windpark Wilhelmshöhe IV GmbH & Co. KG, Gräfelfing, Germany 100.0 100.0 Initial consolidation on 01/01/2021
Zonlocatie 1 B.V., Heerenveen, Netherlands 100.0 100.0 Initial consolidation on 01/01/2021
Zonlocaties Nederland B.V., Heerenveen, Netherlands 100.0 100.0 Initial consolidation on 01/01/2021
Zonnepark PV10 B.V., Heerenveen, Netherlands 100.0 100.0 Initial consolidation on 01/01/2021
Zonnepark PV15 B.V., Heerenveen, Netherlands 100.0 100.0 Initial consolidation on 01/01/2021
Zonnepark PV2 B.V., Heerenveen, Netherlands 100.0 100.0 Initial consolidation on 01/01/2021
Zonnepark PV9 B.V., Heerenveen, Netherlands 100.0 100.0 Initial consolidation on 01/01/2021

BayWa Group – Selected Explanatory Notes to the Consolidated Financial Statements
24 BayWa Group Half-Year Financial Statements 2021
Acquired companies included in the consolidated financial statements
for the first time owing to attainment of control 1
In %
Share in capital
Comment
Accitana Solar, S.L., Barcelona, Spain 2 100.0 Initial consolidation on 05/02/2021
Bracks Farm Solar Park Limited, London, UK 2 100.0 Initial consolidation on 08/02/2021
Dedun Solar, S.L., Barcelona, Spain 2 100.0 Initial consolidation on 05/02/2021
DMA Lucera S.r.l., Milan, Italy 2 100.0 Initial consolidation on 12/03/2021
EE Biogasanlage Brandis GmbH & Co. KG, Regensburg, Germany 100.0 Initial consolidation on 05/05/2021
High Constellation Windfarm Limited, London, UK 2 100.0 Initial consolidation on 16/02/2021
Sickingenstraße Grundbesitz GmbH, Munich, Germany 3 51.0 Initial consolidation on 16/04/2021
Tyche Solar, S.L., Barcelona, Spain 2 100.0 Initial consolidation on 05/02/2021
Windenergie Sallingberg GmbH, Kilb (formerly: Groß Schweinbarth), Austria 2 100.0 Initial consolidation on 17/02/2021
1 No shares were held in these companies in the previous year.
2 These companies are acquired project companies without business operations as defined by IFRS 3. A purchase price allocation is not performed.
3 No acquisition of a business as defined by IFRS 3. The company only owns a property with a building. A purchase price allocation is not prepared.
Established companies included in the consolidated financial statements 1
In %
Share in capital
Comment
Cotopaxi Energy Storage LLC, Irvine, USA 100.0 Initial consolidation on 14/06/2021
Fairgrow Limited, Auckland, New Zealand 100.0 Initial consolidation on 01/01/2021
Santa Fe BESS LLC, Irvine, USA 100.0 Initial consolidation on 14/06/2021
VentureFruit Australia Pty Limited, Melbourne, Australia 100.0 Initial consolidation on 01/01/2021
VentureFruit Global Limited, Auckland, New Zealand 100.0 Initial consolidation on 01/01/2021
VentureFruit International Limited, Auckland, New Zealand 100.0 Initial consolidation on 01/01/2021
VentureFruit NZ Limited, Auckland, New Zealand 100.0 Initial consolidation on 01/01/2021
1 No shares were held in these companies in the previous year.
Companies no longer included in the consolidated financial statements owing to mergers 1
In %
Previous year’s share in capital
Comment
LHD Landhandel Drebkau Import- und Export GmbH, Drebkau, Germany 100.0 Merged with Landhandel Knaup GmbH, Borchen, Germany,
as at 01/01/2021
Raiffeisen Waren GmbH Nürnberger Land, Hersbruck, Germany 100.0 Merged with BayWa AG, Munich, Germany, as at 01/01/2021
1 No shares were held in these companies as at the end of the first half of 2021 on account of their merger.
Companies no longer included in the consolidated financial statements owing to loss of control
In %
Share in capital
Previous year’s share in capital
Comment
Furukraft AB, Malmö, Sweden – 100.0 Sold on 10/05/2021
Great Blue Heron Solar LLC, Irvine, USA – 100.0 Liquidated on 11/03/2021
InterSaatzucht GmbH, Hohenkammer, Germany 100.0 36.0 Successive sale of 64% of shares as at 17/03/2021
Kita-Ibaragi City PV Plant G.K., Tokyo, Japan – 100.0 Sold on 02/02/2021
Plésidy Energies SAS, Paris, France – 100.0 Sold on 02/02/2021
Windpark Immenberg 2 GmbH & Co. KG, Gräfelfing, Germany – 100.0 Sold on 23/06/2021
Windpark Immenberg GmbH & Co. KG, Gräfelfing, Germany – 100.0 Sold on 23/06/2021

BayWa Group – Selected Explanatory Notes to the Consolidated Financial Statements
25 BayWa Group Half-Year Financial Statements 2021
Companies no longer included in the consolidated financial statements for reasons of materiality
In %
Share in capital
Previous year’s share in capital
Comment
Agrar- und Transportservice Kölleda GmbH, Kölleda, Germany 62.3 62.3 Deconsolidation on 01/06/2021
BayWa r.e. UK (Renewables Services) Ltd., London, UK 100.0 100.0 Deconsolidation on 01/01/2021
Ravel Wind, LLC, Wilmington, USA 100.0 100.0 In liquidation
Additions to the group of consolidated companies in the first half of 2021
BayWa AG acquired 100% of the shares in EE Biogasanlage Brandis GmbH & Co. KG through PAF Projects for Advanced Fuels GmbH by
way of a share deal. The aim of the transaction is to structurally and technically enhance the operations of the plant to meet the market
requirements under the European Renewable Energy Directive (RED II). PAF Projects for Advanced Fuels GmbH has had a controlling
influence since 5 May 2021. For reasons of practicability, the initial consolidation of the company in the consolidated financial statements
within the scope of full consolidation took place as at 1 May 2021. The purchase price amounted to €2.7 million.
Disposals from the group of consolidated companies
The total effect of the loss of control resulting from the disclosed sales on the consolidated financial statements is as follows (preliminary
figures):
Assets and debt derecognised owing to loss of control
In € million
Assets
Property, plant and equipment and intangible assets 0.0
Investments 0.0
Other non-current assets 1.8
Inventories 117.2
Receivables and other assets 11.2
Cash and cash equivalents 0.2
130.4
Shareholders’ equity and liabilities
Non-current provisions 0.0
Long-term debt 19.7
Non-current trade payables and other liabilities 0.0
Current provisions 6.2
Short-term debt 99.3
Current trade payables and other liabilities 9.3
134.5
Net assets on the disposal date - 4.1
Gains/losses from the disposal of Group companies
In € million
Consideration received in the form of cash and cash equivalents for the sold shares 80.1
Less net assets relinquished at the time of sale - 4.1
Disposal result 84.2

BayWa Group – Selected Explanatory Notes to the Consolidated Financial Statements
26 BayWa Group Half-Year Financial Statements 2021
In the case of project companies in the Renewable Energies business unit, disposals are disclosed in the income statement under revenues
and changes in inventories, while tax components are disclosed under tax expenses, as the disposal of these companies following the
completion of the corresponding asset is the primary component of operating activities.
Incoming net cash and cash equivalents from the disposal of Group companies
In € million
Purchase price settled through cash and cash equivalents 80.1
Less cash and cash equivalents paid out in connection with the disposal - 0.2
79.9
Financial instruments
The other current financial assets and liabilities measured at fair value assigned to the three levels of the
fair value hierarchy as at the reporting date, 30 June 2021, are as follows:
Level 1: Prices are identical to those quoted in active markets for identical assets or liabilities.
Level 2: Input factors which are not synonymous with the prices assumed at Level 1 but which can be observed either directly (i.e. as
prices) or indirectly (i.e. derived from prices) for the respective asset or liability.
Level 3: Factors not based on observable market data for the measurement of the asset or a liability (non-observable input factors).
Bonds/equity instruments
No bonded loans fell due in the first half of the financial year 2021. No issues, neither for bonds nor for other equity instruments, took place.
Appropriation of 2020 retained earnings
On 11 May 2021, the Annual General Meeting approved the following appropriation of BayWa AG’s profits in the financial year 2020:
In € million
Level 1
Level 2
Level 3
Total
Other current financial assets at fair value through profit or loss
Derivative financial instruments and commodity futures, including derivatives designated as hedging instruments for cash flow hedge accounting
81.5
353.0
–
434.5
Shareholdings in affiliated companies – 23.1 – 23.1
Securities and investments 25.0 45.7 – 70.7
Other current financial assets at fair value without effect on income
Securities (OCI option) 73.7 – – 73.7
Sum total of other current financial assets 180.3 421.8 – 602.0
Financial liabilities measured at fair value
Derivative financial instruments and commodity futures, including derivatives designated as hedging instruments for cash flow hedge accounting
76.7
330.7
–
407.4
Sum total of financial liabilities 76.7 330.7 – 407.4
In €
Dividend of €1.00 per dividend-bearing share 35,279,062.00
BayWa Group – Selected Explanatory Notes to the Consolidated Financial Statements
27 BayWa Group Half-Year Financial Statements 2021
The dividend was paid on 12 May 2021. The amount distributed to the shareholders was reduced by the portion of the treasury shares
owned by BayWa AG at the time when the resolution and profit appropriation was made, as these shares are not entitled to dividends
pursuant to Section 71b German Stock Corporation Act (AktG). This portion was transferred to other revenue reserves.
Earnings per share
Basic earnings per share (EPS) are calculated by dividing the profit for the period attributable to shares (net of minority interest) by the
average number of shares. So-called potential shares (above all share options and convertible bonds), which can dilute earnings per share,
were not issued, which means that diluted and basic earnings per share are the same.
Transactions and events to be reported
Interim reporting must contain information on transactions and events which affect the assets, debt, equity, result for the period under
review or the cash flow, and which, due to their type, scope or frequency, are unusual.
In December 2020, the investor search for the planned capital increase at BayWa r.e. renewable energy GmbH, Munich, Germany, was
successfully concluded upon the signing of a contract. The necessary regulatory approvals for the execution of the capital increase were
issued on 17 March 2021, allowing funds advised by Energy Infrastructure Partners (EIP), Zürich, Switzerland, to acquire a 49% stake in
BayWa r.e. AG (formerly: BayWa r.e. renewable energy GmbH) through an equity contribution of €530 million.
No further transactions or events to be reported took place in the reporting period from January to June 2021. In respect of effects from the
acquisition and disposal of companies, reference is made to the explanations above.
Tax computation
Tax computation is carried out by using the weighted average annual income tax rate for each separate region. The deferred tax assets
include tax-reducing claims which arise from the expected utilisation of loss carryforwards in the periods ahead, the realisation of which is
assured with sufficient probability.
Contingent liabilities and contingent receivables
There were no major changes in either contingent liabilities or contingent assets as against 31 December 2020.
Cash flow statement
The cash flow statement has been drawn up pursuant to IAS 7 by applying the indirect method, and broken down into cash flows from
operating, investing and financing activities.
Other transactions and events to be reported after the reporting date
Since the reporting date, 30 June 2021, there have been no transactions or events to be reported that have had a material effect on the
assets, financial position and earnings position of the BayWa Group.
Audit of the Half-Year Financial Statements
The Half-Year Financial Statements was not subject to any audit review.

BayWa Group – Selected Explanatory Notes to the Consolidated Financial Statements
28 BayWa Group Half-Year Financial Statements 2021
Segment report
The business activities of the Renewable Energies and Conventional Energy business units are pooled in the Energy Segment. The
Agriculture Segment is divided into four business units: Cefetra Group (formerly: BayWa Agri Supply & Trade – BAST), Global Produce, Agri
Trade & Service and Agricultural Equipment, covering the entire value chain from the field to the marketing of products. The Building
Materials Segment sells building materials for construction and civil engineering. This segment also comprises the retail activities of
Austrian Group companies. BayWa has plotted a clear course into the digital future by establishing the Innovation & Digitalisation Segment,
which is responsible for Digital Farming activities. Online sales at the BayWa Group are also pooled in the Innovation & Digitalisation
Segment under the BayWa Portal. Aside from peripheral activities, the Other Activities Segment mainly encompasses BayWa Group’s real
estate operations. The transition primarily includes amortisation of the hidden reserves and intangible assets revealed in purchase price
allocations in previous years.
Condensed segment information by business unit (income statement) for the first half of 2021
In € million Q1–2/2021
Renewable Energies
Conventional Energy
Energy
Cefetra Group (formerly: BAST)
Global Produce
Revenues generated through business with third parties 1,351.3 892.4 2,243.7 2,562.3 461.0
Intra-segment revenues 431.0 85.9 516.9 365.3 54.9
Inter-segment revenues 0.6 3.4 4.0 9.2 –
Total revenues 1,782.9 981.7 2,764.6 2,936.8 515.9
Earnings before interest, tax, depreciation and amortisation (EBITDA)
74.6
13.1
87.7
24.7
30.3
Depreciation/amortisation - 23.8 - 6.6 - 30.4 - 4.6 - 15.8
Earnings before interest and tax (EBIT) 50.8 6.5 57.3 20.1 14.5
Earnings before tax (EBT) 27.7 6.0 33.7 17.4 9.3
Income tax
Net result/loss for the period
Condensed segment information by business unit (income statement) for the first half of 2020
In € million Q1–2/2020
Renewable Energies
Conventional Energy
Energy
Cefetra Group (formerly: BAST)
Global Produce
Revenues generated through business with third parties 835.8 915.0 1,750.8 2,238.7 451.2
Intra-segment revenues 111.1 77.0 188.1 390.2 37.7
Inter-segment revenues 0.3 3.1 3.4 10.1 –
Total revenues 947.2 995.1 1,942.3 2,639.0 488.9
Earnings before interest, tax, depreciation and amortisation (EBITDA)
15.0
23.9
38.9
13.4
31.3
Depreciation/amortisation - 16.3 - 5.9 - 22.2 - 4.8 - 13.1
Earnings before interest and tax (EBIT) - 1.3 18.0 16.7 8.6 18.2
Earnings before tax (EBT) - 28.6 18.2 - 10.4 3.7 13.6
Income tax
Net result/loss for the period

BayWa Group – Selected Explanatory Notes to the Consolidated Financial Statements
29 BayWa Group Half-Year Financial Statements 2021
Agri Trade &
Service Agricultural Equipment
Agriculture
Building Materials
Innovation & Digitalisation
Other Activities
Transition
Group
2,129.0 880.8 6,033.1 994.6 5.7 6.3 – 9,283.4
280.6 19.5 720.3 27.3 0.5 29.3 – 1,294.3
21.4 0.5 31.1 0.6 0.1 3.5 – 39.3
2,431.0 900.8 6,784.5 1,022.5 6.3 39.1 – 10,617.0
58.6
25.5
139.1
47.7
- 1.4
- 10.2
–
262.9
- 19.6 - 10.8 - 50.8 - 14.1 - 3.4 - 16.8 - 2.8 - 118.3
39.0 14.7 88.3 33.6 - 4.8 - 27.0 - 2.8 144.6
27.6 8.2 62.5 24.7 - 5.2 - 19.1 - 2.7 94.0
- 27.2
66.8
Agri Trade &
Service Agricultural Equipment
Agriculture
Building Materials
Innovation & Digitalisation
Other Activities
Transition
Group
1,987.0 876.9 5,553.8 876.8 5.6 6.7 – 8,193.7
180.9 19.8 628.6 22.0 0.2 30.4 – 869.3
20.3 1.0 31.4 0.2 – 3.2 – 38.2
2,188.2 897.7 6,213.8 899.0 5.8 40.4 – 9,101.3
38.0
26.3
109.0
30.7
- 4.4
- 13.8
–
160.4
- 19.1 - 10.4 - 47.4 - 13.5 - 2.4 - 16.4 - 4.7 - 106.6
18.9 15.9 61.6 17.2 - 6.8 - 30.2 - 4.7 53.8
9.0 9.3 35.6 10.9 - 6.9 - 23.9 - 4.7 0.6
- 0.2
0.4
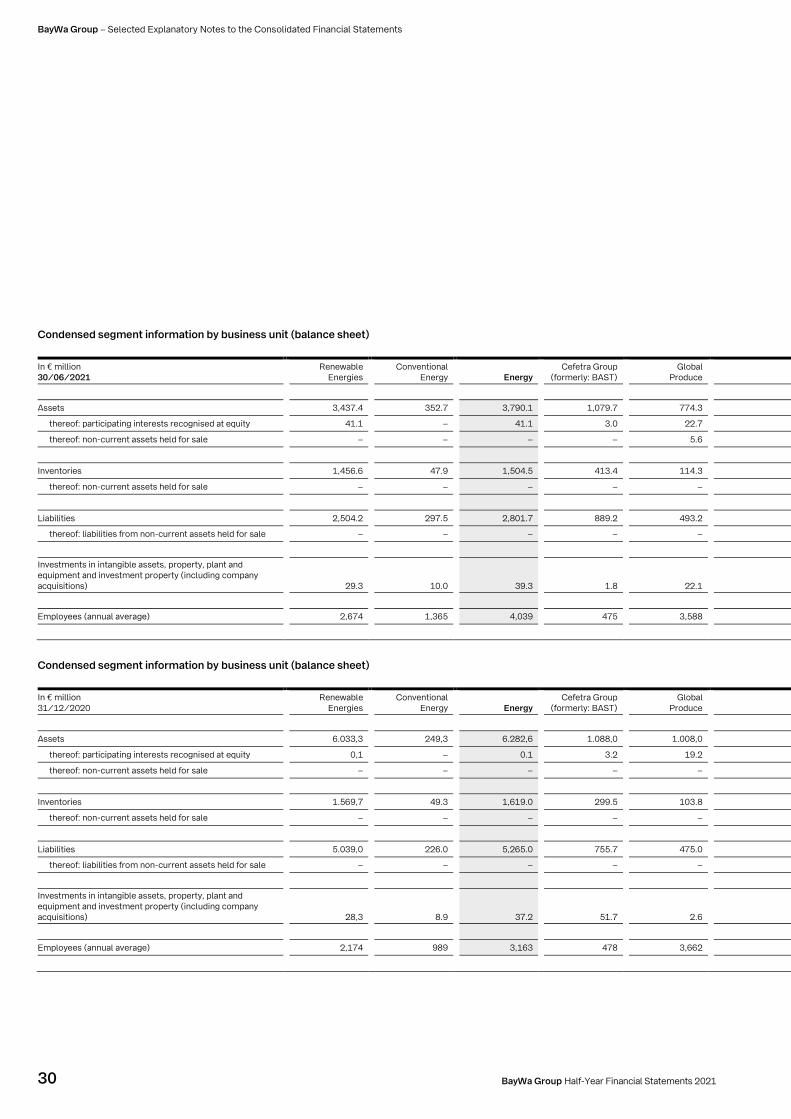
BayWa Group – Selected Explanatory Notes to the Consolidated Financial Statements
30 BayWa Group Half-Year Financial Statements 2021
Condensed segment information by business unit (balance sheet)
In € million 30/06/2021
Renewable Energies
Conventional Energy
Energy
Cefetra Group (formerly: BAST)
Global Produce
Assets 3,437.4 352.7 3,790.1 1,079.7 774.3
thereof: participating interests recognised at equity 41.1 – 41.1 3.0 22.7
thereof: non-current assets held for sale – – – – 5.6
Inventories 1,456.6 47.9 1,504.5 413.4 114.3
thereof: non-current assets held for sale – – – – –
Liabilities 2,504.2 297.5 2,801.7 889.2 493.2
thereof: liabilities from non-current assets held for sale – – – – –
Investments in intangible assets, property, plant and equipment and investment property (including company acquisitions)
29.3
10.0
39.3
1.8
22.1
Employees (annual average) 2,674 1,365 4,039 475 3,588
Condensed segment information by business unit (balance sheet)
In € million 31/12/2020
Renewable Energies
Conventional Energy
Energy
Cefetra Group (formerly: BAST)
Global Produce
Assets 6.033,3 249,3 6.282,6 1.088,0 1.008,0
thereof: participating interests recognised at equity 0,1 – 0.1 3.2 19.2
thereof: non-current assets held for sale – – – – –
Inventories 1.569,7 49.3 1,619.0 299.5 103.8
thereof: non-current assets held for sale – – – – –
Liabilities 5.039,0 226.0 5,265.0 755.7 475.0
thereof: liabilities from non-current assets held for sale – – – – –
Investments in intangible assets, property, plant and equipment and investment property (including company acquisitions)
28,3
8.9
37.2
51.7
2.6
Employees (annual average) 2,174 989 3,163 478 3,662
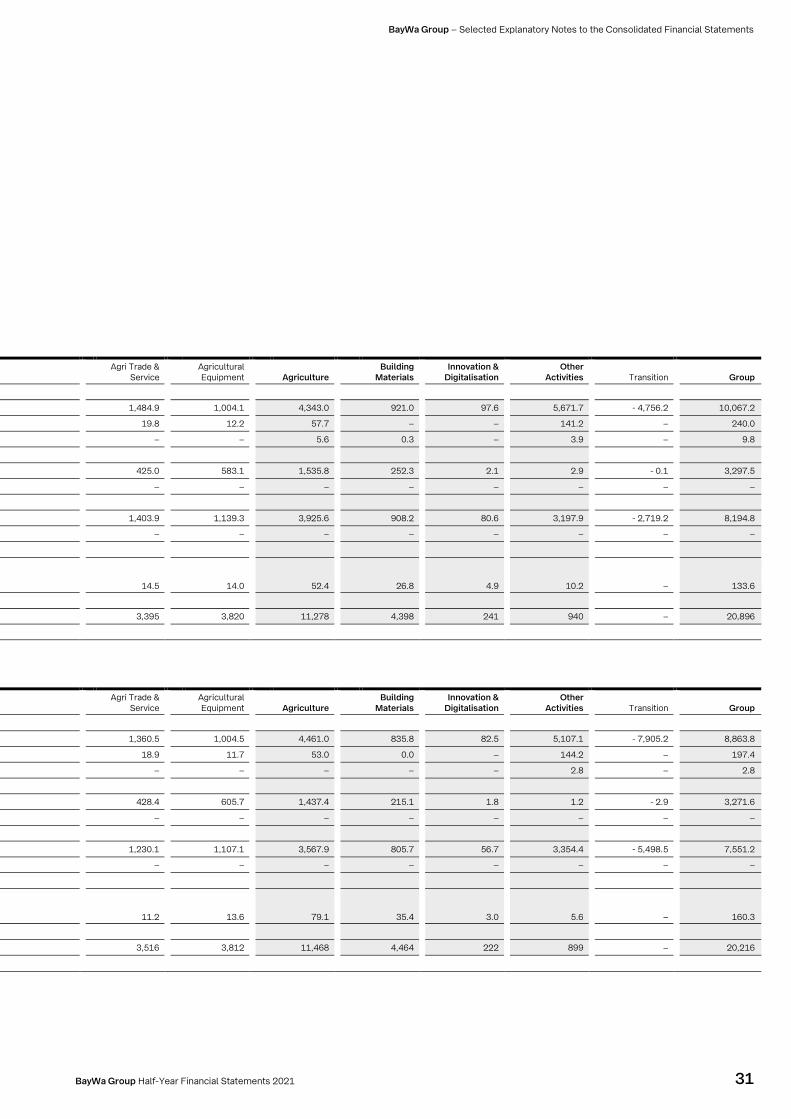
BayWa Group – Selected Explanatory Notes to the Consolidated Financial Statements
31 BayWa Group Half-Year Financial Statements 2021
Agri Trade &
Service Agricultural Equipment
Agriculture
Building Materials
Innovation & Digitalisation
Other Activities
Transition
Group
1,484.9 1,004.1 4,343.0 921.0 97.6 5,671.7 - 4,756.2 10,067.2
19.8 12.2 57.7 – – 141.2 – 240.0
– – 5.6 0.3 – 3.9 – 9.8
425.0 583.1 1,535.8 252.3 2.1 2.9 - 0.1 3,297.5
– – – – – – – –
1,403.9 1,139.3 3,925.6 908.2 80.6 3,197.9 - 2,719.2 8,194.8
– – – – – – – –
14.5
14.0
52.4
26.8
4.9
10.2
–
133.6
3,395 3,820 11,278 4,398 241 940 – 20,896
Agri Trade &
Service Agricultural Equipment
Agriculture
Building Materials
Innovation & Digitalisation
Other Activities
Transition
Group
1,360.5 1,004.5 4,461.0 835.8 82.5 5,107.1 - 7,905.2 8,863.8
18.9 11.7 53.0 0.0 – 144.2 – 197.4
– – – – – 2.8 – 2.8
428.4 605.7 1,437.4 215.1 1.8 1.2 - 2.9 3,271.6
– – – – – – – –
1,230.1 1,107.1 3,567.9 805.7 56.7 3,354.4 - 5,498.5 7,551.2
– – – – – – – –
11.2
13.6
79.1
35.4
3.0
5.6
–
160.3
3,516 3,812 11,468 4,464 222 899 – 20,216

BayWa Group – Selected Explanatory Notes to the Consolidated Financial Statements
32 BayWa Group Half-Year Financial Statements 2021
Condensed segment information by region
External sales
Non-current assets
In € million
Q1–2/2021
Q1–2/2020
30/06/2021
31/12/2020
Germany 3,463.2 3,416.7 1,770.1 1,773.7
Austria 1,363.5 1,185.8 529.0 517.8
Netherlands 840.2 807.3 – –
New Zealand – – 264.1 264.3
USA – – 311.8 330.5
Other international operations 3,616.5 2,783.9 902.6 820.9
Group 9,283.4 8,193.7 3,777.6 3,707.6

BayWa Group – Selected Explanatory Notes to the Consolidated Financial Statements
33 BayWa Group Half-Year Financial Statements 2021
Condensed segment reporting by business unit (income statement) – by quarter
In € million
Q1/2021
Q2/2021
Q1–2/2021
Q1/2020
Q2/2020
Q1–2/2020
Change Q1–Q2 in %
Revenues generated through business with third parties
Renewable Energies 662.1 689.2 1,351.3 383.5 452.3 835.8 4.1
Conventional Energy 377.3 515.1 892.4 486.2 428.8 915.0 36.5
Energy 1,039.4 1,204.3 2,243.7 869.7 881.1 1,750.8 15.9
Cefetra Group (formerly: BAST) 1,258.0 1,304.3 2,562.3 1,090.7 1,148.0 2,238.7 3.7
Global Produce 216.0 245.0 461.0 201.4 249.8 451.2 13.4
Agri Trade & Service 1,008.3 1,120.7 2,129.0 982.8 1,004.2 1,987.0 11.1
Agricultural Equipment 370.7 510.1 880.8 385.4 491.5 876.9 37.6
Agriculture 2,853.0 3,180.1 6,033.1 2,660.3 2,893.5 5,553.8 11.5
Building Materials 373.0 621.6 994.6 333.7 543.1 876.8 66.6
Innovation & Digitalisation 3.0 2.7 5.7 2.4 3.2 5.6 - 10.0
Other Activities 3.7 2.6 6.3 4.0 2.7 6.7 - 29.7
Total 4,272.1 5,011.3 9,283.4 3,870.1 4,323.6 8,193.7 17.3
Earnings before interest, tax, depreciation and amortisation (EBITDA)
Renewable Energies 44.9 29.7 74.6 - 0.9 15.9 15.0 - 33.9
Conventional Energy 6.6 6.5 13.1 7.8 16.1 23.9 - 1.5
Energy 51.5 36.2 87.7 6.9 32.0 38.9 - 29.7
Cefetra Group (formerly: BAST) 13.3 11.4 24.7 6.1 7.3 13.4 - 14.3
Global Produce 8.8 21.5 30.3 7.7 23.6 31.3 > 100
Agri Trade & Service 24.3 34.3 58.6 12.6 25.4 38.0 41.2
Agricultural Equipment 9.8 15.7 25.5 7.2 19.1 26.3 60.2
Agriculture 56.2 82.9 139.1 33.6 75.4 109.0 47.5
Building Materials 1.3 46.4 47.7 - 5.3 36.0 30.7 > 100
Innovation & Digitalisation - 1.5 0.1 - 1.4 - 2.3 - 2.1 - 4.4 > 100
Other Activities - 4.5 - 5.7 - 10.2 - 7.8 - 6.0 - 13.8 - 26.7
Transition 0.0 0.0 0.0 0.0 0.0 0.0 0.0
Total 103.0 159.9 262.9 25.1 135.3 160.4 55.2
Earnings before interest and tax (EBIT)
Renewable Energies 33.7 17.1 50.8 - 8.9 7.6 - 1.3 - 49.3
Conventional Energy 3.3 3.2 6.5 4.9 13.1 18.0 - 3.0
Energy 37.0 20.3 57.3 - 4.0 20.7 16.7 - 45.1
Cefetra Group (formerly: BAST) 11.0 9.1 20.1 3.7 4.9 8.6 - 17.3
Global Produce 1.0 13.5 14.5 1.1 17.1 18.2 > 100
Agri Trade & Service 14.7 24.3 39.0 3.1 15.8 18.9 65.3
Agricultural Equipment 4.5 10.2 14.7 2.0 13.9 15.9 > 100
Agriculture 31.2 57.1 88.3 9.9 51.7 61.6 83.0
Building Materials - 5.7 39.3 33.6 - 12.0 29.2 17.2 > 100
Innovation & Digitalisation - 3.2 - 1.6 - 4.8 - 3.5 - 3.3 - 6.8 50.0
Other Activities - 12.8 - 14.2 - 27.0 - 15.8 - 14.4 - 30.2 - 10.9
Transition - 1.4 - 1.4 - 2.8 - 2.4 - 2.3 - 4.7 0.0
Total 45.1 99.5 144.6 - 27.8 81.6 53.8 > 100
Earnings before tax (EBT)
Renewable Energies 24.3 3.4 27.7 - 24.1 - 4.5 - 28.6 - 86.0
Conventional Energy 3.7 2.3 6.0 4.9 13.3 18.2 - 37.8
Energy 28.0 5.7 33.7 - 19.2 8.8 - 10.4 - 79.6
Cefetra Group (formerly: BAST) 9.7 7.7 17.4 1.3 2.4 3.7 - 20.6
Global Produce - 1.4 10.7 9.3 - 1.1 14.7 13.6 > 100
Agri Trade & Service 7.9 19.7 27.60 - 0.6 9.6 9.0 > 100
Agricultural Equipment - 0.2 8.4 8.2 0.2 9.1 9.3 > 100
Agriculture 16.0 46.5 62.5 - 0.2 35.8 35.6 > 100
Building Materials - 9.8 34.5 24.7 - 14.7 25.6 10.9 > 100
Innovation & Digitalisation - 3.3 - 1.9 - 5.2 - 3.6 - 3.3 - 6.9 42.4
Other Activities - 8.6 - 10.5 - 19.1 - 12.4 - 11.5 - 23.9 - 22.1
Transition - 1.4 - 1.3 - 2.7 - 2.4 - 2.3 - 4.7 7.1
Total 20.9 73.1 94.0 - 52.5 53.1 0.6 > 100
BayWa Group – Affirmation by the Legally Authorised Representatives
34 BayWa Group Half-Year Financial Statements 2021
Affirmation by the Legally Authorised Representatives
We hereby affirm that, to the best of our knowledge and in accordance with the generally accepted accounting principles applicable to
interim reporting, the Interim Consolidated Financial Statements for the first half of the year give a true and fair view of the assets, financial
position and earnings position of the Group, and the Interim Management Report of the BayWa Group presents a true and fair description of
the development of the Group’s business, including its performance, and of the material risks and opportunities inherent in the prospective
development of the Group over the remainder of the financial year.
Munich, 3 August 2021
BayWa Aktiengesellschaft
The Board of Management
Prof. Klaus Josef Lutz
Andreas Helber
Marcus Pöllinger
Reinhard Wolf

BayWa Group – Financial Calendar
35 BayWa Group Half-Year Financial Statements 2021
Financial Calendar
Dates in 2021
Publication of figures for the third quarter of 2021
11 November 2021, 8.30 am – Analysts’ Conference Call
11 November 2021, 10.30 am – Press Conference Call
Dates in 2022
Consolidated Financial Statements for 2021
24 March 2022, 10.30 am – Annual Results Press Conference, Munich
25 March 2022, 11.00 am – Analysts’ Conference, Munich
Publication of figures for the first quarter of 2022
5 May 2022, 8.30 am – Analysts’ Conference Call
5 May 2022 – Press release
Annual General Meeting 2022
24 May 2022, 10.00 am – ICM, Munich
Contact
Investor Relations
Arabellastr. 4
81925 Munich
Germany
www.baywa.com