sevan marine asa interim financial report ... marine asa 2 interim financial report first half 2012...
TRANSCRIPT

20 12
SE
VAN
MA
RIN
E A
SA
IN
TE
RIM
FIN
AN
CIA
L R
EP
OR
T -
FIR
ST
HA
LF
2SEVAN MARINE ASA
INTERIM FINANCIAL REPORT
First half 2012
2
CONTENTS
INTERIM FINANCIAL REPORT FIRST HALF 2012
Main Figures, First half 2012 . . . . . . . . . . . . . . . . . . . . . . . . . . . . . . . . . . . . . . . . . . . . . . . . . .3Business Segments . . . . . . . . . . . . . . . . . . . . . . . . . . . . . . . . . . . . . . . . . . . . . . . . . . . . . . . . .3Financing Activities . . . . . . . . . . . . . . . . . . . . . . . . . . . . . . . . . . . . . . . . . . . . . . . . . . . . . . . . .4Covenant Status . . . . . . . . . . . . . . . . . . . . . . . . . . . . . . . . . . . . . . . . . . . . . . . . . . . . . . . . . . .4Restructuring Process . . . . . . . . . . . . . . . . . . . . . . . . . . . . . . . . . . . . . . . . . . . . . . . . . . . . . . .4Going Concern And Outlook . . . . . . . . . . . . . . . . . . . . . . . . . . . . . . . . . . . . . . . . . . . . . . . . . .4
INTERIM FINANCIAL STATEMENTS
Condensed Consolidated Income Statement . . . . . . . . . . . . . . . . . . . . . . . . . . . . . . . . . . . . .5Statement of Comprehensive Income . . . . . . . . . . . . . . . . . . . . . . . . . . . . . . . . . . . . . . . . . . .5Condensed Consolidated Balance Sheet . . . . . . . . . . . . . . . . . . . . . . . . . . . . . . . . . . . . . . . .6Condensed Consolidated Cash Flow Statement . . . . . . . . . . . . . . . . . . . . . . . . . . . . . . . . . . .7Condensed Consolidated Statement of Changes in Equity . . . . . . . . . . . . . . . . . . . . . . . . . . .8Key Figures . . . . . . . . . . . . . . . . . . . . . . . . . . . . . . . . . . . . . . . . . . . . . . . . . . . . . . . . . . . . . . .8
NOTES TO THE INTERIM CONSOLIDATED FINANCIAL STATEMENTS
Note 1 General accounting principles . . . . . . . . . . . . . . . . . . . . . . . . . . . . . . . . . . . . . . . . .9Note 2 Property, plant and equipment . . . . . . . . . . . . . . . . . . . . . . . . . . . . . . . . . . . . . . . .10Note 3 Related party transactions . . . . . . . . . . . . . . . . . . . . . . . . . . . . . . . . . . . . . . . . . . .11Note 4 Segment information . . . . . . . . . . . . . . . . . . . . . . . . . . . . . . . . . . . . . . . . . . . . . . .11Note 5 Shareholder structure . . . . . . . . . . . . . . . . . . . . . . . . . . . . . . . . . . . . . . . . . . . . . .13Note 6 Discontinued operation – specification profit and loss . . . . . . . . . . . . . . . . . . . . . .14Note 7 Discontinued operation – specification balance sheet . . . . . . . . . . . . . . . . . . . . . .16Note 8 Events after balance sheet date . . . . . . . . . . . . . . . . . . . . . . . . . . . . . . . . . . . . . .17
RESPONSIBILITY STATEMENT
SEVAN MARINE ASA
INTERIM FINANCIAL REPORT
First half 2012

3SEVAN MARINE ASA
INTERIM FINANCIAL REPORT
First half 2012
MAIN FIGURES, FIRST HALF 2012
(previous quarter figures in brackets)
Operating revenue from continued operations for the quarter amounted to USD 23 .7 million (USD 24 .4 million) . EBITDAFX was positive USD 10 .4 million (positive USD 11 .8 million) . Operating profit was USD 11 .4 million (positive USD 10 .3 million) . Net profit from continued operations was USD 11 .0 million (positive USD 12 .3 million) .
Operating revenue from continued operations was USD 0 .7 million lower than the previous quarter . This was mainly the result of lower revenue from studies .
Operating expense from continued operations was USD 0 .7 million higher than previous quarter . This is mainly due to the reversal of a 2011 bonus accrual reflected in the Q1 2012 not repeated in the Q2 2012 figures .
No additional impairments were recorded with respect to the disputed receivable with ONGC . Arbitration proceedings are now underway in India . Sevan will continue to pursue the claim although no guarantees can be given with respect to the amount or timing of potential recoveries .
Depreciation, amortization and impairment of USD 0 .2 million from continued operations was USD 0 .2 million lower than previous quarter due to impairments on equipment relating to our closed office in Brazil reflected in the Q1 2012 figures . No impairment has been done during Q2 2012 .
Foreign exchange loss relating to financing from continued operations was USD 1 .3 million (gain of USD 1 .7) . The loss relates to NOK-nominated cash re-valued to USD .
As of June 30, 2012, total assets of the Group excluding discontinued operations amounted to USD 196 .5 million (USD 201 .4 million), of which USD 92 .0 million (USD 92 .0 million) was capitalized as “Sevan Capital Assets” . Cash and cash equivalents amounted to USD 54 .4 million (USD 56 .7 million) .
INTERIM FINANCIAL REPORT FIRST HALF 2012 FOR
SEVAN MARINE ASA (‘SEVAN MARINE’ OR THE ‘COMPANY’, AND TOGETHER WITH ITS SUBSIDIARIES THE ‘GROUP’)
BUSINESS SEGMENTS
Floating Production The assets remaining in the floating production segment post the Restructuring are the Sevan hulls no . 4 and 5 along with the Goliat project . The FPSO Voyageur Spirit (previously known as the FPSO Sevan Voyageur) is accounted for as discontinued operations .
The upgrade work on FPSO Voyageur Spirit is close to complete at the Nymo yard in Arendal, Norway, and sailaway is expected during September . Teekay is providing Sevan Marine with required funding for completing the upgrade of the FPSO Voyageur Spirit . Under the terms of the bridge loan provided in Q3/2011, Teekay will cover any possible further cost overruns . First oil is expected in Q4/2012, as previously communicated, at which time ownership will be transferred to Teekay .
The activities relating to project management and engineering of the Sevan 1000 Goliat FPSO continued during the quarter . The EBIT-DAFX of these activities was USD 12 .7 million, of which USD 12 .0 million was the license fee received . The license fee is securitized and payable to Investec Bank plc (“Investec”) under the USD 83 million facility agreement (the “Investec Facility”) . The license fee and the Investec Facility both expire in the third quarter 2012 .
The Sevan 300 hulls no . 4 and 5 are located at the COSCO Nantong Shipyard . The intention is to complete the construction of the units only upon securing contracts with clients . Potential contracts including licensing arrangements with respect to the units are also being actively considered and pursued . These hulls represent a substantial portion of the Company’s physical assets .
Topside and Process Technology This consists of the activities of the KANFA group . The KANFA group is currently working on projects both inside and outside the Sevan Marine Group . Revenue for the KANFA group for the Q2 2012 was USD 4 .5 million and EBITDAFX was slightly positive .
CorporateThe activities within Corporate relate to business development, R&D, studies made for clients and general administration activities . Sevan Marine continues to work on several studies involving potential FPSO and FSO projects, license agreements and engineering support contracts . Revenue from such projects amounted to USD 2 .6 million during Q2 2012 .

4SEVAN MARINE ASA
INTERIM FINANCIAL REPORT
First half 2012
FINANCING ACTIVITIES
The bridge loan from Teekay is payable upon completion of the sale of the FPSO Voyageur Spirit and is to be repaid by way of setting off the USD 108 million against the purchase price applicable to the sale of the FPSO Voyageur Spirit . The Teekay Bridge Loan may be terminated should it become clear that the FPSO Voyageur Spirit will not be completed by December 31, 2012 . To date the Company has drawn USD 103 million under the Facility . The loan is secured by the Sevan 300 hulls no . 4 and 5 and a second ranking mortgage against the FPSO Voyageur Spirit .
COVENANT STATUS
A waiver of default and termination rights has been received with respect to the USD 83 million securitization facility led by Investec Bank plc, which subject to certain conditions, will apply through the full repayment of the facility in the third quarter of 2012 .
On April 16, 2012, agreements were entered into between the bank facility syndicate led by ING Bank N .V . (“ING”), Teekay and E .ON regarding the Voyageur project and the amendment of agreements required to effectuate the sale of the FPSO Voyageur Spirit to Teekay . In exchange for certain guarantees and undertakings provided by Teekay, ING and E .ON have agreed to defer their step-in rights and amend financial covenants such that the Company is no longer in breach . Teekay will assume all obligations under the charter agree-ments and the USD 230 million ING led facility upon completion of the sale of the FPSO Voyageur Spirit . For Sevan Marine, this agreement is perceived to represent a further reduction in risk related to the Voyageur project .
RESTRUCTURING PROCESS
The completion of the sale of the FPSO Voyageur Spirit is expected to occur during the Q4 2012 and is the only remaining element of the agreed Restructuring .
The Teekay Bridge Loan calls for completion of the sale of the FPSO Voyageur Spirit by December 31, 2012 . The Company may require extensions to this deadline should completion not occur prior to this date . No guarantees can be given at this time that such extension would be granted .
GOING CONCERN AND OUTLOOK
The many discoveries within oil and gas world wide, more projects moving into a production phase, as well as expected high and increasing investment levels in the industry calls for a positive market outlook for the Company . Further, whilst keeping a firm focus on the core area Sevan Marine will explore the possibility to capitalize on previous investments made for other applications of the Sevan technology and the possible application of new technologies, as well as develop the Kanfa group further . The Company aims at being debt free by the end of 2012 and targets to strengthen its balance sheet during 2012 by reducing its risks and liabilities and thereby improve its growth potential going forward .
Highlights during Q2 2012 include:
• Work on the FPSO Voyageur Spirit is proceeding and expected sail away from the construction yard during September;
• Continued focus on securing work for hulls no . 4 and 5;
• Sevan Marine continues to adapt its organisation to fit the new business model post restructuring; including systematic focus on effective operations;
• On-going negotiations to reduce risks and liabilities, as well as strict cash management;
• In July, the Sevan concept was chosen by Dana Petroleum for the Western Isles development project .
The Board confirms that the First Half 2012 financial statements have been prepared based on a going concern assumption . This assump-tion is based on completion of the sale of the FPSO Voyageur Spirit during the second half of 2012 . It is also based on an assumption that the Company is able to continue to successfully attract new business . Should the completion of the sale of the FPSO Voyageur Spirit be delayed and Sevan find it is unable to attract sufficient capital to cover its cost, the Company may be required to revisit the going concern assumption .
Arendal, August 28, 2012 The Board of Directors of Sevan Marine ASA

5SEVAN MARINE ASA
INTERIM FINANCIAL REPORT
First half 2012
INTERIM FINANCIAL STATEMENTS FIRST HALF OF 2012
CONDENSED CONSOLIDATED INCOME STATEMENT
Unaudited figures in USD million Note Q2 12 Q1 12 30.06.12 Q2 11 30.06.11 2011*
Operating revenue 3 23 .7 24 .4 48 .1 32 .1 52 .9 100 .0 Operating expense -13 .3 -12 .6 -25 .9 -23 .1 -41 .4 -94 .4EBITDAFX 10.4 11.8 22.2 9.0 11.5 5.6 Foreign exchange gain/(loss) relating to operation 1 .2 -1 .1 0 .1 -0 .8 -2 .7 0 .3EBITDA 11.6 10.7 22.3 8.2 8.9 5.9 Depreciation, amortization and impairment 2 -0 .2 -0 .4 -0 .6 -59 .1 -59 .8 -79 .1Operating profit/(loss) 11.4 10.3 21.7 -50.9 -50.9 -73.2 Income from associated companies 0 .0 0 .0 0 .0 1 .9 1 .9 1 .9Financial income/(expense) 0 .9 0 .2 1 .1 -209 .7 -213 .1 -292 .7Foreign exchange gain/(loss) relating to financing -1 .3 1 .7 0 .4 -0 .2 -0 .1 -1 .2Net financial items -0.4 1.9 1.5 -207.9 -211.2 -292.0 Profit/(loss) before tax 11.0 12.3 23.3 -258.8 -262.1 -365.2 Tax income/(expense) 0 .0 0 .0 0 .0 -34 .3 -37 .4 -38 .6Net profit/(loss) continued operations 11.0 12.3 23.3 -293.1 -299.5 -403.8Net profit/(loss) discontinued operations 6 -3.5 -4.2 -7.7 -346.0 -392.9 -337.4
* In accordance with IFRS 5, comparable income statement amounts are reclassified as if the drilling segment and material part of the floating production seg-
ment was regarded as a discontinued operations also for previous periods
STATEMENT OF COMPREHENSIVE INCOME Unaudited figures in USD million Q2 12 Q1 12 30.06.12 Q2 11 30.06.11 2011* Net profit/(loss) 7 .5 8 .1 15 .6 -639 .0 -692 .4 -741 .2Foreign currency translation -1 .3 1 .9 0 .6 1 .1 2 .5 -5 .5Total comprehensive income 6.2 10.0 16.2 -637.9 -689.8 -746.7

6Sevan Marine ASAInterim Financial Statements SEVAN MARINE ASA
INTERIM FINANCIAL REPORT
First half 2012
CONDENSED CONSOLIDATED BALANCE SHEET Unaudited figures in USD million Note 30.06.12 30.06.11 31.12.11Sevan Capital Assets 2 92 .0 914 .0 92 .0Other fixed assets 0 .9 6 .2 0 .9Intangible assets 11 .8 13 .6 11 .5Investments in associates 0 .0 143 .3 0 .0Deferred income tax assets 0 .0 15 .3 0 .0Other non-current assets 0 .6 14 .5 0 .3Total non-current assets 105.2 1,106.9 104.8 Inventories 0 .0 6 .4 0 .0Trade and other receivables 3 37 .0 68 .0 44 .4Financial assets available for sale 0 .0 0 .0 0 .0Cash and cash equivalents 54 .4 33 .9 52 .1Total current assets 91.3 108.4 96.5Assets of disposal Group* 7 447 .5 0 .0 380 .5 Total assets 644.0 1,215.3 581.8 Share capital 5 34 .6 16 .6 34 .6Other equity 103 .7 108 .8 87 .9Total shareholders’ equity 138.4 125.4 122.5Non-controlling interest 1 .2 0 .7 0 .8Total equity 139.6 126.1 123.3 Interest-bearing debt 0 .0 0 .0 0 .0Retirement benefit obligations 1 .7 1 .8 1 .9Other non-current liabilities/provisions 0 .0 3 .9 0 .5Total non-current liabilities 1.7 5.7 2.5 Interest-bearing debt 7 .9 969 .6 30 .4Current liabilities 3 39 .6 113 .7 47 .5Total current liabilities 47.5 1,083.4 77.9 Total liabilities 49.2 1,089.1 80.4Liabilities of disposal Group* 7 455 .3 0 .0 378 .1 Total equity and liabilities 644.0 1,215.3 581.8
* IFRS 5 requires that operations constituting a major part of the business to be classified as discontinued when the assets are held for sale. Consolidated assets
and liabilities of the material part of the floating production segment are therefore presented separately in the balance sheet as per June 30, 2012, as ‘assets of
disposal group’ and ‘liabilities of disposal group’, respectively.

7Sevan Marine ASAInterim Financial Statements SEVAN MARINE ASA
INTERIM FINANCIAL REPORT
First half 2012
CONDENSED CONSOLIDATED CASH FLOW STATEMENT Unaudited figures in USD million 30.06.12 30.06.11* 31.12.11
Cash flows from operation activities Cash from operations 28 .9 99 .3 -18 .6Interest paid -1 .3 -40 .1 -6 .5Taxes paid -1 .7 0 .0 -0 .1Net cash generated from continued operating activities 25.9 59.2 -25.2Net cash generated from discontinued operating activities -10 .3 0 .0 71 .4Net cash generated from operating activities 15.6 59.2 46.2 Cash flows from investment activities Purchases of property, plant and equipment (PPE) -0 .6 -297 .8 -0 .1Purchases of intangible assets -0 .3 -0 .5 -0 .5Net cash flow from continued investment activities -0.9 -298.3 -0.6Net cash flow from discontinued investment activities -46 .9 0 .0 -325 .8Net cash flow from investment activities -47.8 -298.3 -326.4 Cash flows from financing activities Net proceeds from issuance of ordinary shares 0 .0 0 .0 46 .9Net proceeds from interest-bearing debt 0 .0 774 .6 4 .8Repayment of interest bearing debt -22 .7 -342 .2 -41 .5Sale KANFA-TEC AS 0 .0 6 .4 6 .4Sale Sevan Drilling 0 .0 -281 .9 0 .0Restructuring fees 0 .0 0 .0 -16 .8Net cash flow from continued financing activities -22.7 156.9 -0.2Net cash flow from discontinued financing activities 63 .0 247 .4Net cash flow from financing activities 40.3 156.9 247.2 Net cash flow for the period 8.1 -82.2 -33.0 Cash balance at beginning of period 83 .1 116 .1 116 .1Cash balance at end of period 91.2 33.9 83.1
* Consolidated cash flow statement per 30.06.2011 is showing the Group as a whole, without distinguishing between continued and discontinued operations.

8Sevan Marine ASAInterim Financial Statements SEVAN MARINE ASA
INTERIM FINANCIAL REPORT
First half 2012
CONDENSED CONSOLIDATED STATEMENT OF CHANGES IN EQUITY Share Share Retained Non-controlling TotalUnaudited figures in USD million Capital Premium Earnings Interest EquityEquity as of December 31, 2011 34.6 21.0 66.9 0.8 123.3Total comprehensive income for the period 15 .8 0 .4 16 .2Equity as of June 30, 2012 34.6 21.0 82.7 1.2 139.6 Equity as of December 31, 2010 16.6 954.1 -162.7 0.7 808.8Adjustment Opening Balance due to deconsolidation of Sevan Drilling 6 .2 6 .2Value of share options 0 .9 0 .9Total comprehensive income for the period -689 .8 -689 .8Equity as of June 30, 2011 16.6 954.1 -845.4 0.7 126.1
KEY FIGURES Unaudited figures in USD million Note Q2 12 Q1 12 30.06.12 Q2 11 30.06.11 2011 Basic earnings per share (USD) From continued operations 1 0 .21 0 .23 0 .44 -0 .56 -0 .57 -0 .84From discontinued operations -0 .07 -0 .08 -0 .15 -0 .66 -0 .75 -0 .70 Diluted earnings per share (USD) From continued operations 2 0 .21 0 .23 0 .44 -0 .56 -0 .57 -0 .84From discontinued operations -0 .07 -0 .08 -0 .15 -0 .66 -0 .75 -0 .70 Equity ratio 3 21 .5 % 21 .8 % 21 .5 % 10 .4 % 10 .4 % 21 .2 % No . of outstanding shares (million) 52 .6 52 .6 52 .6 526 .1 526 .1 526 .1No . of shares fully diluted (million) 52 .6 52 .6 52 .6 526 .1 526 .1 526 .1Average no . of outstanding shares (million) 52 .6 52 .6 52 .6 526 .1 526 .1 483 .2Average no . of shares fully diluted (million) 52 .6 52 .6 52 .6 526 .1 526 .1 483 .2 Share price (NOK) 11 .5 15 .9 11 .5 0 .39 0 .39 8 .33Market capitalization (NOK, million) 4 605 836 605 205 205 438 Number of employees 162 156 162 305 305 166
Notes
a) Net profit / average no . of outstanding shares
b) Net profit / average no . of shares fully diluted
c) (Total shareholders’ equity / total assets) x 100
d) Latest quoted share price of the reporting period x no . of outstanding shares

9SEVAN MARINE ASA
INTERIM FINANCIAL REPORT
First half 2012
NOTE 1 GENERAL ACCOUNTING PRINCIPLES
Sevan Marine ASA is specializing in design, engineering and project execution of floating units for offshore applications .
Sevan Marine ASA is a public limited company, incorporated and domiciled in Norway . The condensed consolidated interim financial statements consist of the Group and the Group’s interests in associated companies .
The Group prepares its financial statements in accordance with International Financial Reporting Standards (IFRS) and these financial statements have been prepared in accordance with the International Accounting Standard for Interim Financial Reporting (IAS 34) . As the interim financial statements do not include the full information and disclosures as required in the annual financial statements, it should be read in connection with the Annual Financial Statements for 2011 .
The accounting policies adopted in the preparation of the interim financial statements are consistent with those followed in the preparation of the Annual Financial Statements for the year ended December 31, 2011 .
NOTES TO THE INTERIM CONSOLIDATED FINANCIAL STATEMENTS

10Sevan Marine ASANotes to the Financial Statements SEVAN MARINE ASA
INTERIM FINANCIAL REPORT
First half 2012
NOTE 2 PROPERTY, PLANT AND EQUIPMENT
The Group’s main group of non-current assets relate to those classified as Sevan Capital Assets on the balance sheet . The table below summarizes changes to the balance sheet values of such assets for the full year of 2011 and as per June 30, 2012 .
Property, Plant and Equipment Sevan Drilling FPSO Total Capital Discontinued Discontinued Capital Unaudited figures in USD million Assets operations operations Assets
Year ended December 31, 2011:
Book value January 1, 167.2 990.0 988.4 2,145.6Assets reclas . From “Other Fixed Assets” to “Discontinued FPSO” 0 .0 0 .0 31 .4 31 .4Additions 1 .2 18 .0 122 .1 141 .3Disposals 0 .0 -995 .7 -344 .0 -1,339 .7Depreciation charge 0 .0 -12 .3 -37 .3 -49 .6Write-down -76 .4 0 .0 -413 .4 -489 .8Book value December 31, 92.0 0.0 347.3 439.3
At December 31, 2011: Cost 173 .0 1,051 .4 1,247 .1 2,471 .5Assets reclas . From “Other Fixed Assets” to “Discontinued FPSO” 0 .0 0 .0 31 .4 31 .4Accumulated disposals 0 .0 -995 .7 -344 .0 -1,339 .7Accumulated depreciation and write-down -81 .0 -55 .7 -587 .2 -723 .9Book value December 31, 92.0 0.0 347.3 439.3
Sevan Drilling FPSO Total Capital Discontinued Discontinued Capital Unaudited figures in USD million Assets operations operations Assets
Period ended June 30, 2012:
Book value January 1, 92.0 0.0 347.3 439.3Additions 0 .0 0 .0 47 .0 47 .0Depreciation charge 0 .0 0 .0 0 .0 0 .0Write-down 0 .0 0 .0 0 .0 0 .0Book value June 30, 92.0 0.0 394.3 486.3 At June 30, 2012: Cost 173 .0 0 .0 1,294 .0 1,467 .0Accumulated depreciation 0 .0 0 .0 -171 .9 -171 .9Accumulated write-down -81 .0 0 .0 -383 .9 -464 .9Accumulated disposal 0 .0 0 .0 -344 .0 -344 .0Book value June 30, 92.0 0.0 394.3 486.3

11Sevan Marine ASANotes to the Financial Statements SEVAN MARINE ASA
INTERIM FINANCIAL REPORT
First half 2012
NOTE 4 SEGMENT INFORMATION
Segments
Topside and Drilling Adjustments
Quarterly data Floating Process (discontinued and
Production Technology Corporate operation) eliminations Total
Q2 12 Q2 11 Q2 12 Q2 11 Q2 12 Q2 11 Q2 12 Q2 11 Q2 12 Q2 11 Q2 12 Q2 11
External revenue 15 .7 15 .8 4 .5 0 .8 3 .5 14 .8 0 .0 0 .0 0 .0 0 .7 23 .7 32 .1
Internal revenue 0 .0 0 .0 0 .3 0 .3 2 .6 5 .8 0 .0 0 .0 -2 .8 -6 .0 0 .0 0 .0
Total revenue 15.7 15.8 4.8 1.1 6.1 20.5 0.0 0.0 -2.8 -5.3 23.7 32.1
Operating expense -3 .3 -4 .9 -4 .0 -0 .6 -8 .1 -21 .4 0 .0 0 .0 2 .2 3 .7 -13 .3 -23 .1
EBITDAFX 12.4 10.9 0.8 0.6 -2.1 -0.9 0.0 0.0 -0.7 -1.6 10.4 9.0
Foreign exch . gain/(loss), operation 0 .0 -0 .1 0 .1 0 .1 1 .0 -0 .8 0 .0 0 .0 0 .0 0 .0 1 .2 -0 .9
EBITDA 12.4 10.8 0.8 0.6 -1.0 -1.7 0.0 0.0 -0.6 -1.6 11.6 8.1
Depreciation, amortization and impairment 0 .0 -58 .1 0 .0 0 .0 -0 .2 -0 .5 0 .0 0 .0 0 .0 -0 .4 -0 .2 -59 .1
Operating profit/(loss) 12.4 -47.3 0.8 0.6 -1.2 -2.2 0.0 0.0 -0.6 -2.0 11.4 -50.9
Income from associates 0 .0 1 .9
Financial income/(expense) 0 .9 -209 .7
Foreign exch . gain/(loss), financing -1 .3 -0 .2
Net financial items -0.4 -207.9
Profit/(loss) before tax 11.0 -258.8
Tax income/(expense) 0 .0 -34 .3
Net profit/(loss) continued operation 11.0 -293.1
Net profit/(loss) discontined operation -3.5 -346.0
Segment assets continued operation 491 .1 1,351 .8 34 .8 39 .9 829 .6 1,527 .9 0 .0 0 .0 -1,159 .0 -1,847 .6 196 .5 1,072 .0
Segment assets discontinued operation 447 .5 0 .0 0 .0 0 .0 0 .0 0 .0 0 .0 0 .0 0 .0 0 .0 447 .5 0 .0
Inv .m . in assoc . (equity method) 0 .0 0 .0 0 .0 0 .0 0 .0 143 .3 0 .0 0 .0 0 .0 0 .0 0 .0 143 .3
Total assets* 938.6 1,351.8 34.8 39.9 829.6 1,671.2 0.0 0.0 -1,159.0 -1,847.6 644.0 1,215.3
Segment liabilities continued operation 157 .3 918 .9 7 .5 9 .0 96 .1 897 .9 0 .0 0 .0 -211 .8 -736 .7 49 .1 1,089 .1
Segment liabilities discontinued operation 261 .9 0 .0 0 .0 0 .0 193 .4 0 .0 0 .0 0 .0 0 .0 0 .0 455 .3 0 .0
Total liabilities* 419.2 918.9 7.5 9.0 289.6 897.9 0.0 0.0 -211.8 -736.7 504.4 1,089.1
Capital expenditure 26 .3 38 .7 0 .0 0 .0 0 .0 0 .0 0 .0 0 .0 0 .0 0 .0 26 .3 38 .7
Non-cash exp . other than depr . 0 .0 0 .0 0 .0 0 .0 0 .0 0 .0 0 .0 0 .0 0 .0 0 .0 0 .0 0 .0
* For assets and liabilities are intra-segment balances eliminated within the segment, whilst inter-segment balances are eliminated in the elimination section.
NOTE 3 RELATED PARTY TRANSACTIONS
The Group has the following transactions and balances relating to related party transactions:
Unaudited figures in USD million Q2 2012 YTD 2012
Sale to related party Sale to Teekay 2 .9 5 .5Financial income from Teekay 0 .0 0 .0 Receivable from related party Receivable from Teekay 2 .5 2 .5 Payable to related party Payable to Teekay 1 .8 1 .8
Sale to Teekay mainly relates to sale of services/man-hours .

12Sevan Marine ASANotes to the Financial Statements SEVAN MARINE ASA
INTERIM FINANCIAL REPORT
First half 2012
Segments
Topside and Drilling Adjustments
YTD data Floating Process (discontinued and
Production Technology Corporate operation) eliminations Total
30 .06 .12 30 .06 .11 30 .06 .12 30 .06 .11 30 .06 .12 30 .06 .11 30 .06 .12 30 .06 .11 30 .06 .12 30 .06 .11 30 .06 .12 30 .06 .11
External revenue 32 .1 31 .2 9 .0 3 .7 7 .0 16 .9 0 .0 0 .0 0 .0 0 .7 48 .1 52 .5
Internal revenue 0 .0 0 .0 0 .4 0 .7 5 .3 11 .9 0 .0 0 .0 -5 .7 -12 .1 0 .0 0 .5
Total revenue 32.1 31.2 9.4 4.4 12.3 28.7 0.0 0.0 -5.7 -11.4 48.2 52.9
Operating expense -6 .3 -7 .6 -8 .4 -4 .4 -15 .6 -37 .7 0 .0 0 .0 4 .4 8 .3 -25 .9 -41 .4
EBITDAFX 25.8 23.5 1.1 0.0 -3.3 -8.9 0.0 0.0 -1.3 -3.0 22.3 11.5
Foreign exch . gain/(loss), operation 0 .0 -0 .4 0 .1 0 .1 0 .0 -2 .5 0 .0 0 .0 0 .0 0 .0 0 .1 -2 .7
EBITDA 25.7 23.2 1.2 0.1 -3.3 -11.4 0.0 0.0 -1.3 -3.0 22.4 8.9
Depreciation, amortization and impairment 0 .0 -58 .2 0 .0 -0 .1 -0 .5 -1 .1 0 .0 0 .0 0 .0 -0 .4 -0 .6 -59 .8
Operating profit/(loss) 25.7 -35.0 1.1 0.0 -3.8 -12.5 0.0 0.0 -1.3 -3.4 21.8 -50.9
Income from associates 0 .0 1 .9
Financial income/(expense) 1 .1 -213 .1
Foreign exch . gain/(loss), financing 0 .4 -0 .1
Net financial items 1.5 -211.2
Profit/(loss) before tax 23.3 -262.1
Tax income/(expense) 0 .0 -37 .4
Net profit/(loss) continued operation 23.3 -299.5
Net profit/(loss) discontined operation -7.7 -392.9
Segment assets continued operation 491 .1 1,351 .8 34 .8 39 .9 829 .6 1,527 .9 0 .0 0 .0 -1,159 .0 -1,847 .6 196 .5 1,072 .0
Segment assets discontinued operation 447 .5 0 .0 0 .0 0 .0 0 .0 0 .0 0 .0 0 .0 0 .0 0 .0 447 .5 0 .0
Inv .m . in assoc . (equity method) 0 .0 0 .0 0 .0 0 .0 0 .0 143 .3 0 .0 0 .0 0 .0 0 .0 0 .0 143 .3
Total assets* 938.6 1,351.8 34.8 39.9 829.6 1,671.2 0.0 0.0 -1,159.0 -1,847.6 644.0 1,215.3
Segment liabilities continued operation 157 .3 918 .9 7 .5 9 .0 96 .1 897 .9 0 .0 0 .0 -211 .8 -736 .7 49 .1 1,089 .1
Segment liabilities discontinued operation 261 .9 0 .0 0 .0 0 .0 193 .4 0 .0 0 .0 0 .0 0 .0 0 .0 455 .3 0 .0
Total liabilities* 419.2 918.9 7.5 9.0 289.6 897.9 0.0 0.0 -211.8 -736.7 504.4 1,089.1
Capital expenditure 47 .0 65 .7 0 .0 0 .0 0 .0 0 .6 0 .0 19 .0 0 .0 -1 .0 47 .0 84 .2
Non-cash exp . other than depr . 0 .0 0 .0 0 .0 0 .0 0 .0 0 .8 0 .0 0 .0 0 .0 0 .0 0 .0 0 .8
* For assets and liabilities are intra-segment balances eliminated within the segment, whilst inter-segment balances are eliminated in the elimination section

13Sevan Marine ASANotes to the Financial Statements SEVAN MARINE ASA
INTERIM FINANCIAL REPORT
First half 2012
NOTE 5 SHAREHOLDER STRUCTURE
The 20 largest shareholder accounts as at August 20, 2012 Shareholder accounts No. of shares %-shareTEEKAY SERVICE HOLDI 21,091,847 40 .09 GOLDMAN SACHS INT . - 2,721,549 5 .17 F2 FUNDS AS 1,490,000 2 .83 SKAGEN VEKST 992,928 1 .89 MP PENSJON PK 837,584 1 .59 BNYM AS EMEA ASIA 25 756,734 1 .44 TVETERAAS EIENDOMSSE 722,500 1 .37 EUROCLEAR BANK S .A ./ 648,481 1 .23 MIDELFART INVEST AS 495,000 0 .94 CITIBANK NA NEW YORK 446,164 0 .85 DALSETH INVEST AS 430,000 0 .82 GOLDMAN SACHS & CO - 404,884 0 .77 DNB NOR SMB VPF 400,805 0 .76 PREDATOR CAPITAL MAN 385,000 0 .73 MIDTCO INVEST AS 325,000 0 .62 UMOE SHIPPING AND EN 312,500 0 .59 CONMAR AS 307,111 0 .58 UBS AG, LONDON BRANC 305,270 0 .58 JPMORGAN CHASE 300,052 0 .57 BAKLIEN ÅSMUND 300,000 0 .57 Total, 20 largest shareholder accounts 33,673,409 64.01 Total no . of shares 52,606,999 Foreign ownership 29,910,220 56 .86
14Sevan Marine ASANotes to the Financial Statements SEVAN MARINE ASA
INTERIM FINANCIAL REPORT
First half 2012
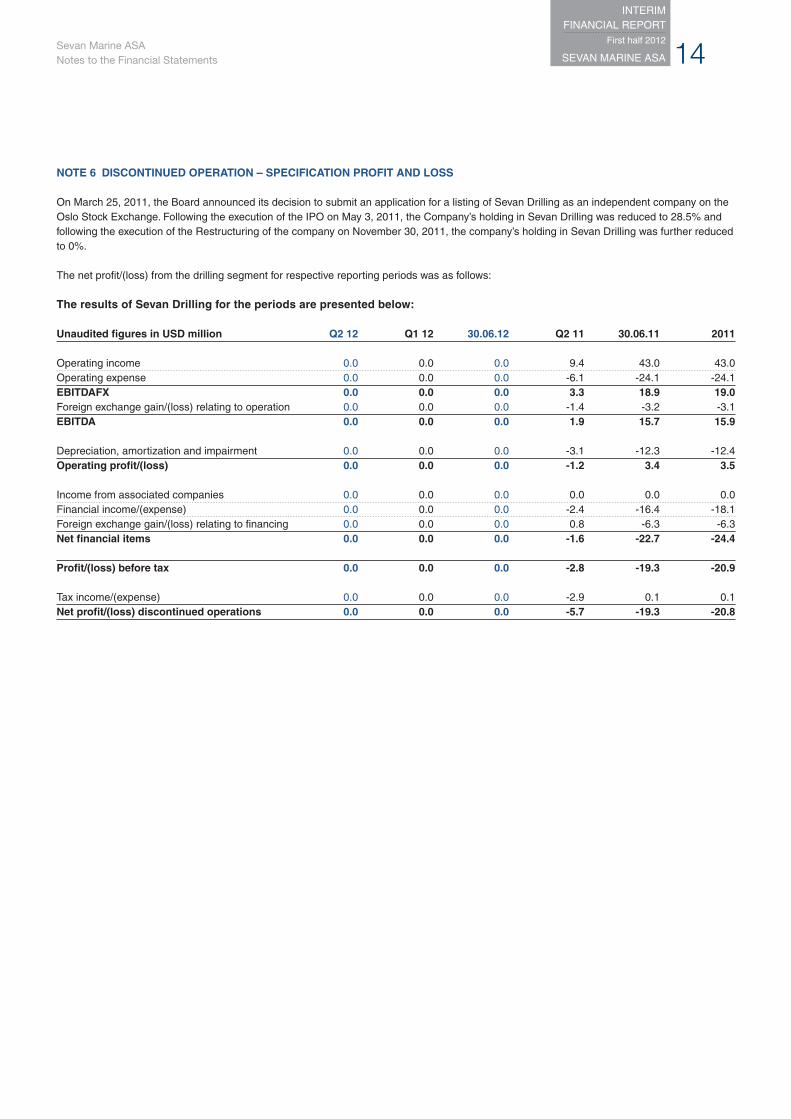
NOTE 6 DISCONTINUED OPERATION – SPECIFICATION PROFIT AND LOSS
On March 25, 2011, the Board announced its decision to submit an application for a listing of Sevan Drilling as an independent company on the Oslo Stock Exchange . Following the execution of the IPO on May 3, 2011, the Company’s holding in Sevan Drilling was reduced to 28 .5% and following the execution of the Restructuring of the company on November 30, 2011, the company’s holding in Sevan Drilling was further reduced to 0% .
The net profit/(loss) from the drilling segment for respective reporting periods was as follows:
The results of Sevan Drilling for the periods are presented below:
Unaudited figures in USD million Q2 12 Q1 12 30.06.12 Q2 11 30.06.11 2011 Operating income 0 .0 0 .0 0 .0 9 .4 43 .0 43 .0Operating expense 0 .0 0 .0 0 .0 -6 .1 -24 .1 -24 .1EBITDAFX 0.0 0.0 0.0 3.3 18.9 19.0Foreign exchange gain/(loss) relating to operation 0 .0 0 .0 0 .0 -1 .4 -3 .2 -3 .1EBITDA 0.0 0.0 0.0 1.9 15.7 15.9 Depreciation, amortization and impairment 0 .0 0 .0 0 .0 -3 .1 -12 .3 -12 .4Operating profit/(loss) 0.0 0.0 0.0 -1.2 3.4 3.5 Income from associated companies 0 .0 0 .0 0 .0 0 .0 0 .0 0 .0Financial income/(expense) 0 .0 0 .0 0 .0 -2 .4 -16 .4 -18 .1Foreign exchange gain/(loss) relating to financing 0 .0 0 .0 0 .0 0 .8 -6 .3 -6 .3Net financial items 0.0 0.0 0.0 -1.6 -22.7 -24.4 Profit/(loss) before tax 0.0 0.0 0.0 -2.8 -19.3 -20.9 Tax income/(expense) 0 .0 0 .0 0 .0 -2 .9 0 .1 0 .1Net profit/(loss) discontinued operations 0.0 0.0 0.0 -5.7 -19.3 -20.8
15Sevan Marine ASANotes to the Financial Statements SEVAN MARINE ASA
INTERIM FINANCIAL REPORT
First half 2012
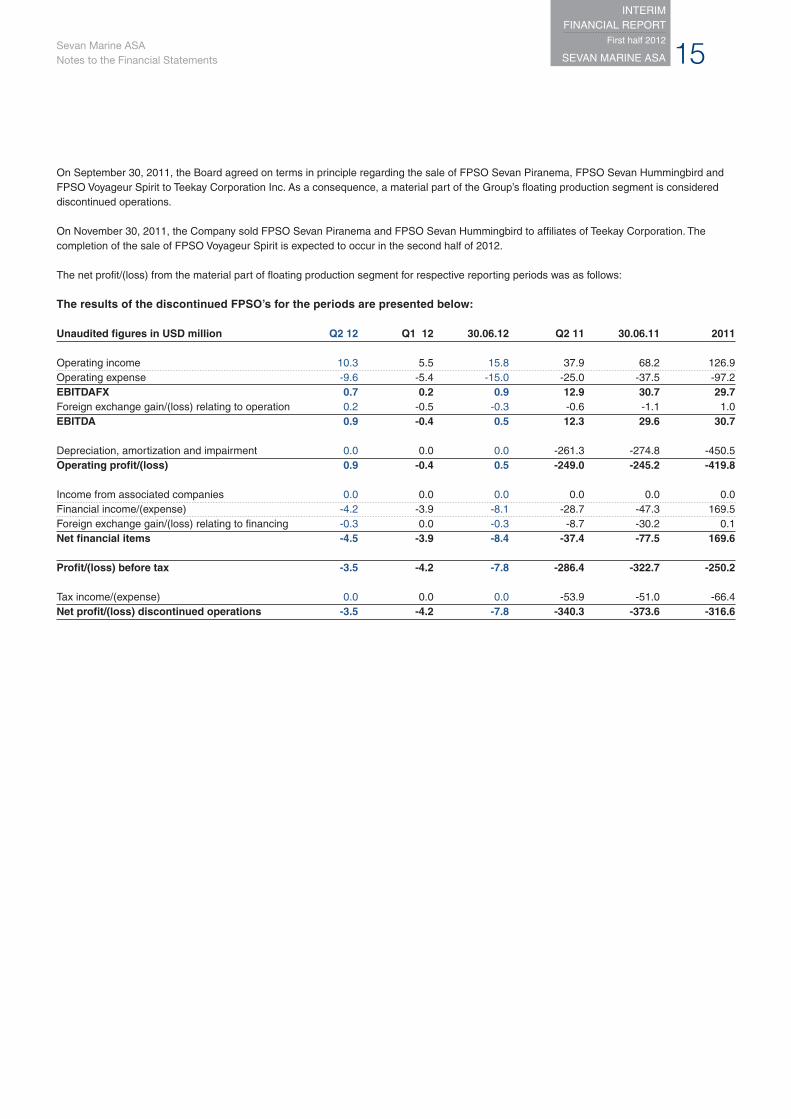
On September 30, 2011, the Board agreed on terms in principle regarding the sale of FPSO Sevan Piranema, FPSO Sevan Hummingbird and FPSO Voyageur Spirit to Teekay Corporation Inc . As a consequence, a material part of the Group’s floating production segment is considered discontinued operations .
On November 30, 2011, the Company sold FPSO Sevan Piranema and FPSO Sevan Hummingbird to affiliates of Teekay Corporation . The completion of the sale of FPSO Voyageur Spirit is expected to occur in the second half of 2012 .
The net profit/(loss) from the material part of floating production segment for respective reporting periods was as follows:
The results of the discontinued FPSO’s for the periods are presented below:
Unaudited figures in USD million Q2 12 Q1 12 30.06.12 Q2 11 30.06.11 2011 Operating income 10 .3 5 .5 15 .8 37 .9 68 .2 126 .9Operating expense -9 .6 -5 .4 -15 .0 -25 .0 -37 .5 -97 .2EBITDAFX 0.7 0.2 0.9 12.9 30.7 29.7Foreign exchange gain/(loss) relating to operation 0 .2 -0 .5 -0 .3 -0 .6 -1 .1 1 .0EBITDA 0.9 -0.4 0.5 12.3 29.6 30.7 Depreciation, amortization and impairment 0 .0 0 .0 0 .0 -261 .3 -274 .8 -450 .5Operating profit/(loss) 0.9 -0.4 0.5 -249.0 -245.2 -419.8 Income from associated companies 0 .0 0 .0 0 .0 0 .0 0 .0 0 .0Financial income/(expense) -4 .2 -3 .9 -8 .1 -28 .7 -47 .3 169 .5Foreign exchange gain/(loss) relating to financing -0 .3 0 .0 -0 .3 -8 .7 -30 .2 0 .1Net financial items -4.5 -3.9 -8.4 -37.4 -77.5 169.6 Profit/(loss) before tax -3.5 -4.2 -7.8 -286.4 -322.7 -250.2 Tax income/(expense) 0 .0 0 .0 0 .0 -53 .9 -51 .0 -66 .4Net profit/(loss) discontinued operations -3.5 -4.2 -7.8 -340.3 -373.6 -316.6

16Sevan Marine ASANotes to the Financial Statements SEVAN MARINE ASA
INTERIM FINANCIAL REPORT
First half 2012
NOTE 7 DISCONTINUED OPERATION – SPECIFICATION BALANCE SHEET
The major classes of assets and liabilities of FPSO’s classified as held for sale at 30 June 2012 are as follows: Unaudited figures in USD million 30 .06 .12
AssetsSevan Capital Assets 394 .3Other fixed assets 0 .0Intangible assets 0 .0Investments in associates 0 .0Deferred income tax assets 0 .0Other non-current assets 0 .0Total non-current assets 394.3 Inventories 0 .0Trade and other receivables 16 .4Available for sale financial instruments 0 .0Cash and cash equivalents 36 .8Total current assets 53.2 Total assets classified as held for sale 447.5 Liabilities Interest-bearing debt 0 .0Retirement benefit obligations 0 .0Other non-current liabilities/provisions 8 .6Total non-current liabilities 8.6 Interest-bearing debt 423 .3Current liabilities 23 .2Total current liabilities 446.6 Total liabilities directly associated with assets classified as held for sale 455.3

17Sevan Marine ASANotes to the Financial Statements SEVAN MARINE ASA
INTERIM FINANCIAL REPORT
First half 2012
NOTE 8 EVENTS AFTER BALANCE SHEET DATE
Following more than a year of front end engineering and development work, Sevan Marine has been chosen by Dana Petroleum for the Western Isles development project . Final agreements are subject to field approval from UK offshore authorities . The Western Isles project consists of two oil field called Harris and Barra in the UK Northern North Sea and east of Shetland .
On the date of this report the Investec facility has been settled in full .
In mid-August 2012 Sevan Drilling ASA announced that they are in temporary breach of a liquidity covenant in the Sevan Brasil bank financing agreement . As stated in the 2011 Annual Report, Sevan Marine remains liable under a guarantee for the Sevan Brasil financing . Sevan Drilling has advised that it is in close dialogue with the relevant lenders and that the breach is expected to be corrected shortly .
18Sevan Marine ASANotes to the Financial Statements SEVAN MARINE ASA
INTERIM FINANCIAL REPORT
First half 2012
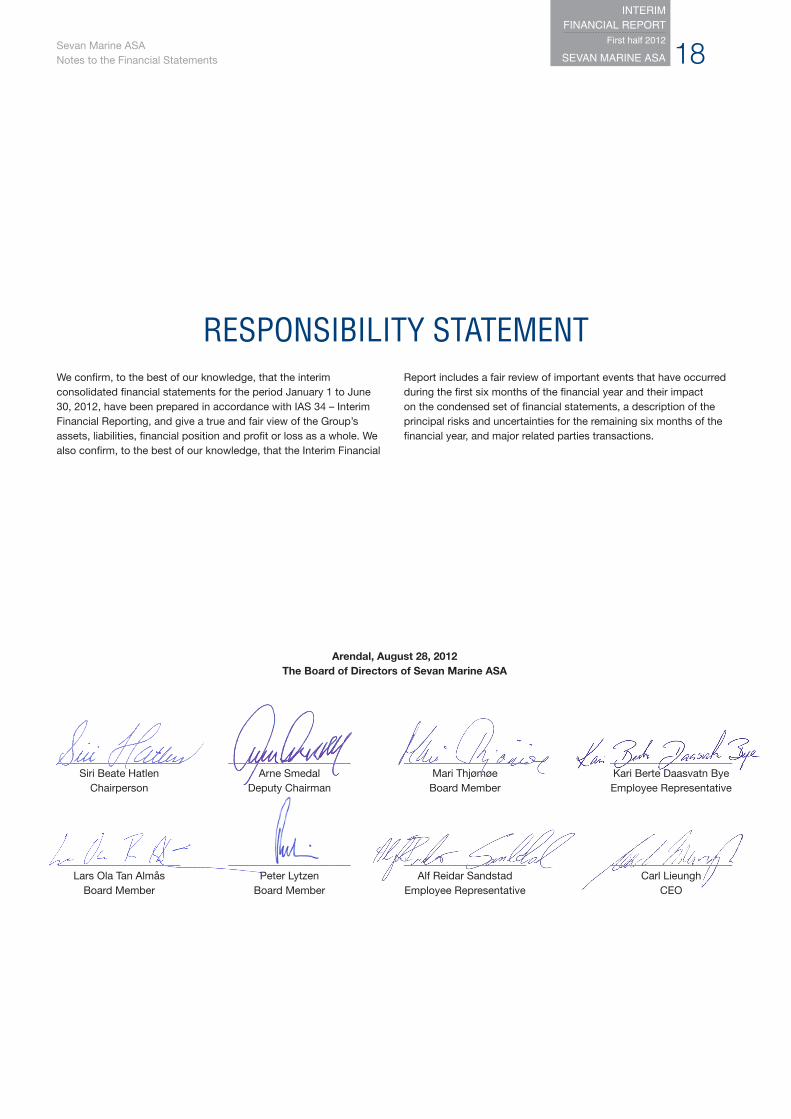
We confirm, to the best of our knowledge, that the interim consolidated financial statements for the period January 1 to June 30, 2012, have been prepared in accordance with IAS 34 – Interim Financial Reporting, and give a true and fair view of the Group’s assets, liabilities, financial position and profit or loss as a whole. We also confirm, to the best of our knowledge, that the Interim Financial
Report includes a fair review of important events that have occurred during the first six months of the financial year and their impact on the condensed set of financial statements, a description of the principal risks and uncertainties for the remaining six months of the financial year, and major related parties transactions.
RESPONSIBILITY STATEMENT
Arendal, August 28, 2012 The Board of Directors of Sevan Marine ASA
_______________________ _______________________ _______________________ _______________________ Siri Beate Hatlen Arne Smedal Mari Thjømøe Kari Berte Daasvatn Bye Chairperson Deputy Chairman Board Member Employee Representative
_______________________ _______________________ _______________________ _______________________ Lars Ola Tan Almås Peter Lytzen Alf Reidar Sandstad Carl Lieungh Board Member Board Member Employee Representative CEO
19SEVAN MARINE ASA
INTERIM FINANCIAL REPORT
First half 2012
Sevan Marine ASA - Arendal Kittelsbuktveien 5
4836 Arendal
NORWAY
Phone: (+47) 37 40 40 00
Fax: (+47) 37 40 40 99
Sevan Marine - OsloNye Vakås vei 80
1395 Hvalstad
NORWAY
Phone: (+47) 64 00 18 00
Fax: (+47) 64 00 18 01
Sevan Marine - Singapore 350 Orchard Road
Shaw House # 15-18
SINGAPORE 238868
Phone: (+65) 62 20 13 14
Fax: (+65) 62 20 13 15
KANFA ASSevan Marine ASA - OsloNye Vakås vei 80
1395 Hvalstad
NORWAY
Phone: (+47) 64 00 18 00
Fax: (+47) 64 00 18 01
KANFA Mator ASTormod Gjestlandsvei 16
3936 Porsgrunn
NORWAY
Phone: (+47) 35 57 49 00
KANFA Aragon AS/Sevan Marine - BergenFantoftveien 42
5072 Bergen
NORWAY
Phone: (+47) 37 40 40 00
Fax: (+47) 37 40 40 99