gulf keystone petroleum · volume estimates as at 31 december 2016 (12.9 mmstb production in 2017)...
TRANSCRIPT

Gulf Keystone Petroleum Corporate Presentation
September 2018

Disclaimer
2
This proprietary presentation (the “Presentation”) has been prepared by Gulf Keystone Petroleum Limited (the “Company”).
Under no circumstances may this presentation be deemed to be an offer to sell, a solicitation to buy or a solicitation of an offer to buy securities of any kind in any jurisdiction where such an offer,solicitation or sale should require registration, qualification, notice, disclosure or application under the securities laws and regulations of any such jurisdiction.
This Presentation has not been independently verified and contains summary information only and does not purport to be comprehensive and is not intended to be (and should not be used as) thesole basis of any analysis or other evaluation. No representation or warranty (express or implied) is made as to, and no reliance should be placed on, the accuracy, completeness or fairness of theinformation contained in this Presentation, including projections, estimates, targets and opinions, contained herein, and no liability whatsoever is accepted as to any errors, omissions ormisstatements contained herein. To the extent available, the industry, market and competitive position data contained in this Presentation has come from official or third party sources. Third partyindustry publications, studies and surveys generally state that the data contained therein have been obtained from sources believed to be reliable, but that there is no guarantee of the accuracy orcompleteness of such data. While the Company believes that each of these publications, studies and surveys has been prepared by a reputable source, the Company has not independentlyverified the data contained therein. In light of the foregoing, no reliance may be or should be placed on any of the industry, market or competitive position data contained in this Presentation.
The information in the Presentation may include statements that are, or may be deemed to be, forward-looking statements regarding future events and the future results of the Company that arebased on current expectations, estimates, forecasts and projections about the industry in which the Company operates and the beliefs, assumptions and predictions about future events of themanagement of the Company. In particular, among other statements, certain statements with regard to management objectives, trends in results of operations, margins, costs and riskmanagement are forward-looking in nature. Forward-looking information and forward-looking statements (collectively, the “forward looking statements”) are based on the Company’s internalexpectations, estimates, projections assumptions and beliefs as at the date of such statements or information including management’s assessment of the Company’s future financial performance,plans, capital expenditures, potential acquisitions and operations concerning, among other things, future operating results from targeted business and development plans and various componentsthereof or the Company’s future economic performance. The projections, estimates and beliefs contained in such forward-looking statements necessarily involve known and unknown risks,assumptions, uncertainties and other factors which may cause the Company’s actual performance and financial results in future periods to differ materially from any estimates or projectionscontained herein. When used in this Presentation, the words “expects,” “anticipates,” “believes,” “plans,” “may,” “will,” “should”, “targeted”, “estimated” and similar expressions, and the negativesthereof, whether used in connection with financial performance forecasts, expectation for development funding or otherwise, are intended to identify forward-looking statements. Such statementsare not promises or guarantees, and are subject to risks and uncertainties that could cause actual outcomes to differ materially from those suggested by any such statements and the risk that thefuture benefits and anticipated production by the Company may be adversely impacted. These forward-looking statements speak only as of the date of this Presentation.
In the view of the Company’s management, this Presentation was prepared by management on a reasonable basis, reflects the best currently available estimates and judgements. However, suchforward-looking statements are not fact and should not be relied upon as being necessarily indicative of future results. The Company expressly disclaims any obligation or undertaking to releasepublicly any updates or revisions of the information, opinions or any forward-looking statement contained herein to reflect any change in its expectations with regard thereto or any change inevents, conditions or circumstances on which any forward looking statement is based except as required by applicable securities laws.
This Presentation contains non-International Financial Reporting Standards (“IFRS”) industry benchmarks and terms such as “EBITDA”. The non-IFRS financial measures do not have anystandardized meaning and therefore are unlikely to be comparable to similar measures presented by other companies. The Company uses the foregoing measures to help evaluate itsperformance. As an indicator of the Company's performance, these measures should not be considered as an alternative to, or more meaningful than, measures of performance as determined inaccordance with IFRS. The Company believes these measures to be key measures as they demonstrate the Company's underlying ability to generate the cash necessary to fund operations andsupport activities related to its major assets.
By reading or accessing the Presentation you acknowledge that you will be solely responsible for your own assessment of the market and the market position of the Company and that you willconduct your own analysis and be solely responsible for forming your own view of the potential future performance of the Company's business. Recipients should not construe the contents of thisPresentation as legal, tax, regulatory, financial or accounting advice and are urged to consult with their own advisers in relation to such matters. The Presentation speaks as of the date hereof.The information included in this Presentation may be subject to updating, completion, revision and amendment and such information may change materially. No person is under any obligation toupdate or keep current the information contained in the Presentation and any opinions expressed relating thereto are subject to change without notice.

Corporate Overview1
Shaikan Field2
Financial Review 3
Appendix4

1) Market cap as at 25 September 2018. US$/GBP = 1.322) Working interest subject to reduction post government back-in following implementation of 2nd Shaikan PSC amendment 3) Source: ERC Equipoise CPR. Volume estimates as at 31 December 2016 (12.9 MMstb production in 2017)4) Net reserves adjusted for 2017 actual production and calculated on diluted working interest of 58% as per CPR5) Cash position as at 7 September 2018 6) Well locations and license boundary on the map are approximate
A leading Kurdistan independent oil & gas company
4
• Kurdistan focused independent E&P company– Listed on the main board of the London Stock Exchange – $875m1) market cap
• 80% working interest2) and operatorship of Shaikan, one of the largest fields in Kurdistan– Net 2P reserves of 349 MMstb4) and 2C of 138 MMstb
• Significant growth potential at Shaikan– Targeting a 38% increase of nameplate production capacity
from 40,000 to 55,000 bopd during H2 2019– Further development of Jurassic with ramp-up to 75,000
bopd; then full field up to 110,000 bopd, including Triassic
• Strong balance sheet –$140m5) net cash– Cash and cash equivalents of $240m5)
– $100m of bond debt outstanding
GKP is the only pure-play Kurdistan player with operatorship
Introduction to Gulf Keystone Petroleum
Shaikan field6)
Shaikan key information
• Gulf Keystone interest: 80% (58%2))
• Partner: MOL 20%
• Discovered: August 2009
• Production start: July 2013
• 2018 prod. guidance: 27– 32 kbopd gross
• 2P reserves: 615 MMstb3) gross
• 2C resources: 239 MMstb3) gross
• Costs to date: >$1.0bn gross

Management team with proven track recordSenior management team profiles
Experienced management team
Jón FerrierCEO• Joined in May 2015
• Previous Senior Vice President in Maersk oil
• Senior leadership positions in a number of ‘blue chip’ oil & gas companies
• MSc at Imperial College
• Highly experienced management team– Strong team with extensive and complementary skill sets and
expertise (technical, commercial and financial) to deliver the next phases of growth
– Extensive regional (MENA) experience– Background from blue-chip IOCs including: ConocoPhillips,
Total, Maersk Oil, Hess and other companies
• Focus on proper corporate governance; close collaboration between board of directors and senior management to execute company strategy
• Continuous cost optimisation (both opex and G&A)• Strong in-country operational team with track record of
project delivery
Renewed, fit-for-purpose and cohesive team to deliver the potential of Shaikan
Gabriel Papineau-Legris Commercial Director• Joined in September 2016
• 10 years of experience in upstream oil & gas
• Private equity at Lime Rock
• Investment banking at Merrill Lynch and Perella Weinberg
Stuart CatterallCOO• Joined in January 2017
• Independent consultant for PA Resources, EnQuest and Petroceltic
• Senior leadership roles with Amerada Hess, BHP Billiton and Celtique Energy
• MSc at Imperial College
Bertrand DemontCountry Manager Kurdistan• Joined in September 2017
• 18 years experience within the oil & gas sector
• Isarene Project Director at Petroceltic
• Previous roles at Hess, BHP Billiton and Total
Sami ZouariCFO• Joined in January 2015
• Regional Head of Corporate & Investment Banking for North Africa and Middle East at BNP Paribas
• Multiple positions in Total
• Master’s at Harvard and BA at Columbia University
Alasdair RobinsonLegal Director & Company Secretary• Joined in June 2017
• Previously at Melrose Resources and Petroceltic
• 8 years corporate finance with Noble
• Qualified solicitor and notary public, MBA graduate
Organisation dedicated to operate Shaikan
• Total of ca.300 personnel including national staff, expats and contractors in the Kurdistan Region of Iraq– ca.280 based in Kurdistan
• Outstanding HSSE performance – 1 LTI in 3 years• High plant uptime (99%) achieved consistently
5

Sep-15Start of regular
monthly export payments
The Gulf Keystone history in Kurdistan
6
Nov-07:Shaikan
PSC awarded
Nov-101st domestic
sales
Apr-09Shaikan-1 discovery
Aug-12Declaration
of commerciality
Jan-13/Jun-13FDP
submission/ approval
Dec-13Crude
exports to Turkey by
trucks
Jul-13Commercial production
Jan-18Crude oil
sales agreement
signed
Dec-1440,000 bopd production
first achieved
Shaikan gross 2P reserves (MMstb) Shaikan gross production (bopd) GKP net operating cash flow (US$m)
(60)
(40)
(20)
-
20
40
60
80
100
2014 2015 2016 2017-
5,000
10,000
15,000
20,000
25,000
30,000
35,000
40,000
2014 2015 2016 2017-
100
200
300
400
500
600
700
Dec 13 Sep 15 June 16 Dec 16
2P Cuml. prod.
Jan-15Start of
executive team and board
reconstruction
Oct-16Completion of restructuring
Jun-18Expansion to 55,000 bopd
initiated

Overview of Kurdistan Region of IraqHighly prolific oil province
Kurdistan – a proven oil region
7
• Kurdistan is the only semi-autonomous, constitutionally recognised, political region in Iraq
• Relatively young oil & gas industry – first PSCs awarded in 2004
• Accessible to international oil companies –including super-majors ExxonMobil, Chevron and Total
• Significant proven reserves with world class conventional resource potential
• Kurdish crude oil blend exported via pipeline to the Mediterranean coast (Ceyhan, Turkey)
– Oil exports account for almost all of Kurdistan’s budget revenues
• Regular monthly export payments to the international E&P companies from September 2015

Corporate Overview1
Shaikan Field2
Financial Review 3
Appendix4

1) Source: ERC Equipoise. Gross volume estimates as at 31 December 2016 (12.9 MMstb production in 2017)2) From 1 January 2018 to 31 August 2018 3) Working interest subject to reduction post government back-in following implementation of 2nd Shaikan PSC amendment. See further details on slide 19 4) Well locations and license boundary on the map are approximate 5) 2013 production metric for December only
Field map4)Overview
Shaikan – A large field with proven production track record
9
• Located ca.60km north-west of Erbil, the Shaikan Field is an anticline sitting at the north-west end of the Zagros Fold-belt
• One of the largest fields in Kurdistan by reserves and production– Gross 2P reserves: 615 MMstb1)
– Field extends 30km (east to west) & 10km (north to south)
– Cumulative production to date over 50 MMstb
– Steady production and pressure decline in line with reservoir understanding – no breakthrough of gas or formation water
• Production on track to meet annual guidance– YTD2): 31,743 bopd
– Plant uptime: over 99%
• Currently developed with nine production wells and two production facilities with a combined capacity of 40,000 bopd
• PF-2 pipeline connection completed in July 2018
Gross production (‘000 bopd)
7.0
17.8
30.534.8 35.3
31.9
-
10
20
30
40
2013 2014 2015 2016 2017 H1 20185)
2018 Guidance

1) Source: ERC Equipoise. Gross volume estimates as at 31 December 2016 (12.9 MMstb production in 2017)
Shaikan subsurface
10
• All production currently from fractured Jurassic carbonates reservoirs– Over 50 MMstb produced to date
• Areal extent of the Jurassic reservoirs of ca.135 sq. km
• Substantial oil column – ca.1,000m – Gravity ranging from 18° API at the top to 11° API at
the bottom
• Jurassic alone represents a giant resource base:– 2P 568 MMstb1)
– 2C 80 MMstb1)
– STOIIP: 5.5 billion barrels1)
• Dynamic data acquired to date suggest that aquifer influx is limited, compared to other fields in Kurdistan
• Recovery from the field is expected to be primarily dominated by processes associated with pressure depletion, supported by a gas cap expansion
• Production and reservoir pressure data continue to support GKP’s geological model and understanding of the field
Discovered and producing reservoirs: JurassicStructural map and section of Jurassic reservoirs

Shaikan subsurface (cont’d)
11
Upside from other reservoirs: Triassic & Cretaceous
1) Source: ERC Equipoise. Gross volume estimates as at 31 December 2016
Illustrative Shaikan cross section
BurjKhalifa
CretaceousVery heavy or bituminous oil
2P: 3 MMstb1) / 2C: 53 MMstb1)
STOIIP: 1.4 billion barrels1)
JurassicSee details on previous slide
TriassicLight oil with 38-43° API and gas condensate
2P 44 MMstb1)
2C 106 MMstb1)
STOIIP: 0.4 billion barrels1)
Dark Green = Oil Red = Gas Pink = Anhydrite Brown = Shale

1) $91m gross capex budgeted in 2018 with the remainder to be spent in 2019. Increase from previous $175-215m guidance driven by expansion of scope for tubing workovers and PF-1 pipeline2) Investment plans beyond the 55,000 bopd expansion project subject to KRG’s MNR and MOL approval
55,00075,000
110,000
Expansion to 55,000 bopd underway
12
• 4 Jurassic wells + ESPs
• ESPs on 3 existing wells
• 2 tubing workovers
• Facilities maintenance and debottlenecking; no additional processing facility required
• PF-1 pipeline tie-in
• Full development of Jurassic via infill drilling
• First development of Triassic and Cretaceous reservoirs
• Additional process train for the TriassicK
ey A
ctiv
ity2)
Cap
ex
• 4 Jurassic wells + ESPs
• ESPs on 3 existing wells
• Further debottlenecking of production facilities
• Installation of gas re-injection facility
Completion H2 2019
Realising the potential of Shaikan with a phased, risk-managed approach
• PF-1 pipeline tie-in initiated
• Phased approach de-risks and progressively unlocks value
• On track to increase Shaikan production to 55,000 bopd gross in H2 2019
• Significant work this year to further optimise the FDP
• Revised FDP has been drafted and is being finalised prior to submission later in 2018 Ti
min
g
bopdbopd
bopd
$200–230m1) gross ($160–184m net)
Capex guidance to be communicated post FDP submission

Shaikan 55,000 bopd expansion project
13
New Jurassic well location
ESP in existing well
Tubular workover
SH‐4
PF-2
SH-2 SH-5 SH-10 SH-11
SH-4 SH-7 SH-8SH-1&3
PF-1
SH‐1SH‐7
SH‐8SH‐3
SH‐11 SH‐10
SH‐2
SH‐5
SH‐6
Atrush pipeline
PF‐2 tie‐in lineoperational
PF‐1 tie‐in line route
Note: Well locations, pipeline routes and licence boundary are approximate
Temporary unloading facility at PF-2 under construction
(completion in the next month) to truck oil from PF-1 to PF-2
(instead of Fishkhabour) until PF-1 pipeline is completed mid-2019
5 km

Export route and crude marketing
14
Iraq
Syria
Iran
Turkey
• The KRG’s MNR currently controls all marketing and crude exports from Kurdistan• In January 2018, the Crude Oil Sales Agreement was signed with the KRG – a key milestone for GKP
– Under the agreement, which is in line with the agreements of other producers in the region, KRG will purchase all exported Shaikan crude at Brent minus ca.$22/bbl reflecting quality adjustments and full transportation costs
• Today, ca.45% of Shaikan production export directly via pipeline from PF-2. The remainder is trucked ca.120km to Fishkhabour where it is injected in the KEP to Ceyhan as part of the Kurdish blend– In the next month, trucking to Fishkhabour expected to cease with the construction of a temporary unloading facility
at PF-2 to inject PF-1 crude directly in the KEP
• Work has started on PF-1 pipeline construction and completion anticipated mid-2019

Corporate Overview1
Shaikan Field2
Financial Review 3
Appendix4

Continuous payments from September 2015
16
Post signed Crude Oil Sales AgreementPre signed Crude Oil Sales Agreement
$12.0
$30.4
$17.0 $17.8$14.7 $15.5
$18.9$21.2
$17.7
$0
$5
$10
$15
$20
$25
$30
$35
Jan-18 Feb-18 Mar-18 Apr-18 May-18 Jun-18 Jul-18 Aug-18 Sep-18
Sept-17 Oct / Nov-17 Dec-17 Jan-18 Feb-18 Mar-18 Apr-18 May-18 Jun-18
33.3 34.5 / 31.1 33.4 32.9 33.2 28.9 32.8 33.1 30.5
$56.2 $57.5 / $62.7 $64.4 $69.1 $65.3 $66.0 $72.1 $77.0 $74.4
Month of Production
Gross Prod. (kbopd)
Payment Received in
Brent Price1)
($/bbl)
• $107m net to GKP received in H1 2018 ($165m net YTD)
1) Source: EIA monthly prices
US$
m(n
et)

($250)
($200)
($150)
($100)
($50)
$0
$50
H1 2016 H1 2017 H1 2018
Half Year 2018 financial highlights
17
Revenue
$53m$72m
$49m $6m
$0
$20
$40
$60
$80
$100
$120
$140
H1 2016 H1 2017 H1 2018
Revenue - Cash Assured Revenue - Payables Offset
$102m$116m
$78m
$0
$10
$20
$30
$40
$50
$60
$70
H1 2016 H1 2017 H1 2018
US$m US$m
$54m$48m
$62m
$116m
US$m
EBITDA Profit/(Loss) After Tax
($233m)
$0.7m$27m
• Record figures for GKP in H1 2018
• Revenue, EBITDA and profit driven by production, robust oil price
• Signing of the Crude Oil Sales Agreement in January 2018

Disciplined cost control
18
General & Administrative ExpensesOperating Expenses1)
7.05.3
3.52.7 3.0
18
31
35 35 32
0
5
10
15
20
25
30
35
40
0
1
2
3
4
5
6
7
8
2014 2015 2016 2017 H1 2018
Ope
x pe
r bbl
(US$
m)
Opex per bbl (LHS) Gross Shaikan Production (RHS)
2820 17 16
5
11
119
5
3
18
31
35 35 32
-
5
10
15
20
25
30
35
40
2014 2015 2016 2017 H1 20180
10
20
30
40
50
G&
A E
xpen
ses
(US$
m)
G&A Kurdistan Recoverable (LHS) G&A Non-Recoverable (LHS)
Gross Shaikan Production (RHS)
kbopd kbopd
1) Excludes capacity building charges, production bonus and transportation costs
US$m 37 48 35 28 14 US$m 39 31 26 21 8
• Opex remained stable – in line with 2017
• Opex per barrel slightly increased due to lower production
• G&A continued to decrease: $2.0m reduction vs. H1 2017 ($9.7m)

Free cash flow positive
19
219
(2)61
0
160
$0
$50
$100
$150
$200
$250
Opening Cash(31-Dec-2017)
OperatingActivities
InvestingActivities
FX Closing Cash(30-Jun-2018)
H1 2018 Cash Flow ($m)
• Healthy cash balance ($240m at 7 September 2018)
• Refinanced $100m bond in July 2018 with standard terms – 10% coupon, 5-year maturity

1) Source: ERC Equipoise. Gross volume estimates as at 31 December 2016: 2P 615 MMstb (12.9 MMstb production in 2017) and 2C 239 MMstb
Gulf Keystone today
20
• Gross 2P + 2C resource base of 854 MMstb1) with year-to-date gross production of 31,743 bopd –on track to meet 2018 guidance (27,000 to 32,000 bopd)
• Predictable reservoir performance: steady production (underpinned by safe and reliable operations), pressure decline in line with reservoir model and no breakthrough of gas or formation water to date
• Low cost and low execution risk project initiated for expansion of nameplate production capacity to 55,000 bopd (+38%) in H2 2019 – longer term potential of up to 110,000 bopd
Operator of Shaikan – a large field with proven
track record
CommercialStability
Strong cash flow and solid balance
sheet
1
2
3
• Landmark Crude Oil Sales Agreement signed in January 2018 – transparent invoicing, commercial protection and on par with peers
• Regular payments – $447m (net to GKP) received from September 2015
• The stable payment cycle and uninterrupted exports have continued post the Kurdistan referendum vote in September 2017
• Strong cash flow driven by steady production, high plant uptime, regular KRG payment cycle, continuous reduction of operating and G&A costs, substantial cost oil position and higher oil price
• New era of profitability with after-tax profit posted in 2017 for the first time since entry to Kurdistan
• Interest bearing debt of $100m with a cash position of $240m

Outlook
21
• Operational Excellence– Safe operations
– Meeting 2018 gross production guidance of 27,000-32,000 bopd
– Delivering on project milestones
– Continued disciplined cost control
• Production Growth– Deliver the expansion project: Jurassic drilling campaign, workovers, facilities
debottlenecking, PF-1 tie-in line – construction work underway and on track toincrease production to 55,000 bopd in H2 2019
– Finalise investment plans and submit revised FDP later in 2018
• Commercial Clarity– PSC amendment (expected Q4 2018)
– Capital management strategy will be communicated after submission of the revised FDP and PSC amendment
Corporate Overview1
Shaikan Field2
Financials 3
Appendix4
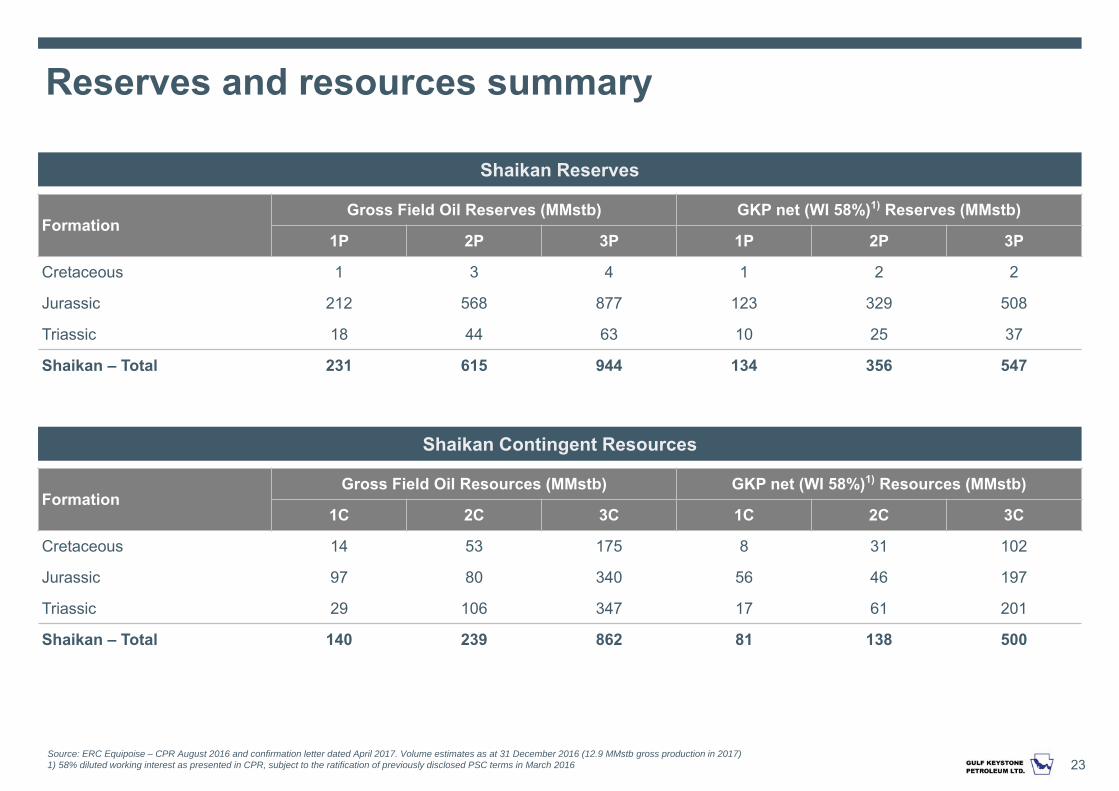
Source: ERC Equipoise – CPR August 2016 and confirmation letter dated April 2017. Volume estimates as at 31 December 2016 (12.9 MMstb gross production in 2017) 1) 58% diluted working interest as presented in CPR, subject to the ratification of previously disclosed PSC terms in March 2016
Reserves and resources summary
23
FormationGross Field Oil Reserves (MMstb) GKP net (WI 58%)1) Reserves (MMstb)
1P 2P 3P 1P 2P 3P
Cretaceous 1 3 4 1 2 2
Jurassic 212 568 877 123 329 508
Triassic 18 44 63 10 25 37
Shaikan – Total 231 615 944 134 356 547
Shaikan Reserves
Shaikan Contingent Resources
FormationGross Field Oil Resources (MMstb) GKP net (WI 58%)1) Resources (MMstb)
1C 2C 3C 1C 2C 3C
Cretaceous 14 53 175 8 31 102
Jurassic 97 80 340 56 46 197
Triassic 29 106 347 17 61 201
Shaikan – Total 140 239 862 81 138 500

1) Under the Shaikan PSC, the KRG is entitled to a capacity building payment representing 40% of GKP profit oil, albeit it is subject to change following the execution of the 2nd PSC Amendment.
Shaikan PSC
24
Summary of terms Shaikan Production Sharing Contract
GROSS REVENUE100%
NET REVENUE90%
ROYALTY10%
PROFIT OIL60%
COST RECOVERY40%
CONTRACTOR (1)
30%-15%KRG (1)
70%-85%Split based on R-Factor (Cum. Rev/Cum. Costs) based on linear scale 1<R>2
Unused CR = Profit Oil
CONTRACTOR INCOME
Corporate Tax Paid by Government
Divided by Working Interest (WI) %

Gulf Keystone Petroleum More resources are available at: www.gulfkeystone.com