guidelines for slow-rate land treatment of wastewater …
TRANSCRIPT

GUIDELINES FOR SLOW-RATE
LAND TREATMENT OF
WASTEWATER VIA SPRAY
IRRIGATION
State of Georgia
Department of Natural Resources
Environmental Protection Division
Watershed Protection Branch
4220 International Parkway, Suite 101
Atlanta, Georgia 30354
Revised: July 2010

ii
ACKNOWLEDGEMENTS
The Environmental Protection Division of the Georgia Department of Natural Resources acknowledges
the assistance of the following individuals and organizations on these or prior editions of guidelines:
Dr. Wade L. Nutter, Nutter and Associates, Inc., Athens, Georgia.
Dr. Robert D. von Bernuth, Department of Agricultural Engineering, University of Tennessee,
Knoxville, Tennessee.
Clayton County Water Authority, E.L. Huie Land Application System, Morrow, Georgia.
Mr. D. Donald Deemer and Mr. Glenn L. Taylor, ERM-Southeast, Inc., Marietta, Georgia.
Mr. J. David Ariail and Mr. Ben Chen, Applied Technology Section, Water Management
Division, U.S. Environmental Protection Agency, Region IV, Atlanta, Georgia.
Mr. John P. McEvoy, Jr., United States Department of Agriculture Soil Conservation Service,
Athens, Georgia.
Mr. Kerry A. Harrison, Georgia Cooperative Extension Service, University of Georgia, Tifton,
Georgia.
Dr. Sherwood C. Reed, Cold Regions Research and Engineering Laboratory, United States
Army, Hanover, New Hampshire.
Mr. Phil Freshley, LandTec Southeast, Watkinsville, Georgia.
Dr. Lawrence Morris, Warnell School of Forestry and Natural Resources, University of
Georgia, Athens, Georgia

iii
TABLE OF CONTENTS
Acknowledgements ii
Table of Contents iii
List of Tables vi
List of Figures vi
1.0 INTRODUCTION 1
1.1 Purpose 1
1.2 Sources of Information 1
1.2.1 Organizations 1
2.0 PROCEDURES FOR STATE REVIEW AND APPROVAL 2
2.1 Proposal for Land Treatment 2
2.1.1 Site Inspection and Concurrence 2
2.2 Environmental Information Document and Design Development Report 2
2.3 Permitting of Slow-Rate Land Treatment Systems 3
2.3.1 Trust Indenture 3
2.3.2 Public Notice, Draft and Final Land Application System Permits 3
2.3.3 Operations Manual 3
2.4 Engineering Plans and Specifications 9
2.4.1 Review 9
2.4.2 Construction 9
3.0 GUIDELINES AND CRITERIA FOR DESIGN 10
3.1 Suitability of Sites for Land Treatment 10
3.1.1 Location 10
3.1.2 Topography 10
3.1.3 Soils 10
3.2 Soil Investigations 10
3.2.1 General 10
3.2.2 Saturated Hydraulic Conductivity Testing 11
3.2.3 Soil Chemical Testing 11
3.3 Preapplication Treatment Requirements 13
3.3.1 General 13
3.3.2 BOD and TSS Reduction, and Disinfection 13
3.3.3 Nitrogen 13
3.3.4 Treatment and Storage Ponds 14
3.4 Soil and Cover Crop Compatibility 14
3.5 Protection of Irrigation Equipment 14
3.6 Determination of Design Percolation Rate(s) 15

iv
3.6.1 General 15
3.6.2 Design Values 15
3.7 Determination of Design Wastewater Loading Rate(s) 17
3.7.1 General 17
3.7.2 Water Balance 18
3.7.3 Potential Evapotranspiration 18
3.7.4 Five-Year Return Monthly Precipitation 19
3.8 Nitrogen Balance, Cover Crop Selection and Management 19
3.8.1 General 19
3.8.2 Nitrogen Balance 19
3.8.3 Cover Crop Selection and Management 20
3.9 Storage Volume 23
3.9.1 Operational Storage 23
3.9.2 Wet-Weather and Emergency Storage 23
3.9.3 Water Balance Storage 23
3.10 Determination of Wetted Field Area 24
3.10.1 Area for Average Daily Flow, A(ADF) 25
3.10.2 Area for Operational Storage, A(OP) 25
3.10.3 Area for Wet-Weather and Emergency Storage, A(WW/E) 25
3.10.4 Area for Water Balance Storage, A(WBS) 25
3.11 Buffer Zones, Public Access and Protection of Water Supply Wells 25
3.11.1 Buffer Zones 25
3.11.2 Public Access 26
3.11.3 Protection of Water Supply Wells 26
3.12 Surface Drainage and Runoff Control 26
3.13 Subsurface Drainage 27
3.14 Distribution Systems and Construction 27
3.14.1 General 27
3.14.2 Access, Flow Measurement, and Controls 27
3.14.3 Freeze Protection 28
3.14.4 Construction Disturbance, System Start-up and Testing 28
4.0 GUIDELINES AND CRITERIA FOR SITE MANAGEMENT 30
4.1 Operation and Management of Slow-Rate Land Treatment Systems 30
4.2 Monitoring Requirements 30
4.2.1 General 30
4.2.2 Preapplication Treatment Facility and Storage Pond(s) 30
4.2.3 Groundwater 30
4.2.4 Surface Water and Drainage Systems 31
4.2.5 Soil 32
4.2.6 Rainfall and Climatic Data 32
5.0 APPENDICES 34
5.1 Operations Manual for Slow-Rate Land Treatment Systems 34
5.1.1 Introduction 34

v
5.1.2 Management and Staffing 34
5.1.3 Facility Operation and Management 34
5.1.4 Monitoring Program 35
5.1.5 Records and Reports 36
5.2 Thornwaite Potential Evapotranspiration 36
5.3 Delta P Values for Georgia Climatic Divisions 38
5.4 Example Calculations 40
5.4.1 Introduction and Assumptions 40
5.4.2 Design Percolation 41
5.4.3 Water Balance 41
5.4.4 Nitrogen Balance 41
5.4.5 Operating Scheme 46
5.4.6 Storage Volume Requirements 46
5.4.7 Wetted Field Area Determination 47

vi
LIST OF TABLES
Table 2.1-1 Steps for Georgia Environmental Protection Division (EPD) Review and
Approval of Slow-Rate Land Treatment Systems 4
Table 2.1-2 Site Selection and Evaluation Report Information 5
Table 2.2-1 Design Development Report Information 6
Table 2.2-2 Detailed Soil Investigation Report Information 8
Table 3.2-1 Hydraulic Conductivity Test Methods 12
Table 3.4-1 Suggested Values for Inorganic Constituents in Wastewater Applied to Land 16
Table 3.8-1 Yield Based Nitrogen, Phosphorus, and Potassium Uptake of Various Crops 21
Table 3.8-2 Nitrogen Uptake Rates For Selected Forest Ecosystems 22
Table 5.2-1 Monthly Average Daylight Hours as a Function of Latitude 37
Table 5.3-1 Delta P Values for Georgia Climatic Divisions 38
Table 5.4-1 Water Balance Calculations 42
Table 5.4-2 Nitrogen Balance, Pine Forest 43
Table 5.4-3 Nitrogen Balance, Coastal Bermuda/Ryegrass, Summer 44
Table 5.4-4 Nitrogen Balance, Coastal Bermuda/Ryegrass, Winter 45
Table 5.4-4 Water Balance Storage Calculations 49
LIST OF FIGURES
Figure 4.2-1 General Monitoring Well - Cross Section 33
Figure 5.3-1 Georgia Climatic Divisions 39

Revised: July 2010 1
1.0 INTRODUCTION
1.1 Purpose
This document provides guidelines and criteria for the planning, design, and operation of slow-
rate land treatment systems in Georgia. It is a revision/update of previous versions of the
document and reflects lessons learned from construction and operation of land application
systems through the intervening years. These guidelines and criteria do not apply to systems
utilizing overland flow, drip irrigation, constructed wetlands, or rapid infiltration.
The term slow-rate land treatment as used in this document refers to the treatment of wastewater
by spray irrigation onto land to support vegetative growth. These systems are to be designed and
operated so that there is no direct discharge to surface waters. The irrigated wastewater
evaporates and transpires to the atmosphere or enters the groundwater through percolation.
Organic constituents in the wastewater are stabilized by soil bacteria. Organic and ammonia
nitrogen are taken up by plants, nitrified by soil bacteria, lost to the atmosphere through
denitrification, and minimally leached into the groundwater. Phosphorus and other constituents
are adsorbed in the soil profile and taken up by plants. Properly designed and operated land
treatment systems produce a percolate water of high quality and thus protect ground and surface
water resources.
The criteria in this document apply primarily to domestic wastewater. Land treatment systems
for industrial and animal wastes will be evaluated on an individual basis, since treatment
requirements for those wastes may differ significantly from those for domestic wastewater.
Finally, this document is not intended to be a cookbook. The design and operation of land
treatment systems are very site-specific. Hydrogeologic conditions vary widely throughout the
State and site assessment and monitoring requirements may vary not only from region to region,
but even from site to site within the same region.
1.2 Sources of Information
The Environmental Protection Division (EPD) recommends the following additional sources of
information for the planning, design and operation of slow-rate land treatment systems.
1.2.1 Organizations
a. Georgia Automated Environmental Monitoring Network
b. The Irrigation Association
c. Natural Resources Conservation Service
d. National Oceanic and Atmospheric Administration
e. United States Environmental Protection Agency
f. University of Georgia College of Agricultural & Environmental Sciences
g. University of Georgia Warnell School of Forestry and Natural Resources

Revised: July 2010 2
2.0 PROCEDURES FOR STATE REVIEW AND APPROVAL
2.1 Proposal for Land Treatment
The Georgia Water Quality Control Act and the Georgia Rules and Regulations for Water
Quality Control govern procedures necessary to gain State of Georgia approval for slow-rate
land treatment systems. The steps outlined in Table 2.1-1 are in accordance with the Act and
Rules. These steps are explained in the following sections. Projects funded under the State
Revolving Loan Fund Program (SRF) (Title VI of the Federal Clean Water Act) must meet
certain federal requirements in addition to the steps listed in Table 2.1-1.
2.1.1 Site Inspection and Concurrence
The owner, the owner’s engineer or agent must submit to EPD a letter of intent to develop a
slow-rate land treatment system. The letter should indicate the projected design flow for this
system and proposed source(s) of project funding. The letter should also request a site
inspection. Accompanying the letter of intent should be a Site Selection and Evaluation Report.
The report must identify potential land treatment sites and provide a preliminary environmental
and soil evaluation of selected sites. Table 2.1-2 outlines information generally needed in the
Site Selection and Evaluation Report. Additional information may be required as needed.
Upon receipt of the report, an EPD representative will inspect the selected site(s). A preliminary
site concurrence or denial letter will be written based on an engineering and geologic evaluation
of site conditions. It should be noted that site concurrence is preliminary and pertains only to
general wastewater treatment and application to the land. The letter will indicate what
requirements are necessary to proceed with the project. Site concurrences for slow-rate land
treatment are valid for one year. If detailed design has not begun within this period, EPD may
choose to reevaluate the project.
2.2 Environmental Information Document and Design Development Report
After a site has been selected by the owner and accepted by EPD as suitable for slow-rate land
treatment, the owner must complete an Environmental Information Document (EID) and prepare
a Design Development Report (DDR). The EID is to be developed prior to the DDR, and is
recommended for all projects but required for municipal projects. The EID shall be a short and
concise document that adequately discusses the environmental impact of the proposed project
and is not expected to be a complete environmental impact study. The preparer of the document
should consider the environmental impacts identified in the latest edition of EPD’s
Environmental Information Document Guidance. All areas may not be pertinent for each project
and the degree of detail will vary depending on the project size and location. The DDR must
bear the stamp of a Professional Engineer registered in the State of Georgia, and should include,
but is not limited to, the information outlined in Tables 2.2-1 and 2.2-2.
When the EID is completed and prior to submitting it for EPD review, the owner must conduct at
least one public meeting. The purpose of the meeting is to allow public input regarding the

Revised: July 2010 3
proposed project, its purpose, its design, and its environmental impacts. The meeting date and
time must be advertised at least 30 days in advance in local newspapers with circulation covering
all areas impacted by the project. The owner must make provisions to receive written comments
from the public. Minutes of the public meeting, proof of advertisement, and opinions derived
from the meeting must be submitted to EPD with the EID. The DDR can be completed and
submitted for review once the public input from the EID has been evaluated and acted upon.
2.3 Permitting of Slow-Rate Land Treatment Systems
2.3.1 Trust Indenture
In order to ensure continuity of operation and maintenance, a trust indenture is required for all
privately-owned facilities. The permittee must attempt to acquire a trust indenture with a local
government. If a local government is not willing to serve as a trustee, EPD will consider
allowing a non-governmental entity as trustee. In either case, we recommend that appropriate
financial security be provided to allow continued operation of the system. Typically, the
financial security is in the form of a bond or letter of credit with the minimum amount being
equal to the cost of major component replacement, as well as projected operation and
maintenance costs of the facility, for three years. EPD has developed a sample trust indenture
document that is available upon request.
2.3.2 Public Notice, Draft and Final Land Application System (LAS) Permits
Upon EPD concurrence with the DDR and EID, the owner of the proposed facility must submit a
written application for a Georgia Land Application System (LAS) Permit. Upon receipt of a
completed application for this permit, EPD will prepare a draft LAS Permit and public notice for
the project. One copy of the public notice will be transmitted to the owner for local
advertisement and one copy will be published by EPD. The cost of the local advertisement is to
be borne by the owner.
A 30-day comment period follows the publication date of each public notice. If no significant
adverse public comments are received, a final LAS Permit may be issued for the slow-rate land
treatment system.
2.3.3 Operations Manual
An outline for the scope of the Operations Manual (OM) required for the system is presented in
Appendix Section 6.1. The OM is written by the owner or owner's engineer during construction
of the system. In order to allow time for EPD input, we recommend that a draft manual be
submitted to EPD by the time construction of the facility is 50% complete. The OM must
address wastewater application rates, spray field cycling, monitoring requirements, harvesting
schedules, maintenance schedules, and all other information necessary for successful operation
of the system.

Revised: July 2010 4
Table 2.1-1
STEPS FOR EPD REVIEW AND APPROVAL
OF SLOW-RATE LAND TREATMENT SYSTEMS
1.0 Letter of Intent, Site Selection & Evaluation Report submitted to EPD by owner or owner's
representative
1.1 EPD conducts site inspection
1.2 Site concurrence or denial issued by EPD
2.0 Environmental Information Document, required for municipal systems
2.1 Owner holds public meeting
2.2 Submitted with minutes from public meeting
3.0 Design Development Report
3.1 Submitted for EPD review
3.2 Accepted by EPD as the basis for facility design
3.3 Permit application sent to owner
4.0 Application for permit to apply treated wastewater to land
4.1 Permit application completed and submitted to EPD
4.2 Application reviewed and checked against DDR and EID
4.3 Trust Indenture executed for privately owned facilities
5.0 Land Application System (LAS) Permit drafted by EPD
5.1 Industrial pretreatment requirements included, if necessary
5.2 Draft permit and monitoring requirements sent to owner for comment
5.3 Draft permit modified if necessary
6.0 Public Notice
6.1 Public notice drafted by EPD
6.2 One copy transmitted to owner for advertisement, one copy advertised by EPD
6.3 Public comment period
6.4 Public notice requirements completed
7.0 Final Land Application System (LAS) Permit issued
7.1 Signed by Division Director
7.2 Sent to facility owner
8.0 Plans and Specifications
8.1 Submitted for EPD review
8.2 Checked against accepted DDR
8.3 Approved by EPD for construction
9.0 Operations Manual

Revised: July 2010 5
9.1 Submitted by owner for EPD review
9.2 Accepted by EPD
10.0 Certification of Construction Completion
10.1 Submitted to EPD by design engineer
10.2 EPD conducts facility inspection to verify compliance with approved plans and
specifications and readiness to operate
11.0 Authorization to commence operation
11.1 Owner submits written request to EPD to commence operation at design flow
11.2 EPD issues written authorization
Table 2.1-2
SITE SELECTION AND EVALUATION REPORT
(REQUIRED INFORMATION FOR EACH SITE UNDER CONSIDERATION)
1.0 Site Description
1.1 Location map
1.2 Topographic map
1.3 Soil survey map
1.4 Known cultural or historic resources (cemeteries, archaeological sites, etc)
2.0 Site Soil Characteristics
2.1 United States Soil Conservation Service soil series classifications
2.2 Narrative description for same including:
2.2.1 Texture
2.2.2 Permeability
2.2.3 Slope
2.2.4 Drainage
2.2.5 Depth to seasonal high water table
2.2.6 Depth to bedrock
2.2.7 Erodibility
3.0 100-year flood elevation for site (Either give the elevation or provide supporting documentation
as to how it was determined that the site is not within the 100-year flood zone).
4.0 Existing vegetative cover
5.0 Existing land use
6.0 Present land owner

Revised: July 2010 6
Table 2.2-1
DESIGN DEVELOPMENT REPORT
RECOMENDED INFORMATION
1.0 Site Description
1.1 Location map
1.2 Climate
1.3 Geology (including subsurface hydrology)
1.4 Groundwater Potentiometric Surface Map
1.5 Topography
1.6 Access
1.7 Identify water supply wells within 2500 L.F. of facility
2.0 Scaled drawing with 2-foot elevation contours showing the preliminary site layout, including
2.1 Preapplication treatment facility
2.2 Storage pond(s)
2.3 Spray fields (show field number/designation, usable acreage, and total acreage)
2.4 Buffer zones
2.5 Hand auger, test pit and soil boring locations
2.6 Access roads and utilities
2.7 Watercourses
2.8 Drainage Structures
2.9 Flood Elevations
2.10 Residences and habitable structures within or adjacent to site
3.0 Design wastewater characteristics (influent to preapplication treatment and treated effluent to
spray fields). If the project involves an existing facility, then actual, recent data must be used
3.1 Average and peak daily flows
3.2 Industrial Flows
3.3 Biochemical Oxygen Demand a
3.4 Total Suspended Solids
3.5 Ammonia Nitrogen, Total Kjeldahl Nitrogen, Nitrate and Nitrite
3.6 Total Phosphorus
3.7 Chloride
3.8 Sodium Adsorption Ratio b
3.9 Electrical Conductivity
3.10 Metals/Priority Pollutants c
4.0 Water balance and determination of design wastewater loading rates for each sprayfield (if
appropriate)
5.0 Nitrogen balance and selection of cover crop and management scheme
6.0 Background groundwater samples
Revised: July 2010 7
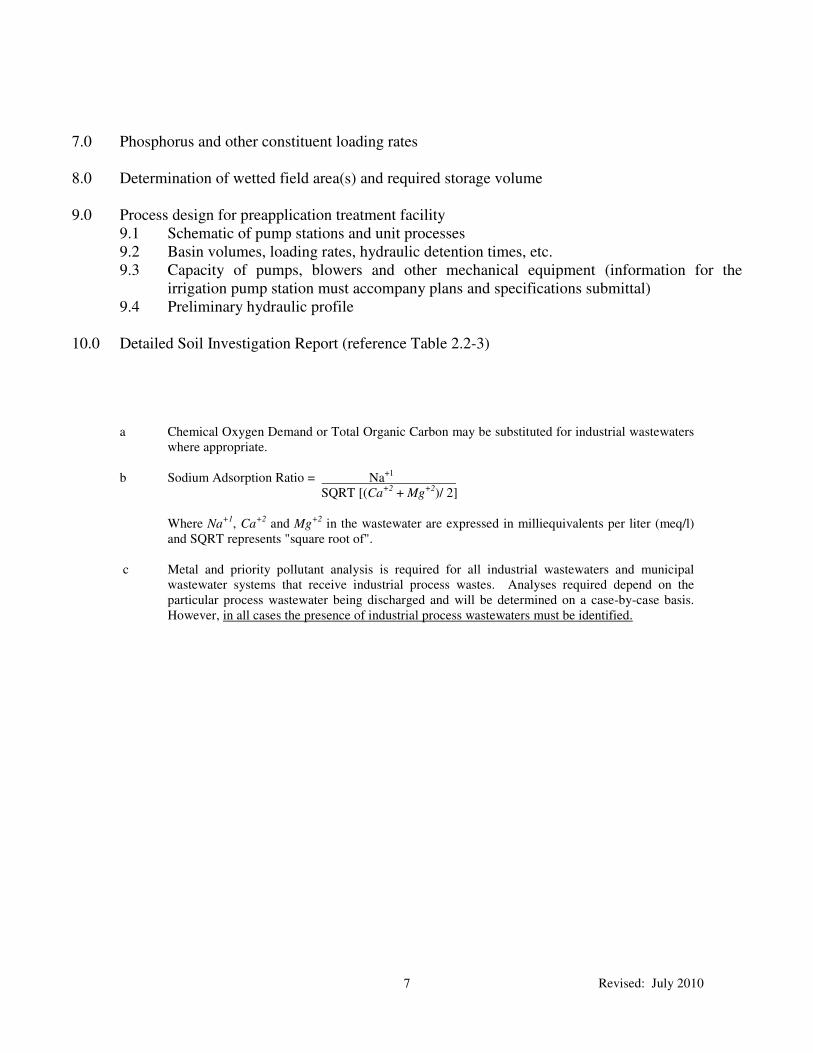
7.0 Phosphorus and other constituent loading rates
8.0 Determination of wetted field area(s) and required storage volume
9.0 Process design for preapplication treatment facility
9.1 Schematic of pump stations and unit processes
9.2 Basin volumes, loading rates, hydraulic detention times, etc.
9.3 Capacity of pumps, blowers and other mechanical equipment (information for the
irrigation pump station must accompany plans and specifications submittal)
9.4 Preliminary hydraulic profile
10.0 Detailed Soil Investigation Report (reference Table 2.2-3)
a Chemical Oxygen Demand or Total Organic Carbon may be substituted for industrial wastewaters
where appropriate.
b Sodium Adsorption Ratio = Na+1
….
SQRT [(Ca+2
+ Mg+2
)/ 2]
Where Na+1
, Ca+2
and Mg+2
in the wastewater are expressed in milliequivalents per liter (meq/l)
and SQRT represents "square root of".
c Metal and priority pollutant analysis is required for all industrial wastewaters and municipal
wastewater systems that receive industrial process wastes. Analyses required depend on the
particular process wastewater being discharged and will be determined on a case-by-case basis.
However, in all cases the presence of industrial process wastewaters must be identified.
Revised: July 2010 8
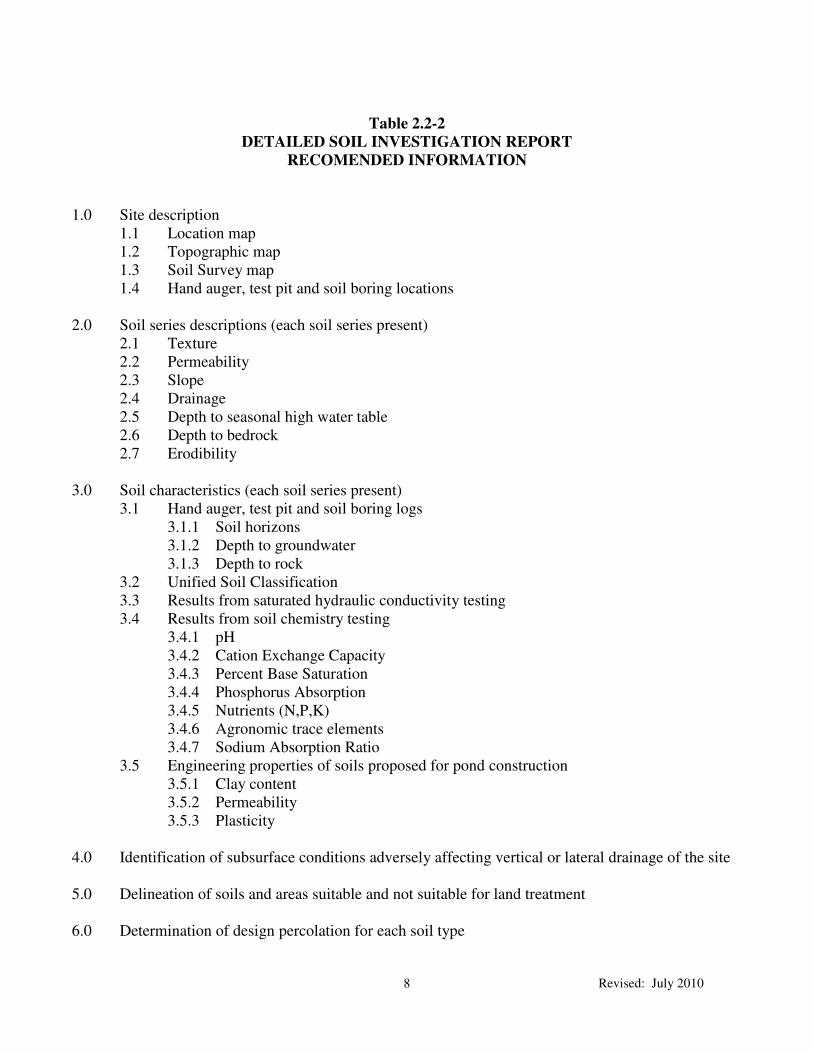
Table 2.2-2
DETAILED SOIL INVESTIGATION REPORT
RECOMENDED INFORMATION
1.0 Site description
1.1 Location map
1.2 Topographic map
1.3 Soil Survey map
1.4 Hand auger, test pit and soil boring locations
2.0 Soil series descriptions (each soil series present)
2.1 Texture
2.2 Permeability
2.3 Slope
2.4 Drainage
2.5 Depth to seasonal high water table
2.6 Depth to bedrock
2.7 Erodibility
3.0 Soil characteristics (each soil series present)
3.1 Hand auger, test pit and soil boring logs
3.1.1 Soil horizons
3.1.2 Depth to groundwater
3.1.3 Depth to rock
3.2 Unified Soil Classification
3.3 Results from saturated hydraulic conductivity testing
3.4 Results from soil chemistry testing
3.4.1 pH
3.4.2 Cation Exchange Capacity
3.4.3 Percent Base Saturation
3.4.4 Phosphorus Absorption
3.4.5 Nutrients (N,P,K)
3.4.6 Agronomic trace elements
3.4.7 Sodium Absorption Ratio
3.5 Engineering properties of soils proposed for pond construction
3.5.1 Clay content
3.5.2 Permeability
3.5.3 Plasticity
4.0 Identification of subsurface conditions adversely affecting vertical or lateral drainage of the site
5.0 Delineation of soils and areas suitable and not suitable for land treatment
6.0 Determination of design percolation for each soil type

Revised: July 2010 9
2.4 Engineering Plans and Specifications
2.4.1 Review
After EPD concurrence with the DDR, the owner must submit detailed construction plans and
specifications that have been completed in accordance with EPD’s current rules and guidelines.
Pump curves and hydraulic calculations for the distribution system must accompany the plans
and specifications, and each of these items will be reviewed for consistency with the DDR and
accepted engineering standards. Upon review of the plans and specifications and issuance of the
final LAS Permit, a letter approving the plans and specifications for construction can be written.
This approval is valid for one year. If construction has not begun within this period, the project
may require reevaluation.
IMPORTANT: Plans and specifications will not be approved for construction until a final LAS
Permit for the facility has been issued. Detailed design work undertaken prior to permit issuance
is at the owner's risk. Approval for construction of a privately-owned LAS is contingent upon
execution of a trust indenture and issuance of the final permit (ref. Sec 2.3.1).
2.4.2 Construction
EPD may choose to make interim inspections of projects under construction to ascertain their
progress and adherence to the approved plans and specifications. Upon project completion, the
design engineer or owner must certify to EPD, in writing, that the project was constructed in
accordance with the approved plans and specifications. Upon receipt of this certification, an
EPD representative will inspect the completed facility. When the facility is verified as being
complete and operational, the permittee must submit to EPD a written request for authorization
to operate the facility at the permitted flow limits. Once all of these steps are completed, EPD
will issue a letter to the permittee formally authorizing operation under the facility's LAS Permit.

Revised: July 2010 10
3.0 GUIDELINES AND CRITERIA FOR DESIGN
3.1 Suitability of Sites for Land Treatment
3.1.1 Location
There are two, often contradictory, requirements for slow-rate land treatment sites: proximity to
the wastewater source and a large tract of suitable, undeveloped land. Additional considerations
include a moderate degree of isolation, ease of access, soil suitability, availability of utilities, and
protection from flooding. Land treatment systems can be developed on agricultural land and in
forests. Irrigation of public areas, such as golf courses, cemeteries, green areas, and parks, are
considered urban water reuse projects and a separate set of guidelines applies to such systems.
3.1.2 Topography
Maximum grades for wastewater spray fields are generally limited to 7 percent for row crops, 15
percent for forage crops and 30 percent in forests. Sloping sites promote lateral subsurface
drainage and make ponding and extended saturation of the soil less likely than on level sites.
Convex landscapes with low drainage density are the ideal landscape for land application,
allowing uniform distribution of effluent across the landform and optimal land utilization. Areas
with high drainage density (the number of intermittent and perennial streams per unit area) are
indicative of lower landscapes that receive significant volume of storm water input. In addition,
the required drainage buffers will reduce the usable area and economic feasibility. Concave
landscapes tend to concentrate water and should be either avoided or considered for lower than
typical applications.
3.1.3 Soils
In general, soils with a USDA Natural Resources Conservation Service permeability
classification of moderate to moderately rapid (0.6 to 6.0 inches/hour) are suitable for
wastewater irrigation. However, groundwater and drainage conditions must also be suitable.
Soils that are poorly drained, have high groundwater tables, or restrictive subsurface soil layers
are not suitable for slow-rate land treatment without drainage improvements.
3.2 Soil Investigations
3.2.1 General
Soil investigations for land treatment differ greatly from investigations for foundations, roads,
and other civil engineering works. As a result, different investigative and testing methods are
required. The land treatment soil investigation must characterize the permeability and chemical
properties of the soil profile that will act as the media for tertiary wastewater treatment and final
disposal. It must also determine the elevation of the seasonal high groundwater, establish the
groundwater flow direction and gradient, and identify any subsurface conditions that may limit
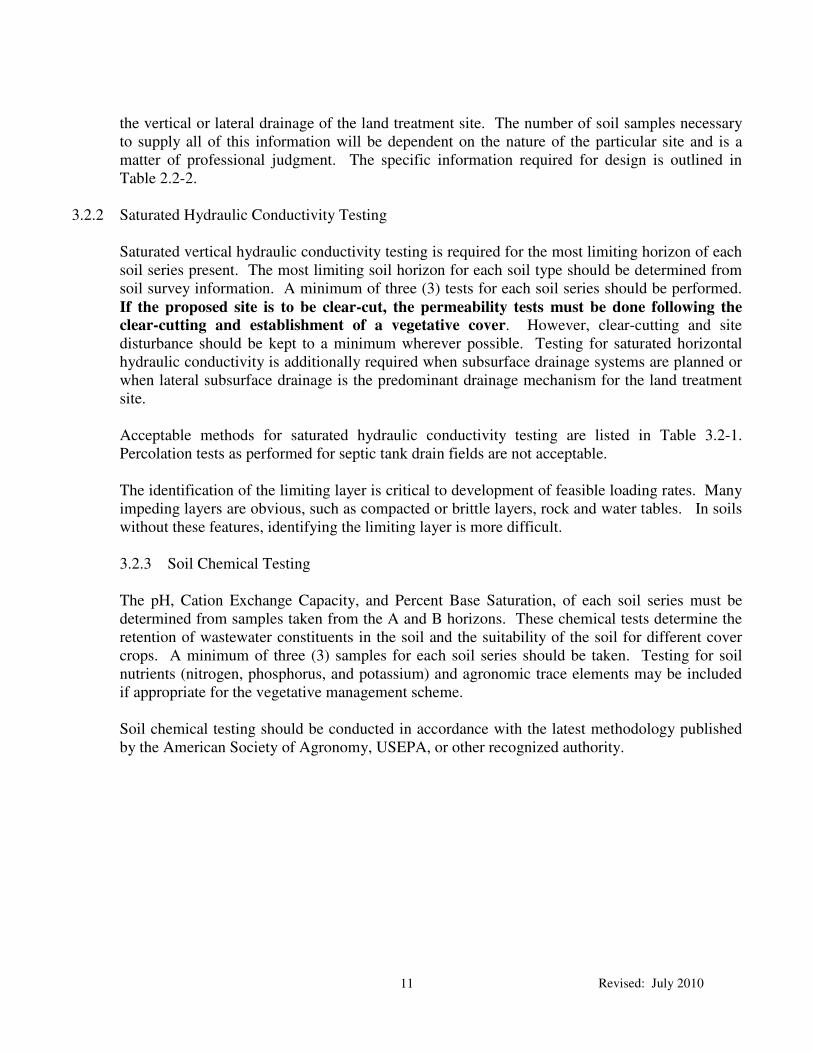
Revised: July 2010 11
the vertical or lateral drainage of the land treatment site. The number of soil samples necessary
to supply all of this information will be dependent on the nature of the particular site and is a
matter of professional judgment. The specific information required for design is outlined in
Table 2.2-2.
3.2.2 Saturated Hydraulic Conductivity Testing
Saturated vertical hydraulic conductivity testing is required for the most limiting horizon of each
soil series present. The most limiting soil horizon for each soil type should be determined from
soil survey information. A minimum of three (3) tests for each soil series should be performed.
If the proposed site is to be clear-cut, the permeability tests must be done following the
clear-cutting and establishment of a vegetative cover. However, clear-cutting and site
disturbance should be kept to a minimum wherever possible. Testing for saturated horizontal
hydraulic conductivity is additionally required when subsurface drainage systems are planned or
when lateral subsurface drainage is the predominant drainage mechanism for the land treatment
site.
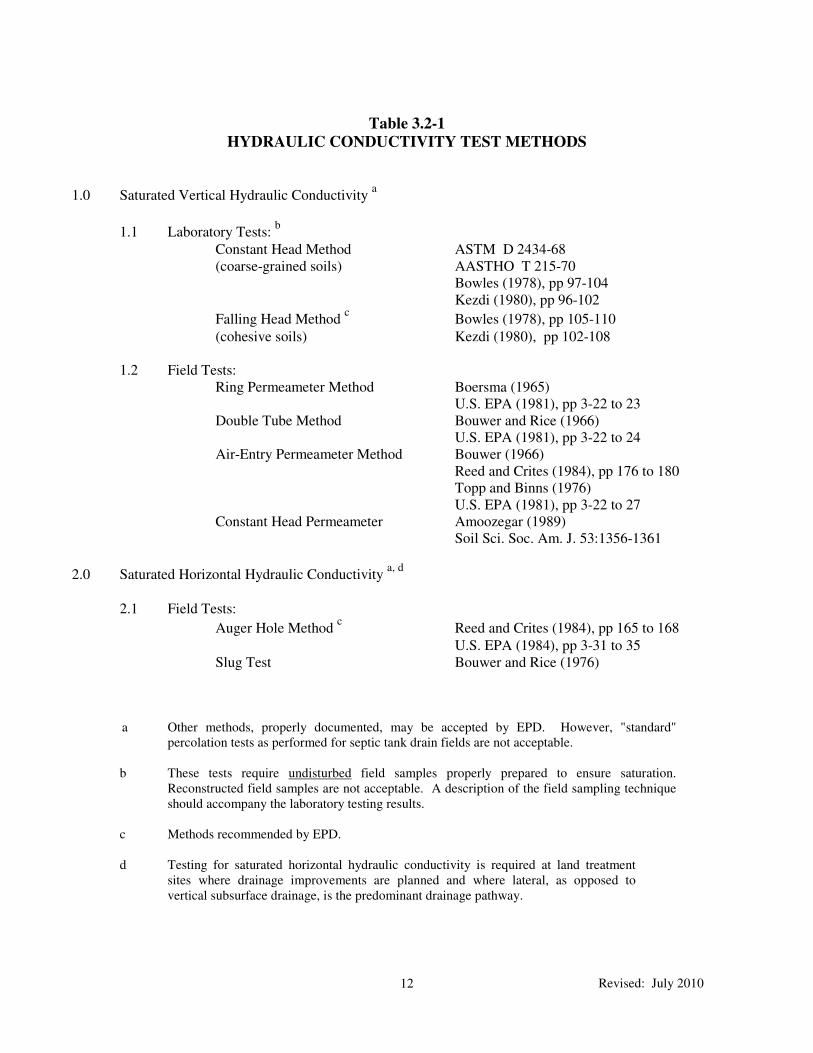
Acceptable methods for saturated hydraulic conductivity testing are listed in Table 3.2-1.
Percolation tests as performed for septic tank drain fields are not acceptable.
The identification of the limiting layer is critical to development of feasible loading rates. Many
impeding layers are obvious, such as compacted or brittle layers, rock and water tables. In soils
without these features, identifying the limiting layer is more difficult.
3.2.3 Soil Chemical Testing
The pH, Cation Exchange Capacity, and Percent Base Saturation, of each soil series must be
determined from samples taken from the A and B horizons. These chemical tests determine the
retention of wastewater constituents in the soil and the suitability of the soil for different cover
crops. A minimum of three (3) samples for each soil series should be taken. Testing for soil
nutrients (nitrogen, phosphorus, and potassium) and agronomic trace elements may be included
if appropriate for the vegetative management scheme.
Soil chemical testing should be conducted in accordance with the latest methodology published
by the American Society of Agronomy, USEPA, or other recognized authority.
Revised: July 2010 12
Table 3.2-1
HYDRAULIC CONDUCTIVITY TEST METHODS
1.0 Saturated Vertical Hydraulic Conductivity a
1.1 Laboratory Tests: b
Constant Head Method ASTM D 2434-68
(coarse-grained soils) AASTHO T 215-70
Bowles (1978), pp 97-104
Kezdi (1980), pp 96-102
Falling Head Method c Bowles (1978), pp 105-110
(cohesive soils) Kezdi (1980), pp 102-108
1.2 Field Tests:
Ring Permeameter Method Boersma (1965)
U.S. EPA (1981), pp 3-22 to 23
Double Tube Method Bouwer and Rice (1966)
U.S. EPA (1981), pp 3-22 to 24
Air-Entry Permeameter Method Bouwer (1966)
Reed and Crites (1984), pp 176 to 180
Topp and Binns (1976)
U.S. EPA (1981), pp 3-22 to 27
Constant Head Permeameter Amoozegar (1989)
Soil Sci. Soc. Am. J. 53:1356-1361
2.0 Saturated Horizontal Hydraulic Conductivity a, d
2.1 Field Tests:
Auger Hole Method c Reed and Crites (1984), pp 165 to 168
U.S. EPA (1984), pp 3-31 to 35
Slug Test Bouwer and Rice (1976)
a Other methods, properly documented, may be accepted by EPD. However, "standard"
percolation tests as performed for septic tank drain fields are not acceptable.
b These tests require undisturbed field samples properly prepared to ensure saturation.
Reconstructed field samples are not acceptable. A description of the field sampling technique
should accompany the laboratory testing results.
c Methods recommended by EPD.
d Testing for saturated horizontal hydraulic conductivity is required at land treatment
sites where drainage improvements are planned and where lateral, as opposed to
vertical subsurface drainage, is the predominant drainage pathway.

Revised: July 2010 13
3.3 Preapplication Treatment Requirements
3.3.1 General
Land treatment systems have a demonstrated ability to treat high strength organic wastes to low
levels. However, such systems require a high degree of management with particular attention
paid to organic loading rates and re-aeration of the soil profile between wastewater applications.
EPD requires that all domestic wastewater receive biological treatment prior to irrigation. This
is necessary to protect the health of persons contacting the irrigated wastewater and to reduce the
potential for odors in storage and irrigation. LAS permits will have a BOD limit of no greater
than 50 mg/L.
Some industrial wastewaters may be suitable for direct land treatment by spray irrigation under
intensive management schemes. EPD will evaluate such systems on a case-by-case basis.
3.3.2 BOD and TSS Reduction, and Disinfection
Preapplication treatment standards for domestic wastewater prior to storage and/or irrigation are
as follows:
a. Restricted Use (No Public Access) - All wastewater must be treated to a 5-day
Biochemical Oxygen Demand of 50 mg/L at average design flow and 75 mg/L
under peak loads. Total Suspended Solids are limited to 50 mg/L for mechanical
systems and 90 mg/L for non-aerated ponds. Disinfection is generally not
required for restricted access land treatment sites. EPD may, however, require
disinfection when deemed necessary.
b. Limited Use (Controlled Public Access) - All wastewater must be treated to a 5-
day Biochemical Oxygen Demand of 30 mg/L at average design flow and 50
mg/L under peak loads. Total Suspended Solids are limited to 30 mg/L.
Disinfection is generally required, usually to achieve a fecal coliform limit of 200
MPN/100 mL.
c. Water Reuse (Unlimited Public Access) - Sites open to public access include golf
courses, green areas, parks, and other public or private land not expressly closed
to the public. Such projects are considered urban water reuse systems and
requirements are outlined in separate EPD guidance.
3.3.3 Nitrogen
Maximum nitrogen removal occurs when nitrogen is applied to the site in the ammonia or
organic form. Nitrate is not retained by the soil and leaches to the groundwater, especially
during periods of dormant plant growth. Therefore, the preapplication treatment system should
be designed so as not to produce a highly-nitrified effluent. A description of the anticipated

Revised: July 2010 14
range of nitrogen removal should be included in the DDR.
3.3.4 Treatment and Storage Ponds
At least two treatment cells followed by a storage pond and irrigation pump station are required
for all pond preapplication treatment systems. The treatment cells may be aerated, facultative or
a combined aerated/facultative system. They may be separated by earthen dikes or floating
baffles. However, the storage pond and irrigation pump station must be hydraulically separate
from the treatment cells (i.e., pumping must not affect hydraulic detention time in these cells).
IMPORTANT: If initial flows are going to be significantly below design, EPD recommends
that the construction be phased. The storage pond should not be built for ultimate flow. Phasing
is necessary to avoid erosion, odor, and liner failure problems that can occur in such
circumstances.
Ponds used for preapplication treatment must have liners to prevent seepage from exceeding 1/8
inch/day. Either properly constructed clay or synthetic liners may be used. Facultative pond cells
should have a length to width ratio of 4:1 (to minimize short circuiting) with a depth of between
3 and 5 feet. Sizing of complete and partially mixed aerated ponds should be based on first-
order removal rate kinetic equations and the expected annual temperature variation. A 2-foot
freeboard is recommended for all ponds less than or equal to six acres and a 3-foot freeboard is
required for all ponds larger than six acres.
Ponds used for storage of treated wastewater must have liners to prevent seepage from exceeding
1/8 inch/day. Because storage ponds fluctuate greatly in water level, it is extremely difficult to
maintain an effective clay liner due to drying, cracking, and erosion. EPD highly recommends
synthetic liners for storage ponds. If clay liners are used, synthetic or concrete slope protection
must be used on interior slopes from six (6) inches above the maximum operational water level
to one (1) foot below the lowest operational water level. An appropriate water level must be
maintained at all times in clay-lined ponds. EPD recommends the use of multiple outlet points to
allow for effluent draw off from different elevations within the storage pond.
Pond dikes must not exceed 3:1 for internal or external slopes. Any pond with a dike taller than
25 feet or which stores in excess of 100 acre-feet (32.6 MG) of water at maximum depth must
comply with the Safe Dam Regulations of EPD.
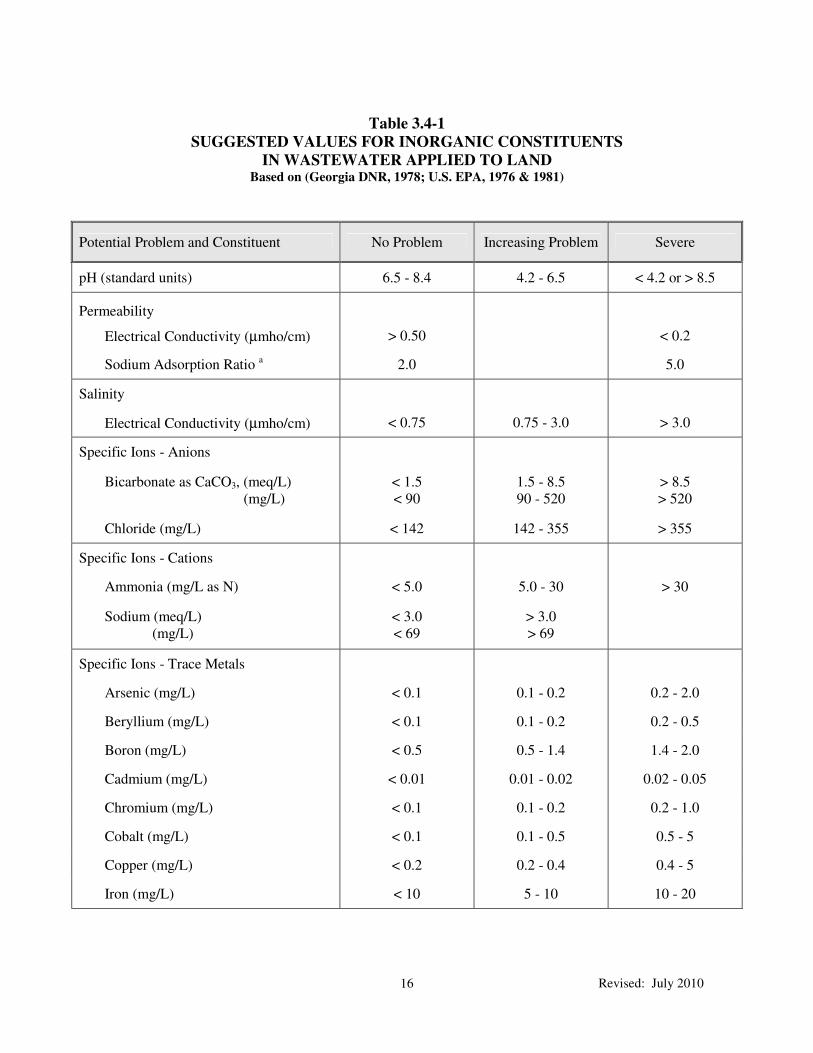
3.4 Soil and Cover Crop Compatibility
Inorganic constituents of effluent from preapplication treatment should be compared with Table
3.4-1 to ensure compatibility with the land application site soils and cover crops.
3.5 Protection of Irrigation Equipment
Prior to pumping to the spray field distribution system, the wastewater must be screened to
remove fibers, coarse solids, oil and grease, etc. which might clog distribution pipes or spray

Revised: July 2010 15
nozzles. At a minimum, screens with a nominal diameter equal to the smallest flow opening in
the distribution system should be provided. Some sprinkler manufacturers recommend screening
to remove solids greater than one third (1/3) the diameter of the smallest sprinkler nozzle. The
planned method for disposal of the screenings must be provided.
Pressurized, clean water for backwashing screens should be provided. This backwash may be
manual or automated. Backwashed screenings should be captured and removed for disposal.
3.6 Determination of Design Percolation Rate(s)
3.6.1 General
One of the first steps in the design of a slow-rate land treatment system is to develop a design
percolation rate. This value is used in water balance calculations to determine design wastewater
loading rate(s) and thus spray field area requirements. The percolation rate is a function of soil
permeability and drainage. Because different soil types may have different limiting percolation
rates and because the soil types may vary from field to field, it may be necessary for a system to
have different design percolation rates for each field.
3.6.2 Design Values
The most limiting layer, i.e. A, B, or C horizon, of each soil series must be identified. Any
subsurface conditions that limit the vertical or lateral drainage of the soil profile must also be
identified. Examples of such conditions are shallow bedrock, a high water table, aquitards, and
extremely anisotropic soil permeability. Values of saturated vertical hydraulic conductivity from
soil testing are used to develop the design percolation rate.
Values of saturated vertical hydraulic conductivity must be modified by an appropriate safety
factor to determine the design percolation rate. The safety factor reflects the influence of several
elements, including: the fact that long periods of saturation are undesirable, the uncertainty of
test values, the drainage characteristics of the land treatment site, the variation of permeability
within the soil series, the rooting habits of the vegetation, the soil reaeration factors, and the
long-term changes in soil permeability due to wastewater application. EPD recommends that the
design percolation rate at land treatment sites with seasonal high groundwater at depths greater
than 5 feet be no more than 10 percent of the mean saturated vertical hydraulic conductivity of
the most limiting layer within the first five feet of the surface.
Sites with seasonal high groundwater less than 5 feet from the surface may require drainage
improvements before they can be utilized for slow-rate land treatment. The design percolation at
such sites is a function of the design of the drainage system. A safety factor not exceeding 10
percent should be applied to field measured values of vertical and horizontal hydraulic
conductivity used for design of subsurface drainage systems.
Revised: July 2010 16
Table 3.4-1
SUGGESTED VALUES FOR INORGANIC CONSTITUENTS
IN WASTEWATER APPLIED TO LAND Based on (Georgia DNR, 1978; U.S. EPA, 1976 & 1981)
Potential Problem and Constituent No Problem Increasing Problem Severe
pH (standard units) 6.5 - 8.4 4.2 - 6.5 < 4.2 or > 8.5
Permeability
Electrical Conductivity (µmho/cm) > 0.50 < 0.2
Sodium Adsorption Ratio a 2.0 5.0
Salinity
Electrical Conductivity (µmho/cm) < 0.75 0.75 - 3.0 > 3.0
Specific Ions - Anions
Bicarbonate as CaCO3, (meq/L)
(mg/L)
< 1.5
< 90
1.5 - 8.5
90 - 520
> 8.5
> 520
Chloride (mg/L) < 142 142 - 355 > 355
Specific Ions - Cations
Ammonia (mg/L as N) < 5.0 5.0 - 30 > 30
Sodium (meq/L)
(mg/L)
< 3.0
< 69
> 3.0
> 69
Specific Ions - Trace Metals
Arsenic (mg/L) < 0.1 0.1 - 0.2 0.2 - 2.0
Beryllium (mg/L) < 0.1 0.1 - 0.2 0.2 - 0.5
Boron (mg/L) < 0.5 0.5 - 1.4 1.4 - 2.0
Cadmium (mg/L) < 0.01 0.01 - 0.02 0.02 - 0.05
Chromium (mg/L) < 0.1 0.1 - 0.2 0.2 - 1.0
Cobalt (mg/L) < 0.1 0.1 - 0.5 0.5 - 5
Copper (mg/L) < 0.2 0.2 - 0.4 0.4 - 5
Iron (mg/L) < 10 5 - 10 10 - 20

Revised: July 2010 17
Potential Problem and Constituent No Problem Increasing Problem Severe
Lead (mg/L) < 10 5 - 10 10 - 20
Lithium (mg/L) < 2.0 2.0 - 2.5 > 2.5
Mercury (mg/L) no standard
Molybdenum (mg/L) < 0.01 0.01 - 0.02 0.02 - 0.05
Nickel (mg/L) < 0.2 0.2 - 0.4 0.4 - 2.0
Selenium (mg/L) < 0.02 0.02 - 0.04 > 0.04
Zinc (mg/L) < 2.0 2.0 - 4.0 4 - 10
a Sodium Adsorption Ratio = Na
+1
….
SQRT [(Ca+2
+ Mg+2
)/ 2]
Where Na+1
, Ca+2
and Mg+2
in the wastewater are expressed in milliequivalents per liter (meq/l) and
SQRT represents "square root of".
3.7 Determination of Design Wastewater Loading Rate(s)
3.7.1 General
The design wastewater loading rate is a function of:
a. Precipitation.
b. Evapotranspiration.
c. Design percolation rate.
d. Nitrogen loading limitations.
e. Other constituent loading limitations.
f. Groundwater and drainage conditions.
g. Average and peak design wastewater flows.
Therefore, developing the design wastewater loading rate is an iterative process. An initial value
is selected from water balance calculations and used to determine wetted field area. This loading
rate is then compared to nitrogen and other constituent loading limitations (reference Section
3.8). If the initial value exceeds these limitations, the design wastewater loading rate is reduced
and the process is repeated. This iterative process is illustrated in Appendix Section 5.4.

Revised: July 2010 18
EPD limits design wastewater loading rates (WLRD) for non-reuse systems to a maximum of 2.5
inches/week and instantaneous wastewater application rates to 0.25 inches/hour. Requests for
higher loadings will be evaluated on a case-by-case basis. The design wastewater loading may
be fixed at a constant rate or may vary seasonally or monthly but it must account for site-specific
climatic and drainage limitations. Also, because a given site may include several different soil
types with significant variation in their permeabilities, it is possible that there may be different
application rates for different areas of the site. EPD recommends that when this is the case, the
fields be laid out to separate the soils with different permeabilities. However, if this is not done
and a field includes more than one soil type, the application rate will be limited to the most
restrictive soil permeability.
3.7.2 Water Balance
Wastewater loading rates are determined from the following water balance equation:
WLRD = (Evap + Perc) – Precip eq. 3.7.2
Where, WLRD = Design wastewater loading rate (in/month), may not exceed 0.36 x no.
of days in the month.
Evap = Potential Evapotranspiration (in/month)
Perc = Design percolation rate (in/month); reference Section 3.6
Precip = Design precipitation (in/month)
Example water balance calculations are presented in Appendix Section 5.4.3. From these
calculations, critical water balance months (i.e., months with the smallest allowable hydraulic
wastewater loading) are identified. The wastewater loading rate in the critical water balance
month is WLRC.
3.7.3 Potential Evapotranspiration
Reliable field data for evapotranspiration are difficult to obtain. Therefore, values for average
monthly potential evapotranspiration generated from vegetative, soil, and climatological data are
used in water balance calculations. For row and forage cover crops, EPD suggests use of either
the modified Penman or the Blaney-Criddle Method calibrated for local conditions. For forested
systems or when data for other methods is not available, the Thornthwaite equation adjusted for
sunlight duration and latitude can be used. The Thornthwaite equation and adjustment factors
for Georgia are presented in Appendix Section 5.2. In addition to the methods listed, estimates
of evapotranspiration can be obtained from published climatological resources, such as the
National Oceanic and Atmospheric Association (NOAA) at www.noaa.gov or the Georgia
Automated Environmental Monitoring Network at www.georgiaweather.net.
The method used to estimate average monthly potential evapotranspiration for water balance
calculations must be referenced in the DDR. In addition, these values should be based on a

Revised: July 2010 19
minimum record of 30 years of historical climatic data.
3.7.4 Five-Year Return Monthly Precipitation
EPD requires the use of five-year return, monthly precipitation values in water balance
calculations. Five-year return values are defined as the 80th percentile value in a 30-year ranked
listing of historical monthly precipitation data. This corresponds to:
5-Year Return Precip = Precip(avg) + (0.85 x std.dev.) eq. 3.7.4
Where, Precip(avg) = Average monthly precipitation from 30 or more year historic
record
std.dev. = Standard deviation for same
The most recent thirty-year records of both monthly precipitation and temperature are available
for all of Georgia from numerous published sources. The source of precipitation data used for
design must be referenced in the DDR.
3.8 Nitrogen Balance/Cover Crop Selection and Management
3.8.1 General
Land treatment systems should be designed so that nitrate concentration in the percolate does not
exceed 7 mg/L. Percolate nitrate concentration is a function of nitrogen loading, cover crop,
management of vegetation, and hydraulic loading. The design wastewater loading rate(s)
determined from water balance calculations must be checked against nitrogen loading
limitations. If for the selected cover crop and management scheme, the proposed wastewater
loading rate results in estimated percolate nitrate concentrations exceeding 7 mg/L, either the
loading must be reduced or a cover crop with a higher nitrogen uptake rate must be selected.
3.8.2 Nitrogen Balance
Percolate nitrate concentrations are estimated from an annual or seasonal nitrogen balance based
on the average design wastewater loading, proposed cover crop, and cover crop management
scheme. Example nitrogen balance calculations are presented in Appendix Section 5.4.4, and
Tables 5.4-2 and 5.4-3.
In nitrogen balance calculations, all nitrogen not lost to denitrification, ammonia volatilization,
or plant uptake is assumed to leach into the groundwater as nitrate. For row and forage crop
systems, assumed losses to denitrification should not exceed 10 percent of the total nitrogen
applied. In forest systems, assumed denitrification losses should not exceed 15 percent.
Assumed losses to ammonia volatilization should not exceed 5 percent of the total ammonia
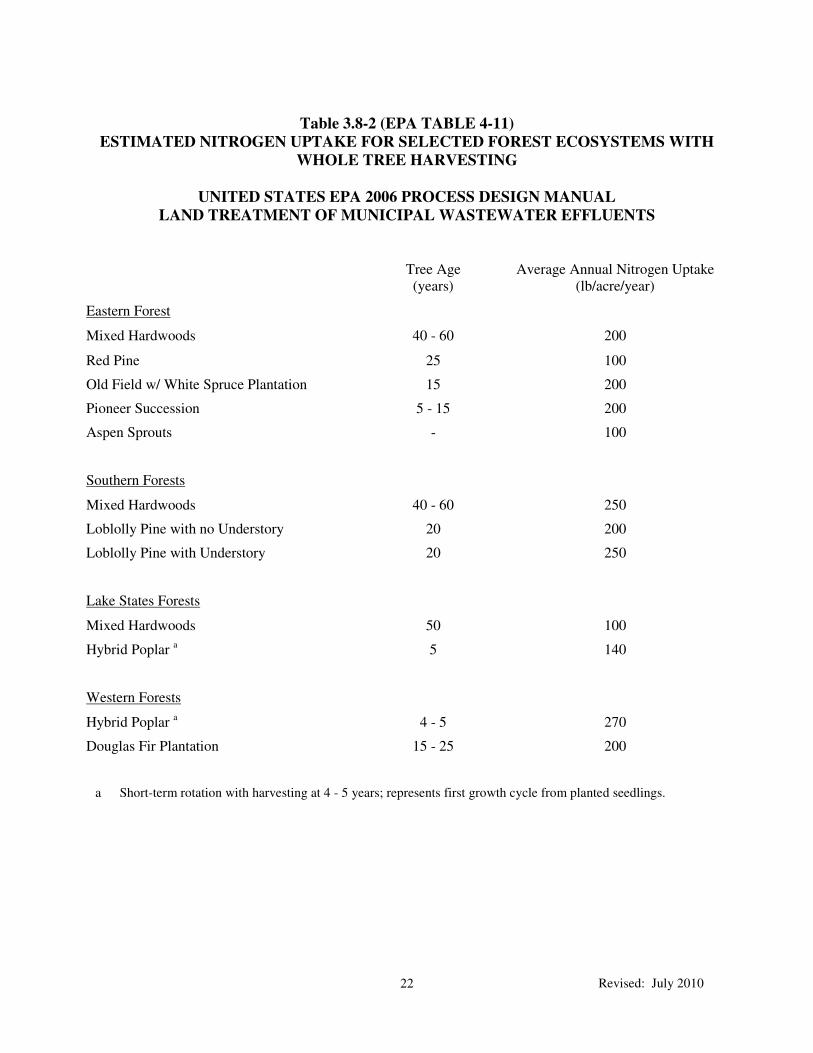
applied. Soil storage of nitrogen should be assumed to be zero. Tables 3.8-1 and 3.8-2 include
uptake rates for different cover crops. In all cases, the source of the plant nitrogen uptake rate
used for design must be referenced in the DDR.

Revised: July 2010 20
3.8.3 Cover Crop Selection and Management
Row crops may be irrigated with wastewater only when not intended for direct human
consumption. Forage crops irrigated with wastewater must be harvested and dried before
feeding to livestock. Unmanaged, volunteer vegetation (i.e., weeds) is not an acceptable spray
field cover crop. Disturbed areas in forest systems must be initially grassed and replanted for
succession to forest.
Spray field cover crops require management and periodic harvesting to maintain optimum
growth conditions assumed in design. Forage crops should be harvested and removed several
times annually. Pine and hardwood forest systems should be harvested at intervals as
recommended by the local forest service. It is recommended that whole tree harvesting be
considered to maximize nutrient removal. However, wastewater loadings following the
harvesting of forest systems must be reduced until the hydraulic capacity of the site is restored.
The design may require additional spray field area to allow for harvesting and the regeneration
cycle.
While relatively high in nitrogen and phosphorus, domestic wastewater is usually deficient in
potassium, as well as trace elements needed for vigorous agronomic cover crop growth. High
growth rate forage crops typically require supplemental nutrient addition to maintain nitrogen
uptake rates assumed in design. A comprehensive nutrient management plan (NMP) is necessary
to determine adequate levels of supplementation for the site. The NMP should include:
a. Site maps, including a soil map
b. Location and description of sensitive resource areas
c. Soil, plant, water, and organic material sample analysis results
d. Current and planned crop production sequence or crop rotation
e. Expected yield
f. Quantification of all nutrient sources available
g. Nutrient budget for the crop rotation being planned
h. Recommended rates, timing, and method of nutrient application
i. Operation and maintenance of the nutrient management plan
At least annually, the soils should be evaluated by the local extension office to determine if soil
supplements are needed. Industrial wastewaters considered for land treatment should be
carefully evaluated for their plant nutrient value, as well as possible salt content, which can
hamper plant growth and destroy soil structure.

Revised: July 2010 21
Table 3.8-1 (EPA TABLE 4-6)
YIELD BASED NITROGEN, PHOSPHORUS, & POTASSIUM UPTAKE OF VARIOUS CROPS
UNITED STATES EPA 2006, PROCESS DESIGN MANUAL
LAND TREATMENT OF MUNICIPAL WASTEWATER EFFLUENTS
Percent of Dry Harvested Material
Forage Crops Dry Weight Typ. Yield/acre-yr N P K
Barley 48 lb/bushel 50 bushel 1.82 0.34 0.43
1 ton straw 0.75 0.11 1.25
Corn 56 lb/bushel 120 bushel 1.61 0.28 0.40
4.5 ton straw 1.11 0.20 1.34
Cotton 600 lbs Lint 2.67 0.85 0.83
1000 lbs stalks 1.75 0.22 1.45
Grain Sorghum 56 lb/bushel 60 bushel 1.67 0.36 0.42
3 tons straw 1.08 0.15 1.31
Soybeans a 60 lb/bushel 35 bushel 6.25 0.64 1.90
2 tons stover 2.25 0.22 1.04
Wheat 60 lb/bushel 40 bushel 2.08 0.62 0.52
1.5 tons straw 0.67 0.07 0.97
Field Crops Typ. Yield/acre-yr N P K
Alfalfa a 4 tons 2.25 0.22 1.87
Bahiagrass 3 tons 1.27 0.13 1.73
Bromegrass 5 tons 1.87 0.21 2.55
Clover-grass 6 tons 1.52 0.27 1.69
Coastal Bermuda Grass 8 tons 1.88 0.19 1.40
Kentucky Blue Grass 2 tons 2.91 0.43 1.95
Orchardgrass 6 tons 1.47 0.20 2.16
Reed Canary Grass 6.5 tons 1.35 0.18 1.66
Ryegrass 5 tons 1.67 0.27 1.42
Switchgrass 3 tons 1.15 0.10 1.90
Tall Fescue 3.5 tons 1.97 0.20 2.00
a Legumes will also take nitrogen from the atmosphere.
Revised: July 2010 22
Table 3.8-2 (EPA TABLE 4-11)
ESTIMATED NITROGEN UPTAKE FOR SELECTED FOREST ECOSYSTEMS WITH
WHOLE TREE HARVESTING
UNITED STATES EPA 2006 PROCESS DESIGN MANUAL
LAND TREATMENT OF MUNICIPAL WASTEWATER EFFLUENTS
Tree Age
(years)
Average Annual Nitrogen Uptake
(lb/acre/year)
Eastern Forest
Mixed Hardwoods 40 - 60 200
Red Pine 25 100
Old Field w/ White Spruce Plantation 15 200
Pioneer Succession 5 - 15 200
Aspen Sprouts - 100
Southern Forests
Mixed Hardwoods 40 - 60 250
Loblolly Pine with no Understory 20 200
Loblolly Pine with Understory 20 250
Lake States Forests
Mixed Hardwoods 50 100
Hybrid Poplar a
5 140
Western Forests
Hybrid Poplar a 4 - 5 270
Douglas Fir Plantation 15 - 25 200
a Short-term rotation with harvesting at 4 - 5 years; represents first growth cycle from planted seedlings.

Revised: July 2010 23
3.9 Storage Volume
The total storage volume required for land treatment systems consists of three (3) separate
storage components such that:
Total Storage = Operational Storage
+
Wet-Weather and Emergency Storage
+
Water Balance Storage eq. 3.9
These separate storage components are described in the sections that follow.
3.9.1 Operational Storage
Operational storage is a design parameter. For example, many land treatment systems are
designed to apply wastewater 5 days per week and store weekend flows. Facilities that harvest
cover crops on a frequent basis may stop irrigation to allow drying of the spray fields.
Wastewater storage volume is required during these periods.
3.9.2 Wet-Weather and Emergency Storage
Wet-weather and emergency storage provides for periods when wastewater cannot be applied,
i.e. excessive rainfall, saturated soil, equipment failure, etc. EPD has minimum requirements for
wet-weather and emergency storage. These are necessary to ensure reliability of the slow-rate
land treatment system.
The volume provided for wet-weather and emergency storage must be the greater of 12 days
average design flow volume, or:
WW/E = Delta P x (30.4 days/month)
WLRC eq. 3.9.2
Where, WW/E = Wet weather/emergency storage (days)
Delta P = 20-year variation from 5-year return monthly design precipitation
(in). Reference Appendix, Section 6.3
WLRC = Wastewater loading rate in most critical water balance month
(in/month). Reference Section 3.7.2
3.9.3 Water Balance Storage
Water balance storage is a function of wastewater flow, wetted field area and the wastewater
loading rate. Therefore, before the water balance storage volume can be determined, the actual,
rather than design wastewater loading rate must be calculated. In order to calculate the WLR,
the areas necessary to eliminate the operational and the wet-weather and emergency storage
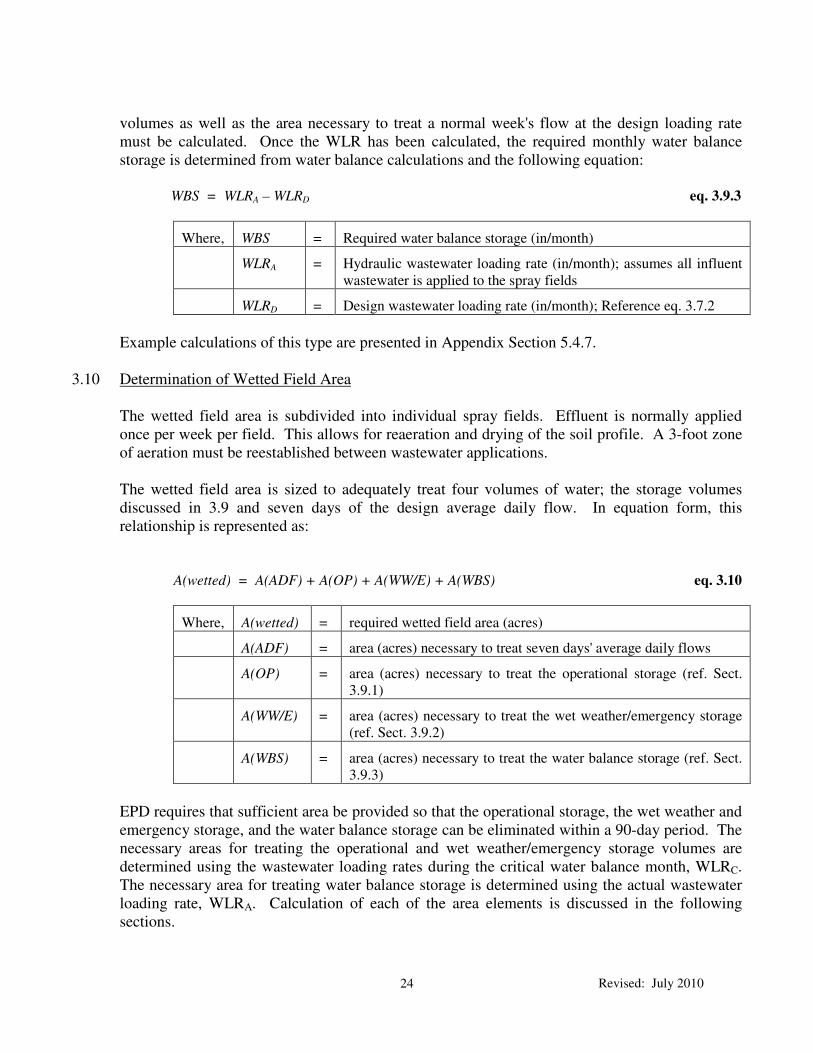
Revised: July 2010 24
volumes as well as the area necessary to treat a normal week's flow at the design loading rate
must be calculated. Once the WLR has been calculated, the required monthly water balance
storage is determined from water balance calculations and the following equation:
WBS = WLRA – WLRD eq. 3.9.3
Where, WBS = Required water balance storage (in/month)
WLRA = Hydraulic wastewater loading rate (in/month); assumes all influent
wastewater is applied to the spray fields
WLRD = Design wastewater loading rate (in/month); Reference eq. 3.7.2
Example calculations of this type are presented in Appendix Section 5.4.7.
3.10 Determination of Wetted Field Area
The wetted field area is subdivided into individual spray fields. Effluent is normally applied
once per week per field. This allows for reaeration and drying of the soil profile. A 3-foot zone
of aeration must be reestablished between wastewater applications.
The wetted field area is sized to adequately treat four volumes of water; the storage volumes
discussed in 3.9 and seven days of the design average daily flow. In equation form, this
relationship is represented as:
A(wetted) = A(ADF) + A(OP) + A(WW/E) + A(WBS) eq. 3.10
Where, A(wetted) = required wetted field area (acres)
A(ADF) = area (acres) necessary to treat seven days' average daily flows
A(OP) = area (acres) necessary to treat the operational storage (ref. Sect.
3.9.1)
A(WW/E) = area (acres) necessary to treat the wet weather/emergency storage
(ref. Sect. 3.9.2)
A(WBS) = area (acres) necessary to treat the water balance storage (ref. Sect.
3.9.3)
EPD requires that sufficient area be provided so that the operational storage, the wet weather and
emergency storage, and the water balance storage can be eliminated within a 90-day period. The
necessary areas for treating the operational and wet weather/emergency storage volumes are
determined using the wastewater loading rates during the critical water balance month, WLRC.
The necessary area for treating water balance storage is determined using the actual wastewater
loading rate, WLRA. Calculation of each of the area elements is discussed in the following
sections.
Revised: July 2010 25
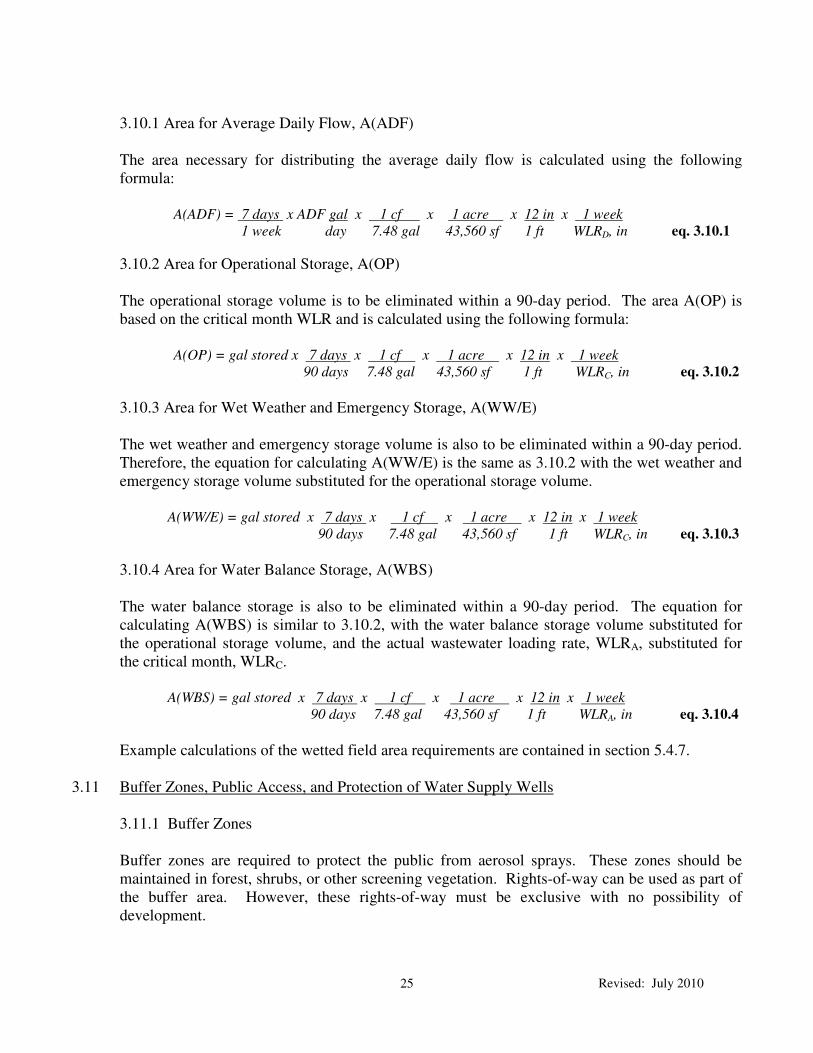
3.10.1 Area for Average Daily Flow, A(ADF)
The area necessary for distributing the average daily flow is calculated using the following
formula:
A(ADF) = 7 days x ADF gal x 1 cf x 1 acre x 12 in x 1 week
1 week day 7.48 gal 43,560 sf 1 ft WLRD, in eq. 3.10.1
3.10.2 Area for Operational Storage, A(OP)
The operational storage volume is to be eliminated within a 90-day period. The area A(OP) is
based on the critical month WLR and is calculated using the following formula:
A(OP) = gal stored x 7 days x 1 cf x 1 acre x 12 in x 1 week
90 days 7.48 gal 43,560 sf 1 ft WLRC, in eq. 3.10.2
3.10.3 Area for Wet Weather and Emergency Storage, A(WW/E)
The wet weather and emergency storage volume is also to be eliminated within a 90-day period.
Therefore, the equation for calculating A(WW/E) is the same as 3.10.2 with the wet weather and
emergency storage volume substituted for the operational storage volume.
A(WW/E) = gal stored x 7 days x 1 cf x 1 acre x 12 in x 1 week
90 days 7.48 gal 43,560 sf 1 ft WLRC, in eq. 3.10.3
3.10.4 Area for Water Balance Storage, A(WBS)
The water balance storage is also to be eliminated within a 90-day period. The equation for
calculating A(WBS) is similar to 3.10.2, with the water balance storage volume substituted for
the operational storage volume, and the actual wastewater loading rate, WLRA, substituted for
the critical month, WLRC.
A(WBS) = gal stored x 7 days x 1 cf x 1 acre x 12 in x 1 week
90 days 7.48 gal 43,560 sf 1 ft WLRA, in eq. 3.10.4
Example calculations of the wetted field area requirements are contained in section 5.4.7.
3.11 Buffer Zones, Public Access, and Protection of Water Supply Wells
3.11.1 Buffer Zones
Buffer zones are required to protect the public from aerosol sprays. These zones should be
maintained in forest, shrubs, or other screening vegetation. Rights-of-way can be used as part of
the buffer area. However, these rights-of-way must be exclusive with no possibility of
development.

Revised: July 2010 26
The following minimum buffer zones must be provided for all land treatment systems utilizing
spray irrigation:
a. A 150-foot buffer must be maintained between the edge of the wetted field area
and all property lines.
b. A 300-foot buffer must be maintained between the wetted field area and any
habitable structure.
c. A 150-foot buffer must be maintained between the edge of the wetted field area
and any internal and external public roads.
d. Internal roads that are closed to public use do not require buffer zones. However,
spray irrigation on these roads is prohibited.
e. A 100-foot buffer is required between the wetted edge of spray fields and the edge
of any perennial lake or stream. A 50-foot buffer is required between spray fields
and any channelized, intermittent watercourse. If wastewater application causes
an intermittent watercourse to become perennial, the 100-foot buffer requirement
will then apply.
f. A 150-foot buffer must be maintained between the property line and any part of
the preapplication treatment facility and storage pond.
g. A 300-foot buffer must be maintained between any habitable structure and any
part of the pretreatment facility and storage pond.
When deemed necessary by EPD, buffer zone requirements may be increased or added based on
site-specific conditions.
3.11.2 Public Access
Public access to the spray fields should be discouraged by posting signs and maintaining well-
vegetated buffer zones. Fencing of spray fields in remote areas is usually not required.
However, fencing and access road gates should be provided along property lines adjacent to
residential and other developed areas. Fencing is required at preapplication treatment facilities,
pump stations, and holding ponds.
3.11.3 Protection of Water Supply Wells
The potential effect of a land treatment system on a water supply aquifer is site-specific and
difficult to predict. Abandoned wells within the treatment site must be identified as well as all
public and private water supply wells within 2500 linear feet (L.F.) of the land treatment site. It
must be clearly shown (through an evaluation of the depth of the water supply aquifer, its
gradient, the condition of the aquitard, the condition of existing water supply wells, and their
capacity) that the LAS will not have any effect on those wells. Shallow and poorly constructed
wells adjacent to and within the land treatment system will require abandonment and sealing.
3.12 Surface Drainage and Runoff Control
Drainage of storm runoff should be considered in design. Spray fields must be protected against

Revised: July 2010 27
flooding, ponding, and erosion. Runoff from upgradient areas should be channelized through or
around the site. However, the collection and channelization of irrigated wastewater must be
avoided. Direct application of wastewater to drainage ditches and seasonal watercourses is
prohibited.
A properly designed and operated slow-rate land treatment system will not produce direct runoff;
i.e., all water applied will either evaporate or infiltrate into the soil profile. Sites that experience
direct runoff as a result of wastewater application will be required to reduce hydraulic loading
rates. Indirect runoff as a result of interflow, changes in slope, and shallow restrictive soil layers
can be expected at some land treatment sites. Indirect runoff is acceptable when it is dispersed
over a wide area. However, monitoring of streams affected by such indirect runoff may be
required.
3.13 Subsurface Drainage
Sites with a seasonal high water table less than 5 feet from the surface will not be accepted for
slow-rate land treatment unless drainage improvements are made. A 3-foot zone of re-aeration
between wastewater applications is generally desirable.
3.14 Distribution Systems and Construction
3.14.1 General
Hydraulic calculations for the pump and distribution system must be submitted with the plans
and specifications. Spray field pressure variation due to friction loss and static head for solid set,
uniformly spaced systems should not exceed +/-10 percent of the design spray nozzle pressure.
IMPORTANT: The spray fields must be laid out so that the irrigation lines generally follow the
contours of the site. The engineer must visit the site when the contractor is laying the lines out to
verify that they do follow the contours and that the 50-foot buffer is maintained from intermittent
streams, including drainage ways that may not have been apparent from the topographical map(s)
used to design the system.
Secondary mist nozzles on impact sprinklers should not be used. These saturate the ground
around the sprinkler riser and undermine the riser's support. They also make it impossible to
inspect operating sprinklers without getting wet.
PVC risers must not be used. EPD recommends that flexible connections be used to connect the
risers to the distribution line.
3.14.2 Access, Flow Measurement, and Controls
The layout of spray fields and spray field roads should provide easy access for inspection and
maintenance of the distribution system. Control valves should be installed so that they are readily
accessible for maintenance and replacement (i.e., either above ground or in a valve pit). We

Revised: July 2010 28
recommend cast iron valve boxes with concrete collars. In addition to control valves for each
field, we highly recommend installation of a shut-off valve for each lateral and each sprinkler.
Experience has shown that such valves will expedite maintenance of the system. Taps located
near the most distant sprinklers must be provided in each field so pressure gauges can be easily
used to verify operating pressures and to locate pressure losses. Spray field access roads must be
designed for all-weather use. Steep grades should be avoided. Irrigation on access roads is
prohibited.
A flow-totalizing recorder is required on the discharge of each irrigation pump station to measure
the volume of wastewater applied to the spray fields.
A low-pressure detection system (with sensors in each field for large systems) must be provided
to automatically shut down irrigation pumps in the event of force main, submain, or lateral
blowout. Similarly, a high pressure shut-off at the irrigation pumps must be provided. In
conjunction with these systems there must be an indicator alarm or an autodialer that alerts the
operator of an early pump shutdown. Depending on the operational control system for the spray
fields, automatic shut-off controls for high intensity rainfall and/or high wind speeds may be
required.
3.14.3 Freeze Protection
EPD requires that aboveground piping systems should drain when depressurized. Pipe drains
should discharge either to the spray fields or to the storage pond(s) and must not produce runoff.
3.14.4 Construction Disturbance, System Start-up and Testing
Construction activities associated with distribution systems can greatly alter the infiltration rate
of spray field soils. Construction disturbance within spray fields must be kept to an absolute
minimum. Excessive compaction of surface soils by construction equipment must be avoided.
Where land clearing is a part of the construction, final permeability testing must be performed
and the permeability must not change more than 15%. The permitted capacity of the system may
be decreased by EPD if the permeability is significantly reduced.
Regrading of pipeline trenches must match original contours. Subsidence of trench backfill must
be repaired, as this promotes channelization of runoff and erosion. Cuts or benches on slopes are
not permissible. These disturbances intercept shallow, subsurface flow also promoting
channelized runoff and erosion.
In forested systems, it is necessary to grub only the pipe centerline. Excessive clearing and
grubbing should be avoided. Clearing for aboveground piping systems should involve only
vegetation that will interfere with operation of the system. All areas disturbed by construction
must be re-vegetated immediately. Areas in which seedlings are to be planted must have a cover
crop of grass provided during the first three years following planting of the seedlings.
IMPORTANT: Before seeding or sprigging grass or ground cover in all areas of fields

Revised: July 2010 29
disturbed by construction, the land should be plowed to a depth of 16 inches with chisel plows.
Sloped areas may require protection from erosion. The Manual for Erosion and Sedimentation
Control in Georgia, published by the State Soil & Water Conservation Committee, should be
used as a guide for erosion and sedimentation control during construction of land treatment
systems.
Pressure testing of the irrigation force mains and laterals must be conducted during installation to
avoid damage to spray fields from re-excavation and repair. Extensive flushing is usually
necessary to clear distribution system pipes of materials that may clog sprinkler nozzles. Care
should be exercised to prevent erosion or flooding of the spray fields during pipeline flushing.
Every effort should be made to keep trash and debris out of the distribution system. Sprinklers
and drain valves should be checked for proper operation prior to installation.
Bare soil resulting from construction can tolerate only short periods of wastewater application
before producing runoff. Irrigation of bare soil compacts the soil surface, reduces the infiltration
rate, promotes erosion, and hinders the establishment of vegetation. In addition, the treatment
capacity of bare soil is poor. Wastewater irrigation on bare soil is not allowed beyond what is
necessary to establish a vegetative cover. Wastewater application at the design rate can begin
only when a uniform vegetative cover has been established. Specifications for spray field
construction must include a re-vegetation performance standard and this standard must be
enforced.
EPD recommends that spray fields be developed before preapplication treatment facilities are
constructed. This allows time for a vegetative cover to be reestablished on construction-
disturbed areas. Potable, ground, or surface water should be used for distribution system testing
and irrigation to establish vegetation. Since one to three growing seasons may be required
before newly constructed spray fields can accept the design wastewater loading, this start-up
period must be considered in the design and operation of land treatment systems.

Revised: July 2010 30
4.0 GUIDELINES AND CRITERIA FOR SITE MANAGEMENT
4.1 Operation and Management of Slow-Rate Land Treatment Systems
As discussed in Section 2.3, the facility’s LAS Permit will require the owner or owner's engineer
to write an Operations Manual (OM). This manual covers operation of both the spray fields and
preapplication treatment facility. It provides a management scheme consistent with the basis of
design outlined in the DDR. An outline for the scope of the OM Manual is presented in
Appendix Section 5.1.
4.2 Monitoring Requirements
4.2.1 General
There are two objectives for a monitoring program at a land application site. The first is to
satisfy the permit requirements set by EPD. The second objective is to provide the data
necessary to optimize the system's operation. The data to meet the second objective may or may
not be the same as that required by the permit. The facility's OM should address the data needs
for optimum plant operation.
4.2.2 Preapplication Treatment Facility and Storage Pond(s)
Influent to the preapplication treatment system and treated effluent applied to the spray fields
must be monitored. Parameters which may require monitoring under the system's permit
include: influent flow, volume of water applied to the spray fields, BOD (influent & effluent),
suspended solids (influent & effluent), fecal coliform bacteria, pH (influent & effluent),
ammonia nitrogen, nitrate nitrogen, total Kjeldahl nitrogen, total phosphorus, chloride, Na, K,
Ca, Mg, metals, and priority pollutants. The parameters included in the permit monitoring
requirements and the sampling frequency for those parameters will be determined on a case-by-
case basis and will be dependent on site conditions.
4.2.3 Groundwater
A system is required for monitoring the quality of groundwater influenced by the land treatment
system. Groundwater leaving the spray site boundaries must meet drinking water standards.
Subsurface geology and the direction of groundwater flow determine the placement and depth of
monitoring wells. EPD recommends the development of a groundwater potentiometric surface
map prior to startup of the facility. Minimum monitoring well requirements are as follows:
a. One well upgradient or otherwise outside the influence of the land treatment site
for background monitoring.
b. One well within the wetted field area of each drainage basin intersected by the
land treatment site.
c. Two wells downgradient of the wetted field area in each drainage basin

Revised: July 2010 31
intersected by the land treatment site. Downgradient wells will be considered
compliance points and must be located within 50-ft of the wetted perimeter of the
application site(s).
d. For smaller systems, the recommendations listed above may be reduced on a case-
by-case basis. Larger sites or sites with complicated surface and/or groundwater
drainage may require additional monitoring wells.
e. All monitoring wells must extend to sufficient depth to sample seasonal
fluctuations of the unconfined water table. Wells must not extend through
confining layers.
f. Monitoring wells must be provided with casings and screens. The casing must be
backfilled and sealed to prevent entry of surface water. This seal should include a
concrete apron surrounding the well at the surface. Care should be taken to avoid
contamination of wells both during and after construction.
g. IMPORTANT: Monitoring wells must be numbered and locked.
h. Monitoring wells should follow a labeling convention that utilizes a U, M, and D
designation for upgradient, middle, and downgradient well locations, respectively.
EPD suggests that monitoring well construction generally conform to the Manual for
Groundwater Monitoring which was developed as a reference for the design and construction of
groundwater monitoring wells at slow-rate land treatment systems (see Figure 4.2-1). Additional
sources for well installation guidance include ASTM Standard D5092, Standard Practice for
Design and Installation of Ground Water Monitoring Wells or USEPA Science and Ecosystem
Support Division’s Design and Installation of Monitoring Wells.
Monitoring of the groundwater under the LAS permit may require measurement of one or more
of the following parameters: depth to groundwater, pH, nitrate nitrogen, total phosphorus,
electrical conductivity, chloride, fecal coliform bacteria, metals and priority pollutants. The
parameters included in the permit monitoring requirements and the sampling frequency for those
parameters will be determined on a case-by-case basis and will be dependent on site conditions.
EPD also encourages the installation and monitoring of soil water lysimeters within the wetted
field area. These are useful as trend monitoring devices to identify problems before the
groundwater system is affected.
4.2.4 Surface Water and Drainage Systems
When a perennial stream traverses or lies at the boundary of a slow-rate land treatment site,
water quality monitoring of this stream may be required. The parameters and frequency of
monitoring will be specified as a condition in the facility's LAS Permit. Sampling upstream and
downstream of the wetted field area as well as flow measurement may also be required.
Land treatment systems incorporating drainage improvements that result in a point discharge to
surface waters must apply for a National Pollutant Discharge Elimination System (NPDES)
Permit. In addition to requiring an OM, the NPDES Permit will include effluent limits,
monitoring parameters, and sampling frequencies for the drainage system. The intent of this
monitoring is to ensure complete renovation of the irrigated wastewater before discharge.

Revised: July 2010 32
4.2.5 Soil
Representative soil samples from each major soil series within the wetted field area must be
taken and analyzed according to requirements in the facility’s LAS permit. In particular, soil pH
is an indicator of changes in soil chemistry. If the soil pH changes significantly, additional
analyses may be required.
Land treatment systems receiving industrial process wastes may be required to monitor metals,
salts, and priority pollutants in site soils and possibly vegetation. The parameters and
frequencies will be determined on a case-by-case basis.
4.2.6 Rainfall and Climatic Data
Monitoring of daily rainfall at the land application site is required. Antecedent precipitation and
soil moisture conditions can be correlated to provide an operating scheme for the system.
Monitoring of wind speed and direction may also be required.
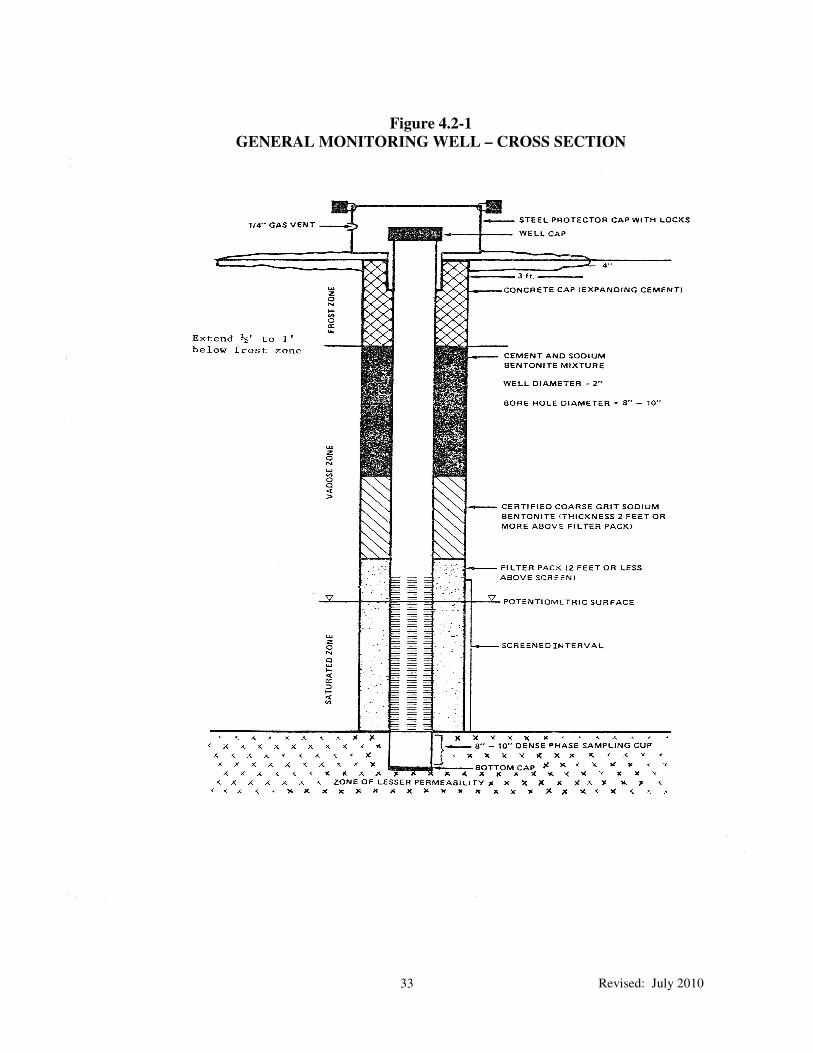
Revised: July 2010 33
Figure 4.2-1
GENERAL MONITORING WELL – CROSS SECTION

Revised: July 2010 34
5.0 APPENDICES
5.1 Operations Manual for Slow-Rate Land Treatment Systems
The manual should include, but not be limited to, the following:
5.1.1 Introduction
A. System Description:
1. A narrative description and process design summary for the land treatment facility
including the design wastewater flow, design wastewater characteristics,
preapplication treatment system, and spray fields.
2. A map of the land treatment facility showing the preapplication treatment system,
storage pond(s), spray fields, buffer zones, roads, streams, drainage system
discharges, monitoring wells, etc.
3. A map of interceptor sewers, force mains, and major pump stations tributary to
the land treatment facility. Indicate their size and capacity.
4. A schematic and plan of the preapplication treatment system and storage pond(s)
identifying all pumps, valves, and process control points.
5. A schematic and plan of the irrigation system identifying all pumps, valves,
gauges, sprinklers, etc.
B. Discuss the design life of the facility and factors that may shorten its useful life. Include
procedures or precautions that will compensate for these limitations.
C. A copy of the facility's Land Application System (LAS) Permit.
D. A copy of the facility’s National Pollutant Discharge Elimination System (NPDES)
permit, if applicable.
5.1.2 Management and Staffing
A. Discuss management's responsibilities and duties.
B. Discuss staffing requirements and duties:
1. Describe the various job titles, number of positions, qualifications, experience,
training, etc.
2. Define the work hours, duties and responsibilities of each staff member.
5.1.3 Facility Operation and Management
A. Preapplication Treatment System:
1. Describe how the system is to be operated.
2. Discuss process control.
3. Discuss maintenance schedules and procedures.
B. Irrigation System Management:
1. Wastewater Application. Discuss how the following will be monitored and
controlled. Include rate and loading limits.
a. Wastewater loading rate (inches/week)
Revised: July 2010 35
b. Wastewater application rate (inches/hour)
c. Spray field application cycles
d. Organic nitrogen and phosphorus loadings (lbs/acre/month, etc.)
2. Discuss how the system is to be operated and maintained.
a. Storage pond(s)
b. Irrigation pump station(s)
c. Spray field force main(s) and laterals
3. Discuss start-up and shutdown procedures.
4. Discuss system maintenance.
a. Equipment inspection schedules
b. Equipment maintenance schedules
5. Discuss operating procedures for adverse conditions.
a. Wet weather
b. Freezing weather
c. Saturated soil
d. Excessive winds
e. Electrical and mechanical malfunctions
6. Provide troubleshooting procedures for common or expected problems.
7. Discuss the operation and maintenance of back-up, stand-by, and support
equipment.
C. Vegetation and Nutrient Management Plan (NMP):
1. Discuss how the selected cover crop is to be established, monitored, and
maintained.
2. Discuss cover crop cultivation procedures, harvesting schedules, and uses.
3. Discuss buffer zone vegetative cover and its maintenance.
4. Discuss winter overseeding requirements
5. Discuss supplemental nutrient requirements
D. Drainage System (if applicable):
1. Discuss operation and maintenance of surface drainage and runoff control
structures.
2. Discuss operation and maintenance of subsurface drainage systems.
5.1.4 Monitoring Program (reference Section 4.2)
A. Discuss sampling procedures, frequency, location, and parameters for:
1. Preapplication treatment system.
2. Irrigation System:
a. Storage pond(s)
b. Groundwater monitoring wells
c. Drainage system discharges (if applicable)
d. Surface water (if applicable)
B. Discuss soil sampling and testing.
C. Discuss ambient conditions monitoring:
1. Rainfall
2. Wind speed

Revised: July 2010 36
3. Soil moisture
D. Discuss the interpretation of monitoring results and facility operation:
1. Preapplication treatment system.
2. Spray fields
3. Groundwater
4. Soils
5.1.5 Records and Reports
A. Discuss maintenance records:
1. Preventive
2. Corrective
B. Monitoring reports and/or records should include:
1. Preapplication treatment system and storage pond(s).
a. Influent flow
b. Influent and effluent wastewater characteristics
2. Irrigation System
a. Wastewater volume applied to spray fields
b. Spray field scheduling
c. Loading rates
3. Groundwater Depth
4. Drainage system discharge parameters (if applicable)
5. Surface water parameters (if applicable)
6. Soils data
7. Rainfall and climatic data
5.2 Thornwaite Potential Evapotranspiration
The Thornthwaite Potential Evapotranspiration (P.E.T.) is defined as "the amount of water which
will be lost from the surface completely covered with vegetation if there is sufficient water in the
soil at all times for use of the vegetation." The Thornthwaite method is an empirical equation
developed from correlations of mean monthly air temperature with evapotranspiration from
water balance studies in valleys of the east-central United States, where soil moisture conditions
do not limit evapotranspiration (The Irrigation Association, 1983, pp. 112 to 114). The
Thornthwaite method is applicable to slow-rate land treatment systems in the southeast United
States, including Georgia. It is not applicable to arid and semi-arid regions west of the
Mississippi River.
The Thornthwaite equation is outlined below. Note that the results are expressed in inches (in)
for a 30-day month. The P.E.T. results must be modified by the actual number of days in each
month. Finally, for water balance calculations as described in Section 3.7, a 30-year record of
historical climatic data (referred to as the climatological normal) is required to determine
monthly temperature normals used in the Thornthwaite equation.

Revised: July 2010 37
P.E.T. = 1.6 x Ld x [(10 x T)/I] A x (1in / 2.54 cm) eq. 5.2.1
Where, P.E.T. = 30-day Thornthwaite Potential Evapotranspiration (in)
Ld = Daylight hours in units of 12 hours (reference Table 5.2-1)
T = Mean (normal) monthly air temperature in degrees Celsius
I = Annual heat index obtained by summing the 12 monthly heat indexes, i,
where: i = (T/5)1.514
A = Power term derived from annual heat index, I, where:
A = 0.000000675(I)3 - 0.0000771(I)
2 + 0.01792(I) + 0.49239
Table 5.2-1
MONTHLY AVERAGE DAYLIGHT HOURS AS
A FUNCTION OF LATITUDE
Daylight (x 12 hours)a
Month at 30O Latitude at 35
O Latitude
January 0.90 0.87
February 0.87 0.85
March 1.03 1.03
April 1.08 1.09
May 1.18 1.21
June 1.17 1.21
July 1.20 1.23
August 1.14 1.16
September 1.03 1.03
October 0.98 0.97
November 0.89 0.86
December 0.88 0.85
a Values for sites between 30 and 35 degrees latitude should be interpolated.
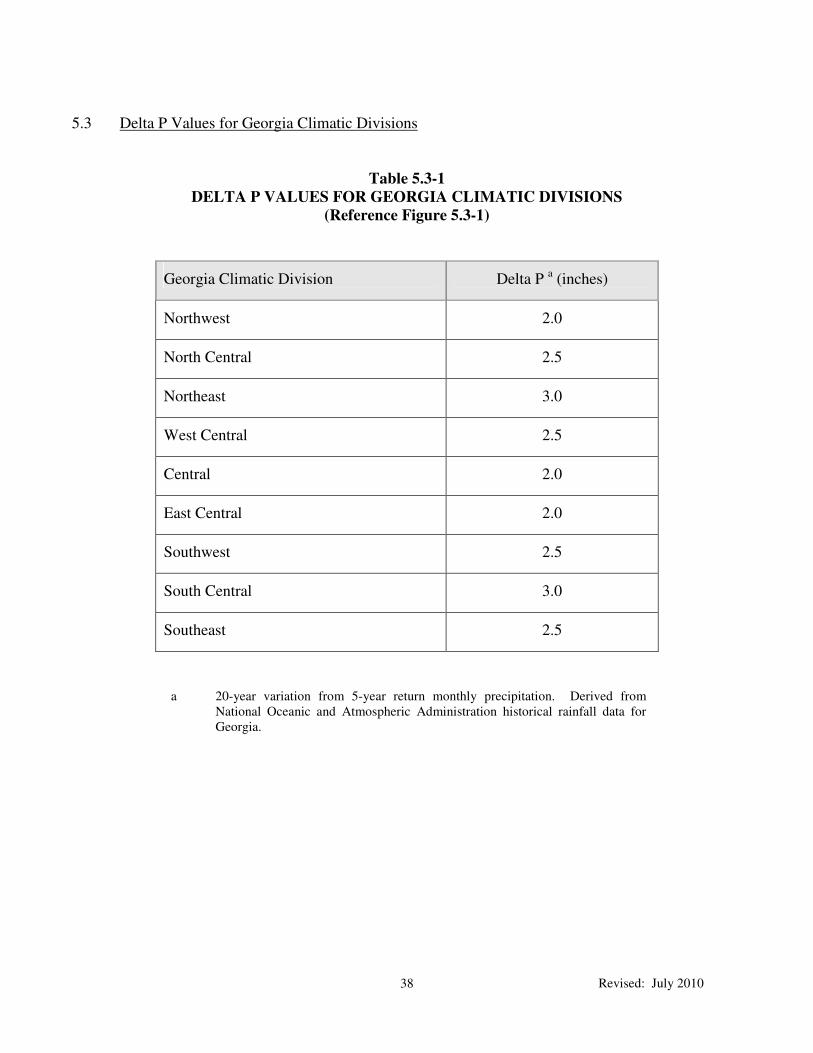
Revised: July 2010 38
5.3 Delta P Values for Georgia Climatic Divisions
Table 5.3-1
DELTA P VALUES FOR GEORGIA CLIMATIC DIVISIONS
(Reference Figure 5.3-1)
Georgia Climatic Division Delta P a (inches)
Northwest 2.0
North Central 2.5
Northeast 3.0
West Central 2.5
Central 2.0
East Central 2.0
Southwest 2.5
South Central 3.0
Southeast 2.5
a 20-year variation from 5-year return monthly precipitation. Derived from
National Oceanic and Atmospheric Administration historical rainfall data for
Georgia.

Revised: July 2010 39
Figure 5.3-1
GEORGIA CLIMATIC DIVISIONS

Revised: July 2010 40
5.4 Example Calculations
5.4.1 Introduction and Assumptions
Design of slow-rate land treatment systems is a process of balancing site limitations against
construction and operating costs. The following example calculations are for a hypothetical 4-
MGD facility in the North Central Piedmont area of Georgia. They illustrate the basic
computations required and the relationship between variables.
The following assumptions were made. They must not be used for real world systems without
verification.
a. The average design flow is 4.0 MGD with a daily peak factor of 2 and a weekly
peak factor of 1.25.
b. The land treatment site is moderately well drained with seasonal high
groundwater more than 5 feet below the surface. The most limiting layer in the
soil profile occurs at a depth of 2 to 4 feet. Testing for saturated vertical
hydraulic conductivity indicates an average permeability for this layer of 0.00015
cm/s corresponding to 0.213 inches/hour.
c. The annual average precipitation is 49 inches. Evapotranspiration is estimated at
the rate computed by the Thornthwaite equation.
d. Nitrogen concentrations in effluent from the preapplication treatment system are
as follows:
Total Nitrogen as N 20 mg/L
Ammonia Nitrogen 15 mg/L
e. Nitrogen is applied to the site through rainfall and fixation at a rate of 5 lbs/acre-
year.
f. Maximum loss to ammonia volatilization is 5% of the total ammonia applied.
Maximum loss to denitrification for pine forest is 15% of the total nitrogen
applied. Maximum loss to denitrification for Coastal Bermuda/Ryegrass is 10%
of the total nitrogen applied.
g. Conservative net uptake of nitrogen in pine forest with understory growth is 175
lbs/acre-year. Table 3.8-1 shows a nitrogen content of 1.88% for Coastal
Bermuda and 1.67% for Ryegrass. Anticipated yields for a double-cropped
system are as follows:
5 tons/acre of Bermuda during summer (April - September)
1 ton/acre Bermuda, 1.5 tons/acre of Ryegrass during winter
(October - March)
This equates to an estimated crop nitrogen uptake of 188 lbs/acre during the
summer and 88 lbs/acre during winter.
h. Delta P from Table 5.3-1 is assumed to be 2.5 inches.

Revised: July 2010 41
5.4.2 Design Percolation
As stated in Section 5.4.1, the average permeability of the most limiting soil layer is 0.213
inches/hour. As this limiting layer occurs at a depth less than 5 feet, 10 percent of this value will
be used for design (reference Section 3.6.2). The design percolation rate becomes:
0.10 x (0.213 in/hr) x (24 hr/day) = 0.51 in/day
5.4.3 Water Balance
Water balance calculations for the hypothetical 4-MGD land treatment system are presented in
Table 5.4-1. This table makes use of eq. 3.7.2 to determine maximum allowable monthly
hydraulic wastewater loadings.
Thornthwaite potential evapotranspiration and 5-year return monthly precipitation values for
Atlanta are used in Table 5.4-1. The table indicates that for the assumed site conditions, the most
critical water balance month is March, with a maximum allowable wastewater loading of 8.7
inches, corresponding to a rate of 2.0 inches/week. Therefore, a design wastewater loading rate
greater than 2.0 inches/week will require water balance storage. Conversely, no water balance
storage will be required for a design wastewater loading rate less than 2.0 inches/week
(reference Section 3.9.3).
5.4.4 Nitrogen Balance
The nitrogen balance is used to evaluate wastewater loadings possible under different cover crop
and management schemes. Tables 5.4-2, 5.4-3, and 5.4-4 present nitrogen balances for cover
crop alternatives of pine forest and grass. Only an annual average is prepared for forested
systems. Both summer and winter averages are prepared for grasses and other crops.
To meet a percolate nitrate limit of 7 mg/L, Table 5.4-2 indicates a pine forest cover crop will
require a design wastewater loading rate less than 1.75 inches/week. Tables 5.4-3 and 5.4-4
indicate that a crop of Coastal Bermuda/Ryegrass will allow a design wastewater loading rate up
to the maximum of 2.5 inches/week in summer and 1.75 inches/week in winter. The final cover
crop selected is an economic decision balancing wetted area and storage requirements against
operating cost.

Revised: July 2010 42
Table 5.4-1
WATER BALANCE CALCULATIONS
Month Evap a Perc
b Precip
c Wastewater Loading Rates
(in/month) (in/month) (in/month) (in/month) d
(in/week) e
January 0.4 15.8 6.5 9.7 2.2
February 0.5 14.4 6.1 8.8 2.2
March 1.3 15.8 8.5 8.6 2.0 f
April 2.5 15.3 6.3 11.5 2.5 g
May 4.3 15.8 5.8 14.3
2.5
June 5.6 15.3 5.0 15.9 2.5
July 6.5 15.8 6.8 15.5 2.5
August 6.0 15.8 5.3 16.5 2.5
September 4.2 15.3 4.7 14.8 2.5
October 2.5 15.8 4.2 14.1 2.5
November 1.1 15.3 5.9 10.5 2.4
December 0.5 15.8 6.0 10.3 2.3
Total 35.2 186.4 71.1 150.5
a Thornthwaite average monthly evapotranspiration. (P.E.T.)
b Number of days per month x 0.51 in/day (design percolation from Section 5.4.2)
c
Five-year return, monthly precipitation
d Wastewater loading rate (in/month) = Evap + Perc – Precip.
e Wastewater loading rate (in/week) = WLR (in/month) / 4.42 (weeks/month). The maximum
allowable is 2.5 in/week.
f 2.0 in/week (WLRC) is the lowest value in column 6. In this example the month of March is the
most critical water balance month.
g 11.5 in/month / 4.29 weeks/month = 2.7 in/week. Since 2.7 > maximum allowable, 2.5 in/week
should be used, as (WLRD).

Revised: July 2010 43
Table 5.4-2
NITROGEN BALANCE, PINE FOREST
1. Average Daily Flow ADF (MGD) 4.0 a 4.0 4.0 4.0
2. Average Design Wastewater Loading Rate (in/week) 1.25 b 1.5 1.75 2.0
3. ADF Wetted Area (acre) 825 c 687 589 516
4. Nitrogen Input from Wastewater (lbs/acre-year) 295 d 355 414 472
5. Nitrogen Input from Rainfall and Fixation (lbs/acre-year) 5 e 5 5 5
6. Total Nitrogen Input (lbs/acre-year) 300 f 360 419 477
7. Ammonia Volatilization @ 5% of Ammonia applied (lbs/acre-year) 11 g 13 16 18
8. Denitrification @ 15% of Total Nitrogen applied (lbs/acre-year) 44 h 53 62 71
9. Net Plant Uptake and Storage (lbs/acre-year) 175 i 175 175 175
10. Nitrogen Leached by Percolate (lbs/acre-year) 70 j 118 166 214
11. Precipitation (in/year) 49 k 49 49 49
12. Wastewater Applied (in/year) 65 l 78 91 104
13. Potential Evapotranspiration P.E.T. (in/year) 35 m 35 35 35
14. Percolate (in/year) 79 n 92 105 118
15. Estimated Percolate Total Nitrogen (mg/L) 3.9 o 5.7 7.0 8.0
a Given value, 4 MGD
b Selected design loading(s)
c 7 days/week x 4,000,000 gal/day x 12 in/ft
7.48 gal/cu ft x 43,560 sq ft/acre x 1.25 in/week
d Given Total Nitrogen value = 20 mg/L: 20 mg/L x 4 MGD x 8.34 lb/gal x 365 day/year
Line 3 value
e Constant from atmosphere, 5 lbs/acre-year
f Line 4 value + Line 5 value
g Given Ammonia Nitrogen value = 15 mg/L: 15 mg/L x 4 MGD x 8.34 lbs/gal x 365 day/year x 0.05
Line 3 value
h Line 6 value x 0.15
i Given, based on selected cover crop
j Line 6 value - Line 7 value - Line 8 value - Line 9 value
k Given, average precipitation value
l Line 2 value x 52 wks/year
m From Table 6.4.1
n Line 11 value + Line 12 value - Line 13 value
o Line 10 value x 453,600 mg/lb
Line 14 value x 102,750 L/acre-inch

Revised: July 2010 44
Table 5.4-3
NITROGEN BALANCE, COASTAL BERMUDA/RYEGRASS, SUMMER
1. Average Daily Flow ADF (MGD) 4.0 4.0 4.0 4.0
2. Average Design Wastewater Loading Rate (in/week) 1.75 2.0 2.25 2.5
3. ADF Wetted Area (acre) 589 516 458 412
4. Nitrogen Input from Wastewater (lbs/acre-period) 207 a 236 266 296
5. Nitrogen Input from Rainfall and Fixation (lbs/acre-period) 2.5 2.5 2.5 2.5
6. Total Nitrogen Input (lbs/acre-period) 210 239 269 299
7. Ammonia Volatilization @ 5% of Ammonia applied (lbs/acre-
period) 8 9 10 11
8. Denitrification @ 10% of Total Nitrogen applied (lbs/acre-period) 21 24 27 30
9. Net Plant Uptake and Storage (lbs/acre-period) 188 188 188 188
10. Nitrogen Leached by Percolate (lbs/acre-period) 0 b 18 44 70
11. Precipitation (in/period) 24 24 24 24
12. Wastewater Applied (in/period) 46 52 59 65
13. Potential Evapotranspiration P.E.T. (in/period) 29 29 29 29
14. Percolate (in/period) 40 47 53 60
15. Estimated Percolate Total Nitrogen (mg/L) 0.0 1.7 3.6 5.1
a For this example, it is assumed that a constant amount of Nitrogen is applied to the field throughout the
year. Actual design should take into account seasonal variations in N input.
Given Total Nitrogen value = 20 mg/L: 20 mg/L x 4 MGD x 8.34 lb/gal x 182.5 day/period
Line 3 value
b Calculated amount of Nitrogen leached by percolate is negative.

Revised: July 2010 45
Table 5.4-4
NITROGEN BALANCE, COASTAL BERMUDA/RYEGRASS, WINTER
1. Average Daily Flow ADF (MGD) 4.0 4.0 4.0 4.0
2. Average Design Wastewater Loading Rate (in/week) 1. 5 1.75 2.0 2.25
3. ADF Wetted Area (acre) 687 589 516 458
4. Nitrogen Input from Wastewater (lbs/acre-period) 177 207 236 266
5. Nitrogen Input from Rainfall and Fixation (lbs/acre-period) 2.5 2.5 2.5 2.5
6. Total Nitrogen Input (lbs/acre-period) 180 210 239 269
7. Ammonia Volatilization @ 5% of Ammonia applied (lbs/acre-
period) 7 8 9 10
8. Denitrification @ 10% of Total Nitrogen applied (lbs/acre-period) 18 21 24 27
9. Net Plant Uptake and Storage (lbs/acre-period) 88 88 88 88
10. Nitrogen Leached by Percolate (lbs/acre-period) 68 93 118 144
11. Precipitation (in/period) 25 25 25 25
12. Wastewater Applied (in/period) 39 46 52 59
13. Potential Evapotranspiration P.E.T. (in/period) 6 6 6 6
14. Percolate (in/period) 58 65 71 78
15. Estimated Percolate Total Nitrogen (mg/L) 5.2 6.4 7.4 8.2

Revised: July 2010 46
5.4.5 Operating Scheme
The operating scheme for the hypothetical 4-MGD facility is as follows:
a. The average initial design wastewater loading rate during summer will be 2.5
inches/week. The actual loading rate will be somewhat less than 2.5 inches/week
during normal operation because the additional acreage needed for treating the
operational storage, water balance storage and wet weather/emergency storage
will be used to treat the normal daily flows. This will be done in order to
maintain the cover crop regardless of whether there is any water in storage.
b. The average initial design wastewater loading rate during winter will be less than
or equal to 1.75 inches/week.
c. The maximum allowable instantaneous application rate is 0.213 in/hr (ref. 5.4.1-
b). For this example an instantaneous application rate of 0.20 in/hr will be used.
d. The cover crop will be Coastal Bermuda overseeded in the winter with Ryegrass.
The crop will be harvested and sold.
e. Normal operation will be five (5) days per week. The flow from the other two
days will be stored. Since the system will normally be operated five days per
week, the wastewater volume applied each day is:
[(7 days/week)/(5 days/week)] x 4 MGD = 5.6 MGD
5.4.6 Storage Volume Requirements
As discussed in Section 3.9, the required storage volume consists of three (3) separate storage
components.
a. Operational Storage
The operating scheme selected for design calls for irrigation five days per week
with storage of two days' flow. The required operational storage is:
(7 days - 5 days) x 4 MGD = 8 MG
For this example it is assumed that harvesting of the grass will not occur during
the wet weather months. Therefore, no additional storage will be needed for
fields out of service due to harvesting since the wet weather storage volume will
be available.
b. Wet Weather and Emergency Storage
Minimum requirements for wet weather and emergency storage are discussed in
Section 3.9.2. These are the greater of 12 days flow or the results of eq. 3.9.2 .
For the hypothetical facility, Delta P from Table 5.3-1 is 2.5 inches. The

Revised: July 2010 47
maximum allowable hydraulic wastewater loading rate in the most critical water
balance month (March) from Table 5.4-1 is 8.6 inches/month. By eq. 3.9.2:
2.5 inch x 365 days/year = 8.8 days
12 month/year x 8.6 in/month
8.8 days is less than the 12-day minimum storage requirement. Therefore, the
required wet weather and emergency storage is:
12 days x 4 MGD = 48 MG
c. Water Balance Storage
As discussed in section 3.9.3, the water balance storage is a function of hydraulic
loading rate, which is a function of the total wetted field area. Therefore, before
the water balance storage can be determined the wetted field area must be defined.
5.4.7 Wetted Field Area Determination
The area required for the spray site is the total of four separate components, as discussed in
Section 3.10.
A(wetted) = A(ADF) + A(OP) + A(WW/E) + A(WBS)
Substituting the appropriate loading rates and the appropriate volumes into equations 3.10.1 and
3.10.3 results in the following wetted area requirements:
A(ADF) = 7 days/wk operation x 4,000,000 gpd x 12 in/ft
7.48 gal/cf x 43,560 sf/acre x 1.75 a in/wk
a This site is nitrogen-limited in the winter at 1.75 in/week (see nitrogen
balance). If the site were hydraulically limited, the design wastewater
loading rate, (WLRD) would be used.
A(ADF) = 589 acres
A(WW/E) = 12 days storage x 4,000,000 gpd x 7 days/wk x 12 in/ft
7.48 gal/cf x 43,560 sf/acre x 90 days x 1.75 b in/wk
b 1.75 in/wk is the most critical wastewater loading rate, WLRC, since the site
is nitrogen-limited in winter at 1.75 in/wk (see nitrogen balance).
A(WW/E) = 79 acres

Revised: July 2010 48
A(OP) = 2 days storage x 4,000,000 gpd x 7 days/wk x 12 in/ft
7.48 gal/cf x 43,560 sf/acre x 90 days x 1.75 b in/wk
A(OP) = 13 acres
With these areas determined the next step is to define the necessary water balance storage and
the wetted field area associated with that storage. The actual wastewater loading rate (WLRA) is:
WLRA = 7 days/wk x 4,000,000 gpd x 12 in/ft
7.48 gal/cf x 43,560 sf/acre x 681 c acres
c A(ADF) 589 acres + A(WW/E) 79 acres + A(OP) 13 acres = 681 acres
WLRA = 1.51 in/wk
Table 5.4-5 combines eq. 3.7.2 and 3.9.3 to determine the required water balance storage
volume, V(WBS), for a loading rate of 1.51 in/wk. The table indicates a water balance storage
requirement of 0.0 inches over the wetted area. Storage for the most critical month (March) is:
V(WBS) = 0.0 in. x 681 acres x 7.48 gal/cf x 43,560 sf/acre = 0 MG
12 inches
Substituting the appropriate values into eq. 3.10.4:
A(WBS) = 0 gal x 7 days/wk x 12 in/ft .
90 days x 7.48 gal/cf x 43,560 sf/acre x 1.51 in/wk
A(WBS) = 0 acres
The total area necessary for this land treatment system is:
A(ADF) + A(OP) + A(WW/E) + A(WBS) = A(TOTAL)
589 acres + 13 acres + 79 acres + 0 acres = 681 acres

Revised: July 2010 49
Table 5.4-5
WATER BALANCE STORAGE
Month WLRA a WLRD
b WBS
c Sum WBS
d
(in/month) (in/month) (in/month) (in/month)
January 6.7 e 9.7
f 0.0 0.0
February 6.1 8.8 0.0 0.0
March 6.7 8.6
0.0 0.0
April 6.5 11.5 0.0 0.0
May 6.7 14.3 0.0 0.0
June 6.5 15.9 0.0 0.0
July 6.7 15.5 0.0 0.0
August 6.7 16.5 0.0 0.0
September 6.5 14.8 0.0 0.0
October 6.7 14.1 0.0 0.0
November 6.5 10.5 0.0 0.0
December 6.7 10.3 0.0 0.0
a Based on the number of days per month and the actual wastewater loading of 1.51 in/week,
assumes all influent wastewater is applied to spray fields.
b Values from Table 5.4-1
c WBS = Water balance storage, reference eq. 3.9.3. A negative WBS value indicates that no WBS
is required for that month. A positive WBS value indicates that WBS is required for that month.
d Cumulative sum of WBS values
e 31 days/month x 1.51 in/wk = 6.7 inches/month
7 days/week
f 6.7 - 9.7 = -3, the value is negative which indicates that no WBS is required for this month