2016 florida water wastewater rate survey · florida water & wastewater rate survey. ......
TRANSCRIPT

2016
FLORIDA WATER & WASTEWATER RATE SURVEY

F O R E WA R D

950 S. Winter Park Drive, Suite 240, Casselberry, FL 32707 / 2803 Fruitville Road, Suite 154, Sarasota, FL 34237
P: 407.960.1806 / F: 407.960.1803 / www.raftelis.com
The 2016 Florida Water and Wastewater Rate Survey (2016 Survey) is developed to provide insight into water and wastewater pricing practices currently utilized
by publicly owned utilities in the State of Florida. This is the third edition of the survey, which was first published in 2012.
The goal of this survey is focused on typical residential potable water/wastewater bills and rate structures for over 180 Florida public utilities. The respondents include small utilities serving a population less than 10,000 to the largest utilities in Florida with service populations of more than 1 million. The 2016 Survey includes utilities with a cumulative service population of more than 14.3 million people throughout Florida.
The rates shown are exclusive of utility taxes or outside-city rates for those jurisdictions that have such charges. Following this introduction is a discussion on why water rates differ, together with a narrative summarizing the survey results. Also included are statistics such as the gallons included in the first usage block, revenue recovery from fixed charges, minimum water bill levels, and other information. The survey table includes information related to population, water management district, residential monthly minimum water bill amounts, and bill amounts for usage at 4,000 and 8,000 gallons.
We would like to thank all of the participants in the 2016 Survey and extend a special thanks to Ken Small at the Florida League of Cities for his support on distributing the survey questionnaire. This survey was completed with the valuable assistance of Robin Chacko, Joe Williams, Kevin Dunham, Malinna San, David George,and Mike Rocca of Raftelis Financial Consultants, Inc.
We hope that you will find these results informative and look forward to continuing this biennial survey in the future.
Sincerely,RAFTELIS FINANCIAL CONSULTANTS, INC.
Tony Hairston Senior Manager

C O N T E N T SSections01 FACTORS AFFECTING RATES
04 OVERVIEW OF THE SURVEY
10 ADDITIONAL RESULTS
14 SURVEY RESULTS
Figures05 FIGURE A: Combined Monthly Water & Wastewater Bill at 4,000 Gallons
05 FIGURE B: Combined Monthly Water & Wastewater Bill at 8,000 Gallons
06 FIGURE C: Comparison of Average Monthly Water & Wastewater Bills at
4,000 and 8,000 Gallons for Utilities Reported in Both 2014 & 2016 Survey
07 FIGURE D: Monthly Water Charges at 4,000 Gallons
07 FIGURE E: Monthly Wastewater Charges at 4,000 Gallons
07 FIGURE F: Monthly Water Charges at 8,000 Gallons
07 FIGURE G: Monthly Wastewater Charges at 8,000 Gallons
07 FIGURE H: Surveyed Utilities by Population Size (Water)
08 FIGURE I: Surveyed Water Utilities by Water Management District
11 FIGURE J: Monthly Minimum Combined Bill
11 FIGURE K: Monthly Minimum Water Bill
11 FIGURE L: Monthly Minimum Wastewater Bill
12 FIGURE M: Water First Block Threshold
13 FIGURE N: Fixed Portion of Bills
13 FIGURE O: Distribution of Wastewater Billing Cap

{ 01 }2016 FLORIDA WATER AND WASTEWATER RATE SURVEY
FACTORS AFFECTING
RATES
SOURCE OF SUPPLY & WATER QUALITY
The source of a large portion of potable water supply in Florida is from underground aquifer sys-tems. Surface water and brackish groundwater are becoming more common sources as populations have increased and groundwater sources are not as plentiful. The quality of water and level of treat-ment necessary to meet regulatory requirements and maintain public acceptance varies greatly throughout the state due to the various sources. For example, communities located inland often re-quire lower levels of treatment compared to those along the coast with more brackish water. Other communities may have regulatory limits on the amount of high quality water available through their consumption use permits. Many communities are required to identify and plan for alternative water supplies, with these alternatives being much more expensive to treat than existing sources of supply. Finally, depending on the location of the source of supply, an expensive transmission system may be required to deliver potable water to the customer service area.
Effluent Disposal
Infrastructure Replacement
Regulatory Stringency
Connection Density
Decreasing Per Capita
Consumption
Water Restrictions
Efficiencies
Budget &TransferPolicies
Acquisitions & Contributions
Political Action
Source of Supply &
Water Quality
The 2016 Survey is focused on publicly owned utilities. Often util-ity infrastructure is the most valuable asset in a community. The rates es-tablished by each community for utility service are essential for op-erations, maintenance, and renewal of the utility infrastructure investment. There are many factors that have an effect on the level of utility rates; however, based on our experience, the items described in this section summarize the more salient factors af-fecting potable water rates.
{ 02 } 2016 FLORIDA WATER AND WASTEWATER RATE SURVEY
EFFLUENT DISPOSAL
While the source of water is a potentially large differentiator in potable water costs, the disposal of treated effluent is one of the most significant drivers of wastewater costs. Some of the least expen-sive effluent disposal methods include land applications with minimal pollutant removal. Many communities have limited land available for effluent disposal and rely on nearby surface waters to discharge treated wastewater. Enforcement of regulations and recent legislation is either restrict-ing these discharge points or even eliminating surface water discharging in many communities. Alternatives include capital-intensive discharge solutions such as deep injection wells.
INFRASTRUCTURE REPLACEMENT In prior decades throughout Florida, utility capital funding was primarily focused on meeting the demands of growth. Much of the cost of providing infrastructure for growth could be mitigated by a combination of impact fees, developer contributions, and careful expansion planning. With the aging of infrastructure, increases in regulatory requirements, and the slowing of growth, com-munities are increasingly concerned with both upgrading and replacement of infrastructure. The burden of upgrading and replacing infrastructure is typically borne by existing customers through utility rate revenues. Moreover, these capital costs are higher than the original cost due to infla-tion and the difficulty of replacing underground piping compared to the original installation cost on undeveloped land. While these challenges are growing, there is increasing pressure to maintain rates and avoid rate adjustments. Infrastructure replacement can often be delayed from one year to the next as budget pressures grow; however, such postponements generally create the need for larger rate increases in the future.
CONNECTION DENSITY
A common factor affecting both the capital and operating costs of utilities is the number of con-nections within their service area. Utilities such as compact cities with high densities enjoy certain economies due to factors such as shorter piping systems and less travel time for servicing the sys-tem and customers. This connection density factor should be considered when comparing rates, especially involving a combination of county and city systems.
REGULATORY STRINGENCY
Water utilities must provide drinking water that is safe for its customers and meet reporting and test-ing requirements. Regulatory requirements such as the EPA Disinfection By-Products Rule (DBPR) affect various communities differently based on the source of its water supply, age of the distribution system, and other factors. Meeting DBPR and other regulatory requirements can require both capital and operating investments that lead to higher user rates.
DECREASING PER CAPITA CONSUMPTION
Many utilities are facing declining per capita potable water consumption due to multiple fac-tors. Because most utility costs are fixed, communities must increase rates to compensate for the loss in revenue from reduced usage. This is especially valid for those utilities that have been heavily reliant on inverted (conservation) rates as a cost recovery source. There are sev-eral reasons for decreasing per capita consumption including more water efficient appliances and irrigation systems installed during renovations or through utility incentive programs. Further contributing to declining consumption is increased awareness due to conservation outreach efforts. Utility customers are responding to ongoing conservation messages.

{ 03 }2016 FLORIDA WATER AND WASTEWATER RATE SURVEY
WATER RESTRICTIONS
Over the past several years, water shortages and watering restrictions throughout Florida have been declared at various levels by the water management districts. Water restrictions include limitations on days and hours of irrigation use, and announced water shortages are accompanied by pleas to reduce consumption by set percentage amounts. Since most utility costs are fixed and, by definition, remain constant regardless of certain deviations in demand, the effect of lower wa-ter sales due to water shortages tend to require higher rates to support those fixed costs.
EFFICIENCIES
Potable water rates are also dependent on the extent a community has been able to use technol-ogy and effective management to achieve a high level of service at the lowest possible cost. Most communities are reporting the ability to accomplish more while relying on fewer resources. For example, many utilities have implemented automated meter reading (AMR) systems to reduce operating costs and increase meter reading accuracy. Implementation of supervisory control and data acquisition (SCADA) technology can increase system monitoring capabilities while lowering operating costs. Other efficiencies that can affect rates include minimizing unbilled water and ex-ploring wholesale arrangements to sell excess capacity.
BUDGET & TRANSFER POLICIES
The full accounting of indirect costs within a potable water utility can vary tremendously among various communities. For city and county utilities there are many supporting departments that may or may not be recognized in the budget process. Even when recognized, the cost of such sup-port services may not be accurate. In one community such costs may be understated, while in others they may be overstated due to budget pressures. In addition, many communities include a payment in lieu of taxes (PILOT), payment in lieu of franchise fees (PILOFF), or simply a transfer to the general fund. The amounts and methodology of such transfers vary considerably, and have a direct effect on utility rates.
ACQUISITIONS AND CONTRIBUTIONS
A significant number of Florida utilities were initially constructed to minimum standards by the pri-mary land developer. Many of these privately developed utilities were subsequently acquired by local governments at prices that included the value of contributions made by existing customers. The in-clusion of these customer contributions in the acquisition price was determined to be appropriate by the Florida Supreme Court. The acquisition cost together with other costs incurred for upgrading the utility to municipal standards is another factor that affect rate levels for certain utilities.
POLITICAL ACTION
The local political climate will have an effect on utility rates. Policymakers generally desire to have rates at a minimum level, or at least avoid rate increases, while still maintaining qual-ity service. However, if a community values redundancy in its service or extra protection for its water supply, then it may be willing to have slightly higher rates, if necessary. Often this must be accomplished by careful planning and occasional modest rate adjustments. Many communities in the survey indicate that rates are indexed annually to an inflation index or by an established inflation percentage. However, there is often very strong resistance to rate in-creases until utility assets begin failing, or regulatory mandates dictate the implementation of costly upgrades. Localized political pressures will affect rates either directly or indirectly.

OVERVIEWOF THE SURVEY
A benchmark of 4,000 gallons per month is used as a representation of indoor usage levels. This amount equates to an average demand of 131 gallons per day. A secondary benchmark of 8,000 gallons, or 263 gal-lons per day, has also been used in order to provide additional information for higher levels of service. Most utilities measure metered water use in terms of gallon increments. Approximately 3% of sur-veyed utilities report metered water use in terms of hundreds of cubic feet (ccf) rather than thousands of gallons. For these utilities, the usage rate data was calculated based on 5.35 ccf and 10.70 ccf of monthly usage which corresponds to 4,000 gallons and 8,000 gallons per month based on 748 gallons per ccf. Keep-
ing in mind the narrative included earlier in this survey regarding the various reasons why water and wastewater rates vary among communities, the distribution of monthly bills at 4,000 gallons from lowest to highest is shown in Figure A.
As shown in Figure A, the average combined monthly water and wastewater bill for 4,000 gallons is $58.30 excluding utility taxes. There is a wide dis-tribution of residential water and wastewater bills at the 4,000-gallon usage level. As noted earlier, there are numerous reasons why utility rates are different among service providers. The average combined bill for these same utilities is $90.37 for 8,000 gallons, as illustrated in Figure B.
The 2016 Survey provides data on more than 180 public water and/or wastewater service providers throughout Florida.
{ 04 } 2016 FLORIDA WATER AND WASTEWATER RATE SURVEY

{ 05 }2016 FLORIDA WATER AND WASTEWATER RATE SURVEY
$-
$20.00
$40.00
$60.00
$80.00
$100.00
$120.00
$140.00
$160.00
$180.00
$200.00
Mon
thly
Com
bine
d Ch
arge
(in
dolla
rs)
8,000 gallons 8,000 gallon avg.
$-
$20.00
$40.00
$60.00
$80.00
$100.00
$120.00
$140.00
Mon
thly
Com
bine
d Ch
arge
(in
dolla
rs)
4,000 gallons 4,000 gallon avg.
FIGURE A:COMBINED MONTHLY WATER & WASTEWATER BILL AT 4,000 GALLONS
FIGURE B:COMBINED MONTHLY WATER & WASTEWATER BILL AT 8,000 GALLONS
Mon
thly
Com
bine
d C
harg
e (in
dol
lars
)M
onth
ly C
ombi
ned
Cha
rge
(in d
olla
rs)
Distribution of Utilities
4,000 gallons 4,000 gallon average
Distribution of Utilities
8,000 gallons 8,000 gallon average
$120.00
$140.00
$120.00
$200.00
$60.00
$60.00
$140.00
$100.00
$100.00
$180.00
$40.00
$40.00
$80.00
$80.00
$160.00
$20.00
$20.00
$-
$-
Average combined bill at 4,000 gallons =
$58.30
Average combined bill at 8,000 gallons =
$90.37
$-
$20.00
$40.00
$60.00
$80.00
$100.00
$120.00
$140.00
Mon
thly
Com
bine
d Ch
arge
(in
dolla
rs)
4,000 gallons 4,000 gallon avg.
$-
$20.00
$40.00
$60.00
$80.00
$100.00
$120.00
$140.00
Mon
thly
Com
bine
d Ch
arge
(in
dolla
rs)
4,000 gallons 4,000 gallon avg.
$-
$20.00
$40.00
$60.00
$80.00
$100.00
$120.00
$140.00M
onth
ly C
ombi
ned
Char
ge (i
n do
llars
)
4,000 gallons 4,000 gallon avg.
$-
$20.00
$40.00
$60.00
$80.00
$100.00
$120.00
$140.00
Mon
thly
Com
bine
d Ch
arge
(in
dolla
rs)
4,000 gallons 4,000 gallon avg.

FIGURE C: COMPARISON OF AVERAGE
MONTHLY WATER & WASTEWATER BILLS AT 4,000 AND 8,000 GALLONS FOR UTILITIES REPORTED IN BOTH
2014 AND 2016 SURVEYSIn the survey, we compare the average monthly water and wastewater bill for 4,000 gallons and 8,000 gallons between 2014 and 2016. The comparisons include only the 147 utilities that participated in both the 2014 and 2016 surveys. As shown in Figure C, the average monthly water bill for 4,000 and 8,000 gallons increased annually by 2.5% and 2.6%, respectively. The average monthly wastewater bill for 4,000 gallons increased by 2.5% annually, and the 8,000 gallon bill increased by 2.4%.
WATER
WASTEWATER
2014
2014
2016
2016
4,000 Gallons Average
4,000 Gallons Average
8,000 GallonsAverage
8,000 Gallons Average
$20.74
$34.60
$32.92
$52.60
$21.81
$36.36
$34.68
$55.12
Annual Increase of 2.6%
Annual Increase of 2.4%
Annual Increase of 2.5%
Annual Increase of 2.5%
2016 FLORIDA WATER AND WASTEWATER RATE SURVEY{ 06 }

{ 07 }2016 FLORIDA WATER AND WASTEWATER RATE SURVEY
$-
$5.00
$10.00
$15.00
$20.00
$25.00
$30.00
$35.00
$40.00
$45.00
$50.00
$55.00
$60.00
Mon
thly
Wat
er C
harg
e (in
dol
lars
)
4,000 gallons 4,000 gallon avg.
$-
$10.00
$20.00
$30.00
$40.00
$50.00
$60.00
$70.00
$80.00
Mon
thly
Was
tew
ater
Cha
rge
(in d
olla
rs)
4,000 gallons 4,000 gallon avg.
$-
$5.00
$10.00
$15.00
$20.00
$25.00
$30.00
$35.00
$40.00
$45.00
$50.00
$55.00
$60.00
$65.00
$70.00
$75.00
$80.00
$85.00
Mon
thly
Wat
er C
harg
e (in
dol
lars
)
8,000 gallons 8,000 gallon avg.
$-
$10.00
$20.00
$30.00
$40.00
$50.00
$60.00
$70.00
$80.00
$90.00
$100.00
$110.00
$120.00
$130.00
$140.00
$150.00
Mon
thly
Was
tew
ater
Cha
rge
(in d
olla
rs)
8,000 gallons 8,000 gallon avg.
Distribution of Utilities
Distribution of Utilities
Distribution of Utilities
Distribution of Utilities
FIGURE D:MONTHLY WATER CHARGES
AT 4,000 GALLONS
FIGURE F:MONTHLY WATER CHARGES
AT 8,000 GALLONS
FIGURE E:MONTHLY WASTEWATER CHARGES
AT 4,000 GALLONS
FIGURE G:MONTHLY WASTEWATER CHARGES
AT 8,000 GALLONS
$80.00
$50.00
$70.00
$40.00
$60.00
$30.00
$20.00
$10.00
$-
$10.00
$20.00
$30.00
$40.00
$50.00
$60.00
$70.00
$80.00
$90.00
$100.00
$110.00
$120.00
$130.00
$140.00
$150.00
$-
$50.00
$55.00
$85.00
$40.00
$45.00
$60.00
$30.00
$35.00
$20.00
$25.00
$20.00
$25.00
$30.00
$35.00
$40.00
$45.00
$50.00
$55.00
$60.00
$65.00
$70.00
$75.00
$80.00
$10.00
$10.00
$5.00
$5.00
$15.00
$15.00
$-
$-
Mon
thly
Wat
er C
harg
e (in
dol
lars
)M
onth
ly W
ater
Cha
rge
(in d
olla
rs)
Mon
thly
Was
tew
ater
Cha
rge
(in d
olla
rs)
Mon
thly
Was
tew
ater
Cha
rge
(in d
olla
rs)
Additional graphs and data for the water and wastewater portions of the surveyed utilities are shown below.
Average water bill at 4,000 gallons = $22.12
Average water bill at 8,000 gallons = $35.36
Average wastewater bill at 4,000 gallons = $36.90
Average wastewater bill at 8,000 gallons =
$55.87
SURVEYED UTILITIES BY POPULATION SIZEThe survey includes a distribution of
utilities of various size and location.
The distribution of surveyed utilities by
population size is shown in Figure H.
FIGURE H:SURVEYED UTILITIES BY POPULATION SIZE (WATER)
0-10,000
47UTILITIES
30%
10,000-50,000
53UTILITIES
33%
50,000-100,000
29UTILITIES
18%
Over 100,000
30UTILITIES
19%
Population Size
4,000 gallons 4,000 gallon average
$-
$5.00
$10.00
$15.00
$20.00
$25.00
$30.00
$35.00
$40.00
$45.00
$50.00
$55.00
$60.00
Mon
thly
Wat
er C
harg
e (in
dol
lars
)
4,000 gallons 4,000 gallon avg.
$-
$5.00
$10.00
$15.00
$20.00
$25.00
$30.00
$35.00
$40.00
$45.00
$50.00
$55.00
$60.00
Mon
thly
Wat
er C
harg
e (in
dol
lars
)
4,000 gallons 4,000 gallon avg.
8,000 gallons 8,000 gallon average
$-
$5.00
$10.00
$15.00
$20.00
$25.00
$30.00
$35.00
$40.00
$45.00
$50.00
$55.00
$60.00
Mon
thly
Wat
er C
harg
e (in
dol
lars
)
4,000 gallons 4,000 gallon avg.
$-
$5.00
$10.00
$15.00
$20.00
$25.00
$30.00
$35.00
$40.00
$45.00
$50.00
$55.00
$60.00
Mon
thly
Wat
er C
harg
e (in
dol
lars
)
4,000 gallons 4,000 gallon avg. 8,000 gallons 8,000 gallon average
$-
$5.00
$10.00
$15.00
$20.00
$25.00
$30.00
$35.00
$40.00
$45.00
$50.00
$55.00
$60.00
Mon
thly
Wat
er C
harg
e (in
dol
lars
)
4,000 gallons 4,000 gallon avg.
$-
$5.00
$10.00
$15.00
$20.00
$25.00
$30.00
$35.00
$40.00
$45.00
$50.00
$55.00
$60.00
Mon
thly
Wat
er C
harg
e (in
dol
lars
)
4,000 gallons 4,000 gallon avg.
4,000 gallons 4,000 gallon average
$-
$5.00
$10.00
$15.00
$20.00
$25.00
$30.00
$35.00
$40.00
$45.00
$50.00
$55.00
$60.00
Mon
thly
Wat
er C
harg
e (in
dol
lars
)
4,000 gallons 4,000 gallon avg.
$-
$5.00
$10.00
$15.00
$20.00
$25.00
$30.00
$35.00
$40.00
$45.00
$50.00
$55.00
$60.00
Mon
thly
Wat
er C
harg
e (in
dol
lars
)
4,000 gallons 4,000 gallon avg.

SURVEYED UTILITIES BY WATER MANAGEMENT DISTRICT
Consumption use permits for potable water use are governed by the five water management districts throughout Florida. The survey respondents by water management district are shown in the following tables.
FIGURE I:SURVEYED WATER UTILITIES BY WATER MANAGEMENT DISTRICT SRWMD
3%
NWFWMD
8%
SFWMD
29%
SWFWMD
27%
SJRWMD
33%
SOUTH FLORIDA WATER MANAGEMENT DISTRICT
Bonita Springs Utilities, Inc. City of Marco Island Fort Pierce Utilities Authority
Broward County City of Margate Immokalee Water & Sewer District
City of Boca Raton City of Miami Beach Key Largo Wastewater Treatment District
City of Boynton Beach City of Miramar Key West Resort Utilities Corp.
City of Cape Coral City of Naples Martin County Utilities
City of Coconut Creek City of North Lauderdale Miami Dade County
City of Cooper City City of North Miami Okeechobee Utility Authority
City of Coral Springs City of North Miami Beach Palm Beach County
City of Dade City City of Pembroke Pines Reedy Creek Improvement District
City of Deerfield Beach City of Plantation St. Lucie County Utilities
City of Delray Beach City of Pompano Beach Toho Water Authority
City of Fort Lauderdale City of Port St. Lucie Town of Fort Myers Beach
City of Fort Myers City of Sunrise Town of Hillsboro Beach
City of Hallandale Beach City of Tamarac Town of Jupiter
City of Hialeah City of West Palm Beach Town of Lantana
City of Hollywood City of Wilton Manors Village of Islamorada
City of Homestead Collier County Village of Tequesta
City of Marathon Florida Keys Aqueduct Authority
NORTHWEST FLORIDA WATER MANAGEMENT DISTRICT
City of Chattahoochee City of Mary Esther Emerald Coast Utilities Authority
City of Crestview City of Monticello Liberty County
City of DeFuniak Springs City of St. Marks Okaloosa County
City of Fort Walton Beach City of Tallahassee South Walton Utility Company
City of Gulf Breeze Destin Water Users
{ 08 } 2016 FLORIDA WATER AND WASTEWATER RATE SURVEY

{ 09 }2016 FLORIDA WATER AND WASTEWATER RATE SURVEY
SOUTHWEST FLORIDA WATER MANAGEMENT DISTRICT
Charlotte County City of New Port Richey City of Zephyrhills
Citrus County Utilities City of North Port Hernando County
City of Auburndale City of Oldsmar Hillsborough County
City of Bartow City of Palmetto Lakeland Water Utilities
City of Bowling Green City of Plant City Lee County
City of Bradenton City of Punta Gorda Little Sumter Service Area
City of Brooksville City of Safety Harbor Manatee County
City of Clearwater City of San Antonio Pasco County
City of Crystal River City of Sarasota Pinellas County
City of Dunedin City of Sebring Polk County
City of Eagle Lake City of St. Petersburg Sarasota County
City of Fort Meade City of Tampa Town of Dundee
City of Frostproof City of Tarpon Springs Town of Lake Placid
City of Gulfport City of Treasure Island Town of Longboat Key
City of Lake Alfred City of Venice Town of Zolfo Springs
City of Lake Wales City of Williston
City of Largo City of Winter Haven
ST. JOHNS RIVER WATER MANAGEMENT DISTRICT
Brevard County City of Mascotte City of Winter Springs
City of Altamonte Springs City of Melbourne Gainesville Regional Utilities
City of Belleview City of Minneola Indian River County
City of Bunnell City of Mount Dora JEA
City of Cape Canaveral City of Neptune Beach Marion County
City of Casselberry City of Ocala Oakland Water System
City of Clermont City of Ocoee Orange County Utilities
City of Cocoa City of Orange City Orlando Utilities Commission
City of Crescent City City of Ormond Beach Sanlando Utilities Corporation
City of Daytona Beach City of Oviedo Seminole County
City of DeLand City of Palm Bay St. Johns County
City of Deltona City of Port Orange Town of Lady Lake
City of Edgewater City of Sanford Town of Montverde
City of Eustis City of St. Augustine Town of Orange Park
City of Green Cove Springs City of Tavares Town of Penney Farms
City of Groveland City of Titusville Town of Ponce Inlet
City of Jacksonville Beach City of Umatilla Village Center Service Area
City of Leesburg City of Vero Beach (Indian River Shores) Volusia County
City of Macclenny City of West Melbourne
City of Maitland City of Winter Park
SUWANEE RIVER WATER MANAGEMENT DISTRICT
City of Alachua City of Jasper City of Newberry
City of High Springs City of Lake City

ADDITIONAL RESULTS
A table of the detailed survey results is provided at the end of this narrative. All utilities surveyed have a combination of a fixed monthly charge and a separate variable charge based on the amount of metered water use as their primary revenue generation mechanism. Most water management district consumption use permits require utilities to have a conservation rate structure (multiple variable rate blocks that are “inverted” or increase at higher usage amounts) to reduce water consumption. The survey identified that approximately 6% of utilities surveyed do not have an inverted conservation rate structure. Certain other charac-teristics of surveyed utilities include the following:
• Monthly minimum water bill• Monthly minimum wastewater bill• Monthly minimum combined bill• First water usage rate block• Fixed portion of bills • Wastewater residential billing cap
{ 10 } 2016 FLORIDA WATER AND WASTEWATER RATE SURVEY

MONTHLY MINIMUM BILLS
The average combined monthly
minimum water and wastewater bill
(i.e., the lowest possible residential
bill) for all surveyed utilities is
$31.69. The distribution of the
minimum water bills is shown in
Figures J, K, and L.
More than $15.00
27%
$10.00 or less
33%
$10.01 to $15.00
40%
FIGURE J:MONTHLY MINIMUM
COMBINED BILL
More than $20.00
42%
$15.00 or less
30%
$15.01 to $20.00
28%
FIGURE L:MONTHLY MINIMUM
WASTEWATER BILL
More than $35.00
30%
$25.00 or less
29%
$25.01 to $35.00
41%
FIGURE K:MONTHLY MINIMUM
WATER BILL
{ 11 }2016 FLORIDA WATER AND WASTEWATER RATE SURVEY

FIRST WATER USAGE RATE BLOCK
Many utilities have multiple usage blocks (tiered blocks) for charging water rates to residential customers. The
amount of water within the first block is usually related to indoor usage or a local affordability threshold. Figure
M illustrates the distribution of utilities by the gallons included in the first usage block. The utilities that do not
have tiered water rates are indicated as “uniform.”
FIGURE M:WATER FIRST BLOCK THRESHOLD
Uniform 1,000 2,000 3,000 4,000 5,000 6,000 Over 6,000
Gallons in Lowest Usage Rate Block
11UTILITIES
6UTILITIES
16UTILITIES
22UTILITIES
23UTILITIES
29UTILITIES
36UTILITIES
36UTILITIES
6%
3%
9%
20% 20%
12%13%
16%
{ 12 } 2016 FLORIDA WATER AND WASTEWATER RATE SURVEY

{ 13 }2016 FLORIDA WATER AND WASTEWATER RATE SURVEY
FIXED PORTION OF WATER, WASTEWATER & COMBINED BILLS
Fixed cost recovery is an important indicator of financial stability, especially considering recent trends in declining water use. Figure N provides the amount of cost recovery for water, wastewater and combined bills at 4,000 and 8,000 gallons. It is important to note that the greater the amount of costs recovered from the fixed monthly charge and initial usage block the greater the revenue stability. While fixed costs of a typical utility are 80% to 90% of total costs, the survey results show that the fixed charge comprises approxi-mately 54% of the average 4,000-gallon bills and comprises approximately 35% within the 8,000-gallon bills.
WASTEWATER RESIDENTIAL BILLING CAP
Since volumetric wastewater usage is billed based on the customer’s water metering readings, many wastewater utilities recognize that there is a practical limit of how much water is returned through the wastewater system. Based on the theory that metered wa-ter used for irrigation and other outdoor uses does not enter the wastewater system, utilities often provide a billing threshold or bill-ing cap for residential wastewater usage charges. Figure O provides the distribution of various billing caps among the surveyed waste-water utilities.
4,000-8,000 9,000-13,000 14,000-18,000No Cap 19,000-23,000 24,000-28,000
Residential Wastewater Billing Cap
FIGURE N:FIXED PORTION
OF BILLS
FIGURE O:DISTRIBUTION OF
WASTEWATER BILLING CAP
The water and wastewater bill does not equal the combined bill since some surveyed utilities that provide only one service are not included in the combined bill average. The water, wastewater, and combined bill includes data from 179 utilities, 176 utilities, and 169 utilities, respectively.
37%
34%
17%
2%1%
9%
Minimum Bill 4,000 Gallons 8,000 Gallons
Water Bill Water BillWastewaterBill
WastewaterBill
Combined Bill
Combined Bill
$12.70$19.64
$31.69
$12.70$19.64
$31.69
$58.67
$36.23
$22.66
$26.61
$17.26
$9.41
64UTILITIES
15UTILITIES
59UTILITIES
29UTILITIES
4UTILITIES 2
UTILITIES
{ 14 } 2016 FLORIDA WATER AND WASTEWATER RATE SURVEY
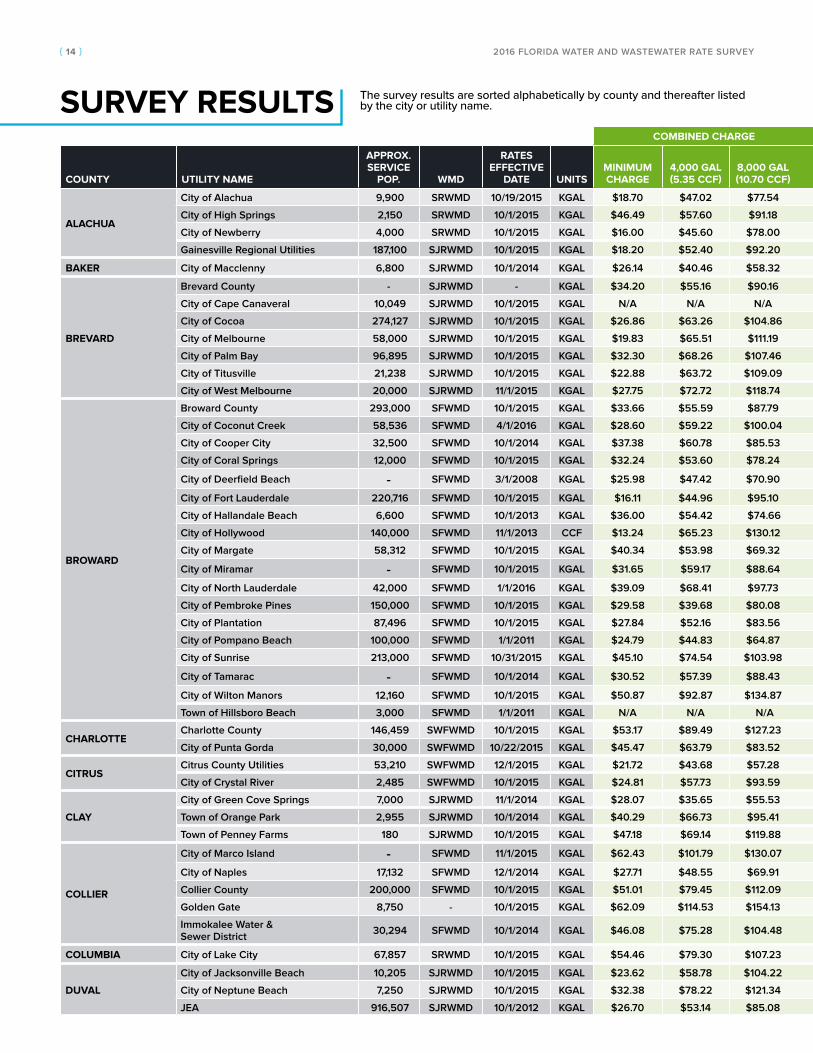
COMBINED CHARGE WATER CHARGE WASTEWATER CHARGE
COUNTY UTILITY NAME
APPROX. SERVICE
POP. WMD
RATES EFFECTIVE
DATE UNITSMINIMUM CHARGE
4,000 GAL (5.35 CCF)
8,000 GAL (10.70 CCF) UTILITY NAME
MINIMUM CHARGE
MINIMUM GALLONS INCLUDED
4,000 GAL (5.35 CCF)
8,000 GAL (10.70
CCF)MINIMUM CHARGE
MINIMUM GALLONS INCLUDED
4,000 GAL (5.35 CCF)
8,000 GAL (10.70
CCF)RES. CAP
(GAL)
ALACHUA
City of Alachua 9,900 SRWMD 10/19/2015 KGAL $18.70 $47.02 $77.54 City of Alachua $8.66 - $15.90 $25.34 $10.04 - $31.12 $52.20 -
City of High Springs 2,150 SRWMD 10/1/2015 KGAL $46.49 $57.60 $91.18 City of High Springs $9.08 - $20.19 $33.16 $37.41 5,000 $37.41 $58.02 -
City of Newberry 4,000 SRWMD 10/1/2015 KGAL $16.00 $45.60 $78.00 City of Newberry $8.00 - $16.00 $26.80 $8.00 - $29.60 $51.20 15,000
Gainesville Regional Utilities 187,100 SJRWMD 10/1/2015 KGAL $18.20 $52.40 $92.20 Gainesville Regional Utilities $9.20 - $18.60 $33.60 $9.00 - $33.80 $58.60 -
BAKER City of Macclenny 6,800 SJRWMD 10/1/2014 KGAL $26.14 $40.46 $58.32 City of Macclenny $10.78 - $14.66 $19.47 $15.36 - $25.80 $38.85 -
BREVARD
Brevard County - SJRWMD - KGAL $34.20 $55.16 $90.16 Brevard County $14.95 3,000 $19.63 $38.35 $19.25 - $35.53 $51.81 12,000
City of Cape Canaveral 10,049 SJRWMD 10/1/2015 KGAL N/A N/A N/A City of Cape Canaveral N/A N/A N/A N/A $19.36 - $41.92 $58.84 7,000
City of Cocoa 274,127 SJRWMD 10/1/2015 KGAL $26.86 $63.26 $104.86 City of Cocoa $13.66 - $25.02 $41.58 $13.20 - $38.24 $63.28 12,000
City of Melbourne 58,000 SJRWMD 10/1/2015 KGAL $19.83 $65.51 $111.19 City of Melbourne $8.00 - $26.28 $44.56 $11.83 - $39.23 $66.63 -
City of Palm Bay 96,895 SJRWMD 10/1/2015 KGAL $32.30 $68.26 $107.46 City of Palm Bay $13.62 - $27.98 $45.58 $18.68 - $40.28 $61.88 10,000
City of Titusville 21,238 SJRWMD 10/1/2015 KGAL $22.88 $63.72 $109.09 City of Titusville $9.31 - $21.39 $38.00 $13.57 - $42.33 $71.09 15,000
City of West Melbourne 20,000 SJRWMD 11/1/2015 KGAL $27.75 $72.72 $118.74 City of West Melbourne $13.88 - $39.13 $65.43 $13.87 - $33.59 $53.31 -
BROWARD
Broward County 293,000 SFWMD 10/1/2015 KGAL $33.66 $55.59 $87.79 Broward County $15.54 - $22.51 $39.75 $18.12 - $33.08 $48.04 15,000
City of Coconut Creek 58,536 SFWMD 4/1/2016 KGAL $28.60 $59.22 $100.04 City of Coconut Creek $16.50 - $33.58 $56.96 $12.10 - $25.64 $43.08 10,000
City of Cooper City 32,500 SFWMD 10/1/2014 KGAL $37.38 $60.78 $85.53 City of Cooper City $11.82 - $23.54 $36.61 $25.56 - $37.24 $48.92 10,000
City of Coral Springs 12,000 SFWMD 10/1/2015 KGAL $32.24 $53.60 $78.24 City of Coral Springs $12.16 - $18.24 $27.60 $20.08 - $35.36 $50.64 -
City of Deerfield Beach - SFWMD 3/1/2008 KGAL $25.98 $47.42 $70.90 City of Deerfield Beach $15.00 - $25.60 $38.24 $10.98 - $21.82 $32.66 12,000
City of Fort Lauderdale 220,716 SFWMD 10/1/2015 KGAL $16.11 $44.96 $95.10 City of Fort Lauderdale $6.53 - $16.96 $35.78 $9.58 - $28.00 $59.32 20,000
City of Hallandale Beach 6,600 SFWMD 10/1/2013 KGAL $36.00 $54.42 $74.66 City of Hallandale Beach $19.00 - $23.26 $28.65 $17.00 - $31.16 $46.01 -
City of Hollywood 140,000 SFWMD 11/1/2013 CCF $13.24 $65.23 $130.12 City of Hollywood $6.76 - $20.50 $47.13 $6.48 - $44.73 $82.99 14,960
City of Margate 58,312 SFWMD 10/1/2015 KGAL $40.34 $53.98 $69.32 City of Margate $11.40 - $25.04 $40.38 $28.94 - $28.94 $28.94 -
City of Miramar - SFWMD 10/1/2015 KGAL $31.65 $59.17 $88.64 City of Miramar $14.58 - $26.14 $39.65 $17.07 - $33.03 $48.99 -
City of North Lauderdale 42,000 SFWMD 1/1/2016 KGAL $39.09 $68.41 $97.73 City of North Lauderdale $13.90 - $27.38 $40.86 $25.19 - $41.03 $56.87 -
City of Pembroke Pines 150,000 SFWMD 10/1/2015 KGAL $29.58 $39.68 $80.08 City of Pembroke Pines $12.97 3,000 $18.02 $38.22 $16.61 3,000 $21.66 $41.86 -
City of Plantation 87,496 SFWMD 10/1/2015 KGAL $27.84 $52.16 $83.56 City of Plantation $12.44 - $19.52 $33.68 $15.40 - $32.64 $49.88 -
City of Pompano Beach 100,000 SFWMD 1/1/2011 KGAL $24.79 $44.83 $64.87 City of Pompano Beach $12.88 - $21.84 $30.80 $11.91 - $22.99 $34.07 10,000
City of Sunrise 213,000 SFWMD 10/31/2015 KGAL $45.10 $74.54 $103.98 City of Sunrise $18.62 - $33.22 $47.82 $26.48 - $41.32 $56.16 16,000
City of Tamarac - SFWMD 10/1/2014 KGAL $30.52 $57.39 $88.43 City of Tamarac $11.77 - $19.44 $31.28 $18.75 - $37.95 $57.15 12,000
City of Wilton Manors 12,160 SFWMD 10/1/2015 KGAL $50.87 $92.87 $134.87 City of Wilton Manors $35.61 - $52.53 $69.45 $15.26 - $40.34 $65.42 15,000
Town of Hillsboro Beach 3,000 SFWMD 1/1/2011 KGAL N/A N/A N/A Town of Hillsboro Beach $24.00 2,000 $30.80 $44.40 N/A N/A N/A N/A N/A
CHARLOTTECharlotte County 146,459 SWFWMD 10/1/2015 KGAL $53.17 $89.49 $127.23 Charlotte County $22.05 - $41.01 $61.39 $31.12 - $48.48 $65.84 10,000
City of Punta Gorda 30,000 SWFWMD 10/22/2015 KGAL $45.47 $63.79 $83.52 City of Punta Gorda $14.75 - $26.95 $40.56 $30.72 - $36.84 $42.96 10,000
CITRUSCitrus County Utilities 53,210 SWFWMD 12/1/2015 KGAL $21.72 $43.68 $57.28 Citrus County Utilities $7.57 - $12.81 $18.05 $14.15 - $30.87 $39.23 6,000
City of Crystal River 2,485 SWFWMD 10/1/2015 KGAL $24.81 $57.73 $93.59 City of Crystal River $9.08 - $21.08 $36.02 $15.73 - $36.65 $57.57 -
CLAY
City of Green Cove Springs 7,000 SJRWMD 11/1/2014 KGAL $28.07 $35.65 $55.53 City of Green Cove Springs $10.60 - $14.02 $21.22 $17.47 - $21.63 $34.31 27,500
Town of Orange Park 2,955 SJRWMD 10/1/2014 KGAL $40.29 $66.73 $95.41 Town of Orange Park $17.85 - $26.77 $37.93 $22.44 - $39.96 $57.48 12,000
Town of Penney Farms 180 SJRWMD 10/1/2015 KGAL $47.18 $69.14 $119.88 Town of Penney Farms $23.48 2,000 $34.56 $60.14 $23.70 2,000 $34.58 $59.74 -
COLLIER
City of Marco Island - SFWMD 11/1/2015 KGAL $62.43 $101.79 $130.07 City of Marco Island $34.39 - $51.59 $68.79 $28.04 - $50.20 $61.28 6,000
City of Naples 17,132 SFWMD 12/1/2014 KGAL $27.71 $48.55 $69.91 City of Naples $7.91 - $13.39 $19.39 $19.80 - $35.16 $50.52 10,000
Collier County 200,000 SFWMD 10/1/2015 KGAL $51.01 $79.45 $112.09 Collier County $20.18 - $31.26 $46.54 $30.83 - $48.19 $65.55 15,000
Golden Gate 8,750 - 10/1/2015 KGAL $62.09 $114.53 $154.13 Golden Gate $26.94 - $51.30 $76.86 $35.15 - $63.23 $77.27 6,000
Immokalee Water & Sewer District
30,294 SFWMD 10/1/2014 KGAL $46.08 $75.28 $104.48Immokalee Water & Sewer District
$16.84 - $26.48 $36.12 $29.24 - $48.80 $68.36 15,000
COLUMBIA City of Lake City 67,857 SRWMD 10/1/2015 KGAL $54.46 $79.30 $107.23 City of Lake City $18.59 - $26.71 $37.92 $35.87 - $52.59 $69.31 16,000
DUVAL
City of Jacksonville Beach 10,205 SJRWMD 10/1/2015 KGAL $23.62 $58.78 $104.22 City of Jacksonville Beach $11.26 - $24.02 $40.74 $12.36 - $34.76 $63.48 15,000
City of Neptune Beach 7,250 SJRWMD 10/1/2015 KGAL $32.38 $78.22 $121.34 City of Neptune Beach $12.14 999 $23.10 $35.34 $20.24 999 $55.12 $86.00 16,000
JEA 916,507 SJRWMD 10/1/2012 KGAL $26.70 $53.14 $85.08 JEA $12.60 - $17.80 $26.34 $14.10 - $35.34 $58.74 20,000
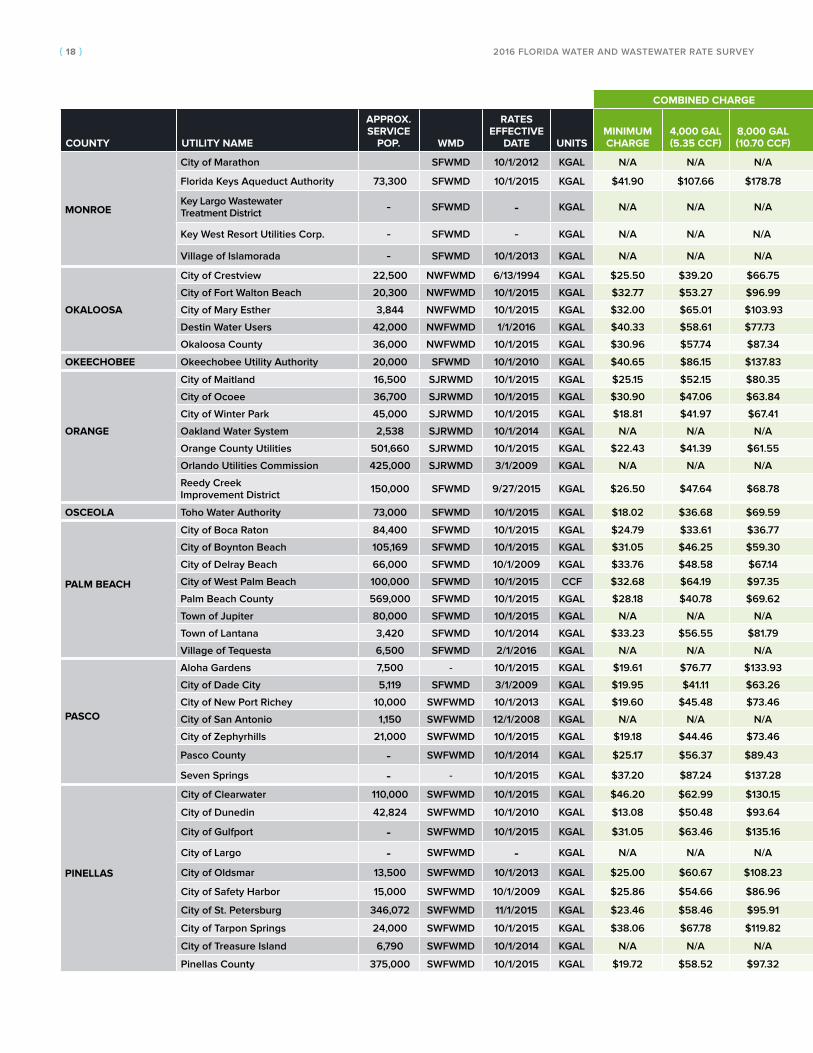
SURVEY RESULTS The survey results are sorted alphabetically by county and thereafter listed by the city or utility name.

{ 15 }2016 FLORIDA WATER AND WASTEWATER RATE SURVEY
COMBINED CHARGE WATER CHARGE WASTEWATER CHARGE
COUNTY UTILITY NAME
APPROX. SERVICE
POP. WMD
RATES EFFECTIVE
DATE UNITSMINIMUM CHARGE
4,000 GAL (5.35 CCF)
8,000 GAL (10.70 CCF) UTILITY NAME
MINIMUM CHARGE
MINIMUM GALLONS INCLUDED
4,000 GAL (5.35 CCF)
8,000 GAL (10.70
CCF)MINIMUM CHARGE
MINIMUM GALLONS INCLUDED
4,000 GAL (5.35 CCF)
8,000 GAL (10.70
CCF)RES. CAP
(GAL)
ALACHUA
City of Alachua 9,900 SRWMD 10/19/2015 KGAL $18.70 $47.02 $77.54 City of Alachua $8.66 - $15.90 $25.34 $10.04 - $31.12 $52.20 -
City of High Springs 2,150 SRWMD 10/1/2015 KGAL $46.49 $57.60 $91.18 City of High Springs $9.08 - $20.19 $33.16 $37.41 5,000 $37.41 $58.02 -
City of Newberry 4,000 SRWMD 10/1/2015 KGAL $16.00 $45.60 $78.00 City of Newberry $8.00 - $16.00 $26.80 $8.00 - $29.60 $51.20 15,000
Gainesville Regional Utilities 187,100 SJRWMD 10/1/2015 KGAL $18.20 $52.40 $92.20 Gainesville Regional Utilities $9.20 - $18.60 $33.60 $9.00 - $33.80 $58.60 -
BAKER City of Macclenny 6,800 SJRWMD 10/1/2014 KGAL $26.14 $40.46 $58.32 City of Macclenny $10.78 - $14.66 $19.47 $15.36 - $25.80 $38.85 -
BREVARD
Brevard County - SJRWMD - KGAL $34.20 $55.16 $90.16 Brevard County $14.95 3,000 $19.63 $38.35 $19.25 - $35.53 $51.81 12,000
City of Cape Canaveral 10,049 SJRWMD 10/1/2015 KGAL N/A N/A N/A City of Cape Canaveral N/A N/A N/A N/A $19.36 - $41.92 $58.84 7,000
City of Cocoa 274,127 SJRWMD 10/1/2015 KGAL $26.86 $63.26 $104.86 City of Cocoa $13.66 - $25.02 $41.58 $13.20 - $38.24 $63.28 12,000
City of Melbourne 58,000 SJRWMD 10/1/2015 KGAL $19.83 $65.51 $111.19 City of Melbourne $8.00 - $26.28 $44.56 $11.83 - $39.23 $66.63 -
City of Palm Bay 96,895 SJRWMD 10/1/2015 KGAL $32.30 $68.26 $107.46 City of Palm Bay $13.62 - $27.98 $45.58 $18.68 - $40.28 $61.88 10,000
City of Titusville 21,238 SJRWMD 10/1/2015 KGAL $22.88 $63.72 $109.09 City of Titusville $9.31 - $21.39 $38.00 $13.57 - $42.33 $71.09 15,000
City of West Melbourne 20,000 SJRWMD 11/1/2015 KGAL $27.75 $72.72 $118.74 City of West Melbourne $13.88 - $39.13 $65.43 $13.87 - $33.59 $53.31 -
BROWARD
Broward County 293,000 SFWMD 10/1/2015 KGAL $33.66 $55.59 $87.79 Broward County $15.54 - $22.51 $39.75 $18.12 - $33.08 $48.04 15,000
City of Coconut Creek 58,536 SFWMD 4/1/2016 KGAL $28.60 $59.22 $100.04 City of Coconut Creek $16.50 - $33.58 $56.96 $12.10 - $25.64 $43.08 10,000
City of Cooper City 32,500 SFWMD 10/1/2014 KGAL $37.38 $60.78 $85.53 City of Cooper City $11.82 - $23.54 $36.61 $25.56 - $37.24 $48.92 10,000
City of Coral Springs 12,000 SFWMD 10/1/2015 KGAL $32.24 $53.60 $78.24 City of Coral Springs $12.16 - $18.24 $27.60 $20.08 - $35.36 $50.64 -
City of Deerfield Beach - SFWMD 3/1/2008 KGAL $25.98 $47.42 $70.90 City of Deerfield Beach $15.00 - $25.60 $38.24 $10.98 - $21.82 $32.66 12,000
City of Fort Lauderdale 220,716 SFWMD 10/1/2015 KGAL $16.11 $44.96 $95.10 City of Fort Lauderdale $6.53 - $16.96 $35.78 $9.58 - $28.00 $59.32 20,000
City of Hallandale Beach 6,600 SFWMD 10/1/2013 KGAL $36.00 $54.42 $74.66 City of Hallandale Beach $19.00 - $23.26 $28.65 $17.00 - $31.16 $46.01 -
City of Hollywood 140,000 SFWMD 11/1/2013 CCF $13.24 $65.23 $130.12 City of Hollywood $6.76 - $20.50 $47.13 $6.48 - $44.73 $82.99 14,960
City of Margate 58,312 SFWMD 10/1/2015 KGAL $40.34 $53.98 $69.32 City of Margate $11.40 - $25.04 $40.38 $28.94 - $28.94 $28.94 -
City of Miramar - SFWMD 10/1/2015 KGAL $31.65 $59.17 $88.64 City of Miramar $14.58 - $26.14 $39.65 $17.07 - $33.03 $48.99 -
City of North Lauderdale 42,000 SFWMD 1/1/2016 KGAL $39.09 $68.41 $97.73 City of North Lauderdale $13.90 - $27.38 $40.86 $25.19 - $41.03 $56.87 -
City of Pembroke Pines 150,000 SFWMD 10/1/2015 KGAL $29.58 $39.68 $80.08 City of Pembroke Pines $12.97 3,000 $18.02 $38.22 $16.61 3,000 $21.66 $41.86 -
City of Plantation 87,496 SFWMD 10/1/2015 KGAL $27.84 $52.16 $83.56 City of Plantation $12.44 - $19.52 $33.68 $15.40 - $32.64 $49.88 -
City of Pompano Beach 100,000 SFWMD 1/1/2011 KGAL $24.79 $44.83 $64.87 City of Pompano Beach $12.88 - $21.84 $30.80 $11.91 - $22.99 $34.07 10,000
City of Sunrise 213,000 SFWMD 10/31/2015 KGAL $45.10 $74.54 $103.98 City of Sunrise $18.62 - $33.22 $47.82 $26.48 - $41.32 $56.16 16,000
City of Tamarac - SFWMD 10/1/2014 KGAL $30.52 $57.39 $88.43 City of Tamarac $11.77 - $19.44 $31.28 $18.75 - $37.95 $57.15 12,000
City of Wilton Manors 12,160 SFWMD 10/1/2015 KGAL $50.87 $92.87 $134.87 City of Wilton Manors $35.61 - $52.53 $69.45 $15.26 - $40.34 $65.42 15,000
Town of Hillsboro Beach 3,000 SFWMD 1/1/2011 KGAL N/A N/A N/A Town of Hillsboro Beach $24.00 2,000 $30.80 $44.40 N/A N/A N/A N/A N/A
CHARLOTTECharlotte County 146,459 SWFWMD 10/1/2015 KGAL $53.17 $89.49 $127.23 Charlotte County $22.05 - $41.01 $61.39 $31.12 - $48.48 $65.84 10,000
City of Punta Gorda 30,000 SWFWMD 10/22/2015 KGAL $45.47 $63.79 $83.52 City of Punta Gorda $14.75 - $26.95 $40.56 $30.72 - $36.84 $42.96 10,000
CITRUSCitrus County Utilities 53,210 SWFWMD 12/1/2015 KGAL $21.72 $43.68 $57.28 Citrus County Utilities $7.57 - $12.81 $18.05 $14.15 - $30.87 $39.23 6,000
City of Crystal River 2,485 SWFWMD 10/1/2015 KGAL $24.81 $57.73 $93.59 City of Crystal River $9.08 - $21.08 $36.02 $15.73 - $36.65 $57.57 -
CLAY
City of Green Cove Springs 7,000 SJRWMD 11/1/2014 KGAL $28.07 $35.65 $55.53 City of Green Cove Springs $10.60 - $14.02 $21.22 $17.47 - $21.63 $34.31 27,500
Town of Orange Park 2,955 SJRWMD 10/1/2014 KGAL $40.29 $66.73 $95.41 Town of Orange Park $17.85 - $26.77 $37.93 $22.44 - $39.96 $57.48 12,000
Town of Penney Farms 180 SJRWMD 10/1/2015 KGAL $47.18 $69.14 $119.88 Town of Penney Farms $23.48 2,000 $34.56 $60.14 $23.70 2,000 $34.58 $59.74 -
COLLIER
City of Marco Island - SFWMD 11/1/2015 KGAL $62.43 $101.79 $130.07 City of Marco Island $34.39 - $51.59 $68.79 $28.04 - $50.20 $61.28 6,000
City of Naples 17,132 SFWMD 12/1/2014 KGAL $27.71 $48.55 $69.91 City of Naples $7.91 - $13.39 $19.39 $19.80 - $35.16 $50.52 10,000
Collier County 200,000 SFWMD 10/1/2015 KGAL $51.01 $79.45 $112.09 Collier County $20.18 - $31.26 $46.54 $30.83 - $48.19 $65.55 15,000
Golden Gate 8,750 - 10/1/2015 KGAL $62.09 $114.53 $154.13 Golden Gate $26.94 - $51.30 $76.86 $35.15 - $63.23 $77.27 6,000
Immokalee Water & Sewer District
30,294 SFWMD 10/1/2014 KGAL $46.08 $75.28 $104.48Immokalee Water & Sewer District
$16.84 - $26.48 $36.12 $29.24 - $48.80 $68.36 15,000
COLUMBIA City of Lake City 67,857 SRWMD 10/1/2015 KGAL $54.46 $79.30 $107.23 City of Lake City $18.59 - $26.71 $37.92 $35.87 - $52.59 $69.31 16,000
DUVAL
City of Jacksonville Beach 10,205 SJRWMD 10/1/2015 KGAL $23.62 $58.78 $104.22 City of Jacksonville Beach $11.26 - $24.02 $40.74 $12.36 - $34.76 $63.48 15,000
City of Neptune Beach 7,250 SJRWMD 10/1/2015 KGAL $32.38 $78.22 $121.34 City of Neptune Beach $12.14 999 $23.10 $35.34 $20.24 999 $55.12 $86.00 16,000
JEA 916,507 SJRWMD 10/1/2012 KGAL $26.70 $53.14 $85.08 JEA $12.60 - $17.80 $26.34 $14.10 - $35.34 $58.74 20,000

{ 16 } 2016 FLORIDA WATER AND WASTEWATER RATE SURVEY
COMBINED CHARGE WATER CHARGE WASTEWATER CHARGE
COUNTY UTILITY NAME
APPROX. SERVICE
POP. WMD
RATES EFFECTIVE
DATE UNITSMINIMUM CHARGE
4,000 GAL (5.35 CCF)
8,000 GAL (10.70 CCF) UTILITY NAME
MINIMUM CHARGE
MINIMUM GALLONS INCLUDED
4,000 GAL (5.35 CCF)
8,000 GAL (10.70
CCF)MINIMUM CHARGE
MINIMUM GALLONS INCLUDED
4,000 GAL (5.35 CCF)
8,000 GAL (10.70
CCF)RES. CAP
(GAL)
ESCAMBIA Emerald Coast Utilities Authority
222,000 NWFWMD 10/1/2015 KGAL $24.06 $47.22 $84.34Emerald Coast Utilities Authority
$11.25 - $20.45 $29.65 $12.81 2,000 $26.77 $54.69 15,000
FLAGLER City of Bunnell 2,400 SJRWMD 10/1/2015 KGAL $43.41 $102.77 $162.13 City of Bunnell $20.43 - $47.79 $75.15 $22.98 - $54.98 $86.98 -
GADSDEN City of Chattahoochee 3,600 NWFWMD 1/1/2007 KGAL $27.30 $43.99 $60.68 City of Chattahoochee $7.00 - $11.28 $15.56 $20.30 - $32.71 $45.12 12,000
HAMILTON City of Jasper 1,230 SRWMD 11/1/2007 KGAL $20.15 $20.15 $42.75 City of Jasper $9.35 4,000 $9.35 $19.95 $10.80 4,000 $10.80 $22.80 -
HARDEECity of Bowling Green 3,000 SWFWMD 12/8/2015 KGAL $48.20 $48.20 $61.00 City of Bowling Green $16.85 4,000 $16.85 $29.65 $31.35 8,000 $31.35 $31.35 -
Town of Zolfo Springs 1,803 SWFWMD 4/20/2015 KGAL $38.60 $55.42 $88.98 Town of Zolfo Springs $10.63 - $17.33 $30.69 $27.97 - $38.09 $58.29 -
HERNANDOCity of Brooksville 4,800 SWFWMD 10/1/2015 KGAL $45.92 $52.25 $77.57 City of Brooksville $21.47 3,000 $23.85 $33.37 $24.45 3,000 $28.40 $44.20 -
Hernando County 162,000 SWFWMD 10/1/2015 KGAL $23.40 $42.84 $62.91 Hernando County $6.31 - $11.03 $16.38 $17.09 - $31.81 $46.53 10,000
HIGHLANDSCity of Sebring 17,403 SWFWMD 10/1/2007 KGAL $30.29 $39.49 $48.69 City of Sebring $8.14 - $17.34 $26.54 $22.15 - $22.15 $22.15 -
Town of Lake Placid 7,977 SWFWMD 8/1/2008 KGAL $32.00 $53.60 $75.20 Town of Lake Placid $13.00 - $22.60 $32.20 $19.00 - $31.00 $43.00 -
HILLSBOROUGHCity of Plant City 39,034 SWFWMD 10/1/2015 KGAL $23.06 $51.66 $81.88 City of Plant City $7.22 - $14.02 $22.44 $15.84 - $37.64 $59.44 15,000
City of Tampa 591,000 SWFWMD 10/1/2011 CCF $0.00 $35.04 $71.96 City of Tampa $0.00 - $11.49 $24.86 $0.00 - $23.55 $47.10 -
Hillsborough County 552,590 SWFWMD 6/1/2015 KGAL $26.08 $58.08 $93.77 Hillsborough County $12.47 - $26.95 $45.12 $13.61 - $31.13 $48.65 8,000
INDIAN RIVERCity of Vero Beach (Indian River Shores)
3,995 SJRWMD - KGAL $24.92 $45.38 $67.93City of Vero Beach (Indian River Shores)
$9.05 - $18.07 $29.18 $15.87 - $27.31 $38.75 12,000
Indian River County 100,000 SJRWMD 10/1/1999 KGAL $24.92 $45.38 $67.93 Indian River County $9.05 - $18.07 $29.18 $15.87 - $27.31 $38.75 12,000
JEFFERSON City of Monticello 3,200 NWFWMD 6/3/2010 CCF $25.50 $57.77 $90.02 City of Monticello $7.50 - $15.53 $23.55 $18.00 - $42.24 $66.47 -
LAKE
City of Clermont 33,000 SJRWMD 10/1/2015 KGAL $20.75 $33.19 $45.63 City of Clermont $5.48 - $9.88 $14.28 $15.27 - $23.31 $31.35 16,000
City of Eustis 34,400 SJRWMD 6/1/2014 KGAL $33.39 $53.43 $73.47 City of Eustis $9.96 - $18.28 $26.60 $23.43 - $35.15 $46.87 10,000
City of Groveland - SJRWMD KGAL $37.63 $37.63 $57.03 City of Groveland $10.50 4,000 $10.50 $21.50 $27.13 4,000 $27.13 $35.53 -
City of Leesburg 45,000 SJRWMD 11/1/2015 KGAL $32.04 $42.41 $53.72 City of Leesburg $8.72 - $12.63 $17.47 $23.32 - $29.78 $36.25 15,000
City of Mascotte - SJRWMD 10/6/2014 KGAL N/A N/A N/A City of Mascotte $28.00 1,000 $38.00 $56.00 N/A N/A N/A N/A N/A
City of Minneola - SJRWMD 8/24/2004 KGAL $22.40 $40.94 $63.63 City of Minneola $7.00 2,000 $10.70 $18.55 $15.40 - $30.24 $45.08 15,000
City of Mount Dora 30,400 SJRWMD 4/1/2016 CCF $35.38 $56.30 $77.22 City of Mount Dora $8.44 - $14.33 $20.21 $26.94 - $41.97 $57.01 8,976
City of Tavares 14,582 SJRWMD 10/1/2015 KGAL $36.27 $55.01 $76.47 City of Tavares $16.12 - $21.54 $29.68 $20.15 - $33.47 $46.79 14,000
City of Umatilla 4,000 SJRWMD 10/1/2015 KGAL $39.99 $66.03 $93.57 City of Umatilla $10.39 - $18.43 $27.97 $29.60 - $47.60 $65.60 20,000
Town of Lady Lake 6,115 SJRWMD 10/1/2014 KGAL $27.14 $51.06 $77.18 Town of Lady Lake $11.64 - $21.36 $33.28 $15.50 - $29.70 $43.90 -
Town of Montverde 1,500 SJRWMD 4/27/2016 KGAL N/A N/A N/A Town of Montverde $12.26 3,000 $16.56 $33.74 N/A N/A N/A N/A N/A
LEE
Bonita Springs Utilities, Inc. 51,000 SFWMD 9/1/2010 KGAL $40.65 $70.09 $101.09 Bonita Springs Utilities, Inc. $12.17 - $26.81 $43.01 $28.48 - $43.28 $58.08 16,000
City of Cape Coral - SFWMD 10/1/2013 KGAL $38.39 $90.15 $143.86 City of Cape Coral $17.32 - $32.92 $50.47 $21.07 - $57.23 $93.39 -
City of Fort Myers - SFWMD 10/1/2015 KGAL $23.53 $95.13 $180.68 City of Fort Myers $8.63 - $27.23 $59.78 $14.90 - $67.90 $120.90 -
Lee County 342,584 SWFWMD 10/1/2014 KGAL $33.04 $69.52 $107.64 Lee County $12.59 - $25.67 $40.39 $20.45 - $43.85 $67.25 9,000
Lehigh Acres 32,000 - 10/1/2015 KGAL $40.09 $96.61 $137.49 Lehigh Acres $14.96 - $36.88 $60.46 $25.13 - $59.73 $77.03 6,000
North Fort Myers 5,000 - 10/1/2015 KGAL $34.43 $96.03 $141.39 North Fort Myers $16.91 - $46.03 $75.15 $17.52 - $50.00 $66.24 6,000
Town of Fort Myers Beach 6,900 SFWMD 10/15/2014 KGAL N/A N/A N/A Town of Fort Myers Beach $15.55 - $35.15 $56.65 N/A N/A N/A N/A N/A
LEON City of Tallahassee 248,000 NWFWMD 1/1/2016 KGAL $27.58 $51.70 $80.31 City of Tallahassee $10.55 2,500 $12.91 $19.76 $17.03 - $38.79 $60.55 -
LEVY City of Williston 2,500 SWFWMD 1/19/2016 KGAL $33.42 $37.82 $46.12 City of Williston $6.67 - $11.07 $16.07 $26.75 5,000 $26.75 $30.05 -
LIBERTY Liberty County 2,214 NWFWMD 3/1/2015 KGAL N/A N/A N/A Liberty County $12.50 3,000 $16.25 $31.55 N/A N/A N/A N/A N/A
MANATEE
City of Bradenton 50,389 SWFWMD 10/1/2014 KGAL $34.45 $54.24 $84.80 City of Bradenton $13.90 999 $23.94 $37.94 $20.55 999 $30.30 $46.86 25,000
City of Palmetto 12,000 SWFWMD 10/1/2015 KGAL $24.88 $62.01 $102.17 City of Palmetto $8.53 - $32.02 $57.46 $16.35 - $29.99 $44.71 12,000
Manatee County - SWFWMD 1/1/2016 KGAL $29.57 $56.61 $84.69 Manatee County $8.73 - $17.17 $26.65 $20.84 - $39.44 $58.04 10,000
Town of Longboat Key 20,000 SWFWMD 1/4/2016 KGAL $30.41 $63.61 $93.70 Town of Longboat Key $14.37 - $23.93 $36.29 $16.04 - $39.68 $57.41 7,000
MARION
City of Belleview 3,113 SJRWMD 1/1/2015 KGAL $31.79 $54.31 $78.06 City of Belleview $10.57 - $19.93 $29.79 $21.22 - $34.38 $48.27 -
City of Ocala 65,000 SJRWMD 1/1/2016 CCF $32.47 $48.41 $64.36 City of Ocala $9.48 - $13.44 $17.40 $22.99 - $34.97 $46.96 9,724
Marion County Utilities 63,156 SJRWMD - KGAL $35.28 $63.00 $80.06 Marion County Utilities $12.75 - $17.51 $23.09 $22.53 - $45.49 $56.97 6,000
MARTIN Martin County Utilities 89,575 SFWMD 10/1/2014 KGAL $33.75 $59.03 $84.31 Martin County Utilities $16.57 - $25.09 $33.61 $17.18 - $33.94 $50.70 10,000
MIAMI-DADE
City of Hialeah - SFWMD 10/1/2015 KGAL $9.82 $38.74 $69.37 City of Hialeah $4.83 - $13.71 $23.13 $4.99 - $25.03 $46.24 -
City of Homestead 60,500 SFWMD 12/1/2010 KGAL $21.21 $36.76 $53.24 City of Homestead $7.01 - $10.52 $14.96 $14.20 - $26.24 $38.28 -
City of Miami Beach - SFWMD 10/1/2015 KGAL $22.15 $55.07 $101.82 City of Miami Beach $22.15 5,000 $22.15 $35.98 $0.00 - $32.92 $65.84 -
City of North Miami - SFWMD 11/1/2014 KGAL $29.39 $54.59 $82.07 City of North Miami $12.51 - $20.07 $29.91 $16.88 - $34.52 $52.16 -
City of North Miami Beach 170,000 SFWMD 10/1/2014 KGAL $30.92 $63.16 $98.37 City of North Miami Beach $10.71 - $23.59 $36.84 $20.21 - $39.57 $61.53 -
Miami Dade County 2,266,092 SFWMD 10/1/2015 KGAL $6.45 $18.33 $66.53 Miami Dade County $3.20 - $6.11 $23.11 $3.25 - $12.22 $43.42 -

{ 17 }2016 FLORIDA WATER AND WASTEWATER RATE SURVEY
COMBINED CHARGE WATER CHARGE WASTEWATER CHARGE
COUNTY UTILITY NAME
APPROX. SERVICE
POP. WMD
RATES EFFECTIVE
DATE UNITSMINIMUM CHARGE
4,000 GAL (5.35 CCF)
8,000 GAL (10.70 CCF) UTILITY NAME
MINIMUM CHARGE
MINIMUM GALLONS INCLUDED
4,000 GAL (5.35 CCF)
8,000 GAL (10.70
CCF)MINIMUM CHARGE
MINIMUM GALLONS INCLUDED
4,000 GAL (5.35 CCF)
8,000 GAL (10.70
CCF)RES. CAP
(GAL)
ESCAMBIA Emerald Coast Utilities Authority
222,000 NWFWMD 10/1/2015 KGAL $24.06 $47.22 $84.34Emerald Coast Utilities Authority
$11.25 - $20.45 $29.65 $12.81 2,000 $26.77 $54.69 15,000
FLAGLER City of Bunnell 2,400 SJRWMD 10/1/2015 KGAL $43.41 $102.77 $162.13 City of Bunnell $20.43 - $47.79 $75.15 $22.98 - $54.98 $86.98 -
GADSDEN City of Chattahoochee 3,600 NWFWMD 1/1/2007 KGAL $27.30 $43.99 $60.68 City of Chattahoochee $7.00 - $11.28 $15.56 $20.30 - $32.71 $45.12 12,000
HAMILTON City of Jasper 1,230 SRWMD 11/1/2007 KGAL $20.15 $20.15 $42.75 City of Jasper $9.35 4,000 $9.35 $19.95 $10.80 4,000 $10.80 $22.80 -
HARDEECity of Bowling Green 3,000 SWFWMD 12/8/2015 KGAL $48.20 $48.20 $61.00 City of Bowling Green $16.85 4,000 $16.85 $29.65 $31.35 8,000 $31.35 $31.35 -
Town of Zolfo Springs 1,803 SWFWMD 4/20/2015 KGAL $38.60 $55.42 $88.98 Town of Zolfo Springs $10.63 - $17.33 $30.69 $27.97 - $38.09 $58.29 -
HERNANDOCity of Brooksville 4,800 SWFWMD 10/1/2015 KGAL $45.92 $52.25 $77.57 City of Brooksville $21.47 3,000 $23.85 $33.37 $24.45 3,000 $28.40 $44.20 -
Hernando County 162,000 SWFWMD 10/1/2015 KGAL $23.40 $42.84 $62.91 Hernando County $6.31 - $11.03 $16.38 $17.09 - $31.81 $46.53 10,000
HIGHLANDSCity of Sebring 17,403 SWFWMD 10/1/2007 KGAL $30.29 $39.49 $48.69 City of Sebring $8.14 - $17.34 $26.54 $22.15 - $22.15 $22.15 -
Town of Lake Placid 7,977 SWFWMD 8/1/2008 KGAL $32.00 $53.60 $75.20 Town of Lake Placid $13.00 - $22.60 $32.20 $19.00 - $31.00 $43.00 -
HILLSBOROUGHCity of Plant City 39,034 SWFWMD 10/1/2015 KGAL $23.06 $51.66 $81.88 City of Plant City $7.22 - $14.02 $22.44 $15.84 - $37.64 $59.44 15,000
City of Tampa 591,000 SWFWMD 10/1/2011 CCF $0.00 $35.04 $71.96 City of Tampa $0.00 - $11.49 $24.86 $0.00 - $23.55 $47.10 -
Hillsborough County 552,590 SWFWMD 6/1/2015 KGAL $26.08 $58.08 $93.77 Hillsborough County $12.47 - $26.95 $45.12 $13.61 - $31.13 $48.65 8,000
INDIAN RIVERCity of Vero Beach (Indian River Shores)
3,995 SJRWMD - KGAL $24.92 $45.38 $67.93City of Vero Beach (Indian River Shores)
$9.05 - $18.07 $29.18 $15.87 - $27.31 $38.75 12,000
Indian River County 100,000 SJRWMD 10/1/1999 KGAL $24.92 $45.38 $67.93 Indian River County $9.05 - $18.07 $29.18 $15.87 - $27.31 $38.75 12,000
JEFFERSON City of Monticello 3,200 NWFWMD 6/3/2010 CCF $25.50 $57.77 $90.02 City of Monticello $7.50 - $15.53 $23.55 $18.00 - $42.24 $66.47 -
LAKE
City of Clermont 33,000 SJRWMD 10/1/2015 KGAL $20.75 $33.19 $45.63 City of Clermont $5.48 - $9.88 $14.28 $15.27 - $23.31 $31.35 16,000
City of Eustis 34,400 SJRWMD 6/1/2014 KGAL $33.39 $53.43 $73.47 City of Eustis $9.96 - $18.28 $26.60 $23.43 - $35.15 $46.87 10,000
City of Groveland - SJRWMD KGAL $37.63 $37.63 $57.03 City of Groveland $10.50 4,000 $10.50 $21.50 $27.13 4,000 $27.13 $35.53 -
City of Leesburg 45,000 SJRWMD 11/1/2015 KGAL $32.04 $42.41 $53.72 City of Leesburg $8.72 - $12.63 $17.47 $23.32 - $29.78 $36.25 15,000
City of Mascotte - SJRWMD 10/6/2014 KGAL N/A N/A N/A City of Mascotte $28.00 1,000 $38.00 $56.00 N/A N/A N/A N/A N/A
City of Minneola - SJRWMD 8/24/2004 KGAL $22.40 $40.94 $63.63 City of Minneola $7.00 2,000 $10.70 $18.55 $15.40 - $30.24 $45.08 15,000
City of Mount Dora 30,400 SJRWMD 4/1/2016 CCF $35.38 $56.30 $77.22 City of Mount Dora $8.44 - $14.33 $20.21 $26.94 - $41.97 $57.01 8,976
City of Tavares 14,582 SJRWMD 10/1/2015 KGAL $36.27 $55.01 $76.47 City of Tavares $16.12 - $21.54 $29.68 $20.15 - $33.47 $46.79 14,000
City of Umatilla 4,000 SJRWMD 10/1/2015 KGAL $39.99 $66.03 $93.57 City of Umatilla $10.39 - $18.43 $27.97 $29.60 - $47.60 $65.60 20,000
Town of Lady Lake 6,115 SJRWMD 10/1/2014 KGAL $27.14 $51.06 $77.18 Town of Lady Lake $11.64 - $21.36 $33.28 $15.50 - $29.70 $43.90 -
Town of Montverde 1,500 SJRWMD 4/27/2016 KGAL N/A N/A N/A Town of Montverde $12.26 3,000 $16.56 $33.74 N/A N/A N/A N/A N/A
LEE
Bonita Springs Utilities, Inc. 51,000 SFWMD 9/1/2010 KGAL $40.65 $70.09 $101.09 Bonita Springs Utilities, Inc. $12.17 - $26.81 $43.01 $28.48 - $43.28 $58.08 16,000
City of Cape Coral - SFWMD 10/1/2013 KGAL $38.39 $90.15 $143.86 City of Cape Coral $17.32 - $32.92 $50.47 $21.07 - $57.23 $93.39 -
City of Fort Myers - SFWMD 10/1/2015 KGAL $23.53 $95.13 $180.68 City of Fort Myers $8.63 - $27.23 $59.78 $14.90 - $67.90 $120.90 -
Lee County 342,584 SWFWMD 10/1/2014 KGAL $33.04 $69.52 $107.64 Lee County $12.59 - $25.67 $40.39 $20.45 - $43.85 $67.25 9,000
Lehigh Acres 32,000 - 10/1/2015 KGAL $40.09 $96.61 $137.49 Lehigh Acres $14.96 - $36.88 $60.46 $25.13 - $59.73 $77.03 6,000
North Fort Myers 5,000 - 10/1/2015 KGAL $34.43 $96.03 $141.39 North Fort Myers $16.91 - $46.03 $75.15 $17.52 - $50.00 $66.24 6,000
Town of Fort Myers Beach 6,900 SFWMD 10/15/2014 KGAL N/A N/A N/A Town of Fort Myers Beach $15.55 - $35.15 $56.65 N/A N/A N/A N/A N/A
LEON City of Tallahassee 248,000 NWFWMD 1/1/2016 KGAL $27.58 $51.70 $80.31 City of Tallahassee $10.55 2,500 $12.91 $19.76 $17.03 - $38.79 $60.55 -
LEVY City of Williston 2,500 SWFWMD 1/19/2016 KGAL $33.42 $37.82 $46.12 City of Williston $6.67 - $11.07 $16.07 $26.75 5,000 $26.75 $30.05 -
LIBERTY Liberty County 2,214 NWFWMD 3/1/2015 KGAL N/A N/A N/A Liberty County $12.50 3,000 $16.25 $31.55 N/A N/A N/A N/A N/A
MANATEE
City of Bradenton 50,389 SWFWMD 10/1/2014 KGAL $34.45 $54.24 $84.80 City of Bradenton $13.90 999 $23.94 $37.94 $20.55 999 $30.30 $46.86 25,000
City of Palmetto 12,000 SWFWMD 10/1/2015 KGAL $24.88 $62.01 $102.17 City of Palmetto $8.53 - $32.02 $57.46 $16.35 - $29.99 $44.71 12,000
Manatee County - SWFWMD 1/1/2016 KGAL $29.57 $56.61 $84.69 Manatee County $8.73 - $17.17 $26.65 $20.84 - $39.44 $58.04 10,000
Town of Longboat Key 20,000 SWFWMD 1/4/2016 KGAL $30.41 $63.61 $93.70 Town of Longboat Key $14.37 - $23.93 $36.29 $16.04 - $39.68 $57.41 7,000
MARION
City of Belleview 3,113 SJRWMD 1/1/2015 KGAL $31.79 $54.31 $78.06 City of Belleview $10.57 - $19.93 $29.79 $21.22 - $34.38 $48.27 -
City of Ocala 65,000 SJRWMD 1/1/2016 CCF $32.47 $48.41 $64.36 City of Ocala $9.48 - $13.44 $17.40 $22.99 - $34.97 $46.96 9,724
Marion County Utilities 63,156 SJRWMD - KGAL $35.28 $63.00 $80.06 Marion County Utilities $12.75 - $17.51 $23.09 $22.53 - $45.49 $56.97 6,000
MARTIN Martin County Utilities 89,575 SFWMD 10/1/2014 KGAL $33.75 $59.03 $84.31 Martin County Utilities $16.57 - $25.09 $33.61 $17.18 - $33.94 $50.70 10,000
MIAMI-DADE
City of Hialeah - SFWMD 10/1/2015 KGAL $9.82 $38.74 $69.37 City of Hialeah $4.83 - $13.71 $23.13 $4.99 - $25.03 $46.24 -
City of Homestead 60,500 SFWMD 12/1/2010 KGAL $21.21 $36.76 $53.24 City of Homestead $7.01 - $10.52 $14.96 $14.20 - $26.24 $38.28 -
City of Miami Beach - SFWMD 10/1/2015 KGAL $22.15 $55.07 $101.82 City of Miami Beach $22.15 5,000 $22.15 $35.98 $0.00 - $32.92 $65.84 -
City of North Miami - SFWMD 11/1/2014 KGAL $29.39 $54.59 $82.07 City of North Miami $12.51 - $20.07 $29.91 $16.88 - $34.52 $52.16 -
City of North Miami Beach 170,000 SFWMD 10/1/2014 KGAL $30.92 $63.16 $98.37 City of North Miami Beach $10.71 - $23.59 $36.84 $20.21 - $39.57 $61.53 -
Miami Dade County 2,266,092 SFWMD 10/1/2015 KGAL $6.45 $18.33 $66.53 Miami Dade County $3.20 - $6.11 $23.11 $3.25 - $12.22 $43.42 -
{ 18 } 2016 FLORIDA WATER AND WASTEWATER RATE SURVEY
COMBINED CHARGE WATER CHARGE WASTEWATER CHARGE
COUNTY UTILITY NAME
APPROX. SERVICE
POP. WMD
RATES EFFECTIVE
DATE UNITSMINIMUM CHARGE
4,000 GAL (5.35 CCF)
8,000 GAL (10.70 CCF) UTILITY NAME
MINIMUM CHARGE
MINIMUM GALLONS INCLUDED
4,000 GAL (5.35 CCF)
8,000 GAL (10.70
CCF)MINIMUM CHARGE
MINIMUM GALLONS INCLUDED
4,000 GAL (5.35 CCF)
8,000 GAL (10.70
CCF)RES. CAP
(GAL)
MONROE
City of Marathon SFWMD 10/1/2012 KGAL N/A N/A N/A City of Marathon N/A N/A N/A N/A $35.97 - $68.13 $100.29 12,000
Florida Keys Aqueduct Authority 73,300 SFWMD 10/1/2015 KGAL $41.90 $107.66 $178.78 Florida Keys Aqueduct Authority $13.90 - $37.26 $65.98 $28.00 - $70.40 $112.80 10,000
Key Largo Wastewater Treatment District - SFWMD - KGAL N/A N/A N/A
Key Largo Wastewater Treatment District
N/A N/A N/A N/A $33.60 - $54.68 $75.76 -
Key West Resort Utilities Corp. - SFWMD - KGAL N/A N/A N/A Key West Resort Utilities Corp. N/A N/A N/A N/A $39.57 - $56.49 $73.41 10,000
Village of Islamorada - SFWMD 10/1/2013 KGAL N/A N/A N/A Village of Islamorada N/A N/A N/A N/A $39.03 - $64.11 $89.19 12,000
OKALOOSA
City of Crestview 22,500 NWFWMD 6/13/1994 KGAL $25.50 $39.20 $66.75 City of Crestview $9.00 2,000 $12.70 $20.25 $16.50 2,000 $26.50 $46.50 16,000
City of Fort Walton Beach 20,300 NWFWMD 10/1/2015 KGAL $32.77 $53.27 $96.99 City of Fort Walton Beach $10.21 2,000 $16.29 $31.17 $22.56 2,000 $36.98 $65.82 16,000
City of Mary Esther 3,844 NWFWMD 10/1/2015 KGAL $32.00 $65.01 $103.93 City of Mary Esther $13.00 - $26.13 $41.69 $19.00 - $38.88 $62.24 -
Destin Water Users 42,000 NWFWMD 1/1/2016 KGAL $40.33 $58.61 $77.73 Destin Water Users $12.36 - $22.72 $33.92 $27.97 - $35.89 $43.81 20,000
Okaloosa County 36,000 NWFWMD 10/1/2015 KGAL $30.96 $57.74 $87.34 Okaloosa County $10.20 - $21.02 $34.66 $20.76 - $36.72 $52.68 10,000
OKEECHOBEE Okeechobee Utility Authority 20,000 SFWMD 10/1/2010 KGAL $40.65 $86.15 $137.83 Okeechobee Utility Authority $18.94 - $37.40 $62.04 $21.71 - $48.75 $75.79 -
ORANGE
City of Maitland 16,500 SJRWMD 10/1/2015 KGAL $25.15 $52.15 $80.35 City of Maitland $9.75 - $14.55 $20.55 $15.40 - $37.60 $59.80 -
City of Ocoee 36,700 SJRWMD 10/1/2015 KGAL $30.90 $47.06 $63.84 City of Ocoee $11.03 - $15.83 $21.25 $19.87 - $31.23 $42.59 12,000
City of Winter Park 45,000 SJRWMD 10/1/2015 KGAL $18.81 $41.97 $67.41 City of Winter Park $8.62 - $13.34 $20.34 $10.19 - $28.63 $47.07 14,000
Oakland Water System 2,538 SJRWMD 10/1/2014 KGAL N/A N/A N/A Oakland Water System $16.50 3,000 $18.97 $28.85 N/A N/A N/A N/A N/A
Orange County Utilities 501,660 SJRWMD 10/1/2015 KGAL $22.43 $41.39 $61.55 Orange County Utilities $6.72 - $11.40 $17.28 $15.71 - $29.99 $44.27 14,000
Orlando Utilities Commission 425,000 SJRWMD 3/1/2009 KGAL N/A N/A N/A Orlando Utilities Commission $7.50 - $10.48 $15.30 N/A N/A N/A N/A N/A
Reedy Creek Improvement District
150,000 SFWMD 9/27/2015 KGAL $26.50 $47.64 $68.78Reedy Creek Improvement District
$23.38 - $27.44 $31.50 $3.12 - $20.20 $37.28 8,000
OSCEOLA Toho Water Authority 73,000 SFWMD 10/1/2015 KGAL $18.02 $36.68 $69.59 Toho Water Authority $5.17 - $9.45 $20.08 $12.85 - $27.23 $49.51 -
PALM BEACH
City of Boca Raton 84,400 SFWMD 10/1/2015 KGAL $24.79 $33.61 $36.77 City of Boca Raton $13.44 - $16.60 $19.76 $11.35 - $17.01 $17.01 -
City of Boynton Beach 105,169 SFWMD 10/1/2015 KGAL $31.05 $46.25 $59.30 City of Boynton Beach $12.35 - $18.95 $25.55 $18.70 - $27.30 $33.75 7,000
City of Delray Beach 66,000 SFWMD 10/1/2009 KGAL $33.76 $48.58 $67.14 City of Delray Beach $15.72 3,000 $16.97 $21.97 $18.04 - $31.61 $45.17 12,000
City of West Palm Beach 100,000 SFWMD 10/1/2015 CCF $32.68 $64.19 $97.35 City of West Palm Beach $20.91 - $33.86 $48.45 $11.77 - $30.33 $48.90 11,968
Palm Beach County 569,000 SFWMD 10/1/2015 KGAL $28.18 $40.78 $69.62 Palm Beach County $13.28 - $18.64 $30.48 $14.90 - $22.14 $39.14 10,000
Town of Jupiter 80,000 SFWMD 10/1/2015 KGAL N/A N/A N/A Town of Jupiter $20.14 - $24.86 $30.44 N/A N/A N/A N/A N/A
Town of Lantana 3,420 SFWMD 10/1/2014 KGAL $33.23 $56.55 $81.79 Town of Lantana $19.98 - $24.98 $31.90 $13.25 - $31.57 $49.89 10,000
Village of Tequesta 6,500 SFWMD 2/1/2016 KGAL N/A N/A N/A Village of Tequesta $15.75 - $25.71 $35.67 N/A N/A N/A N/A N/A
PASCO
Aloha Gardens 7,500 - 10/1/2015 KGAL $19.61 $76.77 $133.93 Aloha Gardens $3.86 - $26.94 $50.02 $15.75 - $49.83 $83.91 10,000
City of Dade City 5,119 SFWMD 3/1/2009 KGAL $19.95 $41.11 $63.26 City of Dade City $5.70 - $13.58 $22.45 $14.25 - $27.53 $40.81 -
City of New Port Richey 10,000 SWFWMD 10/1/2013 KGAL $19.60 $45.48 $73.46 City of New Port Richey $8.72 - $18.68 $30.74 $10.88 - $26.80 $42.72 15,000
City of San Antonio 1,150 SWFWMD 12/1/2008 KGAL N/A N/A N/A City of San Antonio $16.65 2,000 $24.15 $39.15 N/A N/A N/A N/A N/A
City of Zephyrhills 21,000 SWFWMD 10/1/2015 KGAL $19.18 $44.46 $73.46 City of Zephyrhills $4.22 - $11.58 $22.66 $14.96 - $32.88 $50.80 -
Pasco County - SWFWMD 10/1/2014 KGAL $25.17 $56.37 $89.43 Pasco County $7.83 - $18.63 $31.29 $17.34 - $37.74 $58.14 10,000
Seven Springs - - 10/1/2015 KGAL $37.20 $87.24 $137.28 Seven Springs $14.42 - $42.18 $69.94 $22.78 - $45.06 $67.34 10,000
PINELLAS
City of Clearwater 110,000 SWFWMD 10/1/2015 KGAL $46.20 $62.99 $130.15 City of Clearwater $19.44 3,000 $27.31 $58.79 $26.76 3,000 $35.68 $71.36 -
City of Dunedin 42,824 SWFWMD 10/1/2010 KGAL $13.08 $50.48 $93.64 City of Dunedin $6.54 - $21.90 $43.02 $6.54 - $28.58 $50.62 10,000
City of Gulfport - SWFWMD 10/1/2015 KGAL $31.05 $63.46 $135.16 City of Gulfport $13.84 2,000 $28.59 $62.73 $17.21 2,000 $34.87 $72.43 -
City of Largo - SWFWMD - KGAL N/A N/A N/A City of Largo N/A N/A N/A N/A $24.80 3,000 $26.92 $35.40 8,000
City of Oldsmar 13,500 SWFWMD 10/1/2013 KGAL $25.00 $60.67 $108.23 City of Oldsmar $12.25 1,000 $28.66 $50.54 $12.75 1,000 $32.01 $57.69 -
City of Safety Harbor 15,000 SWFWMD 10/1/2009 KGAL $25.86 $54.66 $86.96 City of Safety Harbor $13.53 - $21.65 $33.27 $12.33 - $33.01 $53.69 15,000
City of St. Petersburg 346,072 SWFWMD 11/1/2015 KGAL $23.46 $58.46 $95.91 City of St. Petersburg $11.01 - $26.93 $45.30 $12.45 - $31.53 $50.61 -
City of Tarpon Springs 24,000 SWFWMD 10/1/2015 KGAL $38.06 $67.78 $119.82 City of Tarpon Springs $18.10 - $31.78 $55.66 $19.96 - $36.00 $64.16 -
City of Treasure Island 6,790 SWFWMD 10/1/2014 KGAL N/A N/A N/A City of Treasure Island N/A N/A N/A N/A $14.00 - $47.84 $86.96 -
Pinellas County 375,000 SWFWMD 10/1/2015 KGAL $19.72 $58.52 $97.32 Pinellas County $6.46 - $25.90 $45.34 $13.26 - $32.62 $51.98 10,000

{ 19 }2016 FLORIDA WATER AND WASTEWATER RATE SURVEY
COMBINED CHARGE WATER CHARGE WASTEWATER CHARGE
COUNTY UTILITY NAME
APPROX. SERVICE
POP. WMD
RATES EFFECTIVE
DATE UNITSMINIMUM CHARGE
4,000 GAL (5.35 CCF)
8,000 GAL (10.70 CCF) UTILITY NAME
MINIMUM CHARGE
MINIMUM GALLONS INCLUDED
4,000 GAL (5.35 CCF)
8,000 GAL (10.70
CCF)MINIMUM CHARGE
MINIMUM GALLONS INCLUDED
4,000 GAL (5.35 CCF)
8,000 GAL (10.70
CCF)RES. CAP
(GAL)
MONROE
City of Marathon SFWMD 10/1/2012 KGAL N/A N/A N/A City of Marathon N/A N/A N/A N/A $35.97 - $68.13 $100.29 12,000
Florida Keys Aqueduct Authority 73,300 SFWMD 10/1/2015 KGAL $41.90 $107.66 $178.78 Florida Keys Aqueduct Authority $13.90 - $37.26 $65.98 $28.00 - $70.40 $112.80 10,000
Key Largo Wastewater Treatment District - SFWMD - KGAL N/A N/A N/A
Key Largo Wastewater Treatment District
N/A N/A N/A N/A $33.60 - $54.68 $75.76 -
Key West Resort Utilities Corp. - SFWMD - KGAL N/A N/A N/A Key West Resort Utilities Corp. N/A N/A N/A N/A $39.57 - $56.49 $73.41 10,000
Village of Islamorada - SFWMD 10/1/2013 KGAL N/A N/A N/A Village of Islamorada N/A N/A N/A N/A $39.03 - $64.11 $89.19 12,000
OKALOOSA
City of Crestview 22,500 NWFWMD 6/13/1994 KGAL $25.50 $39.20 $66.75 City of Crestview $9.00 2,000 $12.70 $20.25 $16.50 2,000 $26.50 $46.50 16,000
City of Fort Walton Beach 20,300 NWFWMD 10/1/2015 KGAL $32.77 $53.27 $96.99 City of Fort Walton Beach $10.21 2,000 $16.29 $31.17 $22.56 2,000 $36.98 $65.82 16,000
City of Mary Esther 3,844 NWFWMD 10/1/2015 KGAL $32.00 $65.01 $103.93 City of Mary Esther $13.00 - $26.13 $41.69 $19.00 - $38.88 $62.24 -
Destin Water Users 42,000 NWFWMD 1/1/2016 KGAL $40.33 $58.61 $77.73 Destin Water Users $12.36 - $22.72 $33.92 $27.97 - $35.89 $43.81 20,000
Okaloosa County 36,000 NWFWMD 10/1/2015 KGAL $30.96 $57.74 $87.34 Okaloosa County $10.20 - $21.02 $34.66 $20.76 - $36.72 $52.68 10,000
OKEECHOBEE Okeechobee Utility Authority 20,000 SFWMD 10/1/2010 KGAL $40.65 $86.15 $137.83 Okeechobee Utility Authority $18.94 - $37.40 $62.04 $21.71 - $48.75 $75.79 -
ORANGE
City of Maitland 16,500 SJRWMD 10/1/2015 KGAL $25.15 $52.15 $80.35 City of Maitland $9.75 - $14.55 $20.55 $15.40 - $37.60 $59.80 -
City of Ocoee 36,700 SJRWMD 10/1/2015 KGAL $30.90 $47.06 $63.84 City of Ocoee $11.03 - $15.83 $21.25 $19.87 - $31.23 $42.59 12,000
City of Winter Park 45,000 SJRWMD 10/1/2015 KGAL $18.81 $41.97 $67.41 City of Winter Park $8.62 - $13.34 $20.34 $10.19 - $28.63 $47.07 14,000
Oakland Water System 2,538 SJRWMD 10/1/2014 KGAL N/A N/A N/A Oakland Water System $16.50 3,000 $18.97 $28.85 N/A N/A N/A N/A N/A
Orange County Utilities 501,660 SJRWMD 10/1/2015 KGAL $22.43 $41.39 $61.55 Orange County Utilities $6.72 - $11.40 $17.28 $15.71 - $29.99 $44.27 14,000
Orlando Utilities Commission 425,000 SJRWMD 3/1/2009 KGAL N/A N/A N/A Orlando Utilities Commission $7.50 - $10.48 $15.30 N/A N/A N/A N/A N/A
Reedy Creek Improvement District
150,000 SFWMD 9/27/2015 KGAL $26.50 $47.64 $68.78Reedy Creek Improvement District
$23.38 - $27.44 $31.50 $3.12 - $20.20 $37.28 8,000
OSCEOLA Toho Water Authority 73,000 SFWMD 10/1/2015 KGAL $18.02 $36.68 $69.59 Toho Water Authority $5.17 - $9.45 $20.08 $12.85 - $27.23 $49.51 -
PALM BEACH
City of Boca Raton 84,400 SFWMD 10/1/2015 KGAL $24.79 $33.61 $36.77 City of Boca Raton $13.44 - $16.60 $19.76 $11.35 - $17.01 $17.01 -
City of Boynton Beach 105,169 SFWMD 10/1/2015 KGAL $31.05 $46.25 $59.30 City of Boynton Beach $12.35 - $18.95 $25.55 $18.70 - $27.30 $33.75 7,000
City of Delray Beach 66,000 SFWMD 10/1/2009 KGAL $33.76 $48.58 $67.14 City of Delray Beach $15.72 3,000 $16.97 $21.97 $18.04 - $31.61 $45.17 12,000
City of West Palm Beach 100,000 SFWMD 10/1/2015 CCF $32.68 $64.19 $97.35 City of West Palm Beach $20.91 - $33.86 $48.45 $11.77 - $30.33 $48.90 11,968
Palm Beach County 569,000 SFWMD 10/1/2015 KGAL $28.18 $40.78 $69.62 Palm Beach County $13.28 - $18.64 $30.48 $14.90 - $22.14 $39.14 10,000
Town of Jupiter 80,000 SFWMD 10/1/2015 KGAL N/A N/A N/A Town of Jupiter $20.14 - $24.86 $30.44 N/A N/A N/A N/A N/A
Town of Lantana 3,420 SFWMD 10/1/2014 KGAL $33.23 $56.55 $81.79 Town of Lantana $19.98 - $24.98 $31.90 $13.25 - $31.57 $49.89 10,000
Village of Tequesta 6,500 SFWMD 2/1/2016 KGAL N/A N/A N/A Village of Tequesta $15.75 - $25.71 $35.67 N/A N/A N/A N/A N/A
PASCO
Aloha Gardens 7,500 - 10/1/2015 KGAL $19.61 $76.77 $133.93 Aloha Gardens $3.86 - $26.94 $50.02 $15.75 - $49.83 $83.91 10,000
City of Dade City 5,119 SFWMD 3/1/2009 KGAL $19.95 $41.11 $63.26 City of Dade City $5.70 - $13.58 $22.45 $14.25 - $27.53 $40.81 -
City of New Port Richey 10,000 SWFWMD 10/1/2013 KGAL $19.60 $45.48 $73.46 City of New Port Richey $8.72 - $18.68 $30.74 $10.88 - $26.80 $42.72 15,000
City of San Antonio 1,150 SWFWMD 12/1/2008 KGAL N/A N/A N/A City of San Antonio $16.65 2,000 $24.15 $39.15 N/A N/A N/A N/A N/A
City of Zephyrhills 21,000 SWFWMD 10/1/2015 KGAL $19.18 $44.46 $73.46 City of Zephyrhills $4.22 - $11.58 $22.66 $14.96 - $32.88 $50.80 -
Pasco County - SWFWMD 10/1/2014 KGAL $25.17 $56.37 $89.43 Pasco County $7.83 - $18.63 $31.29 $17.34 - $37.74 $58.14 10,000
Seven Springs - - 10/1/2015 KGAL $37.20 $87.24 $137.28 Seven Springs $14.42 - $42.18 $69.94 $22.78 - $45.06 $67.34 10,000
PINELLAS
City of Clearwater 110,000 SWFWMD 10/1/2015 KGAL $46.20 $62.99 $130.15 City of Clearwater $19.44 3,000 $27.31 $58.79 $26.76 3,000 $35.68 $71.36 -
City of Dunedin 42,824 SWFWMD 10/1/2010 KGAL $13.08 $50.48 $93.64 City of Dunedin $6.54 - $21.90 $43.02 $6.54 - $28.58 $50.62 10,000
City of Gulfport - SWFWMD 10/1/2015 KGAL $31.05 $63.46 $135.16 City of Gulfport $13.84 2,000 $28.59 $62.73 $17.21 2,000 $34.87 $72.43 -
City of Largo - SWFWMD - KGAL N/A N/A N/A City of Largo N/A N/A N/A N/A $24.80 3,000 $26.92 $35.40 8,000
City of Oldsmar 13,500 SWFWMD 10/1/2013 KGAL $25.00 $60.67 $108.23 City of Oldsmar $12.25 1,000 $28.66 $50.54 $12.75 1,000 $32.01 $57.69 -
City of Safety Harbor 15,000 SWFWMD 10/1/2009 KGAL $25.86 $54.66 $86.96 City of Safety Harbor $13.53 - $21.65 $33.27 $12.33 - $33.01 $53.69 15,000
City of St. Petersburg 346,072 SWFWMD 11/1/2015 KGAL $23.46 $58.46 $95.91 City of St. Petersburg $11.01 - $26.93 $45.30 $12.45 - $31.53 $50.61 -
City of Tarpon Springs 24,000 SWFWMD 10/1/2015 KGAL $38.06 $67.78 $119.82 City of Tarpon Springs $18.10 - $31.78 $55.66 $19.96 - $36.00 $64.16 -
City of Treasure Island 6,790 SWFWMD 10/1/2014 KGAL N/A N/A N/A City of Treasure Island N/A N/A N/A N/A $14.00 - $47.84 $86.96 -
Pinellas County 375,000 SWFWMD 10/1/2015 KGAL $19.72 $58.52 $97.32 Pinellas County $6.46 - $25.90 $45.34 $13.26 - $32.62 $51.98 10,000

{ 20 } 2016 FLORIDA WATER AND WASTEWATER RATE SURVEY
COMBINED CHARGE WATER CHARGE WASTEWATER CHARGE
COUNTY UTILITY NAME
APPROX. SERVICE
POP. WMD
RATES EFFECTIVE
DATE UNITSMINIMUM CHARGE
4,000 GAL (5.35 CCF)
8,000 GAL (10.70 CCF) UTILITY NAME
MINIMUM CHARGE
MINIMUM GALLONS INCLUDED
4,000 GAL (5.35 CCF)
8,000 GAL (10.70
CCF)MINIMUM CHARGE
MINIMUM GALLONS INCLUDED
4,000 GAL (5.35 CCF)
8,000 GAL (10.70
CCF)RES. CAP
(GAL)
POLK
City of Auburndale 10,990 SWFWMD 10/1/2015 KGAL $46.97 $46.97 $54.45 City of Auburndale $10.36 4,000 $10.36 $17.84 $36.61 4,000 $36.61 $36.61 4,000
City of Bartow 20,000 SWFWMD 12/1/2011 KGAL $31.87 $48.75 $67.41 City of Bartow $10.55 - $20.31 $31.85 $21.32 - $28.44 $35.56 10,000
City of Eagle Lake 2,500 SWFWMD 10/1/2014 KGAL $39.90 $52.29 $77.45 City of Eagle Lake $15.75 4,000 $15.75 $24.39 $24.15 1,000 $36.54 $53.06 -
City of Fort Meade 2,100 SWFWMD 10/1/2015 KGAL $23.91 $43.99 $64.97 City of Fort Meade $8.11 - $13.27 $19.33 $15.80 - $30.72 $45.64 10,000
City of Frostproof 2,900 SWFWMD 10/1/2012 KGAL $69.90 $79.67 $118.75 City of Frostproof $14.31 3,000 $16.54 $25.46 $55.59 3,000 $63.13 $93.29 -
City of Lake Alfred 6,000 SWFWMD 11/1/2014 KGAL $53.49 $53.49 $55.49 City of Lake Alfred $12.95 6,000 $12.95 $14.95 $40.54 - $40.54 $40.54 -
City of Lake Wales 19,000 SWFWMD 10/1/2015 KGAL $31.77 $55.81 $90.11 City of Lake Wales $6.98 - $18.02 $31.97 $24.79 - $37.79 $58.14 15,000
City of Winter Haven 75,000 SWFWMD 10/1/2015 KGAL $17.62 $45.06 $76.70 City of Winter Haven $8.93 - $17.11 $29.51 $8.69 - $27.95 $47.19 14,000
Lakeland Water Utilities 171,951 SWFWMD 10/1/2015 KGAL $25.30 $48.14 $71.42 Lakeland Water Utilities $8.39 - $16.07 $24.19 $16.91 - $32.07 $47.23 12,000
Polk County 59,834 SWFWMD 10/1/2014 KGAL $45.83 $79.72 $108.96 Polk County $9.69 - $17.66 $27.46 $36.14 - $62.06 $81.50 7,000
Town of Dundee - SWFWMD 10/1/2003 KGAL $77.95 $81.75 $85.55 Town of Dundee $17.00 - $20.80 $24.60 $60.95 - $60.95 $60.95 -
PUTNAM City of Crescent City 2,200 SJRWMD 8/12/2010 KGAL $60.55 $62.71 $72.97 City of Crescent City $19.46 3,000 $21.62 $31.88 $41.09 - $41.09 $41.09 -
SANTA ROSA City of Gulf Breeze 6,838 NWFWMD 1/1/2015 KGAL $29.00 $59.64 $90.28 City of Gulf Breeze $12.00 - $25.44 $38.88 $17.00 - $34.20 $51.40 -
SARASOTA
City of North Port 45,759 SWFWMD 1/1/2016 KGAL $45.76 $85.28 $132.36 City of North Port $17.80 - $33.00 $55.76 $27.96 - $52.28 $76.60 12,000
City of Sarasota 52,000 SWFWMD 9/1/2015 KGAL $39.73 $80.05 $127.53 City of Sarasota $16.72 - $30.24 $46.16 $23.01 - $49.81 $81.37 -
City of Venice 22,000 SWFWMD 10/1/2015 KGAL $45.22 $94.20 $152.89 City of Venice $21.43 - $43.53 $75.34 $23.79 - $50.67 $77.55 -
Sarasota County 200,000 SWFWMD 11/19/2013 KGAL $30.96 $70.88 $113.36 Sarasota County $16.07 - $25.83 $38.15 $14.89 - $45.05 $75.21 10,000
SEMINOLE
City of Altamonte Springs 41,000 SJRWMD 10/1/2014 KGAL $10.80 $28.92 $58.67 City of Altamonte Springs $3.61 - $9.94 $20.52 $7.19 - $18.98 $38.15 11,000
City of Casselberry 21,000 SJRWMD 10/1/2015 KGAL $22.75 $51.95 $90.91 City of Casselberry $8.10 - $14.14 $24.18 $14.65 - $37.81 $66.73 -
City of Oviedo 30,000 SJRWMD 10/1/2015 KGAL $34.83 $56.98 $82.58 City of Oviedo $11.36 - $16.27 $24.63 $23.47 - $40.71 $57.95 10,000
City of Sanford 51,000 SJRWMD 10/1/2013 KGAL $30.95 $46.13 $77.79 City of Sanford $10.90 2,000 $15.14 $24.92 $20.05 2,000 $30.99 $52.87 12,000
City of Winter Springs 34,000 SJRWMD 10/1/2014 KGAL $16.95 $39.83 $62.71 City of Winter Springs $5.72 - $11.04 $16.36 $11.23 - $28.79 $46.35 10,000
Sanlando Utilities Corporation - SJRWMD - KGAL $19.43 $30.67 $42.85 Sanlando Utilities Corporation $4.45 - $8.21 $12.91 $14.98 - $22.46 $29.94 10,000
Seminole County 154,700 SJRWMD 10/1/2015 KGAL $33.38 $56.38 $79.38 Seminole County $12.89 - $17.25 $21.61 $20.49 - $39.13 $57.77 -
ST. JOHNS
City of St. Augustine 17,000 SJRWMD 10/1/2015 KGAL $23.30 $58.35 $101.83 City of St. Augustine $11.53 - $24.34 $45.58 $11.77 - $34.01 $56.25 10,000
St. Johns County - Main System 82,000 SJRWMD 10/1/2015 KGAL $26.28 $56.48 $88.96 St. Johns County - Main System $12.08 - $24.36 $38.92 $14.20 - $32.12 $50.04 10,000
St. Johns County - Ponte Vedra System
26,500 SJRWMD 10/1/2015 KGAL $32.12 $49.84 $68.46St. Johns County - Ponte Vedra System
$12.85 - $18.61 $25.27 $19.27 - $31.23 $43.19 10,000
ST. LUCIECity of Port St. Lucie 190,000 SFWMD 10/1/2014 KGAL $24.01 $69.29 $118.14 City of Port St. Lucie $8.31 - $23.87 $43.00 $15.70 - $45.42 $75.14 8,000
Fort Pierce Utilities Authority 42,000 SFWMD 3/1/2015 KGAL $39.13 $64.54 $100.30 Fort Pierce Utilities Authority $23.83 3,000 $27.28 $41.08 $15.30 - $37.26 $59.22 10,000
St. Lucie County Utilities 25,958 SFWMD 6/1/2015 KGAL $48.30 $90.46 $140.75 St. Lucie County Utilities $22.25 - $36.05 $57.98 $26.05 - $54.41 $82.77 10,000
SUMTER Little Sumter Service Area 24,753 SWFWMD 10/1/2015 KGAL $21.56 $36.04 $50.52 Little Sumter Service Area $7.38 - $13.14 $18.90 $14.18 - $22.90 $31.62 10,000
Village Center Service Area 18,122 SJRWMD 10/1/2015 KGAL $35.71 $40.67 $45.63 Village Center Service Area $7.38 - $12.34 $17.30 $28.33 - $28.33 $28.33 -
VOLUSIA
City of Daytona Beach 88,000 SJRWMD 10/1/2015 KGAL $27.91 $69.75 $124.39 City of Daytona Beach $15.25 1,000 $30.31 $50.39 $12.66 900 $39.44 $74.00 -
City of DeLand 40,000 SJRWMD 10/1/2015 KGAL $41.02 $67.18 $93.34 City of DeLand $11.89 - $19.57 $27.25 $29.13 - $47.61 $66.09 15,000
City of Deltona 85,000 SJRWMD 11/1/2015 KGAL $27.99 $90.43 $170.24 City of Deltona $11.22 - $17.50 $28.52 $16.77 - $72.93 $141.72 10,000
City of Edgewater 20,958 SJRWMD 10/1/2015 KGAL $24.86 $62.78 $112.88 City of Edgewater $10.14 - $24.90 $51.84 $14.72 - $37.88 $61.04 -
City of Orange City - SJRWMD 10/1/2015 KGAL $31.31 $73.79 $118.06 City of Orange City $10.43 - $24.71 $40.78 $20.88 - $49.08 $77.28 9,000
City of Ormond Beach 28,497 SJRWMD 10/1/2015 KGAL $29.87 $45.09 $76.71 City of Ormond Beach $13.08 2,000 $19.44 $33.34 $16.79 2,000 $25.65 $43.37 -
City of Port Orange 70,000 SJRWMD 4/1/2015 KGAL $21.60 $49.72 $82.64 City of Port Orange $9.90 - $20.62 $36.14 $11.70 - $29.10 $46.50 12,000
Town of Ponce Inlet 3,100 SJRWMD 1/1/2015 KGAL $32.93 $67.69 $115.45 Town of Ponce Inlet $18.30 2,000 $31.30 $57.30 $14.63 - $36.39 $58.15 12,000
Volusia County - Softened 8,150 SJRWMD 1/1/2015 KGAL $33.34 $65.34 $99.92 Volusia County - Softened $13.14 - $28.02 $45.48 $20.20 - $37.32 $54.44 14,000
Volusia County - Unsoftened 23,000 SJRWMD 1/1/2015 KGAL $33.34 $58.34 $84.81 Volusia County - Unsoftened $13.14 - $21.02 $30.37 $20.20 - $37.32 $54.44 14,000
WAKULLA City of St. Marks 330 NWFWMD 1/1/2011 KGAL $50.00 $57.71 $88.55 City of St. Marks $22.46 3,000 $25.30 $36.66 $27.54 3,000 $32.41 $51.89 -
WALTONCity of DeFuniak Springs 4,400 NWFWMD 10/1/2015 KGAL $43.00 $72.32 $110.19 City of DeFuniak Springs $17.88 2,000 $25.32 $41.31 $25.12 - $47.00 $68.88 -
South Walton Utility Company 16,000 NWFWMD 10/1/2015 KGAL $24.69 $52.97 $82.18 South Walton Utility Company $9.28 - $16.44 $24.53 $15.41 - $36.53 $57.65 10,000

{ 21 }2016 FLORIDA WATER AND WASTEWATER RATE SURVEY
COMBINED CHARGE WATER CHARGE WASTEWATER CHARGE
COUNTY UTILITY NAME
APPROX. SERVICE
POP. WMD
RATES EFFECTIVE
DATE UNITSMINIMUM CHARGE
4,000 GAL (5.35 CCF)
8,000 GAL (10.70 CCF) UTILITY NAME
MINIMUM CHARGE
MINIMUM GALLONS INCLUDED
4,000 GAL (5.35 CCF)
8,000 GAL (10.70
CCF)MINIMUM CHARGE
MINIMUM GALLONS INCLUDED
4,000 GAL (5.35 CCF)
8,000 GAL (10.70
CCF)RES. CAP
(GAL)
POLK
City of Auburndale 10,990 SWFWMD 10/1/2015 KGAL $46.97 $46.97 $54.45 City of Auburndale $10.36 4,000 $10.36 $17.84 $36.61 4,000 $36.61 $36.61 4,000
City of Bartow 20,000 SWFWMD 12/1/2011 KGAL $31.87 $48.75 $67.41 City of Bartow $10.55 - $20.31 $31.85 $21.32 - $28.44 $35.56 10,000
City of Eagle Lake 2,500 SWFWMD 10/1/2014 KGAL $39.90 $52.29 $77.45 City of Eagle Lake $15.75 4,000 $15.75 $24.39 $24.15 1,000 $36.54 $53.06 -
City of Fort Meade 2,100 SWFWMD 10/1/2015 KGAL $23.91 $43.99 $64.97 City of Fort Meade $8.11 - $13.27 $19.33 $15.80 - $30.72 $45.64 10,000
City of Frostproof 2,900 SWFWMD 10/1/2012 KGAL $69.90 $79.67 $118.75 City of Frostproof $14.31 3,000 $16.54 $25.46 $55.59 3,000 $63.13 $93.29 -
City of Lake Alfred 6,000 SWFWMD 11/1/2014 KGAL $53.49 $53.49 $55.49 City of Lake Alfred $12.95 6,000 $12.95 $14.95 $40.54 - $40.54 $40.54 -
City of Lake Wales 19,000 SWFWMD 10/1/2015 KGAL $31.77 $55.81 $90.11 City of Lake Wales $6.98 - $18.02 $31.97 $24.79 - $37.79 $58.14 15,000
City of Winter Haven 75,000 SWFWMD 10/1/2015 KGAL $17.62 $45.06 $76.70 City of Winter Haven $8.93 - $17.11 $29.51 $8.69 - $27.95 $47.19 14,000
Lakeland Water Utilities 171,951 SWFWMD 10/1/2015 KGAL $25.30 $48.14 $71.42 Lakeland Water Utilities $8.39 - $16.07 $24.19 $16.91 - $32.07 $47.23 12,000
Polk County 59,834 SWFWMD 10/1/2014 KGAL $45.83 $79.72 $108.96 Polk County $9.69 - $17.66 $27.46 $36.14 - $62.06 $81.50 7,000
Town of Dundee - SWFWMD 10/1/2003 KGAL $77.95 $81.75 $85.55 Town of Dundee $17.00 - $20.80 $24.60 $60.95 - $60.95 $60.95 -
PUTNAM City of Crescent City 2,200 SJRWMD 8/12/2010 KGAL $60.55 $62.71 $72.97 City of Crescent City $19.46 3,000 $21.62 $31.88 $41.09 - $41.09 $41.09 -
SANTA ROSA City of Gulf Breeze 6,838 NWFWMD 1/1/2015 KGAL $29.00 $59.64 $90.28 City of Gulf Breeze $12.00 - $25.44 $38.88 $17.00 - $34.20 $51.40 -
SARASOTA
City of North Port 45,759 SWFWMD 1/1/2016 KGAL $45.76 $85.28 $132.36 City of North Port $17.80 - $33.00 $55.76 $27.96 - $52.28 $76.60 12,000
City of Sarasota 52,000 SWFWMD 9/1/2015 KGAL $39.73 $80.05 $127.53 City of Sarasota $16.72 - $30.24 $46.16 $23.01 - $49.81 $81.37 -
City of Venice 22,000 SWFWMD 10/1/2015 KGAL $45.22 $94.20 $152.89 City of Venice $21.43 - $43.53 $75.34 $23.79 - $50.67 $77.55 -
Sarasota County 200,000 SWFWMD 11/19/2013 KGAL $30.96 $70.88 $113.36 Sarasota County $16.07 - $25.83 $38.15 $14.89 - $45.05 $75.21 10,000
SEMINOLE
City of Altamonte Springs 41,000 SJRWMD 10/1/2014 KGAL $10.80 $28.92 $58.67 City of Altamonte Springs $3.61 - $9.94 $20.52 $7.19 - $18.98 $38.15 11,000
City of Casselberry 21,000 SJRWMD 10/1/2015 KGAL $22.75 $51.95 $90.91 City of Casselberry $8.10 - $14.14 $24.18 $14.65 - $37.81 $66.73 -
City of Oviedo 30,000 SJRWMD 10/1/2015 KGAL $34.83 $56.98 $82.58 City of Oviedo $11.36 - $16.27 $24.63 $23.47 - $40.71 $57.95 10,000
City of Sanford 51,000 SJRWMD 10/1/2013 KGAL $30.95 $46.13 $77.79 City of Sanford $10.90 2,000 $15.14 $24.92 $20.05 2,000 $30.99 $52.87 12,000
City of Winter Springs 34,000 SJRWMD 10/1/2014 KGAL $16.95 $39.83 $62.71 City of Winter Springs $5.72 - $11.04 $16.36 $11.23 - $28.79 $46.35 10,000
Sanlando Utilities Corporation - SJRWMD - KGAL $19.43 $30.67 $42.85 Sanlando Utilities Corporation $4.45 - $8.21 $12.91 $14.98 - $22.46 $29.94 10,000
Seminole County 154,700 SJRWMD 10/1/2015 KGAL $33.38 $56.38 $79.38 Seminole County $12.89 - $17.25 $21.61 $20.49 - $39.13 $57.77 -
ST. JOHNS
City of St. Augustine 17,000 SJRWMD 10/1/2015 KGAL $23.30 $58.35 $101.83 City of St. Augustine $11.53 - $24.34 $45.58 $11.77 - $34.01 $56.25 10,000
St. Johns County - Main System 82,000 SJRWMD 10/1/2015 KGAL $26.28 $56.48 $88.96 St. Johns County - Main System $12.08 - $24.36 $38.92 $14.20 - $32.12 $50.04 10,000
St. Johns County - Ponte Vedra System
26,500 SJRWMD 10/1/2015 KGAL $32.12 $49.84 $68.46St. Johns County - Ponte Vedra System
$12.85 - $18.61 $25.27 $19.27 - $31.23 $43.19 10,000
ST. LUCIECity of Port St. Lucie 190,000 SFWMD 10/1/2014 KGAL $24.01 $69.29 $118.14 City of Port St. Lucie $8.31 - $23.87 $43.00 $15.70 - $45.42 $75.14 8,000
Fort Pierce Utilities Authority 42,000 SFWMD 3/1/2015 KGAL $39.13 $64.54 $100.30 Fort Pierce Utilities Authority $23.83 3,000 $27.28 $41.08 $15.30 - $37.26 $59.22 10,000
St. Lucie County Utilities 25,958 SFWMD 6/1/2015 KGAL $48.30 $90.46 $140.75 St. Lucie County Utilities $22.25 - $36.05 $57.98 $26.05 - $54.41 $82.77 10,000
SUMTER Little Sumter Service Area 24,753 SWFWMD 10/1/2015 KGAL $21.56 $36.04 $50.52 Little Sumter Service Area $7.38 - $13.14 $18.90 $14.18 - $22.90 $31.62 10,000
Village Center Service Area 18,122 SJRWMD 10/1/2015 KGAL $35.71 $40.67 $45.63 Village Center Service Area $7.38 - $12.34 $17.30 $28.33 - $28.33 $28.33 -
VOLUSIA
City of Daytona Beach 88,000 SJRWMD 10/1/2015 KGAL $27.91 $69.75 $124.39 City of Daytona Beach $15.25 1,000 $30.31 $50.39 $12.66 900 $39.44 $74.00 -
City of DeLand 40,000 SJRWMD 10/1/2015 KGAL $41.02 $67.18 $93.34 City of DeLand $11.89 - $19.57 $27.25 $29.13 - $47.61 $66.09 15,000
City of Deltona 85,000 SJRWMD 11/1/2015 KGAL $27.99 $90.43 $170.24 City of Deltona $11.22 - $17.50 $28.52 $16.77 - $72.93 $141.72 10,000
City of Edgewater 20,958 SJRWMD 10/1/2015 KGAL $24.86 $62.78 $112.88 City of Edgewater $10.14 - $24.90 $51.84 $14.72 - $37.88 $61.04 -
City of Orange City - SJRWMD 10/1/2015 KGAL $31.31 $73.79 $118.06 City of Orange City $10.43 - $24.71 $40.78 $20.88 - $49.08 $77.28 9,000
City of Ormond Beach 28,497 SJRWMD 10/1/2015 KGAL $29.87 $45.09 $76.71 City of Ormond Beach $13.08 2,000 $19.44 $33.34 $16.79 2,000 $25.65 $43.37 -
City of Port Orange 70,000 SJRWMD 4/1/2015 KGAL $21.60 $49.72 $82.64 City of Port Orange $9.90 - $20.62 $36.14 $11.70 - $29.10 $46.50 12,000
Town of Ponce Inlet 3,100 SJRWMD 1/1/2015 KGAL $32.93 $67.69 $115.45 Town of Ponce Inlet $18.30 2,000 $31.30 $57.30 $14.63 - $36.39 $58.15 12,000
Volusia County - Softened 8,150 SJRWMD 1/1/2015 KGAL $33.34 $65.34 $99.92 Volusia County - Softened $13.14 - $28.02 $45.48 $20.20 - $37.32 $54.44 14,000
Volusia County - Unsoftened 23,000 SJRWMD 1/1/2015 KGAL $33.34 $58.34 $84.81 Volusia County - Unsoftened $13.14 - $21.02 $30.37 $20.20 - $37.32 $54.44 14,000
WAKULLA City of St. Marks 330 NWFWMD 1/1/2011 KGAL $50.00 $57.71 $88.55 City of St. Marks $22.46 3,000 $25.30 $36.66 $27.54 3,000 $32.41 $51.89 -
WALTONCity of DeFuniak Springs 4,400 NWFWMD 10/1/2015 KGAL $43.00 $72.32 $110.19 City of DeFuniak Springs $17.88 2,000 $25.32 $41.31 $25.12 - $47.00 $68.88 -
South Walton Utility Company 16,000 NWFWMD 10/1/2015 KGAL $24.69 $52.97 $82.18 South Walton Utility Company $9.28 - $16.44 $24.53 $15.41 - $36.53 $57.65 10,000

Raftelis Financial Consultants (RFC) has the largest utility financial and rate consulting practice in the nation, with more than 50 consultants in 14 offices around the country, including two Florida offices in Casselberry and Sarasota. RFC is also registered as a Municipal Advisor with the U.S. Securities Exchange Commission (SEC) and the Municipal Securities Rulemaking Board (MSRB). RFC provides a variety of financial, rate, and management consulting services for water, wastewater, and stormwater utilities including:
FINANCIAL & RATE CONSULTING
• Affordability Analysis and Program Development
• Debt Issuance Support• Dispute Resolution• Financial and Capital Improvements
Planning• Rate Case Support• Rate Study• Risk Analysis• Stormwater Utility Development
MANAGEMENT CONSULTING
• Customer Relationship Management• Custom Software and Tool Development• Data Services• Organizational Optimization • Performance Management and
Benchmarking • Project/Program Procurement
Assistance• Public/Stakeholder Education,
Outreach, and Facilitation• Stormwater Program Development
Support • Strategic Business Planning• Water/Wastewater Utility Valuation
RFC conducts and/or publishes several of the water and wastewater utility indus-try's leading rate surveys, some of which are co-published by various industry as-sociations, including:• Water and Wastewater Rate Survey, co-
published with the American Water Works Association (AWWA)
• Utility Financial Information Survey, published by the Association of Metropolitan Water Agencies (AMWA)
• Florida Water and Wastewater Rate Survey• California-Nevada Water and
Wastewater Rate Survey, co-published with the CA-NV AWWA
• Water and Wastewater Residential Rate Survey, published by the Water Infrastructure Finance Authority of Arizona
• Washington/Oregon Water and Wastewater Rate Survey
ABOUT RAFTELIS FINANCIAL CONSULTANTS, INC.
FOR MORE INFORMATION, PLEASE VISIT: WWW.RAFTELIS.COM
RFC OFFICE LOCATIONS
{ 22 } 2016 FLORIDA WATER AND WASTEWATER RATE SURVEY

The 2016 Florida Water and Wastewater Rate Survey includes information for more than 180 utilities throughout Florida, each with its own unique characteristics including rate structures that vary in complexity and cost. This document includes highlights from the survey and illustrates why rates may differ among communities. We hope the survey provides a resource for utilities to compare themselves with their peer communities throughout Florida, and to stay abreast of industry trends.
Photo Credits Courtesy of: Front Cover, Arturo Donate on Flickr | Inside Cover, Jim
Luckah on Flickr | Table of Contents, Dan Lundberg on Flickr | p. 10, Andrew Peterson
on Flickr | p. 12, Chauncey Davis on Flickr | Back Cover, Eric Kilby on Flickr
{ 23 }2016 FLORIDA WATER AND WASTEWATER RATE SURVEY
950 S. Winter Park Drive, Suite 240, Casselberry, FL 32707
2803 Fruitville Road, Suite 154, Sarasota, FL 34237
P: 407.960.1806 / F: 407.960.1803
WWW.RAFTELIS.COM