the effect of primary treatment of wastewater in high rate
TRANSCRIPT

Accepted Manuscript
The effect of primary treatment of wastewater in high rate algal pond systems:biomass and bioenergy recovery
Larissa T. Arashiro, Ivet Ferrer, Diederik P.L. Rousseau, Stijn W.H. Van Hulle,Marianna Garfí
PII: S0960-8524(19)30120-8DOI: https://doi.org/10.1016/j.biortech.2019.01.096Reference: BITE 20973
To appear in: Bioresource Technology
Received Date: 5 November 2018Revised Date: 21 January 2019Accepted Date: 22 January 2019
Please cite this article as: Arashiro, L.T., Ferrer, I., Rousseau, D.P.L., Van Hulle, S.W.H., Garfí, M., The effect ofprimary treatment of wastewater in high rate algal pond systems: biomass and bioenergy recovery, BioresourceTechnology (2019), doi: https://doi.org/10.1016/j.biortech.2019.01.096
This is a PDF file of an unedited manuscript that has been accepted for publication. As a service to our customerswe are providing this early version of the manuscript. The manuscript will undergo copyediting, typesetting, andreview of the resulting proof before it is published in its final form. Please note that during the production processerrors may be discovered which could affect the content, and all legal disclaimers that apply to the journal pertain.

1
The effect of primary treatment of wastewater in high rate algal pond
systems: biomass and bioenergy recovery
Larissa T. Arashiroa,b, Ivet Ferrera*, Diederik P.L. Rousseaub, Stijn W.H. Van Hulleb and
Marianna Garfía
aGEMMA - Group of Environmental Engineering and Microbiology, Department of Civil
and Environmental Engineering, Universitat Politècnica de Catalunya · BarcelonaTech, c/
Jordi Girona 1-3, Building D1, 08034 Barcelona, Spain
bDepartment of Green Chemistry and Technology, Ghent University Campus Kortrijk, Graaf
Karel de Goedelaan 5, 8500 Kortrijk, Belgium
* Corresponding author: Tel: +34 934016463
E-mail address: [email protected] (I. Ferrer)

2
Abstract
The aim of this study was to assess the effect of primary treatment on the performance of two
pilot-scale high rate algal ponds (HRAPs) treating urban wastewater, considering their
treatment efficiency, biomass productivity, characteristics and biogas production potential.
Results indicated that the primary treatment did not significantly affect the wastewater
treatment efficiency (NH4+-N removal of 93 and 91% and COD removal of 62 and 65% in
HRAP with and without primary treatment, respectively). The HRAP without primary
treatment had higher biodiversity and productivity (18 vs. 16 g VSS/m2d). Biomass from
both systems presented good settling capacity. Results of biochemical methane potential test
showed that co-digesting microalgae and primary sludge led to higher methane yields (238 -
258 mL CH4/g VS) compared with microalgae mono-digestion (189 - 225 mL CH4/g VS).
Overall, HRAPs with and without primary treatment seem to be appropriate alternatives for
combining wastewater treatment and bioenergy recovery.
Keywords: Biogas, microalgae, open photobioreactor, wastewater treatment, resource
recovery

3
1. Introduction
High rate algal ponds (HRAPs) have received renewed interest due to their capacity to treat
wastewater with reduced energy consumption compared to conventional activated sludge
systems, while producing microalgal biomass that can be used for non-food bioproducts and
biofuels production (Young et al., 2017). HRAPs consist of shallow, paddlewheel mixed,
raceway ponds where microalgae assimilate nutrients and produce oxygen, which is used by
bacteria to oxidise organic matter (Craggs et al., 2014; Park et al., 2011). They are low-cost
technologies that can be successfully implemented in locations where weather conditions are
favourable for microalgae growth (e.g. high solar radiation and temperature). These natural
systems are appropriate solutions for wastewater treatment especially in small
agglomerations, since they reduce costs and environmental impacts associated with
wastewater treatment (Garfí et al., 2017). In this context, they were reported to treat
anaerobically digested domestic wastewater reaching removal efficiencies of up to 97% of
NH4+-N and 87% of soluble biochemical oxygen demand (sBOD5) at optimal conditions
(Park and Craggs, 2011). Similar results were obtained from HRAPs treating primary settled
urban wastewater, reaching average removal of 80% of chemical oxygen demand (COD) and
95% of NH4+-N (Gutiérrez et al., 2016). Other studies applying this technology to treat
agricultural wastes and industrial wastewater were also reported (de Godos et al., 2010;
Ibekwe et al., 2017; Van Den Hende et al., 2016). Moreover, HRAPs have been proven to be
very effective for the recovery of bioenergy (e.g. biofuels), nutrients (e.g. biofertilisers) and
valuable compounds (e.g. pigments, lipids) from wastewater (Arashiro et al., 2018; Craggs
et al., 2011; Van Den Hende et al., 2016).

4
The installation and maintenance of HRAPs are significantly cheaper compared to
conventional activated sludge systems and closed photobioreactors (Delrue et al., 2016).
Another advantage of the HRAPs is that greenhouse gas emissions are also reduced, making
them an option to improve the sustainability of wastewater treatment (Acién et al., 2016).
However, one of the main drawbacks for implementing HRAPs for wastewater treatment is
the large surface area requirement (up to 6 m2/PE), which is necessary to promote satisfactory
removal efficiency and biomass productivity. Indeed, a critical analysis of the latest studies
on microalgae-based processes for wastewater treatment identified that the major obstacle
hindering the dissemination of these technologies is the land requirement (Acién et al., 2016).
In order to overcome this drawback and to simplify system operation and maintenance, the
option of removing the primary treatment from the entire process could be considered.
Primary treatment consists of removing settleable organic and inorganic solids from the raw
wastewater by sedimentation. To date, there are several studies on optimising the HRAP
operating conditions, such as depth, hydraulic retention time (HRT) and dynamics (Amini et
al., 2016; Buchanan et al., 2018; Sutherland et al., 2014). However, there are no studies in
the literature which investigate, in practice, the role and effect of the primary treatment step
before the HRAPs. Posadas et al. (2017) carried out a theoretical case study suggesting that
primary suspended solids removal is probably unnecessary in a HRAP system. This
implication was based on the fact that the removal of biodegradable suspended solids can be
efficiently reached by microalgal photosynthesis, which generates large excess in
oxygenation capacity in the ponds. As suspended solids from raw wastewater may have an
impact on light penetration and microalgae growth, which is directly related to biomass
productivity and treatment capacity, further research is needed in order to demonstrate the
5
feasibility of this configuration. Moreover, the possibility of incorporating a downstream
process for microalgae biomass valorisation could be jeopardised in case the quality and
amount of biomass was negatively affected by the absence of primary treatment.
Facing the current energy and environmental crisis, with the global economy relying on fossil
fuels, extensive research has been done to valorise microalgal biomass within a biorefinery
approach (Raheem et al., 2018; Šoštarič et al., 2012). Among the different biomass
valorisation techniques proposed so far, biogas production seems to be the least complex
option to recover bioenergy from microalgal biomass. Previous studies have reported the
microalgae as a potential substrate for anaerobic digestion, especially after undergoing
pretreatments to enhance the methane yield (González-Fernández et al., 2012; Uggetti et al.,
2017).
The aim of this research was therefore to investigate the effect of primary treatment on the
long-term performance of pilot-scale HRAPs with a holistic approach, considering not only
the wastewater treatment efficiency and biomass characteristics, but also the bioenergy
recovery potential from harvested biomass. In particular, the present study focused on: 1)
studying the performance of two parallel pilot systems: a HRAP treating raw urban
wastewater and a HRAP treating primary settled urban wastewater; 2) comparing the biomass
productivity, composition and settling capacity of each system; and 3) assessing the biogas
production potential from microalgal biomass of each system. This is, to the best of the
authors knowledge, the first study that explicitly investigated the role of the primary
treatment in HRAP systems based on pilot-scale experiments and its effect on bioenergy
recovery.

6
2. Materials and methods
2.1. High rate algal ponds
Experiments were carried out in a pilot plant located outdoors at the laboratory of the
GEMMA Research Group (Universitat Politècnica de Catalunya, Barcelona, Spain) during
260 days (November 2016 – July 2017). The system treated real wastewater from the
municipal sewer, which received a pretreatment (screening) in the homogenization tank (1.2
m3) that was continuously stirred to avoid solids sedimentation. From this tank, wastewater
was conveyed to two parallel treatment lines: one with a primary treatment (PT) in a
cylindrical PVC settling tank (diameter: 18 cm, height: 30 cm, effective volume: 3 L, HRT:
41 min) as a control line (HRAP-PT); and another one without PT as a test line (HRAP-
noPT). Subsequently, two identical HRAPs received the corresponding influents (105 L/day)
with a HRT of 4.5 days. The HRAPs were made of PVC with a useful volume of 0.47 m3, a
surface area of 1.5 m2, a water depth of 0.3 m, and with a paddle wheel constantly stirring
the mixed liquor at an average velocity of 10 m/h. Both HRAPs were followed by secondary
settlers (diameter: 18 cm, height: 34 cm, effective volume: 3.3 L, HRT: 46 min) where the
secondary effluent was separated from the microalgae. The biomass then was further
thickened before undergoing anaerobic digestion. Details on the bioenergy recovery set-up
will be described later. A schematic structure of the pilot plant is shown in Fig. 1. The
performance of both lines were compared in terms of wastewater treatment efficiency and
biomass productivity, composition and settling capacity. In order to account for the
seasonality, the wastewater treatment efficiency was compared in cold (November to March)
and warm (April to July) periods.

7
Please insert Figure 1
2.2. Wastewater characterisation
In order to evaluate the wastewater treatment efficiency of both systems, the following
parameters were monitored: dissolved oxygen (DO) and temperature (EcoScan DO 6,
ThermoFisher Scientific, USA) (daily), pH (Crison 506, Spain) and turbidity (Hanna HI
93703, USA) (three times per week), total suspended solids (TSS), volatile suspended solids
(VSS), chlorophyll-a, according to Standard Methods (APHA-AWWA-WEF,
2012), NH4+-N according to Solórzano method (Solórzano, 1969) and NO2
--N, NO3--N and
PO43--P through isocratic mode with carbonate-based eluents at a temperature of 30°C and a
flow of 1 mL/min (ICS-1000, Dionex Corporation, USA) (limits of detection (LOD) were
0.9 mg/L of NO2--N, 1.12 of NO3
--N, and 0.8 mg/L of PO43—P) (twice a week), alkalinity,
total and soluble chemical oxygen demand (COD and sCOD) according to Standard Methods
(APHA-AWWA-WEF, 2012), total carbon (TC) and total nitrogen (TN) (multi N/C 2100S,
Analytik Jena, Germany) (once a week). All the analyses were done in triplicate and results
are given as average values.
2.3. Biomass composition and productivity
Samples of biomass were analysed microscopically (BA310, Motic, China) once a month, in
order to observe the composition of microorganisms and measure flocs sizes during the
experimental period. The identification of microalgae genera was based on conventional
taxonomic books (Palmer, 1962; Streble and Krauter, 1987).

8
Average biomass productivity (g VSS/m²d) was calculated based on the VSS concentration
in the HRAPs mixed liquor samples, using Equation 1.
𝐵𝑖𝑜𝑚𝑎𝑠𝑠 𝑝𝑟𝑜𝑑𝑢𝑐𝑡𝑖𝑣𝑖𝑡𝑦 = 𝑉𝑆𝑆 (𝑄 − 𝑄𝐸 + 𝑄𝑃)
𝐴 Eq. 1
where 𝑉𝑆𝑆 is the volatile suspended solids concentration of the HRAP mixed liquor (g
VSS/L); 𝑄 is the wastewater flow rate (L/d); 𝑄𝐸 is the evaporation rate (L/d); 𝑄𝑃 is the
precipitation rate (L/d); and 𝐴 is the surface area of the HRAP (m2). The evaporation rate was
calculated using Eq. 2.
𝑄𝐸 = 𝐸𝑝 𝐴 Eq. 2
where 𝐴 is the surface area of the HRAP (m2) and 𝐸𝑝 is the potential evaporation (mm/d),
calculated from Turc’s formula (Eq. 3) (Fisher and Pringle III, 2013).
𝐸𝑝 = 𝑎 (𝑅 + 50) 𝑇𝑎
(𝑇𝑎 + 15) Eq. 3
where 𝑅 is the average solar radiation in a day (cal/cm2d); 𝑇𝑎 is the average air temperature
in a day (°C); and 𝑎 is a dimensionless coefficient which varies depending on the sampling
frequency (0.0133 for daily samples).
Solar radiation, air temperature and precipitation data were provided by the local automatic
weather station of Barcelona – Zona Universitària (X8) (Supplementary materials) (DAM,
2017).
2.4. Biomass settling capacity
Sedimentation tests were carried out monthly in order to observe the difference between the
settling characteristics of the biomass produced in both HRAPs. The tests were performed in

9
a settling column (height: 50 cm, diameter: 9 cm) with four sampling ports at different depths
along the column (d1 = 12 cm, d2 = 20 cm, d3 = 32 cm and d4 = 40 cm), according to the
method described by Metcalf & Eddy (2003). Mixed liquor of each HRAP was poured into
the column up to 45 cm height in such a way that the distribution of particle sizes was uniform
from top to bottom. At various time intervals (0, 5, 10, 20, 40, 60, 90, 120, 180 min), samples
of 20 mL were withdrawn from the sampling ports and analysed for TSS concentrations.
Removal efficiencies were calculated from initial and final TSS concentrations at different
time intervals and column depths. Moreover, average settling velocities were estimated
considering the column depth and the time needed to reach a certain biomass recovery
efficiency.
2.5. Biochemical methane potential test
BMP tests were carried out between operational days 213 and 260 in order to compare the
biogas production potential of biomass harvested from both systems. BMP tests were
performed in serum bottles of 160 mL filled up to 100 mL of liquid volume with certain
amounts of inoculum and substrate, corresponding to 5 g VS substrate/L and a substrate to
inoculum ratio (S/I) of 0.5 g VS substrate/g VS inoculum (Passos et al., 2013). The substrates
used were primary sludge (PS) from the primary settler of the HRAP-PT and microalgal
biomass from both the HRAP-PT and HRAP-noPT. PS was purged daily from the primary
settler by means of a pump and microalgal biomass was harvested from the secondary settlers
following the HRAPs and thickened by gravity in laboratory Imhoff cones at 4°C for 24h
(Fig. 1). The microalgae thermal pretreatment was carried out at 75°C for 10h, according to
the methodology described by Solé-Bundó et al. (2018).

10
Microalgal biomass was tested untreated (Microalgae-PT and Microalgae-noPT from the
HRAP-PT and HRAP-noPT, respectively) and thermally pre-treated (TPT Microalgae-PT
and TPT Microalgae-noPT from the HRAP-PT and HRAP-noPT, respectively). Moreover,
in order to increase the C:N ratio, co-digestion (i.e. digestion of a mixture of different
substrates) of Microalgae-PT and TPT Microalgae-PT with PS at two different ratios (25%
Microalgae - 75% PS and 50% Microalgae - 50% PS on a VS basis) was also tested (Lu and
Zhang, 2016). These ratios represent the average volume of microalgae and primary sludge
obtained in warm and cold months in a pilot HRAP system (Solé-Bundó et al., 2015). Each
trial was performed in triplicate.
After being flushed with helium gas and closed with butyl rubber stoppers, the bottles were
placed in a platform shaker incubator (OPAQ, Ovan, Spain) at 35°C and 100 rpm until daily
methane production was less than 1% of the total accumulated methane yield in all bottles.
Pressure in each bottle was periodically measured with a digital manometer (GMH 3151
Greisinger, Germany) and biogas production was calculated by subtracting the blank (only
inoculum) production. The methane content in biogas was analysed by gas chromatography
(Trace GC Thermo Finnigan, USA), following the procedure described by Solé-Bundó et al.
(2018). The anaerobic biodegradability of each substrate was calculated based on the net
methane production (mL CH4) and the theoretical methane yield under standard conditions,
which is estimated as 350 mL CH4 for each gram of degraded COD (Chernicharo, 2007).
Microalgal biomass macromolecular composition was expressed in terms of proteins,
carbohydrates and lipids over the VS content. Carbohydrates were measured by phenol-
sulphuric acid method with acid hydrolysis and determined by spectrophotometry
(Spectronic Genesys 8), proteins were measured from the Total Kjeldahl Nitrogen (TKN)

11
(APHA-AWWA-WEF, 2012) and a TKN/protein conversion factor of 5.95 (González López
et al., 2010) and lipids were measured with the Soxhlet extraction method, using a mixture
of chloroform and methanol at the ratio of 2:1 (v/v) as extractant agents (Folch et al., 1957).
2.6. Statistical analyses
Experimental data obtained from the systems HRAP-PT and HRAP-noPT regarding
wastewater treatment efficiency, as well as biomass productivity and settleability, were
analysed by paired two-sample t-test (α = 0.05) using Minitab 18 (Minitab Inc., PA, USA).
For the evaluation of kinetic parameters of the BMP tests, experimental data were adjusted
to a first-order kinetic model by the least square method (Schroyen et al., 2014), using the
tool Solver from Microsoft Excel 2016 (Eq. 8).
𝑃 = 𝑃𝑜 ∙ [1 − exp(−𝑘 ∙ 𝑡)] Eq. 8
where 𝑃𝑜 stands for the methane production potential (mL CH4/g VS), 𝑘 is the first order
kinetic rate constant (day-1), 𝑃 is the accumulated methane production at time 𝑡 (mL CH4/g
VS) and 𝑡 is time (day).
The error variance (𝑠2) of modelled methane production from Eq. 8 based on the actual
methane production was estimated by the following equation (Eq. 9):
𝑠2 = ∑ (𝑦𝑖 − �̂�𝑖)
𝑖1
𝑁 − 𝐾 Eq. 9
where 𝑦𝑖 is the experimental value, �̂�𝑖 is the value estimated by the model, 𝑁 is the number
of samples and 𝐾 is the number of model parameters.

12
The results were statistically assessed via multi-factor analysis of variance (ANOVA) (α =
0.05). The Fisher's Least Significant Difference (LSD) (α = 0.05) was used as a post-hoc test
using Minitab 18 (Minitab Inc., PA, USA).
3. Results and discussion
3.1. Wastewater treatment efficiency
The average values of the main parameters measured in HRAP-PT and HRAP-noPT over a
period of 260 days are shown in Table 1 (mixed liquor) and Table 2 (influent and effluent).
The temporal variations of water quality parameters monitored in both systems are shown in
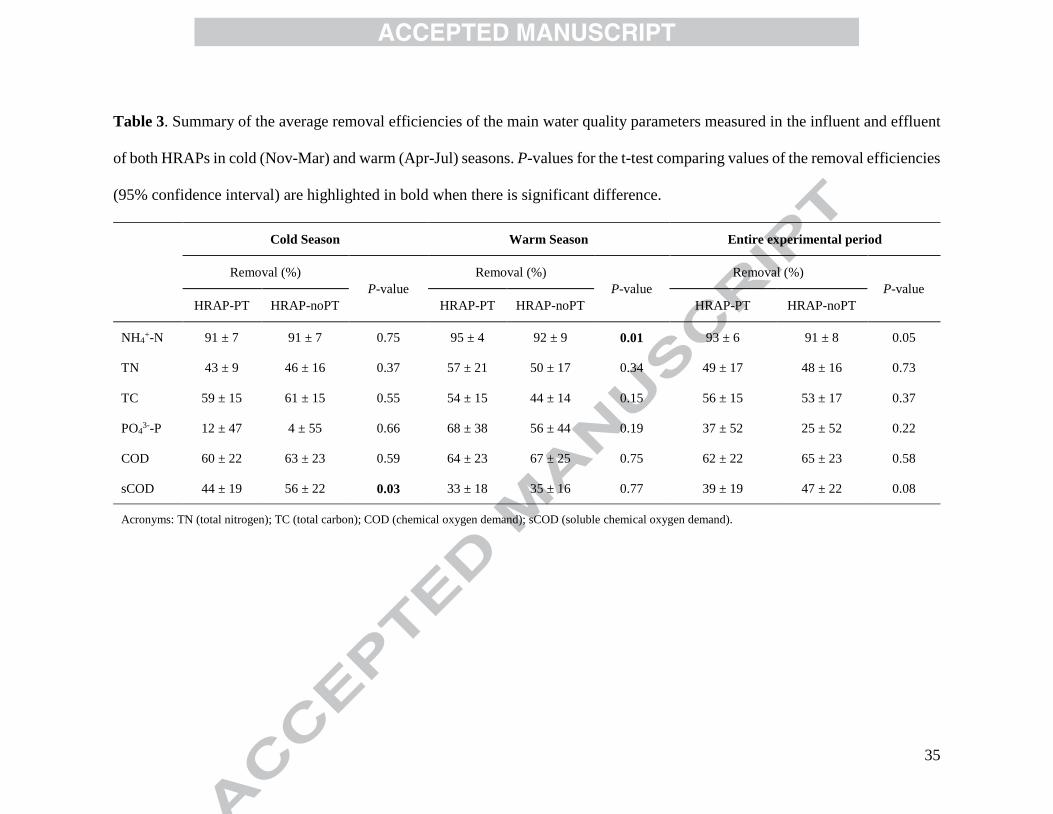
Figure 2. Moreover, a summary of the average removal efficiencies of the main water quality
parameters is shown in Table 3. Additional data on average concentrations and removal
efficiencies are presented in Supplementary materials.
The results obtained from the HRAPs indicated that there was no significant difference in
terms of wastewater treatment efficiency between the two configurations considered.
Please insert Table 1
Average TSS and VSS concentration in the mixed liquor of HRAP-noPT were 41% and 31%
significantly higher than in the HRAP-PT, respectively (Table 1). As expected, the difference
between the two systems relied more on the higher inert solids concentration discharged into
the HRAP-noPT than in microorganisms’ biomass (VSS). The average DO concentration in
the HRAP-PT was 16% higher compared to the HRAP-noPT (Table 1), which is explained
by its lower TSS concentration in the mixed liquor, enhancing light penetration through the
13
pond and leading to a higher photosynthetic activity rate. However, the higher average
chlorophyll-a concentration in HRAP-noPT indicates that in spite of the higher solids
concentrations, microalgae growth was not hindered in this system.
Please insert Table 2
Regarding the wastewater quality parameters, there were no significant differences when
comparing NH4+-N, TN, TC and COD removal efficiencies throughout the entire
experimental period between the HRAP-PT and HRAP-noPT (Table 3). Considering the
seasonal influence, there were no significant differences in removal efficiencies between the
HRAP-PT and HRAP-noPT, except for NH4+-N and sCOD removal (Table 3). The NH4
+-N
removal efficiency was slightly higher in the HRAP-PT during the warm season. This was
probably because the proportion of microalgae (as mg chlorophyll-a/g VSS) increased by
61% from cold to warm season in the HRAP-PT, while in the HRAP-noPT the increase was
only 6%. The higher microalgae proportion in the HRAP-PT during the warm season could
have enhanced the NH4+-N removal in this system. Similarly, the higher sCOD removal in
the HRAP-noPT during the cold season (Table 3) could be related to the higher biomass
concentration in this system (Table A.1).
Please insert Table 3
Despite the very high removal efficiencies of NH4+-N (around 90%) in both systems, the TN
removal efficiencies were lower (around 45%) (Table 3). This was due to the fact that the

14
influent nitrogen (mainly NH4+) was converted into NO3
- (mostly) and NO2- (i.e.
nitrification), as observed in previous studies (de Godos et al., 2016; Van Den Hende et al.,
2016). Moreover, during the warm season photosynthetic activity is enhanced, increasing pH
and favouring NH4+ volatilisation (de Godos et al., 2016; García et al., 2006). This explains
the lower NO3- effluent concentrations during the warm season compared to the cold season,
since a lower amount of NH4+ was available to be converted into NO3
- (Figure 2). Average
concentrations of NO2- in both ponds were very low (up to 2.5 mg/L). Thus, considering also
that average NO3- concentrations in the influent and effluent of both HRAPs were similar
(Figure 2), as well as NH4+ removal, it can be deduced that the nitrogen conversion pathway
was similar in both systems through the experimental period. In general, NH4+ is the
preferential form of nitrogen uptake for most microalgae species, followed by NO3-
(Maestrini, 1982; Oliver and Ganf, 2002; Ruiz-Marin et al., 2010), which is in accordance
with the results obtained in this study.
Please insert Figure 2
On the whole, both systems presented high nutrients and organic matter removal efficiencies
in spite of the seasonal changes and different operational conditions (i.e. absence of primary
treatment). Average COD removal efficiencies ranged between 60 and 67% in both systems
through the entire experimental period (Table 3). These removal efficiencies were in
accordance with previous studies under similar operational conditions (Young et al., 2017;
Sutherland et al., 2014). Another study which evaluated the growth of Chlorella sp. in raw
and primary treated wastewater from a conventional municipal wastewater plant (i.e.

15
activated sludge system), also reported similar organic matter and nutrients removal
efficiencies (Wang et al., 2010). Average NH4+-N removal efficiencies were 82.4 and 74.7%,
while for COD the removal rates were 50.9 and 56.5% for algae cultivation in wastewater
sampled before and after primary treatment, respectively (Wang et al., 2010). Although these
results were obtained from batch cultures, the removal efficiencies were similar to the ones
found in this work.
The results of this work are in accordance with previous studies in which microalgae were
cultivated at lab-scale using wastewater from different stages of municipal wastewater
treatment plants, obtaining efficient treatment (Cabanelas et al., 2013; Kong et al., 2009).
Furthermore, the present study corroborates with the hypothesis proposed by Posadas et al.
(2017) who suggested that, based on a theoretical study, primary suspended solids removal
is unlikely needed when using the HRAPs technology for treating urban wastewater.
Finally, based on the results presented in this section, the primary treatment preceding a
HRAP seems to be a dispensable step when urban wastewater treatment is the main objective.
Moreover, the simplification of a HRAP system by removing the primary treatment step
would also incentivise its implementation in small communities, since the wastewater
treatment plant footprint and cost could be reduced.
3.2. Biomass composition and productivity
Considering the entire experimental period, the HRAP-noPT had a higher biodiversity of
microorganisms compared to the HRAP-PT. During the cold season, the microalgal biomass
in the HRAP-PT was mainly composed of Chlorella sp., while in the HRAP-noPT the
predominant microalgae genus was Stigeoclonium sp., which formed macroscopic

16
filamentous flocs. However, during the warm season Chlorella sp. became the predominant
genus in the HRAP-noPT system as well. Diatoms (mostly Nitzschia sp. and Navicula sp.)
and grazers (ciliate and flagellate protozoans) were observed in both ponds along the entire
period, but in larger quantity in the HRAP-noPT than in the HRAP-PT (Supplementary
materials). The average size for the flocs observed in the HRAP-PT was 50-500 μm, while
for the HRAP-noPT it ranged from 100 to 2,000 μm. The biomass diversity is a relevant
parameter to be monitored, since it influences downstream processes, such as biogas and
bioproducts generation. The presence of grazers, for instance, might affect the productivity
of high-value compounds extracted from the biomass.
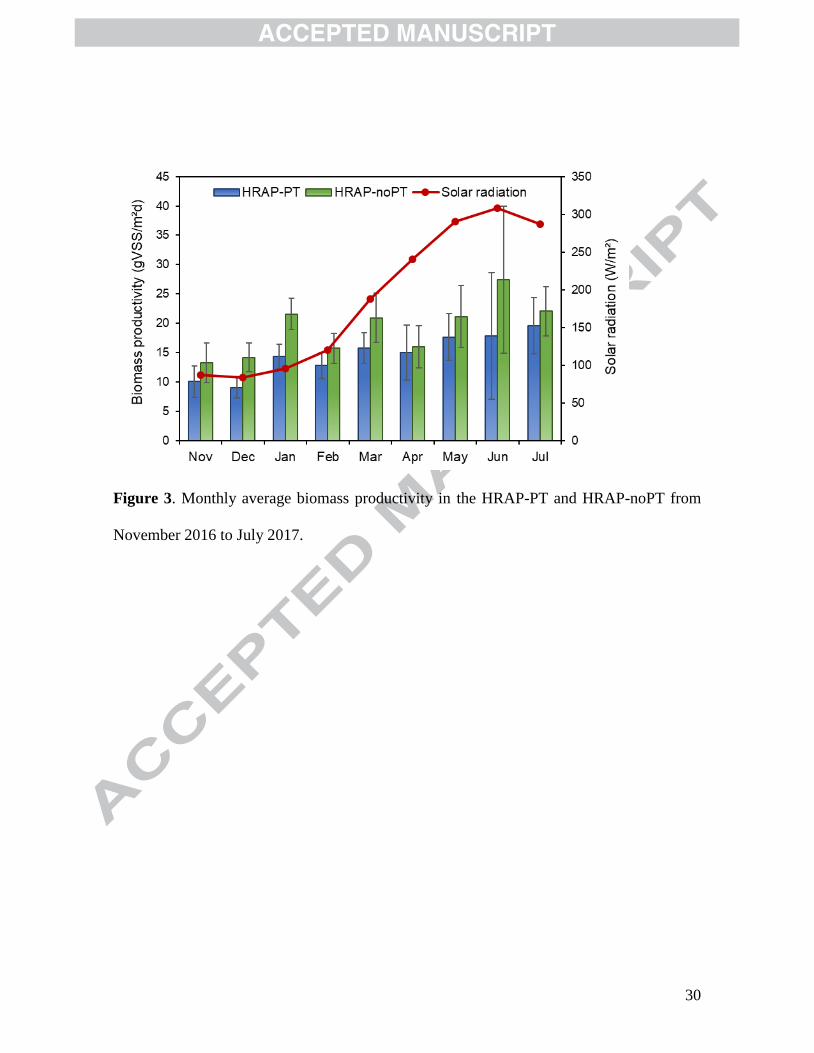
Microalgal biomass productivity of both HRAPs is shown in Fig. 3. The overall average
biomass productivity in the HRAP-noPT was 20 ± 7 g VSS/m2d, which was significantly
higher (by 30%) than in the HRAP-PT (15 ± 6 g VSS/m2d). Park and Craggs (2010) operated
a HRAP with a HRT of 4 days and reported an average biomass productivity of 20.7 g
VSS/m2d, which was slightly higher than in the present study most probably because there
was CO2 addition to control the pH and prevent carbon limitation. Similar results were
described by de Godos et al. (2016), with an average biomass productivity ranging from 13.2
g VSS/m2d (HRT of 5 days in spring) to 23.9 g VSS/m2d (HRT of 3 days in summer) in
HRAPs operated without CO2 injection.
The higher biomass productivity observed in the HRAP-noPT might be explained by the
higher influent VSS concentration (Table 1). Indeed, the VSS concentration in the influent
was 49% higher in the HRAP-noPT than in the HRAP-PT (Table 1). Moreover, the VSS and
chlorophyll-a concentrations in the mixed liquor were around 31% and 50% higher in HRAP-
noPT than in the HRAP-PT, respectively (Table 1). With this in mind, it can be assumed that

17
part of the VSS introduced in the HRAP-noPT was consumed by the microalgal-bacterial
biomass. In other words, the VSS in the influent (i.e. organic matter from the wastewater)
was converted into microalgal-bacterial biomass in the HRAP-noPT system, where the
microalgal proportion may have increased better than in the HRAP-PT system. As mentioned
before, the difference in TSS influent concentration (Table 1) and, consequently, on the light
availability between the two systems, did not seem to have created photo-inhibition. Indeed,
previous studies, which investigated the composition of the phytoplankton community in
three HRAPs submitted to different solar radiation levels, also reported that light availability
was not the main influence on the growth and development of microalgal biomass. Other
aspects, such as competition with other microorganisms for space and nutrients, and
predation by zooplankton seemed to have a higher effect on microalgae biomass composition
and productivity (Assemany et al., 2015).
With regards to seasonal influence, there was a slight increase in biomass productivity in
warmer months (Figure 3). It is worth noting that during those months, the abundance of
grazers in both ponds also increased. The presence of these predators indicated that the actual
biomass productivity might have been higher that the calculated values, which were based
on the VSS concentrations measured in the mixed liquor of both ponds. This could possibly
explain the high variation seen in June, in which the ranges of biomass productivity measured
in both ponds were the largest of the entire period (HRAP-PT: 5 - 33 gVSS/m2d and HRAP-
noPT: 14 - 46 gVSS/m2d). Biomass losses caused by these organisms have also been reported
in previous studies (Mehrabadi et al., 2016; Montemezzani et al., 2016; Park et al., 2013).
Finally, although the HRAP-noPT received higher organic loading, the production of
microalgal biomass was not jeopardised. In addition, the higher biomass productivity would

18
most likely lead to higher biogas production per day or other bioproducts obtained from this
biomass.
Please insert Figure 3
3.3. Biomass settling capacity
The biomass sedimentation through gravity settling was assessed by monthly settling column
tests. The assessment of the settling capacity helps to define further harvesting and
dewatering techniques to be applied at large scale, which usually represents high energy
consumption on the overall process (Fasaei et al., 2018). In this study, the initial biomass
concentration in the mixed liquor varied from 0.26 – 0.39 g VSS/L for the HRAP-PT and
0.23 – 0.72 g VSS/L for the HRAP-noPT. As mentioned above, biomass recovery efficiencies
were calculated from the initial and final TSS concentrations at different time intervals and
column depths.
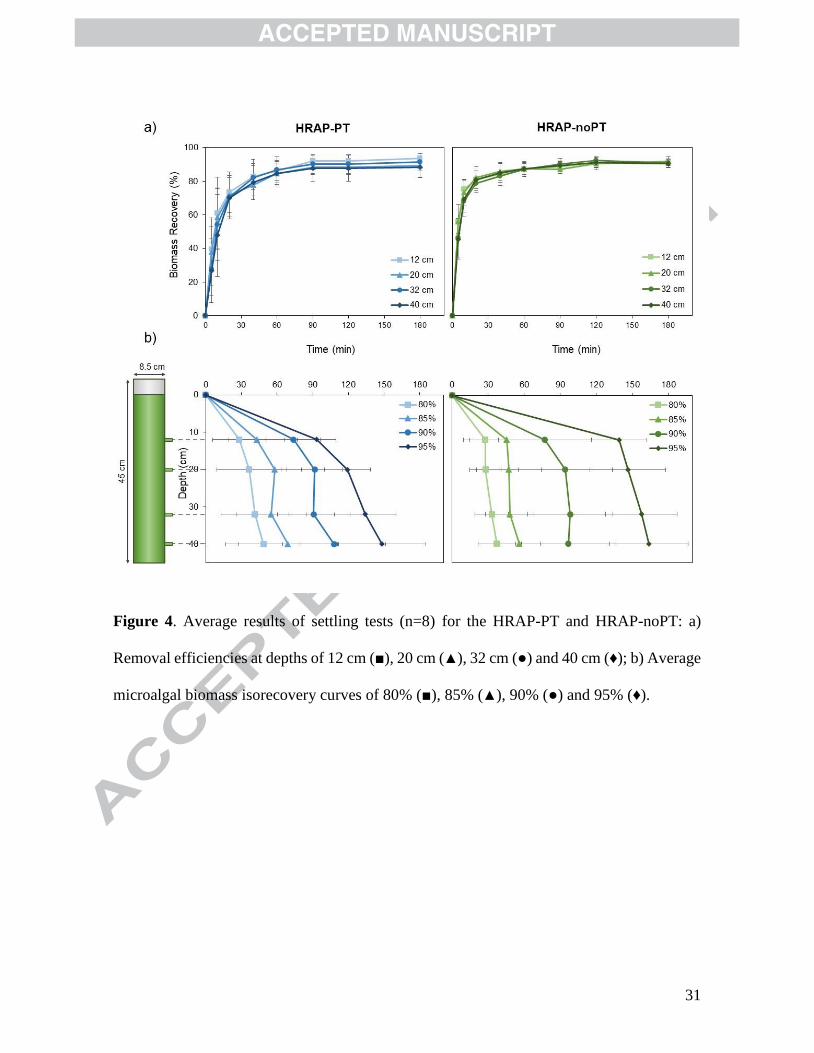
The settling tests results indicated that the biomass from both systems had good settling
capacity. Figure 4a shows the biomass recovery over time with curves representing the four
different sampling depths (12, 20, 32 and 40 cm). Based on these data, the time required to
obtain certain biomass recovery efficiencies (80, 85, 90 and 95%) was calculated (Fig. 4b).
Considering average values of all settling tests, the biomass from the HRAP-noPT was faster
to reach recovery efficiencies of 80, 85 and 90%, and the HRAP-PT was faster only for 95%
recovery. This is in accordance with microbiology observations, that recorded higher
biodiversity of microorganisms for the HRAP-noPT than the HRAP-PT during the entire
period. Moreover, filamentous microalgae present in the HRAP-noPT during the cold season,
19
which are organisms linked to flocs aggregation, also influenced the higher settling capacity
of this biomass.
Please insert Figure 4
Biomass recovery efficiencies were lower than those found in a previous study with similar
biomass composition, with about 85% recovery in less than 40 min (Gutiérrez et al., 2015).
However, it is important to mention that the initial biomass concentration in that study was
higher (800 mg VSS/L) than in the present one (300 - 400 mg VSS/L). In that study, the
average time needed to recover 90% of biomass was 58 min, with a final effluent
concentration of 80 mg VS/L. In the present study, the average times needed to reach 90%
of biomass recovery was 129 min (HRAP-PT) and 114 min (HRAP-noPT), but the final
effluent concentrations were much lower: 30 and 40 mg VSS/L. This highlights the
importance of considering the final effluent quality when comparing results of relative
removal efficiencies from different studies.
The relation between the sampling depth and settling time recorded for biomass from the
HRAP-PT and HRAP-noPT is illustrated by isorecovery curves (Fig. 4b). Each curve shows
the time required to obtain a certain biomass recovery at different depths. Thus, the settling
velocities were calculated by dividing the column depth (di) by time (ti).
For instance, the average settling velocities for 80% recovery were 0.47 and 0.51 m/h, and
for 95% recovery they were 0.13 and 0.09 m/h for the HRAP-PT and HRAP-noPT,
respectively. For 80% recovery, the HRAP-noPT had a slightly higher velocity, which is
explained by the larger flocs, but for 95% HRAP-PT had a higher velocity, indicating the
higher amount of colloidal particles in the HRAP-noPT resulting from the influent

20
characteristics. The settling velocities were similar to the ones reported by Moorthy et al.
(2017), which ranged from 0.03 to 0.08 m/h for Scenedesmus abundans, and by Peperzak et
al. (2003), which fluctuated from 0.02 to 0.09 m/h for a mixture of microalgae.
Overall, the biomass from both systems presented good settling capacity with no significant
differences between them. Thus, the absence of primary treatment did not affect the biomass
settling capacity.
3.4. Biochemical methane potential test
The BMP test was performed in order to complement the comparison between the HRAP-
PT and HRAP-noPT, in terms of potential bioenergy recovery from biomass harvested in
each system. Biochemical analysis indicated that microalgal biomass was mainly composed
of proteins (41 - 49%), followed by carbohydrates (27 - 33%) and lipids (20 - 25%) (Table
4), in accordance with previous studies (Dong et al., 2016; Solé-Bundó et al., 2017a).
Please insert Table 4
The methane yield of each trial over an incubation period of 48 days is illustrated in Fig. 5.
The methane content in biogas was similar in all cases (around 72%).
The lowest methane yield was obtained in the mono-digestion of Microalgae-noPT, with a
final yield of 188.7 mL CH4/g VS; and the highest methane yield was from the co-digestion
of 25% Microalgae-PT + 75% PS, reaching a final yield of 258.3 mL CH4/g VS. This was
25% higher compared to the mono-digestion of the Microalgae-PT. During the initial stage
of the incubation (especially the first 6 days) the kinetics and productions were better for TPT

21
Microalgae-PT, TPT Microalgae-noPT and Microalgae-noPT (Fig. 5a). However, after the
9th day the behaviour changed and the Microalgae-PT production slightly increased
compared to Microalgae-noPT (both untreated and TPT). This performance could be
explained by the fact that Microalgae-noPT contained more readily biodegradable material
(which was transformed into biogas) than the Microalgae-PT, as expected, since the former
was harvested from the system without primary treatment.
Please insert Figure 5
The final methane yield of pre-treated microalgae from the HRAP-PT, primary sludge and
its co-digestion with untreated or pre-treated microalgae grown in the HRAP-PT were not
statistically different from each other (Table 5). In addition, no significant differences were
found in the final methane yield from untreated and pre-treated microalgae grown in both
HRAP-noPT and HRAP-PT (Table 5). Nevertheless, the methane yield of untreated and pre-
treated microalgae grown in HRAP-noPT were significantly lower than those obtained with
the co-digestion of primary sludge and microalgae harvested in the HRAP-PT (Table 5).
Please insert Table 5
The thermal pretreatment was applied in this study in order to increase microalgae
biodegradability by breaking down their resistant cell wall, as suggested by previous studies
(Solé-Bundó et al., 2018). Several studies on microalgae pretreatment for biogas production
have been reported, including biological, chemical and physical pretreatments (Kendir and

22
Ugurlu, 2018). The selection of a thermal pretreatment for this study was based on previous
research comparing different pretreatments, which showed that the thermal one would reach
the highest methane yield and considerably better energy balance (Kendir and Ugurlu, 2018;
Passos et al., 2015). Comparing the mono-digestions, the thermal pretreatment improved the
methane yield by 3% (HRAP-noPT) and 9% (HRAP-PT). Although no statistical difference
(P-values: 0.80 for HRAP-noPT and 0.37 for HRAP-PT) was found between the methane
yield of untreated and thermally pre-treated microalgae from both systems (Table 5), the
thermal pretreatment did improve the kinetics in all cases (by 14-22%) as compared to
untreated microalgae, which is in agreement with Solé-Bundó et al. (2017c).
In contrast, the co-digestion of microalgae and sludge showed a more significant
improvement, increasing the methane yield up to 25% and the kinetics up to 39% compared
to microalgae mono-digestion. Moreover, the kinetics of co-digestion with thermally pre-
treated microalgae at both ratios (25-75% and 50-50%) were even higher than primary sludge
(Table 5). This highlights the synergy of co-digesting microalgae with primary sludge, as
also described in previous studies on co-digestion of microalgae and other C-rich substrates
(Solé-Bundó et al., 2017b; Yen and Brune, 2007). The results are also in agreement with
previous studies in which the co-digestion of microalgae and sewage sludge had a synergistic
effect (Olsson et al., 2014; Solé-Bundó et al., 2018).
4. Conclusions
The removal of the primary treatment preceding a HRAP, which would simplify its
maintenance, reduce costs and the footprint, did not significantly affect the wastewater
treatment efficiency. Thus, it seems to be a dispensable step when urban wastewater

23
treatment is the main objective. Although the HRAP without primary treatment received
higher organic loading due to the absence of primary treatment, the production of microalgal
biomass was not jeopardised. Bioenergy recovery through biogas production would be a good
alternative for biomass valorisation. In particular, the co-digestion with primary sludge could
improve the methane yield and kinetics of microalgae mono-digestion.
Acknowledgements
This research was funded by the Spanish Ministry of Economy and Competitiveness
(FOTOBIOGAS Project CTQ2014-57293-C3-3-R) and the European Union's Horizon 2020
research and innovation programme under the Marie Skłodowska-Curie grant agreement No
676070 (SuPER-W). This communication reflects only the author's view and the Research
Executive Agency of the EU is not responsible for any use that may be made of the
information it contains. Marianna Garfí is grateful to the Spanish Ministry of Economy and
Competitiveness (Plan Estatal de Investigación Científica y Técnica y de Innovación 2013–
2016, Subprograma Ramón y Cajal (RYC) 2016, RYC-2016-20059). The authors
acknowledge Jose Luis Pellín Moreno, Manuel Ángel Arenas Vallejo, Valentin Lebot and
Pol Puigseslloses i Sánchez for their contribution to this work.
Appendix A. Supplementary data
E-supplementary data of this work can be found in online version of the paper.
References
Acién, F.G., Gómez-Serrano, C., Morales-Amaral, M.M., Fernández-Sevilla, J.M., Molina-

24
Grima, E., 2016. Wastewater treatment using microalgae: how realistic a contribution
might it be to significant urban wastewater treatment? Appl. Microbiol. Biotechnol.
100, 9013–9022. doi:10.1007/s00253-016-7835-7
Amini, H., Hashemisohi, A., Wang, L., Shahbazi, A., Bikdash, M., KC, D., Yuan, W.,
2016. Numerical and experimental investigation of hydrodynamics and light transfer
in open raceway ponds at various algal cell concentrations and medium depths. Chem.
Eng. Sci. 156, 11–23. doi:http://dx.doi.org/10.1016/j.ces.2016.09.003
APHA-AWWA-WEF, 2012. Standard methods for the examination of water and
wastewater, 22nd ed. Published jointly by the American Water Works Association, the
American Public Health Association, and the Water Environment Federation.,
Washington, D.C.
Arashiro, L.T., Montero, N., Ferrer, I., Acién, F.G., Gómez, C., Garfí, M., 2018. Life cycle
assessment of high rate algal ponds for wastewater treatment and resource recovery.
Sci. Total Environ. 622–623. doi:10.1016/j.scitotenv.2017.12.051
Assemany, P.P., Calijuri, M.L., Couto, E. de A. do, de Souza, M.H.B., Silva, N.C.,
Santiago, A. da F., Castro, J. de S., 2015. Algae/bacteria consortium in high rate
ponds: Influence of solar radiation on the phytoplankton community. Ecol. Eng. 77,
154–162. doi:http://dx.doi.org/10.1016/j.ecoleng.2015.01.026
Buchanan, N.A., Young, P., Cromar, N.J., Fallowfield, H.J., 2018. Performance of a high
rate algal pond treating septic tank effluent from a community wastewater
management scheme in rural South Australia. Algal Res. 35, 325–332.
doi:10.1016/j.algal.2018.08.036
Cabanelas, I.T.D., Ruiz, J., Arbib, Z., Chinalia, F.A., Garrido-Pérez, C., Rogalla, F.,
Nascimento, I.A., Perales, J.A., 2013. Comparing the use of different domestic
wastewaters for coupling microalgal production and nutrient removal. Bioresour.
Technol. 131, 429–436. doi:https://doi.org/10.1016/j.biortech.2012.12.152
Chernicharo, C.A. de L., 2007. Anaerobic Reactors, Biological Wastewater Treatment
series (Volume 4). IWA Publishing.
Craggs, R., Park, J., Heubeck, S., Sutherland, D., 2014. High rate algal pond systems for
low-energy wastewater treatment, nutrient recovery and energy production. New Zeal.
J. Bot. 52, 60–73. doi:10.1080/0028825X.2013.861855
Craggs, R.J., Heubeck, S., Lundquist, T.J., Benemann, J.R., 2011. Algal biofuels from
wastewater treatment high rate algal ponds. Water Sci. Technol. 63, 660–665.
doi:10.2166/wst.2011.100
DAM, 2017. Department of Astronomy and Meteorology - Universitat de Barcelona
[WWW Document]. URL http://www.am.ub.edu/en (accessed 10.15.17).
de Godos, I., Arbib, Z., Lara, E., Rogalla, F., 2016. Evaluation of High Rate Algae Ponds
for treatment of anaerobically digested wastewater: Effect of CO2 addition and
modification of dilution rate. Bioresour. Technol. 220, 253–261.
doi:10.1016/j.biortech.2016.08.056
de Godos, I., Blanco, S., García-Encina, P.A., Becares, E., Muñoz, R., 2010. Influence of
flue gas sparging on the performance of high rate algae ponds treating agro-industrial
wastewaters. J. Hazard. Mater. 179, 1049–1054. doi:10.1016/j.jhazmat.2010.03.112
Delrue, F., Álvarez-Díaz, P.D., Fon-Sing, S., Fleury, G., Sassi, J.F., 2016. The
environmental biorefinery: Using microalgae to remediate wastewater, a win-win

25
paradigm. Energies 9, 1–19. doi:10.3390/en9030132
Dong, T., Van Wychen, S., Nagle, N., Pienkos, P.T., Laurens, L.M.L., 2016. Impact of
biochemical composition on susceptibility of algal biomass to acid-catalyzed
pretreatment for sugar and lipid recovery. Algal Res. 18, 69–77.
doi:10.1016/j.algal.2016.06.004
Fasaei, F., Bitter, J.H., Slegers, P.M., van Boxtel, A.J.B., 2018. Techno-economic
evaluation of microalgae harvesting and dewatering systems. Algal Res. 31, 347–362.
doi:10.1016/j.algal.2017.11.038
Fisher, D.K., Pringle III, H.C., 2013. Evaluation of alternative methods for estimating
reference evapotranspiration. Agric. Sci. 04, 51–60. doi:10.4236/as.2013.48A008
Folch, J., Lees, M., Stanley, G.H.S., 1957. A simple method for the isolation and
purification of total lipides from animal tissues 497–509.
García, J., Green, B.F., Lundquist, T., Mujeriego, R., Hernández-Mariné, M., Oswald, W.J.,
2006. Long term diurnal variations in contaminant removal in high rate ponds treating
urban wastewater. Bioresour. Technol. 97, 1709–1715.
doi:10.1016/j.biortech.2005.07.019
Garfí, M., Flores, L., Ferrer, I., 2017. Life Cycle Assessment of wastewater treatment
systems for small communities: Activated sludge, constructed wetlands and high rate
algal ponds. J. Clean. Prod. 161, 211–219.
doi:https://doi.org/10.1016/j.jclepro.2017.05.116
González-Fernández, C., Sialve, B., Bernet, N., Steyer, J.-P., 2012. Impact of microalgae
characteristics on their conversion to biofuel. Part II: Focus on biomethane production.
Biofuels, Bioprod. Biorefining 6, 205–218. doi:10.1002/bbb.337
González López, C.V., García, M. del C.C., Fernández, F.G.A., Bustos, C.S., Chisti, Y.,
Sevilla, J.M.F., 2010. Protein measurements of microalgal and cyanobacterial
biomass. Bioresour. Technol. 101, 7587–7591.
doi:http://doi.org/10.1016/j.biortech.2010.04.077
Gutiérrez, R., Ferrer, I., González-Molina, A., Salvadó, H., García, J., Uggetti, E., 2016.
Microalgae recycling improves biomass recovery from wastewater treatment high rate
algal ponds. Water Res. 106, 539–549.
doi:http://dx.doi.org/10.1016/j.watres.2016.10.039
Gutiérrez, R., Passos, F., Ferrer, I., Uggetti, E., García, J., 2015. Harvesting microalgae
from wastewater treatment systems with natural flocculants: Effect on biomass settling
and biogas production. Algal Res. 9, 204–211. doi:10.1016/j.algal.2015.03.010
Ibekwe, A.M., Murinda, S.E., Murry, M.A., Schwartz, G., Lundquist, T., 2017. Microbial
community structures in high rate algae ponds for bioconversion of agricultural wastes
from livestock industry for feed production. Sci. Total Environ. 580, 1185–1196.
doi:10.1016/j.scitotenv.2016.12.076
Kendir, E., Ugurlu, A., 2018. A comprehensive review on pretreatment of microalgae for
biogas production. Int. J. Energy Res. 42, 3711–3731. doi:10.1002/er.4100
Kong, Q., Li, L., Martinez, B., Chen, P., Ruan, R., 2009. Culture of Microalgae
Chlamydomonas reinhardtii in Wastewater for Biomass Feedstock Production. Appl.
Biochem. Biotechnol. 160, 9. doi:10.1007/s12010-009-8670-4
Lu, D., Zhang, X.J., 2016. Biogas Production from Anaerobic Codigestion of Microalgae
and Septic Sludge. J. Environ. Eng. 142, 04016049. doi:10.1061/(ASCE)EE.1943-

26
7870.0001126
Maestrini, S.Y., 1982. Simultaneous uptake of ammonium and nitrate by oyster-pond algae.
Mar. Biol. Lett. 3, 143–153.
Mehrabadi, A., Farid, M.M., Craggs, R., 2016. Variation of biomass energy yield in
wastewater treatment high rate algal ponds. Algal Res. 15, 143–151.
doi:http://dx.doi.org/10.1016/j.algal.2016.02.016
Metcalf & Eddy, 2003. Wastewater engineering : treatment and reuse, 4th ed. McGraw-
Hill, Boston.
Montemezzani, V., Duggan, I.C., Hogg, I.D., Craggs, R.J., 2016. Zooplankton community
influence on seasonal performance and microalgal dominance in wastewater treatment
High Rate Algal Ponds. Algal Res. 17, 168–184.
doi:http://dx.doi.org/10.1016/j.algal.2016.04.014
Moorthy, R.K., Premalatha, M., Arumugam, M., 2017. Batch Sedimentation Studies for
Freshwater Green Alga Scenedesmus abundans Using Combination of Flocculants.
Front. Chem. 5, 1–13. doi:10.3389/fchem.2017.00037
Oliver, R.L., Ganf, G.G., 2002. Freshwater Blooms BT - The Ecology of Cyanobacteria:
Their Diversity in Time and Space, in: Whitton, B.A., Potts, M. (Eds.), . Springer
Netherlands, Dordrecht, pp. 149–194. doi:10.1007/0-306-46855-7_6
Olsson, J., Feng, X.M., Ascue, J., Gentili, F.G., Shabiimam, M.A., Nehrenheim, E., Thorin,
E., 2014. Co-digestion of cultivated microalgae and sewage sludge from municipal
waste water treatment. Bioresour. Technol. 171, 203–210.
doi:10.1016/j.biortech.2014.08.069
Palmer, C.M., 1962. Algas en abastecimientos de agua: manual ilustrado acerca de la
identificación, importancia y control de las algas en los abastecimientos de agua.
Interamericana.
Park, J.B.K., Craggs, R.J., 2011. Algal production in wastewater treatment high rate algal
ponds for potential biofuel use. Water Sci. Technol. 63, 2403–2410.
doi:10.2166/wst.2011.200
Park, J.B.K., Craggs, R.J., 2010. Wastewater treatment and algal production in high rate
algal ponds with carbon dioxide addition. Water Sci. Technol. 61, 633–639.
doi:10.2166/wst.2010.951
Park, J.B.K., Craggs, R.J., Shilton, A.N., 2013. Enhancing biomass energy yield from pilot-
scale high rate algal ponds with recycling. Water Res. 47, 4422–4432.
doi:10.1016/j.watres.2013.04.001
Park, J.B.K., Craggs, R.J., Shilton, A.N., 2011. Wastewater treatment high rate algal ponds
for biofuel production. Bioresour. Technol. 102, 35–42. doi:10.2166/wst.2011.200
Passos, F., Carretero, J., Ferrer, I., 2015. Comparing pretreatment methods for improving
microalgae anaerobic digestion: Thermal, hydrothermal, microwave and ultrasound.
Chem. Eng. J. 279, 667–672. doi:10.1016/j.cej.2015.05.065
Passos, F., García, J., Ferrer, I., 2013. Impact of low temperature pretreatment on the
anaerobic digestion of microalgal biomass. Bioresour. Technol. 138, 79–86.
doi:10.1016/j.biortech.2013.03.114
Peperzak, L., Colijn, F., Koeman, R., Gieskes, W.W.C., Joordens, J.C.A., 2003.
Phytoplankton sinking rates in the rhine region of freshwater influence. J. Plankton
Res. 25, 365–383. doi:10.1093/plankt/25.4.365

27
Posadas, E., Muñoz, R., Guieysse, B., 2017. Integrating nutrient removal and solid
management restricts the feasibility of algal biofuel generation via wastewater
treatment. Algal Res. 22, 39–46. doi:https://doi.org/10.1016/j.algal.2016.11.019
Raheem, A., Prinsen, P., Vuppaladadiyam, A.K., Zhao, M., Luque, R., 2018. A review on
sustainable microalgae based biofuel and bioenergy production: Recent developments.
J. Clean. Prod. 181, 42–59. doi:10.1016/j.jclepro.2018.01.125
Ruiz-Marin, A., Mendoza-Espinosa, L.G., Stephenson, T., 2010. Growth and nutrient
removal in free and immobilized green algae in batch and semi-continuous cultures
treating real wastewater. Bioresour. Technol. 101, 58–64.
doi:10.1016/j.biortech.2009.02.076
Schroyen, M., Vervaeren, H., Van Hulle, S.W.H., Raes, K., 2014. Impact of enzymatic
pretreatment on corn stover degradation and biogas production. Bioresour. Technol.
173, 59–66. doi:10.1016/j.biortech.2014.09.030
Solé-Bundó, M., Carrère, H., Garfí, M., Ferrer, I., 2017a. Enhancement of microalgae
anaerobic digestion by thermo-alkaline pretreatment with lime (CaO). Algal Res. 24,
199–206. doi:http://dx.doi.org/10.1016/j.algal.2017.03.025
Solé-Bundó, M., Eskicioglu, C., Garfí, M., Carrère, H., Ferrer, I., 2017b. Anaerobic co-
digestion of microalgal biomass and wheat straw with and without thermo-alkaline
pretreatment. Bioresour. Technol. 237, 89–98.
doi:http://dx.doi.org/10.1016/j.biortech.2017.03.151
Solé-Bundó, M., Passos, F., Garfí, M., Ferrer, I., 2015. Biogas potential from algal-based
wastewater treatment systems: co-digestion of by-products, thermal pretreatment,
energy balance and digestate characteristics., in: Proceedings of the 14th World
Congress on Anaerobic Digestion, AD2015. Viña del Mar, Chile.
Solé-Bundó, M., Salvadó, H., Passos, F., Garfí, M., Ferrer, I., 2018. Strategies to Optimize
Microalgae Conversion to Biogas: Co-Digestion, Pretreatment and Hydraulic
Retention Time. Molecules 23, 2096. doi:10.3390/molecules23092096
Solórzano, L., 1969. Determination of ammonia in natural seawater by the phenol-
hypochlorite method. Limnol. Oceanogr. 14, 799–801. doi:10.4319/lo.1969.14.5.0799
Šoštarič, M., Klinar, D., Bricelj, M., Golob, J., Berovič, M., Likozar, B., 2012. Growth,
lipid extraction and thermal degradation of the microalga Chlorella vulgaris. N.
Biotechnol. 29, 325–331. doi:10.1016/j.nbt.2011.12.002
Streble, H., Krauter, D., 1987. Atlas de los microorganismos de agua dulce, La vida en una
gota de agua. Omega, Barcelona.
Sutherland, D.L., Turnbull, M.H., Craggs, R.J., 2014. Increased pond depth improves algal
productivity and nutrient removal in wastewater treatment high rate algal ponds. Water
Res. 53, 271–281. doi:http://dx.doi.org/10.1016/j.watres.2014.01.025
Uggetti, E., Passos, F., Solé, M., Garfí, M., Ferrer, I., 2017. Recent Achievements in the
Production of Biogas from Microalgae. Waste and Biomass Valorization 8, 129–139.
doi:10.1007/s12649-016-9604-3
Van Den Hende, S., Beelen, V., Julien, L., Lefoulon, A., Vanhoucke, T., Coolsaet, C.,
Sonnenholzner, S., Vervaeren, H., Rousseau, D.P.L., 2016. Technical potential of
microalgal bacterial floc raceway ponds treating food-industry effluents while
producing microalgal bacterial biomass: An outdoor pilot-scale study. Bioresour.
Technol. 218, 969–979. doi:http://dx.doi.org/10.1016/j.biortech.2016.07.065

28
Wang, L., Min, M., Li, Y., Chen, P., Chen, Y., Liu, Y., Wang, Y., Ruan, R., 2010.
Cultivation of Green Algae Chlorella sp. in Different Wastewaters from Municipal
Wastewater Treatment Plant. Appl. Biochem. Biotechnol. 162, 1174–1186.
doi:10.1007/s12010-009-8866-7
Yen, H.W., Brune, D.E., 2007. Anaerobic co-digestion of algal sludge and waste paper to
produce methane. Bioresour. Technol. 98, 130–134.
doi:10.1016/j.biortech.2005.11.010
Young, P., Taylor, M., Fallowfield, H.J., 2017. Mini-review: high rate algal ponds, flexible
systems for sustainable wastewater treatment. World J. Microbiol. Biotechnol. 33,
117. doi:10.1007/s11274-017-2282-x
Figure 1. Scheme of the microalgae-based wastewater treatment pilot plant located outdoors
in Barcelona (Spain). HRAP-PT is the line with primary treatment (PT) and HRAP-noPT is
the line without PT.

29
Figure 2. Influent (●) and effluent (■) concentrations of total suspended solids (TSS), NH4+-
N, NO2--N, NO3
--N, total nitrogen (TN), PO43--P, total carbon (TC) and chemical oxygen
demand (COD) measured in the HRAP-PT and HRAP-noPT during the experimental period.
30
Figure 3. Monthly average biomass productivity in the HRAP-PT and HRAP-noPT from
November 2016 to July 2017.
31
Figure 4. Average results of settling tests (n=8) for the HRAP-PT and HRAP-noPT: a)
Removal efficiencies at depths of 12 cm (■), 20 cm (▲), 32 cm (●) and 40 cm (♦); b) Average
microalgal biomass isorecovery curves of 80% (■), 85% (▲), 90% (●) and 95% (♦).

32
Figure 5. Cumulative methane yields showing the effects of: a) thermal pretreatment (TPT),
with the comparative results for microalgal biomass from the HRAP-PT and HRAP-noPT:
untreated (Microalgae-PT and Microalgae-noPT) and thermally pre-treated (TPT
Microalgae-PT and TPT Microalgae-noPT); and b) co-digestion (CD), with the comparative
results for Primary Sludge (PS) and co-digestion of Microalgae-PT and TPT Microalgae-PT
with PS at two different ratios (25% microalgae + 75% PS and 50% microalgae + 50% PS
on a VS basis).

33
Table 1. Summary of the average values of the main parameters monitored in the mixed
liquor of both HRAPs through the entire experimental period (260 days). P-values for the t-
test comparing values of the mixed liquor (95% confidence interval) are highlighted in bold
when there is significant difference.
HRAP-PT HRAP-noPT P-value
TSS (mg/L) 261 ± 106 370 ± 131 9.7E-15
VSS (mg/L) 230 ± 91 301 ± 112 1.7E-10
pH 8.2 ± 0.5 7.9 ± 0.3 2.1E-13
Turbidity (NTU) 136 ± 73 160 ± 74 4.7E-04
TN (mg/L) 47 ± 13 52 ± 15 1.5E-02
TC (mg/L) 226 ± 154 240 ± 144 2.1E-02
DO (mg/L) 8.7 ± 2.2 7.6 ± 2.2 7.8E-20
Chlorophyll-a (mg/L) 1.1 ± 0.8 1.7 ± 0.8 1.8E-06
Acronyms: TSS (total suspended solids); VSS (volatile suspended solids); TN (total
nitrogen); TC (total carbon); DO (dissolved oxygen).

34
Table 2. Summary of the average values of the main parameters monitored in the influent
and effluent of both HRAPs through the entire experimental period (260 days).
HRAP-PT HRAP-noPT
Influent Effluent Influent Effluent
TSS (mg/L) 201 ± 132 52 ± 37 333 ± 183 75 ± 46
VSS (mg/L) 185 ± 112 49 ± 32 280 ± 143 67 ± 38
pH 7.8 ± 0.3 8.0 ± 0.4 8.0 ± 0.2 7.7 ± 0.2
Turbidity (NTU) 135 ± 115 25 ± 22 170 ± 104 41 ± 37
TN (mg/L) 53 ± 27 28 ± 10 56 ± 28 33 ± 12
TC (mg/L) 244 ± 157 107 ± 69 258 ± 149 126 ± 88
NH4+-N (mg/L) 24 ± 11 1.5 ± 1.3 26 ± 11 2.2 ± 2.1
NO3- -N (mg/L) 0.2 ± 0.4 17 ± 10 0.6 ± 1.7 16 ± 9
NO2- -N (mg/L) 0.9 ± 1.7 1.6 ± 1.2 1.2 ± 2.3 2.3 ± 1.7
PO43--P (mg/L) 2.3 ± 1.8 1.5 ± 1.3 2.3 ± 1.5 1.7 ± 1.4
COD (mg/L) 353 ± 208 114 ± 65 464 ± 234 134 ± 64
sCOD (mg/L) 88 ± 48 58 ± 31 97 ± 47 61 ± 38
Acronyms: TSS (total suspended solids); VSS (volatile suspended solids); TN (total nitrogen); TC (total
carbon); COD (chemical oxygen demand); sCOD (soluble chemical oxygen demand).
35
Table 3. Summary of the average removal efficiencies of the main water quality parameters measured in the influent and effluent
of both HRAPs in cold (Nov-Mar) and warm (Apr-Jul) seasons. P-values for the t-test comparing values of the removal efficiencies
(95% confidence interval) are highlighted in bold when there is significant difference.
Cold Season Warm Season Entire experimental period
Removal (%)
P-value
Removal (%)
P-value
Removal (%)
P-value
HRAP-PT HRAP-noPT HRAP-PT HRAP-noPT HRAP-PT HRAP-noPT
NH4+-N 91 ± 7 91 ± 7 0.75 95 ± 4 92 ± 9 0.01 93 ± 6 91 ± 8 0.05
TN 43 ± 9 46 ± 16 0.37 57 ± 21 50 ± 17 0.34 49 ± 17 48 ± 16 0.73
TC 59 ± 15 61 ± 15 0.55 54 ± 15 44 ± 14 0.15 56 ± 15 53 ± 17 0.37
PO43--P 12 ± 47 4 ± 55 0.66 68 ± 38 56 ± 44 0.19 37 ± 52 25 ± 52 0.22
COD 60 ± 22 63 ± 23 0.59 64 ± 23 67 ± 25 0.75 62 ± 22 65 ± 23 0.58
sCOD 44 ± 19 56 ± 22 0.03 33 ± 18 35 ± 16 0.77 39 ± 19 47 ± 22 0.08
Acronyms: TN (total nitrogen); TC (total carbon); COD (chemical oxygen demand); sCOD (soluble chemical oxygen demand).

36
Table 4. Average biochemical composition of the inoculum and substrates used for the BMP
test. Microalgae-PT and Microalgae-noPT refer to microalgal biomass harvested from the
HRAP-PT and HRAP-noPT, respectively; untreated or thermally pre-treated (TPT).
Parameter Inoculum Primary
Sludge
Microalgae-PT Microalgae-noPT
Untreated TPT Untreated TPT
pH 7.35 6.37 6.46 6.74 6.33 6.48
TS [%(w/w)] 2.12 ± 0.01 3.13 ± 0.04 6.09 ± 0.01 6.03 ± 0.01 5.87 ± 0.02 5.80 ± 0.01
VS [%(w/w)] 1.31 ± 0.13 2.32 ± 0.40 4.65 ± 0.23 4.62 ± 0.28 3.96 ± 0.62 4.02 ± 0.11
COD (g O2/L) 16.90 ± 0.50 15.43 ± 0.29 79.87 ± 0.88 79.70 ± 0.25 59.43 ± 1.07 59.87 ± 1.38
Carbohydrates (%VS) - - 29.7 26.9 29.0 32.5
Proteins (%VS) - - 48.8 47.4 43.6 41.2
Lipids (%VS) - - 20.6 25.0 22.0 19.8
Acronyms: TS (total solids); VS (volatile solids); COD (chemical oxygen demand).

37
Table 5. Summary of the methane yield (initial after 6 days and final after 48 days of
digestion), anaerobic biodegradability (mean values ± standard deviation; n=3) and first-
order kinetics constant (𝑘) obtained from Eq. 8 (error variance (𝑠2) from Eq. 9 is represented
in brackets).
Substrate Initial methane yield
(mL CH4/g VS d)
Final methane yield
(mL CH4/g VS)
Anaerobic
Biodegradability
(%)
First-order kinetics
constant (day-1)
Untreated TPT Untreated TPT Untreated TPT Untreated TPT
Primary sludge 163.1a ± 1.1 255.5a ± 2.4 37.7 ± 2.4 0.202 (135)
Microalgae-noPT 113.1a ± 0.4 119.8a ± 0.6 188.7b ± 0.7 193.9b ± 1.4 25.3 ± 0.7 25.8 ± 1.4 0.179 (78) 0.205 (150)
Microalgae-PT 106.3a ± 0.2 128.5a ± 0.2 206.8b ± 0.7 225.4a,b ± 0.7 25.3 ± 0.7 26.5 ± 0.7 0.135 (63) 0.165 (326)
CD 25% Microalgae-PT
+ 75% PS 159.5a ± 1.7 163.1a ± 0.3 258.3a ± 3.9 250.3a ± 0.4 35.1 ± 3.9 34.5 ± 0.4 0.184 (201) 0.214 (208)
CD 50% Microalgae-PT
+ 50% PS 148.8a ± 1.1 164.0a ± 0.5 237.6a,b ± 1.7 251.9a ± 0.5 31.1 ± 1.7 32.2 ± 0.5 0.187 (146) 0.213 (216)
a,b : Letters indicate a significant difference of methane yield between trials (α = 0.05) after Fisher's LSD test.
Highlights
Two HRAP systems (with and without primary treatment) were compared
Wastewater treatment efficiency was not affected by removing the primary treatment
Biomass productivity and composition from both systems were significantly different
Biomass settling capacity was similar in both systems
Co-digestion of microalgae and primary sludge led to higher methane yields