guidelines - college of engineering · water conservation, which in most cases, is a win-win...
TRANSCRIPT

1
Guidelines # 09--2012
Reducing Outdoor Water Use with a
Lawn Sprinkler Irrigation Assessment Adapted from a Report Prepared by Joshua J. Melliger
Partners in Pollution Prevention Intern 2006
Background/Rationale: The purpose of performing a turfgrass lawn sprinkler irrigation assessment
is to identify opportunities to save water and money by being more efficient with watering practices.
This guide provides background information and a step-by-step procedure to assist student interns and
corporate environmental staff in performing an assessment in a non-residential setting to find ways to
conserve water and reduce costs associated with outdoor irrigation systems. The procedure in this guide
focuses primarily on water conservation through optimizing an existing outdoor sprinkler system and
contains fewer steps than other available irrigation assessment methods in order to decrease the required
time and past experience necessary to perform the assessment. If desired, professionals may be hired to
perform a more complex irrigation audit. The assessments described by this procedure will generally
take one person 2-3 days to complete. Past assessments performed by the University of Nebraska—
Lincoln have identified potential irrigation water reductions ranging from 50 to 73% for each system
evaluated.
Water is a valuable resource that is often taken for granted, especially in locations where groundwater is
readily available and water rates are relatively inexpensive. For example, Nebraska is positioned above
the High Plains Aquifer, and most of the state has almost unlimited access to its ground water.
Unfortunately, at the current time the amount of water being taken out of the aquifer exceeds the amount
of water being replenished. Clearly, from a progressive environmental point of view, local availability
is not an acceptable excuse for wasting and overusing water. The best and most sustainable solution is
water conservation, which in most cases, is a win-win solution. Not only is less water removed from
aquifers and streams, but less energy is required to pump and distribute the water. Energy often is
generated from burning coal, and decreasing energy use reduces environmental damage and promotes
sustainability. Using less water lowers the peak water demand for communities and hence lowers the
strain on drinking water and wastewater treatment infrastructure. This becomes even more critical
during drought conditions.
Water waste often occurs from residential and commercial irrigation systems. The message for
effective watering to irrigate at night and early morning to reduce evaporative losses is fairly well
known and followed. Because most irrigation systems run at night and early morning, operators often
do not notice problems with their systems. For example, when brown or dead spots appear, it is
assumed that the entire lawn is not getting enough water, and systems are often changed to run longer
instead of fixing deficient sprinkler heads which may be the actual source of the dead spots. Many large
impacts can be made from assessing the lawn and landscape irrigation system.
The goal of performing an irrigation water assessment is not necessarily to tell clients to water their
grass less, but to water smarter. Improving the sprinkler system and adjusting the watering program can
enhance the appearance and the physical condition of the turf and landscaped areas while using less
water. Fixing broken and misaligned sprinkler heads will increase the amount of water being applied to

2
grass and lower the amount applied to unneeded areas, such as pavement. Also, studies have shown that
watering less frequently will increase the plant root depth and will result in a more drought resistant
plant. As a result, the plant becomes healthier overall while less water is used and more money is saved.
There are also several intangible benefits associated with watering smarter. It is not uncommon for
customers and other citizens upon observing water waste to file complaints regarding wasting water with
the wasting business itself, the water utility, or even their elected officials. Often, people are angry and
highly emotional with a business’ watering practices. A water assessment exposes the water wasting
deficiencies within the sprinkler system and can prevent complaints, resulting in a better company
image. Other benefits include more employee involvement and potential awards from the community.
Relaying the message that the business cares about water conservation and asking employees to be
conscious of water waste may give the employees a sense of pride in their workplace and the
environment. Also, being willing to change current irrigation practices may open doors to
environmental awards given for installing water conservation techniques.
Step 1: Assess the Current Situation/Define the Scope of the Situation 1.1: Calculate Water Used for Irrigation
Obtain Usage Information
The first step in performing the assessment is to obtain the client’s water usage information and
determine how much water is being used for turf and landscape irrigation each watering season. It is
important to ask the client if their water processes or irrigation system has significantly changed in the
last one or two years. For example, a company may expand their facility and install a new process water
cooling system, or a business may install a new lawn sprinkler system. In cases such as these, accurate
irrigation water use may be difficult to calculate from recent usage data and may have to be estimated
from years before the change or by quantifying the additional water used in the new industrial processes
or expansion activities. If water usage cannot be estimated, the assessment can still be performed
starting with 1.4.
Water usage information is most easily determined from water meter readings. Typically, meter
readings can be obtained from past water bills. Readings may also be available directly from the water
utility if bills cannot be located. Ideally, meter readings from at least the previous two watering seasons
should be obtained for analysis. It is important to recognize the units of volume each meter is actually
measuring. For example, water meters in Lincoln, NE quantify the number of “units” each customer
uses. One unit is equivalent to 100 ft3 which is about 748 gallons. Other locales may bill water based
on other usage units. Using correct units in calculations is essential to a proper assessment. Relevant
unit conversions may be found in Appendix A.
Calculate Water Use
To calculate water used for irrigation, it is necessary to determine whether the sprinkler system has its
own meter (called a deduct meter) or if it is combined with other process water in its measurement at the
meter. Deduct meters typically measure only the water that flows into the sprinkler system. In general,
outdoor sprinkler water is not discharged into the sanitary sewer, and it is the sanitary sewer volume that
is generally used for the billing basis. If there is not a deduct meter, a sewer base for all water meters
needs to be determined. The sewer base is the volume of water that drains into the sanitary sewer and
must be treated. Industrial water lost as steam and water used for summertime air conditioning,
gardening, lawn watering and other outdoor uses does not generally contribute to the sewer base. One

3
way to determine the sewer base is to make a graph of the total usage for each billing period vs. the date
so that a visual representation is presented. If more than one meter is used by the facility, total usage per
billing period will be the sum of the meter readings for that particular billing period. The graph should
exemplify peaks during summer months. An estimate of the sewer base can be determined by drawing a
horizontal line across the average usages of the winter months. An example of such a graph is below in
Figure 1.
Figure 1. Total water usage vs. time when there is not a deduct meter.
In Figure 1, the sewer base appears to be about 300,000 gallons, and the peak water use occurs in
August and is about 1.85 million gallons.
The irrigation water use for each billing period can be calculated by subtracting the volume of water
representing the sewer base from the total usage of that period. The sum of the irrigation water use for
each billing period is the volume of water applied over the watering season. It is important to ask staff
members if there is any other additional water use during the watering season (i.e. car washing, flushing,
etc.). If there is, it will be necessary to estimate this amount and subtract it to obtain the actual volume
of water applied to the turf and landscaped areas over the watering season.
If the facility has a deduct meter and data from this meter is being used, the sewer base is zero. As a
result, the volume of water applied over the watering season is just the sum of the water use for each
billing cycle. Figure 2 below displays such a case.
0
200,000
400,000
600,000
800,000
1,000,000
1,200,000
1,400,000
1,600,000
1,800,000
2,000,000
1/14/2004 4/23/2004 8/1/2004 11/9/2004 2/17/2005 5/28/2005 9/5/2005 12/14/2005 3/24/2006 7/2/2006
Date
To
tal
Usag
e (
gall
on
s /
bi-
mo
nth
peri
od
)
Sewer Base
Irrigation
Volumes
4
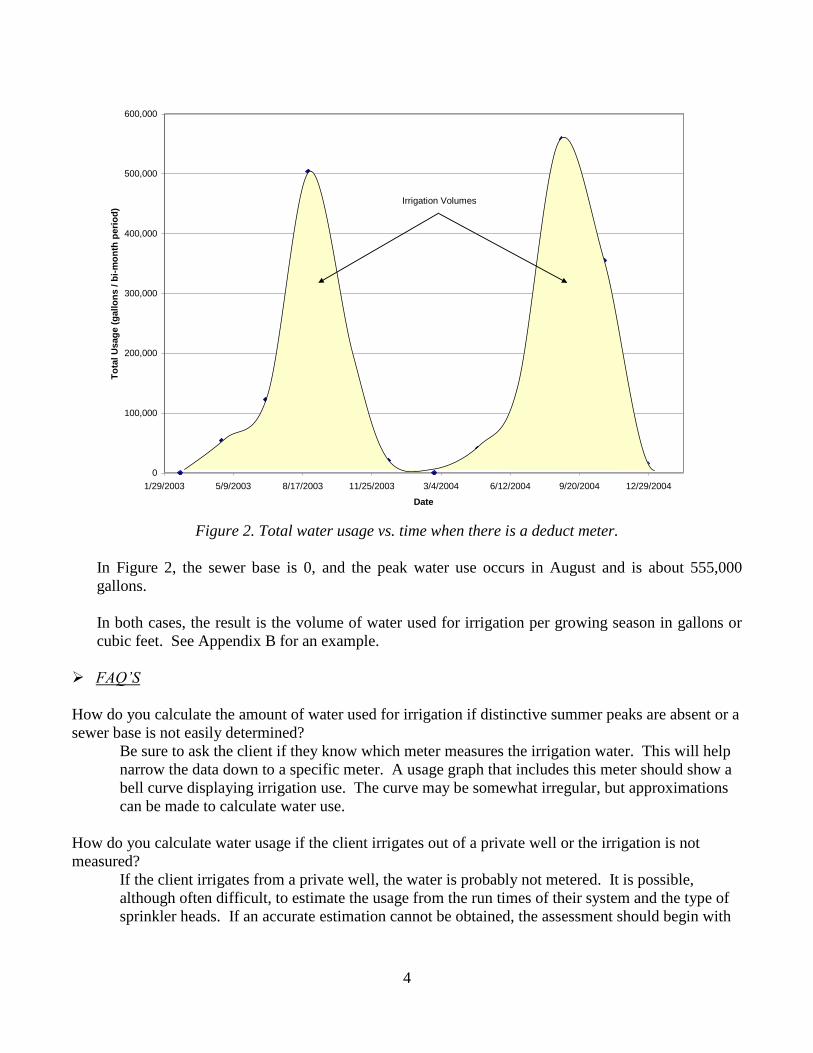
Figure 2. Total water usage vs. time when there is a deduct meter.
In Figure 2, the sewer base is 0, and the peak water use occurs in August and is about 555,000
gallons.
In both cases, the result is the volume of water used for irrigation per growing season in gallons or
cubic feet. See Appendix B for an example.
FAQ’S
How do you calculate the amount of water used for irrigation if distinctive summer peaks are absent or a
sewer base is not easily determined?
Be sure to ask the client if they know which meter measures the irrigation water. This will help
narrow the data down to a specific meter. A usage graph that includes this meter should show a
bell curve displaying irrigation use. The curve may be somewhat irregular, but approximations
can be made to calculate water use.
How do you calculate water usage if the client irrigates out of a private well or the irrigation is not
measured?
If the client irrigates from a private well, the water is probably not metered. It is possible,
although often difficult, to estimate the usage from the run times of their system and the type of
sprinkler heads. If an accurate estimation cannot be obtained, the assessment should begin with
0
100,000
200,000
300,000
400,000
500,000
600,000
1/29/2003 5/9/2003 8/17/2003 11/25/2003 3/4/2004 6/12/2004 9/20/2004 12/29/2004
Date
To
tal
Usag
e (
gall
on
s /
bi-
mo
nth
peri
od
)
Irrigation Volumes

5
1.4. It may also be recommended that the client install a meter for future assessment purposes.
Water meters may be available from the local utility or a private plumbing contractor.
What if water volumes are not given on the water bill?
The bill should reflect some sort of volume whether it is in gallons or some other unit. The local
water utility should be contacted with questions regarding interpretation of bills. In some cases,
the water volume can be calculated from the water billing rate, available from the water utility,
and the amount of the bill.
1.2: Obtain Surface Area Information
The next step in performing an irrigation water assessment is to determine the total surface area of the
facility being watered. The total area includes turf and landscaped zones that are watered by drip
irrigation, sprinklers, and manual irrigation. There are numerous methods available to determine the
surface area. The first source of information should be the client. They may know the exact surface
area. In this case, the area should be double checked by a second method. Possibly the most accurate
approach is to use a computer program such as MicroStation with aerial photography or ArcGIS. Figure
3 below displays an aerial photograph of a facility. Areas of irrigation are shaded and the area in square
feet can be determined automatically using ArcGIS.
Figure 3. Example ArcGIS photograph that can be used to calculate surface areas.
However, programs that calculate surface area may not be available due to the cost or other reasons. If
this is the case, surface areas can be calculated directly on site using measuring tapes and geometry.
Google Earth (http://earth.google.com) is a free satellite imagery program that may also be used to
measure distances. Once again, areas can then be calculated using geometry and the distances measured
using the computer program.
The result of 1.2 is the surface area being watered in square feet or acres. See Appendix B for an
example.

6
1.3: Calculate Water Applied in Inches and Determine Excess Water Applied Application in Inches
The amount of water applied to grass and landscaped areas is often referred to in units of height, usually
inches. Since the volume of water applied and the surface area has already been determined, the water
applied in inches per watering season can be determined using Equation 1 below and appropriate unit
conversions found in Appendix A. The average volume of irrigation water applied is determined from
averaging the amount of irrigation water applied over past watering seasons.
AreaSurface
WaterIrrigationofVolumeAverageAppliedWaterofHeight
_
_______ (1)
In most instances, more water is applied than necessary. Using this assumption, the amount of excess
water being applied can be determined.
Excess Water Applied
Determining the amount of excess water applied to turf and landscaped areas involves investigating how
much water plants use, how much water is lost due to evaporation into the atmosphere, and how much
rain the area receives. The amount of water lost by evaporation (from the ground and surface of the
plants) and the amount of water utilized (transpired) by the vegetation is referred to as the
evapotranspiration (ET) rate. ET rates vary based on the type of plants, location, precipitation,
humidity, temperature, wind, and other factors. Average ET rates (usually expressed in inches) for a
watering season can often be obtained by contacting the county extension office, local landscaping
companies, or a Certified Landscape Irrigation Auditor (CLIA). Contact information for CLIA’s can be
found at the following website: www.irrigation.org.
When it rains, some of the water, called effective rainfall, is utilized by plant roots and contributes to the
plant’s evapotranspiration. The rest of the water percolates beyond plant roots into the groundwater or
flows away as runoff and does not contribute to ET. The effective rainfall for a watering season varies
with location and plant type and may be obtained for the specific area and description of the facility
being assessed by contacting the county extension office, local landscaping companies or a CLIA. A
general rule of thumb is that the effective rainfall is in the range of 1/2 to 2/3 of the total rainfall during
the growing season.
Subtracting the effective rainfall from the ET rate yields the maximum height of water in inches per
watering season that may be applied to grass and landscaped areas from an external source to assure a
healthy landscape without wasting water. Once the desired application height has been determined, the
height of excess water applied can be found by subtracting the desired height from the height of water
that is currently being applied externally.
Example for Lincoln, Nebraska
For the watering of Kentucky bluegrass in Lincoln, NE, the ET rate is about 27 inches per
watering season, and the effective rainfall is about 10 inches per watering season. Both of these
values were obtained from Ken Merboth, CLIA for Water Scape. The desired amount of water
to be applied from an external source is the difference (17 inches). If it was determined that a
facility applies about 50 inches of water each watering season, subtracting the desired amount of

7
)(*))(.()(_)(__ 23 ftaSurfaceAreftRainEffETftAppliedWaterftWaterVolumeExcess
water to be applied results in the excess height of water applied of 33 inches (50 inches-
17inches).
The excess volume of water is often more meaningful than excess height of water and can be used to
show potential cost savings using local water costs. The cost of water can usually be found from the
local utility’s website or by simply contacting the utility in person. Calculating potential savings is
extremely important because although the business may want to conserve water, they will ALWAYS
want to save money. The excess volume of water is found using Equation 2 below and using unit
conversions from Appendix A. For simplicity, all units should be converted to feet, square feet, or cubic
feet.
(2)
The result of 1.3 is the excess volume of water applied in cubic feet. Converting cubic feet to gallons
often makes the result easier to visualize and communicate to a client. See Appendix B for an example.
FAQ’S
Do you adjust areas when the facility irrigates a mixture of both turf and landscaped areas?
Turf areas typically use more water than landscaped areas. Since the overall area of grass that is
watered at a facility usually far exceeds the area landscaped, no calculation adjustments are
required.
What if the applied amount of water is less than the desired application?
This means that the facility is probably conserving water and should be commended for it.
Recommending continued system maintenance and conservation is still good practice.
How accurate are the seasonal averages?
As the name suggests, the values are averages. Problems with averaging over an entire season
may include:
o Variance in soils will result in different ET and effective rainfall values.
o Extreme drought or heat may cause ET rates to increase.
o Effective rainfall may vary depending on length and frequency of rain storms.
o Steep slopes and compacted soil at the facility encourage runoff and decrease effective
rainfall.
Be sure to note in the report how the averages were obtained and give the reference.
How much impact does 10% error in calculating surface area or estimating seasonal averages of the
height of irrigation water that should be applied (ET -Effective Rainfall) have on the total excess amount
of water applied to the turf and landscaped areas?
Impact associated with error in surface area is directly proportional to the error in the total
amount of excess water applied. As a result a 10% error in calculating the surface area will
result in a 10% difference in the excess water applied.
However, error associated with estimating the height of water that should be applied each
watering season varies with the total height of water applied and the actual value of [ET –

8
Effective Rainfall]. The percent difference in excess volume of water applied increases as the
height of water applied approaches the desired height of water to be applied (ET – Effective
Rainfall). Figure 4 below demonstrates how a 10% error in estimating the desired height of
water to be applied affects the percent difference in the volume of excess water applied.
Height of Water Applied (in/ watering season)
10 20 30 40 50 60 70% C
hange
in E
xcess V
olu
me
of W
ate
r A
pplie
d w
ith a
10%
err
or
of (E
T-E
ff. R
ain
fall)
0
5
10
15
20
25
30
ET-Eff. Rain (inches)
25
201510
Most common in Great Plains
Figure 4. Percent difference vs. height of water applied for various values of [ET – Effective Rain].
Most situations on the Great Plains are anticipated to have lower [ET – Effective Rainfall]
values. Often, irrigators water excessively resulting in a large height of water applied. In such
situations, a 10% error in estimating [ET – Effective Rainfall] will result in less than a 10% error
in the excess water volume used. For these situations, accuracy in calculating surface area has a
greater impact than estimating ET and effective rainfall.
Is there any way to quantify environmental benefits related to water savings?
Yes. Reducing water use will also lead to reductions in various other environmental impacts,
especially those associated with the reduction in power consumption related to water pumping.
An estimate of the average environmental impacts in the United States of $2,000 of water use
was obtained using web-based life cycle assessment software (http://www.eiolca.net) developed
by Carnegie-Mellon University’s Green Design Institute. This software estimates the overall
environmental impacts from producing a certain dollar amount of any of 500 commodities or
services in the United States. It provides rough guidance on the relative impacts of different
types of products, materials, services, or industries with respect to resource use and emissions
throughout the United States.
A summary of the main benefits of reducing water consumption by $2,000 a year is provided
below in Table 1. To put these benefits in context, they are roughly equivalent in CO2 reductions
to reducing gasoline consumption by 700 gallons.
9
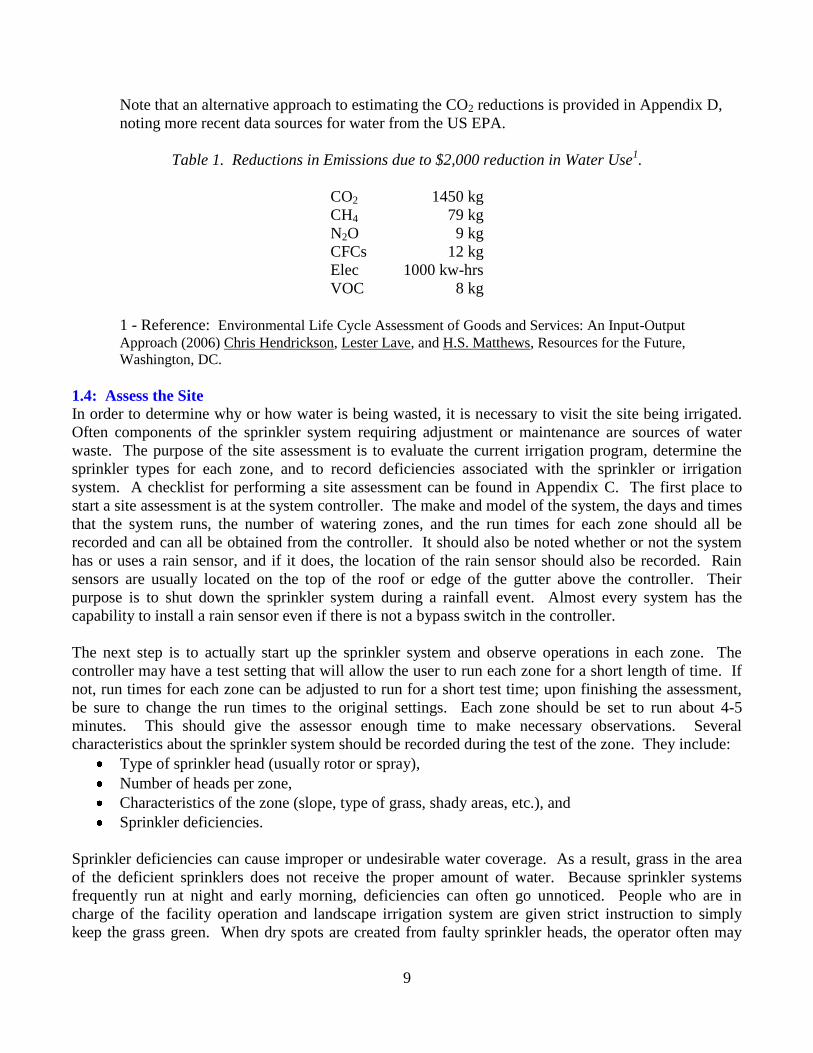
Note that an alternative approach to estimating the CO2 reductions is provided in Appendix D,
noting more recent data sources for water from the US EPA.
Table 1. Reductions in Emissions due to $2,000 reduction in Water Use1.
CO2 1450 kg
CH4 79 kg
N2O 9 kg
CFCs 12 kg
Elec 1000 kw-hrs
VOC 8 kg
1 - Reference: Environmental Life Cycle Assessment of Goods and Services: An Input-Output
Approach (2006) Chris Hendrickson, Lester Lave, and H.S. Matthews, Resources for the Future,
Washington, DC.
1.4: Assess the Site
In order to determine why or how water is being wasted, it is necessary to visit the site being irrigated.
Often components of the sprinkler system requiring adjustment or maintenance are sources of water
waste. The purpose of the site assessment is to evaluate the current irrigation program, determine the
sprinkler types for each zone, and to record deficiencies associated with the sprinkler or irrigation
system. A checklist for performing a site assessment can be found in Appendix C. The first place to
start a site assessment is at the system controller. The make and model of the system, the days and times
that the system runs, the number of watering zones, and the run times for each zone should all be
recorded and can all be obtained from the controller. It should also be noted whether or not the system
has or uses a rain sensor, and if it does, the location of the rain sensor should also be recorded. Rain
sensors are usually located on the top of the roof or edge of the gutter above the controller. Their
purpose is to shut down the sprinkler system during a rainfall event. Almost every system has the
capability to install a rain sensor even if there is not a bypass switch in the controller.
The next step is to actually start up the sprinkler system and observe operations in each zone. The
controller may have a test setting that will allow the user to run each zone for a short length of time. If
not, run times for each zone can be adjusted to run for a short test time; upon finishing the assessment,
be sure to change the run times to the original settings. Each zone should be set to run about 4-5
minutes. This should give the assessor enough time to make necessary observations. Several
characteristics about the sprinkler system should be recorded during the test of the zone. They include:
Type of sprinkler head (usually rotor or spray),
Number of heads per zone,
Characteristics of the zone (slope, type of grass, shady areas, etc.), and
Sprinkler deficiencies.
Sprinkler deficiencies can cause improper or undesirable water coverage. As a result, grass in the area
of the deficient sprinklers does not receive the proper amount of water. Because sprinkler systems
frequently run at night and early morning, deficiencies can often go unnoticed. People who are in
charge of the facility operation and landscape irrigation system are given strict instruction to simply
keep the grass green. When dry spots are created from faulty sprinkler heads, the operator often may

10
increase the time the system runs instead of checking for the defects that are causing the brown grass.
Taking digital pictures during the assessment to illustrate problems and including the pictures in the
report will give the client a better perspective of the problems in their system. Examples of sprinkler
deficiencies include:
Crooked heads spraying at undesired angle
Low heads that spray at or below grade level
Broken heads
No heads at all
Plugged heads (usually caused by sand, plastic, or other debris)
Heads not rotating properly
Heads that are not adjusted to water the desired area often resulting in watering concrete or
parked cars instead
Cars or equipment parked over heads, limiting coverage
Heads blocked by overgrown landscaping
Cut water delivery line
Leaky valves resulting in depressed grass areas
These are merely examples of defects that may appear in a sprinkler system. There may also be other
deficiencies that are observed during the course of the site assessment. Be sure to make notes of all
problems identified. Figures 5-7 below are digital photos that show some examples of these sprinkler
deficiencies.
Figure 5. Example of a buried sprinkler head.

11
Figure 6. Example of no sprinkler heads.
Figure 7. Example of a cut water line.
An important characteristic of sprinkler zones that may require consideration is the irrigation uniformity.
Uniformity means that every plant or soil surface receives the same amount of water. Irrigation
uniformity is achieved through proper spacing and placing of sprinkler heads. Not every system is
completely uniform, resulting in over-watering one area to assure another will not dry out. If the

12
majority of a lawn appears healthy, but a specific zone seems dry, that particular zone may need
calibration. Although time demanding, this procedure will help conserve water.
1.5: Conduct necessary research and calculations using the following useful material:
Rain Sensor Information
http://www.irritrol.com/controllers/rsseries.html
http://www.rainbird.com/landscape/products/controllers/rsd.htm
Software Information
http://earth.google.com/
www.esri.com/software/arcgis/index.html
http://www.eiolca.net
Water Conservation
http://www.lincoln.ne.gov/city/pworks/water/conserve/index.htm
http://www.saws.org/conservation/
Water Conservation Publications
http://www.hhs.state.ne.us/enh/pws/drought/WaterCountOnTheYard.pdf
http://www.ext.colostate.edu/pubs/Garden/07239.html
http://www.twdb.state.tx.us/assistance/conservation/ConservationPublications/OutdoorNew.pdf
Certified Landscape Irrigation Auditor
http://www.irrigation.org/
NebGuide #G93-1181-A “Evaluating Your Landscape Irrigation System” by Donald
Steinegger, Extension Horticultur, Roch Gaussoin, Extension Turfgrass Specialist, and Garald
Horst, Turfgrass Physiologist
Step 2: Identify Feasible P2 Opportunities 2.1: Develop Recommendations to Help Conserve Water & Save Money The last part of the irrigation water assessment is to develop recommendations to give the client in order
to improve their landscape, conserve water, and save money. The recommendations should be presented
in some sort of order. One possible order is by degree of urgency for implementation to achieve water
savings. None of the recommendations below suggest completely revamping the landscaping design.
Rather, the assessment suggests improvements to the existing situation. Examples of possible
recommendations are:
Set the irrigation program to water between 4 and 10 a.m. if possible in order to decrease losses
to evaporation during the heat of the day. If the system needs to run longer than 6 hours, setting
the program to water earlier in the morning is suggested.
Encourage the mowing staff and other employees working outdoors to be aware of the sprinkler
system and to report deficiencies. This will support the business’s desire to conserve water.

13
Assign responsibility for the sprinkler system to a single individual just as for building
maintenance or other functions. This will help conserve water by assuring people know who to
contact in the event of problems.
Check, adjust, and repair all sprinklers before running the system each season and at least once
during the watering season. Hiring a professional irrigation company to perform a start-up of
the irrigation system would be an excellent idea.
Install a rain sensor. There are both wireless and hard wired rain sensors commercially
available. The value of installing a rain sensor can be demonstrated by showing the potential
savings. Rain sensor savings can be calculated by multiplying the amount of water saved each
watering season (assume 4 sprinkler waterings * ½ inch per watering) by the surface area being
watered. This volume can be converted to dollars by applying local water rates. A payback
period can then be determined from the cost of the rain sensor and local water costs. The
payback period varies depending on the total surface area watered by the system. For example,
if a system waters one (1) acre, a rain sensor in Lincoln, NE will save about $86, and the simple
payback is about one watering season (rain sensors cost about $20-$100). See Appendix B for
an example.
Adjust the irrigation program for optimum water delivery. One way to change the program is to
set each zone to apply approximately ½ inch of water per cycle. It is important to realize that
desired application amounts may vary depending on characteristics of the zone such as shade,
type of grass, direction of slope, etc. Also, rotor sprinkler heads apply about 1/3 the amount of
water as spray heads in the same amount of time. Manufacturers’ ratings of how much water
sprinkler heads deliver per hour (precipitation rate) can be used to estimate run times. Often,
rotor heads apply ½” water in about 50 minutes, and spray heads apply ½” water in 20 minutes.
The number of days to run the system changes depending on the turf’s demand for water, which
varies depending on environmental conditions. Watering once or twice a week during mild
weather and three times a week during extreme heat conditions is a relevant recommendation.
Watering as infrequently as possible will encourage deeper roots and produce a healthier plant.
A sample program is shown below in Figure 8.

14
Name of Business
For each cycle to water approximately ½ inch
Situation 1: Regular Watering Situation 2: Extreme Heat Watering (Select Weeks in June, July, and August)
Program A Program B
Watering days: Wednesday, Sunday Watering days: Wed. Fri. Sun
Start Time: 1:00 AM Start Time: 1:00 AM
Station Length of Time
(min) Station Length of Time
(min)
1 20 1 20
2 20 2 20
3 20 3 20
4 20 4 20
5 50 5 50
6 50 6
50
7 20 7 20
8 50 8
50
9 50 9
50
Figure 8. Sample recommended irrigation program.
Install a deduct meter. Deduct meters typically measure only the water that flows into the
sprinkler system. For those who are enthusiastic about water conservation, a deduct meter will
allow the business to easily calculate the amount of water they are applying to their turf and
landscaped areas, and adjustments can be quickly made when water usage changes unexpectedly.
Other recommendations should be offered as deemed necessary. No two systems are alike therefore not
all recommendations will be the same.
FAQ’S
What if a zone has both rotor and spray heads?
Any properly designed system will not mix rotor and spray heads in the same zones, although
exceptions do occur. For example, a spray head may be installed in an area where an object
blocks the water stream of rotor heads. For a case like this, run times should be set
conservatively to run the time necessary for the rotor heads.

15
What if there is visible runoff from the sprinklers after a ½ inch watering cycle?
A “cycle and soak” approach may be used. This involves running sprinkler zones about 1/2 to
2/3 as long as initially programmed. This will allow the water to soak into the ground and
eliminate most of the runoff. After one complete cycle of all the zones is over and the water has
had the chance to soak into the ground, the system may be programmed to run again to water the
remaining 1/2 to 1/3 the desired run time. The cycle and soak technique is used most frequently
where runoff is common such as compacted soils, soils with low permeability, and zones with
slopes and berms.
Step 3: Make the Business Case for Change 3.1: Deliver the Report in Person Once the report is complete, the client should be contacted to set up a time to meet with whoever is in
charge of the sprinkler system. It is important to go through the assessment with the client so that he or
she understands the necessary steps to take to improve their system. Technical assistance should be
offered, especially when people responsible for the system have limited knowledge about sprinklers.
Understanding the problems of their current system, clients will be more likely to take action. Thirty
minutes of explanation will lead to a higher rate of implementation of the recommendations given.
Before finishing discussion with the client, give your contact information so that you may assist with
future questions. Also, be sure to give copies of your assessment to appropriate management.
3.2: Report potential Greenhouse Gas (GHG) emission reductions as an important indirect benefit:
include in written report and oral presentation
include explanation of why GHG emissions are relevant/of concern to all businesses
calculate potential carbon dioxide equivalent (CO2e) emission reductions for each
recommendation
include an appendix in written report documenting calculations (see Appendix D for details and
example calculations)
see Appendix E for additional tips for making the business case for change.

16
Appendix A
Relevant Unit Conversions
Length
1foot = 12 inches
1 yard = 3 feet
Area
1 acre = 43,560 sq. ft
Volume
1 cubic ft. = 7.4805 gallons
1 acre-foot = 43,560 cubic feet
1 acre-foot = 325,851.427 gallons
1 acre-inch = 3,630 cubic feet
1 acre-inch = 27,154.2856 gallons

17
Appendix B
Abbreviated Example Assessment
A business has asked a student to perform an assessment of their outdoor lawn sprinkler system. The
preliminary research has determined the following facts. The average ET rate for the grass in this area is
already known to be 27 inches per watering season and the effective rainfall is known to be 10 inches
per watering season. The non residential water rate is $1.38 per unit, where 1 unit is equivalent to 100
cubic feet. The water bills for the last 2 years show the following data for the facility. Use the step-by-
step process to determine the following:
a) Irrigation water applied each watering season.
b) The area of turf and landscape being irrigated.
c) The average height of irrigation water applied in inches, the average excess volume of water
applied in gallons per watering season, and the cost savings of the excess water applied.
d) The savings if a rain sensor is installed assuming it would prevent 4 watering
cycles and each cycle applies ½ inch of water.
Table B.1. Facility water usage taken from water bills.
Date
Total Usage (units)
5/24/2006 12
3/27/2006 12
1/26/2006 14
11/28/2005 298
9/26/2005 791
7/26/2005 817
5/26/2005 253
3/28/2005 9
1/25/2005 12
11/24/2004 240
9/24/2004 668
7/26/2004 812
5/25/2004 223
Solution
a) STEP 1 For this example the sewer base of about 12 units can be determined by observing the usage
information. However, displaying usage in graphical form is more appealing to the client, and it is
important to visualize the peaking effects in the summers. Figure B.1 below displays a graph of the
data.

18
Figure B.1. Total water usage over time.
The amount of water applied to the turf and landscaped areas is found by subtracting the sewer base
from the total usage. Table B.2 below can then be constructed using unit conversions (1 unit = 100
cubic feet = 748 gallons).
Table B.2. Water use calculations.
Date
Total Usage (units)
Total Usage
(gallons)
Estimated Irrigation
use (units)
Estimated Irrigation
use (ft
3)
Estimated Irrigation
use (gallons)
5/24/2006 12 8,977 0 0 0
3/27/2006 12 8,977 0 0 0
1/26/2006 14 20,945 2 200 1,496
11/28/2005 298 222,919 286 28,600 213,943
9/26/2005 791 591,709 779 77,900 582,732
7/26/2005 817 611,158 805 80,500 602,182
5/26/2005 253 189,257 241 24,100 180,281
3/28/2005 9 6,732 0 0 0
1/25/2005 12 8,977 0 0 0
11/24/2004 240 179,532 228 22,800 170,556
9/24/2004 668 499,699 656 65,600 490,722
7/26/2004 812 607,418 800 80,000 598,442
5/25/2004 223 166,816 211 21,100 157,839
0
100,000
200,000
300,000
400,000
500,000
600,000
700,000
1/14/2004 4/23/2004 8/1/2004 11/9/2004 2/17/2005 5/28/2005 9/5/2005 12/14/2005 3/24/2006 7/2/2006
Date
To
tal
Usag
e (
gall
on
s /
bi-
mo
nth
peri
od
)
Irrigation Volumes
Sewer Base

19
)(__)(*))(.()(_ 32 ftWaterVolumeExcessftaSurfaceAreftRainEffETftAppliedWater
The amount of water applied during the watering months (for this case about March to November) is the
sum of each of the two shaded areas.
Irrigation water applied each watering season is
211,100 ft3 in 2005 and 189,500 ft
3 in 2004.
b) STEP 2
Using the facility map given below, the area can be found using ArcGIS. The map was found by
locating the facility by its address. Polygons were created for all turf areas and the areas of those
polygons were then calculated. Table B.3 below shows the area calculated by the program.
Table B.3 Turf and landscape area.
Identification Area (ft
2)
Area (Acres)
17 3774 0.087
18 1502 0.034
19 286 0.007
20 325 0.007
21 402 0.009
22 289 0.007
23 915 0.021
24 2459 0.056
25 40722 0.935
Total 50,674 1.163
Land being watered (ft2) = 1.16 acres * 43,560 ft
2/acre = 50,674 ft
2
c) STEP 3
Using the average of 200,300 ft3 of irrigation water applied per watering season (from 2004 & 2005),
the average height of water applied in inches is determined using Equation 1.
AppliedWaterofHeightAreaSurface
WaterIrrigationofVolumeAverage___
_
____
ftft
ft95.3
674,50
300,2002
3
47.4 inches per watering season
The excess volume of water is found using Equation 2.
50 0 5025 Feet
.
25
17
24
18
23
21
22
1920
40
TH
ST
OLD CHENEY RD

20
32 512,128674,5012
110274.47 ftft
in
ftininin = 960,000 gallons per watering season
The cost of the water is $1.38 per unit. There are 1,285.1 excess units. The cost savings from
conserving this volume of water is then:
unitsunit
_1.281,138.1$
$1773 per watering season
d) Determining the Cost Savings from Installing a Rain Sensor.
Four ½ inch watering cycles per season are assumed to be prevented. This equates to 2 inches of water
being saved over the entire watering area. The volume of that water is equal to the area times the depth
of water:
Volume of water saved = inches
footinchesft
12
1_2674,50 3 8445.7 ft
3 = 84.46 units
Cost of saved water = unit
units38.1$
46.84 = $116.55
NOTE: Actual cost of water may vary depending on the total amount of water used in a month.
Water usages are often grouped into tiers, and each tier has a separate cost associated with it.
Water use in higher tiers costs more. If the rain sensor prevented a cycle in a low use month
(lower tier), the cost savings may be lower than if the rain sensor prevented a cycle in a high use
month (upper tier). Be sure to note this in the report.

21
Appendix C
Site Assessment Checklist

22
Sprinkler Assessment Site Checklist
System Information Rain Sensor YES NO
Location of Rain Sensor Assessor
Controller Information Facility Name
Make and Model
Days the system runs Site Location
Number of Zones
Runtimes of Each Zone (fill in below under zone information)
Sprinkler and Zone Information
Deficiencies
ZONE Run
Tim
e
(min
)
Num
be
r o
f S
prin
kle
rs
Sp
rin
kle
r T
yp
e
(ro
tor,
sp
ray,
oth
er)
Ch
arac
teri
stic
s (s
lop
e, t
yp
e o
f
gra
ss,
shad
y a
reas
, et
c.)
Bro
ken
hea
ds
Lo
w h
ead
s
Cro
ok
ed h
ead
s
No
hea
ds
at a
ll
Plu
gg
ed h
ead
s
Bu
ried
hea
ds
Hea
ds
no
t ro
tati
ng
pro
per
ly
Hea
ds
wat
erin
g u
nd
esir
ed a
rea
Ob
stru
ctio
ns
blo
ckin
g s
trea
m
Hea
ds
blo
cked
by
lan
dsc
apin
g
Cu
t w
ater
lin
e
Lea
kin
g v
alv
e
Other Comments
1
2
3
4
5
6
7
8
9
10
11
12
13
14

23
Appendix D Greenhouse Gas Reductions Explanation and Calculations
Relevance of Greenhouse Gas Emission Estimates
This issue is an increasingly important one for business decision makers as it relates to regulations,
stakeholder interests and day-to-day business operations and energy use. There are several important
dimensions of analysis for any pollution prevention opportunity. One is certainly direct environmental
impact (e.g. reductions in solid or hazardous waste, water use, air pollution, or energy use). Another
important dimension is cost. Yet another is the intangible (not quantifiable) impact, such as reduced
liability, increased worker safety/satisfaction, or improved corporate image. A final important dimension
is indirectly estimating the impact on greenhouse gas (GHG) emissions that can be achieved by
implementing any given pollution prevention opportunity.
GHGs include a number of different gases such as carbon dioxide, methane, nitrous oxide, ozone,
chlorofluorocarbons and water vapor. These gases contribute to the “greenhouse effect” in the Earth’s
atmosphere. While GHGs make the planet warm enough to be habitable, an excessive amount of these
gases is believed to be building up in the atmosphere and causing the average global temperature to rise,
leading to climate change and instability. A significant spike in GHG concentrations in the atmosphere
has occurred since the industrial revolution, pointing to the man-made nature of this change. This is why
a new emphasis, and discussion of possible regulations, has been placed on reducing GHG emissions in
all parts of our society, including government, business and industry.
The most widely recognized unit for measuring GHG emissions is carbon dioxide equivalent (CO2e).
Each of the GHGs has a different capacity to heat the earth’s atmosphere, called its global warming
potential (GWP). Carbon dioxide (CO2) has a GWP of 1, so in order to standardize reporting, when
GHG emissions are calculated, they are reported as equivalent to a given volume of CO2.
Array of Calculation Tools
Reductions in GHG emissions can be estimated using a variety of calculation tools and computer
models. The direct environmental/cost benefits estimated or realized are used as quantified input for
these calculations, therefore the resulting GHG emission reduction estimates are considered indirect
benefits. Some commonly used tools are listed below:
--Nationally recognized conversion factors from the U.S. Department of Energy and the
American Water Works Association: these are used to estimate GHG emissions for electricity, natural
gas, and water use. For example, kilowatt-hours (kWh) of electricity used can be converted to GHG
emissions using a factor of 1.404 pounds CO2 e per kWh.
--EPA’s WAste Reduction Model (WARM): this tool is used to determine GHG emissions
related to solid waste. This online calculator uses a life-cycle approach to determine the change in GHG
emissions caused by alternative end-of-life waste management decisions or disposal methods for a
number of different kinds of wastes. For example, using the weight of a solid waste diverted from a
landfill and recycled, an approximate reduction in GHG can be calculated. WARM is periodically
updated and new material types are added by the EPA as new information from climate change research
becomes available.
--Economic Input Output Life Cycle Assessment (EIO-LCA): this model used to estimate GHG
reductions has been developed by researchers at Carnegie Mellon University. This model provides a

24
useful approximation of GHG reductions through the full life-cycle production of a material or
chemical, based on the cost savings from reductions in use. For example, if a business reduces its
purchase of lights by $50,000, the EIO-LCA estimates the GHG emissions to produce the lights through
the mining, manufacturing, packaging and delivery (to list a few) steps in the process of getting the
lights to the end user.
--Recycled Content (ReCon) Tool: EPA created the ReCon Tool to help companies and
individuals estimate life-cycle greenhouse gas (GHG) emissions and energy impacts from purchasing
and/or manufacturing materials with varying degrees of post-consumer recycled content.
--Pollution Prevention (P2) Greenhouse Gas (GHG) Calculator: designed by U.S. EPA in
conjunction with a panel of professionals from the P2 community with state and local governments,
business facilities, grantees, and project managers in mind. The tool was reviewed in national webinars
and conferences reaching over 600 participants and reworked to be more robust and user friendly. The
tool is available in an Excel format and finalized as of November 2011. U.S. EPA will periodically
update the tool as new information and data sources become available. It is designed to help calculate
GHG emissions reductions in metric tons of carbon dioxide equivalent (MTCO2e) from electricity
conservation, green energy, fuel and chemical substitutions, water conservation, and improved materials
and process management in the chemical manufacturing sector.
Selecting the Most Appropriate Tool(s):
When using one of these models to estimate GHG emission reductions for a client, always provide an
explanation of which model was used, why it is most relevant for the issue at hand, what assumptions
were applied, and the importance of reducing GHG emissions as a business and global sustainability
strategy. The EPA P2 GHG Calculator has conversion factors that easily convert reductions in water
use to reductions in GHG emissions. The FAQ in section 1.3 about quantifying environmental benefits
provides an example of GHG calculations using the EIO-LCA model when only cost savings are known.
A summary sentence stating the amount of GHG reduction should be included in the report with each
recommendation, e.g. “Fixing sprinkler deficiencies” will save 960,000 gallons of water per growing
season, which reduces greenhouse gas emissions by about 3.02 metric tons of CO2 equivalents/year.
A detailed appendix should also be developed which shows how the GHG emission reductions were
calculated and is provided below.
Example Appendix of Greenhouse Gas Calculations
Opportunity – Fix sprinkler deficiencies GHG calculated Using EPA’s P2 GHG Calculator Savings: --960,000 gallon reduction in water use per year Assumptions: --0.003149 MTCO2E per 1,000 gallons of cold water based on EPA GHG Calculator Calculations: 960,000 gallons X 0.003149 MTCO2E/1000gallons = 3.02 MTCO2E Sources: --U.S. EPA, Clean Energy. "eGRID 2007 Version 1.1." February 2009. Downloadable ZIP file: eGRID20071_1year05_aggregation.xls, tab NRL05 and US05.

25
Appendix E Tips for Making the Business Case for Change
Tip # 1: Writing an Executive Summary
An executive summary is a brief overview of a report designed to give readers a quick preview of its
contents. Its purpose is to consolidate the principal points of a document in one place. After reading the
summary, your audience should understand the main points you are making and your evidence for those
points without having to read every part of your report in full. It is called an executive summary because
the audience is usually someone who makes funding, personnel, or policy decisions and needs
information quickly and efficiently in order to make decisions and respond appropriately.
Guidelines:
An executive summary should communicate independently of the report. It should stand on its own as a
complete document.
It should explain why you wrote the report, emphasize your conclusions or recommendations, and
include only the essential or most significant information to support those conclusions.
Use subtitles, bullets, tables, selective bolding or other types of organizational structure to add clarity to
your summary
It should be concise—about 10% of the length of the full report.
It should be organized according to the sequence of information presented in the full report. Don’t
introduce any new information that is not in your report.
To help with organizing the executive summary, after you have written the full report, find key words;
words that enumerate (first, next, finally); words that express causation (therefore, consequently); words
that signal essentials (basically, central, leading, principal, major); and contrast (however, similarly, less
likely).
Read the completed summary with fresh eyes. Check spelling, grammar, punctuation, details, and
content. Ask someone else to read it.

26
Tip #2: Technical Writing Tips:
Use these tips as a checklist as you prepare your report.
Proof reading. Write your report, let it sit, then proof read it for grammar, jargon, clarity,
multiple meanings, and technical correctness before submittal. Re-read the report from the
recipient’s point of view. Reading the report aloud may help.
Figures and tables. Refer to each figure and table in the text prior to inserting it. Always place the
figure or table in the report soon after you have referred to it. Include a title and number for all
figures and tables, capitalizing the title when referring to a specific table or figure, e.g., “All of the
wastes generated by the shop are listed in Table 1
Transitions. Provide brief transition sentences between sections of the report and before a
bulleted list to explain what the list consists of and how it is organized.
Parallel construction. Use parallel construction in all numbered or bulleted lists. For example,
all items should be a complete sentence or none should be; or all items might begin with an
active verb, e.g., “use,” “change,” “remove” or a noun, like this list.
Format. A general format/outline has been suggested, although this may need to be modified to
address a client’s requests. Generally you should:
o Move from generalities to specifics, in each section and across the report as a whole.
o Use page numbers.
o Keep section headings with the narrative that follows at page breaks.
o Rarely split a table across two pages.
Abbreviations. On first use, spell the term out completely, followed by the abbreviation in
parentheses. For example, “Volatile Organic Compounds (VOCs) are another waste that could be
minimized.” Subsequently, just the abbreviation is sufficient unless it is used at the beginning of
a sentence. Never start a sentence with an abbreviation or a numeral.
Professional tone. o Avoid slang, informal terminology (inexpensive vs. cheap), or imprecise (there, that, it)
language.
o Be careful how you word suggestions. Avoid making recommendations outside of your area
and level of expertise in source reduction and waste minimization.
o Use tact and be positive in your conclusions. Remember a reader likes to be complimented,
but can see through phoniness.
o Be careful to confirm your information if you state it as a fact; or cite your source, e.g.,
“According to Mr. Jones, Plant Engineer, . .“ or state that the information is a potential
based on xyz assumptions.
Common errors.
o i.e. vs. e.g.: i.e. means “that is” or “in other words,” and e.g. means “for example.”
o compliment vs. complement: a compliment is a nice comment, and a complement is a part
of a whole
o how many vs. how much: how many can be counted, and how much is uncountable, e.g.,
how many bottles of water vs. how much water.
o policies vs. procedures vs. practices: policies are formal written positions or statements
about some issue; procedures are written directives aimed at accomplishing a task or
complying with a policy; practices are typically informal steps people take, which may or
may not follow written policies and procedures
27
Tip #3: General Recommendations
General recommendations are made to help a company establish the culture and infrastructure needed to
establish and sustain a commitment to source reduction and sustainability. Examples of commonly made
general recommendations include:
1. A pollution prevention policy statement should be generated and periodically updated by management
to formally reflect management’s commitment to incorporating pollution prevention in the company’s
operations. Some examples of formal policy statements follow:
This company is committed to continued excellence, leadership, and stewardship in protecting
the environment. Environmental policy is a primary management responsibility, as well as the
responsibility of every employee.
The corporate objective is to reduce waste and achieve minimal adverse impact on the air,
water, and land through excellence in environmental control.
Minimizing or eliminating the generation of hazardous waste is a prime consideration in process
design and plant operations and is viewed by management as having a priority as high as safety,
yield, and loss prevention.
2. To further implement the corporate pollution prevention policy, one or more “cause champions”
should be selected to lead the pollution prevention program and overcome the resistance present when
changes are made to existing operations. These “cause champions” may include a project manager, an
environmental coordinator, or anyone else dedicated to implementing the pollution prevention ideal and
company policy. These individuals must be given authority by management to carry out the policy.
3. Input from employees should be considered, encouraged, and valued. Since the employees must deal
with the waste, they may have insight into how a specific pollution prevention opportunity may be
implemented. Many companies offer incentives to employees who suggest innovations to minimize or
reduce waste generation.
4. Goals should be established to help implement and track the progress of the corporate pollution
prevention policy. Specific, quantitative goals should be set that are acceptable to those willing to work
to achieve them, flexible to changing requirements, and achievable with a practical level of effort. To
document the progress of the pollution prevention goals, a waste accounting system should be used.