gsa data repository 2011173 esposti ongaro et al ... · gsa data repository 2011173 esposti ongaro...
TRANSCRIPT

GSA DATA REPOSITORY 2011173 Esposti Ongaro et al.
Supplement A. Multiphase flow formulation
ModelequationsModel equations express the Eulerian balance of mass, momentum and enthalpy for one gas phase, made of M components, and N particulate phases.
In the above equations, ε is the phase volumetric fraction, y is the mass fraction of a gas species, v is the velocity vector, ρ is microscopic density, P is the thermodynamic pressure, is the gas constant divided by the effective gas molecular weight, h is the phase enthalpy, T is the temperature, T is the stress tensor, κ is the thermal diffusivity coefficient, Cp is the specific heat at constant pressure, G(εg) is the solid compressive modulus. Subscript g indicates the gas phase, k (running from 1 to N) the solid phases, m (running from 1 to M) the gas species. µg is the dynamic gas viscosity coefficient,
µge indicates effective gas viscosity accounting for turbulent subgrid transport, µk is a solid viscosity coefficient (depending only on particle size). Interphase exchange coefficients (Dg,k, Dk,j, Qg, Qs) in the momentum and enthalpy balance equations are computed as a function of the primary (independent) flow variables (P, εk, vg, vk, hg, hk) through semi-empirical relations, whose formulation, validity and calibration are discussed extensively by Neri et al. (2003).
DiscussionofmodelvalidityMass balance equations do not account for gas phase transitions or mass transfer between particulate phases (e.g., via secondary fragmentation or aggregation). Momentum balance equations are expressed through “Model A” of Gidaspow (1994), where the so-called buoyancy term (-εk∇Pg) is included in the particle momentum equations and the granular pressure term (-∇Pk) is neglected. To account for collision effects at higher volume fractions, an additional Coulombic repulsive term (“dispersive pressure”) is introduced in the particle normal stress. The viscous stress tensor adopted for particle phases is proportional to the particle volumetric fraction: such form implies a linear increase of viscous dissipation with solid concentration. Such correlation was adopted in many studies of viscous multiphase flow (see e.g. Gidaspow 1994, Chap. 8) and make the model more suited for the simulation of particle sedimentation in shear flows at moderate concentrations (less than about 10-1, i.e. in kinetic to collisional regime). In the present application, we have thus focused our discussion on the dynamics of the dilute, upper layer, where the multiphase model more accurately describes the natural mixture.
BoundaryconditionsFree in-out flow conditions are imposed at West, East, South, North and Top domain boundaries. At ground, we impose no-slip (zero velocity) conditions to both gas and particles. No solid mass outflow is allowed from bottom boundary, which is equivalent to avoiding particle deposition. Although this condition is certainly conservative, we assume that it did not influence much the large-scale dynamics of the flow, since the current rapidly decouples into a dense, basal layer and a dilute cloud: while the bottom layer controls the depositional features of the blast, the dynamics of the upper, dilute layer largely controls the runout distance and timing of the current emplacement.
NumericalsolutionTo solve the model numerically, the continuum transport equations are discretized on a 3D Cartesian mesh through a second-order accurate, finite-volume scheme and a semi-implicit time-advancing scheme. The solution of the resulting non-linear algebraic system is achieved through a parallel, cell-by-cell iterative algorithm suited for sub- to supersonic multiphase flows (Harlow and Amsden, 1975; Esposti Ongaro et al., 2007). An immersed boundary technique applicable to compressible multiphase flows has been implemented to accurately describe ground boundary conditions of the flow in a complex 3D topography, even when the Cartesian grid is relatively coarse (20 meters in the present case) (de' Michieli Vitturi et al., 2007). The new numerical code has been verified and validated through a number of applications to known analytical solutions, laboratory experiments and volcanological events. Examples relevant to this study include the dynamics of pyroclastic density currents (Esposti Ongaro et al., 2010), 1D, 2D and 3D shock-wave tests (Esposti Ongaro et al., 2007 and unpublished data), the dynamics of underexpanded jets
(Esposti Ongaro et al., 2006). In particular, the last study demonstrates that our model is able to compute supersonic flows and multidimensional shock waves in multiphase jets. The interested reader may refer to these papers for further discussion of model features.
Additionalreferences1. de'Michieli Vitturi, M., Esposti Ongaro, T., Neri, A., Salvetti, M.V., Beux, F.,
2007. An immersed boundary method for compressible multiphase flow: application to the dynamics of pyroclastic density currents. Comput. Geosci. doi:10.1007/s10596-007-9047-9.
2. Esposti Ongaro, T., Neri, A., Cavazzoni, C., Erbacci, G., Salvetti M.V., 2007, A parallel multiphase flow code for the 3D simulation of explosive volcanic eruptions. Parallel Computing, doi:10.1016/j.parco.2007.04.003.
3. Esposti Ongaro, T., Pelanti, M., Neri, A., LeVeque, R., 2006. Shock-wave pattern and atmospheric signature of underexpanded volcanic jets: a comparative study using two numerical multiphase flow models. Workshop The Physics of Fluid Oscillation in Volcanic systems, Lancaster (UK), September 2006 (abstract).
4. Esposti Ongaro, T., Barsotti, S., Neri, A., Salvetti, 2010, M.V., Large-eddy simulation of pyroclastic density currents. In “Quality and Reliability of Large-Eddy Simulations II”, M.V. Salvetti, B.J. Geurts, J. Meyers, P. Sagaut eds., Springer ERCOFTAC series, 16, 161-170, ISSN 1382-4309.
5. Esposti Ongaro, T., Clarke, A. B., Neri, A., Voight, B., Widiwidjayanti, C., 2008, Fluid dynamics of the 1997 Boxing Day volcanic blast on Montserrat, W.I. J. Geophys. Res. 113, B03211, doi:10.1029/2006JB004898.
6. Harlow, F.H., Amsden, A.A., 1975. Numerical calculation of multiphase fluid flow. J. Comput. Phys., 17, 19–52.

Supplement B. Sensitivity analysis
Sensitivity analysis on model initial conditions has been carried out on 2D and 3D simulations. Due to the high computational cost of 3D runs, 2D runs have been used for extensive parameter exploration.
Two‐dimensionalsimulationsIn 2D modeling, we have chosen a cylindrical coordinate system (instead of a Cartesian system) since it has the advantage of accounting for the radial spreading (i.e. the increase of the frontal width with radial distance) of the flow (at Mount St. Helens, the blast spread over a 120° sector). The correct mass per unit angle was accounted for by increasing the total mass by a correction factor of 3 (i.e. ~360°/120°). This was just an artifact to parameterize in 2D the first-order effect of a 3D phenomenon, which was motivated by the assumption (verified a posteriori) that the mass per unit angle was a primary parameter influencing the pyroclastic density current (PDC) dynamics. The 2D runs were performed by adopting two different sections of the Mount St. Helens region, crossing the crater and directed towards N10°W (not shown here) and N20°E, in order to inspect the effect of different topographic profiles on model results. Grid resolution in 2D was 20 m at ground level and at the domain axis, increasing progressively up to 100 m at domain boundaries in both R and Z directions (at 25 km radially and 8 km vertically). Input and scaling parameters for 2D and 3D simulations are described in Table DR1. The 2D dynamics of the blast is characterized by the same sequence of phenomena described in 3D, in which a gravity-driven flow forms by the decompressive expansion (burst) and subsequent collapse of the eruptive mixture, initially at rest (Figure DR1). At 10 s the decompression phase is completed: the mixture has reached its maximum expansion and starts collapsing forming a pyroclastic density current. Maximum runout at 300 s is about 16 km (actual runout along the N20°E direction was about 18-20 km). Two-dimensional runs, in general, have a shorter runout compared to 3D, which can be explained by the strong topographic control in 3D and by the significant azimuthal variation of the flow field, which make the 2D assumption only useful for input parameter (sensitivity) tests.
Radialdistributionofpressure/porosity(specificenergy)We have tested several models of dome pressure and void distribution. The specific energy released during the gas decompression was computed assuming either an adiabatic or an isothermal expansion (as in Esposti Ongaro et al., 2008) and used as a scaling parameter for the different porosity and pressure distributions. The minimum gas pressure adopted in this study equals the hydrostatic load of the solids: this is equivalent to imposing the minimum fluidization conditions (we did not test the case of purely granular flow because it is not suited to the phenomenon under investigation). The upper level corresponds to the maximum overpressure sustainable by the tensile strength of the edifice, which we set at 10 MPa. The maximum specific energy refers to the case where the void fraction is larger in the dome interior and where pressure is higher. According to Alatorre-Ibargüengoitia et al. (2010), the effective pressure propelling the gas-particle mixture after fragmentation corresponds to the pressure initially stored in the pores minus the fragmentation threshold (which is about 2.7 MPa for MSH dacite). We then tested variation of initial pressure within this range of variation.

In Figure DR2 we show a comparison, using 2D simulations, of a) PDC front positions vs. time and b) PDC front velocities vs. distance along the N20°E profile. The plots clearly show that there can be significant variability in flow conditions depending on the specific energy of the initial dome condition, resulting in initial velocities ranging from about 75 m/s (run 2D-C) to more than 150 m/s (three-shells model, run 2D-H). Overall, the changes in the specific energy affect the final 2D runout by less than 15% (14±2 km).
GrainsizeGrain size distribution can have a significant impact on PDC mobility, as already pointed out by multiparticle numerical simulations by Neri et al. (2003). In the present sensitivity study we have also analyzed two end-member cases, characterized by single-sized particles of diameter 50 µm and 500 µm and equal density of 2500 kg/m3
(Figure DR3). The coarsest particles tend to accumulate in a thin bottom layer, thus enhancing the decoupling and lifting off of a dilute ash cloud, with respect to simulations with fine particles alone. Simulations with fine particles alone form a more mobile PDC, with a final runout distance increased by 35% (from 9 to about 14 km). In our study, we have tried to constrain as much as possible (within our computational capabilities) the initial grain size distribution of the eruption mixture.
3DdomegeometrySource geometry has a strong control on the asymmetric focusing of the blast. We tested the case of a hemispheric source, in order to assess the robustness of the burst-collapse-PDC blast mechanism and to estimate the influence of the source geometry on the flow runout, with initial conditions of Run 3D-A (Table DR1). The hemispheric source conditions resulted (Figure DR4) in a reduced focusing (about 8% of the mass spilling Southward) and a shorter runout (up to 4 km less) in the North direction, but the overall blast dynamics is substantially similar. Finally, we have tested blast properties on 3D Cartesian domain with a flat surface (in the absence of topography), without any significant difference in the fundamental sequence of events described in the present paper.
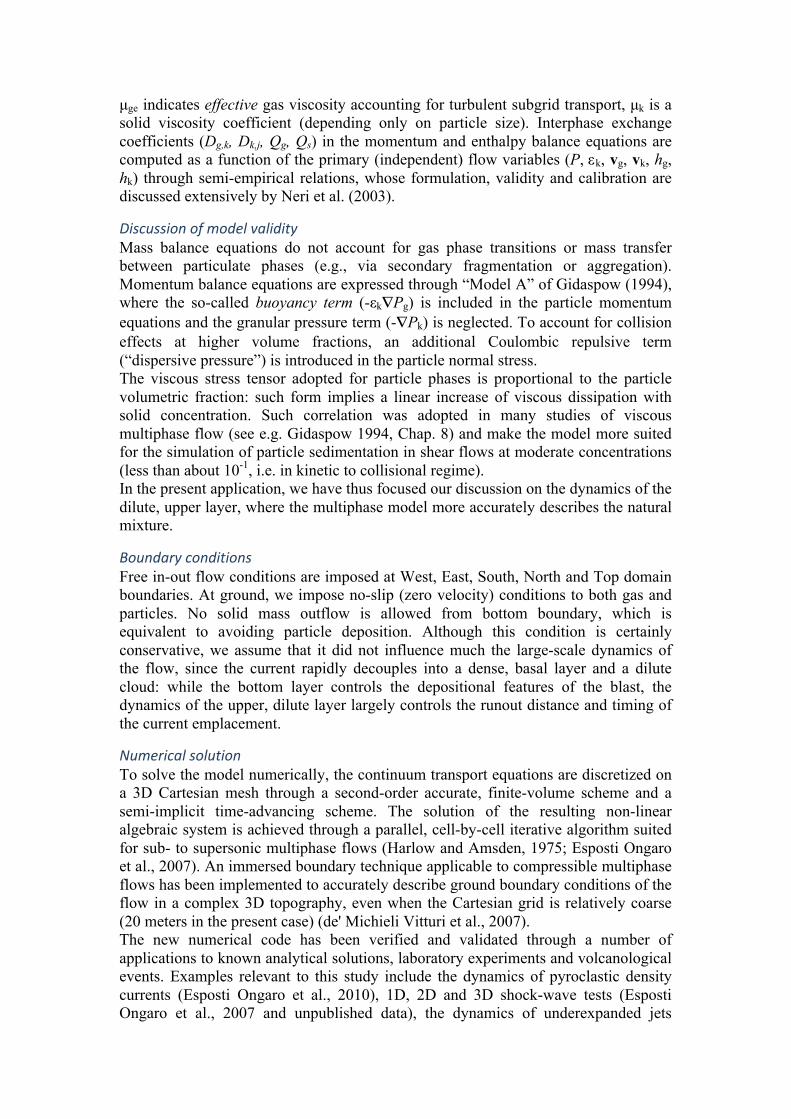
3Dparametricstudy:energy.In 3D, we have tested the end-member case of zero dome overpressure, which corresponds to the gravitational collapse of a fluidized mixture (gas pressure equals the hydrostatic load of particles - Run 3D-B in Table DR1). The final runout (Figure DR5), in this case, is about 4 km shorter in the NE and NW directions, with respect to the 10 MPa overpressure case, but the overall blast features are very similar.
Additionalreferences1. Alatorre-Ibargüengoitia M.A., Scheu B., Dingwell, D.B., Delgado-Granados,
H., Taddeucci, J., 2010, Energy consumption by magmatic fragmentation and pyroclast ejection during Vulcanian eruptions. Earth Planet. Sci. Lett. 291:60–69.
2. Esposti Ongaro, T., Clarke, A. B., Neri, A., Voight, B., Widiwidjayanti, C., 2008, Fluid dynamics of the 1997 Boxing Day volcanic blast on Montserrat, W.I. J. Geophys. Res. 113, B03211, doi:10.1029/2006JB004898.
3. Neri, A., Esposti Ongaro, T., Macedonio, G., Gidaspow, D., 2003, Multiparticle simulation of collapsing volcanic columns and pyroclastic flows. J. Geophys. Res. 108(B4), doi:10.1029/2001JB000508.

Table DR1: Inputconditionsforthesensitivitystudyontheeffectofdomeinitialconditions on 2D/3D model results. Initial conditions for 3D simulationdiscussed in the paper are those of run 3D‐A. The third column (Number ofphases) indicates the number of particulate classes in the juvenile (dome) andnon‐juvenile(rocks).Pressureinrun2D‐BisdistributedaccordinglytothedomemodeldescribedbyEspostiOngaroetal.(2008),withdomepermeabilityequalto 10‐14. If not specified, particle classes are those described in the paper: 3 juvenile particle classes with equivalent hydraulic diameters of 3,250 µm (35 wt.%), 150 µm (37 wt.%) and 13 µm (28 wt.%) µm, and densities of 1,900, 2,300 and 2,500 kg/m3, respectively; 1 non-juvenile particle class, with 500 µm diameter and 2,500 kg/m3 density.Multiplerowsindicatethesubdivisionofthedomeintoconcentricshells,whosevolumes,porositiesandtemperaturesarereportedinthetable.
Sourcemodel
Numberofshells
Numberofphases
Pressuremodel
Volume,VDRE[m
3]Vol.fract.ε s
Temperature[K]
Total solidmass[kg]
Energy[J/kg]
2D‐A 1 dome(3);rocks(1)
10MPa +hydrostatic
450x106 0.8 dome(1173);rocks(323)
1182.5x109 8600
2D‐B 1 dome(3);rocks(1)
W14 +hydrostatic
450x106 0.8 dome(1173);rocks(323)
1182.5x109 7500
2D‐C 1 dome(3);rocks(1)
hydrostatic 450x106 0.8 dome(1173);rocks(323)
1182.5x109 2400
2D‐D 1 dome(3);rocks(1)
10MPa +hydrostatic
372x106 0.7 dome(1173);rocks(323)
1182.5x109 14000
2D‐E 1 1(50µm)
10MPa +hydrostatic
420x106 0.8 833 1277.5x109 8200
2D‐F 1 1(500µm)
10MPa +hydrostatic
420x106 0.8 833 1277.5x109 8200
dome(3) 10MPa +hydrostatic
252x106 0.8 11732D‐G 2
rocks(1) hydrostatic 168x106 0.8 323
1182.5x109 6300
10MPa +hydrostatic
189x106 0.6dome(3)
10MPa +hydrostatic
75.6x10⁶ 0.9
1173
2D‐H 3
rocks(1) hydrostatic 113.4x10⁶ 0.9 323
1078.2x109 13200
5MPa +hydrostatic
189x106 0.6dome(3)
5MPa +hydrostatic
75.6x10⁶ 0.9
11732D‐I 3
rocks(1) hydrostatic 113.4x10⁶ 0.9 323
1078.2x109 8900
10MPa +hydrostatic
189x106 0.6dome(3)
10MPa +hydrostatic
75.6x10⁶ 0.9
11733D‐A 3
rocks(1) hydrostatic 113.4x10⁶ 0.9 323
1078.2x109 13200
189x106 0.6dome(3) hydrostatic75.6x106 0.9
11733D‐B 3
rocks(1) 113.4x10⁶ 0.9 323
1078.2x109 13200

Figure DR1: Distribution of total particle volumetric fraction at 10, 60, 186 and 300 s in Simulation 2D-H.

Figure DR2: a) front position as a function of time for 5 different 2D simulations (see Table DR1 for input conditions). b) Front velocity as a function of the distance from the source. The shaded curve represents the topographic profile along the N20°E section.

Figure DR3: Comparison of total volumetric particle fraction at 300 s for runs 2D-E (upper panel, 50 µm) and 2D-F (lower panel, 500 µm).

Figure DR4: Map of the log10 of the total particle concentration at 10 m above the ground level, at 400 s after the onset of the eruption, for run 3D-A with hemispheric dome (see Table DR1 and text for discussion). Superimposed outlines (modified after Moore and Rice, 1984, Figs. 10.2 and 10.7): White line, boundary of debris avalanche deposit; Orange line, tree blowdown limit; Yellow line, seared zone boundary.
Figure DR5: Map of the log10 of the total particle concentration at 10 m above the ground level, at 400 s after the onset of the eruption, for run 3D-B with zero dome overpressure (see Table DR1 and text for discussion). Superimposed outlines (modified after Moore and Rice, 1984, Figs. 10.2 and 10.7): White line, boundary of debris avalanche deposit; Orange line, tree blowdown limit; Yellow line, seared zone boundary.