growth trends in global agricultural output changing...
TRANSCRIPT

1
Changing Global Food Markets: The Role of Value Chains & Supply Chains
World Bank ESSD Workshop on Standards and Trade – April 6, 2005“Part 1: Small Scale Producers in Changing Food Markets”
Except otherwise noted, copyrighted April, 2005
by Abt Associates, Inc.
All Rights Reserved
Developed by John Lamb; presented by John
Holtzman, Abt Associates Inc.
April 6, 2004
Growth trends in global agricultural output
• Annual rate of growth in global ag sector GDP slowed in last decade (up just 1.8% between 1990 and 2002 vs. 2.6% in Eighties)
• Output slowed for all country-income groups in the latter Nineties, only to pick up the year after 9/11 as the 2002 globalrecession passed
• In most LDCs, agriculture still contributes at least 15% of GDP,sometimes much more (e.g. Benin 36%, Nicaragua 29%, Vietnam 22%), yet …
• Historical growth rates are much lower than the 4-6% needed to cover population growth & serve as the main driver of rural prosperity
April 6, 2004
Trends in value of agricultural exports
• After contraction in the late Nineties, global food and agricultural trade has been expanding faster than population since 2001 (up 6% in 2002, then 15% in 2003), reaching $674 billion in 2003
• All regions did well in 2003 ag exports (latest year reported): Western Europe up 19%; Asia up 12%; North America up 9%; Latin America up 15%; CEE/Baltic/CIS States up 26%; Africa up 16%
• Some countries are highly dependent on ag exports (e.g. in 2003, Paraguay 82%, Nicaragua 77%, Belize 74%, Ethiopia 72%), but the share of agriculture in exports tends to fall as development proceeds
April 6, 2004
Population growth in developing countries remains a key driver of food and agricultural trade
Source: Neil Conklin, Economic Research Service, 2004

2
April 6, 2004
Urbanization will also drive greater diversification in food consumption & expanded trade
Source: FAO, State of Agricultural Commodity Markets, 2004
April 6, 2004
Other characteristics of future developing country markets to keep in mind
Emerging middle class: higher value added to staple products; ↑ consumption of animal protein and vegetables (dietary diversification)
High-end segment will have same preferences as consumers in developed markets, e.g. convenience, variety, quality
Changing role of women in labor force & food preparation: ↑ demand for ready-to-cook food & meals away from home
Supermarkets’ share will increase
April 6, 2004
Diets diversify as incomes rise…
Source: Neil Conklin, Economic Research Service, 2004
April 6, 2004
The change has already begun: witness LDC agricultural trade balance since 1980
Source: FAO, State of Agricultural Commodity Markets, 2004

3
April 6, 2004
Trends in value of agricultural imports
• Some countries highly dependent on food and ag imports: e.g., Egypt at 29% of all merchandise imports; Madagascar and Syria at 20%
• Northern countries are tending to import a greater share of their needs in terms of value (in 2003: EU15
18%, USA 8%, Japan 6%, China 40%)
• At $308 B (billion) in 2003, EU is largest importer, US second at $77B, Japan third at $58 B, China moving up fast (probably to 2nd place by 2015)
April 6, 2004
Trends in composition of agricultural trade
• Composition of trade is changing, with greater share to:
– higher value products (80% food products vs. 20% agric. raw materials)
– consumer-oriented items with good value-added (within food)
• Changes due to better post-harvest & transport technology, improved equipment, and practices that enable shipment much greater distances & more quickly
• Seasonal windows are closing in most major markets, especially in Northern countries, but opportunities still remain in South and for regional trade
April 6, 2004
Seasonal windows on which the NTAE boom was built are closing
• Fresh produce whose windows have closed in the U.S.
– Apples
– Melons
– Lettuce
– Greens
– Asparagus
– Onions
– Oranges
– Carrots
– Potatoes
– Cucumbers
• Fresh produce with seasonal gaps or shortages in the U.S.
– Blueberries
– Cherries
– Stonefruit
– Red raspberries
– Tangerines
– Lychees
– Rambutan
– Mangosteen
– Apricots
April 6, 2004
Note that real prices for agricultural commodities continue to fall over time…
Source: FAO, State of Agricultural Commodity Markets, 2004
4
April 6, 2004
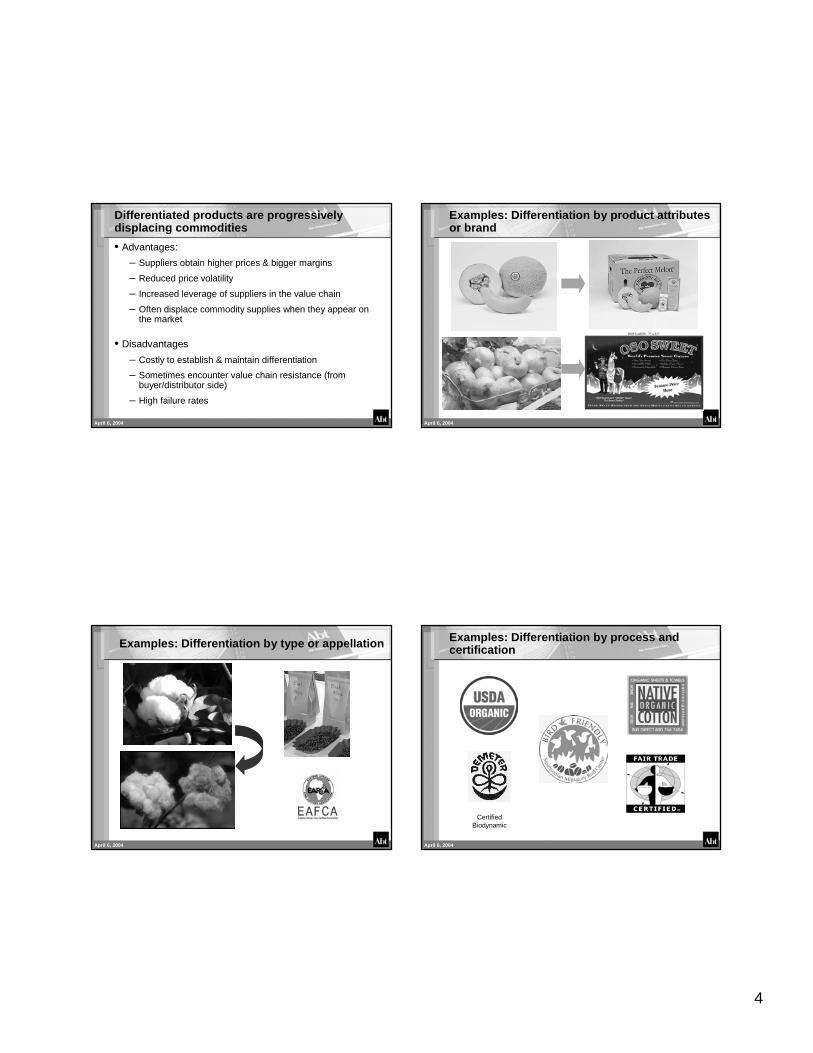
Differentiated products are progressively displacing commodities
• Advantages:
– Suppliers obtain higher prices & bigger margins
– Reduced price volatility
– Increased leverage of suppliers in the value chain
– Often displace commodity supplies when they appear on the market
• Disadvantages
– Costly to establish & maintain differentiation
– Sometimes encounter value chain resistance (from buyer/distributor side)
– High failure rates
April 6, 2004
Examples: Differentiation by product attributes or brand
April 6, 2004
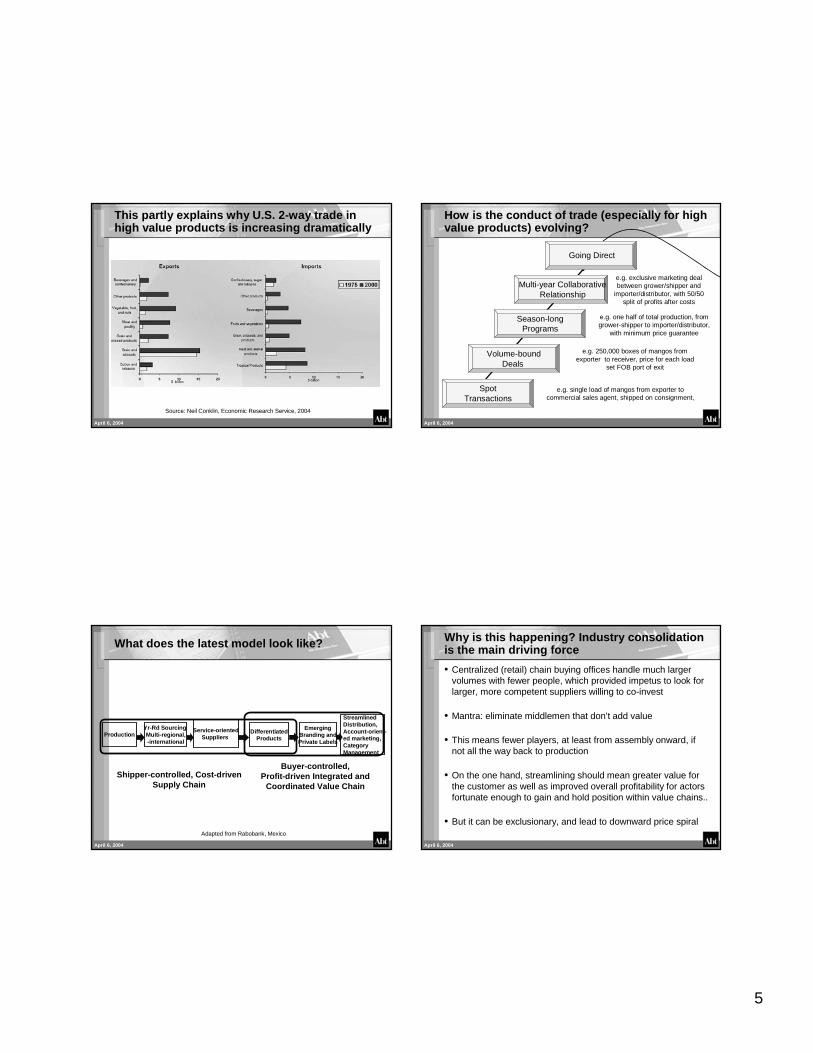
Examples: Differentiation by type or appellation
April 6, 2004
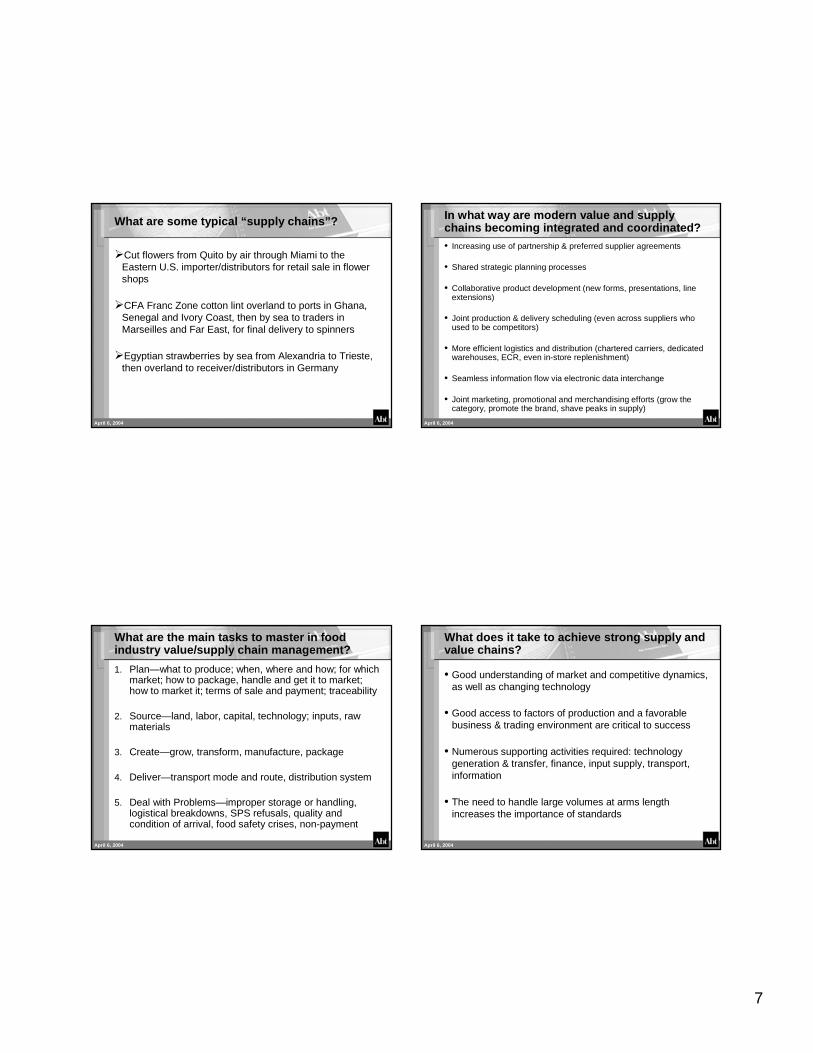
Examples: Differentiation by process and certification
Certified Biodynamic
5
April 6, 2004
This partly explains why U.S. 2-way trade in high value products is increasing dramatically
Source: Neil Conklin, Economic Research Service, 2004
April 6, 2004
How is the conduct of trade (especially for high value products) evolving?
Spot Transactions
Volume-bound Deals
Season-long Programs
Multi-year Collaborative Relationship
e.g. single load of mangos from exporter to commercial sales agent, shipped on consignment,
e.g. 250,000 boxes of mangos from exporter to receiver, price for each load
set FOB port of exit
e.g. one half of total production, from grower-shipper to importer/distributor,
with minimum price guarantee
e.g. exclusive marketing deal between grower/shipper and
importer/distributor, with 50/50 split of profits after costs
Going Direct
April 6, 2004
ProductionYr-Rd Sourcing Multi-regional,-international
Service-orientedSuppliers
DifferentiatedProducts
Streamlined Distribution,Account-orient-ed marketing, Category Management
ShipperShipper--controlled, Costcontrolled, Cost--driven driven Supply ChainSupply Chain
BuyerBuyer--controlled,controlled,ProfitProfit--driven Integrated and driven Integrated and
Coordinated Value ChainCoordinated Value Chain
EmergingBranding andPrivate Labels
Adapted from Rabobank, Mexico
What does the latest model look like?
April 6, 2004
Why is this happening? Industry consolidation is the main driving force
• Centralized (retail) chain buying offices handle much larger volumes with fewer people, which provided impetus to look for larger, more competent suppliers willing to co-invest
• Mantra: eliminate middlemen that don’t add value
• This means fewer players, at least from assembly onward, if not all the way back to production
• On the one hand, streamlining should mean greater value for the customer as well as improved overall profitability for actors fortunate enough to gain and hold position within value chains..
• But it can be exclusionary, and lead to downward price spiral

6
April 6, 2004
How is this new and different?
1. Longer-term vision
2. More stable relationship between two companies, not based so much on personal relationships
3. Joint responsibility and accountability
4. Bottom line is profitability and growth of the category as a whole—year-end for category, not weekend results for a particular brand
5. Fewer players control more of the volume
6. Heavy emphasis on enterprise-wide IT
7. Shared staff, dedicated facilitiesApril 6, 2004
“Value chain” is not the same as “supply chain”
• Value chains:
– medium-to-long term: what will the market pay for a good offered for sale? (maximize profit)
– short-to-medium term: expand market share
• The main objectives of value chain management: maximize gross revenue & sustain it over time
• However, you can’t have a successful value chain without an efficient and reliable supply chain
April 6, 2004
What are some of the emerging “value chains”?
Consumer packs of specialty vegetables from Guatemala and Peru for the Southeast US chain stores
Freshcut fruit from Ghana and Costa Rica
Chilled Nile perch fillets from Uganda and Kenya for UK multiples
April 6, 2004
What is an agricultural supply chain?
Entire set of processes and activities required to produce a product then deliver it to a target market, i.e. to go from “farm to fork”
• “to produce” encompasses growing, transforming, or manufacturing
• Focus of supply chains: what does product cost and how long does it take to present product for sale
• The main objectives of supply chain management:
a) minimize costs by reducing the number of links & friction in the chain (bottlenecks, red tape, transaction costs, time to market)
b) improve reliability, speed & quality of goods delivered
7
April 6, 2004
What are some typical “supply chains”?
Cut flowers from Quito by air through Miami to the Eastern U.S. importer/distributors for retail sale in flower shops
CFA Franc Zone cotton lint overland to ports in Ghana, Senegal and Ivory Coast, then by sea to traders in Marseilles and Far East, for final delivery to spinners
Egyptian strawberries by sea from Alexandria to Trieste, then overland to receiver/distributors in Germany
April 6, 2004
In what way are modern value and supply chains becoming integrated and coordinated?• Increasing use of partnership & preferred supplier agreements
• Shared strategic planning processes
• Collaborative product development (new forms, presentations, line extensions)
• Joint production & delivery scheduling (even across suppliers who used to be competitors)
• More efficient logistics and distribution (chartered carriers, dedicated warehouses, ECR, even in-store replenishment)
• Seamless information flow via electronic data interchange
• Joint marketing, promotional and merchandising efforts (grow thecategory, promote the brand, shave peaks in supply)
April 6, 2004
What are the main tasks to master in food industry value/supply chain management?
1. Plan—what to produce; when, where and how; for which market; how to package, handle and get it to market; how to market it; terms of sale and payment; traceability
2. Source—land, labor, capital, technology; inputs, raw materials
3. Create—grow, transform, manufacture, package
4. Deliver—transport mode and route, distribution system
5. Deal with Problems—improper storage or handling, logistical breakdowns, SPS refusals, quality and condition of arrival, food safety crises, non-payment
April 6, 2004
What does it take to achieve strong supply and value chains?
• Good understanding of market and competitive dynamics, as well as changing technology
• Good access to factors of production and a favorable business & trading environment are critical to success
• Numerous supporting activities required: technology generation & transfer, finance, input supply, transport, information
• The need to handle large volumes at arms length increases the importance of standards

8
April 6, 2004
There are three main kinds of standard
• Product standards: e.g. type, variety, size count, PLU stickers, color, maturity, sugar level, cosmetic appearance, organoleptic attributes, type of box, markings, etc
• Process standards: e.g. pesticide use, GAP, GMP, HACCP, labor conditions, certifications, traceability, etc
• Logistical standards: e.g. palletization, markings, barcoding, RFID, loading patterns, delivery time/place, crossdocking, recovery of pallets, rhythm of deliveries, etc
April 6, 2004
Sanitary and Phytosanitary Standards
Quality and Condition Standards
Environmental
Standards
Social
Standards
Service
Standards
There is also en evolving hierarchy of topical areas to which standards are applied
Let’s briefly examine each layer…
April 6, 2004
Official grades and standards for quality & condition still exist but private specs are increasingly dominant
April 6, 2004
Getting the right quality remains crucial
To achieve this kind of quality, small farmers will need to change how they grade, select, pack, handle, and ship

9
April 6, 2004
There is increasing concern for food safety
10 Least Wanted FoodbornePathogens
Campylobacter
Clostridium botulinum
E. coli 0157:H7
Listeria monocytogenes
Norovirus
Salmonella
Staphyloccus aureus
Shigella
Toxoplasma gondii
Vibrio vulnificus
April 6, 2004
So firm, industry, and even country management of food safety is a competitive necessity
April 6, 2004
Major buyers are requiring food safety and hygiene plans, audits, and certification
April 6, 2004
This has stimulated emergence of third-party suppliers of consulting and auditing services…
10
April 6, 2004
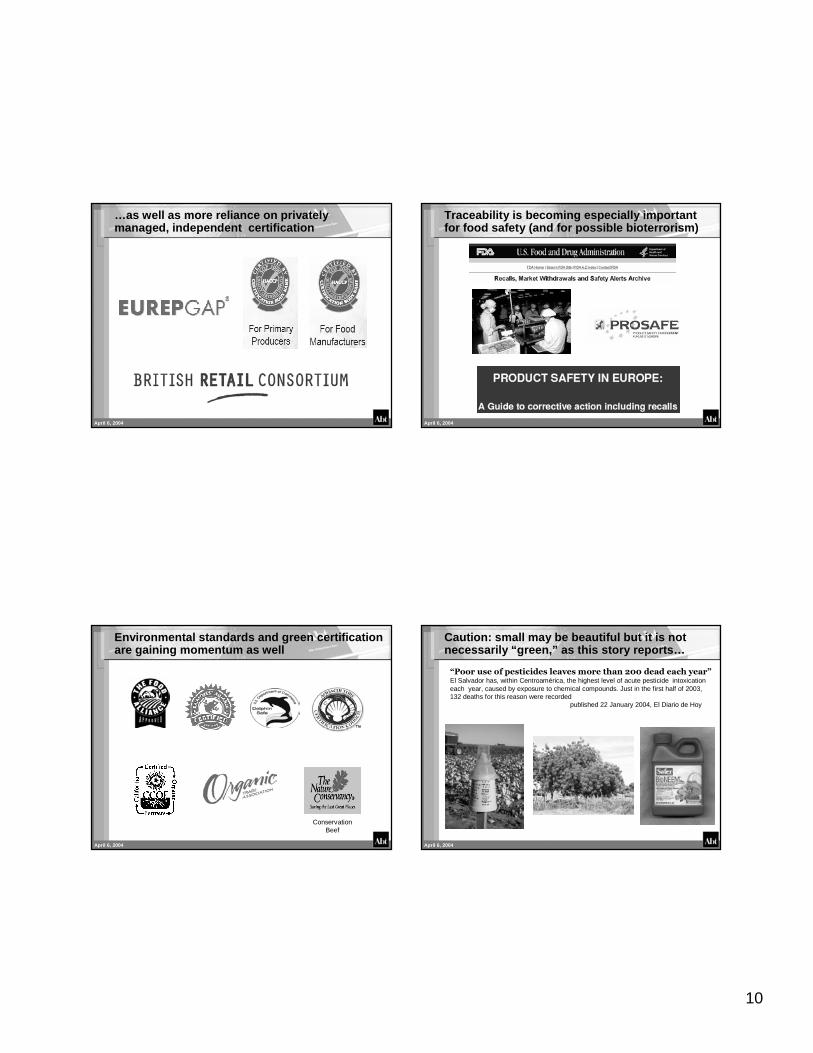
…as well as more reliance on privately managed, independent certification
April 6, 2004
Traceability is becoming especially important for food safety (and for possible bioterrorism)
April 6, 2004
Environmental standards and green certification are gaining momentum as well
Conservation Beef
April 6, 2004
Caution: small may be beautiful but it is not necessarily “green,” as this story reports…
“Poor use of pesticides leaves more than 200 dead each year”El Salvador has, within Centroamérica, the highest level of acute pesticide intoxication each year, caused by exposure to chemical compounds. Just in the first half of 2003, 132 deaths for this reason were recorded
published 22 January 2004, El Diario de Hoy

11
April 6, 2004
Social codes of conduct have been emerging, both from within chains and from outside
April 6, 2004
At the top of the hierarchy, service standards are the new battleground in global food trade
Slotting Allowances
Special Packs
Private Label Products
Promotional Support
Merchandising Support
Volume/Non-Volume Rebates
Capital Improvements
Timely, Consistent Delivery
Setting up Electronic Data Interchange or Merging Systems
Stock Replenishment by Supplier (Warehouse, Store)
Use of Returnable Containers
Prompt Problem Resolution
Trace-back Systems
April 6, 2004
Unfortunately, the market rarely pays for the higher standards, so less of the food dollar is going to the farmer
April 6, 2004
Implications: Need for quality, safety and volume means more contract farming
•Driven by desire for specific attributes: method of production; nutritional composition; variety; seasonality; size/count; maturity; presentation
•Buyers—processors, elevators & retailers—use production contracts to control input choices & production methods
•Farmers benefit: contracts can reduce income risks, ease credit requirements & guarantee higher prices for specific product attributes
•Among U.S. farms with at least $500,000 in annual sales, 61 percent used contracts for at least some of their production in 2001, compared with only 8 percent of farms with sales under $250,000.
•The use of contracts can spread rapidly through an industry. By 2001, contracts covered 54 % of cotton and 39 % of rice production, compared with 30 % and 20 %, respectively, in 1991.
12
April 6, 2004
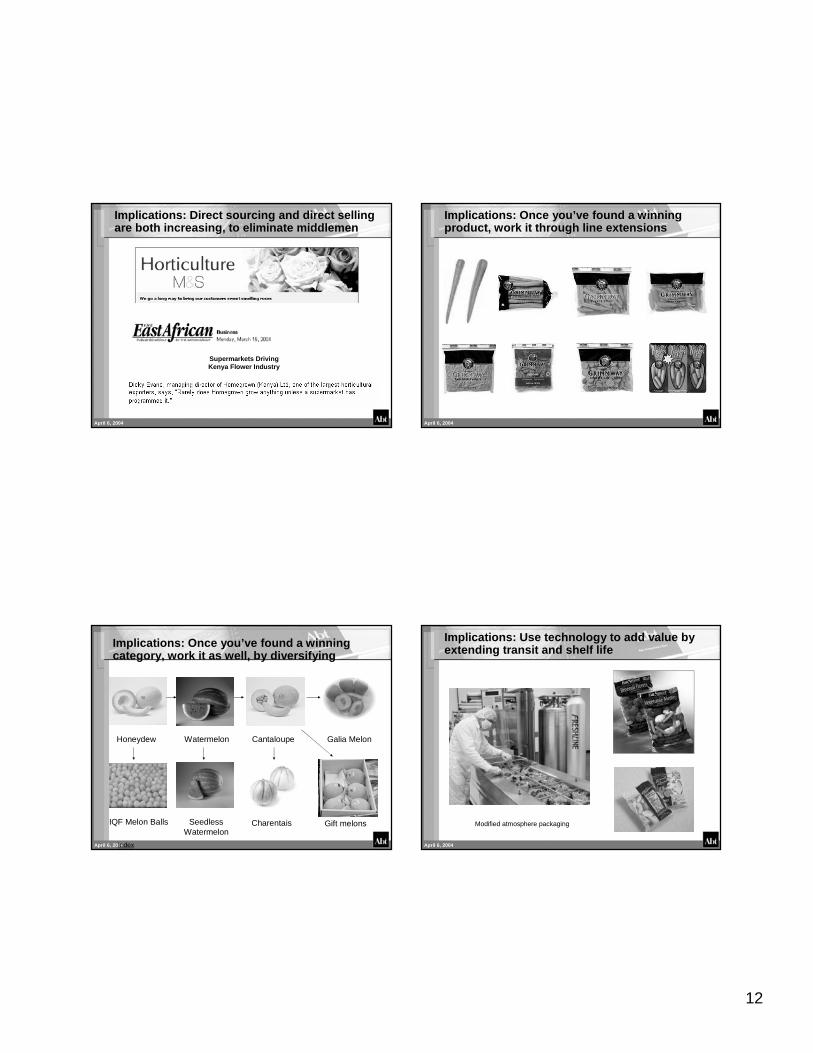
Implications: Direct sourcing and direct selling are both increasing, to eliminate middlemen
Supermarkets DrivingKenya Flower Industry
April 6, 2004
Implications: Once you’ve found a winning product, work it through line extensions
April 6, 2004Index
Honeydew Watermelon Cantaloupe Galia Melon
CharentaisSeedless Watermelon
IQF Melon Balls
Implications: Once you’ve found a winning category, work it as well, by diversifying
Gift melons
April 6, 2004
Implications: Use technology to add value by extending transit and shelf life
Modified atmosphere packaging

13
April 6, 2004
Implications: Improve packaging to add value for both buyers and customers
April 6, 2004
Implications: Keep looking for the next cape gooseberry but…
…since that process is expensive, risky and time-
consuming…
Vietnam: “Dragonfruit”
Nicaragua: “Pitahaya”
April 6, 2004
Implications: …Meanwhile work on new value-adding product forms and presentations
April 6, 2004
Implications: Small farmers in developing countries need to get organized and connected
• They often lack risk capital, facilities, presence, marketing know-how and know-who, language
• They can often supply a limited number of products or varieties, over a limited timeframe
• They may not be able to police themselves to control quality, ensure food safety, deal with other standards

14
April 6, 2004
…because they have some significant weaknesses with respect to these changes.– Shortage of capital and lack of
collateral with which to borrow
– Lack of access to technology
– Difficult access to good land
– Environmental degradation, especially soils and water
– High pest/disease pressure in tropical and subtropical areas
– Inputs often not available, or late
– Power usually expensive
– Time, distance and cost to market
– Transport infrastructure and services often inadequate
– Small scale of farm units, difficulty delivering volumes needed
– Inability to speak English
– Lack of know-how and know-who for export markets
– Policy and enabling environment
– HIV/AIDS scourge
April 6, 2004
On the other hand, they do have some strengthsas well…
Vocation for agriculture
Low wage rates, and after training, low cost of labor
Good growing conditions for some crops
Extended growing season in tropical and subtropical areas
In some cases, low cost of production
Lack of options often means strong motivation
In many places, a tradition of working together (e.g. “minga” in Ecuador and Peru)
Nearness to growth market of the future for food products, which is developing countries in general, and urban markets in developing countries in particular
April 6, 2004
So small farmers can participate in supply chains, as long as they get help in:
Better understanding of markets and marketing
Identifying value chains worth developing
Streamlining the corresponding supply chains
Selecting and dealing with export catalysts & channel captains
Complying with official & commercial standards of all kinds
Generating the required volumes
Assimilating enabling technologies
Retaining & adding value once they have penetrated a market