a compendium of barriers to services...
TRANSCRIPT

A compendium of barriers to services trade*
Dr Philippa Dee Asia-Pacific School of Economics and Government
Crawford Building (13) Australian National University
Canberra ACT 0200 Australia
[email protected]; ph 61 2 6126 8598; fax 61 2 6125 0767
November 2005
Abstract:
The first purpose of this paper is to present available estimates of barriers to services trade. The second purpose is to present sufficient explanation to allow interested readers to apply the methodology to new countries or new time periods, so as to extend the available set of estimates. The paper also reviews several recent critiques of the literature, and suggests directions for further research.
JEL Classification: F13, F15, F23 Keywords : services trade, trade barriers, air passenger transport, banking, distribution, electricity generation, maritime, professions, telecommunications
* Prepared for the World Bank.

2
1 Introduction
The first purpose of this paper is to present available estimates of barriers to services trade. The second purpose is to present sufficient explanation to allow interested readers to apply the methodology to new countries or new time periods, so as to extend the available set of estimates.
Chapter 2 firstly discusses the nature of services trade barriers. It then gives sources of the available estimates and describes the general methodology used in their preparation. It also surveys two recent critiques of this methodology. Finally, it suggests directions for further research.
Chapter 3 shows how to collect the raw information about policy regimes, from which the estimates are derived. It gives details of useful information sources, and also presents an example of how such information was collected and compiled for Vietnam.
Chapter 4 describes the econometric work that has been used to trace the relationships between services trade barriers and economic outcomes. This work allows the estimation of a ‘tax’ or ‘productivity’ equivalent of services trade barriers, as a measure of their economic significance. The chapter presents and explains the formulas that have been used to derive the detailed tax and/or productivity equivalents that are presented in tables at the end of the paper.

3
2 Sources, methods and future directions
2.1 The nature of services trade barriers
Services are highly differentiated. Not only do they differ from one firm to the next, they also differ from one customer to the next. As Ethier and Horn (1991) noted, what makes services special is that they are customised to meet the needs of individual purchasers.
This means that the measurement of services trade barriers cannot assume services are homogeneous. Nor is it appropriate to use the price comparisons methodology often used to measure non-tariff barriers in goods trade, since this assumes homogeneity across borders. Strictly speaking, it may not even be appropriate to talk about a ‘tariff equivalent’, since this concept (a) assumes that services are primarily traded cross-border, and (b) often also assumes that the domestic and foreign service are perfect substitutes.
Services are often delivered face to face. This means that trade in services often takes place via the movement of primary factors of production — people or capital.
• Firstly, the consumer may move to the producer’s economy. In the language of the General Agreement on Trade in Services (GATS) under the WTO, this mode of services trade is called ‘consumption abroad’.
• Alternatively, the producer may move to the consumer’s economy. In the language of the GATS, this mode of service delivery is called the ‘movement of natural persons’ (to distinguish it from the movement of corporate or other legal entities).
• Many other services are delivered to other economies via ‘commercial presence’. The GATS also recognises commercial presence as a mode of services delivery. This has policy significance because it means that the GATS is a vehicle for negotiating foreign direct investment issues in the services area.
• Services are intangible. This means that where services are traded in the traditional ‘cross-border’ fashion, e-commerce is an important vehicle for that cross-border trade.
Three of these modes of services delivery are captured, to a greater or lesser degree of accuracy, in conventional balance of payments statistics. Commercial presence is not. There have been recent initiatives, especially by the OECD, to compile statistics on the activities of foreign affiliates (so-called FATS statistics). These and other statistics (eg

4
Karsenty 2002) suggest that reliance on balance of payments statistics alone can lead to an underestimate of services trade by more than 50 per cent.
With services traded via the movement of people or capital, the transaction typically occurs behind the border. Even when cross-border trade takes place via e-commerce, it is not easily observed by customs officials.
So services transactions are not amenable to border protection. Instead, services trade barriers are typically behind-the-border, non-price regulatory measures. Numerous examples are discussed in the next chapter.
The services trade barriers may be of two types:
• they may specifically discriminate against foreign suppliers — either against their entry, or against the nature and scope of their operations once they have entered the market.
• they may protect incumbent service providers by discriminating against all new suppliers, be they domestic or foreign — either by restricting their entry, or by restricting the nature and scope of their operations.
The GATS agreement similarly recognises that services trade barriers need not be discriminatory against foreigners. It recognises a specific list of (mostly quantitative) restrictions on ‘market access’ that are not discriminatory. Many analysts have extended the definition of ‘market access’ to cover all measures that are non-discriminatory (eg Findlay and Warren 2000). The GATS also recognises ‘derogations from national treatment’, which is GATS-speak for discriminatory restrictions.
Thus a key feature of services trade barriers is that they often protect incumbent service suppliers from any competition, be it from domestic or foreign new entrants. This is the single most important feature distinguishing services trade barriers. It has implications both for the economic effects of services trade liberalisation, and for the political economy of services trade reform. These implications are drawn out in Dee and Sidorenko (2005), for example.
Services are also an area where market failures can occur. Natural monopoly is a characteristic of some network industries such as telecommunications and air passenger transport — it may be economically inefficient to have key bottleneck facilities provided by more than one service provider, so regulation is required to prevent the abuse of this monopoly power. Information asymmetry is almost by definition a feature of professional services — the client is not in a position to judge whether the service being delivered is of reasonable quality, so licensing or accreditation requirements can help to bridge the

5
information gap. Similarly, there is a legitimate role for prudential regulation of financial services to ensure systemic stability, and for safety regulation in air passenger transport.
In these circumstances, services trade liberalisation may not deliver the anticipated benefits if it is not supported by the appropriate domestic regulatory regimes. For example, liberalising market access in financial services may not generate benefits if prudential regulation is either too heavy- or too light-handed. Similarly, allowing market entry in telecommunications may not reap benefits if new entrants cannot get access to the incumbent’s bottleneck facilities — the local loop — on reasonable terms.
The GATS recognises the right of individual governments to regulate, but requires that domestic regulatory regimes be the ‘least burdensome’ necessary to achieve their objectives. A counterexample would be a requirement for foreign health professionals to retrain in a new economy. Here the legitimate domestic objective of ensuring quality could be achieved by the less burdensome requirement to resit a qualifying examination.
The way in which services trade barrier measurement has taken account of the legitimate role of regulation is discussed in more detail in the next chapter.
While services are typically not protected by tariffs, services trade barriers may or may not be tariff-like, in the following sense. Some regulatory trade restrictions, particularly quantitative restrictions, create artificial scarcity. The prices of services are inflated, not because the real resource cost of producing them has gone up, but because incumbent firms are able to earn economic rents — akin to a tax, but with the revenue flowing to the incumbent rather than to government. Liberalisation of these barriers would yield ‘triangle gains’ in producer and consumer surplus associated with improvements in allocative efficiency, but also have redistributive effects associated with the elimination of rents to incumbents. As Dee and Hanslow (2001) demonstrate, the former effects would not be trivial, but the latter effects could also be significant. Such rent-creating restrictions are tariff-like, with the redistribution of rent having effects similar to the redistribution of tariff revenue.
Alternatively, services trade restrictions could increase the real resource cost of doing business. An example would be the above requirement for foreign service professionals to retrain in a new economy. Liberalisation would be equivalent to a productivity improvement (saving in real resources), and yield ‘roughly rectangle’ gains associated with a downward shift in supply curves. This could increase returns for the incumbent service providers, as well as lowering costs for users elsewhere in the economy.
The distinction is critical, for two reasons. First, in a unilateral or multilateral setting, rectangle gains are likely to exceed triangle gains by a significant margin, especially given the importance of the services sectors in most economies. Secondly, in the context

6
of preferential trade agreements, the danger of net welfare losses from net trade diversion arises only if the relevant barriers are rent-creating (see also Adams et al. 2003).
The way in which services trade barrier measurement has so far distinguished the two types of effects is discussed in more detail in chapter 4.
2.2 Sources
To date, most econometric studies that provide estimates of the effects of services trade restrictions have been cross-country (or panel) studies.
Essentially, the studies exploit cross-country (or panel) variation in the extent of barriers to trade in a particular services sector, and cross-country variation in the subsequent economic performance of that sector, or of the economy as a whole, to quantify a ‘cross-country average’ relationship between barriers and performance. This is then used to project the effects to an individual country, given its current level of barriers to services trade in that sector.
Because services trade barriers operate behind the border, the studies typically quantify the effects of services trade barriers on some behind-the-border measure of economic performance. The studies tend to be of two types (see tables 2.1 and 2.2 for examples).
Sectoral studies quantify the direct impact of services trade barriers on sector-specific measures of performance. These effects on performance can be levels effects (if the performance measures are in levels) or could be growth effects (if the performance measures are in growth rates — though in practice, no sectoral studies have identified growth effects). But the key to these studies is that they are sectoral, and do not measure the effects of services trade barriers for the economy as a whole. However, the first round impacts from sectoral econometric studies can provide the key inputs into computable general equilibrium (CGE) modelling, which can trace through the effects of services trade barriers on other sectors of the economy and, where a disaggregated approach is taken, can also add up the effects of services trade barriers across different services sectors.

7
Table 2.1: Sectoral studies of the effects of services trade (and other regulatory) barriers
Sector in which barriers occur
Study Sectoral performance measure
Growth or level effects
Cross-country or panel
Air passenger transport Gonenc and Nicoletti (2000) Airfares Load factors Airline efficiency
Level Cross-country
Doove et al. (2001) Airfares Level Cross-
country Banking Kalirajan et al. (2000) Net interest margin Level Cross-
country Claessens, Demirgüç-Kunt and
Huizinga (2001) Net interest margin Non-interest income Overhead expenses
Level Panel
Barth, Caprio and Levine (2002) Bank development*
Net interest margin Overhead cost Non-performing loans Prob. of bank crisis
Level Cross-country
Dee (2004a) Net interest margin Level Cross-
country Business/finance Francois and Hoekman (1999) Exports Level ? Construction Francois and Hoekman (1999) Exports Level ? Distribution Kalirajan (2000) Cost Level Cross-
country Electricity generation Steiner (2000) Price
Utilisation rates Reserve plant margins
Level Panel
Doove et al. (2001) Price Level Panel Maritime Kang (2000) Price Level Cross-
country Fink, Mattoo and Neagu (2001) Price Level Cross-
country Clark, Dollar and Micco (2001) Costs Level Panel

8
Table 2.1: (Continued)
Sector in which barriers occur
Study Sectoral performance measure
Growth or level effects
Cross-country or panel
Professions – engineering Nguyen-Hong (2000) Price
Cost Level Cross-
country Telecommunications Warren (2000) Quantity
Price Level Cross-
country Trewin (2000) Cost Level Panel Boylaud and Nicoletti (2000) Price
Labour productivity Quantity
Level Panel
Doove et al. (2001) Price Level Panel Dee (2004a) Quantity
Price Level Cross-
country Fink, Mattoo and Rathindran
(2002) Quantity Productivity
Level Panel
* Bank credit to the private sector as a share of GDP. Source: See table for references.
Economy-wide studies quantify the overall effects of services trade barriers on some economy-wide measure of performance. Again, these effects can be levels effects (if the performance measures are in levels — though in practice, no economy-wide studies have identified levels effects) or growth effects (if the performance measures are in growth rates). These studies aim to do the same ‘adding up’ job as CGE studies. But whereas CGE studies take a structural approach to spelling out how barriers in one sector flow through to other sectors and the economy as a whole, the econometric studies typically take a reduced form approach (although Francois and Schuknecht (2000) and Eschenbach and Francois (2002) have some structural elements).

9
Table 2.2: Economy-wide studies of the effects of services trade (and other regulatory) barriers
Sector in which barriers occur
Study Economy-wide performance measure
Growth or level effect
Cross-country or panel
Finance Francois and Schuknecht (2000) Per capita GDP Growth Cross-country
Eschenbach and Francois (2002) Per capita GDP Growth Panel Mattoo, Rathindran and
Subramanian (2001) Per capita GNP Growth Panel
Telecommunications Mattoo, Rathindran and
Subramanian (2001) Per capita GNP Growth Panel
Source: See table for references.
The comparison of these economy-wide econometric approaches with CGE modelling hinges on the differences between structural and reduced form approaches. CGE approaches have a higher information content, and are less testable. But econometric studies need to control for all other factors affecting performance, and to deal (where necessary) with simultaneity issues. This is easier in a panel than in a pure cross-country context. In addition, economy-wide econometric studies are subject to the Lucas (1976) critique — their estimates of flow-on costs or benefits are appropriate so long as the economy stays with the same structure, but could be highly misleading in the face of structural change. One of the main effects of reducing or removing barriers to services trade is to induce structural change.
The estimates presented in this paper come from selected sectoral studies, for several reasons. First, there are more sectoral studies to draw from. Second, sectoral studies are better able to control for all the other factors affecting economic performance, in a way that takes account of the special characteristics of each services sector. These sectors vary widely, with differing economic structures and differing regulatory objectives. By using sector-specific models of economic performance, these differences can be taken in to account.
The particular sectoral studies chosen were those that provided estimates for a wide range of countries on an easily reproducible basis. In some cases the estimates presented here differ slightly from the original studies, because the methodology has been simplified to make it more easily reproduced. The paper presents estimates for both air passenger transport and electricity generation from Doove et al. (2001), which is itself an extension of Gonenc and Nicoletti (2000) and Steiner (2000). Estimates for banking are taken from

10
Dee (2004a), which combines the approaches of Kalirajan et al. (2000) and Barth, Caprio and Levine (2002). Estimates for maritime are taken from the work by Clark, Dollar and Micco on port efficiency, itself an extension of Fink, Mattoo and Neagu (2001). Estimates for distribution come from Kalirajan (2000). Estimates for four different professions — accountancy, architecture, engineering and legal — come from Nguyen-Hong (2000).
The resulting estimates of services trade barriers cover the sectors, countries and time periods shown in table 2.3. Where a date is given for an estimate, it is roughly the date the estimate was complied. The estimate may be based in turn on policy information from earlier years.
With each estimate, information about discriminatory and non-discriminatory policies has been compiled and combined with econometric estimates of performance, to produce a price or cost impact for foreign and domestic suppliers separately. A price impact has been computed where theory or empirical evidence suggests the barriers have affected markups. A cost estimate has been computed where theory or empirical evidence suggests the barriers have affected real resource costs.
With each estimate, the price or cost impact for domestic suppliers measures the impact of non-discriminatory policies. The price or cost impact for foreign suppliers measures the impact of both discriminatory and non-discriminatory policies. The difference between the impact on domestic and foreign suppliers measures the pure margin of discrimination against foreigners.
2.3 Methods
The methodology used to quantify barriers to services trade is that applied to a number of services sectors in Findlay and Warren (2000). There are two key steps.
The first step is to convert qualitative information about regulatory restrictions into a quantitative index (or indexes), using a priori judgements about the relative restrictiveness of different barriers. This is generally less contentious within a given category of barrier than between. For example, it makes sense to score a regime that restricts foreign ownership to 25 per cent or less as being twice as restrictive as one that restricts foreign ownership to 50 per cent or less. What is less obvious is how to weight the scores on foreign ownership restrictions together with those on licensing requirements, or those on restrictions on lines of business. Nevertheless, some of the inherent arbitrariness of the weighting procedures can be tested empirically at the next stage.

11
Table 2.3: Coverage of services trade barrier estimates
Country
Air passenger transport Banking
Distrib- ution
Electricity generation
Maritime - ports
Pro- fessions*
Tele- communications
Albania 2003 1997 2003
Algeria 1997 Angola 1997 Argentina yes 1997 1999 1999 2001 AArE
1999 1997
Armenia 1997 Australia yes 1997
2005 1999 2005
1999 2001 AArEL 1999
1997 2005
Austria yes 1997 1999 1999 AArEL 1999
1997
Azerbaijan 1997 Bahrain 1997 Bangladesh 1997 Barbados 1997 Belarus 1997 Belgium yes 1997 1999 1999 2001 AArEL
1999 1997
Belize 1997 Benin 1997 Bhutan 1997 Bolivia 1999 2001 1997 Bosnia 1997 Botswana 1997 Brazil yes 1997
2004 1999 2004
1999 2001 AArE 1999
1997 2004
Brunei 2001 1997 Bulgaria 2003 2001 1997
2003 Burkina Faso 1997 Burundi 1997 Cambodia 1997 Cameroon 1997 Canada yes 1997 1999 1999 2001 AArEL
1999 1997
Cape Verde 1997 Central African Rep
1997
Chad 1997 Chile yes 1997
2004 1999 1999 2001 AArE
1999 1997, 2004
China yes 1999 2001 1997 Hong Kong yes 1997 1999 1999 2001 AArEL
1999 1997
Colombia yes 1997 1999 1999 2001 A 1999 1997 Costa Rica 2001 1997 Cote d'Ivoire 1997 Croatia 2003 Cyprus 1997
Continued

12
Table 2.3: (Continued)
Country
Air passenger transport Banking
Distrib- ution
Electricity generation
Maritime - ports
Pro- fessions*
Tele- communications
Czech Republic
1999 2001 1997
Denmark yes 1997 1999 1999 2001 AArEL 1999
1997
Djibouti 1997 Ecuador 2001 1997 Egypt 2001 1997 El Salvador 2001 1997 Estonia 2004 1997
2003 Ethiopia 1997 Fiji 1997 Finland yes 1997 1999 1999 2001 AArEL
1999 1997
France yes 1997 1999 1999 2001 AArEL 1999
1997
Gabon 1997 Germany yes 1997 1999 1999 2001 AArEL
1999 1997
Ghana 2001 1997 Greece yes 1997 1999 1999 2001 AArEL
1999 1997
Guatemala 1997 Guinea 1997 Guinea Bissau
1997
Guyana 1997 Honduras 1997 Hungary 1999 2001 1997 Iceland 1999 1997 India yes 1997 1999 1999 2001 AArEL
1999 1997
Indonesia yes 1997 1999 1999 2001 AArEL 1999
1997
Iran 1997 Ireland yes 1997 1999 1999 2001 AArE
1999 1997
Israel 1997 Italy yes 1997 1999 1999 2001 AArEL
1999 1997
Jamaica 1997 Japan yes 1997
2005 1999 2005
1999 2001 AArEL 1999
1997 2005
Jordan 1997 Kazakhstan 1997 Kenya 1997 Korea Rep yes 1997 1999 1999 2001 AArEL
1999 1997
Kyrgyzstan 1997 Continued

13
Table 2.3: (Continued)
Country
Air passenger transport Banking
Distrib- ution
Electricity generation
Maritime - ports
Pro- fessions*
Tele- communications
Latvia 2004 1997 2003
Lithuania 2004 1997 2003
Luxembourg yes 1997 1999 1999 AArEL 1999
1997
Macedonia 2003 2003 Madagascar 1997 Malawi 1997 Malaysia yes 1997
2003 1999 1999 2001 AArEL
1999 1997 2002
Maldives 1997 Mali 1997 Malta 1997 Mauritania 1997 Mauritius 2001 1997 Mexico yes 1997 1999 1999 2001 AArEL
1999 1997
Moldova 2003 2003 Morocco yes 2004 2004 2004 E 2004 1997
2004 Mozambique 1997 Namibia 1997 Nepal 1997 Netherlands yes 1997 1999 1999 2001 AArEL
1999 1997
New Zealand yes 1997 1999 1999 2001 AArEL 1999
1997
Nicaragua 1997 Niger 1997 Nigeria 2001 1997 Norway yes 1999 1997 Oman 1997 Pakistan 1997 Panama 1997 PNG 1997 Paraguay 1997 Peru yes 1997 1999 1999 2001 A 1999 1997 Philippines yes 1997 1999 1999 2001 AArEL
1999 1997
Poland 1999 2001 1997 Portugal yes 1997 1999 1999 2001 AArEL
1999 1997
Qatar 1997 Romania 2001 1997
2003 Russian Fed yes 2004 2004 1999 2001 E 2004 1997
2004 Saudi Arabia 1997
Continued

14
Table 2.3: (Continued)
Country
Air passenger transport Banking
Distrib- ution
Electricity generation
Maritime - ports
Pro- fessions*
Tele- communications
Senegal 1997 Serbia & Montenegro
2003 2003
Sierra Leone 1997 Singapore yes 1997 1999 1999 2001 AArEL
1999 1997
Slovak Rep 1999 2001 1997 Solomon Is 1997 South Africa yes 1997 1999 1999 2001 AArE
1999 1997
Spain yes 1997 1999 1999 AArEL 1999
1997
SriLanka 1997 Swaziland 1997 Sweden yes 1997 1999 1999 2001 AArEL
1999 1997
Switzerland yes 1997 1999 1999 AArEL 1999
1997
Syria 1997 Tajikistan 1997 Taiwan 1999 2001 Tanzania 1997 Thailand yes 1997
2004 1999 2004
1999 2002
2001 AArEL 1999
1997 2004
Togo 1997 Trinidad & Tobago
1997
Tunisia 1997 Turkey yes 1997 1999 1999 2001 AArEL
1999 1997
Uganda 1997 Ukraine 2001 1997 United States yes 1997 1999 1999 2001 AArEL
1999 1997
United Arab Emirat
1997
United Kingdom
yes 1997 1999 1999 2001 AArEL 1999
1997
Uruguay yes 1997 1999 1999 1997 Uzbekistan 1997 Venezuela yes 1997 1999 1999 2001 1997 Vietnam yes 2004 2004 1999
2004 2001 AArEL
2004 1997 2004
Zambia yes 2004 2004 2004 E 2004 1997 2004
Zimbabwe 2001 1997 * A = accountancy, Ar = architectural, E = engineering, L = legal. Source: See tables at end of document.

15
The second step is to develop an econometric model and use it to estimate the effect of the services trade restrictiveness index(es) on some measure of economic performance (typically price, cost, price-cost margin, quantity or productivity), while controlling for all the other factors that might affect performance in that industry. The appropriate control variables obviously vary from one sector to the next.
It is also possible to use the econometric stage to test the weighs that were assigned a priori to different categories of restrictions in the first stage, essentially by reestimating them. This is done by entering the index scores for the different categories of restrictions separately into the estimating equation. The studies that have achieved the most in this regard so far are Nguyen-Hong (2000) for the professions and Dee (2004a) for telecommunications..
Often this approach is precluded by one of two econometric problems — multicollinearity, or lack of in-sample variation in one or more of the restrictiveness index components. However, the regulatory work by the OECD (Gonenc and Nicoletti 2000, Boylaud and Nicoletti 2000, Steiner 2000) is suggestive of how factor analysis (of which principal components is an application) could be used to overcome these problems. Prior to any econometric estimation, they used factor analysis to identify a set of orthogonal ‘factors’ that explained most of the variation in their original data on regulatory restrictions. But as Doove et al. (2001) point out, high cross-country variation in restrictions may have little or no relationship with the relative economic importance of particular restriction categories:
… the use of factor analysis could lead to paradoxical results — in the sense that the more important restrictions, if they were applied widely and consistently across countries, could also have low cross-country variation and thus low factor analysis weights. (p. 17)
If, instead, principal components were used as the method of econometric estimation, then problems of multicollinearity would be overcome and orthogonal linear combinations of individual restrictions could be identified that explained most of the variation in economic outcomes — a truer measure of economic significance. To date, however, no study has used this methodology.
Once the econometric estimation is completed, the ‘on-average, per unit’ effects of services trade restrictions are given by the estimated coefficients. Total, country-specific measures of economic impact (equivalent to vertical shifts in supply or demand curves) can be calculated by multiplying the coefficient(s) by their associated restrictiveness index measures for that country. The latter measures can also be turned into ‘tax equivalent’ or ‘productivity equivalent’ measures for that country (where the base for the
16
calculation can similarly be price, cost or some other measure). These give the direct impact of services trade reform on the particular sector in question.
The first thing to note about the methodology is that it can be generalised fairly easily to include additional countries or additional time periods. Once a coefficient estimate has been obtained from a particular sample, all that is required for additional countries or time periods is to produce an index score to characterise the services trade restrictions at that point in time, and the new ‘tax equivalents’ or ‘productivity equivalents’ can be calculated from the existing coefficient and the new index score without redoing the econometrics. Obviously, the original sample needs to be fairly representative for such ‘out-of-sample forecasting’ to be appropriate. Many of the studies in table 2.1 include, at minimum, the APEC economies, the members of the European Union, and often key economies from the rest of the world (eg Switzerland, Turkey, India, South Africa).
A second advantage of the methodology is that it produces estimates of the effects of trade barriers that are explicitly linked to characterisations of the restrictions themselves, rather than being generated as an ‘unexplained residual’ (as in Francois and Hoekman 1999).
While it would be desirable to use information about every conceivable barrier affecting trade in a particular service in these exercises, this is not always possible. Where the index measures of services trade barriers are to be used in an econometric model, issues of comparability also arise. It would be inappropriate to use a dataset that showed a particular country to be very liberal (or very illiberal), simply because information on some barriers to services trade were unavailable for that country. Hence, the trade restrictiveness indexes used in econometric exercises may not be fully comprehensive, but they generally measure a broad range of barriers for which comparable data are available for all the countries in the sample.
2.4 Critiques
As noted, the methodology for measuring the direct effects of services trade restrictions within a particular sector relies solely or primarily on cross-country variation in policy settings, and the resulting cross-sectional variation in sectoral performance. This means that, when quantifying the price or cost impact for a particular country, the assumption is being made that the country conforms to the sample average responsiveness of performance to policy settings. In reality, there can be country-specific factors (captured in the error term of the regression) that are likely to play an important role. One important direct for future research, therefore, will be to develop panel datasets with a time dimension, so that country-specific characteristics can be more readily identified.

17
Ideally, the econometric models of sectoral performance used to quantify direct effects should be both developed and estimated at the structural level — that is, supply and demand side influences should be separately identified and estimated. In particular, the estimation should control for the quantity of the service produced. When a quantity control is used, the effects of trade barriers on price or cost can be interpreted unambiguously as vertical shifts in the demand or supply curve.
In practice, some models are developed structurally but then estimated in reduced form. For example, this is the case with the model of banking sector financial intermediation. Other models are both developed and estimated in reduced form, as is the case with the model of performance in electricity generation (which is primarily a supply-side model based on technical characteristics). This means that it is not always possible to identify supply and demand side influences separately, so it is not always clear that the price or cost wedge that is being estimated in fact corresponds to a vertical shift in the supply or demand curve. On this score, at least, the direct effects may be being underestimated.
As noted, the restrictiveness indices are in many ways crude measures of services policy, which is typically multidimensional. Even where there is enough in-sample variation to enter sub-indexes into the econometrics separately, the sub-indexes will lump together measures which may not be comparable in their economic impact.
Finally, there may be multiple dimensions to economic performance that are not always captured. An example is in electricity generation, where there are both static and dynamic considerations. Prices or costs may be measures of static performance at a point in time. But in the longer term, lower prices may reduce the incentives for investment in infrastructure. So not only are there multiple measures of performance, there can be tradeoffs between them.
There have been two recent critiques of the services trade barrier measurement methodology, by Whalley (2004) and Deardorff and Stern (2005). In my view, Whalley pays insufficient attention to the importance of non-discriminatory trade restrictions, to the importance of high levels of differentiation in services such as the professions, health and education, and too easily slips into making direct but inappropriate comparisons with the literature on tariffs and goods trade.1 But he does state that
Market structure, conduct and performance are all key and all need to be evaluated when discussing quantitative impacts of global liberalisation of services trade on poorer developing countries. (p. 1232)
1 ‘Price based measures of barriers to services trade … ideally … should reflect differences between domestic and foreign prices for key service categories across supplying and using countries’. (Whalley 2004, p. 1238).

18
The work to date on measuring barriers to services trade has been firmly in the structure-conduct-performance framework, as originally identified by Findlay and Warren (2000).
Beyond his generalised negative tone, Whalley makes the following specific criticisms of services trade barrier measurement.
First, he notes that with multiple restraints on trade it is not clear which restrictions are binding and which are not. This argues for continuing efforts to separate out the different dimensions of trade barriers and to enter them separately into the econometric models of sectoral performance.
Second, he notes that the marginal effects of different restrictions on trade will typically differ. This also argues for continuing to separate out the different restrictions in econometric work.
Third, he notes that there may be country discrimination in the application of barriers, even though both de jure and de facto discrimination are breaches of national treatment under the GATS. The literature has so far dealt with this by explicitly identifying both discriminatory and non-discriminatory measures, using policy information sources that go well beyond GATS schedules. Work has also begun on documenting the content of services trade commitments in regional trading arrangements, so as to identify deviations from most favoured nation treatment.
Whalley states that quantity-based measures are ‘typically based on model-generated residuals given by observations relative to econometric model predictions’ (p. 1239). In reality, Francois and Hoekman (1999) is the only study in table 2.1 to use this approach.
Finally, Whalley presumes that international price comparisons are the appropriate way to generate price-based measures of barriers to services trade, but notes that ‘price differences across countries for services need not be related to barriers, even if they could be measured’ (p. 1239). As stated at the beginning of this chapter, the highly differentiated nature of services makes direct international price comparisons an inappropriate tool. So the literature has not used this approach, but has instead undertaken behind-the-border studies of market structure, conduct and performance to generate its price or cost impacts, controlling for a range of other factors that affect prices or costs.
Deardorff and Stern (2005) also pay insufficient attention to the critical importance of non-discriminatory trade barriers in services trade. This seems to be the fundamental reason why they assert that the appropriate way to model services trade barriers is as a tariff equivalent — all the examples they give to demonstrate that a tariff equivalent is an appropriate concept are examples of discriminatory trade barriers.

19
Deardorff and Stern, like Whalley, note that if the econometric models are not structural enough to have controlled for the effects of services quantities, then estimates of the elasticities of supply and demand would be required to covert the price impacts from econometrics into vertical shifts in supply or demand curves. A solution to this issue, discussed in more detail below, is to begin to control for quantities in the econometric work.
Deardorff and Stern discuss the issue of assigning weights in a restrictiveness index by judgement or by factor analysis. They state that
[Judgement] may well be the best approach if the investigator really is knowledgeable, as in the case when an index is being constructed for a specific narrowly defined industry.
An alternative … is to apply factor analysis to the data …This is a purely statistical technique that is not, in our view, necessarily an improvement on the use of judgement weights. (p. 569)
Deardorff and Stern provide guiding principles for measuring barriers to services trade. They note first that no single methodology is sufficient for documenting and measuring barriers to trade in services. Instead, investigators need to draw upon all available information, including both direct observation of particular barriers and indirect inference of barriers using data on prices and quantities. These approaches are reflected in chapters 3 and 4 that follow.
Deardorff and Stern also note that because of the special role of incumbent firms in many services industries, regulations do not need to be explicitly discriminatory against foreign firms in order to have discriminatory effects.
This observation is true, but it misses the economic significance of non-discriminatory barriers against potential domestic new entrants. In most developing countries, indigenous firms have significant supply capability, and can compete against foreign new entrants by differentiating their services and targeting particular market niches. In banking, for example, foreign banks may specialise in servicing the local affiliates of foreign multinationals in manufacturing, while local banks specialise in rural or retail finance. Indigenous law firms have a natural advantage in practising home country law. Any analysis of services trade barriers that misses the barriers against potential domestic new entrants will miss the gains to those entrants when barriers are lifted, and will give a distorted view of who gains and who loses from services trade reform. Again, some of these themes are explored in Dee and Sidorenko (2005).

20
2.5 Future directions
Work on measuring barriers to services trade has suffered from sins of omission and sins of commission.
Sins of omission
The critique of Deardorff and Stern (2005) confirms that a sector by sector approach to measuring barriers to services trade is the best way to proceed. Whalley (2004) confirms that the sectoral evaluations should occur in a way that takes account of structure, conduct and performance. Experience suggests that for any given sector, there will be a combination of one-off and ongoing information sources that can be found to provide information about current policy settings on an indicative, if not always comprehensive basis. As will be explained below, a slight change of focus is required when finding measures of performance.
To date, the sectoral coverage of available estimates is inadequate. In particular, the key service sectors of insurance, education, health, construction and tourism are missing. For education, some information about policy regimes in a number of countries has already been collected (Nguyen-Hong and Wells 2003), but the impact of these regimes on performance has yet to be analysed. It would require collecting data on measures of performance in education, much of which is available from the OECD. And since education is one of the few services that is traded via all four modes of delivery, the analysis should yield some interesting insights into how trade barriers can drive inter-modal substitution.
For other sectors, information on policy regimes has yet to be collected. But the World Bank website has sectoral questionnaires for a range of services sectors that already map out the content of the policy information required. Further, the Worldscope database that has proved a fruitful source of performance data for a range of sectors (banking, distribution, engineering) also has performance data on a range of other sectors, and has particularly good performance data on insurance.
Further work is also required to track how services trade barriers are changing over time. Initial experience suggests that the regimes in telecommunications and financial services have been changing rapidly, while those governing distribution and the professions are far more static. The regimes affecting air passenger transport have also probably been changing fairly rapidly, although it has so far been difficult to obtain information about the current content of air service agreements. Nevertheless, the International Civil Aviation Organisation is about to release new information on this, so an update of performance in air passenger transport will soon be possible.

21
A research priority should be to update information about policy regimes comprehensively across a range of countries. This is required to track progress on services trade liberalisation. Even more valuable, however, would be to update both the measures of policy and the measures of performance. This would allow the estimation of the costs of trade barriers to be done in a panel context. With panel data, it would be possible to control for unobserved heterogeneity across countries, and thus achieve more robust and reliable estimates.
Sins of commission
To date, the single biggest determinant of the projected gains from services trade liberalisation is whether the trade barriers are modelled as affecting markups or affecting real resource costs. This ‘treatment’ effect often dominates the estimated ‘height’ of the trade barrier, and accounts for some of the variation in modelling outcomes observed by Whalley (2004).
This treatment effect also means that the economic significance of current barriers to services trade cannot be gauged simply by comparing the ‘heights’ of the price and cost impacts listed in the tables at the end of this paper. As noted earlier, the cost impacts have much greater implications for economic welfare than the price impacts. Economic modelling is required to trace through the implications of the barriers for economy-wide resource allocation and for economic welfare.
As chapter 4 shows, whether barriers create rents or add to resource costs is severely under-researched currently. In some cases, the empirical evidence is suggestive, but not conclusive because only one performance measure has been used. In other cases, a price impact is estimated, and then it is simply asserted whether the effect operates through price-cost margins or whether it operates through costs.
To establish this properly requires using more than one measure of economic performance. Specifically, it requires estimating both a profit function and a cost function, and determining the effects of trade barriers on both measures of performance. Only then can it be teased out whether the effects of trade barriers are operating through price-cost margins or through marginal costs. Berger, Cummins and Weiss (1997) show how this approach has been applied to performance in the insurance industry.
A second advantage to estimating profit and cost functions is that both are structural, and correct for output quantities. This would help to overcome the critique outlined earlier about the reduced form nature of most of the work to date.
Doing such analysis requires using datasets that provide data on prices and quantities separately. Only then can profit and cost functions be estimated. To date, most datasets

22
used for analysis have been accounting datasets. These provide values, not prices and quantities. However, the Worldscope database provides considerable additional information for the banking and insurance sectors, in addition to its usual accounting data, and would be an adequate source for proper estimation of cost and profit functions for these sectors. For other sectors, alternative databases may need to be found, or additional data sought on prices, that can be used to split the accounting data into its price and quantity components.
Reestimating the direct effects of services trade barriers in a cost and profit function framework would also provide an opportunity to split out the different dimensions of policy into separate sub-indexes.
Dissemination
In summary, sectoral studies are required that combine the collection of data on policy settings with an evaluation of its effect on sectoral performance behind the border, in more than one dimension. The most promising initial directions for new research have already been noted.
The results of current and future studies also need to be disseminated more widely, particularly to facilitate the modelling evaluation of trade barriers, given that price and cost impacts cannot be compared directly.
Given that the general methodology in outlined in this paper can be easily extended to additional countries and time periods, dissemination could usefully involve an open-source dimension. Not only should the tables at the end of this paper be made available on line, but the corresponding excel spreadsheets with embedded formulae should also be made available, so that researchers around the world can easily enter policy data for new countries and time periods, and generate the corresponding price or cost impacts automatically.

23
3 Compiling information about regulatory policies
3.1 Recognising a legitimate role for regulation
Because the services sector is an area where market forces alone may not deliver the most efficient or equitable outcomes,2 such measures may be part of a broader domestic regulatory regime designed to address market failures or to meet legitimate social policy objectives. But in many countries, such measures may also suppress competition, whether or not this was intended.
A key methodological issue at the outset is how to distinguish between services restrictions that are protective and those that are designed to meet legitimate economic or social policy objectives. The literature takes one of three possible approaches.
The first approach is to decide a priori which policy measures are designed to meet legitimate economic or social policy objectives, and to exclude them from the analysis at the outset. Thus, for example, the estimates in this paper exclude those policy measures in air passenger transport designed to ensure the safety of passengers, and those technical regulations in electricity generation and transmission designed to ensure the integrity of the transmission network. Similarly, licensing per se is not necessarily treated as a restriction, but only when the licensing is not automatic or the qualification criteria are judged to be unduly restrictive. The early work on the effects of regulatory measures in banking services excluded prudential regulation, since it was designed to ensure systemic stability.
The second approach is to treat regulation on a continuum, and to ask the question whether the current level of regulation is ‘too little’ or ‘too much’. Empirically, this is accomplished by allowing for a non-linear relationship between regulation and performance, and then identifying at what point the degree of regulation has the least adverse incidental effect on economic performance. For example, port services such as pilotage and towage can help to reduce costs, but eventually, having too many mandatory port services can start to add to costs. This paper draws on analysis of port costs that identifies what level of mandatory servicing minimises costs. The approach to identifying the optimal regulatory regime in electricity generation is similar, although there the regulatory choices are binary rather than continuous.
2 For example, natural monopoly is a feature of many network infrastructure industries, and the problem of asymmetric information characterises many professional services.

24
The final approach is to avoid prejudging the issue, to include all regulatory measures in the analysis, and to identify whether they have an adverse effect on some measures of economic efficiency. It is useful to policy makers to know this effect, even when the measures have a legitimate social or other objective. But if the cost to economic efficiency is found to be high, the appropriate policy conclusion need not be that the regulatory measure be removed. It could instead be that some other, less burdensome method be found to achieve that objective. For example, cross-subsidisation is often used in the telecommunications industry as a way of ensuring universal service on reasonable terms, but cross-subsidisation can also be a major impediment to achieving competition and lower prices generally. The regulatory solution can be to phase out cross-subsidisation so as to allow the development of competition, but to find other mechanism (such as having all services providers, not just the incumbent, make financial contributions) so as to fund universal service.
It is important to keep this final interpretation in mind when considering the services trade barrier estimates presented here. Even when regulatory measures are designed to address social obligations, it is relevant to know the incidental economic cost of those measures, and to ask whether there are better ways to achieve the underlying objectives.
All these approaches are of necessity incomplete. Ideally, the quantification process should identify the effects of services sector regulations, not just on economic outcomes such as prices or costs, but also on the social, environmental or safety outcomes that the regulations may be also designed to address. With this more complete information, the tradeoff between economic efficiency and other objectives could be evaluated directly. The difficulty is in coming up with a modelling framework that can evaluate both economic and other social, environmental or safety outcomes. The current frameworks, which focus on economic outcomes, can help in the policy evaluation process. But they do not replace the need for judgement.
3.2 Compiling information
Air passenger transport
For more than 50 years, a system of bilateral air services arrangements among economies has regulated various aspects of aviation production and trade, largely outside the multilateral framework of trading rules. The bilateral system developed because international air flights require international cooperation to provide the necessary infrastructure and air traffic rights. However, the bilateral system has also created various limits on competition and trade in aviation services. Some economies have recognised the

25
costs of these restrictions in terms of higher costs and prices, and substantially liberalised air service arrangements, or made commitments to do so.
A recent OECD study (Gonenc and Nicoletti 2000) examined the effects that the provisions of bilateral air service agreements had on the prices of air passenger transport. That study was recently extended to a number of non-OECD countries by Doove et al. (2001).
Index measures of the degree of restrictiveness of the provisions in air service agreements were complied from the following four characteristics of air services agreements.
• Designation requirements, which limit the number of airlines providing services on a particular route. The score is successively higher if there are (i) no limits, (ii) if each economy may designate more than one airline to operate the service, (iii) if each economy may designate more than one airline to operate the route, but if only one airline is allowed on specific routes, and (iv) if each economy permits only one airline to provide the service.
• Capacity regulation. Scores are successively higher if there is (i) free determination, where the economies agree not to impose unilateral restrictions except for general safety and technical reasons, (ii) Bermuda 1 restrictions, where airlines act separately to determine capacity, with ex post government monitoring and review, (iii) hybrid determination, involving some mix of the other provisions, and (iv) predetermination, where an agreement on capacity is reached by both economies before airline operations begin.
• Price regulation. Scores are successively higher if there is (i) no approval process (ii) a double disapproval process, whereby airfares are allowed unless they are disapproved by both economies, (iii) a country of origin method, where an economy may disapprove airfares only for flights from its own territory, and (iv) a double approval process, where proposed airfares require the approval of both economies.
• Regulation of non-scheduled services. Scores are successively higher if (i) there are explicit traffic rights for non-scheduled services, including charter services or (ii) there are no formal traffic rights for such services.
These measures are border measures, but can inhibit the performance of domestic national flag carriers as much as they can foreign airlines, by restricting the extent to which both can achieve network economies.

26
Table 3.1: Bilateral index for international air passenger transport
Restriction category Specific score Weights* Weighted score
Designation requirements Single designation 1.00 0.24 0.24 Multiple designation with route limitations 0.67 0.16 Multiple designation 0.33 0.08 No requirements 0.00 0.00Capacity regulation Predetermination 1.00 0.24 0.24 Hybrid 0.67 0.16 Bermuda 1 0.33 0.08 Free determination 0.00 0.00Price regulation Double approval 1.00 0.27 0.27 Country of origin approval 0.67 0.18 Double disapproval 0.33 0.09 No requirements 0.00 0.00Non-scheduled services No formal traffic rights for charter services 1.00 0.22 0.22 Explicit traffic rights for charter services 0.00 0.00 Regulatory maximum score** 0.97* Weights are the relative squared factor loadings from factor analysis, as estimated by Gonenc and Nicoletti (2000). ** The maximum score is 0.97 rather than 1.0 because Doove et al. (2000) omit a small component from the analysis of Gonenc and Nicoletti (2000) attributable to market structure rather than regulation. Source:Doove et al. (2001).
The weightings used to convert qualitative information about these characteristics into a quantitative index are shown in table 3.1. This weighting scheme is used to compute a bilateral index score for each air service agreement with each bilateral partner separately, as shown in tables A2 to A46 at the end of this document.3
The raw information on air services agreements used by Goncenc and Nicoletti (2000) and Doove et al. (2000) came from two documents from the International Civil Aviation Organisation (ICAO 1988, 1995) which are by now rather dated.4 Some of the agreements in those sources will have become defunct or been replaced, some will have been amended by subsequent memoranda of understanding, and some may still persist in
3 The results in these tables differ slightly from those in Doove et al. (2001) because a few more countries and bilateral routes are covered, and because a small mistake in the calculation of the indices has been corrected. As a result of the correction, the price impacts reported in the tables are about 1 to 2 percentage points higher than the comparable estimates in Doove et al. (2001). 4 The ICAO has yet to release a more updated publication, although one is imminent.

27
their original form. Hence it is unclear what the actual policy time frame is for the information taken from these sources. Table A1 at the end of this document shows how to extract the relevant information from these ICAO sources, while the information itself is shown on tables A2 to A46.
Doove et al. (2001) note that the ICAO information may also be incomplete. Some economies may choose not to register informal or confidential arrangements with the ICAO, particularly the allocation of capacity. The ICAO sources also exclude plurilateral and regional air service agreements in their coverage. Doove et al. (2001) also used the following sources of information:
• The APEC Transport Working Group (1999) for information on APEC bilateral arrangements;
• US Department of State (2001) for information on US ‘open skies’ agreements;
• OAS Trade Information Unit for information on air transport policies in South American economies;
• DTRD (1998) and PC (1998) for information on Australia’s air services agreements; and
• Button, Haynes and Stough (1998) for information on European air transport arrangements.
Example
The methodology outlined in table 3.1 can be illustrated in the case of Vietnam. The Air Services Group of the APEC Transport Working Group provides relatively recent information about Vietnam’s air service agreements. The Air Services Group achieved APEC-wide consensus for eight priorities for reform of international aviation, which were endorsed by APEC leaders in Auckland in 1999. These included giving consideration to relaxing the ownership and control requirements when considering designation made by partners, considering multiple designation, removing or easing tariff regulations and considering double disapproval regimes, and allowing non-scheduled services.
Since then, some APEC countries have filed country reports to the Air Services Group outlining their progress in achieving these priorities. Vietnam’s reports to this forum suggest that its air services agreements were recently characterised by multiple designation, predetermination of capacity, dual approval of air fares, and with no formal provision for charter services (although these could be approved on an ad hoc basis, in instances where they did not compete with scheduled services) (APEC Air Services Group 2002).

28
On this basis, Vietnam’s current regime can be given a bilateral index score of (0.08 + 0.24 + 0.27 + 0.22) = 0.81 (see also table A45). The next chapter describes the econometric work that allows this index score to be converted into an impact on economic performance.
For other economies not listed in tables A2 to A46, it may be possible to extract the relevant information from the original ICAO sources.
Banking
The estimates of barriers to trade in banking services are taken from the study by Dee (2004a). This study extended the trade-focused work of Kalirajan et al. (2000), firstly by controlling for the effects of prudential supervision as in Barth, Caprio and Levine (2002) (see the next chapter for details), and also by extending the sample to include South East European countries.
The study used information on trade policies as outlined in table 3.2, adapted from McGuire and Schuele (2000). Information is collected about restrictions affecting domestic and/or foreign operators regarding:
• number of bank licences;
• equity participation;
• joint ventures (foreign banks only);
• raising of funds by banks;
• lending of funds by banks;
• prohibitions on other lines of business (eg insurance, securities);
• number of bank outlets;
• temporary or permanent movement of people (foreign banks only).
This information is then used to construct two restrictiveness indexes. The index of barriers to domestic entrants measures the effects of non-discriminatory restrictions affecting both domestic and foreign operators. The index of barriers to foreign entrants adds to this the effects of discriminatory restrictions against foreign operators. Thus the difference between the domestic and the foreign index gives a preliminary measure of the pure margin of discrimination against foreign operators.

29
Table 3.2: Banking restrictiveness indexes
Weight - foreign index
Weight - domestic index Score Restriction
Restrictions on commercial presence
0.1900 0.1900 Licensing 1.00 Issues no new banking licenses 0.75 Issues up to 3 new banking licenses with only prudential restrictions 0.50 Issues up to 6 new banking licenses with only prudential restrictions 0.25 Issues up to 10 new banking licenses with only prudential restrictions 0.00 Issues new banking licenses with only prudential restrictions
0.1900 0.1900 Direct Investment
The score will be inversely proportional to maximum equity participation permitted in an existing domestic bank. For example, ownership to a maximum of 49 per cent of a bank would receive a score of 0.51.
0.0950 0 No new licenses and JV arrangements
1.00 Issues no new banking licenses and no entry is allowed through a joint venture with a domestic bank
0.50 Bank entry is only through a joint venture with a domestic bank
0.00 No requirement for a bank to enter through a joint venture with a domestic bank
0.0190 0 Movement of People - Permanent
1.00 No entry of executives, senior managers or specialists
0.80 Executives, specialists and/or senior managers can stay a period of up to 1 year
0.60 Executives, specialists and/or senior managers can stay a period of up to 2 years
0.40 Executives, specialists and/or senior managers can stay a period of up to 3 years
0.20 Executives, specialists and/or senior managers can stay a period of up to 4 years
0.00 Executives, specialists and/or senior managers can stay a period of more than 5 years
Other Restrictions
0.1425 0.1425 Raising funds by banks 1.00 Banks are unable to raise funds from domestic sources 0.75 Banks are restricted from raising funds from domestic capital markets
0.50 Banks are restricted in accepting deposits from the public, or face interest rate controls
0.00 Banks can raise funds from any source with only prudential restrictions
Continued

30
Table 3.2: (Continued) Weight - foreign index
Weight - domestic index Score Restriction
Lending funds by banks
0.1425 0.1425 1.00 Banks are not permitted to lend to domestic clients
0.75 Banks are restricted to specified lending size or lending to Government projects
0.5 Banks are restricted in providing certain lending services such as leasing, credit cards and consumer finance
0.25 Banks are directed to lend to certain sectors such as housing and small business
0.00 Banks can lend to any source with only prudential restrictions
0.0950 0.0950 Other business of banks - insurance and securities services 1.00 Banks can only provide banking services
0.50 Banks can provide banking services plus one other line of business - insurance or securities services
0.00 Banks have no restrictions on conducting other lines of business
0.0475 0.0475 Expanding operations - street branches, offices and ATMs 1.00 One banking outlet with no new banking outlets permitted 0.75 Number of bank outlets is limited in number and location
0.25 Expansion of banking outlets is subject to non-prudential regulatory approval
0.00 No restrictions on banks expanding operations
0.0095 0 Movement of people - Temporary 1.00 No temporary entry of executives, senior managers and/or specialists
0.75 Temporary entry of executives, senior managers and/or specialists up to 30 days
0.50 Temporary entry of executives, senior managers and/or specialists up to 60 days
0.25 Temporary entry of executives, senior managers and/or specialists up to 90 days
0.00 Temporary entry of executives, senior managers and/or specialists over 90 days
0* 0 Movement of people - Board of Directors
1.00 Board cannot comprise of foreigners 0.00 No restrictions on the composition of the board of directors
The score is inversely related to the percentage of the Board which can comprise of foreigners. For example, if 20% of a BOD can comprise of foreigners they would receive a score of 0.80.
0.9310 0.8075 Total
* Weight was 0.019 in McGuire and Schuele (2000). Source: Dee (2004a).

31
The restrictiveness index calculations differ from those in McGuire and Schuele (2000) by giving zero weight to two types of restrictions considered by them in their study — restrictions on the composition of the board of directors, and information about MFN exemptions. This is because the information on these categories were unavailable for the South East European countries added in Dee (2004a). Accordingly, they were excluded from the index measures for all countries in that study. This also explains why the maximum score for the foreign index in table 3.2 is 0.9310 rather than 1.00.
The original study by McGuire and Schuele (2000) used the following information sources to compile the banking restrictiveness indexes:
• WTO (World Trade Organisation) Trade Policy Reviews, which describe the financial regulatory structures, trade restrictions and trade policies for WTO members. These are now available at the WTO website at http://www.wto.org/english/tratop_e/tpr_e/tpr_e.htm.
• The National Trade Estimates (NTE) Report on Foreign Trade Barriers from the Office of the US Trade Representative (USTR), which covers information on restrictions for most economies. These are now available at http://www.ustr.gov/Document_Library/Reports_Publications/Section_Index.html.
• APEC Individual Action Plans (IAPs), which list restrictions and liberalising commitments in reports covering services, investment, competition and deregulation. These are now available at http://www.apec-iap.org/ for APEC member countries (Australia, Brunei, Canada, Chile, China, Hong Kong, Indonesia, Japan, Korea, Malaysia, Mexico, New Zealand, Papua New Guinea, Peru, Philippines, Russia, Singapore, Chinese Taipei, Thailand, United States, Vietnam).
• A Common List of Barriers to Financial Services Trade report prepared by the WTO Financial Leaders Group, which gives a list of restrictions on trade in financial services for Asian and South American economies (FLG 1997).
• Information provided by Indonesia, Korea and Thailand to the IMF as a requirement for receiving standby credit, which outlines the structure of and developments in financial services sectors. Such communications are now at http://www.imf.org/external/np/loi/mempub.asp?view=loi&sort=cty.
• The TradePort web site, which covers information on restrictions for most economies.
The FLG report was a one-off report. The country market research reports on the Tradeport website are no longer freely available. The other information sources remain invaluable sources for collecting the information required to compile banking restrictiveness indexes. In particular, the Trade Policy Reviews of the WTO are now

32
reporting virtually all the required information as a matter of course. This is a commendable development.
For countries that are not yet members of the WTO or APEC, their own domestic banking legislation can also provide the necessary detail about the licensing requirements to become a commercial bank. For many of the South East European and Baltic States, for example, the banking legislation is available in English on the website of each country’s central bank, and was used to compile the information for those countries in the banking tables at the end of this paper.
Most countries have made horizontal commitments on the temporary and permanent movement of people as part of their GATS schedules. These horizontal commitments may be accessed at the WTO website at http://tsdb.wto.org/wto/Public.nsf/FSetPredefinedReport3?OpenFrameSet under ‘All countries’.
Example
The methodology outlined in table 3.2 can be illustrated in the case of Vietnam.
According to Vietnam’s APEC IAP, foreign credit institutions can operate in Vietnam in the forms of (i) a foreign bank branch; (ii) a joint-venture bank; (iii) a joint-venture financial leasing company; (iv) a wholly foreign owned financial leasing company; (v) a joint-venture finance company; (vi) a wholly foreign owned finance company; (vii) other non-bank credit institutions. The licensing of any new bank (domestic or foreign) is apparently subject to an economic needs test, but few if any banks are denied a licence. There is more likely to be a limit on the scope of activity. Although this mild form of economic needs test does not appear explicitly as a category in table 3.2, it has been scored at a relatively low value of 0.25 under the heading of ‘licensing’ for both domestic and foreign banks.
Joint venture banks are neither proscribed nor required. So a score of 0.0 has been assigned to the joint venture category for both domestic and foreign banks.
In terms of capital contribution, the share of foreign counterparts in a joint venture bank is not permitted to exceed 50 per cent of the total registered capital of a joint venture, according to Vietnam’s APEC IAP. This is despite the fact that wholly foreign owned banks are also allowed. This restriction on foreign equity participation translates to a score of 0.5 under the heading of ‘direct investment’ for foreign banks.
According to Vietnam’s APEC IAP, foreign managers, executive directors and experts of foreign service-providing organisations who cannot be Vietnamese by nationality, and

33
are engaging in foreign directly invested enterprises, are allowed to immigrate and reside in Vietnam in a proper time period in conformity with regulations of investment contracts or for 3 years, whichever is shorter. The duration may be prolonged subject to the employment contract between these individuals and the enterprises. This translates to a score of 0.4 for foreign banks under the heading ‘permanent movement of people’.
According to Vietnam’s APEC IAP, foreign credit organisations are not allowed to receive savings in any form. This has been scored as 1.0 under the heading of ‘raising funds’ by foreign banks. There are no known limitations on domestic banks under this category.
According to Vietnam’s APEC IAP, foreign invested enterprises and foreigners are only allowed to hire land, and to own real estate (except land), but not to receive the collateral of land use rights in their banking licenses. According to the NTE report of the USTR, this restriction will be gradually lifted for US banks under Vietnam’s, Bilateral Trade Agreement (BTA) with the United States — for the first three years after the entry into force of the US Vietnam BTA, financial institutions with 100 per cent US equity ownership may not take an initial mortgage interest in land use rights. In addition, foreign banks cannot issue credit cards. The inability of foreign banks to issue mortgages against land use rights, or to issue credit cards, has been scored as 0.5 under the heading of ‘lending funds’. There are no similar restrictions on domestic banks.
According to Vietnam’s APEC IAP, insurance is regulated separately, with a numerical limit on the number of foreign invested insurance companies allowed to operate. According to the NTE report of the USTR, non-bank US securities service suppliers may only establish a commercial presence in Vietnam in the form of a representative office. This suggests that foreign banks cannot offer insurance or securities services. So a score of 1.0 has been assigned to foreign banks under the heading ‘other business of banks’. Similar restrictions apply to domestic banks.
According to Vietnam’s APEC IAP, in terms of geographical areas, foreign banks are allowed to open branches in provinces and cities belonging to the Center, but not to open subsidiaries under the branches and transaction offices in any form apart from head offices. Apparently, both domestic and foreign banks need separate approval for each new branch outlet. This has been scored as 0.25 for both domestic and foreign banks under the heading ‘expanding the number of banking outlets’.
No information about the composition of the board of directors has been collected, as this category now receives a zero weight.
According to Vietnam’s APEC IAP, service providers who work for service providers without establishment (trade representatives) in Vietnamese territory, do not receive

34
salaries from any Vietnamese source, engage in service-providing under service-providing contracts between their enterprises and a Vietnamese one, do not directly collect money for their service-providing, and do not work for any other foreign enterprise which has a trade representative, are allowed to immigrate and reside in Vietnam in a specific time in conformity with the contract’s regulations and not in excess of 90 days. This has been scored as 0.25 under the heading ‘temporary movement of people’.
Table B55 at the end of this paper shows how the weights in table 3.2 have been used to convert these scorings into an overall restrictiveness index value of 0.47 for foreign banks and 0.15 for domestic banks in Vietnam. The next chapter describes the econometric work that allows these index scores to be converted into impacts on economic performance.
Distribution services
The estimates of barriers to trade in distribution services are based on the study by Kalirajan (2000).
Distribution services comprise wholesale and retail trade services, along with the activities of franchisors and commission agents. Foreign trade occurs primarily through commercial presence. As shown in table 3.3, the relevant discriminatory and non-discriminatory restrictions affecting the establishment or ongoing operations of domestic and foreign new entrants include:
• restrictions on establishment:
- the acquisition of commercial land;
- direct investment in distribution firms;
- the establishment of large-scale stores;
- screening tests, needs tests, performance requirements and other factors affecting investment;
- local government requirements (eg zoning, environmental, employment, operating hours);
- the permanent movement of people;

35
Table 3.3: Distribution restrictiveness indexes Weight - foreign index
Weight - domestic index Score Restriction`
Barriers to establishment
0.2000 0.2000 Restrictions on commercial land 1.00 Acquisition of commercial land is not permitted
0.50 Acquisition of commercial land is permitted, but is restricted to a certain size
0.00 No restrictiction on the acquisition of land
0.2000 0.2000 Direct investment
The score will be inversely proportional to maximum foreign equity participation permitted in a domestic distribution enterprise. For example, ownership to a maximum of 49 per cent would receive a score of 0.51 (1-0.49).
0.0500 0.0500 Restrictions on large-scale stores
1.00 National legislation prohibits large-scale stores 0.50 Regional and local authorities restrict large-scale stores 0.00 No restrictions on large scale stores
0.0750 0.0750 Factors affecting investment 0.30 Takeovers are hindered by regulation 0.30 Investors must meet performance requirements 0.20 Establishment subject to economic needs test 0.20 Government screening of investment
0.0750 0.0750 Factors affecting local establishment
0.40 Establishment subject to a local environmental impact assessment or zoning requirement
0.40 Local employments requirements 0.20 Restrictions on operating hours
0.0474 0 Movement of People - Permanent 1.00 No entry of executives, senior managers or specialists 0.80 Executives, senior managers or staff can stay a period of up to 1 year 0.60 Executives, senior managers or staff can stay a period of up to 2 years 0.40 Executives, senior managers or staff can stay a period of up to 3 years 0.20 Executives, senior managers or staff can stay a period of up to 4 years
0.00 Executives, senior managers or staff can stay a period of more than 4 years
Continued

36
Table 3.3: (Continued) Weight - foreign index
Weight - domestic index Score Restriction
Barriers to ongoing operations
0.0750 0.0750 Wholesale import licensing 1.00 No new import licences are available for wholesalers 0.50 A limited number of new import licences are available for wholesalers 0.00 There are no limits on the issuse of import licences
0.0500 0.0500 Promotion of retail products
1.00 Firms are prohibited from using promotional tools to market retail products
0.50 Firms are limited in their use of promotional tools to market retail products
0.00 No restrictions on promotion of retail products
0.1000 0.1000 State Monopolies - Product exclusions
The score for an economy is taken froma able of 16 product categories, in which distribution occurs through statutory government monopolies
0.0500 0.0500 Protection of intellectual property rights
1.00 An economy is on USTR priority 301 watchlist 0.50 An economy is on USTR 301 watchlist 0.00 Intellectual property rights are not on USTR watch lists
0.0474 0 Licensing requirements on management
1.00 All directors/managers or at least a majority of them must be nationals or residents
0.75 At least one director/manager must be national or resident 0.50 Directors and managers must be locally licensed 0.25 Directors and managers must be domiciled in the foreign economy 0.00 No restrictions
0.0237 0 Movement of people - Temporary 1.00 No temporary entry of executives, senior managers or specialists
0.75 Temporary entry of executives, senior managers or specialists up to 30 days
0.50 Temporary entry of executives, senior managers or specialists up to 60 days
0.25 Temporary entry of executives, senior managers or specialists up to 90 days
0.00 Temporary entry of executives, senior managers or specialists over 90 days
0.9935 0.8750 Total
Source: Kalirajan (2000).

37
• restrictions on ongoing operations:
- issuing of wholesale licences;
- limits on promotional activities;
- a lack of protection of intellectual property rights;
- the presence of statutory government monopolies;
- licensing requirements on management;
- the temporary movement of people.
Kalirajan (2000) notes that at least some restrictions on distribution services, such as zoning and environmental regulations, may be imposed for social policy reasons. But they nevertheless have the ability to create rents or raise the real resource costs of undertaking wholesale and retail activity.
The restrictiveness index values for foreign operators differ very slightly from those in Kalirajan (2000), by giving zero weight to MFN exemptions. Such exemptions are probably better dealt with by building separate indices for the restrictiveness of trade between the partners for which the exemptions apply, rather than by trying to incorporate them into an overall MFN index. MFN exemptions would have added at most 0.0065 to the foreign index values, so the results differ only very slightly. This also explains why the maximum score for the foreign index in table 3.3 is 0.9935 rather than 1.00.
In compiling information from various countries, Kalirajan was able to take advantage of two one-off OECD publications, OECD (2000a) and (2000b). In addition, he used many of the same sources as were used for banking, including:
• GATS schedules, available on the WTO web site at http://tsdb.wto.org/wto/Public.nsf/FSetPredefinedReport3?OpenFrameSet.
• WTO (World Trade Organisation) Trade Policy Reviews, which describe the financial regulatory structures, trade restrictions and trade policies for WTO members. These are now available at the WTO website at http://www.wto.org/english/tratop_e/tpr_e/tpr_e.htm.
• The National Trade Estimates (NTE) Report on Foreign Trade Barriers from the Office of the US Trade Representative (USTR), which covers information on restrictions for most economies. These are now available at http://www.ustr.gov/Document_Library/Reports_Publications/Section_Index.html.
• APEC Individual Action Plans (IAPs), which list restrictions and liberalising commitments in reports covering services, investment, competition and deregulation. These are now available at http://www.apec-iap.org/ for APEC member countries

38
(Australia, Brunei, Canada, Chile, China, Hong Kong, Indonesia, Japan, Korea, Malaysia, Mexico, New Zealand, Papua New Guinea, Peru, Philippines, Russia, Singapore, Chinese Taipei, Thailand, United States, Vietnam).
• The TradePort web site, which covers information on restrictions for most economies.
As noted, the country market research reports on the Tradeport website are no longer freely available. But the other information sources remain invaluable sources for collecting the information required to compile distribution restrictiveness indexes.
In particular, the sections in the WTO Trade Policy reviews dealing with barriers to agriculture and manufacturing often give details of restrictions on issuing wholesale import licences, or details of State monopolies. For countries (such as Morocco) that have signed NAFTA-style ‘negative list’ trade agreements with the United States, the detailed annexes of exceptions and reservations in those agreements are also invaluable sources of this and other information about barriers to distribution services. The WTO and USTR reports often include additional information specifically about the distribution sector. As noted earlier, the horizontal commitments in GATS schedules often give details about restrictions on the temporary and permanent movement of people. And the USTR’s annual Special 301 reports (through the same web address as for the NTE reports) give up-to-date lists of those countries on its 301 priority and 301 watch lists.
Example
The methodology outlined in table 3.2 can be illustrated in the case of Vietnam.
According to Vietnam’s APEC IAP, foreign distributors in Vietnam are required to conform to specific regulations including those on tax, services charges, land and real estate hiring rights. They are allowed to hire land but not allowed to use these rights for investment contribution purposes as Vietnam enterprises do. They are allowed to use real assets (excluding land) for only the certain period of time provided in their investment permission. Domestic distribution firms may hold land use rights for up to a 50 year term, but may not own land. Foreign distribution firms may hire land, but may not hold land use rights. So foreign firms have been allocated a score of 1.0 under ‘restrictions on commercial land’, while domestic firms have been allocated a score of 0.5.
According to Vietnam’s APEC IAP, the Foreign Investment Law of 12 November 1996 and the Law on amendments and supplements of some provisions of May 2000 allow domestic distributors to establish their business units in the following forms: business cooperation contracts (BCCs); joint venture enterprises, where the foreign party’s capital contribution is not allowed to lie below 30 per cent out of total legal capital, except with government permission; and 100 per cent foreign invested capital enterprises. In practice,

39
equity limits are imposed on a case-by-case basis. This has been given a relatively modest restrictiveness score of 0.25 (equivalent to allowing 75 per cent foreign equity participation).
According to Vietnam’s APEC IAP, priority is given to construction of commercial centres, shopping malls, stores and warehouses in accordance with the country’s economic regions. This does not seem to imply a restriction on large-scale stores, so a score of 0.0 has been allocated to this category for both domestic and foreign firms.
According to Vietnam’s APEC IAP, the general regulation of foreign entry is that licensing is done on a case by case basis and depending on the level and particular domestic demands. In addition, in the regulations on granting branch establishing licenses for foreign business persons, Article 5 of Decree No 45/2000/ND-CP stipulates conditions for foreign businessmen to be granted operation licenses, including: having legally registered in compliance with overseas laws; having been operating for at least five consecutive years from their business registration; having been dealing with permitted ranges of goods and services specified in the list enclosed with this Decree. This has been scored as equivalent to government screening plus a needs test for foreign firms, and given a value 0.4 in the category of ‘factors affecting investment’.
According to Vietnam’s APEC IAP, the number of foreign staff is not allowed to exceed 18 per cent of the total technological experts in foreign service-providing organizations in Vietnam. According to USTR’s 2004 NTE report, in September 2003 Vietnam issued Decree 105, which provides that all enterprises operating in Vietnam may only employ foreign nationals at the lesser of 1) a maximum rate of 3 per cent of their total workforce or 2) 50 persons. In response to complaints from the foreign business community, the government stated that it would issue legislation clarifying the decree and providing exemptions for certain sectors and types of employment. The USTR suggests that the same limit on hiring foreign nationals also applies to domestic businesses. This has been scored as a local employment requirement and given a value of 0.4 for both foreign and domestic firms under the category of ‘local government requirements’.
For the reasons outlined for banking above, a score of 0.4 has been allocated to foreign distribution firms under ‘the permanent movement of people’.
In the chapter on non-tariff barriers in Vietnam’s APEC IAP report, there is a list of goods for which importing is prohibited, a list for which exporting is prohibited, a list for which discretionary import licensing is required, and a list for which discretionary export licensing is required. This applies to both domestic and foreign firms. Hence a score of 0.5 has been allocated for both domestic and foreign firms under the heading ‘wholesale import licensing’.

40
No source mentions restrictions on the promotion of retail products. So a score of 0.0 has been allocated to this category, for both domestic and foreign firms.
While both Vietnam’s APEC IAP and the USTR’s NTE report contain information about State monopolies, the best source of information is the annexes to the US Bilateral Trade Agreement. The US Vietnam BTA has an annex C specifying Imports and Exports subject to State Trading. Some are relaxed under the BTA. It is assumed that they continue to apply for countries other than the United States. The products listed are reflected in Vietnam’s State Monopolies table D46b at the end of the paper. But when calculating the restrictiveness index in table D46a, this State monopoly score has been halved because the monopolies are only for export and import, not for all trade. Annex D of the BTA also has a phase-out of restrictions on Import Trading Rights and Distribution Rights for a range of Agricultural and Industrial Products. It is assumed that these apply to foreigners only, and they have been used for the foreign index.
According to the USTR website, Vietnam was on the 301 watch list in 2004. A score of 0.5 has been allocated in this category for both domestic and foreign firms.
According to Vietnam’s APEC IAP, under the Law on Investment the General Directors or the First Deputy General Directors of joint venture enterprises must be Vietnamese citizens. Foreign invested enterprises and foreign parties participating in BCCs are allowed to recruit on the basis of business requirements provided that recruitment priority is granted to Vietnamese citizens. They are only to employ foreigners to do high professional knowledge and management work exceeding the Vietnamese capacity. However, they have to train Vietnamese staff. This is equivalent to at least one director having to be a national or resident, and has been allocated a score of 0.75 under the category of ‘licensing requirements on management’.
For the reasons outlined for banking above, a score of 0.25 has been allocated to foreign distribution firms under ‘the temporary movement of people’.
Table D46 at the end of this paper shows how the weights in table 3.3 have been used to convert these scorings into an overall restrictiveness index value of 0.52 for foreign distribution firms and 0.21 for domestic distribution firms in Vietnam. The next chapter describes the econometric work that allows these index scores to be converted to impacts on economic performance.
Electricity generation
A recent study by the OECD looked at the impact of domestic regulatory regimes in electricity supply on the price performance of that sector (Steiner 2000), while correcting

41
for a number of country-specific features. Doove et al. (2001) extended that work to a range of non-OECD countries.
The characterisation of regulatory regimes is based on the idea that while electricity transmission (and perhaps retail distribution) may possess natural monopoly characteristics, industry performance could be enhanced by encouraging competition in electricity generation (and perhaps retail distribution). Recent technological advances, such as cogeneration (of electricity and usable heat) have changed the economics of generating electricity, facilitating competitive supply. Thus the dimensions of a regulatory regime which can encourage competition in electricity generation include:
• unbundling those activities that are considered to be competitive (generation and retailing) from those that are thought to be natural monopoly activities (transmission), so as to avoid conflicts of interest in promoting competition;
• allowing third party access, ie guaranteeing open and non-discriminatory access for all generators to the transmission grid (subject to available transmission capacity); and
• introducing a wholesale pool, or spot market, for electricity (either mandatory or optional) to overcome limitations associated with the use of direct (bilateral) contracts between generators and retailers.
All that is required to generate a measure of inappropriate regulation in electricity generation is yes/no information about whether the regulatory regime has these three characteristics.
The benefits of a wholesale price pool are contentious. Against the potential adverse lock-in effects of long term contracts, there is the possibility of dominant generators using their market power to ‘game’ a wholesale pool, ie manipulating the bidding system to deliver electricity at prices that are still above cost. Thus while the United Kingdom established a wholesale electricity market in March 1990, the ‘gaming’ problem lead to the pool being replaced by a system of bilateral contracts in March 2001. But as Doove et al. (2000) note, it is not clear that the alternative price setting mechanism will deliver lower prices than a wholesale pool, as the underlying problem is the same in both regimes — the market power of the generators.
Other, less controversial aspects of a pro-competitive regulatory regime that are not captured in the empirical work of Steiner include:
• allowing new generators to enter the market;
• allowing customers (sometimes large customers such as retailers or large industrial users, sometimes all retail customers) to purchase electricity directly from the generator of their choice; and

42
• introducing a regulator independent of industry players and day-to-day political influence.
Doove et al. (2000) used the following information sources to extend the coverage of the Steiner study to non-OECD countries:
• the country analysis briefs of the US Energy Information Agency, available at http://www.eia.doe.gov/emeu/cabs/;
• the International Energy Agency (eg IEA 2000); and
• reports of national governments.
The first of these sources has been a valuable source of ongoing information. Another strategy has been to use google search using the keywords ‘power’ and the name of the country in question.5
Example
The June 2004 Vietnam country analysis brief by the US Energy Information Agency notes that due to the large amount of investment required to meet forecasted electricity demand, the state power company, Electricity of Vietnam (EVN) is facing pressure to end its monopoly and open the door to investment in power production and distribution facilities. It is working on a plan to develop a national electricity grid by 2020, patching together several regional grids. In early March 2003, the 720 megawatt Phu My 3 power plant in the Phu My power generating complex in Ba Ria-Vung Tau province commenced operations, thereby pushing the country’s power generating capacity up by nearly 10 per cent. The plant, which is owned by a consortium led by UK’s BP, is the first foreign-invested project to operate under a build-operate-transfer model. EVN will purchase the plant’s output under a 20 year power purchase agreement.
On the basis of this information, Vietnam’s regulatory regime in 2004 can be characterised as allowing third party access, but not yet having unbundling or a wholesale price pool.
Maritime — ports
The relevant policy determinants of port efficiency are taken from Clark, Dollar and Micco (2001). They identify three possible determinants, although only two prove to be statistically significant. 5 One site accessed via this method was the website of UK Trade and Investment. This used to have detailed policy information sheets about a number of sectors, including power and communications, in a range of developed and developing countries. This information is now only made available to UK companies.

43
The first variable measures the extent of restrictions against foreign participation in cargo handling. Data on this were obtained from Fink, Mattoo and Neagu (2001), who in turn provide little information about how the index was complied, although its values for particular countries are shown in table M1. As will be seen in the next chapter, this determinant does not seem to be statistically significant.
The second variable measures whether the following port services are mandatory: pilotage, towing, tug assistance, navigation aids, berthing, waste disposal, anchorage and other mandatory services. The data are also from Fink, Mattoo and Neagu (2001). They provide little information about data sources, but the index seems to assign a value of 0.125 to each service that is mandatory (with a maximum index score of 1.0). The values are shown in table M1.
The third variable measures the absence of organised crime. Data on this are taken from the Global Competitiveness Report (1996-2000) and are based on surveys of representative firms about whether organised crime does not impose significant costs on business and is not a burden.
Example
The values of these variables for Vietnam are shown in table M1. Vietnam’s regulatory regime for port operation is relatively liberal. It does not impose cargo handling restrictions or require mandatory servicing. However, its index measure of the absence of organised crime, at 5.02, is below the third quartile value of 6.17.
Professional services
The estimates of barriers to trade in professional services are based on the study by Nguyen-Hong (2000).
His study uses information on trade policies as outlined in table 3.4. The relevant discriminatory and non-discriminatory restrictions affecting the establishment or ongoing operations of domestic and foreign new entrants are as follows:
• restrictions on establishment:
- the form of establishment;
- prohibitions on, or requirements for, foreign entrants to form partnerships or joint ventures with local firms;
- limits on investment and ownership by foreign professionals or by non-professional investors;
- nationality or citizenship, residency or local presence requirements;
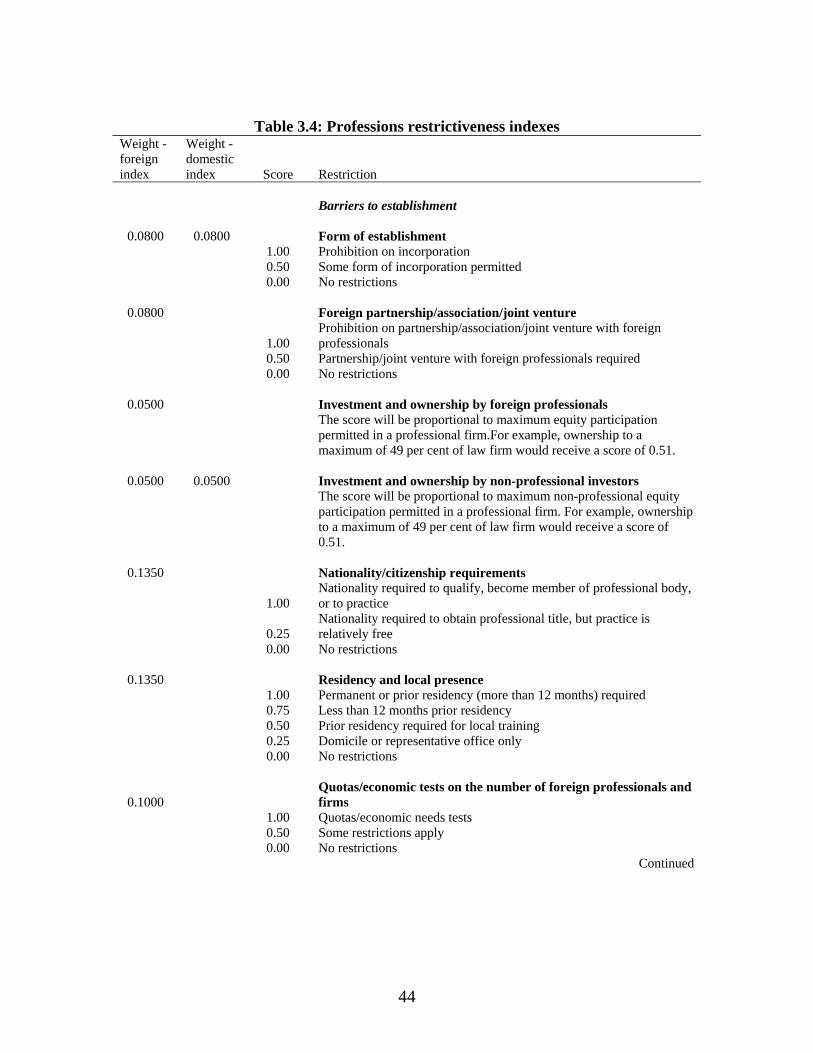
44
Table 3.4: Professions restrictiveness indexes
Weight - foreign index
Weight - domestic index Score Restriction
Barriers to establishment
0.0800 0.0800 Form of establishment 1.00 Prohibition on incorporation 0.50 Some form of incorporation permitted 0.00 No restrictions
0.0800 Foreign partnership/association/joint venture
1.00 Prohibition on partnership/association/joint venture with foreign professionals
0.50 Partnership/joint venture with foreign professionals required 0.00 No restrictions
0.0500 Investment and ownership by foreign professionals
The score will be proportional to maximum equity participation permitted in a professional firm.For example, ownership to a maximum of 49 per cent of law firm would receive a score of 0.51.
0.0500 0.0500 Investment and ownership by non-professional investors
The score will be proportional to maximum non-professional equity participation permitted in a professional firm. For example, ownership to a maximum of 49 per cent of law firm would receive a score of 0.51.
0.1350 Nationality/citizenship requirements
1.00 Nationality required to qualify, become member of professional body, or to practice
0.25 Nationality required to obtain professional title, but practice is relatively free
0.00 No restrictions
0.1350 Residency and local presence 1.00 Permanent or prior residency (more than 12 months) required 0.75 Less than 12 months prior residency 0.50 Prior residency required for local training 0.25 Domicile or representative office only 0.00 No restrictions
0.1000 Quotas/economic tests on the number of foreign professionals and firms
1.00 Quotas/economic needs tests 0.50 Some restrictions apply 0.00 No restrictions
Continued

45
Table 3.4: (Continued)
Weight - foreign index
Weight - domestic index Score Restriction
0.1000 Licensing and accreditation of foreign professionals
1.00 Local retraining required for full license 0.75 Local examination required in all cases 0.50 Case by case assessment of foreign qualification/licence 0.25 Aptitude tests 0.00 Foreign licence/qualifications sufficient to practice
0.0500 Licensing and accreditation of domestic professionals (scores additive)
0.25 Compulsory membership of professional association 0.25 Professional examination requirements 0.25 Practical experience requirements 0.25 Higher education requirements
0.0200 Movement of People - Permanent 1.00 No entry of executives, senior managers or specialists
0.80 Executives, specialists or senior managers can stay a period of up to 1 year
0.60 Executives, specialists or senior managers can stay a period of up to 2 years
0.40 Executives, specialists or senior managers can stay a period of up to 3 years
0.20 Executives, specialists or senior managers can stay a period of up to 4 years
0.00 Executives, specialists or senior managers can stay a period of 5 or more years
Barriers to ongoing operations
0.0500 0.0500 Activities reserved by law to the profession 1.00 4 core activities and over 0.75 3 core activities 0.50 2 core activities 0.25 1 core activity 0.00 None
0.0500 0.0500 Multidisciplinary practices 1.00 Prohibition on partnership with other professionals 0.50 Majority partnership required 0.00 No restrictions
0.0500 0.0500 Advertising, marketing and solicitation 1.00 Advertising, marketing and solicitation restricted 0.50 Some form of advertising, marketing or solicitation allowed 0.00 No restrictions
Continued

46
Table 3.4: (Continued)
Weight - foreign index
Weight - domestic index Score Restriction
0.0500 0.0500 Fee setting
1.00 Mandatory minimum or maximum fees 0.50 Restrictions for some groups or activities 0.00 No restrictions
0.0200 Licensing requirements on management
1.00 All directors/managers or at least a majority of them must be nationals or residents
0.75 At least one director/managers must be nationals or residents 0.50 Directors and managers must be locally licensed 0.25 Directors and managers must be domiciled 0.00 No restrictions
0.0200 Other restrictions (scores additive) 0.33 Restrictions on hiring professionals 0.33 Restrictions on the use of firm's international names 0.33 Government procurement - restrictions towards foreigners 0.00 No restrictions
0.0100 Movement of people - Temporary 1.00 No temporary entry of executives, senior managers or specialists
0.75 Temporary entry of executives, senior managers or specialists up to 30 days
0.50 Temporary entry of executives, senior managers or specialists up to 60 days
0.25 Temporary entry of executives, senior managers or specialists up to 90 days
0.00 Temporary entry of executives, senior managers or specialists over 90 days
1.0000 0.3800 Total
Source: Nguyen-Hong (2000).

47
- quotas or economic needs tests on foreign entry;
- licensing and accreditation requirements on foreign and local professionals;
- limits on permanent movement of people;
• restrictions on ongoing operations:
- whether activities are reserved by law to the profession;
- limits on multidisciplinary practices;
- limits on advertising, marketing and solicitation;
- restrictions on fee setting;
- licensing requirements on management and other restrictions (eg on local employment);
- limits on the temporary movement of people.
The information is collected separately for up to four different professions — accountancy, architecture, engineering and legal. Because the same index structure is used for all professions, the results are comparable across professions.
The original study by Nguyen-Hong (2000) made most use of one-off studies of the content of regulations affecting the professions. These included:
• an OECD study (OECD 1996) which contained detailed coverage of regulations applying to engineering, architectural, legal and accountancy services in OECD countries;
• a WTO questionnaire on restrictions in the accountancy sector (WTO 1996);
• an APEC directory of professional services, which provided information on regulations affecting accountancy, architecture and engineering services in AOEC economies; and
• the legal services country profiles of the International Legal Services Advisory Council (ILSAC), which are available from the website at http://www.ag.gov.au/agd/WWW/ilsHome.nsf/Page/Publications_Publication_Documents_Publications_For_Sale for Australia and Asia, but are not free of charge.
The one-off nature of most of these publications has made professional services the most challenging area in which to obtain updated information. Nevertheless, the regulations governing professional services, along with those governing distribution, have been among the slowest to evolve. Much faster to change have been the regulations affecting banking and telecommunications.

48
In addition to the above sources, the WTO Trade Policy Reviews, the NTE reports of the USTR and the APEC IAPs have also provided sources of updated information. Of all these sources, the APEC IAPs are probably the most complete (although they do not always give information about the licensing requirements for domestic professionals, for example).
Example
According to Vietnam’s APEC IAP, foreign law firms are only permitted to operate in Vietnam in the form of branches or partnership with Vietnamese enterprises. Each foreign law firm is allowed to establish two branches in Vietnam. This is interpreted to mean that Vietnam will accept the form of the foreign organisation as it is. So a score of 0.0 has been allocated to ‘form of establishment’ for foreign firms. But as in many countries, local firms must be partnerships — they are not allowed to incorporate or have limited liability. Thus a score of 1.0 has been allocated to ‘form of establishment’ for domestic firms.
The above information suggests that if a foreign law firm is not in a joint venture, then it can only be a branch. This has been allocated a score of 0.5 under the category ‘foreign partnership or joint venture’.
There are no equity limits or similar restrictions noted in Vietnam’s APEC IAP concerning investment and ownership by foreign professionals. Thus a score of 0.0 has been allocated to this category. According to the IAP, lawyers of foreign law firms practicing in Vietnam are required to hold a license of legal consulting practice issued by a foreign authorized body. However, this does not impose any restrictions on the management or equity holders of the foreign law firm. Thus a score of 0.0 has been allocated to the category ‘investment and ownership by non-professional investors’.
The IAP does not explicitly note any restrictions on multidisciplinary practices. But it makes it clear that the legal and accounting professions are regulated separately. This has been interpreted as meaning that legal firms cannot practice accounting. So a score of 1.0 has been allocated to ‘multidisciplinary practices’ for both domestic and foreign firms.
According to Vietnam’s APEC IAP, licenses for branch establishment and operation of law firms are required. With regards to lawyers, ‘addition decision to the list of foreign lawyers of the branch is required’. This has been interpreted requiring that directors and managers be locally licensed, and a score of 0.5 has been allocated under the category of ‘licensing requirements on management’.
According to Vietnam’s APEC IAP, the branches of foreign law firms in Vietnam until recently were not allowed to hire Vietnamese lawyers to work in their branches.

49
However, Decree 87 overruled this restriction, so a score of 0.0 has been allocated to ‘other restrictions’.
According to Vietnam’s APEC IAP, there is no residency requirement, but there is a requirement for the Chief lawyer to have five years past experience. This has been scored as equivalent to a domicile requirement, and given a relatively low score of 0.25 against the category of ‘residency or local presence’.
According to Vietnam’s APEC IAP, there are no quotas or economic needs tests, but foreign lawyers are required to service foreign clients only. This has been scored as equivalent to ‘some restrictions’, and allocated a score of 0.5 accordlingly.
According to Vietnam’s APEC IAP, Vietnam has expanded the scope of activities of foreign lawyers in Vietnam in the way that foreign lawyers are permitted to practice consulting on Vietnamese law and international law in all legal areas, excepting consulting on Vietnamese law and not permitted to participate in legal proceedings before Vietnamese courts. These restrictions on activity have been scored as equivalent to a case-by-case assessment of foreign license and qualifications, and allocated a score of 0.5 under the category ‘licensing and accreditation of foreign professionals’.
Court appearance is an activity reserved to the profession, so has been scored at 0.25 under this category.
Vietnamese lawyers must be a member of a legal association, must pass a professional exam, hold a law degree, and have practical experience. These requirements have been scored as 1.0 under the category of ‘licensing and accreditation of local professionals’.
For the reasons outlined for banking above, a score of 0.4 has been allocated to foreign firms under ‘the permanent movement of people’ and a score of 0.25 to foreign firms under ‘the temporary movement of people’.
Telecommunications
The estimates of direct costs of barriers to trade in telecommunications services are derived from the study by Dee (2004a). This study extended the work of Warren (2000) to a larger sample of countries that included South East Europe. The index measures of trade barriers are based on Warren (2000).
The barriers to trade in telecommunications services are grouped in two ways:
• those that affect the market access (MA) of any new entrant into the market, be they domestic or foreign, have been distinguished from those that discriminate against foreigners (where NT stands for ‘national treatment’); and

50
• those that primarily affect services delivered via commercial presence (FDI) have been distinguished from those that affect other modes of delivery, primarily cross-border trade (Trade).
This two-way classification of services trade barriers mirrors distinctions made in the General Agreement on Trade in Services under the WTO.
Within each category, an index is constructed from an indicative, rather than comprehensive, list of barriers.
• MA/Trade. This is constructed from information on whether regulations allow domestic or international (i) leased lines or private networks (ii) third party resale (iii) connections of leased lines and private networks to the public switched telecommunications network (PSTN). Hence there are 6 observations for each country, and the index value can range from 0 to 6.
• MA/FDI. This is constructed for the fixed and mobile telecommunications markets separately. In each case, the variable is a weighted average of three scores (i) the number of competitors in the market (max. 3), multiplied by 3 (ii) average policy scores for competition in the provision of the relevant service, multiplied by 2 (iii) percentage of incumbent that is privatised, multiplied by 1. The index values can range from 0 to 1.
The policy scores for competition in fixed line telecommunications are averaged across the following markets: local service, domestic long distance, international, data, and leased lines. For each segment, a score of 1 is given if full competition is allowed, 0.5 for partial competition, and 0 for monopoly.
The policy scores for competition in mobile markets are 1 if full competition is allowed in either analogue or digital, 0.5 for partial competition and 0 for monopoly.
• NT/Trade. This variable is indicative of discrimination against foreigners in the provision of cross-border services. It takes the value 1 if callback services are allowed, and zero otherwise.
• NT/FDI. The percentage of foreign investment allowed in competitive carriers.
Some these policy indicators measure market structure, rather than market conduct (or the rules governing it). In an area such as telecommunications, where technology has changed very rapidly, this can be seen as a strength rather than a weakness. Policy rules have tended to be technology-specific. An example above is whether call-back services are allowed. When international telephony was very expensive, this was a useful means of providing cross-border competition in international telephony. As technology has

51
improved and the cost of providing international connections has plummeted, the relevance of call-back services has declined. And as will be seen in the next chapter, this policy indicator no longer has a significant impact on telecommunications performance. But despite changes in technology, the extent of competition faced by incumbent carriers is still a significant determinant of performance.
The original study by Warren (2000) collected the data on all these elements of policy directly from an international survey undertaken by the International Telecommunications Union (ITU 1999).
It is possible to collect the required information from other sources.
The country regulatory profiles available on the ITU website still provide information about the level of competition in various segments of the market. These are at http://www.itu.int/ITU-D/databanks.html. However, some of the scoring is a little hard to understand. For example, the Japanese market is scored as being full competitive in all segments, even though the Japanese regulator has described the Japanese market as still being oligopolistic.
Information about whether call-back services are allowed is available from the ITU website at http://www.itu.int/osg/spu/ni/iptel/countries/bdt99-1.html.
The ITU has conducted a series of internet case studies, which contain valuable background information about the telecommunications markets of the countries concerned, particularly about market structure and ownership. These are available at http://www.itu.int/osg/spu/casestudies/index.html#topic.
The WTO Trade Policy Reviews also provide information about regulatory policy, but not about market structure or ownership.
Example
According to the ITU’s Vietnam Internet Case Study (ITU 2002), Vietnam has followed China in allowing different government ministries to offer telecommunications services, as a form of competition with the incumbent. The Defence Ministry has entered through Vietel. It previously mainly served government clients, eg in the provision of private networks. It now has a general licence, but initially lacked the resources to enter all markets. It initially ran ‘voice over the internet protocol’ (VoIP) telephony, using VNPT leased lines between Hanoi and Ho Chi Minh City. The price was half the regular PSTN price. Vietel’s ability to compete is constrained by VNPT’s leased line prices. The Government liberalised VoIP telephony in 2001, with two additional licences (to VNPT and Saigon Post and Telecoms (SPT)) and lowered leased line prices, and has recently
52
allowed international VoIP. VNPT, SPT and Electricity Telecommunications and Information Company (ETIC) now also offer VoIP telephony.
Because VoIP telephony is linked to the PSTN, and because international VoIP is available, Vietnam has been scored as allowing the domestic and international connection of leased lines and private networks to the PSTN, as well as allowing leased lines and private networks. So Vietnam has been allocated a score of 4.0 for MA/Trade.
According to the ITU’s Vietnam Internet Case Study (ITU 2002), VNPT is still fully State owned. It has created numerous subsidiaries to carry out virtually every aspect of telecommunications. In addition, it has established several Business Cooperation Contracts with foreign telcos to jointly provide services. Now Vietel and ETIC also offer a full range of services. But Vietnam remains one of the few ITU members that have neither privatised the incumbent operator nor yet full separated the functions of operator and regulator.
On the basis of this assessment, Vietnam has been scored as having the maximum of three competitors in the fixed market, although with the lack of a fully independent regulator, competition has only been scored as partial in all fixed line segments. Its degree of privatisation is zero. So Vietnam’s score for MA/FDI (fixed) is (3*3 + 0.5*2 + 0)/12 = 0.833.
In the mobile market, there has been a duopoly for GSM services, offered by Vinaphone and Mobifone. There is an older analogue system, Saigon Mobile Telephone Company (SMPT), running AMPS. But VNPT owns both GSM operators and counts their subscribers as part of its own network. Both operators have identical rates, and the competition between them has been described by the ITU as more a battle for resources within NVPT than a battle for customers. Vinaphone has served mainly government customers, while Mobifone has more private customers. Vietel has now entered the GSM market and is offering price competition, but is limited because of price regulation. SPT, with a Korean BCC partner, also offers a CDMA service.
Vinaphone is 100 per cent owned by VNPT, so is not privatised. Mobifone operates under a BCC revenue and technology sharing arrangement between VNPT and Millicom (which is based in Luxembourg, and also owns Swedish Comvik). But a BCC contract is not the same as foreign ownership. Under the BTA with the United States, BCCs with US firms will be converted to joint ventures.
On the basis of this information, Vietnam has been allocated the same scoring for MA/FDI (mobile) as for MA/FDI (fixed). It has also been allocated a score of 0.0 for NT/FDI.

53
By Ministerial directive, call-back services are not allowed. So Vietnam has been allocated a score of 0.0 for NT/Trade.

54
4 Computing price and cost impacts
4.1 Air passenger transport
Gonenc and Nicoletti (2000) examined the effects of the provisions of air service agreements on the prices of air passenger transport services in two stages:
Route-specific airfare = f(stage length)
Deviation of airfare from that predicted by stage length = f(bilateral restriction index, environmental variables)
where the environmental variables included route-specific market structure, market structure of the international aviation industry in the route-end economies, extent of government ownership, average propensity of the populations at route ends for air travel, a measure of airport dominance by incumbent carriers, a measure of airport congestion at route ends, and the purchasing power of currencies. The two stage model overcame a multicollinearity problem that arose when stage length was initially included as an environmental variable. The inclusion of market structure variables captures the role of actual competition (see also Slade 2004), while the trade restriction index captures the role of potential competition.
The price models were estimated for business fares, economy fares and discount fares separately. The bilateral restriction index had a positive and statistically significant effect on all types of airfares. The effect was strongest for business fares, and weaker, though still significant, for economy and discount fares. Route specific market structures did not appear to affect airfares, but market structures at route ends had a significant effect on discount fares. This suggests that potential, rather than actual, competition is a key determinant of airfares on travel routes. The results of other environmental variables were less consistent across different fare regressions. The discount fare model was the most robust model, and is used in what follows.
Doove et al. (2001) show how the econometric results of Gonenc and Nicoletti (2000) can be used in conjunction with the index measures of air services restrictions in the tables at the end of this paper to generate estimates of the price impacts of air services restrictions for a number of countries. The method is described below, and the results are also shown in the tables at the end of the paper.
The price impacts measure by how much air fares have been inflated by having less than the most liberal settings for the four dimensions of air services agreements outlined in the
55
previous chapter. Air services agreements typically include a range of other provisions that could also be restrictive, including provisions limiting foreign direct investment, cabotage restrictions, and provisions denying so-called fifth and seventh freedom rights to fly to and from third countries. The effects of these other restrictions are not captured. Nor do the estimates here include the potential effects on air fares of legitimate safety regulation.
The air services restrictions captured in the bilateral restriction index could raise air fares for two reasons — because they raise markups, or because they raise airline costs. The econometric estimates capture both effects, without distinguishing between them. For modelling purposes, it will be important to distinguish which of these mechanisms operate. Unfortunately, a definitive study has yet to be done. But detailed airline modelling work by Gregan and Johnson (1999) suggests that both effects are likely to operate.
Doove et al. (2000) show that from the functional forms used by Gonenc and Nicoletti (2000), a route specific price impact can be computed as follows:
Route level price impact = pa – pu = pa*βBRI (1) pu pa – pa*βBRI
where pa is the actual air fare, pu is the fare that would prevail if the measured restrictions were not in place, pa* is the air fare value predicted by stage length alone, BRI is the bilateral restriction index, and β is the estimated coefficient of BRI in the second regression equation above. Gonenc and Nicoletti (2000) estimated the equation for predicted discount air fares as
pa* = 109 + 0.12 km
where km was the route length between city pairs (expressed in kilometers). They also estimated β to be 0.17, which was statistically significant at the 10 per cent level.
These formulae have been used to compute the route specific price (or cost) impacts shown at the end of the paper. In addition to values of the bilateral restriction index (explained in the previous chapter), the formulae require values for stage length and actual air fares.
Doove et al. (2001) followed Gonenc and Nicoletti (2000) in collecting actual fare data from on-line ticket systems for APEX (21 days advance booking) discount fares. The fares were those offered in the country of origin by the national or the largest carrier on each route, based on flight traffic information contained in ICAO (1998). The fares were the price of a single one-way ticket expressed in US dollars. The data collected by

56
Gonenc and Nicoletti (2000) for OECD countries were at September 1999. The additional data collected by Doove et al. (2001) for non-OECD countries were for Februrary 2001. All this data is shown in the tables at the end of the paper, where available. For a few countries, price impacts were calculated only recently, and estimates of fares around 2000 were not available. For those countries, pa* has been used instead of pa in equation (1)
Doove et al. (2001) also followed Gonenc and Nicoletti (2000) in collecting stage length data from ICAO (1998). These data are also shown in the tables at the end of the paper.
4.2 Banking
In Dee (2004a), as in Kalirajan et al. (2000), the effects of trade barriers on banking performance were examined in a two-stage process:
• first, the price performance of banks was ‘corrected’ for the influence of two key elements of prudential supervision — capital and liquidity requirements;
• then the influence of trade restrictions and other factors was examined on this ‘corrected’ price measure.
While the activities of banks have diversified enormously over recent years, a key banking function is still financial intermediation between depositors and borrowers. The raw price measure chosen was the net interest margin on this intermediation activity. The model, based on Saunders and Schumacher (1997a, 1997b), examined the main influences on financial intermediation activity.
The first stage was a firm-level estimation across a range of countries:
Net interest margin = f [capital, liquidity, non-interest operating expenses (net of other operating income), country dummy variables]
where all variables were measured as ratios and in natural log form. The net interest margin (including account service fees) was expressed as a ratio of interest earning assets. Capital (common stock, preferred stock and retained earnings), liquidity (cash and due from banks) and net non-interest operating expenses were expressed as ratios to total assets.
The capital and liquidity measures were the actual holdings of individual banks, on the assumption that these largely reflect prudential requirements. It was felt that using actual capital and liquidity ratios was the best that could be done, in the absence of data to

57
compute each bank’s actual reserve and liquidity requirements based on risk-weighted (rather than simple total) assets.
The inclusion of net non-interest expenses corrected for differences in the size and/or cost structures of different banks. The above specification did not make provision for an interaction between size and services trade reform. Such an interaction would be difficult to incorporate, given the two stage nature of the estimation, in which the services trade policy variables did not appear until the second stage. The two stage approach was adopted to correct for grouping effects in the firm-level data.
The second stage was a pure cross-country estimation:
‘Corrected’ interest margin = f [interest rate volatility, market structure, foreign trade restrictiveness index, measures of bank supervision]
where the ‘corrected’ interest margin was an average measure across all the banks in that country. It was calculated from the results of the first stage estimation as the sum of the constant term and the coefficient on the relevant country dummy in that equation. The specification differed from that in Kalirajan et al. (2000) by including measures of bank supervision as well as a measure of trade policy.
The elements of bank supervision were taken from a World Bank database of bank regulation and supervision (see Barth, Caprio and Levine 2002 for a summary). They were (the names are taken directly from Barth, Caprio and Levine 2002):
• 5a. An index measure of whether the supervisory authorities have authority to take specific actions to prevent and correct problems (eg consult with or take legal action against auditors, suspend directors’ decisions on various matters). A higher index value indicates greater power.
• 5e. An index measure of whether there are explicit, verifiable, quantifiable guidelines for asset diversification, and whether banks are allowed to make loans abroad. Higher values indicate more diversification.
• 6c. An index measure of the degree to which the supervisory authority is protected by the legal system from the banking industry. A higher value indicates protection.
• 7b. The percentage of the top ten banks that are rated by international credit rating agencies.
• 7d. An index measure of whether the income statement includes accrued or unpaid interest or principal on non-performing loans and whether banks are required to

58
produce consolidated financial statements. A higher value indicates more informative bank accounts.
• 8a. Whether the deposit insurance authority has the authority to make the decision to intervene in a bank, and take legal action against bank directors or officials. A higher value indicates more power.
This measure differs slightly from that defined in Barth, Caprio and Levine (2002). Theirs also included an indication of whether legal action had ever been taken against bank directors or officers. Since the answers to this component were unavailable for many countries in the sample, this component was excluded from the measure used in Dee (2004a).
• 9a. The degree of concentration of deposits in the five largest banks.
• 9c. The percentage of the banking system’s assets that are more than 50 per cent government owned.
The measures were not comprehensive, but were those for which there were data for most countries in the sample used by Dee (2004a). The selection excluded one measure (7a — whether there is a compulsory external audit) for which there was data, but for which there was insufficient variation within the sample.6
Interest rate volatility was included because it increases interest rate risk for banks and reduces bank profit. It was measured as the variance of annualised quarterly deposit interest rates over the last 3 years. Market structure was included because greater bank concentration was expected to increase bank profits. It was measured as a four firm concentration ratio in lending assets.
The results in Dee (2003) suggested that higher capital or liquidity requirements would both raise the ‘price’ of intermediation services — the net interest margins of banks — although the result for liquidity requirements was highly insignificant. However, these estimates were only a partial measure of the effects of prudential regulations, which are not aimed at reducing the price of banking services, but at ensuring systemic stability. The results in Dee (2004a) showed the incidental cost of such regulations, in terms of reducing bank profits, but they did not show the corresponding benefits.
6 There were other elements of banking supervision covered by Barth, Caprio and Levine (2002) that were not included, primarily because they were covered elsewhere. Other categories they considered were restrictions on lines of financial and non-financial business, and entry and ownership restrictions. These are covered in the index measure of trade restrictions. Another central plank of prudential regulation covered by them was the stringency of capital requirements. This, along with liquidity requirements, was covered separately in the econometrics.

59
Some insight into the benefits of prudential regulation is provided by Barth, Caprio and Levine (2002). They examined the effects of their regulatory variables on several measures of bank performance, including bank development (bank credit to the private sector as a share of GDP) and the probability of experiencing a banking crisis. They concluded that the stringency of capital regulations was not very closely linked with bank performance or stability, neither generally nor in particular institutional or regulatory environments. Instead, they found that regulations that encourage and facilitate private monitoring of banks tended to boost bank performance, while those that encourage diversification reduced the probability of suffering a systemic crisis. Their measure of capital stringency included such things as whether risks were properly accounted for, and whether capital requirements were officially verified, rather than the size of the capital requirements per se (as used in Dee 2004a). Their finding on capital stringency raises questions about the conventional wisdom that such measures are beneficial.
Of the potential policy variables, two were estimated in Dee (2004a) to be significant — the policy variable measuring the extent of trade barriers to foreign entrants, and the measure of the extent of government ownership. Trade barriers increased prices, and government ownership reduced them. The results were similar to those of Barth, Caprio and Levine (2002), who found that contestability, but not actual foreign entry, affected banking performance. The results do not imply that increasing government ownership would be a good policy option, however — government ownership can suppress bank margins below sustainable levels.
None of the bank supervisory variables were significant. As noted, these policies are designed to ensure system stability and integrity, not to reduce prices. The results were reassuring in that these supervisory practices did not appear to raise costs significantly as a secondary consequence. As in Barth, Caprio and Levine (2002), measures that encouraged private monitoring (7b and 7d) were instead estimated to reduce net interest margins, although the effect in Dee (2004a) was not significant. Barth, Caprio and Levine (2002) provide further evidence of how these policies contribute to banking system development and stability.
Kalirajan et al. (2000) show that, given the functional forms assumed by them (and also used in Dee 2004a), the price impact of barriers to trade in banking services can be computed as
100*(NIM – NIM0)/NIM0 = 100*(eβTRI – 1) (2)
where NIM was the net interest margin, NIM0 was the margin in the absence of the measured restrictions, TRI was the trade restrictiveness index and β was its coefficient in the second stage regression.

60
This formula has been used to compute the price impacts of services trade restrictions in banking shown at the end of the paper. In addition to values of the trade restrictiveness index, the formula only requires a value for the estimated coefficient. Dee (2004a) estimated this to be 0.504, which was significant at the 5 per cent level.
These price impacts clearly operates through markups, given NIM as the dependent variable.
4.3 Distribution services
Kalirajan (2000) estimated a model of the performance of a relatively homogeneous set of firms involved in food distribution, to estimate the effects of trade restrictions on firm profitability, correcting for all the other factors that are likely to affect profitability in the sector. Drawing on models of retailing by Betancourt and Gautschi (1993a, b) and Mueller (1986), the potentially relevant control variables were:
• accessibility of location;
• assortment of goods available;
• ability to deliver in the desired form at the desired time;
• level of information provided;
• ambience;
• level of concentration in distribution services; and
• extent of non-retail activities.
A two-stage estimation procedure was used to differentiate the firm-specific from the economy-wide influences on performance.
Kalirajan (2000) found that, correcting for other influences, restrictions on establishment had a significant and negative effect on price-cost margins of firms engaged in food distribution. Restrictions on ongoing operations also had a negative effect, but this was not significant.
The negative coefficients were taken as tentative evidence that the nature of trade restrictions in distribution was primarily to raise the real costs of doing business. One possible explanation was that restrictions such as local government requirements on employment conditions, operating hours or environmental impact assessments could genuinely raise real resource costs for business. Another reason was that restrictions on land acquisition or the development of large scale stores could create rents for incumbents, but that such rents could then become capitalised into the cost of land. It was

61
also likely that the restrictions had some independent effects on prices. So the measured effect on price-cost margins was the net of separate effects on prices and costs, which was likely to understate the total impact of the restrictions on competitiveness and efficiency.
Kalirajan (2000) showed how the econometric results could be used to estimate the direct ‘cost impact’ of restrictions on trade in distribution services for each country in the sample. Given the functional forms involved, the cost impact could be computed as
100*(v – v0) = R(β*TRI) (3) v0 1 – R(β*TRI)
where v is variable cost, v0 is the value of variable cost in the absence of the measured restrictions, R is the ratio of revenue to variable cost, TRI is the value of the trade restrictiveness index, and β is the absolute value of the estimated coefficient on TRI in the second stage regression. In addition to values of the trade restrictiveness index, the formula requires a value for the estimated coefficient and a value for the ratio of revenue to variable cost.
Because of multicollinearity problems, the relative effects of restrictions on domestic and foreign firms could not be identified in the same regression. Kalirajan (2000) nevertheless used different regressions to estimate coefficients for the domestic and foreign indexes separately. The coefficient on the foreign index of restriction on establishment was -0.205 (significant at the 5 per cent level), and the coefficient on the domestic index of restrictions on establishment was -0.605 (significant at the 10 per cent level). This suggests that restrictions affecting domestic entrants are relatively more cost raising than those that affect foreign entrants. The coefficients are likely to be somewhat overstated, since with only one index entered into each regression, the separate effect of the other could not be controlled for. But against this, the net effects on price-cost margins are likely to understate total effects on prices and costs.
Kalirajan (2000) estimated the cost impacts of restrictions on establishment for each country in his econometric sample, using country-specific averages of R (averaged across all the firms in that country). To facilitate comparability when doing out-of-sample forecasting to other countries and time periods, the cost impacts at the end of this paper have been estimated using his sample average of R over all firms in all countries. This value is 1.0573. The cost impacts have been computed for all countries for which trade restrictiveness indexes are available, rather than just those used in the econometric sample.

62
4.4 Electricity generation
Steiner (2000) estimated the effects of the three dimensions of regulatory regimes on industrial electricity prices, while correcting for a range of other influences. One additional regulatory influence was the extent of government ownership. Two additional variables were designed to capture the effects of policy announcements — time to liberalisation, and time to privatisation. Finally, Steiner included three important non-regulatory variables — the share of electricity generated from hydro sources, the share generated from nuclear sources, and real GDP (capturing both the genuine scale effect from differences in size or population, and the affluence effect arising from differences in per capita incomes).
Separating generation from transmission, allowing third party access to the transmission grid and allowing a wholesale electricity market were all found to lead to lower industrial electricity prices.
The coefficients on the remaining three regulatory variables were less intuitive. Doove et al. (2001) speculated that this was because it was the interaction of privatisation and unbundling, rather than privatisation per se, that could be expected to affect electricity prices. Doove et al. also noted a lack of in-sample variation in the announcement variables. As in their study, these dimensions of the regulatory regime are excluded from the estimated price impacts below.
Doove et al. (2001) show that, given the functional forms in Steiner, the price impact of inappropriate regulation in electricity generation can be computed as
P – P0 = ∑βidRi (4) P0 P - ∑βidRi
where P is the electricity price, P0 is the value that price would take with an appropriate or ‘benchmark’ regulatory regime, dRi = Ri – Ri0 is the difference between the regulatory variable i in the actual and benchmark regimes, and βi is the coefficient on the regulatory variable in Steiner’s regression.
The benchmark regime was chosen to be the one that minimised prices. Given the estimated signs of the coefficients in the regulatory variables, this was a regime that had unbundling, third party access and a wholesale price pool. For a country that did not have unbundling, the value of its regulatory variable in this dimension would be 0, its benchmark value would be 1, and dRi would be -1.
In addition to values of the dRi variables, the formula requires a value for the estimated coefficients and a value for the electricity price. In implementing the formula, Doove et

63
al. (2001) chose to use the value of the price as predicted by the Steiner regression (ignoring the effects of the counter-intuitive variables), rather than the actual price. This aided comparability in price impacts, by abstracting from the random component of price variation. Thus, the value for P used in equation (4) was estimated from the Steiner regression as
P = 0.0666506 + 0.00000144*GDP - 0.0340654*hyrdo share + 0.0022297*nuclear share - 0.0010961*R1 - 0.0026927*R2 - 0.0052294*R3
where R1 is the regulatory variable for unbundling, R2 is the variable for third party access, and R3 is the variable for a wholesale price pool.
Implementing this measure of P requires data on GDP (measured in billions if US dollars, 1995, purchasing power parity values), the hydro share and the nuclear share (both as ratios between 0 and 1). Doove et al. (2001) obtained the purchasing power parity measures of GDP from the OECD website for OECD countries. The values for all non-OECD countries, except Taiwan, were estimated from World Bank data showing the relationship between PPP and nominal exchange rates for each economy (World Bank 2000) and US dollar GDP data sourced from IMF (2000). In the absence of PPP estimates for Taiwan, the nominal exchange rate was used in its place (IMF 2000). Doove et al. (2001) obtained the data on the hydro and nuclear shares predominantly from IEA (1998), although updated estimates can generally also be obtained from the same sources as provide the regulatory information (see the previous chapter), or from the World Bank’s World Development Indicators. The values for these variables used in the price impact calculations are also shown in table E1 at the end of the paper.7
The Steiner study does not identify whether the higher prices would be the result of higher markups or higher production costs. Based on experiences in a range of countries, Doove et al. (2001) speculate that a regulatory regime that is not pro-competitive is likely to encourage x-inefficiency, allowing incumbents to employ more capital and labour than is strictly necessary to produce a given level of output.
4.5 Maritime — ports
Clark, Dollar and Micco (2001) estimated the effects that port efficiency had on maritime charges (per unit of weight), correcting for a range of other factors that affect those charges — distance, the value of goods shipped per unit of weight, the presence of price
7 The values differ slightly from those in Doove et al. (2001) because a small error in implementing equation (4) has been corrected.
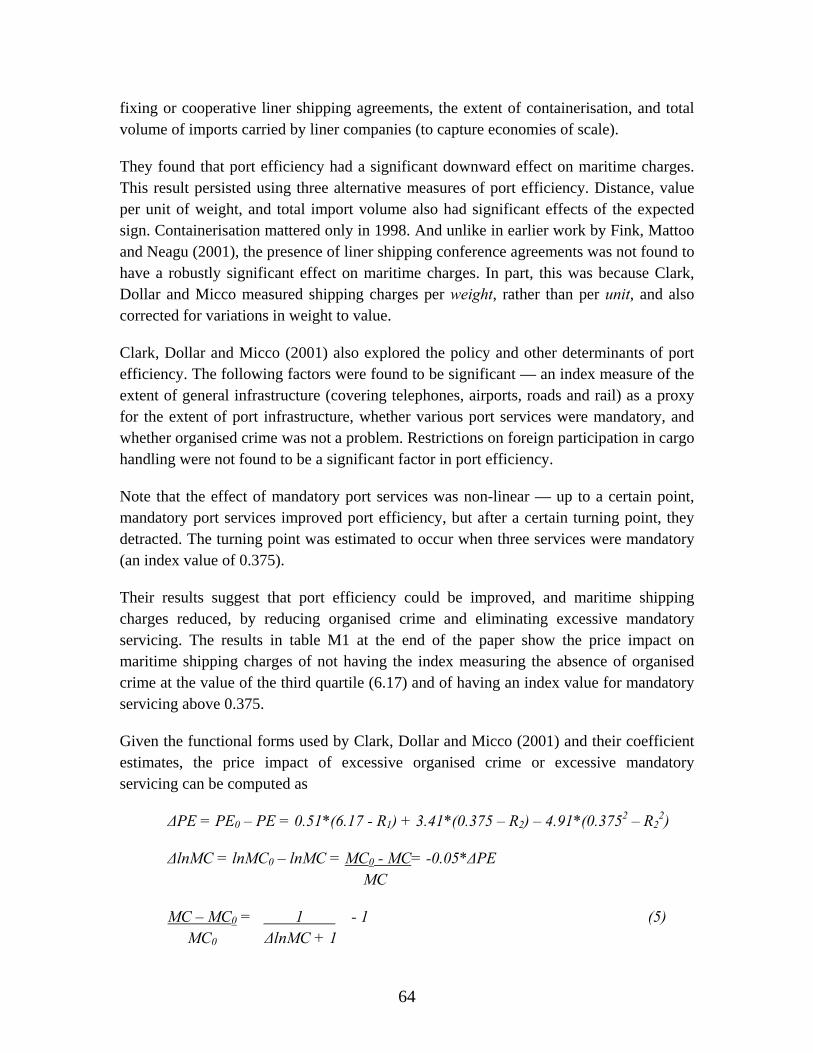
64
fixing or cooperative liner shipping agreements, the extent of containerisation, and total volume of imports carried by liner companies (to capture economies of scale).
They found that port efficiency had a significant downward effect on maritime charges. This result persisted using three alternative measures of port efficiency. Distance, value per unit of weight, and total import volume also had significant effects of the expected sign. Containerisation mattered only in 1998. And unlike in earlier work by Fink, Mattoo and Neagu (2001), the presence of liner shipping conference agreements was not found to have a robustly significant effect on maritime charges. In part, this was because Clark, Dollar and Micco measured shipping charges per weight, rather than per unit, and also corrected for variations in weight to value.
Clark, Dollar and Micco (2001) also explored the policy and other determinants of port efficiency. The following factors were found to be significant — an index measure of the extent of general infrastructure (covering telephones, airports, roads and rail) as a proxy for the extent of port infrastructure, whether various port services were mandatory, and whether organised crime was not a problem. Restrictions on foreign participation in cargo handling were not found to be a significant factor in port efficiency.
Note that the effect of mandatory port services was non-linear — up to a certain point, mandatory port services improved port efficiency, but after a certain turning point, they detracted. The turning point was estimated to occur when three services were mandatory (an index value of 0.375).
Their results suggest that port efficiency could be improved, and maritime shipping charges reduced, by reducing organised crime and eliminating excessive mandatory servicing. The results in table M1 at the end of the paper show the price impact on maritime shipping charges of not having the index measuring the absence of organised crime at the value of the third quartile (6.17) and of having an index value for mandatory servicing above 0.375.
Given the functional forms used by Clark, Dollar and Micco (2001) and their coefficient estimates, the price impact of excessive organised crime or excessive mandatory servicing can be computed as
ΔPE = PE0 – PE = 0.51*(6.17 - R1) + 3.41*(0.375 – R2) – 4.91*(0.3752 – R22)
ΔlnMC = lnMC0 – lnMC = MC0 - MC= -0.05*ΔPE MC
MC – MC0 = 1 - 1 (5) MC0 ΔlnMC + 1

65
where PE and MC are current port efficiency and maritime shipping charges, PE0 and MC0 are their values in the benchmark regime, R1 is the index of absence of organised crime, and R2 is the index of mandatory servicing.
The modelling framework of Clark, Dollar and Micco (2001) assumes that the reduction in maritime charges that would come from moving to a benchmark regime would come from a reduction in marginal costs rather than a reduction in markups.
4.6 Professions
Nguyen-Hong (2000) estimated a model of the performance of engineering firms, in order to estimate the effects of trade restrictions on firm profitability, correcting for all the other factors that are likely to affect profitability in the sector. Extending models of profitability by Mueller (1986), the potentially relevant control variables were:
• market share of the particular firm;
• extent of overall market concentration;
• R&D spending, as an indicator of product differentiation;
• recent sales growth;
• diversification;
• absolute size;
• cost of capital.
Nguyen-Hong (2000) found that, correcting for other influences, non-discriminatory domestic barriers to establishment had a significant and negative effect on the price-cost margins of engineering firms. Discriminatory barriers to foreign establishment and ongoing operation had a significant and positive effect on price-cost margins.
This finding suggests that the non-discriminatory restrictions, such as local licensing and accreditation requirements, are likely to raise costs, but that the discriminatory nationality, residency and other restrictions placed on foreign professionals are likely to protect incumbent engineering professionals from competition and to create rents. In practice, both sorts of restrictions are likely to have independent effects on both prices and costs. The net impacts found by Nguyen-Hong would therefore understate the total impacts of the restrictions on competitiveness and efficiency.
Nguyen-Hong (2000) showed how the econometric results could be used to estimate the direct ‘cost impact’ of non-discriminatory restrictions and the ‘price impact’ of

66
discriminatory restrictions for each country in the sample. Given the functional forms, these could be computed as
p – p0 = Rβe(1–m)FBE + Rβo(1-m)FBO (6a) p0
v - v0 = βd(1–m)DBE (6b) v0 1/R - βd(1–m)DBE
where p and v are price and unit cost, p0 and v0 are their values in the absence of measured restrictions, m is the sample mean of each firm’s market share in its economy, R is the ratio of revenue to cost, FBE is the index of foreign barriers to entry and βe is its coefficient, FBO is the index of foreign barriers to operation and βo is its coefficient, DBE is the index of domestic barriers to entry and βd is the absolute value of its coefficient.
The relative effects of the discriminatory and non-discriminatory restrictions were able to be identified by entering the foreign and domestic index measures together into the same regression. Therefore, multicollinearity was controlled for and the resulting coefficient estimates were not overstated. The estimated value of βe was 0.37 (significant at the 1 per cent level), the estimated value of βo was 0.26 (significant at the 10 per cent level), and the estimated value of value of βd (in absolute value) was 0.55 (significant at the 5 per cent level).
Nguyen-Hong (2000) estimated the price and cost impacts for engineering for each country in his econometric sample, using country-specific averages of (1-m) and R (averaged across all the firms in that country). To facilitate comparability when doing out-of-sample forecasting to other countries and time periods, the price and cost impacts at the end of this paper have been estimated using his sample averages of (1-m) and R over all firms in all countries. These values were 0.9652 for (1-m) and 1.0859 for R. The price and cost impacts have been computed for all countries for which trade restrictiveness indexes are available, rather than just those used in the econometric sample.
Nguyen-Hong’s econometric results for engineering have also been extended to the other professions — accountancy, architecture and the legal profession, using the same coefficient estimates and values for (1-m) and R. This takes advantage of the comparability of the restrictiveness indexes across the professions. Ideally, the impact of trade restrictions on performance in these sectors should be estimated separately. However, given the prevalence of unincorporated structures in accountancy and law, performance data for these sectors is hard to obtain.
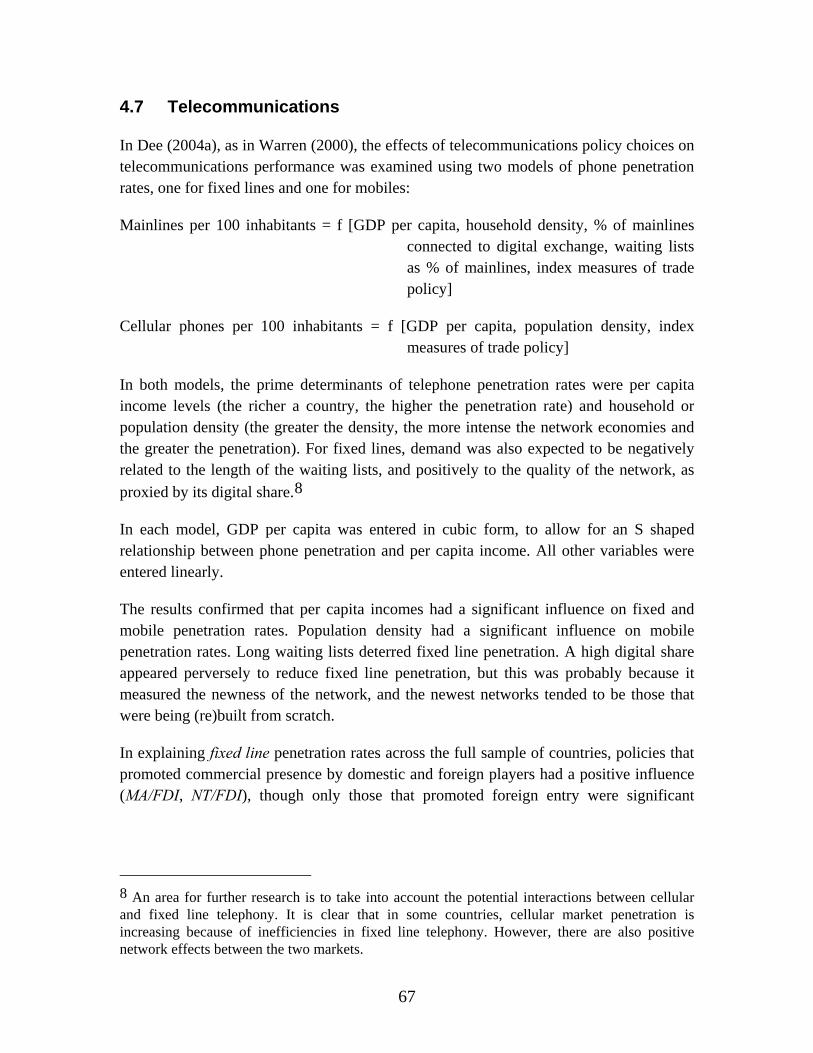
67
4.7 Telecommunications
In Dee (2004a), as in Warren (2000), the effects of telecommunications policy choices on telecommunications performance was examined using two models of phone penetration rates, one for fixed lines and one for mobiles:
Mainlines per 100 inhabitants = f [GDP per capita, household density, % of mainlines connected to digital exchange, waiting lists as % of mainlines, index measures of trade policy]
Cellular phones per 100 inhabitants = f [GDP per capita, population density, index measures of trade policy]
In both models, the prime determinants of telephone penetration rates were per capita income levels (the richer a country, the higher the penetration rate) and household or population density (the greater the density, the more intense the network economies and the greater the penetration). For fixed lines, demand was also expected to be negatively related to the length of the waiting lists, and positively to the quality of the network, as proxied by its digital share.8
In each model, GDP per capita was entered in cubic form, to allow for an S shaped relationship between phone penetration and per capita income. All other variables were entered linearly.
The results confirmed that per capita incomes had a significant influence on fixed and mobile penetration rates. Population density had a significant influence on mobile penetration rates. Long waiting lists deterred fixed line penetration. A high digital share appeared perversely to reduce fixed line penetration, but this was probably because it measured the newness of the network, and the newest networks tended to be those that were being (re)built from scratch.
In explaining fixed line penetration rates across the full sample of countries, policies that promoted commercial presence by domestic and foreign players had a positive influence (MA/FDI, NT/FDI), though only those that promoted foreign entry were significant
8 An area for further research is to take into account the potential interactions between cellular and fixed line telephony. It is clear that in some countries, cellular market penetration is increasing because of inefficiencies in fixed line telephony. However, there are also positive network effects between the two markets.

68
(NT/FDI).9 Policies affecting cross-border trade (MA/Trade) did not matter much for overall fixed line penetration, which is not surprising given that technologies are increasingly moving against this mode of delivery.
In explaining mobile penetration rates across the full sample of countries, policies that affected commercial presence (MA/FDI, NT/FDI) mattered more than those affecting cross-border trade (MA/Trade, NT/Trade). This was not surprising, since in most countries comprehensive cross-border provision of cellular services would not be an option. But unlike for fixed line penetration, where foreign ownership was most significant, in the case of mobile penetration it was non-discriminatory policies that encouraged competition by any new entrant that were most significant.
The econometric specifications can be used to calculate ‘quantity impacts’ of current telecommunications trade policies. This is done by comparing the predicted values for fixed or mobile penetration rates under current policy settings with the predicted values were policies to be set at their most liberal. Given the functional forms and coefficient estimates in Dee (2004a), the quantity impacts for foreign firms can be computed as
100*Qf0 - Qf = 100*[2.892*(1-R1)+3.529*(1-R3)]/Qf
Qf
100*Qm0 - Qm = 100*[1.898*(1-R2)+1.075*(1-R3)]/Qm Qm
where Qf = 8.844 + 0.004*gdppc -0.000000014*gdppc2 +0.00000000000017*gdppc3 + 0.004*hd - 0.07*wait - 0.117*dshare + 10.483*time + 2.892*R1+3.529*R3
and Qm = -1.564 + 0.001*gdppc + 0.0000000028*gdppc2 -0.0000000000000765*gdppc3 + 0.001*pd + 11.274*time + 1.898*R2 + 1.075*R3
Here Qf and Qm is current fixed and mobile penetration, Qf0 and Qm0 is their values in the benchmark regime, R1 is the index of MA/FDI (fixed), R2 is the index of MA/FDI (mobile), R3 is the index of NT/FDI, gdppc is GDP per capita in US dollars, hd is household density (households per square kilometre), pd is population density (people per square kilometre), wait is waiting list as a percentage of mainlines in operation, dshare is the percentage of digital mainlines, and time is a time dummy that takes a value of 1 for post-2000 data and zero otherwise.
9 Fink, Matto and Rathindran (2002) also found a positive effect of competition on fixed line penetration, although they did not distinguish whether it was domestic or foreign. They also found evidence that the effect of competition operated through its interaction with privatisation.

69
The equivalent quantity impacts for domestic firms can be computed by omitting the term involving R3 from the numerator.
Implementing these measures of the quantity impacts requires data on these additional variables. Warren (2000) obtained the GDP per capita data from the IMF’s International Financial Statistics, population density from the World Bank’s World Tables, and the remaining data from the ITU’s Yearbook of Statistics: Telecommunications Services Chronological Time Services 1988-97. Data on fixed and mobile penetration, population density and GDP per capita are still freely available from the ITU website at http://www.itu.int/ITU-D/ict/statistics. The waitlist variable can be computed from the World Bank’s World Development Indicators. More up-to-date estimates of the digital share are sometimes available from the same information sources as provide the regulatory information (see the previous chapter). The values for these variables used in the quantity impact calculations are also shown in tables T1 to T156 at the end of the paper.
The quantity impacts of restriction on commercial presence in telecommunications can be converted to ‘tax equivalents’. As in Warren (2000), this is done using an indicative own price elasticity of demand of 1.2, taken from a survey of the empirical literature in Albon, Hardin and Dee (1997). The results estimate by how much the domestic prices of telecommunications services have been inflated because of the trade restrictions (the base for this calculation being the price without restrictions).
The general form of the calculation is
p – p0 = 1 - 1 (7) p0 QI/(-1.2) + 1
where QI = Q0 – Q, as calculated above. Q
Because of the way the price impacts are calculated, very large quantity impacts can translate into negative price impacts. Consequently, the maximum price and quantity impacts are both capped at 1000 per cent in the tables at the end of this paper.

70
References Adams, R., Dee, P., Gali, J. and McGuire, G. 2003, The Trade and Investment Effects of
Preferential Trading Arrangements — Old and New Evidence, Productivity Commission Staff Working Paper, Canberra, May.
Albon, R., Hardin, A. and Dee, P. 1997, Telecommunications Economics and Policy Issues, Industry Commission Staff Information Paper, AGPS, Canberra.
APEC (Asia Pacific Economic Cooperation) 1999, APEC Directory on Professional Services, http://www.dfat.gov.au/apec/prof_services/index.html.
APEC Air Services Group 2002, Report by Vietnam to the Steering Committee on More Competitive Transportation Industry (Including Infrastructure) on Implementation of Air Services Group Recommendations, TPT-WG21/SC/CT/AGS/2, Brisbane Australia, 23-27 September 2002, http://www.apec-tptwg.org.tw/TPT/tpt-main/Archives/tpt-wg21/Final-paper/Experts-Project-Groups/Competitive/Air-Services-Group/Air-Services-Report-Vietnam.doc
APEC Transport Working Group 1999, Country response to questionnaire on the Review of Implementation of Air Services Group Recommendation, http://www.iot.gov.tw/apec_tptwg.
Barth, J., Caprio, G. and Levine, R. 2002, ‘Bank Regulation and Supervision: What Works Best?’, mimeo, World Bank, January, subsequently published in Journal of Financial Intermediation, 13 (2004), pp. 205–48.
Berger, A., Cummins, J.D. and Weiss, M. 1997, ‘The coexistence of multiple distribution systems for financial services: The case of property liability insurance’, The Journal of Business, 70(4), pp. 515–46.
Betancourt, R. and Gautschi, D. 1993a, ‘The output of retail activities: concepts, measurement and evidence from US census data’, Review of Economics and Statistics, 75(2), pp. 294–304.
Betancourt, R. and Gautschi, D. 1993b, ‘Two essential characteristics of retail markets and their economic consequences’, Journal of Economic Behaviour and Organisation, 21, pp. 277–94.
Boylaud, O. and Nicoletti, G. 2000, Regulation, Market Structure and Performance in Telecommunications, Working Paper No. 237, ECO/WKP(2000)10, Economics Department, OECD, Paris, 12 April.
Button, K., Haynes, K. and Stough, R. 1998, Flying into the Future: Air Transport Policy in the European Union, Edward Elgar, United States.

71
Claessens, S., Demirgüç-Kunt, A. and Huizinga, H. 2001, ‘How does foreign entry affect domestic banking markets?’, Journal of Banking and Finance, 25, pp. 891–911.
Clark, X., Dollar, D. and Micco, A. 2001, ‘Maritime Transport Costs and Port Efficiency’, Mimeo, World Bank, available at econ.worldbank.org/files/11793_wps2781.pdf (accessed 23 July 2003), subsequently published as ‘Port efficiency, maritime transport costs, and bilateral trade’, Journal of Development Economics, 75 (2004), pp. 417–50.
Deardorff, A. and Stern, R. 2005, ‘Empirical analysis of barriers to international services transactions and the consequences of liberalisation’, in P.Dee and M. Ferrantino (eds), Quantitative Methods for Assessing the Effects of Non-tariff measures and Trade Facilitation, APEC Secretariat and World Scientific Publishing, Singapore, pp. 549–609.
Dee, P. 2004a, ‘Services Trade Liberalisation in South East European Countries’, study prepared for OECD, January (revised).
Dee, P. 2004b, ‘Services trade liberalisation in Russia and the Baltic States’, study prepared for OECD, January (revised).
Dee, P. 2005, ‘The economy-wide effects of a trade agreement between Japan and Australia: Services and Investment’, study commissioned by Government of Japan, January.
Dee, P., Duc, L.T. and Hiep, D.T. 2005, ‘Evaluating Vietnam’s WTO accession offer in services’, Study prepared for World Bank, May (revised).
Dee, P. and Hanslow, K. 2001, ‘Multilateral liberalisation of services trade’, in Stern, R. (ed.), Services in the International Economy, University of Michigan Press, Ann Arbor, pp. 117–39.
Dee, P. and Sidorenko, A. 2005, ‘The rise of services trade: regional initiatives and challenges for the WTO’, in C. Findlay and H. Soesastro (eds), Reshaping the Asia Pacific Economic Order, Routledge, London, pp. 200–26.
Doove, S., Gabbitas, O., Nguyen-Hong, D. and Owen, J. 2001, Price Effects of Regulation: International Air Passenger Transport, Telecommunications and Electricity Supply, Productivity Commission Staff Research Paper, Ausinfo, Canberra.
DTRD (Department of Transport and Regional Development) 1998, Submission by the Department of Transport and Regional Development to the Industry Commission Inquiry into International Air Services Inquiry, No. 88, Productivity Commission, Canberra, March.
72
Eschenbach, F. and Francois, J. 2002, ‘Financial Sector Competition, Services Trade and Growth’, CEPR Discussion Paper No. 3573.
Ethier, W. and Horn, H. 1991, ‘Services in international trade’, in Helpman, E. and Razin, A. (eds), International Trade and Trade Policy, MIT Press, Cambridge Massachusetts, pp. 223–44.
Findlay, C. and Warren, T. (eds) 2000, Impediments to Trade in Services: Measurement and Policy Implications, Routledge, London and New York.
Fink, C., Mattoo, A. and Neagu, C. 2001, Trade in International Maritime Services: How Much Does Policy Matter?, Working Paper No. 2522, World Bank, Washington DC.
Fink, C., Mattoo, A. and Rathindran, R. 2002, ‘Liberalising Basic Telecommunications: Evidence from Developing Countries’, paper presented at OECD-World Bank Services Experts Meeting, OECD, Paris, 4-5 March.
FLG (WTO Financial leaders Group) 1997, Common List of Barriers to Financial Services Trade, 11 April.
Francois, J. and Hoekman, B. 1999, ‘Market access in the service sectors’, Tinbergen Institute, manuscript, cited in B. Hoekman 2000, ‘The next round of services negotiations: identifying priorities and options’, Federal Reserve Bank of St Louis Review, 82(4), pp. 31–47.
Francois, J. and Schuknecht, l. 2000, ‘International Trade in Financial Services, Competition and Growth Performance’, Centre for International Economic Studies Paper No. 6.
Gonenc, R. and Nicoletti, G. 2000, Regulation, Market Structure and Performance in Air Passenger Transport, Working Paper No. 254, ECO/WKP(2000)27, Economics Department, OECD, Paris, 3 August.
Gregan, T. and Johnson, M. 1999, Impacts of Competition Enhancing Air Services Agreements: a Network Modelling Approach, Productivity Commission Staff Research Paper, Ausinfo, Canberra, July.
ICAO (International Civil Aviation Organisation) 1988, Digest of Bilateral Air Transport Agreements, Doc 9511.
ICAO 1995, Digest of Bilateral Air Transport Agreements, Doc 9511.
ICAO 1998, Traffic by Flight Stage 1996, Series TF-no. 111.
IEA (International Energy Agency) 1998, Electricity Information 1998, OECD, Paris.
IEA 2000, Electricity Information 2000, OECD, Paris.
73
IMF (International Monetary Fund) 2000, International Financial Statistics Yearbook, Washington DC.
ITU (International Telecommunications Union) 1999, Telecommunications Reform, 1998, Volumes I-V, ITU, Geneva.
ITU 2002, Vietnam Internet Case Study, ITU, Geneva, March.
Kalirajan, K. 2000, Restrictions on Trade in Distribution Services, Productivity Commission Staff Research Paper, Ausinfo, Canberra.
Kalirajan, K., McGuire, G., Nguyen-Hong, D. and Schuele, M. 2000, ‘The price impact of restrictions on banking services’, in Findlay, C. and Warren, T. (eds) 2000, Impediments to Trade in Services: Measurement and Policy Implications, Routledge, London and New York, pp. 215–30.
Kang, J. 2000, ‘Price impact of restrictions on maritime transport services’, in Findlay, C. and Warren, T. (eds) 2000, Impediments to Trade in Services: Measurement and Policy Implications, Routledge, London and New York, pp. 189–200.
Karsenty, G. 2002, ‘Trends on Services Trade Under GATS: Recent Developments’, paper presented at WTO Symposium on Assessment of Trade in Services, Geneva, 14-15 March, available at http://www.wto.org/english/tratop_e/serv_e/symp_assessment_serv_march02_e.htm, accessed 20 November 2003.
Lucas, R.E. 1976, ‘Econometric policy evaluation: A critique’, in Brunner, K. and Meltzer, A. (eds), The Phillips Curve and the Labour Market, Vol. 1, Carnegie-Rochester Conferences in Public Policy, North-Holland, Amsterdam.
Mattoo, A., Rathindran, R. and Subramanian, A. 2001, ‘Measuring Services Trade Liberalisation and its Impact on Economic Growth: An Illustration’, World Bank Working Paper No. 2655, World Bank.
McGuire, G. and Schuele, M. 2000, ‘Restrictiveness of international trade in banking services’, in C. Findlay and T. Warren (eds), Impediments to Trade in Services, Measurement and Policy Implications, Routledge, London and New York, pp. 201–214.
Mueller, D. 1986, Profits in the Long Run, Cambridge University Press, New York.
Nguyen-Hong, D. 2000, Restrictions on Trade in Professional Services, Productivity Commission Staff Research Paper, Ausinfo, Canberra.
Nguyen-Hong, D. and Wells, R. 2003, Restrictions on Trade in Education Services, Productivity Commission Staff Working Paper, Canberra, October.

74
OAS (Organization of American States) Trade Unit, SICE — Foreign Trade Information System, http://www.sice.oas.org.
OECD (Organisation for Economic Co-operation and Development) 1996, International Trade in Professional Services: Assessing Barriers and Encouraging Reform, OECD Documents, Paris.
OECD 2000a, Wholesale Trade Services, TD/TC/WP(99)18REV2, OECD, Paris.
OECD 2000b, Retail Trade Services, TD/TC/WP(99)41/REV1, OECD, Paris.
OECD 2004, The Economy-wide Effects of Services Trade Barriers in Selected Developing Countries, TD/TC/WP(2004)42, OECD, Paris.
PC (Productivity Commission) 1998, International Air Services, Report No. 2, Ausinfo, Canberra.
Saunders, A. and Schumacher, L. 1997a, The Determinants of Bank Interest Rate Margins: An international Study, George Washington University, Washington DC.
Saunders, A. and Schumacher, L. 1997b, The Determinants of Bank Interest Margins in Mexico’s Post-Privatisation Period, George Washington University, Washington DC.
Slade, M. 2004, ‘Competing models of firm profitability’, International Journal of Industrial Organisation, 22(3), pp. 289–308.
Steiner, F. 2000, Regulation, Industry Structure and Performance in the Electricity Supply Industry, Working Paper No. 238, ECO/WKP(2000)11, Economics Department, OECD, Paris, 12 April.
Trewin, R. 2000, ‘A price-impact measure of impediments to trade in telecommunications services’, in Findlay, C. and Warren, T. (eds) 2000, Impediments to Trade in Services: Measurement and Policy Implications, Routledge, London and New York, pp. 101–18.
US (United States) Department of State 2001, Transportation Affairs: Open Skies Agreements, http://www.state.gov.
Warren, T. 2000, ‘The impact on output of impediments to trade and investment in telecommunications services’, in Findlay, C. and Warren, T. (eds) 2000, Impediments to Trade in Services: Measurement and Policy Implications, Routledge, London and New York, pp. 85–100.
Whalley, J. 2004, ‘Assessing the benefits to developing countries of liberalisation in services trade’, World Economy, 27(8), pp. 1123–53.
World Bank 2000, World Development Indicators, New York.

75
World Economic Forum 1996-2000, The Global Competitiveness Report, Harvard University, Cambridge, USA, and World Economic Forum, Geneva, Switzerland.
WTO (Word Trade Organisation) 1996, Response to the Questionnaire on the Accountancy Sector, Working Party on Professional Services, S/WPPS/W/7.