greenhouse gas emissions analysis for the barrio logan
TRANSCRIPT

Greenhouse Gas Emissions Analysis for the Barrio Logan Community Plan Update Project, City of San Diego, California
Prepared for Prepared by
City of San Diego RECON Environmental, Inc.
202 C Street, MS-4A 1927 Fifth Avenue
San Diego, CA 92101 San Diego, CA 92101-2358
Contact: Lara Gates P 619.308.9333 F 619.308.9334
RECON Number 4716
August 17, 2012
Karen Bowling
Senior Environmental Analyst
Greenhouse Gas Analysis for the Barrio Logan Community Plan Update
Page i
TABLE OF CONTENTS
Executive Summary 1 1.0 Introduction 3
1.1 Understanding Global Climate Change 3 1.2 Greenhouse Gases of Primary Concern 3
2.0 Project Description 5 2.1 Project Overview 5 2.2 Development Summary 6
3.0 Existing Conditions 12 3.1 Environmental Setting 12
3.1.1 State and Regional GHG Inventories 12 3.1.2 CPU Area GHG Inventory 14 3.1.3 Consequences of Global Climate Change 17
3.2 Regulatory Background 18 3.2.1 International 18 3.2.2 National 21 3.2.3 State 24 3.2.4 Local 35
4.0 Significance Criteria and Analysis Methodologies 40 4.1 Determining Significance 40
4.1.1 900 MTCO2E Screening Criterion 41 4.1.2 Further Analysis Demonstrating a 28.3-percent Reduction in BAU 41 4.1.3 Other Threshold Considerations 43
4.2 Methodology and Assumptions 45 4.2.1 Defining Project Characteristics and Land Use 46 4.2.2 Estimating Construction Emissions 47 4.2.3 Estimating Vehicle Emissions 49 4.2.4 Estimating Energy Use Emissions 50 4.2.5 Estimating Area Source Emissions 53 4.2.6 Estimating Water and Wastewater Emissions 53 4.2.7 Estimating Solid Waste Emissions 54
5.0 Impact Analysis 55 5.1 Cumulative GHG Emissions 55
5.1.1 Impacts 55 5.1.2 Significance of Impacts 68 5.1.3 Mitigation 71 5.1.4 Significance of Impacts after Mitigation 72
5.2 Consistency with Adopted Plans, Policies, and Regulations 72 5.2.1 Impacts 72 5.2.2 Significance of Impacts 87
6.0 Conclusions and Recommendations 87 7.0 References Cited 89
Greenhouse Gas Analysis for the Barrio Logan Community Plan Update
Page ii
TABLE OF CONTENTS (CONT.)
FIGURES
1: Regional Location of the Barrio Logan Community Plan Area 7 2: Barrio Logan Community Plan Area on Aerial Photograph 8 3: Existing Land Use 9 4: Alternative 1 Proposed Land Use 10 5: Revised Alternative 2 Proposed Land Use 11
TABLES
1: Global Warming Potentials and Atmospheric Lifetimes 4 2: California GHG Emissions by Sector in 1990, 2000, 2004 and 2008 13 3: San Diego County GHG Emissions by Sector in 2006 14 4: Existing Modeled Land Uses 15 5: Plan Area GHG Emissions in 2010 17 6: CARB Scoping Plan-recommended GHG Reduction Measures 27 7: Project Types that Require a GHG Analysis and Mitigation 41 8: California BAU 2020 GHG Emissions Forecast (Modeled in 2008) 42 9: California BAU 2020 Comparative GHG Emissions Forecasts 44 10: San Diego Gas & Electric Intensity Factors 47 11: Future Modeled Land Uses 48 12: Existing Land Uses that Will Remain and Not Change 52 13: Estimated CPU Alternative 1 GHG Emissions and BAU Reductions 69 14: Estimated CPU Revised Alternative 2 GHG Emissions and BAU Reductions 70
ATTACHMENTS
1: Modeled GHG Emissions Outputs—Existing and Plan Buildout with and without GHG Reductions
Greenhouse Gas Analysis for the Barrio Logan Community Plan Update
Page 1
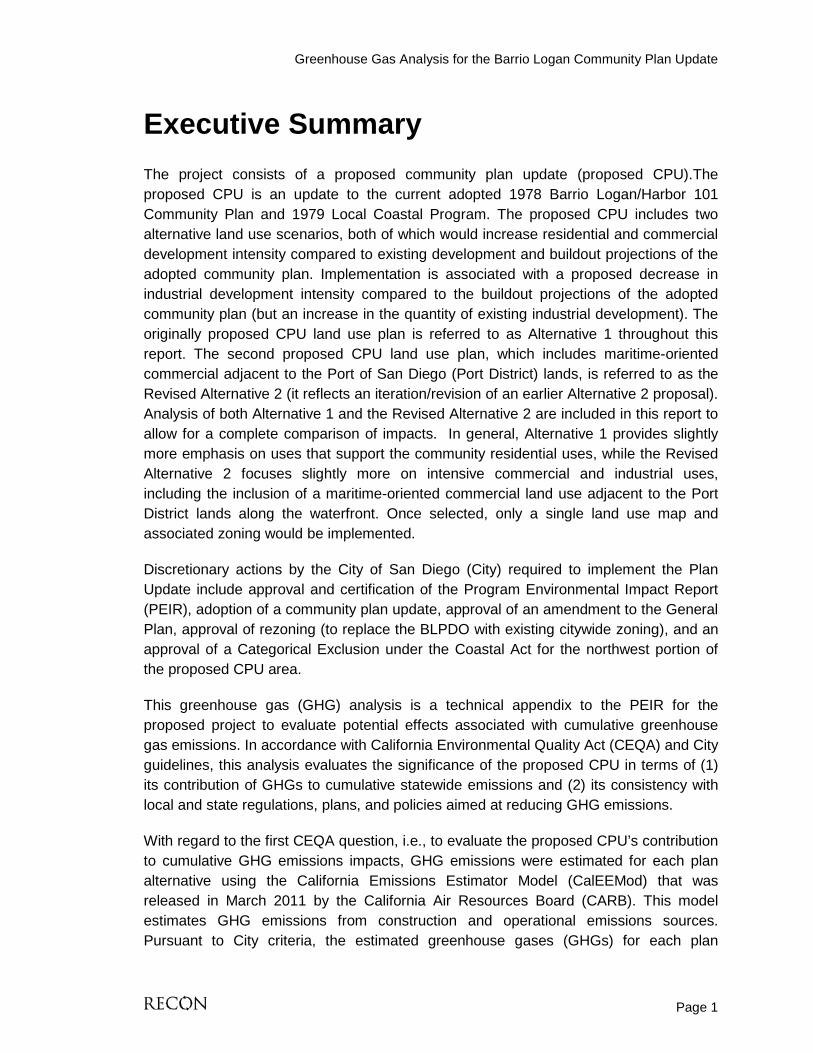
Executive Summary The project consists of a proposed community plan update (proposed CPU).The proposed CPU is an update to the current adopted 1978 Barrio Logan/Harbor 101 Community Plan and 1979 Local Coastal Program. The proposed CPU includes two alternative land use scenarios, both of which would increase residential and commercial development intensity compared to existing development and buildout projections of the adopted community plan. Implementation is associated with a proposed decrease in industrial development intensity compared to the buildout projections of the adopted community plan (but an increase in the quantity of existing industrial development). The originally proposed CPU land use plan is referred to as Alternative 1 throughout this report. The second proposed CPU land use plan, which includes maritime-oriented commercial adjacent to the Port of San Diego (Port District) lands, is referred to as the Revised Alternative 2 (it reflects an iteration/revision of an earlier Alternative 2 proposal). Analysis of both Alternative 1 and the Revised Alternative 2 are included in this report to allow for a complete comparison of impacts. In general, Alternative 1 provides slightly more emphasis on uses that support the community residential uses, while the Revised Alternative 2 focuses slightly more on intensive commercial and industrial uses, including the inclusion of a maritime-oriented commercial land use adjacent to the Port District lands along the waterfront. Once selected, only a single land use map and associated zoning would be implemented.
Discretionary actions by the City of San Diego (City) required to implement the Plan Update include approval and certification of the Program Environmental Impact Report (PEIR), adoption of a community plan update, approval of an amendment to the General Plan, approval of rezoning (to replace the BLPDO with existing citywide zoning), and an approval of a Categorical Exclusion under the Coastal Act for the northwest portion of the proposed CPU area.
This greenhouse gas (GHG) analysis is a technical appendix to the PEIR for the proposed project to evaluate potential effects associated with cumulative greenhouse gas emissions. In accordance with California Environmental Quality Act (CEQA) and City guidelines, this analysis evaluates the significance of the proposed CPU in terms of (1) its contribution of GHGs to cumulative statewide emissions and (2) its consistency with local and state regulations, plans, and policies aimed at reducing GHG emissions.
With regard to the first CEQA question, i.e., to evaluate the proposed CPU’s contribution to cumulative GHG emissions impacts, GHG emissions were estimated for each plan alternative using the California Emissions Estimator Model (CalEEMod) that was released in March 2011 by the California Air Resources Board (CARB). This model estimates GHG emissions from construction and operational emissions sources. Pursuant to City criteria, the estimated greenhouse gases (GHGs) for each plan
Greenhouse Gas Analysis for the Barrio Logan Community Plan Update
Page 2
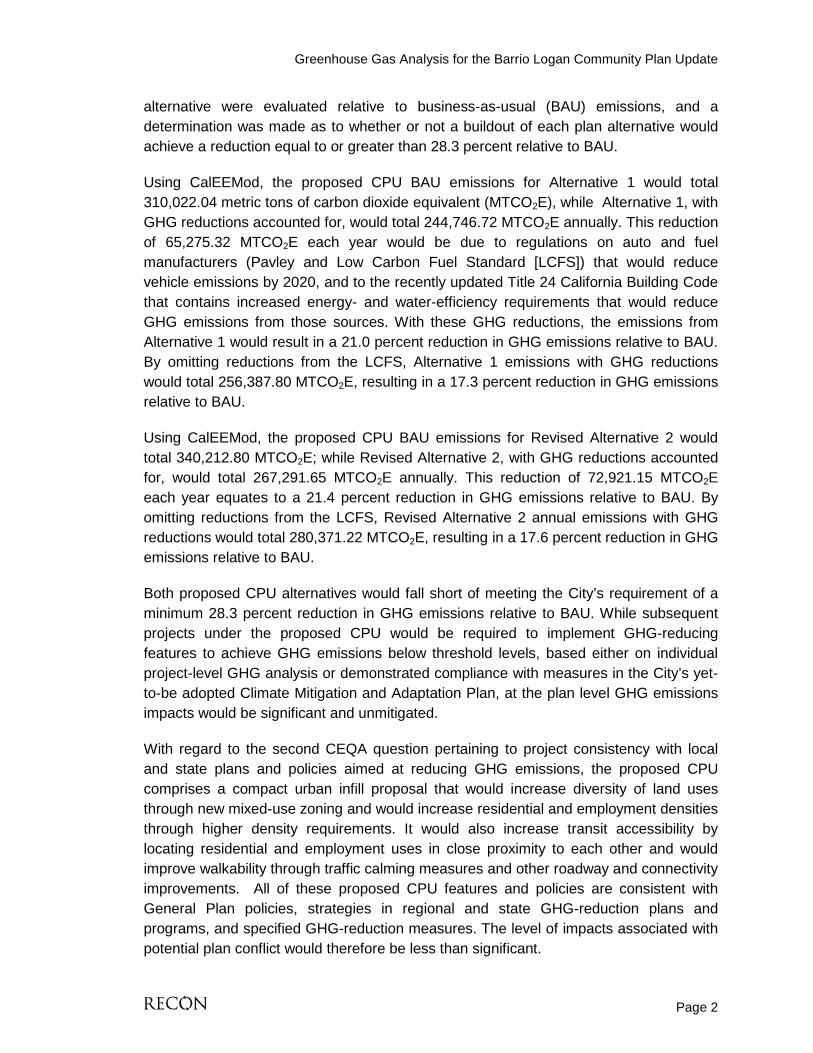
alternative were evaluated relative to business-as-usual (BAU) emissions, and a determination was made as to whether or not a buildout of each plan alternative would achieve a reduction equal to or greater than 28.3 percent relative to BAU.
Using CalEEMod, the proposed CPU BAU emissions for Alternative 1 would total 310,022.04 metric tons of carbon dioxide equivalent (MTCO2E), while Alternative 1, with GHG reductions accounted for, would total 244,746.72 MTCO2E annually. This reduction of 65,275.32 MTCO2E each year would be due to regulations on auto and fuel manufacturers (Pavley and Low Carbon Fuel Standard [LCFS]) that would reduce vehicle emissions by 2020, and to the recently updated Title 24 California Building Code that contains increased energy- and water-efficiency requirements that would reduce GHG emissions from those sources. With these GHG reductions, the emissions from Alternative 1 would result in a 21.0 percent reduction in GHG emissions relative to BAU. By omitting reductions from the LCFS, Alternative 1 emissions with GHG reductions would total 256,387.80 MTCO2E, resulting in a 17.3 percent reduction in GHG emissions relative to BAU.
Using CalEEMod, the proposed CPU BAU emissions for Revised Alternative 2 would total 340,212.80 MTCO2E; while Revised Alternative 2, with GHG reductions accounted for, would total 267,291.65 MTCO2E annually. This reduction of 72,921.15 MTCO2E each year equates to a 21.4 percent reduction in GHG emissions relative to BAU. By omitting reductions from the LCFS, Revised Alternative 2 annual emissions with GHG reductions would total 280,371.22 MTCO2E, resulting in a 17.6 percent reduction in GHG emissions relative to BAU.
Both proposed CPU alternatives would fall short of meeting the City’s requirement of a minimum 28.3 percent reduction in GHG emissions relative to BAU. While subsequent projects under the proposed CPU would be required to implement GHG-reducing features to achieve GHG emissions below threshold levels, based either on individual project-level GHG analysis or demonstrated compliance with measures in the City’s yet-to-be adopted Climate Mitigation and Adaptation Plan, at the plan level GHG emissions impacts would be significant and unmitigated.
With regard to the second CEQA question pertaining to project consistency with local and state plans and policies aimed at reducing GHG emissions, the proposed CPU comprises a compact urban infill proposal that would increase diversity of land uses through new mixed-use zoning and would increase residential and employment densities through higher density requirements. It would also increase transit accessibility by locating residential and employment uses in close proximity to each other and would improve walkability through traffic calming measures and other roadway and connectivity improvements. All of these proposed CPU features and policies are consistent with General Plan policies, strategies in regional and state GHG-reduction plans and programs, and specified GHG-reduction measures. The level of impacts associated with potential plan conflict would therefore be less than significant.

Greenhouse Gas Analysis for the Barrio Logan Community Plan Update
Page 3
1.0 Introduction To evaluate the incremental effect of the proposed CPU on statewide emissions and global climate change, it is important to have a basic understanding of the nature of the global climate change problem.
1.1 Understanding Global Climate Change
Global climate change is a change in the average weather of the earth, which can be measured by wind patterns, storms, precipitation, and temperature. The earth’s climate is in a state of constant flux with periodic warming and cooling cycles. Extreme periods of cooling are termed “ice ages,” which may then be followed by extended periods of warmth. For most of the earth’s geologic history, these periods of warming and cooling have been the result of many complicated interacting natural factors that include: volcanic eruptions that spew gases and particles (dust) into the atmosphere; the amount of water, vegetation, and ice covering the earth’s surface; subtle changes in the earth’s orbit; and the amount of energy released by the sun (sun cycles). However, since the beginning of the Industrial Revolution around 1750, the average temperature of the earth has been increasing at a rate that is faster than can be explained by natural climate cycles alone.
With the Industrial Revolution came an increase in the combustion of carbon-based fuels such as wood, coal, oil, natural gas, and biomass. Industrial processes have also created emissions of substances not found in nature. This in turn has led to a marked increase in the emissions of gases shown to influence the world’s climate. These gases, termed “greenhouse” gases, influence the amount of heat trapped in the earth’s atmosphere. Because recently observed increased concentrations of greenhouse gases (GHGs) in the atmosphere are related to increased emissions resulting from human activity, the current cycle of “global warming” is generally believed to be largely due to human activity. Of late, the issue of global warming or global climate change has arguably become the most important and widely debated environmental issue in the United States and the world. Because it is the collective of human actions taking place throughout the world that contributes to climate change, it is quintessentially a global or cumulative issue.
1.2 Greenhouse Gases of Primary Concern
There are numerous GHGs, both naturally occurring and manmade. Table 1 summarizes some of the most common. Each GHG has variable atmospheric lifetime and global warming potential.

Greenhouse Gas Analysis for the Barrio Logan Community Plan Update
Page 4
TABLE 1 GLOBAL WARMING POTENTIALS (GWPs) AND ATMOSPHERIC LIFETIMES (YEARS)
Gas
Atmospheric Lifetime 100-year GWP
20-year GWP
500-year GWP
Carbon dioxide (CO2) 50–200 1 1 1 Methane (CH4)* 12±3 21 56 6.5
Nitrous oxide (N2O) 120 310 280 170 HFC-23 264 11,700 9,100 9,800 HFC-32 5.6 650 2,100 200 HFC-125 32.6 2,800 4,600 920 HFC-134a 14.6 1,300 3,400 420 HFC-143a 48.3 3,800 5,000 1,400 HFC-152a 1.5 140 460 42
HFC-227ea 36.5 2,900 4,300 950 HFC-236fa 209 6,300 5,100 4,700
HFC-43-10mee 17.1 1,300 3,000 400 CF4 50,000 6,500 4,400 10,000 C2F6 10,000 9,200 6,200 14,000 C3F8 2,600 7,000 4,800 10,100 C4F10 2,600 7,000 4,800 10,100 c-C4F8 3,200 8,700 6,000 12,700 C5F12 4,100 7,500 5,100 11,000 C6F14 3,200 7,400 5,000 10,700 SF6 3,200 23,900 16,300 34,900
Source: U.S. EPA 2010a, Annex 6. *The methane global warming potential (GWP) includes the direct effects and those indirect effects due to the production of tropospheric ozone and stratospheric water vapor. The indirect effect due to the production of CO2 is not included.
The atmospheric lifetime of the GHG is the average time the molecule stays stable in the atmosphere. Most GHGs have long atmospheric lifetimes, staying in the atmosphere hundreds or thousands of years. The potential of a gas to trap heat and warm the atmosphere is measured by its global warming potential (GWP). Specifically, GWP is defined as (U.S. Environmental Protection Agency [EPA] 2010a):
the cumulative radiative forcing—both direct and indirect effects—integrated over a period of time from the emission of a unit mass of gas relative to some reference gas.
The reference gas for establishing GWP is carbon dioxide (CO2), which—as shown in Table 1—consequently has a GWP of 1. As an example, methane (CH4), while having a shorter atmospheric lifetime than carbon dioxide, has a 100-year GWP of 21, which means that it has a greater global warming effect than carbon dioxide on a molecule-by-molecule basis.

Greenhouse Gas Analysis for the Barrio Logan Community Plan Update
Page 5
Of the gases listed in Table 1, CO2, CH4, and nitrous oxide (N2O) are produced by both biogenic (natural) and anthropogenic (human) sources. The remaining gases occur solely as the result of human processes. Hydrofluorocarbons (HFCs) are synthetic, man-made chemicals used as substitutes for ozone-depleting chlorofluorocarbons used in air conditioners and as refrigerants. Perfluorocarbons (PFCs) such as tetrafluoromethane (CF4) are used primarily in aluminum production and semiconductor manufacture. Sulfur hexafluoride (SF6) is used for insulation in electric power transmission and distribution equipment. HFCs, PFCs, and sulfur hexafluoride are not of primary concern to the proposed project.
CO2, CH4 and N2O are the GHGs of primary concern in this analysis. Carbon dioxide would be emitted by the proposed project due to the combustion of fossil fuels in vehicles (including construction), from electricity generation and natural gas consumption, water use, and from solid waste disposal. Smaller amounts of methane and nitrous oxide would be emitted from the same project operations.
2.0 Project Description
2.1 Project Overview
The proposed CPU is an update of the current adopted 1978 Barrio Logan/Harbor 101 Community Plan and 1979 Local Coastal Program in order to increase residential and commercial development intensity compared to existing development and compared to the buildout projections of the adopted community plan. The City of San Diego (City) is the Lead Agency for the environmental processing of the project.
Discretionary actions by the City required to implement the proposed CPU include approval and certification of the Program Environmental Impact Report (PEIR), adoption of a proposed Community Plan Update, approval of an amendment to the General Plan, approval of rezoning (to replace the BLPDO with citywide zoning), and approval of a Categorical Exclusion under the Coastal Act for the northwest portion of the proposed CPU area. The Categorical Exclusion would delegate review authority of properties within this area of the proposed CPU to the City, thereby waiving the Coastal Commission review and hearing requirements as defined in the Coastal Act. The proposed development or redevelopment of a specific site would be required to be consistent with the certified Local Coastal Program for Barrio Logan and the implementing regulations of the Land Development Code to be eligible for this alternate process.
Greenhouse Gas Analysis for the Barrio Logan Community Plan Update
Page 6
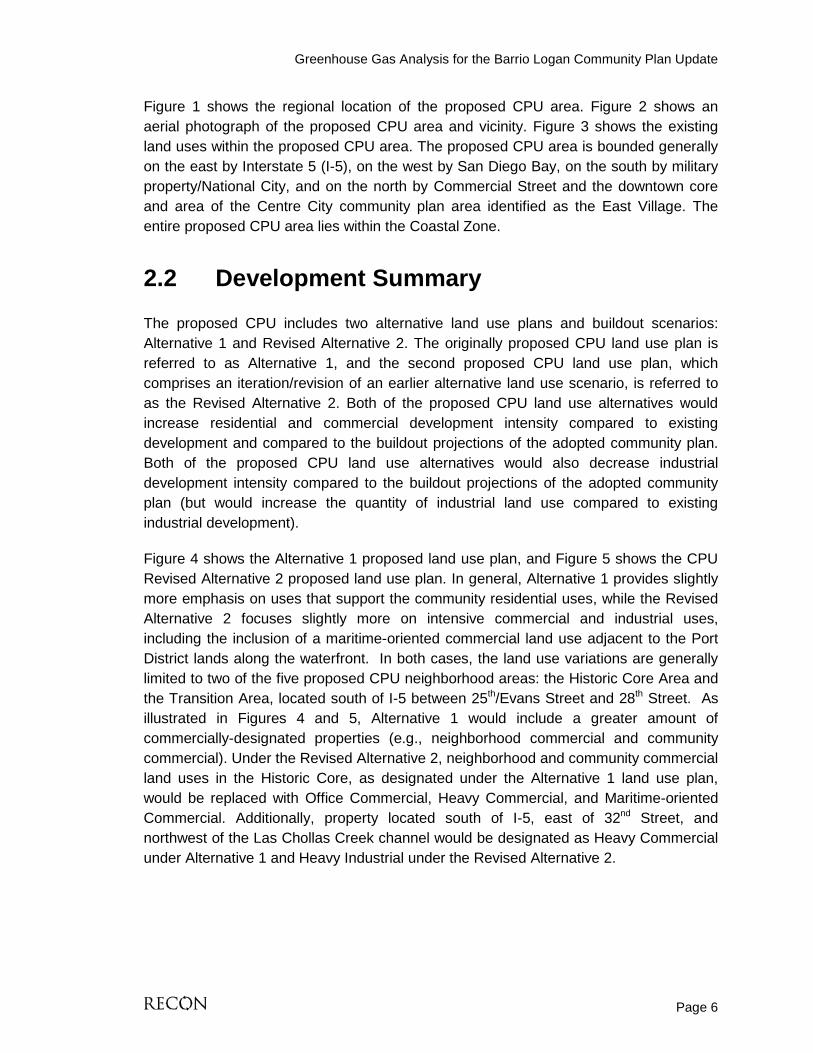
Figure 1 shows the regional location of the proposed CPU area. Figure 2 shows an aerial photograph of the proposed CPU area and vicinity. Figure 3 shows the existing land uses within the proposed CPU area. The proposed CPU area is bounded generally on the east by Interstate 5 (I-5), on the west by San Diego Bay, on the south by military property/National City, and on the north by Commercial Street and the downtown core and area of the Centre City community plan area identified as the East Village. The entire proposed CPU area lies within the Coastal Zone.
2.2 Development Summary
The proposed CPU includes two alternative land use plans and buildout scenarios: Alternative 1 and Revised Alternative 2. The originally proposed CPU land use plan is referred to as Alternative 1, and the second proposed CPU land use plan, which comprises an iteration/revision of an earlier alternative land use scenario, is referred to as the Revised Alternative 2. Both of the proposed CPU land use alternatives would increase residential and commercial development intensity compared to existing development and compared to the buildout projections of the adopted community plan. Both of the proposed CPU land use alternatives would also decrease industrial development intensity compared to the buildout projections of the adopted community plan (but would increase the quantity of industrial land use compared to existing industrial development).
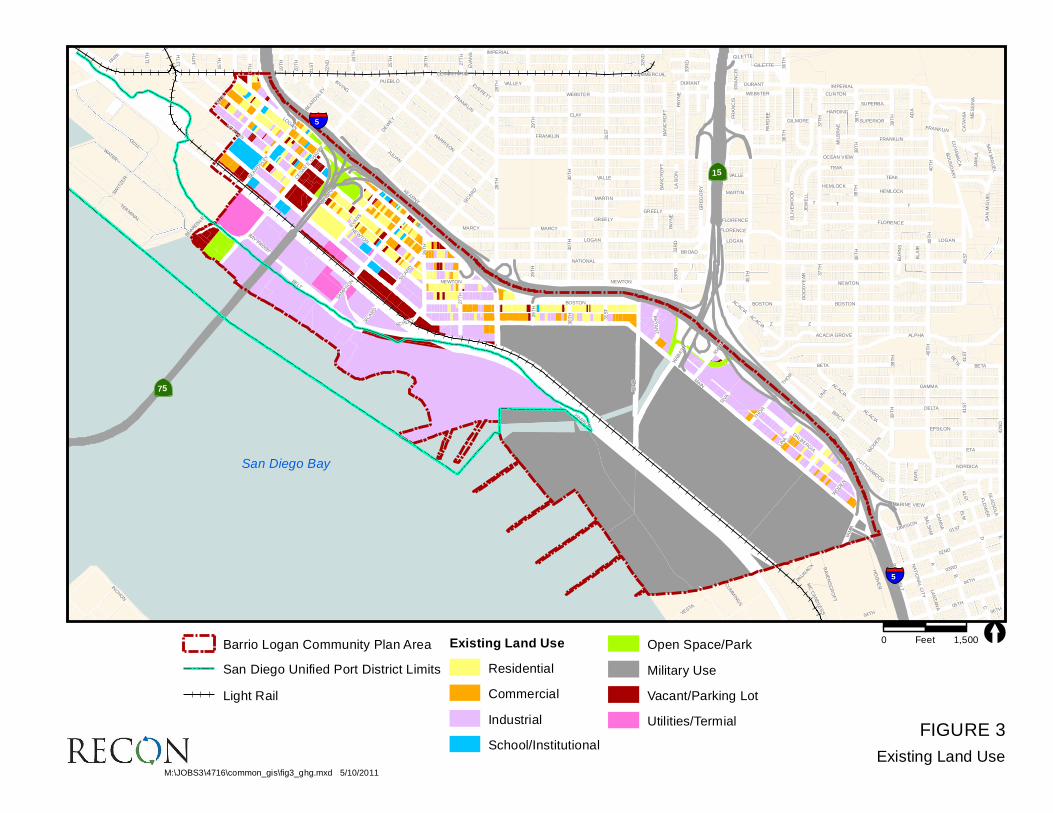
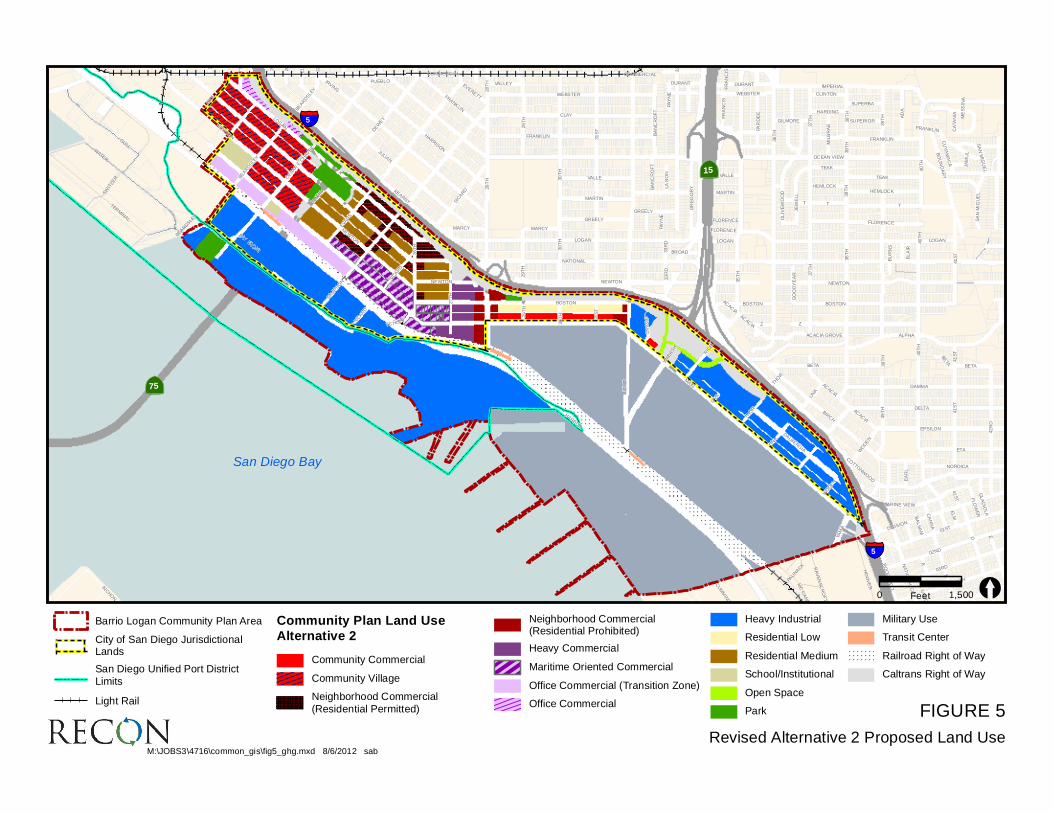
Figure 4 shows the Alternative 1 proposed land use plan, and Figure 5 shows the CPU Revised Alternative 2 proposed land use plan. In general, Alternative 1 provides slightly more emphasis on uses that support the community residential uses, while the Revised Alternative 2 focuses slightly more on intensive commercial and industrial uses, including the inclusion of a maritime-oriented commercial land use adjacent to the Port District lands along the waterfront. In both cases, the land use variations are generally limited to two of the five proposed CPU neighborhood areas: the Historic Core Area and the Transition Area, located south of I-5 between 25th/Evans Street and 28th Street. As illustrated in Figures 4 and 5, Alternative 1 would include a greater amount of commercially-designated properties (e.g., neighborhood commercial and community commercial). Under the Revised Alternative 2, neighborhood and community commercial land uses in the Historic Core, as designated under the Alternative 1 land use plan, would be replaced with Office Commercial, Heavy Commercial, and Maritime-oriented Commercial. Additionally, property located south of I-5, east of 32nd Street, and northwest of the Las Chollas Creek channel would be designated as Heavy Commercial under Alternative 1 and Heavy Industrial under the Revised Alternative 2.

FIGURE 1Regional Location of the Barrio Logan Community Plan Area
San Diego
Chula Vista
Bonita
Coronado
La Mesa
La Presa
National City
Spring ValleyLemon Grove
El Cajon
San Diego
Chula Vista
Bonita
Coronado
La Mesa
La Presa
National City
Spring ValleyLemon Grove
El Cajon
M:\JOBS3\4716\common_gis\fig1_ghg.mxd 5/10/2011
0 2Miles [
Barrio Logan Community Plan Area
§̈¦5
§̈¦5
§̈¦08 5
§̈¦15
·|}þ163
§̈¦08 5
|ÿ94
|ÿ54San Diego Bay
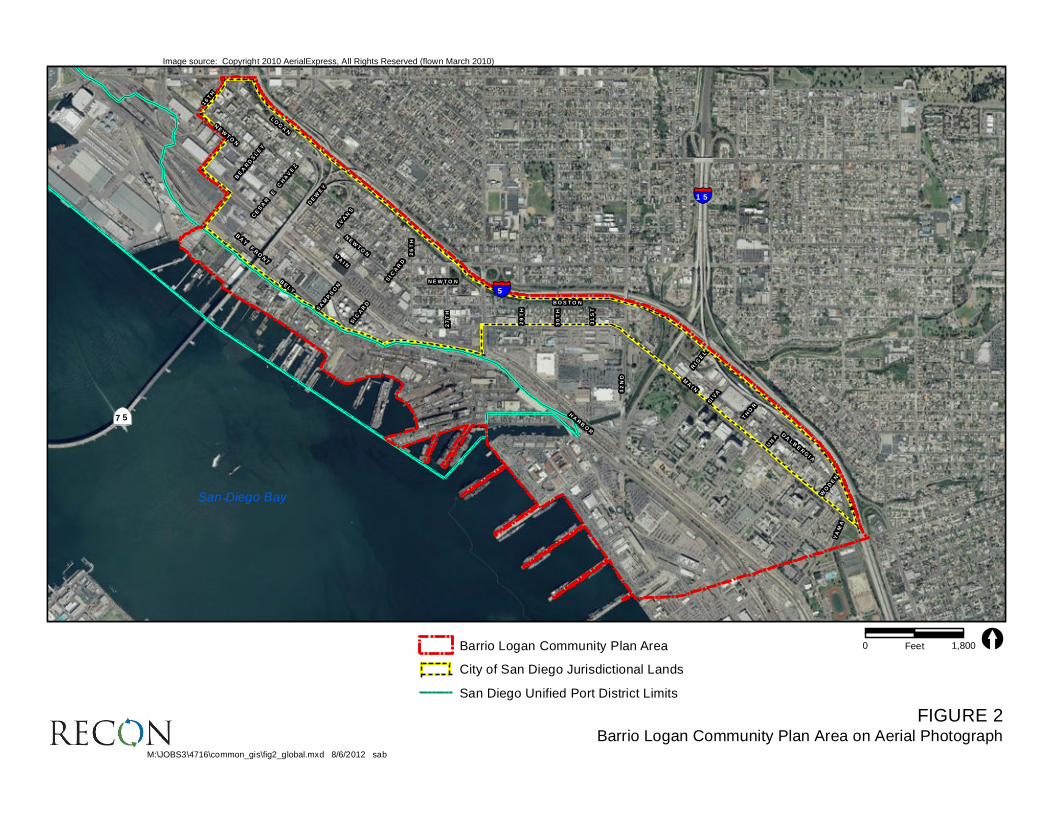
FIGURE 2Barrio Logan Community Plan Area on Aerial Photograph
§̈¦1 5
§̈¦5
|ÿ75
BEARDSLEY
LOGAN
BAY
FRONT
16TH
CESAR
E
CHAVEZ
NEWTON
DEWEY
EVANS
NEWTON
NE W TO N
SICARD
SICARD
27TH
SAMPSON
BELT
26TH
29TH
30TH
B O S TO N
31ST
SIVA
RIGEL
MAI N
THOR
UNA
DALBERGI A
WODEN
YAMA
32ND
HARBOR
MAI N
§̈¦1 5
§̈¦5
|ÿ75
BEARDSLEY
LOGAN
BAY
FRONT
16TH
CESAR
E
CHAVEZ
NEWTON
DEWEY
EVANS
NEWTON
NE W TO N
SICARD
SICARD
27TH
SAMPSON
BELT
26TH
29TH
30TH
B O S TO N
31ST
SIVA
RIGEL
MAI N
THOR
UNA
DALBERGI A
WODEN
YAMA
32ND
HARBOR
MAI N
Image source: Copyright 2010 AerialExpress, All Rights Reserved (flown March 2010)
M:\JOBS3\4716\common_gis\fig2_global.mxd 8/6/2012 sab
0 1,800Feet [Barrio Logan Community Plan Area
City of San Diego Jurisdictional Lands
San Diego Unified Port District Limits
San Diego Bay
MAIN
HARBOR
Z
NATIONAL
32
ND
T
D
28
TH
B
IMPERIAL
40
TH
36
TH
OCEAN VIEW
35
TH
31
ST
BELT
38
TH
33
RD
COMMERCIAL
LOGAN
CLAY
JULIAN
IRVING
BIRCH
KEARNY
SAM
PSO
N
WATER
42
ND
DELTA
37
TH
EV
AN
S
ALPHA
02ND
29
TH
BETA
03RD
01ST
GAMMA
05TH
ETA
41
ST
BOSTON
GULL
WEBSTER
FRANKLIN
NEWTO
N HARRISON
C
39
TH
27
TH
26
TH
DEW
EY
CESA
R E
CHAV
EZ
TEAK
RIG
EL
16TH
EPSILON
TERM
INAL
PARK
WAB
AS
H
E
AD
A
VALLE
A
DIVISION
CU
MM
ING
S
30
TH
FLORENCE
BO
UN
DA
RY
HO
OV
ER
DALBERGIA
MARTIN
GREELY
06TH
INCHO
N
04TH
17
TH
21
ST
NORDICA
13
TH
HEMLOCK
UNA
22
ND
GR
EG
OR
Y
RO
OS
EV
ELT
JE
WE
LL
BAY FRONT
20
TH
19
TH
DURANT
VESTA
PA
RD
EE
MARINE VIEW
YAM
A
SW
ITZE
R
THO
R
25
TH
NA
TIO
NA
L C
ITY
OL
IVE
WO
OD
MIL
BR
AE
MARCY
EA
RL
ACACIA GROVE
RA
VE
NS
CR
OF
T
VALLEY
ACAC
IA
SA
N M
IGU
EL
14
TH
BROAD
EL
M
15
TH
GILETTE
CLINTON
HARDING
GILMORE
SUPERBA
EVERETT
LA
BO
N
ME
SS
INA
SUPERIOR
BL
AIR
COTTO
NWO
OD
BA
NC
RO
FT
24
TH
BR
YA
NT
CU
YA
MA
CA
PUEBLO
FR
AN
CIS
GO
OD
YE
AR
JA
MU
L
BU
RN
S
PA
YN
E
CA
NN
A
CA
TA
NIA
PAUN
ACK
SIVA
BA
LS
AM
FLO
WE
R
11T
H
LA
NT
AN
A
BEARDSLE
Y
GL
AD
IOLA
41
ST
31
ST
FLORENCE
40
TH
NEWTON
IMPERIAL
26
TH
SICARD
LOG
AN
SICARD
FRANKLIN
BOSTON
FR
AN
CIS
38
TH
40
TH
38
TH
30
TH
NEWTO
N
39
TH
29
TH
SA
N M
IGU
EL
DURANT
04TH
36
TH
T
ACAC
IA
WO
DEN
29
TH
DEW
EY
33
RD LOGAN
MARCY
BETA
BEARDSLE
Y
HEMLOCK
BA
NC
RO
FT
28
TH
FRANKLIN
COMMERCIAL
SICARD
MARTIN
FLORENCE
WEBSTER
TEAK
GREELY
NEWTON
PA
YN
E
SCHLEY
BEARDSLE
Y
38
TH
Z
41
ST
UNA
ACAC
IA
FRANKLIN
GILETTE
BOSTON
LOGAN
WO
DEN
T
37
TH
27
TH
MC
CA
ND
LES
S
NEWTON
ACAC
IA
32
ND
33
RD
41
ST
30
TH
VALLE
THO
R
EVANS
BE
TA
39
TH
Barrio Logan Community Plan Area
San Diego Unified Port District Limits
Light Rail
Existing Land Use
Residential
Commercial
Industrial
School/Institutional
Open Space/Park
Military Use
Vacant/Parking Lot
Utilities/TermialFIGURE 3
Existing Land UseM:\JOBS3\4716\common_gis\fig3_ghg.mxd 5/10/2011
0 1,500Feet [
|ÿ75
§̈¦5
§̈¦5
|ÿ15
San Diego Bay
ACACIA
ACACIA
MAIN
HARBOR
Z
NATIONAL
32ND
T
D
28TH
B
40TH
36TH
OCEAN VIEW
35TH
31ST
BELT
38TH
33RD
COMMERC IAL
LOGAN
CLAY
JULIAN
IRVING
BIRCH
KEARNY
SAMPSON
WATER
42ND
DELTA
37TH
EV
ALPHA
02ND
29TH
BETA
03RD
01ST
GAMMA
TH
ETA
41ST
BOSTON
GULL
WEBSTER
FRANKLIN
NEWTON H
ARRISON
39TH
27TH
26TH
DEWEY
CESARECHAVEZ
TEAK
RIGEL
16TH
EPSILON
TERMINAL
P
WABASH
E
ADA
VALLE
A
DIVISIO
N
CUMMINGS
30TH
FLORENCE
BOUNDARY
HOOVER
DALBERGIA
MARTIN
GREELY
INCHON
17TH
21ST
NORDICA
13
HEMLOCK
UNA
22ND
GREGORY
ROOSEVELT
JEWELL
BAYFRONT
20TH
19TH
DURANT
PARDEE
MARINE VIEW
YAMA
SWITZER
THOR
25
NATIONALCITY
OLIVEWOOD
MILBRAE
MARCY
EARL
ACAC IA GROVE
RAVENSCROFT
VALLEY
ACACIA
SANMIGUEL
1
BROAD
ELM
15T
CLINTON
HARDING
GILMORE
SUPERBA
EVERETT
LABON
MESSINA
SUPERIOR
BLAIR
COTTO
NWOOD
BANCROFT
BRYANT
CUYAMACA
PUEBLO
FRANCIS
GOODYEAR
JAMUL
BURNS
PAYNE
CANNA
CATANIA
PAUNACK
SIVA
BALSAM
FLOWER
1
LANTAN
BEARDSLEY
GLADIOLA
41ST
31ST
FLORENCE
40TH
NEWTON
IMPERIAL
26
SICARD
LOGAN
SICARD
FRANKLIN
BOSTON
FRANCIS
38TH
40TH
38TH
30TH
NEWTON
39TH
29TH
SANMIGUEL
DURANT
04TH
36T
T
WODEN
29TH
DEWEY
33RD LOGAN
MARCY
BETA
BEARDSLEY
HEMLOCK
BANCROFT
28TH
FRANKLIN
COMMERC IAL
SICARD
MARTIN
FLORENCE
WEBSTER
TEAK
GREELY
NEWTON
PAYNE
SCHLEY
BEARDSLEY
38TH
Z
41ST
UNA
FRANKLIN
GILETTE
BOSTON
LOGAN
WODEN
T
37TH
2
MCCANDLE
NEWTON
ACACIA
32
33RD
41ST
30TH
VALLE
THOR
EVANS
BETA
39TH
Barrio Logan Community Plan
City of San Diego Jurisdictional Lands
San Diego Unified Port District Limits
Light Rail
Community Plan Land Use Alternative 1
Community Commercial
Community Village
"""""""""""""""""""""""""""""""""""""""""""""""""""""""""""""""""""""""""""""""""""""""""""""""""""""""""""""""""""""""""""""""""""""""""""""""""""""""""""""""""""""""""""""""""""""""""""""""""""""""""""""""""""""""""""""""""""""""
Neighborhood Commercial (Residential
Permitted)
Neighborhood Commercial (Residential
Prohibited)
Heavy Commercial
Office Commercial (Transition Zone)
Office Commercial
Heavy Industrial
Residential Low
Residential Medium
School/Institutional
Open Space
Park
Military Use
Transit Center
Railroad Right of Way
Caltrans Right of WayFIGURE 4
Alternative 1 Proposed Land UseM:\JOBS3\4716\common_gis\fig4_ghg.mxd 8/6/2012 sab
0 1,500Feet [
|ÿ75
§̈¦5
§̈¦5
|ÿ15
San Diego Bay
ACACIA
ACACIA
MAIN
HARBOR
Z
NATIONAL
32ND
T
D
28TH
B
40TH
36TH
OCEAN VIEW
35TH
31ST
BELT
38TH
33RD
COMMERCIAL
LOGAN
CLAY
JULIAN
IRVING
BIRCH
KEARNY
SAMPSON
WATER
42ND
DELTA
37TH
EV
ALPHA
02ND
29TH
BETA
03RD
01ST
GAMMA
TH
ETA
41ST
BOSTON
GULL
WEBSTER
FRANKLIN
NEWTON HARRISON
C
39TH
27TH
26TH
DEWEY
CESARECHAVEZ
TEAK
RIGEL
16TH
EPSILON
TERMINAL
P
WABASH
E
ADA
VALLE
A
DIVISIO
N
CUMMINGS
30TH
FLORENCE
BOUNDARY
HOOVER
DALBERGIA
MARTIN
GREELY
INCHON
17TH
21ST
NORDICA
13
HEMLOCK
UNA
22ND
GREGORY
ROOSEVELT
JEWELL
BAYFRO
NT
20TH
19TH
DURANT
PARDEE
MARINE VIEW
YAMA
SWITZER
THOR
25
NATIONALCITY
OLIVEWOOD
MILBRAE
MARCY
EARL
ACACIA GROVE
RAVENSCROFT
VALLEY
ACACIA
SANMIGUEL
1
BROAD
ELM
15T
CLINTON
HARDING
GILMORE
SUPERBA
EVERETT
LABON
MESSINA
SUPERIOR
BLAIR
COTTO
NWOOD
BANCROFT
BRYANT
CUYAMACA
PUEBLO
FRANCIS
GOODYEAR
JAMUL
BURNS
PAYNE
CANNA
CATANIA
PAUNACK
SIVA
BALSAM
FLOWER
1
LANTAN
BEARDSLEY
GLADIOLA
41ST
31ST
FLORENCE
40TH
NEWTON
IMPERIAL
26
SICARD
LOGAN
SICARD
FRANKLIN
BOSTON
FRANCIS
38TH
40TH
38TH
30TH
NEWTON
39TH
29TH
SANMIGUEL
DURANT
04TH
36T
T
WODEN
29TH
DEWEY
33RD LOGAN
MARCY
BETA
BEARDSLEY
HEMLOCK
BANCROFT
28TH
FRANKLIN
COMMERCIAL
SICARD
MARTIN
FLORENCE
WEBSTER
TEAK
GREELY
NEWTON
PAYNE
SCHLEY
BEARDSLEY
38TH
Z
41ST
UNA
FRANKLIN
GILETTE
BOSTON
LOGAN
WODEN
T
37TH
27
MCCANDLE
NEWTON
ACACIA
32
33RD
41ST
30TH
VALLE
THOR
EVANS
BETA
39TH
Barrio Logan Community Plan Area
City of San Diego JurisdictionalLands
San Diego Unified Port District
Limits
Light Rail
Community Plan Land Use
Alternative 2
Community Commercial
Community Village
""""""""""""""""""""""""""""""""""""""""""""""""""""""""""""""""""""""""""""""""""""""""""""""""""""""""""""""""""""""""""""""""""""""""""""""""""""""""""""""""""""""""""""""""""""""""""""""""""""""""""""""""""""""""""""""""""""""" Neighborhood Commercial
(Residential Permitted)
Neighborhood Commercial(Residential Prohibited)
Heavy Commercial
Maritime Oriented Commercial
Office Commercial (Transition Zone)
Office Commercial
Heavy Industrial
Residential Low
Residential Medium
School/Institutional
Open Space
Park
Military Use
Transit Center
Railroad Right of Way
Caltrans Right of Way
FIGURE 5
Revised Alternative 2 Proposed Land UseM:\JOBS3\4716\common_gis\fig5_ghg.mxd 8/6/2012 sab
0 1,500Feet [
|ÿ75
§̈¦5
§̈¦5
|ÿ15
San Diego Bay

Greenhouse Gas Analysis for the Barrio Logan Community Plan Update
Page 12
Although the Port Tidelands and the Navy properties are shown in Figures 4 and 5 as within the boundaries of the proposed CPU area, the City does not have regulatory jurisdiction over them. Only the properties within the City’s regulatory jurisdiction would be subject to the land use regulations of the proposed CPU. In this analysis, therefore, the Port and Navy properties were not evaluated, and only the potential GHG impacts from sources located within the proposed CPU area in which the City has regulatory jurisdiction were analyzed.
Several existing land uses would remain and are not proposed to be redeveloped as part of the proposed CPU. These include several single-family residences, recently constructed multi-family residences, recently entitled projects, existing major public and institutional uses such as the Cesar Chavez Continuing Education Center, the health center, Cesar Chavez and Chicano parks, Perkins Elementary School, and the Barrio Station. These land uses are referred to in the Methodology (Section 4.2) and Impact Analyses (Section 5.1) sections as the “No Change” land uses.
The land use buildout assumptions of each proposed CPU Alternative are discussed in greater detail in Section 4.2.1, particularly as they were quantified and modeled in the GHG emissions estimator model.
3.0 Existing Conditions
3.1 Environmental Setting
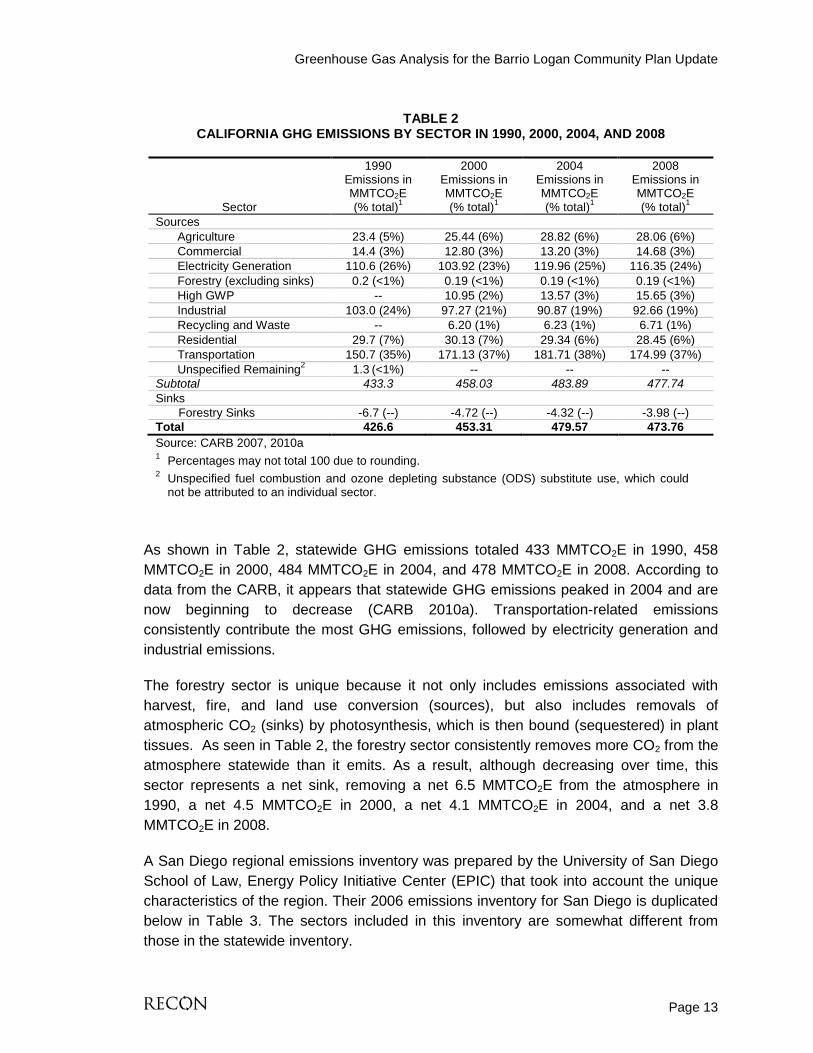
3.1.1 State and Regional GHG Inventories The California Air Resources Board (CARB) performs statewide GHG inventories. The inventory is divided into nine broad sectors of economic activity: agriculture, commercial, electricity generation, forestry, high GWP emitters, industrial, recycling and waste, residential, and transportation. Emissions are quantified in million metric tons of CO2 equivalent (MMTCO2E). Table 2 shows the estimated statewide GHG emissions for the years 1990, 2000, 2004, and 2008.
Greenhouse Gas Analysis for the Barrio Logan Community Plan Update
Page 13
TABLE 2
CALIFORNIA GHG EMISSIONS BY SECTOR IN 1990, 2000, 2004, AND 2008
Sector
1990 Emissions in MMTCO2E (% total)1
2000 Emissions in MMTCO2E (% total)1
2004 Emissions in MMTCO2E (% total)1
2008 Emissions in MMTCO2E (% total)1
Sources Agriculture 23.4 (5%) 25.44 (6%) 28.82 (6%) 28.06 (6%) Commercial 14.4 (3%) 12.80 (3%) 13.20 (3%) 14.68 (3%) Electricity Generation 110.6 (26%) 103.92 (23%) 119.96 (25%) 116.35 (24%) Forestry (excluding sinks) 0.2 (<1%) 0.19 (<1%) 0.19 (<1%) 0.19 (<1%) High GWP -- 10.95 (2%) 13.57 (3%) 15.65 (3%) Industrial 103.0 (24%) 97.27 (21%) 90.87 (19%) 92.66 (19%) Recycling and Waste -- 6.20 (1%) 6.23 (1%) 6.71 (1%) Residential 29.7 (7%) 30.13 (7%) 29.34 (6%) 28.45 (6%) Transportation 150.7 (35%) 171.13 (37%) 181.71 (38%) 174.99 (37%) Unspecified Remaining2 1.3 (<1%) -- -- -- Subtotal 433.3 458.03 483.89 477.74 Sinks Forestry Sinks -6.7 (--) -4.72 (--) -4.32 (--) -3.98 (--) Total 426.6 453.31 479.57 473.76 Source: CARB 2007, 2010a 1 Percentages may not total 100 due to rounding. 2 Unspecified fuel combustion and ozone depleting substance (ODS) substitute use, which could
not be attributed to an individual sector.
As shown in Table 2, statewide GHG emissions totaled 433 MMTCO2E in 1990, 458 MMTCO2E in 2000, 484 MMTCO2E in 2004, and 478 MMTCO2E in 2008. According to data from the CARB, it appears that statewide GHG emissions peaked in 2004 and are now beginning to decrease (CARB 2010a). Transportation-related emissions consistently contribute the most GHG emissions, followed by electricity generation and industrial emissions.
The forestry sector is unique because it not only includes emissions associated with harvest, fire, and land use conversion (sources), but also includes removals of atmospheric CO2 (sinks) by photosynthesis, which is then bound (sequestered) in plant tissues. As seen in Table 2, the forestry sector consistently removes more CO2 from the atmosphere statewide than it emits. As a result, although decreasing over time, this sector represents a net sink, removing a net 6.5 MMTCO2E from the atmosphere in 1990, a net 4.5 MMTCO2E in 2000, a net 4.1 MMTCO2E in 2004, and a net 3.8 MMTCO2E in 2008.
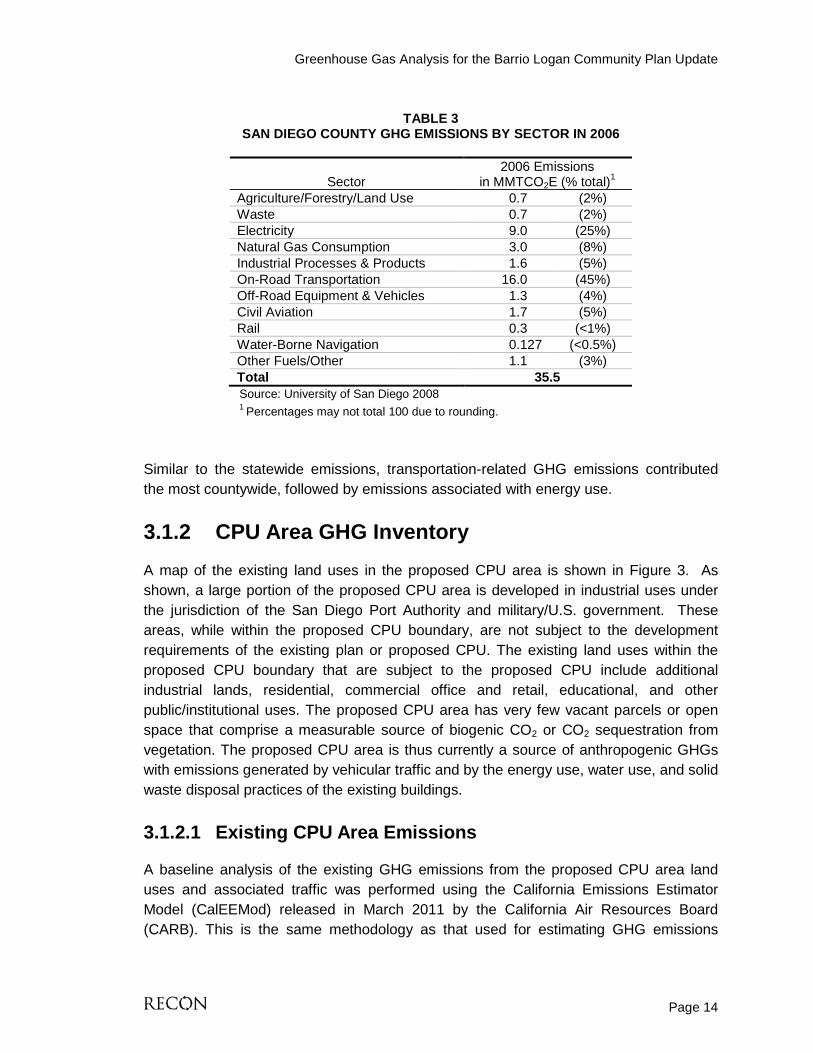
A San Diego regional emissions inventory was prepared by the University of San Diego School of Law, Energy Policy Initiative Center (EPIC) that took into account the unique characteristics of the region. Their 2006 emissions inventory for San Diego is duplicated below in Table 3. The sectors included in this inventory are somewhat different from those in the statewide inventory.
Greenhouse Gas Analysis for the Barrio Logan Community Plan Update
Page 14
TABLE 3
SAN DIEGO COUNTY GHG EMISSIONS BY SECTOR IN 2006
Sector 2006 Emissions
in MMTCO2E (% total)1 Agriculture/Forestry/Land Use 0.7 (2%) Waste 0.7 (2%) Electricity 9.0 (25%) Natural Gas Consumption 3.0 (8%) Industrial Processes & Products 1.6 (5%) On-Road Transportation 16.0 (45%) Off-Road Equipment & Vehicles 1.3 (4%) Civil Aviation 1.7 (5%) Rail 0.3 (<1%) Water-Borne Navigation 0.127 (<0.5%) Other Fuels/Other 1.1 (3%) Total 35.5 Source: University of San Diego 2008 1 Percentages may not total 100 due to rounding.
Similar to the statewide emissions, transportation-related GHG emissions contributed the most countywide, followed by emissions associated with energy use.
3.1.2 CPU Area GHG Inventory A map of the existing land uses in the proposed CPU area is shown in Figure 3. As shown, a large portion of the proposed CPU area is developed in industrial uses under the jurisdiction of the San Diego Port Authority and military/U.S. government. These areas, while within the proposed CPU boundary, are not subject to the development requirements of the existing plan or proposed CPU. The existing land uses within the proposed CPU boundary that are subject to the proposed CPU include additional industrial lands, residential, commercial office and retail, educational, and other public/institutional uses. The proposed CPU area has very few vacant parcels or open space that comprise a measurable source of biogenic CO2 or CO2 sequestration from vegetation. The proposed CPU area is thus currently a source of anthropogenic GHGs with emissions generated by vehicular traffic and by the energy use, water use, and solid waste disposal practices of the existing buildings.
3.1.2.1 Existing CPU Area Emissions
A baseline analysis of the existing GHG emissions from the proposed CPU area land uses and associated traffic was performed using the California Emissions Estimator Model (CalEEMod) released in March 2011 by the California Air Resources Board (CARB). This is the same methodology as that used for estimating GHG emissions

Greenhouse Gas Analysis for the Barrio Logan Community Plan Update
Page 15
resulting from proposed CPU buildout (refer to Section 4.2). In brief, CalEEMod is a computer model that estimates GHG emissions from mobile (i.e., vehicular) sources, area sources (fireplaces, woodstoves, and landscape maintenance equipment), energy use (electricity and natural gas used in space heating and cooling, ventilation and lighting; and plug-in appliances), water use, and solid waste disposal. Emissions are estimated based on land use information input to the model by the model user. The input land use information consists of land use subtypes (such as the residential subtypes of single-family residential and multi-family medium-rise residential) and their unit or square footage quantities. Other inputs include the air basin, climate zone, setting (urban, suburban, or rural), and utility provider (in this case San Diego Gas & Electric). In various places, the user can input additional information and/or override the default assumptions to account for project- or location-specific parameters. For this estimate of existing GHG emissions, the model default parameters including vehicle trip lengths and energy intensity factors were not changed.
Table 4 lists the existing land use quantities that were input to CalEEMod to estimate existing proposed CPU area GHG emissions.
TABLE 4 EXISTING MODELED LAND USES
Land Uses1 Existing
(Year 2010) Commercial (sf)2 1,234,490 Educational - Elementary (student) 529 Educational - Community College (student) 105 Educational - Community College (sf)3 8,700 Hotel (rooms) 67 Industrial (sf)4 2,482,850 Place of Worship (sf) 23,300 Retail (sf)5 194,900 Retail (pump) 16 Residential Multi-family (du) 518 Residential Single Family (du) 477 1Land use data obtained from Kimley-Horn & Associates, Inc. 2011 traffic impact analysis and recategorized to match land use subtypes of CalEEMod. 2Includes low rise office, other public service, other transportation, rail station, street front commercial, fire or police station, and other health care. 3Includes junior college. 4Includes heavy industrial, light industrial and warehousing. 5Includes fast food restaurant and neighborhood shopping center. sf = square feet du = dwelling unit pump = number of fueling pumps at a convenience market with gas pumps
The complete calculations of existing GHG emissions, including the CalEEMod input parameters and reported results, are included in Attachment 1 and summarized below.

Greenhouse Gas Analysis for the Barrio Logan Community Plan Update
Page 16
a. Vehicle Emissions
As identified in the traffic impact analysis, approximately 82,926 total vehicle trips are assumed to occur daily in association with the proposed CPU area (Kimley-Horn and Associates 2011). Based on this quantity of trips and the trip rates for each land use subtype identified in the traffic analysis and the default CalEEMod trip lengths as inputs to CalEEMod, approximately 187,211,168 vehicle miles are traveled (VMT) each year. This equates to a total of 96,031.30 MTCO2E of GHGs that are being emitted annually by vehicles associated with existing on-site land uses.
b. Energy Use Emissions
Based on the existing land use inputs identified in Table 4 and average electricity and natural gas consumption rates adjusted to 2005 Title 24 Energy Efficiency Standards in CalEEMod, the proposed CPU area’s existing buildings are estimated to emit approximately 27,636.34 MTCO2E of GHGs each year from the CPU area. Of this total, approximately 5,239.55 MTCO2E of GHGs are generated annually from natural gas combustion, and 22,396.79 MTCO2E of GHGs are generated annually from electricity use.
c. Area Source Emissions
CalEEMod estimates that existing area sources, determined from the land use inputs identified in Table 4, emit approximately 2,383.66 MTCO2E each year.
d. Water Use Emissions
Based on the existing land use inputs identified in Table 4 and default water use rates and embodied energy intensities, CalEEMod estimates that the embodied energy needed to supply and treat existing annual water consumption in the CPU area generates 69,851.42 MTCO2E of GHGs each year.
e. Solid Waste Emissions
Existing solid waste generation within the CPU area was estimated by CalEEMod by multiplying the land use inputs identified in Table 4 with average waste generation rates obtained from the California Department of Recycling (CalRecycle). The existing annual solid waste generation in the CPU area was thus estimated to be 129,337 tons. CalEEMod estimates that GHG emissions associated with disposing of this amount of waste generates 58,837.18 MTCO2E each year.

Greenhouse Gas Analysis for the Barrio Logan Community Plan Update
Page 17
f. Total Existing CPU Area GHG Emissions
The results of the analysis described above indicate that the existing CPU area uses are currently generating approximately 254,739.90 MTCO2E annually as shown in Table 5 below.
TABLE 5 PLAN AREA GHG EMISSIONS IN 2010
(MTCO2E PER YEAR)
Emission Source Existing Plan Area Emissions Vehicles 96,031.30 Energy Use 27,636.34 Area Sources 2,383.66 Water Use 69,851.42 Solid Waste Disposal 58,837.18
TOTAL 254,739.90
3.1.3 Consequences of Global Climate Change CARB projects a future statewide GHG emissions increase of more than 23 percent (from 2004) by 2020 given current trends (CARB 2008a). The 2008 EPIC study predicts a countywide increase to 43 MMTCO2E, or roughly 20 percent (from 2006) by 2020, given a BAU trajectory. Global GHG emissions forecasts also predict similar substantial increases, given a BAU trajectory.
The potential consequences of global climate change on the San Diego region are far reaching. The Climate Scenarios analysis report, published in 2006 by the California Climate Change Center, uses a range of emissions scenarios to project a series of potential warming ranges (low, medium, or high temperature increases) that may occur in California during the 21st century. Throughout the state and the region, global climate and local microclimate changes could cause an increase in extreme heat days; higher concentrations, frequency, and duration of air pollutants; an increase in wildfires; more intense coastal storms; sea level rise; impacts to water supply and water quality through reduced snowpack and saltwater influx; public health impacts; impacts to near-shore marine ecosystems; reduced quantity and quality of agricultural products; pest population increases; and altered natural ecosystems and biodiversity.
The Barrio Logan CPU area is located along the coast, adjacent to San Diego Bay. The Coastal Zone Boundary is shown on the aerial photograph in Figure 2. The entire CPU area is relatively flat and lies within the Coastal Zone, with elevations ranging from a high of approximately 60 feet above mean seal level (AMSL) in the northeastern portion of the CPU area near I-5 to a low of approximately 10 feet AMSL in the western portion near Harbor Drive. The CPU area is thus more susceptible than inland or higher-elevation locations to the potential threats of intense coastal storms and sea level rise.
Greenhouse Gas Analysis for the Barrio Logan Community Plan Update
Page 18
The 2001 California Coastal Commission staff report titled Overview of Sea Level and Some Implications for Coastal California describes the types of impact that are likely to occur at marine terminals and ports. In the near term, these impacts would not likely be significant, but over the years could become adverse. The report identifies a 90 percent probability that the sea level in the San Diego region will increase 3 inches by 2025 and as much as 9.5 inches by 2100. Potential impacts include reduced periods for loading and unloading cargo, reconstruction/heightening of docks and piers, and the potential for bay water to intrude into Las Chollas Creek.
A more recent regional study looking at sea level rise impacts affecting the San Diego Bay was released in January 2012 (ICLEI 2012). The report titled Sea Level Rise Adaptation Strategy for San Diego Bay evaluates where and when sea level rise impacts may occur, and recommends implementation of adaptation strategies to reduce those impacts. The report evaluated impacts based on a projected 20-inch (0.5 meter) increase in sea level in 2050 and a 59-inch (1.5 meter) increase in sea level in 2100. Rising sea levels are generally associated with impacts including flooding, inundation, erosion, salt water intrusion, and water table rise. A key finding of the report is that over the next few decades there will be an increase in the frequency and severity of flooding due to waves, storm surges, El Nino events, and very high tides. Starting around mid-century, it was found that regularly occurring inundation may impact parts of San Diego Bay.
There appear to be minimal impacts to the Barrio Logan Community Planning area in the 2050 scenario, but there is increased projected exposure to flooding and inundation in Barrio’s Port Lands in the 2100 scenario (ICLEI 2012).
3.2 Regulatory Background
In response to rising concern associated with increasing GHG emissions and global climate change impacts, several plans and regulations have been adopted at the international, national, and state levels with the aim of reducing GHG emissions.
3.2.1 International
3.2.1.1 Montreal Protocol on Substances that Deplete the Ozone Layer
Human caused effects on the global atmosphere first became widely known to the public at large in the mid-1970s when it was discovered that a number of substances, particularly chlorofluorocarbons (CFCs) used in refrigeration, when released into the atmosphere, could cause the breakdown of significant quantities of the earth’s protective ozone (O3) in the stratosphere (i.e., the “ozone layer”). Somewhat concurrent with this
Greenhouse Gas Analysis for the Barrio Logan Community Plan Update
Page 19
was the discovery of the now well documented “ozone hole” over Antarctica. The ozone layer filters out most of the ultraviolet-B (UV-B) radiation reaching the earth. Therefore, destruction of the ozone layer would allow more UV-B radiation to reach the earth’s surface potentially leading to increases in skin cancer and other effects such as crop damage and adverse effects on marine phytoplankton.
In response to these concerns, the Coordinating Committee on the Ozone Layer was established by the United Nations Environment Programme (UNEP) in 1977, and UNEP's Governing Council adopted the World Plan of Action on the Ozone Layer. Continuing efforts led to the signing in 1985 of the Vienna Convention on the Protection of the Ozone Layer. This led to the creation of the Montreal Protocol on Substances That Deplete the Ozone Layer (Montreal Protocol), an international treaty designed to protect the stratospheric ozone layer by phasing out production of ozone depleting substances. The Montreal Protocol was adopted on September 16, 1987 and was enacted on January 1, 1989. The Protocol has been amended four times since 1989: the London Amendment in 1990, Copenhagen Amendment in 1992, Montreal Amendment in 1997, and most recently the Beijing Amendment in 1999 (U.S. EPA 2010b).
This treaty is considered one of the most successful international treaties on environmental protection in the world, with ratification by 191 countries including the United States. By the end of 2006, the 191 parties to the treaty had phased out over 95 percent of ozone depleting substances (UNEP 2007). Because of this success, scientists are now predicting that the ozone hole will “heal” later this century.
The elimination of these ozone-depleting substances also has benefits relative to global climate change because most of these substances are also potent GHGs, with very high GWPs ranging from 4,680 to 10,720 (UNEP 2007; Australian Government 2007). However, the phasing out of ozone depleting substances has led to an increase in the use of non-ozone depleting substances such as hydrofluorocarbons (HFCs) which, although not detrimental to the ozone layer, are also potent GHGs. As shown in Table 1, these substances have GWPs ranging from 140 to 11,700.
3.2.1.2 Intergovernmental Panel on Climate Change
In response to growing concern about pollutants in the upper atmosphere and the potential problem of climate change, the World Meteorological Organization and the UNEP established the Intergovernmental Panel on Climate Change (IPCC) in 1988. The IPCC was tasked with assessing the scientific, technical, and socioeconomic information relevant to understanding the scientific basis for human-induced climate change, its potential impacts, and options for adaptation and mitigation. The most recent reports of the IPCC have emphasized the scientific consensus that real and measurable changes to the climate are occurring, that they are caused by human activity, and that significant
Greenhouse Gas Analysis for the Barrio Logan Community Plan Update
Page 20
adverse impacts on the environment, economy, and human health and welfare are unavoidable.
3.2.1.3 United Nations (UN) Framework Convention on Climate Change
In 1994, the Unites States joined a number of other nations in signing an international treaty known as the United Nations Framework Convention on Climate Change (UNFCCC). The UNFCCC recognized that global climate is a shared resource that can be affected by industrial and other emissions of GHGs and set an overall framework for intergovernmental efforts to tackle the challenges posed by global climate change.
As with the Montreal Protocol, UNFCCC was ratified by 191 countries including the United States. Under this treaty, governments were to (UNFCCC 2007a):
• gather and share information on GHG emissions, national policies, and best practices;
• launch national strategies for addressing GHG emissions and adapting to expected impacts; and
• cooperate with other nations in preparing for adaptation to the impacts of climate change.
The UNFCCC divided countries into three main groups according to differing commitments based on economic strength, vulnerability to adverse climate change impacts, and capacity to respond or adapt to climate change effects. The stronger economic nations, including the United States, were to provide financial and technological support to developing countries to enable them to undertake emissions reduction activities and to help them adapt to adverse effects of climate change.
The UNFCCC was enacted in March 1994; however, it generally lacked powerful, legally binding measures. This led to the development of the Kyoto Protocol.
3.2.1.4 Kyoto Protocol to the UNFCCC
Knowing that the UNFCCC did not contain the legally binding measures that would be required to meaningfully address global climate change, a conference of the UNFCCC signatory nations was held in Berlin in 1995 that launched a new round of discussions to determine more detailed and stronger commitments for industrialized countries (the Berlin Mandate). After 2.5 years of negotiations, the Kyoto Protocol was adopted in December 1997 (UNFCCC 2007b). While the 1997 Kyoto Protocol shared the UNFCCC’s objectives, it committed signatories to individual, legally binding targets to
Greenhouse Gas Analysis for the Barrio Logan Community Plan Update
Page 21
limit or reduce their GHG emissions. By March 1999, 84 countries, including the United States, had signed the Kyoto Protocol (UNFCCC 2009).
Only Parties to the UNFCCC that have also become Parties to the Kyoto Protocol are bound by the Kyoto Protocol’s commitments. Governments become Parties to the Protocol by ratifying, accepting, approving, or acceding to it. Because of the complexity of the negotiations and uncertainty associated with the rules or how they would operate, several of the signing countries, including the United States, were reluctant to actually ratify the Protocol. Therefore, a new round of negotiations was undertaken to flesh out the Kyoto Protocol’s rulebook. These negotiations concluded with the adoption of the Marrakesh Accords in 2001. With the adoption of the Marrakesh Accords, the Protocol was enacted in February 2005, and by July 2009 184 governments had become Parties to the Protocol (UNFCCC 2007b, 2009). In December 2009, a Copenhagen Accord was held to address global climate change issues in the future; however, no further measures were adopted. The most recent UN Climate Change Conference occurred in Cancun, Mexico from November 29 to December 10, 2010 and resulted in 26 agreements related to GHG emission reductions (Cancun Accords).
Although a signer to the Kyoto Protocol, the U.S. has not ratified the Kyoto Protocol to date because it does not mandate emissions reductions from all countries including several developing countries whose GHG emissions are expected to exceed emissions from developed countries within the next 25 years (U.S. EPA 2007a).
3.2.2 National
3.2.2.1 Clean Air Act, Title VI—Stratospheric Ozone Protection
Similar to the Montreal Protocol discussed above, Title VI of the Clean Air Act was established to protect stratospheric ozone by phasing out the manufacture of ozone-depleting substances and by restricting their use and distribution (U.S. EPA 2007b). Also similar to the Montreal Protocol, while successful in phasing out ozone depleting substances, Title VI has inadvertently led to an increase in the production and use of non-ozone depleting substitutes such as HFCs that are global warming gases with high GWPs and relatively long atmospheric lifetimes.
3.2.2.2 Climate Change Action Plan
Adopted in 1993, the U.S. Climate Change Action Plan (CCAP) consists of voluntary actions to reduce all significant GHGs from all economic sectors. Backed by federal funding, the CCAP supports cooperative partnerships between the government and the private sector in establishing flexible and cost-effective ways to reduce GHG emissions. The CCAP encourages investments in new technologies, but also relies on previous actions and programs focused on saving energy, reducing transportation emissions,

Greenhouse Gas Analysis for the Barrio Logan Community Plan Update
Page 22
improving forestry management, and reducing waste. With respect to energy and transportation-related GHG emissions reductions, the CCAP includes the following:
• Energy Demand Actions to accelerate the use of existing energy saving technologies and encourage the development of more advanced technologies. Commercial actions focus on installing efficient heating and cooling systems in commercial buildings and upgrading to energy-efficient lighting systems (the Green Lights program). The State Buildings Energy Incentive Fund provides funding to states for the development of public building energy management programs. Residential actions focus on developing new residential energy standards and building codes and providing money-saving energy efficient options to homeowners.
• Energy Supply Actions to reduce emissions from energy supply. These actions focus on increasing the use of natural gas, which emits less CO2 than coal or oil, and investing in renewable energy sources, such as solar and wind power, which result in zero net CO2 emissions. Energy supply strategies also focus on reducing the amount of energy lost during distribution from power plants to consumers.
• Transportation Actions to reduce transportation-related emissions are focused on investing in cleaner fuels and more efficient technologies, and reducing VMT. In addition, the U.S. EPA and Department of Transportation (DOT) are to draft guidance documents for reducing VMTs for use in developing local clean air programs.
3.2.2.3 GHG Emissions Intensity Reduction Programs
The GHG Emissions Intensity is the ratio of GHG emissions to economic output. In 2002, the U.S. GHG Emissions Intensity was 183 metric tons per million dollars of gross domestic product (GDP; U.S. EPA 2007c). In February 2002, the U.S. set a goal to reduce this GHG Emissions Intensity by 18 percent by 2012 through various reduction programs. A number of ongoing voluntary programs have thus been instituted to reduce nationwide GHG emissions. These include (U.S. EPA 2007c):
• Climate VISION Partnership: In 2003, this program established a partnership between 12 major industries and the U.S. Department of Energy (U.S. DOE), the U.S. EPA, the DOT and the U.S. Department of Agriculture. The involved industries include electric utilities; petroleum refiners and natural gas producers; automobile, iron and steel, chemical and magnesium manufacturers; forest and paper producers; railroads; and cement, mining, aluminum, and semiconductor industries. These industries are working with the four agencies to reduce their GHG emissions by developing cost-effective solutions, measuring and reporting emissions, developing strategies for the adoption of advanced technologies, and implementing voluntary mitigation actions.
Greenhouse Gas Analysis for the Barrio Logan Community Plan Update
Page 23
• Cleaner Energy–Environment State Partnership: This program established a partnership between federal and state agencies to support states in implementing strategies and policies to promote renewable energy, energy efficiency, and other cost-effective clean energies. States receive technical assistance from the U.S. EPA.
• Climate Leaders: Climate Leaders is a U.S. EPA’s voluntary program that establishes partnerships with individual companies. Together they establish individual corporate goals for GHG emissions reduction and monitor their emissions to measure progress. More than 100 corporations that represent 8 percent of U.S. GHG emissions are involved in Climate Leaders. More than half have reached their emissions goals so far.
• Energy Star: Energy Star was established in 1992 by the U.S. EPA and became a joint program with the U.S. DOE in 1996. Energy Star is a program that labels energy efficient products with the Energy Star label. Energy Star enables consumers to choose energy-efficient and cost-saving products. More than 1,400 manufacturers use Energy Star labels on their energy-efficient products.
• Green Power Partnership: This program establishes partnerships between the U.S. EPA, and companies and organizations that have bought or are considering buying green power, which is power generated from renewable energy sources. The U.S. EPA offers recognition and promotion to organizations that replace electricity consumption with green power.
3.2.2.4 Corporate Average Fuel Economy Standards
The federal Corporate Average Fuel Economy (CAFE) standards determine the fuel efficiency of certain vehicle classes in the U.S. While the standards had not changed since 1990, as part of the Energy and Security Act of 2007, the CAFE standards were increased in 2007 for new light-duty vehicles to 35 miles per gallon (mpg) by 2020. In May 2009, President Obama announced further plans to increase CAFE standards to require light duty vehicles to meet an average fuel economy of 35.5 mpg by 2016. With improved gas mileage, fewer gallons of transportation fuel would be combusted to travel the same distance, thereby reducing nationwide GHG emissions associated with vehicle travel.
3.2.2.5 Mandatory Reporting of GHGs Rule
Starting January 1, 2010, large emitters of heat-trapping gases began collecting GHG data and reporting their annual GHG emissions to the U.S. EPA. The first reports were generally due March 31, 2011, with extensions available under certain circumstances to September 30, 2011. Under this reporting rule, approximately 10,000 facilities are covered, accounting for nearly 85 percent of the nation’s GHG emissions. This

Greenhouse Gas Analysis for the Barrio Logan Community Plan Update
Page 24
mandatory reporting applies to fossil fuel and industrial GHG suppliers, motor vehicle and engine manufacturers, and facilities that emit 25,000 MTCO2E or more per year. Vehicle and engine manufacturers outside of the light-duty sector are required to begin phasing in their GHG reporting starting with engine/vehicle model year 2011.
3.2.3 State The State of California has adopted a number of plans and regulations aimed at identifying statewide and regional GHG emissions caps, GHG emissions reduction targets, and actions and timelines to achieve the target GHG reductions.
3.2.3.1 EO S-3-05—Statewide GHG Emission Targets
This executive order (EO) signed on June 1, 2005, established the following GHG emission reduction targets for the state of California:
• by 2010, reduce GHG emissions to 2000 levels;
• by 2020 reduce GHG emissions to 1990 levels;
• by 2050 reduce GHG emissions to 80 percent below 1990 levels.
This executive order also directs the secretary of the California EPA (CalEPA) to oversee the efforts made to reach these targets, and to prepare biannual reports on the progress made toward meeting the targets and on the impacts to California related to global warming, including impacts to water supply, public health, agriculture, the coastline, and forestry. With regard to impacts, the report shall also prepare and report on mitigation and adaptation plans to combat the impacts. The first Climate Action Team Assessment Report was produced in March 2006 and has been updated every two years.
3.2.3.2 AB 32—California Global Warming Solutions Act
In response to Executive Order S-3-05, the California legislature passed Assembly Bill (AB) 32 (Nuñez), the “California Global Warming Solutions Act of 2006.” It requires the CARB to adopt rules and regulations that would reduce GHG emissions to 1990 levels by 2020. The CARB is also required to publish a list of discrete GHG emission reduction measures.
Specifically, AB 32, the California Global Warming Solutions Act of 2006, requires CARB to (State of California 2006):
• Establish a statewide GHG emissions cap for 2020, based on 1990 emissions by January 1, 2008.
Greenhouse Gas Analysis for the Barrio Logan Community Plan Update
Page 25
In December 2007, CARB approved a 2020 emission limit of 427 million metric tons of CO2 equivalent.
• Adopt mandatory reporting rules for significant sources of GHGs by January 1, 2009.
In December 2007, CARB adopted regulations requiring the largest industrial sources to report and verify their GHG emissions. Facilities began tracking emissions in 2008 and reports were due June 1, 2009. Emissions reporting for 2008 was allowed to be based on best available data. Beginning in 2010, emissions reports became more rigorous and subject to third-party verification.
This action builds on the earlier Senate Bill (SB) 177 (Sher) enacted in 2000, which established a nonprofit California Climate Action Registry for the purpose of administering a voluntary GHG emissions registry.
• Adopt a plan by January 1, 2009 indicating how emission reductions will be achieved from significant GHG sources via regulations, market mechanisms, and other actions.
A Climate Change Scoping Plan (Scoping Plan) was approved on December 12, 2008. The 2008 Scoping Plan contains the main strategies California will implement to achieve a reduction of 174 million MTCO2E GHG emissions, or approximately 29 percent from the state’s projected 2020 emission level of 596 million MTCO2E under a BAU scenario. The Scoping Plan is discussed in detail in Section 3.2.3.3 below.
• Convene an Environmental Justice Advisory Committee and an Economic and Technology Advancement Advisory Committee to advise CARB.
In January 2007, the CARB appointed a 10-member Environmental Justice Advisory Committee and appointed members to the Economic and Technology Advancement Advisory Committee.
• Ensure public notice and opportunity for comment for all CARB actions.
A number of CARB documents, including the 2020 Emissions Forecast, the Scoping Plan, and the Draft Recommended Approaches for Setting Interim Significance Thresholds, have been circulated for public review and comment.
• Prior to imposing any mandates or authorizing market mechanisms, CARB must evaluate several factors, including but not limited to impacts on California's economy, the environment, and public health; equity between regulated entities; electricity reliability; conformance with other environmental laws; and ensure that the rules do not disproportionately impact low-income communities.
Greenhouse Gas Analysis for the Barrio Logan Community Plan Update
Page 26
3.2.3.3 Climate Change Scoping Plan
As directed by AB 32, the Climate Change Scoping Plan prepared by CARB in December 2008 includes measures to reduce statewide GHG emissions to 1990 levels by 2020. These reductions are what CARB identified as necessary to reduce forecasted BAU 2020 emissions. CARB will update the Scoping Plan at least once every 5 years to allow evaluation of progress made and to correct the Scoping Plan’s course where necessary.
In 2008, CARB estimated annual BAU 2020 emissions to reach 596 MMTCO2E. To achieve 1990 emissions levels of 427 MMTCO2E, a 169 MMTCO2E reduction was thus determined to be needed by 2020. As indicated in Table 6, the majority of reductions is directed at the sectors with the largest GHG emissions contributions—transportation and electricity generation—and involve statutory mandates affecting vehicle or fuel manufacture, public transit, and public utilities. CARB also lists several other recommended measures which will contribute toward achieving the 2020 statewide reduction goal, but whose reductions are not (for various reasons, including the potential for double counting) additive with the measures listed in Table 6. These include state and local government operations measures, green building, mandatory commercial recycling and other additional waste and recycling measures, water sector measures, and methane capture at large dairies.
The Scoping Plan reduction measures and complementary regulations are described further in the following sections, and are grouped under the two headings of Transportation-related Measures and Non-Transportation-Related Measures as representative of the sectors to which they apply.
In 2010, CARB revised its 2020 BAU projections to account for the economic downturn and other factors. CARB’s revised estimate calculated that BAU 2020 emissions would reach approximately 545 MMTCO2E in the absence of any Scoping Plan reduction measures (although two of the key measures—the Pavely I [Light-duty Vehicle GHG Emissions Standards] and the Renewable Portfolios Strategy [RPS]—have begun to be enforced), and that the new 2020 baseline emissions (accounting for Pavley I and the RPS) would be approximately 507 MMTCO2E per year. Thus, in order to reach the 1990 emissions level of 427 MMTCO2E, an 80 MMTCO2E reduction was determined to be needed by 2020 (CARB 2010b).

Greenhouse Gas Analysis for the Barrio Logan Community Plan Update
Page 27
TABLE 6 CARB 2008 SCOPING PLAN-RECOMMENDED GHG REDUCTION MEASURES
Recommended Reduction Measures
Reductions Counted Towards 2020 Target
In MMTCO2E (% total) 2
ESTIMATED REDUCTIONS RESULTING FROM THE COMBINATION OF CAPPED SECTORS AND COMPLEMENTARY MEASURES
146.7
California Light-Duty Vehicle Greenhouse Gas Standards • Implement Pavley Standards • Develop Pavley II light-duty vehicle standards
31.7 (22%)
Energy Efficiency • Building/appliance efficiency, new programs, etc. • Increase CHP generation by 30,000 gigaWatts (GWh) • Solar Water Heating (AB 1470 goal)
26.3 (18%)
Renewables Portfolio Standard (33% by 2020) 21.3 (14%) Low Carbon Fuel Standard 15.0 (10%) Regional Transportation-related GHG Targets1 5.0 (4%) Vehicle Efficiency Measures 4.5 (3%) Goods Movement
• Ship Electrification at Ports • System-Wide Efficiency Improvements
3.7 (3%)
Million Solar Roofs 2.1 (2%) Medium/Heavy Duty Trucks
• Heavy-Duty Vehicle Greenhouse Gas Emissions Reduction (Aerodynamic Efficiency)
• Medium- and Heavy-Duty Vehicle Hybridization
1.4 (<1%)
High Speed Rail 1.0 (<1%) Industrial Measures (for sources covered under cap & trade program)
• Refinery Measures • Energy Efficiency and Co-Benefits Audits
0.3 (<.5%)
Additional Reductions Necessary to Achieve the Cap 34.4 (23%) ESTIMATED REDUCTIONS RESULTING FROM UNCAPPED SECTORS 27.3 Industrial Measures (for sources not covered under cap & trade program)
• Oil and Gas Extraction and Transmission
1.1
High Global Warming Potential Gas Measures 20.2 Sustainable Forests 5.0 Recycling and Waste (landfill methane capture) 1.0 TOTAL REDUCTIONS COUNTED TOWARDS 2020 TARGET 174.03
Source: Table 2 of CARB 2008b. 1 This number represents an estimate of what may be achieved from local land use changes. It is not the
SB 375 regional target. CARB will establish regional targets for each Metropolitan Planning Organization following input of the Regional Targets Advisory Committee and a public stakeholders’ consultation process per SB 375.
2 Percentages are relative to the capped sector subtotal of 146.7 MMTCO2E, and may not total 100 due to rounding.
3 The total reduction for the recommended measures slightly exceeds the 169 MMTCO2E of reductions estimated in the BAU 2020 Emissions Forecast. This is the net effect of adding several measures and adjusting the emissions reduction estimates for some other measures.
Greenhouse Gas Analysis for the Barrio Logan Community Plan Update
Page 28
3.2.3.4 Transportation-related Emissions Reductions
Transportation accounts for the largest share of the state’s GHG emissions. Accordingly, a large share of the reduction of GHG emissions from the recommended measures comes from this sector. To address emissions from vehicles, CARB is proposing a comprehensive three-prong strategy: reducing GHG emissions from vehicles, reducing the carbon content of the fuel these vehicles burn, and reducing the miles these vehicles travel.
a. AB 1493—Pavley GHG Vehicle Standards
AB 1493 (Pavley) enacted July 2002, directed CARB to adopt vehicle standards that lowered GHG emissions from passenger vehicles and light duty trucks to the maximum extent technologically feasible, beginning with the 2009 model year. CARB adopted regulations in 2004 and applied to the U.S. EPA for a waiver under the federal Clean Air Act to implement them. Termed “Pavley I,” these regulations cover Model Years 2009 to 2016.
Under federal law, California is the only state allowed to adopt its own vehicle standards, but it cannot implement them until the U.S. EPA grants an administrative waiver. In December 2004, the Alliance of Automobile Manufacturers sued CARB to block implementation of the new regulations and ultimately, in December 2007, a federal judge decided the case in favor of the CARB (Sacramento Bee 2007). Despite this ruling, on December 19, 2007 the U.S. EPA announced that it would deny CARB’s waiver request. In January 2008, the State of California sued the U.S. EPA in an attempt to overturn the U.S. EPA’s denial (Marten Law Group 2008).
On June 30, 2009, the U.S. EPA rejected its earlier waiver denial reasoning and granted California the authority to implement these GHG emissions reduction standards for new passenger cars, pickup trucks, and sport utility vehicles. CARB adopted amendments to its new regulations in September 2009 that would enforce AB 1493 but provide vehicle manufacturers with new compliance flexibility.
With these actions, it is expected that the new regulations (Pavley I) will reduce GHG emissions from California passenger vehicles by about 22 percent in 2012 and about 30 percent in 2016 (CARB 2010b) for a total reduction of 31.7 MMTCO2E counted toward the total statewide reduction target established in the 2008 Scoping Plan (CARB 2008b) (see Table 6). However, CARB’s revised 2010 projections estimate that Pavley I will reduce GHG emissions from passenger vehicles by about 29.9 MMTCO2E, or 37 percent of the total 80 MMTCO2E reduction target (CARB 2010b).
CARB has adopted a second, more stringent, phase of the Pavley regulations, termed “Pavley II” [now known as “Low Emission Vehicle III GHG”], that covers Model Years 2017 to 2025. Pavley II was estimated in 2008 to add an additional 4.0 MMTCO2E for 2 percent of the then-estimated 174 MMTCO2E reduction total. The revised

Greenhouse Gas Analysis for the Barrio Logan Community Plan Update
Page 29
2010 projections estimate that Pavley II will reduce GHG emissions from passenger vehicles by 3.8 MMTCO2E, 5 percent of the total 80 MMTCO2E reduction target (per CARB’s 2010 revised projections; CARB 2010b). These reductions are to come from improved vehicle technologies such as small engines with superchargers, continuously variable transmissions, and hybrid electric drives.
b. EO S-01-07—Low Carbon Fuel Standard
This executive order signed by Governor Schwarzenegger in January 2007 directed that a statewide goal be established to reduce the carbon intensity of California’s transportation fuels by at least 10 percent by 2020 through a LCFS. CARB adopted the LCFS as a discrete early action measure pursuant to AB 32 in April 2009 and includes it as a reduction measure in its Scoping Plan (see Table 6).
The LCFS is a performance standard with flexible compliance mechanisms intended to incentivize the development of a diverse set of clean, low-carbon transportation fuel options. Its aim is to accelerate the availability and diversity of low-carbon fuels such as biofuels, electricity, and hydrogen, by taking into consideration the full life cycle of GHG emissions. A 10 percent reduction in the intensity of transportation fuels is expected to equate to a reduction of 16.5 MMTCO2E in 2020. However, in order to account for possible overlap of benefits between LCFS and the Pavley GHG standards, CARB has discounted the contribution of LCFS to 15 MMTCO2E (CARB 2008b).
The LCFS is currently being challenged in court. Plaintiffs argue that the LCFS is unconstitutional, because it violates the interstate commerce clause, which was intended to stop states from introducing laws that would discriminate against businesses located in other states. Litigation is ongoing, and no final decision has been made whether the program is unconstitutional.
c. Regional Transportation-related GHG Targets
The Regional Transportation-Related GHG Targets measure included in the Scoping Plan identifies policies to reduce transportation emissions through changes in future land use patterns and community design, as well as through improvements in public transportation, that reduce VMT. By reducing the miles vehicles travel, vehicle emissions will be reduced. Improved planning and the resulting development are seen as essential for meeting the 2050 emissions target (CARB 2008b p. 20). CARB expects that this measure will reduce transportation-related GHG emissions by about 5 MMTCO2E or 4 percent of the total statewide reductions attributed to the capped sectors (see Table 6). Specific regional reduction targets established through SB-375 (see discussion below) will determine more accurately what reductions can be achieved through this measure.

Greenhouse Gas Analysis for the Barrio Logan Community Plan Update
Page 30
d. SB 375—Regional Emissions Targets
The SB 375 was signed in September 2008 and required CARB to set regional targets for reducing passenger vehicle GHG emissions in accordance with the Scoping Plan measure described above. Its purpose is to align regional transportation planning efforts, regional GHG reduction targets, and land use and housing allocation to reduce GHG emissions by promoting high-density, mixed-use developments around mass transit hubs.
The CARB, in consultation with the Metropolitan Planning Organizations (MPOs), was required to provide each affected region with passenger vehicle GHG emissions reduction targets for 2020 and 2035 by September 30, 2010. The San Diego Association of Governments (SANDAG) is the San Diego region’s MPO. On August 9, 2010 CARB released the staff report on the proposed reduction target, which was subsequently approved by CARB on September 23, 2010. The San Diego region will be required to reduce greenhouse gas emissions from cars and light trucks 7 percent per capita by 2020 and 13 percent by 2035 (SANDAG 2010).
The reduction targets are to be updated every 8 years, but can be updated every 4 years if advancements in emissions technologies affect the reduction strategies to achieve the targets.
Once reduction targets are established, each of California’s MPOs must prepare and adopt a Sustainable Communities Strategy (SCS) that demonstrates how the region will meet its greenhouse gas reduction targets through integrated land use, housing, and transportation planning. Enhanced public transit service combined with incentives for land use development that provides a better market for public transit will play an important role in the SCS. After the SCS is adopted by the MPO, the SCS will be incorporated into that region's federally enforceable regional transportation plan (RTP).
CARB is also required to review each final SCS to determine whether it would, if implemented, achieve the greenhouse gas emission reduction target for its region. If the combination of measures in the SCS will not meet the region’s target, the MPO must prepare a separate Alternative Planning Strategy (APS) to meet the target. The APS is not a part of the RTP.
As an incentive to encourage implementation of the SCS and APS, developers can obtain relief from certain requirements under the California Environmental Quality Act (CEQA) for those projects that are consistent with either the SCS or APS (CARB 2010c).
San Diego’s MPO, SANDAG, completed and adopted its 2050 RTP in October 2011, the first such plan in the state that included a SCS.
Greenhouse Gas Analysis for the Barrio Logan Community Plan Update
Page 31
e. EO S-7-04/SB 1505—California Hydrogen Highway Network
This executive order signed in 2004 designated California’s 21 interstate freeways as the California Hydrogen Highway Network, and directed the CalEPA and all other relevant state agencies to plan and build a network of hydrogen-fueling stations along these roadways and in the urban centers. This EO also called for the CalEPA and others to develop by January 1, 2005 a California Hydrogen Economy Blueprint Plan (Blueprint Plan) for the rapid transition to a hydrogen economy in California. The Blueprint Plan was delivered to the Governor in May 2005.
In response to this EO, SB 1505 (Lowenthal), chaptered on September 30, 2006, required the CARB to adopt regulations to ensure that the production and use of hydrogen for transportation purposes contributes to the reduction of GHGs and other air contaminants (Union of Concerned Scientists 2007). The regulation, referenced as the Environmental and Energy Standards for Hydrogen Production, is currently in the development process and is expected to be approved by CARB before the end of 2010. To date this has not occurred.
3.2.3.5 Non-transportation-related Emissions Reductions
In the energy sector, Scoping Plan measures aim to provide better information and overcome institutional barriers that slow the adoption of cost-effective energy-efficiency technologies. They include enhanced energy-efficiency programs to provide incentives for customers to purchase and install more efficient products and processes and building and appliance standards to ensure that manufacturers and builders bring improved products to market. Over the long term, the recommended measures will increase the amount of electricity from renewable energy sources and improve the energy efficiency of industries, homes, and buildings. While energy efficiency accounts for the largest emissions reductions from this sector, other applicable land development measures such as water conservation, materials use and waste reduction, and green building design and development practices, achieve additional emissions reduction.
a. Renewables Portfolio Standard
The Renewables Portfolio Standard (RPS) promotes diversification of the state’s electricity supply. Originally adopted in 2002 with a goal to achieve a 20-percent renewable energy mix by 2020, the goal has been accelerated and increased, most recently so by EOs S-14-08 and S-21-09 to a goal of 33 percent by 2020. Its purpose is to achieve a 33-percent renewable energy mix statewide; providing 33 percent of the state’s electricity needs met by renewable resources by 2020 (CARB 2008b). The RPS is included in CARB’s Scoping Plan list of reduction measures (see Table 6). Increasing the RPS to 33 percent is designed to accelerate the transformation of the electricity sector, including investment in the transmission infrastructure and systems changes to allow integration of large quantities of intermittent wind and solar generation. Renewable
Greenhouse Gas Analysis for the Barrio Logan Community Plan Update
Page 32
energy includes (but is not limited to) wind, solar, geothermal, small hydroelectric, biomass, anaerobic digestion, and landfill gas. Increased use of renewables would decrease California’s reliance on fossil fuels, thus reducing emissions of GHGs from the electricity sector. CARB estimates that full achievement of the RPS would decrease statewide GHG emissions by 21.3 MMTCO2E (CARB 2008b).
b. Million Solar Roofs Program
The Million Solar Roofs Program was created by SB 1 in 2006 and includes the California Public Utilities Commission’s (CPUC’s) California Solar Initiative and California Energy Commission’s (CEC’s) New Solar Homes Partnership. It requires publicly owned utilities to adopt, implement, and finance solar-incentive programs to lower the cost of solar systems and help achieve the goal of installing 3,000 megaWatts (MW) of new solar capacity by 2020. The Million Solar Roofs Program is one of CARB’s GHG-reduction measures identified in the 2008 Scoping Plan (see Table 6). Achievement of the program’s goal is expected to equate to a reduction of 2.1 MMTCO2E in 2020 statewide BAU emissions (CARB 2008b).
c. SB 1368—Public Utility Emission Standards
The SB 1368 (Parata), passed in 2006, requires the CEC to set GHG-emission standards for entities providing electricity in the state. The bill further requires that the CPUC prohibit electricity providers and corporations from entering into long-term contracts, if those providers and corporations do not meet the CEC’s standards (Union of Concerned Scientists 2007).
d. Title 24, Part 6—California Energy Code
The California Code of Regulations, Title 24, Part 6 is the California Energy Code. This code, originally enacted in 1978 in response to legislative mandates, establishes energy- efficiency standards for residential and non-residential buildings in order to reduce California’s energy consumption. The Energy Code is updated periodically to incorporate and consider new energy-efficiency technologies and methodologies as they become available. The most recent amendments to the Energy Code, known as 2008 Title 24, or the 2008 Energy Code, became effective January 1, 2010. 2008 Title 24 requires energy savings of 15–35 percent above the former 2005 Title 24 Energy Code. At a minimum, residential buildings must achieve a 15-percent reduction in their combined space heating, cooling, and water heating energy compared to the 2005 Title 24 standards. Incentives in the form of rebates and tax breaks are provided on a sliding scale for buildings achieving energy efficiency above the minimum 15 percent reduction over 2005 Title 24. The reference to 2005 Title 24 is relevant in that many of the State’s long-term energy and GHG reduction goals identify energy-saving targets relative to 2005 Title 24. By reducing California’s energy consumption, emissions of statewide GHGs may also be reduced.
Greenhouse Gas Analysis for the Barrio Logan Community Plan Update
Page 33
New construction and major renovations must demonstrate their compliance with the current Energy Code through submission and approval of a Title 24 Compliance Report to the local building permit review authority and the CEC. The compliance reports must demonstrate a building’s energy performance through use of CEC-approved energy performance software that shows iterative increases in energy efficiency given selection of various HVAC, sealing, glazing, insulation, and other components related to the building envelope. Title 24 governs energy consumed by the built environment, by the major building envelope systems such as space heating, space cooling, water heating, some aspects of the fixed lighting system, and ventilation. Non-building energy use, or “plug-in” energy use (such as appliances, equipment, electronics, plug-in lighting), are independent of building design and are not subject to Title 24.
e. Title 24, Part 11—California Green Building Standards
In 2007, Governor Schwarzenegger directed the California Building Standards Commission to work with state agencies on the adoption of green building standards for residential, commercial, and public building construction for the 2010 code adoption process. A voluntary version of the California Green Building Standards Code, referred to as CalGreen, was added to Title 24 as Part 11 in 2009. The 2010 version of CalGreen took effect January 1, 2011 and instituted mandatory minimum environmental performance standards for all ground-up new construction of commercial and low-rise residential buildings, state-owned buildings, schools, and hospitals. It also includes voluntary tiers (I and II) with stricter environmental performance standards for these same categories of residential and non-residential buildings. Its requirements for new construction include:
• 20 percent mandatory reduction in indoor water use relative to specified baseline levels, with voluntary goals for reductions of 30 percent and over;
• mandatory water submetering;
• mandatory diversion of 50-percent waste from landfills, with voluntary goal reductions of 65 percent for homes and 80 percent for commercial projects;
• mandatory inspections of energy systems to ensure optimal working efficiency, with voluntary goals for 15 percent (Tier I) and 30 percent (Tier II) exceedance of 2008 Title 24; and
• requirements for low-pollutant emitting exterior and interior finish materials such as paints, carpets, vinyl flooring, and particleboards.
Similar to the compliance reporting procedure described above for demonstrating energy code compliance in new buildings and major renovations, compliance with the CalGreen water reduction requirements must be demonstrated through completion of water use reporting forms for both residential and non-residential buildings. The water use compliance form must demonstrate a 20 percent reduction in indoor water use by either

Greenhouse Gas Analysis for the Barrio Logan Community Plan Update
Page 34
showing a 20 percent reduction in the overall baseline water use as identified in CalGreen or a reduced per-plumbing-fixture water use rate.
Related to CalGreen are the earlier 2000 Sustainable Building Goal (EO D-16-00) and 2004 Green Building Initiative (EO S-20-04). The 2000 Sustainable Building Goal instructed that all state buildings be constructed or renovated and maintained as models of energy, water, and materials efficiency. The 2004 Green Building Initiative recognized further that significant reductions in GHG emissions could be achieved through the design and construction of new green buildings as well as the sustainable operation, retrofitting, and renovation of existing buildings.
The CARB Scoping Plan includes a Green Building Strategy with the goal of expanding the use of green building practices to reduce the carbon footprint of new and existing buildings. Consistent with CalGreen, the Scoping Plan recognized that GHG reductions would be achieved through buildings that exceed minimum energy-efficiency standards, decrease consumption of potable water, reduce solid waste during construction and operation, and incorporate sustainable materials. Green building is thus a vehicle to achieve the Scoping Plan’s statewide electricity and natural gas efficiency targets, and lower GHG emissions from waste and water transport sectors.
In the Scoping Plan, CARB projects that an additional 26 MMTCO2E could be reduced through expanded green building (CARB 2008b, p.17). However, this reduction is not counted toward the BAU 2020 reduction goal to avoid any double counting, as most of these reductions are accounted for in the electricity, waste, and water sectors. Because of this, CARB has assigned all emissions reductions that occur because of green building strategies to other sectors for meeting AB 32 requirements, but will continue to evaluate and refine the emissions from this sector.
f. SB 97—CEQA GHG Amendments
SB 97 (Dutton), passed by the legislature and signed by the governor on August 24, 2007, required the office of Planning and Research (OPR) on or before July 1, 2009, to prepare, develop, and transmit to the Resources Agency amendments to the CEQA guidelines (Guidelines) to assist public agencies in the evaluation and mitigation of GHGs or the effects of GHGs as required under CEQA, including the effects associated with transportation and energy consumption. SB 97 required the Resources Agency to certify and adopt those guidelines by January 1, 2010. Proposed amendments to the state CEQA Guidelines for GHG emissions were submitted on April 13, 2009, adopted on December 30, 2009, and became effective March 18, 2010.

Greenhouse Gas Analysis for the Barrio Logan Community Plan Update
Page 35
Section 15064.4 of the amended Guidelines includes the following requirements for determining the significance of impacts from GHG emissions:
(a) The determination of the significance of greenhouse gas emissions calls for a careful judgment by the lead agency consistent with the provisions in section 15064. A lead agency should make a good-faith effort, based to the extent possible on scientific and factual data, to describe, calculate, or estimate the amount of GHG emissions resulting from a project. A lead agency shall have discretion to determine, in the context of a particular project, whether to:
(1) Use a model or methodology to quantify greenhouse gas emissions resulting from a project, and which model or methodology to use. The lead agency has discretion to select the model or methodology it considers most appropriate provided it supports its decision with substantial evidence. The lead agency should explain the limitations of the particular model or methodology selected for use; and/or
(2) Rely on a qualitative analysis or performance-based standards.
While the amendments require calculation of a project’s contribution, they clearly do not establish a standard by which to judge a significant effect or a means to establish such a standard.
3.2.4 Local
3.2.4.1 San Diego Sustainable Community Program
In 2002, the San Diego City Council unanimously approved the San Diego Sustainable Community Program (SCP) and requested that an Ad Hoc Advisory Committee be established to provide recommendations that would decrease GHG emissions from City operations. Actions identified in the SCP include:
1. Participation in the International Council for Local Environmental Initiatives (ICLEI) Cities for Climate Protection (CCP) Campaign to reduce GHG emissions, and in the California Climate Action Registry;
2. Establishment of a reduction target of 15 percent by 2010, using 1990 as a baseline; and
3. Direction to use the recommendations of the Ad Hoc Advisory Committee as a means to expand the GHG Emission Reduction Action Plan for the City organization and broaden its scope to include community actions.

Greenhouse Gas Analysis for the Barrio Logan Community Plan Update
Page 36
3.2.4.2 Cities for Climate Protection
As a participant in the ICLEI Cities for Climate Protection Program, the City made a commitment to voluntarily decrease its GHG emissions by 2030. The Program includes five milestones: (1) establish a CCP campaign, (2) engage the community to participate, (3) sign the U.S. Mayors Climate Protection Agreement, (4) take initial solution steps, and (5) perform a GHG audit. The City has advanced past Milestone 3 by signing the Mayor’s agreement and establishing actions to decrease City Operations’ emissions.
3.2.4.3 Climate Protection Action Plan
In July 2005, the City of San Diego developed a Climate Protection Action Plan (CPAP) that identifies policies and actions to decrease GHG emissions from City operations. Recommendations included in CPAP for transportation included measures such as increasing carpooling and transit ridership, improving bicycle lanes, and converting the City vehicle fleet to low-emission or non-fossil-fueled vehicles. Recommendations in the CPAP for energy and other non-transportation emissions reductions included increasing building energy efficiency (i.e., requiring that all City projects achieve the U.S. Green Building Council’s Leadership in Energy and Environmental Design (LEED) Silver standard); reducing waste from City operations; continuing use of landfill methane as an energy source; reducing the urban heat island by avoiding dark roofs and roads which absorb and retain heat; and increasing shade tree and other vegetative cover plantings.
Because of City actions implemented earlier between 1990 and 2002, moderate GHG emissions reductions were reported in the CPAP. City actions taken to capture methane gas from solid waste landfills and sewage treatment plants resulted in the largest decrease in GHG emissions. Actions taken thus far to incorporate energy efficiency and alternative renewable energy reached only 5 percent of the City’s 2010 goal. The transportation sector remains a significant source of GHG emissions in 2010 and has had the lowest GHG reductions, reaching only 2.2 percent of the goal for 2010. The recently amended City General Plan (2008) includes a Policy CE-A.13 to regularly monitor and update the CPAP.
3.2.4.4 Sustainable Building Policies
In several of its policies, the City aims to reduce GHG emissions by requiring sustainable development practices in City operations and incentivizing sustainable development practices in private development. In Council Policy 900-14—Green Building Policy, adopted in 1997, Council Policy 900-16—Community Energy Partnership, and the updated Council Policy 900-14—Sustainable Buildings Expedite Program, last revised in 2006 [NOTE: City needs to provide update], the City establishes a mandate for all City projects to achieve the U.S. Green Building Council’s LEED Silver standard for all new buildings and major renovations over 5,000 square feet. Incentives are also provided to

Greenhouse Gas Analysis for the Barrio Logan Community Plan Update
Page 37
private developers through the Expedite Program, which expedites project review of green building projects and discounts project review fees.
The City has also enacted codes and policies aimed at helping the City achieve the State’s 50-percent waste diversion mandate, including the Refuse and Recyclable Materials Storage Regulations (Municipal Code Chapter 14, Article 2, Division 8), Recycling Ordinance (O-19678 Municipal Code Chapter 6, Article 6, Division 7), and the Construction and Demolition (C & D) Debris Deposit Ordinance (0-19420 & 0-19694 Municipal Code Chapter 6, Article 6, Division 6).
3.2.4.5 General Plan
The City of San Diego 2008 General Plan includes several climate change-related policies aimed at reducing GHG emissions from future development and City operations. For example, Conservation Element policy CE-A.2 aims to “reduce the City’s carbon footprint” and to “develop and adopt new or amended regulations, programs, and incentives as appropriate to implement the goals and policies set forth” related to climate change. The Land Use and Community Planning Element, the Mobility Element, the Urban Design Element, and the Public Facilities, Services and Safety Element also identify GHG reduction and climate change adaptation goals. These elements contain policy language related to sustainable land use patterns, alternative modes of transportation, energy efficiency, water conservation, waste reduction, and greater landfill efficiency. The overall intent of these policies is to support climate protection actions, while retaining flexibility in the design of implementation measures, which could be influenced by new scientific research, technological advances, environmental conditions, or state and federal legislation.
Cumulative impacts of GHG emissions were qualitatively analyzed and determined to be significant and unavoidable in the PEIR for the General Plan. A PEIR Mitigation Framework was included that indicated “for each future project requiring mitigation (measures that go beyond what is required by existing programs, plans and regulations), project-specific measures will [need to] be identified with the goal of reducing incremental project-level impacts to less than significant; or the incremental contributions of a project may remain significant and unavoidable where no feasible mitigation exists.
3.2.4.6 Climate Mitigation and Adaptation Plan
A citywide Climate Mitigation and Adaptation Plan (CMAP) is currently under development to provide a mechanism for the City to achieve the goals of AB 32 and the CARB Scoping Plan at a program level. The CMAP elements are being prepared pursuant to guidance from the amended CEQA Guidelines and CARB recommendations for what constitutes an effective GHG reduction plan, as follows.

Greenhouse Gas Analysis for the Barrio Logan Community Plan Update
Page 38
Section 15183.5 of the amended Guidelines includes the following requirements for plans that serve to tier and streamline the analysis of GHG emissions.
(a) Lead agencies may analyze and mitigate the significant effects of GHG emissions at a programmatic level, such as in a general plan, a long-range development plan, or a separate plan to reduce GHG emissions. Later project-specific environmental documents may tier from and/or incorporate by reference that existing programmatic review. …
(b) Plans for the Reduction of GHG Emissions. Public agencies may choose to analyze and mitigate significant GHG emissions in a plan for the reduction of GHG emissions or similar document. A plan to reduce GHG emissions may be used in a cumulative impact analysis as set forth below. Pursuant to sections 15064 (h)(3) and 15130(d), a lead agency may determine that a project’s incremental contribution to a cumulative effect is not cumulatively considerable, if the project complies with the requirements in a previously adopted plan or mitigation program under specified circumstances.
(1) Plan Elements. A plan for the reduction of GHG emissions should:
(A) Quantify GHG emissions, both existing and projected over a specified time period, resulting from activities within a defined geographic area.
(B) Establish a level, based on substantial evidence, below which the contribution to GHG emissions from activities covered by the plan would not be cumulatively considerable.
(C) Identify and analyze the GHG emissions resulting from specific actions or categories of actions anticipated within the geographic area.
(D) Specify measures or a group of measures including performance standards that substantial evidence demonstrates, if implemented on a project-by-project basis, would collectively achieve the specific emissions level.
(E) Establish a mechanism to monitor the plan’s progress toward achieving the level and to require amendment if the plan is not achieving specified levels.
(F) Be adopted in a public process following environmental review.
(2) Use with Later Activities. A plan for the reduction of GHG emissions, once adopted following certification of an EIR or adoption of an environmental document, may be used in the cumulative impacts analysis of later projects.
Greenhouse Gas Analysis for the Barrio Logan Community Plan Update
Page 39
An environmental document that relies on a GHG reduction plan for a cumulative impacts analysis must identify those requirements specified in the plan that apply to the project, and, if those requirements are not otherwise binding and enforceable, incorporates those requirements as mitigation measures applicable to the project. If there is substantial evidence that the effects of a particular project may be cumulatively considerable notwithstanding the project’s compliance with the specified requirements in the plan for the reduction of GHG emissions, an EIR must be prepared for the project.
(c) Special Situations. As provided in the Public Resource Code sections 21155.2 and 21159.28, environmental documents for certain residential and mixed-use projects and transit priority projects, as defined in section 21155, that are consistent with the general use designation, density, building intensity, and applicable policies specified for the project area in an applicable sustainable communities strategy or alternative planning strategy [refer to Section 3.2.3.4.d] need not analyze global warming impacts resulting from cars and light duty trucks. A lead agency should consider whether such projects may result in GHG emissions from other sources, however, consistent with these Guidelines.
As a Climate Mitigation and Adaptation Plan it is anticipated that the City’s CMAP will contain measures that address both the causes of climate change (i.e., through mitigation) and the effects of climate change (i.e., through adaptation). It is anticipated that the City’s CMAP would thus offer both proactive options (mitigation) and also a plan to live with the consequences (adaptation) of global warming. The City’s CMAP is anticipated to be completed in fall of 2012. Once adopted, discretionary and ministerial projects within the City’s jurisdiction would be evaluated through an Initial Study or similar review to determine conformance with the measures identified in the CMAP.
3.2.4.7 Regional Climate Action Plan
The SANDAG Regional Climate Action Plan (RCAP) is a long-range policy (year 2030) that focuses on transportation, electricity, and natural gas sectors. It is a complement to the Regional Energy Strategy 2030 Update and feeds into the SANDAG Regional Transportation Plan (RTP) and Regional Comprehensive Plan (RCP). It is currently in process of being prepared.
As indicated above, per the requirements of SB 375 the San Diego region will be required to reduce greenhouse gas emissions from cars and light trucks 7 percent per capita by 2020 and 13 percent by 2035 (SANDAG 2010). These reduction targets have been incorporated into the 2050 RTP and SCS that was finalized for the San Diego region in October 2011.
Greenhouse Gas Analysis for the Barrio Logan Community Plan Update
Page 40
4.0 Significance Criteria and Analysis Methodologies
4.1 Determining Significance
The current CEQA Guidelines Appendix G Environmental Checklist includes the following two questions regarding assessment of GHG emissions:
1) Would the project generate GHG emissions, either directly or indirectly, that may have a significant impact on the environment?
2) Would the project conflict with an applicable plan, policy or regulation adopted for the purpose of reducing the emission of GHGs?
As stated in the Guidelines, these questions are “intended to encourage thoughtful assessment of impacts and do not necessarily represent thresholds of significance” (Title 14, Division 6, Chapter 3 Guidelines for Implementation of the CEQA, Appendix G, VII Greenhouse Gas Emissions). To date, there have been no local, regional, state, or federal regulations establishing a threshold of significance to determine project-specific impacts of GHG emissions. The CEQA Guidelines require Lead Agencies to adopt GHG thresholds of significance. When adopting these thresholds, the amended Guidelines allow Lead Agencies to consider thresholds of significance adopted or recommended by other public agencies, or recommended by experts, provided that the thresholds are supported by substantial evidence, and/or to develop their own significance threshold.
The City has not adopted its own GHG Thresholds of Significance for CEQA and is following guidance from the California Air Pollution Control Officers Association (CAPCOA) report CEQA & Climate Change, dated January 2008, for interim screening criteria to determine when a GHG analysis would be required and information from the CARB Scoping Plan and BAU 2020 Forecast to determine when a cumulatively significant contribution of GHGs has occurred.
Although the criteria discussed below are interim guidance, they represent a good faith effort to evaluate whether GHG impacts from a project are significant, taking into account the type and location of the proposed development, the best available scientific data regarding GHG emissions, and the current statewide goals and strategies for reduction of GHG emissions. It is also important to note that the San Diego Air Pollution Control District (SDAPCD) has not provided guidance on the quantification of GHG emissions or emissions thresholds for the San Diego Region.
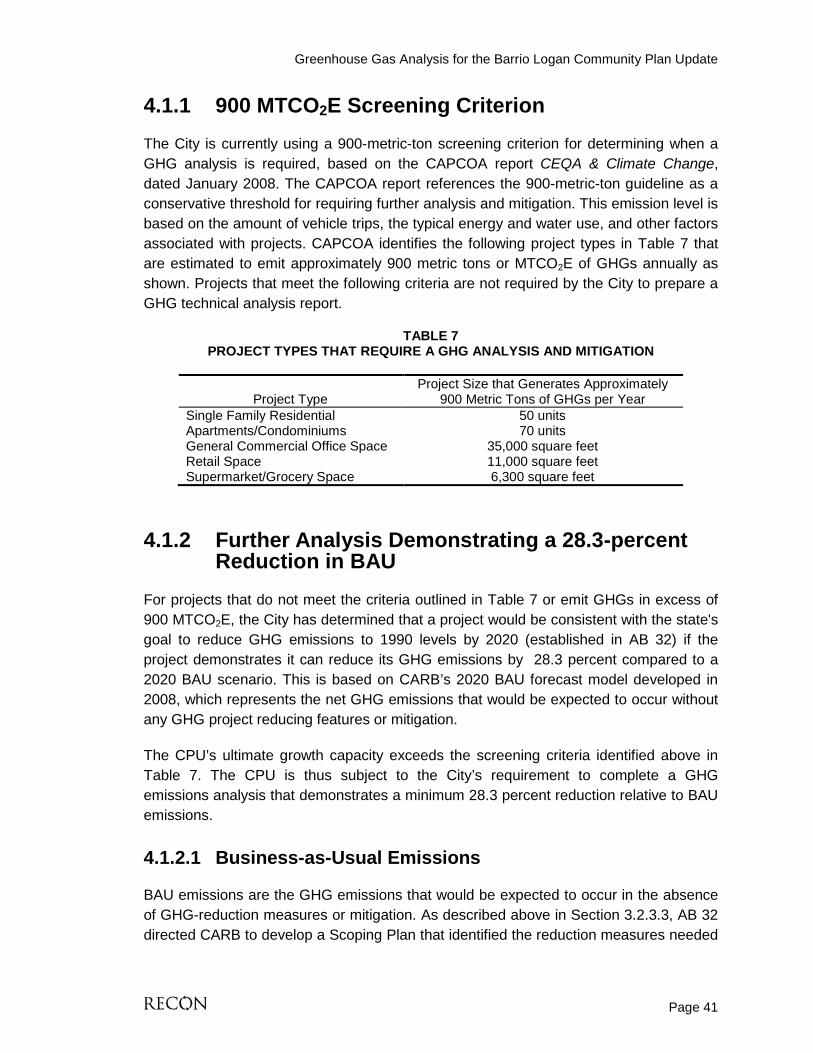
Greenhouse Gas Analysis for the Barrio Logan Community Plan Update
Page 41
4.1.1 900 MTCO2E Screening Criterion The City is currently using a 900-metric-ton screening criterion for determining when a GHG analysis is required, based on the CAPCOA report CEQA & Climate Change, dated January 2008. The CAPCOA report references the 900-metric-ton guideline as a conservative threshold for requiring further analysis and mitigation. This emission level is based on the amount of vehicle trips, the typical energy and water use, and other factors associated with projects. CAPCOA identifies the following project types in Table 7 that are estimated to emit approximately 900 metric tons or MTCO2E of GHGs annually as shown. Projects that meet the following criteria are not required by the City to prepare a GHG technical analysis report.
TABLE 7 PROJECT TYPES THAT REQUIRE A GHG ANALYSIS AND MITIGATION
Project Type Project Size that Generates Approximately
900 Metric Tons of GHGs per Year Single Family Residential 50 units Apartments/Condominiums 70 units General Commercial Office Space 35,000 square feet Retail Space 11,000 square feet Supermarket/Grocery Space 6,300 square feet
4.1.2 Further Analysis Demonstrating a 28.3-percent Reduction in BAU
For projects that do not meet the criteria outlined in Table 7 or emit GHGs in excess of 900 MTCO2E, the City has determined that a project would be consistent with the state's goal to reduce GHG emissions to 1990 levels by 2020 (established in AB 32) if the project demonstrates it can reduce its GHG emissions by 28.3 percent compared to a 2020 BAU scenario. This is based on CARB’s 2020 BAU forecast model developed in 2008, which represents the net GHG emissions that would be expected to occur without any GHG project reducing features or mitigation.
The CPU’s ultimate growth capacity exceeds the screening criteria identified above in Table 7. The CPU is thus subject to the City’s requirement to complete a GHG emissions analysis that demonstrates a minimum 28.3 percent reduction relative to BAU emissions.
4.1.2.1 Business-as-Usual Emissions
BAU emissions are the GHG emissions that would be expected to occur in the absence of GHG-reduction measures or mitigation. As described above in Section 3.2.3.3, AB 32 directed CARB to develop a Scoping Plan that identified the reduction measures needed

Greenhouse Gas Analysis for the Barrio Logan Community Plan Update
Page 42
to achieve the targets established in AB 32/S-3-05. In order to assess the scope of the reductions California needs to make to return to 1990 emissions levels by 2020, CARB staff first estimated the 2020 BAU GHG emissions (Table 8) that would be expected to occur without any GHG reduction measures. In 2008, CARB staff estimated that statewide 2020 BAU GHG emissions would be 596 MMTCO2E, requiring a reduction of 169 MMTCO2E, to attain the 2020 emissions limit of 427 MMTCO2E. This equates to a 28.3 percent reduction relative to BAU.
TABLE 8
CALIFORNIA BAU 2020 GHG EMISSIONS FORECAST (ESTIMATED IN 2008)
Sector Projected 2020 Emissions
in MMTCO2E (% total) Transportation 225.4 (38%) Electricity 139.2 (23%) Commercial and Residential 46.7 (8%) Industry 100.5 (17%) Recycling and Waste 7.7 (1%) High GWP 46.9 (8%) Agriculture 29.8 (5%) Forest Net Emissions 0.0 TOTAL 596.4
SOURCE: CARB 2008a.
The 2020 BAU emissions forecast modeled in 2008 thus serves as the basis for establishing the City’s 28.3-percent reduction relative to BAU goal and is consistent with the current CEQA Guidelines, which state that cumulative impacts may be measured relative to a cumulative baseline that includes a
summary of projections contained in an adopted local, regional or statewide plan, or related planning document, that describes or evaluates conditions contributing to the cumulative effect. Such plans may include a general plan, regional transportation plan, or plans for the reduction of GHG emissions.
4.1.2.2 Calculating Project Emissions Relative to BAU
While BAU emissions are the GHG emissions that would be expected to occur in the absence of GHG-reduction measures or mitigation, project emissions are the GHG emissions that would be expected to occur with GHG-reduction measures or mitigation. Per City guidance, when assessing project emissions against the City’s 28.3 percent reduction relative to BAU, project emissions estimates are to account for the GHG reductions achieved through statewide regulations adopted since 2005 to reduce GHG emissions. This includes the Pavley and LCFS measures aimed at reducing vehicle

Greenhouse Gas Analysis for the Barrio Logan Community Plan Update
Page 43
emissions (by approximately 30 percent), the 2008 update to the Title 24 Energy Efficiency Standards aimed at reducing energy emissions (by a minimum of 15 percent), and the 2011 effective date of implementing the mandatory water reduction requirements of CalGreen aimed at reducing water use emissions (by approximately 20 percent). In addition to these statewide regulations, project GHG emissions estimates are to account for any project-specific GHG reductions achieved through design features or mitigation.
The project’s estimated 2020 GHG emissions with GHG reductions are then evaluated relative to the 2020 BAU GHG emissions for comparison to the City’s threshold as follows:
?3.28100,
,, ≥×
−
BAUGHG
PRGHGBAUGHG
mmm
Where BAUGHGm , = Project’s 2020 BAU GHG emissions (MMTCO2E) PRGHGm , = Project’s net 2020 GHG emissions with GHG-reducing
features incorporated (MMTCO2E)
If the project’s 2020 GHG emissions accounting for the effects of GHG-reducing regulations and project-specific design features represent a 28.3 percent reduction relative to the project’s BAU GHG emissions, the project would not result in a significant impact to global climate change. Section 5.1 provides this analysis.
4.1.3 Other Threshold Considerations
4.1.3.1 2020 BAU GHG Emissions Forecast Update
As described above in Section 3.2.3.3, the 2020 BAU emissions forecast modeled by CARB in 2008 was updated by CARB in 2010. In October 2010, CARB revised its 2020 BAU emissions projection based on current economic forecasts, as influenced by the economic downturn, and statewide GHG reduction measures already in place. The result of this update was to reduce the originally estimated statewide 2020 BAU emission estimate of 596 MMTCO2E to 507 MMTCO2E. This value accounts not only for reduced energy demand and growth due to the economic downturn, but also incorporates two adopted Scoping Plan GHG reduction measures. The two measures the revised 2020 forecast accounts for include the Pavley I and RPS 20 percent (refer to Sections 3.2.3.4.a and 3.2.3.5.a). Considering the updated BAU estimate of 507 MMTCO2E by 2020, a 16 percent reduction below the estimated BAU levels would be necessary to return to 1990 levels (i.e., 427 MMTCO2E) by 2020 (CARB 2011a).
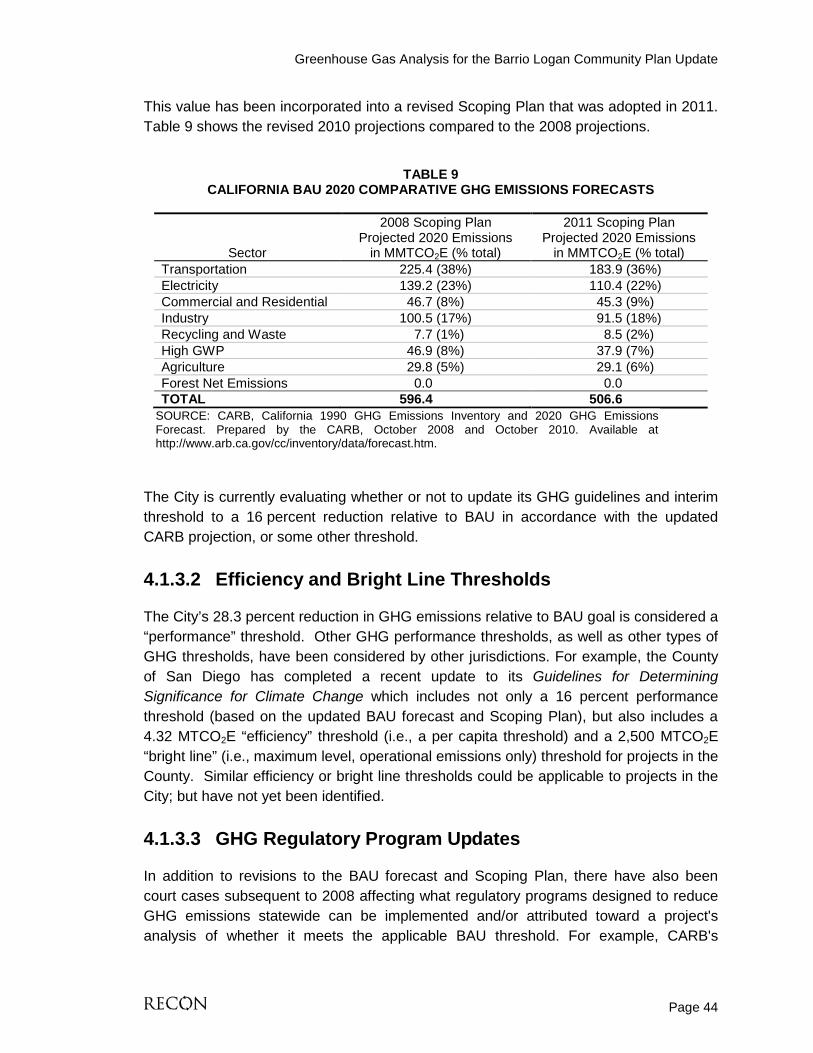
Greenhouse Gas Analysis for the Barrio Logan Community Plan Update
Page 44
This value has been incorporated into a revised Scoping Plan that was adopted in 2011. Table 9 shows the revised 2010 projections compared to the 2008 projections.
TABLE 9
CALIFORNIA BAU 2020 COMPARATIVE GHG EMISSIONS FORECASTS
Sector
2008 Scoping Plan Projected 2020 Emissions
in MMTCO2E (% total)
2011 Scoping Plan Projected 2020 Emissions
in MMTCO2E (% total) Transportation 225.4 (38%) 183.9 (36%) Electricity 139.2 (23%) 110.4 (22%) Commercial and Residential 46.7 (8%) 45.3 (9%) Industry 100.5 (17%) 91.5 (18%) Recycling and Waste 7.7 (1%) 8.5 (2%) High GWP 46.9 (8%) 37.9 (7%) Agriculture 29.8 (5%) 29.1 (6%) Forest Net Emissions 0.0 0.0 TOTAL 596.4 506.6
SOURCE: CARB, California 1990 GHG Emissions Inventory and 2020 GHG Emissions Forecast. Prepared by the CARB, October 2008 and October 2010. Available at http://www.arb.ca.gov/cc/inventory/data/forecast.htm.
The City is currently evaluating whether or not to update its GHG guidelines and interim threshold to a 16 percent reduction relative to BAU in accordance with the updated CARB projection, or some other threshold.
4.1.3.2 Efficiency and Bright Line Thresholds
The City’s 28.3 percent reduction in GHG emissions relative to BAU goal is considered a “performance” threshold. Other GHG performance thresholds, as well as other types of GHG thresholds, have been considered by other jurisdictions. For example, the County of San Diego has completed a recent update to its Guidelines for Determining Significance for Climate Change which includes not only a 16 percent performance threshold (based on the updated BAU forecast and Scoping Plan), but also includes a 4.32 MTCO2E “efficiency” threshold (i.e., a per capita threshold) and a 2,500 MTCO2E “bright line” (i.e., maximum level, operational emissions only) threshold for projects in the County. Similar efficiency or bright line thresholds could be applicable to projects in the City; but have not yet been identified.
4.1.3.3 GHG Regulatory Program Updates
In addition to revisions to the BAU forecast and Scoping Plan, there have also been court cases subsequent to 2008 affecting what regulatory programs designed to reduce GHG emissions statewide can be implemented and/or attributed toward a project's analysis of whether it meets the applicable BAU threshold. For example, CARB's

Greenhouse Gas Analysis for the Barrio Logan Community Plan Update
Page 45
implementation of the LCFS GHG reduction program (refer to Section 3.2.3.4.b) has been impeded by recent litigation. In December 2011, a preliminary injunction blocking CARB's implementation of the LCFS was granted. On April 23, 2012, the Ninth Circuit Court of Appeals overturned the injunction pending a ruling on the merits of the case. While there is no injunction currently in place, the City has determined there is sufficient legal uncertainty with this program that projects cannot rely on taking credit for CARB's implementation of the LCFS program when analyzing whether or not it meets the BAU threshold.
Accordingly, the City has approved a new protocol requiring GHG technical studies to analyze project impacts both with and without reliance on the LCFS.
4.2 Methodology and Assumptions
Given current City guidance, the proposed CPU land use alternatives are evaluated relative to the 28.3 percent BAU reduction threshold; the vehicle emissions portion of these estimates is estimated both with and without accounting for the LCFS. To evaluate the proposed CPU’s GHG emissions relative to BAU, emissions were quantified and projected to the year 2020 for both BAU and each CPU alternative. This is because the AB 32, CARB BAU Forecast, and associated Scoping Plan GHG reduction targets (including the overall 28.3 percent reduction in BAU target) are projected to a year 2020 horizon. Although the CPU has a time horizon of 15 to 20 years, with buildout anticipated to complete by roughly 2030 or 2035, no specific GHG reduction target has been identified in state legislation after 2020. Executive Order S-3-05 identified a GHG reduction target for 2050 but did not identify interim targets for the decades between 2020 and 2050. Establishing target reductions and significance of GHG emissions beyond 2020 is too speculative. Therefore, in this analysis the GHG emissions estimates based on ultimate buildout of the CPU are compared to the 2020 GHG reduction goals in order to evaluate significance. In other words, for the purpose of this analysis, CPU buildout is projected to occur by 2020.
GHG emissions were estimated using the California Emissions Estimator Model (CalEEMod) Version 2011.1.1 released by CARB in March 2011. CalEEMod was developed by the CARB and an air quality consultant, with the participation of several state air districts including the South Coast Air Quality Management District (SCAQMD) and the San Diego Air Pollution Control District (SDAPCD).
As stated by CARB,
“the purpose of CALEEMod it to provide a uniform platform for government agencies, land use planners, and environmental professionals to estimate potential emissions associated with both construction and operational use of land use projects. It is intended that these emission estimates are suitable for use in CEQA compliant

Greenhouse Gas Analysis for the Barrio Logan Community Plan Update
Page 46
documents for air quality and climate change impacts. CalEEMod utilizes widely accepted models for emissions estimates combined with appropriate default data that can be used if site-specific information is not available. These models and default estimates use sources such as the USEPA AP-42 emission factors, CARB vehicle emissions models, studies commissioned by California agencies such as the California Energy Commission and CALRecycle.”
In brief, the model estimates criteria air pollutants and GHG emissions by multiplying emission source intensity factors by estimated quantities of emission sources based on the land use information entered by the user in the first module of the model. In the first module, the user defines the specific land uses that will occur at the project site. The user also selects the appropriate land use setting (urban or rural), operational year, air basin, and utility provider. The input land uses, size features, and population are used throughout CalEEMod in determining default variables and calculations in each of the subsequent modules. The subsequent modules include construction (including off-road vehicle emissions), mobile (on-road vehicle emissions), area sources (woodstoves, fireplaces, consumer products [cleansers, aerosols, solvents], landscape maintenance equipment, architectural coatings), water and wastewater, and solid waste. Each module comprises multiple components including an associated mitigation module to account for further reductions in the reported baseline calculations. These reductions are linked to several of the quantifiable mitigation measures identified in the CAPCOA Quantifying Greenhouse Gas Mitigation Measures August 2010 report (CAPCOA 2010).
CalEEMod estimates emissions in terms of total metric ton CO2 equivalent (MTCO2E). CO2-equivalent emissions are the preferred way to assess combined GHG emissions because they give weight to the GWP of a gas. The GWP, as described above in Section 1.1, is the potential of a gas to warm the global climate in the same amount as an equivalent amount of emissions of CO2. Carbon dioxide (CO2) thus has a GWP of 1. Methane (CH4) has a GWP of 21 and nitrous oxide (N2O) has a GWP of 310, which means they have a greater global warming effect than CO2.
Each of the modules’ methodology and input data are described below and are based on information provided in the CalEEMod User’s Guide (CARB 2011b). The reported GHG estimates based on these inputs are provided in Section 5.1. Attachment 1 includes the CalEEMod input and output files.
4.2.1 Defining Project Characteristics and Land Use In this module the user is prompted to enter the project’s location, setting, climate zone, utility provider, and the specific land uses that will occur. For this analysis, the location was selected as the San Diego Air Pollution Control District with an urban (versus suburban) setting, in climate zone 13, served by San Diego Gas and Electric (SDG&E). By identifying the utility provider, its specific energy intensity factors are loaded into the model’s calculations. SDG&E’s energy intensity factors are shown in the table below.

Greenhouse Gas Analysis for the Barrio Logan Community Plan Update
Page 47
TABLE 10
SAN DIEGO GAS & ELECTRIC INTENSITY FACTORS
GHG Intensity Factor1 (lbs/MWh)
Carbon Dioxide (CO2) 780.79 Methane (CH4) 0.029 Nitrous Oxide (N2O) 0.011
1SOURCE: CalEEMod Version 2011.1.1. lbs = pounds MWh = megaWatt hour
These energy intensity values are used in CalEEMod to determine the GHG emissions associated with electricity use in various modules and are based on CARB’s Local Government Operations Protocol (for CO2) and E-Grid (for CH4 and N2O) values.
Table 11 lists the buildout land use quantities that were input to CalEEMod to estimate future CPU area GHG emissions for each alternative. As shown in Table 11, the buildout totals include several existing land uses that would remain and not be redeveloped as part of the CPU, as well as anticipated new/redeveloped land uses. These are distinguished in Table 11 as “No Change” and “Change”, and were subject to different model assumptions as described in the following paragraphs.
For each CPU alternative, emission estimates were calculated for the three GHGs of primary concern (CO2, CH4, and N2O) that would be emitted from construction and the five primary operational sources that would be associated with Plan buildout: on-road vehicular traffic, use of fireplaces and consumer products, energy use (composed of electricity use and natural gas consumption), water use, and solid waste disposal. To evaluate the reductions in GHG emissions of each CPU alternative relative to the BAU 2020 Forecast, emissions were estimated for two scenarios: first, CPU buildout without GHG-reducing measures (i.e., CPU buildout under BAU conditions) and, second, CPU buildout with GHG-reducing measures. This allowed for a comparison between the CPU buildout with and without GHG-reducing measures in accordance with the City’s 28.3 percent reduction goal.
4.2.2 Estimating Construction Emissions Construction emissions were estimated only for the Change land uses. Construction activities emit GHGs primarily though combustion of fuels (mostly diesel) in the engines of off-road construction equipment and through combustion of diesel and gasoline in on-road construction vehicles and in the commute vehicles of the construction workers. Smaller amounts of GHGs are also emitted through the energy use embodied in any water use (for fugitive dust control) and lighting for the construction activity. Every phase of the construction process, including demolition, grading, paving, and building, emits GHG emissions, in volumes proportional to the quantity and type of construction
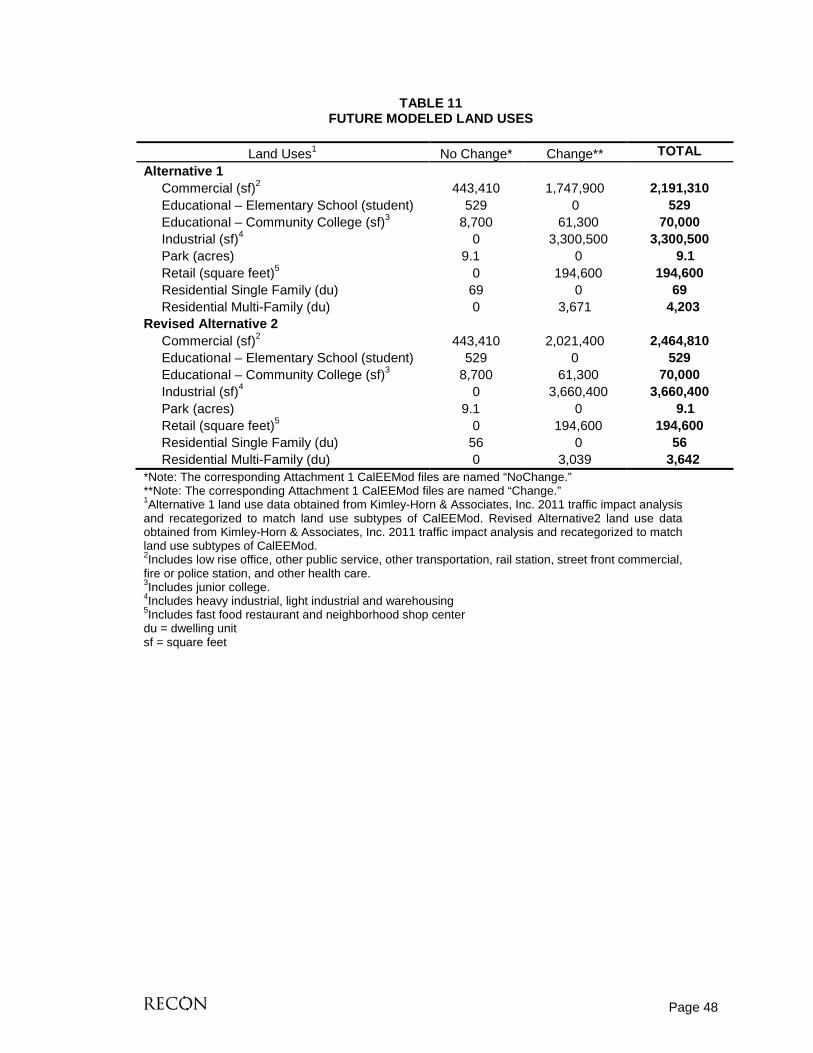
Page 48
TABLE 11 FUTURE MODELED LAND USES
Land Uses1 No Change* Change** TOTAL
Alternative 1 Commercial (sf)2 443,410 1,747,900 2,191,310 Educational – Elementary School (student) 529 0 529 Educational – Community College (sf)3 8,700 61,300 70,000 Industrial (sf)4 0 3,300,500 3,300,500 Park (acres) 9.1 0 9.1 Retail (square feet)5 0 194,600 194,600 Residential Single Family (du) 69 0 69 Residential Multi-Family (du) 0 3,671 4,203
Revised Alternative 2 Commercial (sf)2 443,410 2,021,400 2,464,810 Educational – Elementary School (student) 529 0 529 Educational – Community College (sf)3 8,700 61,300 70,000 Industrial (sf)4 0 3,660,400 3,660,400 Park (acres) 9.1 0 9.1 Retail (square feet)5 0 194,600 194,600 Residential Single Family (du) 56 0 56 Residential Multi-Family (du) 0 3,039 3,642
*Note: The corresponding Attachment 1 CalEEMod files are named “NoChange.” **Note: The corresponding Attachment 1 CalEEMod files are named “Change.”
1Alternative 1 land use data obtained from Kimley-Horn & Associates, Inc. 2011 traffic impact analysis and recategorized to match land use subtypes of CalEEMod. Revised Alternative2 land use data obtained from Kimley-Horn & Associates, Inc. 2011 traffic impact analysis and recategorized to match land use subtypes of CalEEMod. 2Includes low rise office, other public service, other transportation, rail station, street front commercial, fire or police station, and other health care. 3Includes junior college. 4Includes heavy industrial, light industrial and warehousing 5Includes fast food restaurant and neighborhood shop center du = dwelling unit sf = square feet
Greenhouse Gas Analysis for the Barrio Logan Community Plan Update
Page 49
equipment used. The heavier equipment typically emits more GHGs per hour of use than the lighter equipment because of their greater fuel consumption and engine design.
GHG emissions associated with each phase of project construction are calculated in CalEEMod by multiplying the total fuel consumed by the construction equipment and worker trips by applicable emission factors. CalEEMod forecasts the number and pieces of construction equipment that would be used given project-specific design. In the absence of project-specific construction information, needed equipment for all phases of construction are estimated based on the size of the land use subtype features entered in the land use module.
CalEEMod estimates construction emissions for each year of construction activity based on the annual construction equipment profile and other factors determined as needed to complete all phases of construction by the target completion year. As such, each year having reported construction emissions has varying quantities of GHG emissions. However, the Association of Environmental Professionals (AEP) has recently recommended that total construction GHG emissions resulting from a project be amortized over 30 years and added to operational GHG emissions (AEP 2010). Estimates of the total emissions from construction activities (associated with the development of subsequent projects) estimated by CalEEMod were thus divided by 30 and then added to the operational emissions, in accordance with the AEP recommendations. Also, as recommended in a recent (March 2012) CalEEMod workshop conducted by CARB, because CalEEMod overestimates construction emissions by roughly 30 percent, the resulting total quantity of construction emissions estimated by CalEEMod is multiplied by 0.70 to obtain total construction GHGs.
4.2.3 Estimating Vehicle Emissions Transportation-related GHG emissions comprise the largest sector contributing to both inventoried and projected statewide GHG emissions, accounting for 38 percent of the projected total statewide 2020 BAU emissions (CARB 2008a). On-road vehicles alone account for 35 percent of forecasted 2020 BAU emissions. GHG emissions from vehicles come from the combustion of fossil fuels in vehicle engines. The CalEEMod model estimates vehicle emissions by first calculating trip rate, trip length, trip purpose, and trip type percentages (e.g., home to work, home to shop, home to other) for each land use type, based on the land use types and quantities entered by the user in the land use module. CalEEMod’s default trip rates are based on the Institute of Transportation Engineers (ITE) Trip Generation 8th Edition trip rates for each respective land use category. According to the CalEEMod User’s Guide, for residential uses, CalEEMod default ITE trip lengths are based on the assumption of a suburban setting. The user can edit any of this information by entering a new value in the appropriate cell and/or by accounting for reductions in the traffic mitigation module.
Greenhouse Gas Analysis for the Barrio Logan Community Plan Update
Page 50
For this analysis, CalEEMod default trip rates were edited to reflect the trip rates identified for each land use subtype in the traffic impact analysis (Kimley-Horn & Associates 2011). However, the model’s default trip lengths were not edited. To account for higher urban existing and planned residential densities associated with the CPU, CalEEMod’s default 3 dwelling units per acre (du/ac) for single-family residential was changed to 14 du/ac in the Land Use input module. These edits were entered in the land use module in the lot acreage column to reflect CPU area densities. Alternately, reductions in GHGs associated with shorter trips lengths and reduced VMT due to higher-density residential land uses could be accounted for in the traffic mitigation module.
The traffic mitigation module includes several categories of potential reduction, many of which generally apply to the proposed CPU. These include, in addition to increased density, increased diversity (i.e., mix of land uses), improved walkability design, increased transit accessibility, provision of traffic calming measures, constrained parking supply, and transit improvements. However, in order to account for these reductions, quantifiable project-level information is required. Thus, no further reductions were quantified for the CPU’s vehicle emissions other than accounting for the Pavley and LCFS regulations, and the CPU’s higher residential densities and corresponding trip rates.
CalEEMod default vehicle emission factors and fleet mix are derived from the Emission Factors (EMFAC) 2007 model adjusted to account for Pavley and the LCFS. The adjustments for Pavley and LCFS are only applicable for future years and do not impact EMFAC values prior to these regulations’ implementation. CalEEMod anticipates that most users will not edit these data. For this analysis, the CalEEMod default values that account for Pavley and LCFS were assumed to yield accurate estimates of the future CPU with GHG reductions scenarios (for both the No Change and Change land uses). However, in consideration of recent litigation concerning implementation of the LCFS, an additional manual calculation was made to increase future vehicle emissions outputs by 10 percent, reflecting the absence of the LCFS. Thus, for both alternatives, vehicle emissions are estimated both with and without reliance on the LCFS. Also, to calculate each alternative BAU scenario (i.e., the CPU without GHG reductions scenario), the CPU with reductions vehicle emissions were divided by 0.70 to achieve a 30 percent increase in order to reflect the absence of both the Pavley and LCFS regulations.
4.2.4 Estimating Energy Use Emissions GHGs are emitted as a result of activities in buildings for which electricity and natural gas are used as energy sources. GHGs are generated during the generation of electricity from fossil fuels off-site in power plants. These emissions are considered indirect but are calculated in CalEEMod as associated with a building’s operation. Electric power generation accounts for the second largest sector contributing to both
Greenhouse Gas Analysis for the Barrio Logan Community Plan Update
Page 51
inventoried and projected statewide GHG emissions, comprising 24 percent of the projected total 2020 statewide BAU emissions (CARB 2008a). Combustion of fossil fuel emits criteria pollutants and GHGs directly into the atmosphere. When this occurs in a building this is considered a direct emissions source associated with that building. CalEEMod only estimates emissions from the direct combustion of natural gas. Fuel oil, kerosene, liquefied petroleum gas, and wood can also be used as fuels, but they generally contribute only small amounts, and thus CalEEMod does not account for their emissions. Use of these other fuels is not anticipated for Barrio Logan.
CalEEMod estimates GHG emissions from energy use by multiplying average rates of residential and non-residential energy consumption by the quantities of residential units and non-residential square footage entered in the land use module to obtain total projected energy use. This value is then multiplied by electricity and natural gas GHG emission factors applicable to the project location and utility provider.
Building energy use is typically divided into energy consumed by the built environment and energy consumed by uses that are independent of the construction of the building such as plug-in appliances. In California, Title 24 governs energy consumed by the built environment, mechanical systems, and some types of fixed lighting. Non-building energy use, or “plug-in energy use,” can be further subdivided by specific end-use (refrigeration, cooking, office equipment, etc.). CalEEMod thus calculates electricity use by:
• Calculating energy use from systems covered by Title 24 (i.e., Heating, Ventilating, and Air Conditioning (HVAC) system, water heating system, and the lighting system);
• Calculating energy use from lighting use; and
• Calculating energy use from office equipment, appliances, plug-in electronics, and other sources not covered by Title 24 or lighting.
Lighting is calculated separately, since it can be both part and not part of Title 24. Natural gas use is just distinguished in the model as Title 24 or Non-Title 24 similar to electricity consumption.
CalEEMod default energy values are based on the CEC-sponsored California Commercial End Use Survey (CEUS) and Residential Appliance Saturation Survey (RASS) studies, which identify energy use by building type and climate zone. Each land use type input to the land use module is mapped in the energy module to the appropriate CEUS and RASS building type. Because these studies are based on older buildings, adjustments have been made in CalEEMod to account for changes to Title 24 building codes. The default adjustment is to the current 2008 Title 24 energy code (part 6 of the building code). Adjustments to simulate the 2005 Title 24 energy code are available in the model by selecting the ”use historical data” box. The CalEEMod User’s Guide states

Greenhouse Gas Analysis for the Barrio Logan Community Plan Update
Page 52
that “a user should select the use historical box if they only want an adjustment to the 2005 standards which were in effect when CARB developed its Scoping Plan 2020 No Action Taken [i.e., BAU] predictions” (CARB 2011b, page 30).
Therefore, for the existing conditions estimate and the BAU energy emissions estimate the historical data box was selected in order to reflect GHG emissions from energy use as associated with a building built to the 2005 Title 24 energy code. For the estimates of each CPU alternative, energy emissions were estimated using two runs of the model. One run assumed the default 2008 Title 24 energy code adjustments for the portion of the total buildout land use quantities that would be new (i.e, the Change land uses) and therefore constructed in accordance with the 2008 Title 24 energy code. The second model run for each CPU alternative selected the historical data box for the portion of the total buildout land use quantities that comprise existing land uses that would not change (i.e., the No Change land uses). The two model runs were then added together to obtain the total projected energy emissions associated with the CPU buildout year.
Table 12 lists the buildout land use quantities that were input to the No Change CalEEMod energy module run using historical energy rates to estimate the quantity of energy emissions that would be generated by existing older buildings within the CPU area.
TABLE 12
EXISTING LAND USES THAT WILL REMAIN AND NOT CHANGE*
Land Uses1 Alternative 1 (Year 2030)
Alternative 2 (Year 2030)
Residential Single Family (du) 69 56 Residential Multi-Family (du) 532 603 Educational (student) 529 529 Educational (sf) 8,700 8,700 Commercial
Government Office Building (Barrio Station) (sf) 110,000 110,000 Medical Office Building (Health Center) (sf) 76,400 76,400 General Office Building (Public/Institutional) (sf) 257,010 257,010
Park (acres) 9.1 9.1 *Note: In the corresponding Attachment 1 CalEEMod files are named “NoChange.” 1 These quantities are equal to the No Change land use quantities identified in Table 11. du = dwelling unit sf = square feet
The quantities listed in Table 12 consist of existing land uses that are assumed to remain and are not proposed to be redeveloped as part of either CPU alternative. These existing land uses include several single-family residences, recently constructed multi-family residences, recently entitled projects, existing major public/institutional uses such

Greenhouse Gas Analysis for the Barrio Logan Community Plan Update
Page 53
as the Cesar Chavez Continuing Education Center, the health center, Cesar Chavez and Chicano parks, Perkins Elementary School, and the Barrio Station.
4.2.5 Estimating Area Source Emissions This CalEEMod module estimates the GHG emissions that would occur from the use of hearths, woodstoves, and landscaping equipment. This module also estimates emissions due to use of consumer products and architectural coatings that have volatile organic (VOC) content. However, the use of consumer products and architectural coatings does not emit GHGs. The use of hearths (fireplaces) and woodstoves directly emits CO2 from the combustion of natural gas, wood, or biomass, some of which are thus classified as biogenic. CalEEMod estimates emissions from hearths and woodstoves only for residential uses based on the type and size features of the residential land use inputs. By default, commercial land uses do not have any hearths or woodstoves in CalEEMod but can be added for those cases where they may occur such as in restaurants or hotels if such information is known. In this GHG analysis no hearths or woodstoves were attributed to any commercial uses.
The use of landscape equipment emits GHGs associated with the equipment’s fuel combustion. CalEEMod estimates the number and type of equipment needed based on the number of summer days given the project’s location as entered in the project characteristics module. The model defaults for hearths, woodstoves, and landscaping equipment were assumed.
4.2.6 Estimating Water and Wastewater Emissions The amount of water used and wastewater generated by a project has indirect GHG emissions associated with it. These emissions are a result of the energy used to supply, distribute, and treat the water and wastewater. In addition to the indirect GHG emissions associated with energy use, wastewater treatment can directly emit both methane and nitrous oxide.
The CalEEMod water/wastewater module estimates the land uses contribution to GHG emissions associated with supplying and treating the water and wastewater. CalEEMod’s default rates of indoor and outdoor water use for each residential land use subtype comes from Table ES-1 of the Pacific Institute’s Waste Not, Want Not: The Potential for Urban Water Conservation in California 2003 report that gives water demand in gallons per dwelling unit type (as cited in CARB 2011b). Water use data for most commercial and industrial land uses were obtained from Appendices E and F of that same report. Figures in the report show the percent of water use dedicated to landscape irrigation. This percent was multiplied by the total water use to obtain outdoor water use; with the remainder assigned to indoor water use. Wastewater generation was similarly based on a reported percentage of total indoor water use. For a few land uses
Greenhouse Gas Analysis for the Barrio Logan Community Plan Update
Page 54
(place of worship, movie theater, civic center) where the Pacific Institute report did not provide sufficient data, CalEEMod uses the American Water Works Association Research Foundation’s Commercial and Institutional End Uses of Water report (CARB 2011b).
CalEEMod uses default electricity intensity values for various phases of supplying and treating water from CEC’s 2006 Refining Estimates of Water-related Energy Use in California. The model estimates water/wastewater emissions by multiplying the total projected water/wastewater demand by the applicable water electricity intensities and by the utility intensity GHG factors.
The default water module assumptions were used for the estimates of BAU and existing conditions, including the existing land uses that would remain and not change within the CPU horizon year (refer to explanation in Project Characteristics module discussion above). However, for the future/new land uses of each CPU alternative, the water mitigation module was used to account for an overall 20 percent reduction in water use for new development that would have to comply with recent requirements of CalGreen. Similar to energy use, recent updates to the water conservation element of Title 24 have resulted in increased water conservation for development subsequent to 2010. New construction and redevelopment that would occur under the CPU would be constructed in accordance with the current 2011 CALGreen or later water conservation requirements. Because the 2011 CALGreen (i.e., Part 11 of Title 24) requires a minimum 20 percent reduction in water use, a 20 percent reduction in BAU water use was factored into the CPU emissions calculations by using the mitigation module. The water mitigation module was used to account for CalGreen reductions, as changes to the default rates in the unmitigated water model would have been more cumbersome. As with the energy efficiency improvements due to Title 24 updates, the improvements in water conservation were only applied to the land use buildout quantities expected to redevelop (i.e., the Change quantities), not the whole buildout quantity.
4.2.7 Estimating Solid Waste Emissions The disposal of solid waste produces GHG emissions from anaerobic decomposition in landfills, incineration, and transportation of waste. CalEEMod determines the GHG emissions associated with disposal of solid waste into landfills. Portions of these emissions are biogenic. To estimate the GHG emissions that would be generated by disposing of the solid waste associated with CPU buildout, the total volume of solid waste associated with each CPU alternative was first estimated in the model using waste disposal rates identified by the California Department of Resources Recycling and Recovery (CalRecycle). CalEEMod methods for quantifying GHG emissions from solid waste are based on the IPCC method using the degradable organic content of waste. Existing, BAU, and CPU GHG emissions associated with waste disposal were all calculated using CalEEMod’s default parameters.

Greenhouse Gas Analysis for the Barrio Logan Community Plan Update
Page 55
5.0 Impact Analysis In accordance with CEQA and City guidelines, this analysis evaluates the significance of the proposed CPU in terms of (1) its contribution of GHGs to cumulative statewide emissions and (2) its consistency with local and state regulations, plans, and policies aimed at reducing GHG emissions.
5.1 Cumulative GHG Emissions
5.1.1 Impacts As indicated in Section 4.1, based on the criteria shown in Table 7, the ultimate buildout that would be allowed under the CPU requires completion of a GHG emissions analysis in order to determine what, if any, cumulative impacts would result from project implementation. Specifically, the analysis must demonstrate whether or not ultimate buildout of the CPU, accounting for GHG reduction measures, would generate GHG emissions at least 28.3 percent less than the emissions that would occur under a BAU buildout scenario. The BAU buildout scenario represents buildout of the CPU without accounting for GHG reduction measures. Thus, GHG estimates for both scenarios are discussed below.
5.1.1.1 CPU without GHG Reductions (BAU)
The projected GHG emissions that would be generated from the CPU under BAU assumptions (i.e., without accounting for GHG reductions) were estimated using the methodology described in Section 4.2. The complete calculations including the input parameters are included in Attachment 1.
a. Vehicle Emissions
Greenhouse gas emissions would be emitted from vehicles associated with CPU buildout and would come from the combustion of fossil fuels (primarily gasoline and diesel) in vehicle engines. The quantity and type of transportation fuel consumed, and the number of miles driven determines the amount of GHGs emitted from a vehicle. The method for calculating these emissions is described in Section 4.2.3. As described in Section 4.2.3, to calculate each alternative BAU scenario, default vehicle emissions calculated by CalEEMod were divided by 0.70 to achieve a 30 percent increase in order to reflect the absence of the Pavley and LCFS reductions accounted for in the default estimates.
Greenhouse Gas Analysis for the Barrio Logan Community Plan Update
Page 56
Alternative 1—BAU
The traffic impact analysis determined that approximately 137,267 total vehicle trips would occur daily in association with buildout of proposed CPU Alternative 1 (Kimley–Horn and Associates 2011). Based on this quantity of trips and the trip rates for each land use subtype identified in the traffic analysis, the default CalEEMod trip lengths, and accounting for a 30 percent increase (due to the subtraction of the Pavley and LCFS adjustments), an estimated total of 149,671.11 MTCO2E of GHGs would be emitted annually by vehicles associated with buildout of the BAU Alternative 1. Of this total, approximately 19,409.79 MTCO2E of GHGs would be emitted annually by vehicles associated with existing/not changing land uses, and 130,261.32 MTCO2E would be emitted by vehicles associated with new/changing land uses of Alternative 1.
Revised Alternative 2—BAU
As identified in the traffic impact analysis, approximately 140,140 total vehicle trips would occur daily in association with buildout of CPU Revised Alternative 2 (Kimley–Horn and Associates 2012). Based on this quantity of trips and the trip rates for each land use subtype identified in the traffic analysis, the default CalEEMod trip lengths, and accounting for a 30 percent increase (due to the subtraction of the Pavley and LCFS reductions), an estimated total of 168,165.94 MTCO2E of GHGs would be emitted annually by vehicles associated with buildout of Revised Alternative 2 under BAU conditions. Of this total, approximately 19,873.60 MTCO2E of GHGs would be emitted by vehicles associated with existing land uses, and 148,292.34 MTCO2E would be emitted by vehicles associated with new/changing land uses of Revised Alternative 2.
b. Energy Use Emissions
GHG emissions would be generated by the CPU buildout use of electricity and combustion of natural gas. As explained in Section 4.2.4, 2005 statewide average annual energy consumption rates were used to estimate BAU emissions, consistent with the CARB 2020 BAU forecast that assumed building energy efficiencies in accordance with 2005 Title 24. The method for calculating these emissions is described in Section 4.2.4.
Alternative 1—BAU
CalEEMod estimates that the total annual energy consumption associated with buildout of Alternative 1 using BAU electricity and natural gas consumption rates would emit 39,173.88 MTCO2E of GHGs annually. Of this total, approximately 7,981.22 MTCO2E of GHGs would be generated annually from natural gas combustion, and 31,192.66 MTCO2E of GHGs would be generated annually from electricity use. Of the combined total 39,173.88 MTCO2E of GHGs associated with BAU energy use, approximately
Greenhouse Gas Analysis for the Barrio Logan Community Plan Update
Page 57
4,522.91 MTCO2E would be associated with existing land uses, and 34,650.97 MTCO2E would be associated with new/changing land uses of Alternative 1.
Revised Alternative 2—BAU
CalEEMod estimates that the total annual energy consumption associated with buildout of Revised Alternative 2 using BAU electricity and natural gas consumption rates would emit 41,406.49 MTCO2E of GHGs annually. Of this total, approximately 88,220.24 MTCO2E of GHGs would be generated annually from natural gas combustion, and 33,186.25 MTCO2E of GHGs would be generated annually from electricity use. Of the combined total 41,406.49 MTCO2E of GHGs associated with BAU energy use, approximately 4,596.07 MTCO2E would be associated with existing land uses, and 36,810.42 MTCO2E would be associated with new/changing land uses of Revised Alternative 2.
c. Area Source Emissions
Buildout land uses would emit GHGs from the area sources of landscape maintenance equipment and fireplaces. The method for calculating these emissions is described in Section 4.2.5.
Alternative 1—BAU
CalEEMod estimates that approximately 10,233.88 MTCO2E of GHGs would be emitted annually given Alternative 1 buildout land use projections. Of this total, approximately 1,439.74 MTCO2E would be associated with existing land uses, and 8,794.14 MTCO2E would be associated with new/changing land uses of Alternative 1.
Revised Alternative 2—BAU
CalEEMod estimates that approximately 8,858.82 MTCO2E of GHGs would be emitted annually given Revised Alternative 2 buildout land use projections. Of this total, approximately 1,578.68 MTCO2E would be associated with existing land uses, and 7,280.14 MTCO2E would be associated with new/changing land uses of Revised Alternative 2.
d. Water Use Emissions
The supply and treatment of water to CPU area end users would consume large amounts of energy. This type of energy use is known as embodied energy. GHGs would be emitted from the generation of this embodied energy. The method for calculating these emissions is described in Section 4.2.6. As explained in Section 4.2.6, average rates of water consumption were used in the calculation of BAU water use emissions, consistent with plumbing code regulations in effect at the time the CARB 2020 BAU forecast was made.
Greenhouse Gas Analysis for the Barrio Logan Community Plan Update
Page 58
Alternative 1—BAU
Based on buildout of Alternative 1 land uses and the CalEEMod default BAU water use rates and embodied energy intensities, CalEEMod estimates that the embodied energy needed to supply and treat future water use in the CPU area would emit 95,129.72 MTCO2E of GHGs each year. Of this total, approximately 978.65 MTCO2E would be associated with existing land uses not expected to change, and 94,151.07 MTCO2E would be associated with new/changing land uses of Alternative 1.
Revised Alternative 2—BAU
Based on buildout of Revised Alternative 2 land uses and the CalEEMod default BAU water use rates and embodied energy intensities, CalEEMod estimates that the embodied energy needed to supply and treat future water use in the CPU area would emit 104,988.27 MTCO2E of GHGs each year. Of this total, approximately 1,008.94 MTCO2E would be associated with existing land uses, and 103,979.33 MTCO2E would be associated with new/changing land uses of Revised Alternative 2.
e. Solid Waste Emissions
The disposal of solid waste produces GHG emissions from anaerobic decomposition in landfills, incineration, and transportation of waste. The method for calculating these emissions is described in Section 4.2.7.
Alternative 1—BAU
CalEEMod estimates that Alternative 1 without GHG-reducing design features (i.e., BAU) would generate approximately 13,937.00 MTCO2E of GHGs per year associated with solid waste disposal. Of this total, approximately 728.12 MTCO2E would be associated with existing land uses not expected to change, and 13,208.88 MTCO2E would be associated with new/changing land uses of Alternative 1.
Revised Alternative 2—BAU
CalEEMod estimates that Revised Alternative 2 without GHG-reducing design features (i.e., BAU) would generate approximately 14,936.34 MTCO2E of GHGs per year associated with solid waste disposal. Of this total, approximately 736.08 MTCO2E would be associated with existing land uses not expected to change, and 14,200.26 MTCO2E would be associated with new/changing land uses of Revised Alternative 2.
f. Construction Emissions
GHGs would be emitted from construction equipment, and worker and vendor vehicle trips associated with the development of new or renovated land uses. The method for calculating these emissions is described in Section 4.2.2.

Greenhouse Gas Analysis for the Barrio Logan Community Plan Update
Page 59
Alternative 1—BAU
Based on the Alternative 1 buildout land use quantities that would change, CalEEMod estimates that construction activities would generate a total of 168,880.93 MTCO2E. Divided by three (due to acknowledged over estimation by CARB), total construction emissions would be 56,293.64 MTCO2E (CARB, 2010d). While CalEEMod distributes construction activity emissions over each year at varying quantities depending on various model assumptions, for the purpose of this analysis, total adjusted construction GHG emissions were divided by 30 years in order to identify annual construction GHG emissions. This is in accordance with AEP recommendations (see Section 4.2.2 explanation). Thus, annual construction GHG emissions associated with buildout of Alternative 1 land uses would approximate 1,876.45 MTCO2E each year.
Revised Alternative 2—BAU
Based on the Revised Alternative 2 buildout land use quantities that would change, CalEEMod estimates that construction activities would generate a total of 167,126.58 MTCO2E. Divided by three (due to acknowledged overestimation by CARB), total construction emissions would be 55,708.86 MTCO2E (CARB, 2010d). While CalEEMod distributes construction activity emissions over each year at varying quantities depending on various model assumptions, for the purpose of this analysis total adjusted construction GHG emissions were divided by 30 years in order to identify annual construction GHG emissions. This is in accordance with AEP recommendations (see Section 4.2.2 explanation). Thus, annual construction GHG emissions associated with buildout of Revised Alternative 2 land uses would approximate 1,856.96 MTCO2E each year.
g. Total Plan Emissions without GHG Reductions (BAU)
Alternative 1
Based on the calculations described above, the combined total Alternative 1 BAU GHG emissions without GHG reductions would be approximately 310,022.04 MTCO2E. Of this total, approximately 282,942.83 MTCO2E would be associated with the CPU’s new/changing land uses, and 27,079.21 MTCO2E would be associated with the existing land uses not expected to change.
Revised Alternative 2
Based on the calculations described above, the combined total Revised Alternative 2 BAU GHG emissions without GHG reductions would be approximately 340,212.80 MTCO2E. Of this total, approximately 312,419.43 MTCO2E would be associated with the CPU’s new/changing land uses, and 27,793.37 MTCO2E would be associated with the existing land uses not expected to change.
Greenhouse Gas Analysis for the Barrio Logan Community Plan Update
Page 60
5.1.1.2 Plan with GHG Reductions
The projected GHG emissions that would be generated from each CPU alternative, accounting for GHG reductions, were estimated using the methodology described in Section 4.2. The complete calculations, including the CalEEMod input files, are included in Attachment 1. The results are summarized below.
a. Vehicle Emissions
GHG emissions would be emitted from vehicles associated with CPU buildout and would come from the combustion of fossil fuels in vehicle engines. The method for calculating these emissions is described in Section 4.2.3. As described in Section 4.2.3, the default CalEEMod vehicle emissions estimates account for vehicle GHG reductions due to the Pavley and LCFS regulations.
Alternative 1—with Reductions
Based on 137,267 vehicle trips that would occur daily in association with buildout of CPU Alternative 1 and the default trip lengths in CalEEMod, the model estimates that approximately 253,443,548 vehicle miles would be traveled each year. Using the default CalEEMod emission factors that have been adjusted to account for the Pavley and LCFS vehicle GHG reduction measures, a total of 104,769.78 MTCO2E of GHGs would be emitted annually by vehicles associated with buildout of Alternative 1. Of the total Alternative 1 vehicle emissions, approximately 13,586.85 MTCO2E of GHGs would be generated annually from the existing land uses not expected to change, and 91,182.93 MTCO2E would be generated annually from the new/changing land uses. The combined quantity of 104,769.78 MTCO2E is approximately 30 percent less than the 149,671.11 MTCO2E of vehicle GHGs that would occur under the BAU Alternative 1. By not accounting for the LCFS, the estimate of Alternative 1 vehicle emissions would be increased by 10 percent (i.e., to 20 percent less than BAU): 116,410.86 MTCO2E total, with 101,314.36 MTCO2E from new/changing land uses, and 15,096.50 MTCO2E from land uses not expected to change.
Revised Alternative 2—with Reductions
As identified in the traffic impact analysis, approximately 140,140 total vehicle trips would occur daily in association with buildout of Revised Alternative 2 (Kimley-Horn and Associates 2012). Based on this quantity of trips and the trip rates for each land use subtype identified in the traffic analysis and the default CalEEMod trip lengths as inputs to CalEEMod, approximately 327,351,415 vehicle miles would be traveled each year. Using the default CalEEMod emission factors that have been adjusted to account for the Pavley and LCFS vehicle GHG reduction measures, a total of 117,716.17 MTCO2E of GHGs would be emitted annually by vehicles associated with buildout of Revised Alternative 2. Of the total Revised Alternative 2 vehicle emissions, approximately

Greenhouse Gas Analysis for the Barrio Logan Community Plan Update
Page 61
13,911.52 MTCO2E of GHGs would be generated annually from the existing land uses not expected to change, and 103,804.65 MTCO2E of GHGs would be generated annually from the new/changing land uses. The combined quantity of 117,716.17 MTCO2E is approximately 30 percent less than the 168,165.94 MTCO2E of vehicle GHGs that would occur under the BAU Revised Alternative 2. By not accounting for the LCFS, the estimate of Revised Alternative 2 vehicle emissions would be increased by 10 percent: 130,795.74 MTCO2E total; 115,338.50 MTCO2E from new/changing land uses and 15,457.24 MTCO2E from land uses not expected to change.
b. Energy Use Emissions
GHGs would be emitted from the generation of electricity and the combustion of natural gas needed to supply the energy needs of CPU buildout land uses. As explained in Section 4.2.4, 2005 statewide average energy consumption rates were used to estimate the GHG emissions that would occur from the CPU area’s existing land uses that would not change by the horizon year. The energy use GHG emissions associated with these land uses were thus not adjusted for any GHG reductions that would come from the current stricter energy code. The energy use GHG emissions from the CPU area’s new/redeveloped land uses were estimated using energy rates adjusted to the current 2008 Title 24 energy code in order to account for GHG reductions that would occur from more energy-efficient building construction. Both the 2005 and 2008 energy use options are available in the CalEEMod energy module; however they must be run separately. Therefore, two separate model runs were conducted for each CPU alternative to estimate the two energy and land use conditions, which were then summed to obtain the total projected energy demand and resulting GHG emissions.
Alternative 1—with Reductions
CalEEMod estimates that the total annual energy consumption associated with buildout of Alternative 1 would emit 37,630.10 MTCO2E of GHGs annually. This quantity is approximately 3.9 percent less than the quantity that would occur under the BAU Alternative 1. Of the total Alternative 1 amount, approximately 33,107.19 MTCO2E of GHGs would be generated from the new/changing land uses, and 4,522.91 MTCO2E of GHGs would be generated annually from the existing land uses not expected to change. Of the 33,107.19 MTCO2E of GHGs generated from the new/changing land use, approximately 6,446.26 MTCO2E of GHGs would be generated annually from natural gas combustion, and 26,660.93 MTCO2E of GHGs would be generated annually from electricity use.
Revised Alternative 2—with Reductions
CalEEMod estimates that the total annual energy consumption associated with buildout of CPU Revised Alternative 2 would emit 39,730.96 MTCO2E of GHGs annually, with approximately 35,134.89 MTCO2E associated with the new/changing land uses, and

Greenhouse Gas Analysis for the Barrio Logan Community Plan Update
Page 62
4,596.07 MTCO2E associated with the existing land uses not expected to change. Of the combined total, approximately 7,729.41 MTCO2E of GHGs would be generated annually from natural gas combustion, and 32,001.55 MTCO2E of GHGs would be generated annually from electricity use. This quantity is approximately 4 percent less than the amount that would be emitted under the BAU Revised Alternative 2.
As discussed in Section 3.2.3.5.d, the Title 24 energy code is updated every five years or so to account for changing technologies. It is possible that over the lifetime of the proposed CPU, the Title 24 energy code will be updated to include increased standards that would further reduce building energy demand and associated GHG emissions. New building construction and major renovations subject to the updated code would have an improved energy efficiency profile compared to the existing buildings or newer buildings built to comply with earlier versions of the energy code. Subsequent projects could also voluntarily exceed the current Title 24 energy code, install high-efficiency lighting and plug-in appliances, and/or include on-site renewable energy generation. Given project-level information the GHG reductions from these actions could be quantified in CalEEMod or using some other method in accordance with the 2010 CAPCOA GHG Mitigation Measures report. Therefore, over time the level of GHG emissions resulting from building energy use could be less than the estimates presented above.
In addition, as shown in Table 6, the CARB Scoping Plan includes a Renewables Portfolio Standard, which requires public utilities to acquire an increasing proportion of their energy supply from renewable energies. By 2020, 33 percent of all statewide electricity generation is to come from renewable energies sources. This would result in a statewide emissions reduction of 26.3 MMTCO2E and is counted toward the total 2020 emissions reduction target. Because of implementation of the Renewables Portfolio Standard, GHG emissions from electricity generation needed to supply future projects in accordance with either Plan alternative would likely decline as energy supply shifts from fossil fuel-based energies to renewable energy. Renewable energies have zero to little carbon content, and their use in electricity generation emits fewer GHGs. Therefore, over time the levels of GHG emissions resulting from the CPU buildout energy consumption are likely to be less than those presented above.
c. Area Source Emissions
Buildout land uses would emit GHGs from area sources such as landscape maintenance equipment and fireplaces. The method for calculating these emissions is described in Section 4.2.5. Potential reductions in the BAU input parameters and area source estimates are not quantifiable at the plan level.
Greenhouse Gas Analysis for the Barrio Logan Community Plan Update
Page 63
Alternative 1
CalEEMod estimates that approximately 10,233.88 MTCO2E of area source GHGs would be emitted annually given Alternative 1 buildout land use projections. Approximately 1,439.74 MTCO2E of this quantity of GHGs would be generated from the existing land uses not expected to change, and 8,794.14 MTCO2E would be associated with new/changing land uses. This is the same quantity of area source emissions that would be emitted under the BAU Alternative 1, as no quantifiable area source reductions can be accounted for at the plan level.
Revised Alternative 2
CalEEMod estimates that approximately 8,858.82 MTCO2E of area source GHGs would be emitted annually given Revised Alternative 2 buildout land use projections. Of this total, approximately 1,578.68 MTCO2E would be associated with existing land uses not expected to change, and 7,280.14 MTCO2E would be associated with new/changing land uses of Revised Alternative 2. This is the same quantity of area source emissions that would be emitted under Revised Alternative 2 BAU conditions, as no quantifiable area source reductions can be accounted for at the plan level.
Measures that could reduce area source emissions include restrictions on hearth fuel type, limits on their quantity, or restrictions against the inclusion of hearths in residential projects. Project-level reduction measures could also include the use of only electric-powered landscaping equipment, such as electric lawn mowers, electric leaf blowers and electric chain saws, versus gasoline or diesel-powered landscaping equipment. These measures are included in CalEEMod’s area source mitigation module, but require quantified project-level information in order to account for any GHG reductions. Subsequent projects that incorporate these kinds of design features or requirements would emit reduced area source GHGs relative to BAU area source emissions.
d. Water Use Emissions
GHGs would be emitted from the generation of energy needed to supply and treat water. The method for calculating these emissions is described in Section 4.2.6. As explained in Section 4.2.6, pre-2010 water consumption rates were used to estimate the emissions from the CPU area’s existing land uses that would not change by the horizon year. To account for reductions however, GHG emissions from the CPU area’s new/redeveloped land uses were estimated based on a 20 percent reduction in baseline water use. This reduction in water use via building design is mandated in the current 2011 CalGreen water conservation requirements but is not accounted for in the default water use parameters of CalEEMod. The 20 percent reduction in baseline water usage for new construction was thus accounted for using the CalEEMod water mitigation module.

Greenhouse Gas Analysis for the Barrio Logan Community Plan Update
Page 64
Alternative 1—with Reductions
Based on buildout of Alternative 1 land uses, and water use rates adjusted to 2011 CalGreen standards for the changing land use quantities and default water use rates and embodied energy intensities for the existing/not changing land uses, CalEEMod estimates that the embodied energy needed to supply and treat future water use in the CPU area would emit 76,299.51 MTCO2E of GHGs each year. Approximately 978.65 MTCO2E of this quantity of GHGs would be generated from the existing land uses not expected to change, and 75,320.86 MTCO2E would be generated from the new/changing land uses. This quantity is approximately 19.8 percent less than the amount that would be emitted under the BAU Alternative 1.
Revised Alternative 2—with Reductions
Based on buildout of Revised Alternative 2 land uses, and water use rates adjusted to 2011 CalGreen standards for the changing land use quantities and default water use rates and embodied energy intensities for the existing/not changing land uses, CalEEMod estimates that the embodied energy associated with future water use in the CPU area would generate approximately 84,192.40 MTCO2E of GHGs each year. This quantity is nearly 20 percent less than the quantity that would be emitted under the BAU Revised Alternative 2. Of the total water emissions associated with Revised Alternative 2, approximately 1,008.94 MTCO2E of GHGs would be generated from the existing land uses not expected to change, and 83,183.46 MTCO2E would be generated from the new/changing land uses.
While not shown in Table 6, the CARB Scoping Plan includes other reduction strategies, including water sector measures, not counted toward the 2020 target reduction of 174 MMTCO2E statewide. CARB estimates that their recommended water sector measures would reduce an additional 4.8 MMTCO2E by 2020. These measures require water suppliers to improve energy and other efficiencies associated with water supply. Thus, it is possible that the embodied energy and resulting GHG emissions associated with supplying potable water to the proposed CPU would decrease somewhat by 2020 through statewide efforts.
In addition, certain design-specific measures that are not quantifiable at the plan level can reduce subsequent projects’ water use GHG emissions. Measures that could reduce water use emissions at the project-level include increased water conservation beyond the mandatory minimums in CalGreen, use of reclaimed water or gray water, and incorporation of green landscape design methods such as turf reduction/minimization, use of water-efficient plants and materials, and use of highly water-efficient irrigation systems. These measures are included in CalEEMod water mitigation module and in CAPCOA report Quantifying Greenhouse Gas Mitigation Measures (CAPCOA 2010). Project-level design information is required to quantify the GHG reductions, such as the percent of reduction in water flow for various plumbing fixtures, percent of indoor/outdoor

Greenhouse Gas Analysis for the Barrio Logan Community Plan Update
Page 65
water use served by reclaimed or gray water, area of turf reduction, water demand in gallons per year of the water-efficient landscape design, and so forth. Thus, future projects may demonstrate reduced GHG emissions related to water use.
e. Solid Waste Emissions
The disposal of solid waste produces GHG emissions from anaerobic decomposition in landfills, incineration, and transportation of waste. The method for calculating these emissions is described in Section 4.2.7. For calculating the CPU’s GHG emissions related to solid waste disposal, it was assumed that the CPU with GHG-reducing features would generate up to the same amount of waste and associated GHG emissions as the CPU without GHG-reducing features. While subsequent development projects in accordance with the CPU would be required by current City policy to divert 50 percent of its construction waste (including lumber) from the landfill, thus potentially exceeding average or BAU waste disposal practice, the GHG emissions reductions from these measures cannot be accurately determined at this time. However, the importance of this project level action is revealed in CalRecycle’s annual Statewide Waste Characterization Study (2008), which noted that inerts and other materials accounted for nearly one-third (29 percent) of the statewide waste stream, with lumber representing nearly 15 percent. The largest change in the overall waste stream was an increase, from 22 percent to 29 percent, in this materials class, largely due to an increase in lumber. Nevertheless, for this plan level analysis, no reductions in solid waste associated GHG emissions relative to BAU were assumed.
Alternative 1
CalEEMod estimates that the disposal of solid waste associated with Alternative 1 buildout would generate approximately 13,937.00 MTCO2E of GHGs per year. Approximately 728.12 MTCO2E of this quantity of GHGs would be generated from the existing land uses not expected to change, and 13.208.88 MTCO2E would be associated with the new/changing land uses. This is the same quantity of solid waste emissions that would be emitted under the BAU Alternative 1, as no quantifiable solid waste GHG reductions can be accounted for at the plan level.
Revised Alternative 2
CalEEMod estimates that the disposal of solid waste associated with Revised Alternative 2 buildout would generate approximately 14,936.34 MTCO2E of GHGs per year. This is the same quantity of solid waste emissions that would be emitted under the BAU Revised Alternative 2, as no quantifiable solid waste GHG reductions can be accounted for at the plan level. Of the total solid waste emissions associated with Revised Alternative 2, approximately 736.08 MTCO2E of GHGs would be associated with the existing land uses not expected to change, and 14,200.26 MTCO2E would be associated with the new/changing land uses.

Greenhouse Gas Analysis for the Barrio Logan Community Plan Update
Page 66
As shown in Table 6, the CARB Scoping Plan includes Recycling and Waste measures that would reduce statewide emissions by roughly 1 MMTCO2E by 2020. This is to be achieved through improved landfill methane capture. In addition, while not shown in Table 6, the CARB Scoping Plan includes other waste sector reduction strategies not counted toward the statewide 2020 emissions reduction target. CARB estimates that these additional waste and recycling sector measures would provide up to an additional 10 MMTCO2E reduction by 2020. Thus, the embodied energy and emissions resulting from disposing of the Plan buildout’s solid waste may decrease somewhat by 2020 due to these statewide measures.
The institution of citywide or plan level recycling and composting services with a quantifiable reduction in waste disposal relative to existing regulations could further reduce GHG emissions associated with waste disposal. In addition, project-level institution of recycling and composting services beyond what is currently mandated could also reduce solid waste disposal GHG emissions. This measure is included in CalEEMod solid waste mitigation module, as derived from CAPCOA Measure SW-1 of the Quantifying Greenhouse Gas Mitigation Measure 2010 report. The percentage reduction in baseline waste disposal is required information in order to count a reduction in waste disposal GHG emissions. Subsequent projects that incorporate a quantifiable recycling/waste reduction program would emit reduced GHGs relative to BAU solid waste emissions.
f. Construction Emissions
GHGs would be emitted from construction equipment, and worker and vendor vehicle fuel trips associated with the construction of new development or redevelopment projects. The method for calculating these emissions is described in Section 4.2.2. Given the lack of project-specific information, construction GHG emission estimates for the Plan used the same construction input parameters as were used to calculate BAU construction emissions. Construction emissions reductions are not quantifiable at the plan level, as their quantification requires project-specific information.
Alternative 1
Based on the Alternative 1 buildout land use quantities expected to change, construction activities distributed evenly over the plan horizon would generate approximately 1,876.45 MTCO2E each year. This is the same quantity of construction emissions that would be emitted under BAU, as no quantifiable construction GHG reductions can be accounted for at the plan level.

Greenhouse Gas Analysis for the Barrio Logan Community Plan Update
Page 67
Revised Alternative 2
Based on the Revised Alternative 2 buildout land use quantities expected to change, construction activities distributed evenly over the plan horizon would generate approximately 1,856.96 MTCO2E each year. This is the same quantity of construction emissions that would be emitted under the BAU Revised Alternative 2, as no quantifiable construction GHG reductions can be accounted for at the plan level.
The Scoping Plan does not identify any measures specific to reducing GHG emissions from construction activities. However, the Scoping Plan reduction measure affecting heavy-duty truck emissions would potentially encompass construction on-road diesel vehicles and off-road equipment and reduce emissions through improved engine technology and conversion to non-diesel, low-carbon fuels. These GHG reductions could be experienced by subsequent future projects.
Other project-level measures could be implemented that would reduce BAU construction emissions. These are outlined in the CalEEMod construction mitigation module and are largely based on measures in the CAPCOA Quantifying Greenhouse Gas Mitigation Measures report (CAPCOA 2010). While most of the reduction measures pertain to reducing criteria pollutants, especially particulates, options to reduce GHG emissions include restrictions on equipment fuel type, engine tier, and use of oxidative catalyst reduction.
g. Total Plan Emissions with GHG Reductions
Alternative 1
Based on the calculations described above, the combined total CPU Alternative 1 GHG emissions with GHG reductions would be approximately 244,746.72 MTCO2E. Of this total, approximately 223,490.45 MTCO2E would be associated with the new/changing land uses of Alternative 1, and 21,256.27 MTCO2E would be associated with the existing land uses not expected to change.
Revised Alternative 2
Based on the calculations described above, the combined total CPU Revised Alternative 2 GHG emissions with GHG reductions would be approximately 267,291.65 MTCO2E. Of this total, approximately 245,460.36 MTCO2E would be associated with the new/changing land uses of Revised Alternative 2, and 21,831.29 MTCO2E would be associated with the existing land uses not expected to change.

Greenhouse Gas Analysis for the Barrio Logan Community Plan Update
Page 68
5.1.2 Significance of Impacts
5.1.2.1 Alternative 1
Table 13 summarizes the estimated 2020 BAU emissions associated with Alternative 1, the target emissions to achieve a 28.3 percent reduction relative to BAU, and the Alternative 1 emissions with the incorporation of GHG-reducing measures. Table 13 also provides the percentage reductions for comparison with the City’s 28.3 percent reduction relative to BAU goal in accordance with the methodology discussed in Section 4.1.2.
BAU emissions, or CPU emissions without GHG reductions, would total 310,022.04 MTCO2E annually. As shown in the second column in Table 13, a 28.3 percent reduction in CPU-area wide BAU emissions would equal 222,285.80 MTCO2E per year. Therefore, the proposed CPU Alternative 1 would be considered to be consistent with the AB 32/Scoping Plan and City goals if it were to emit total annual emissions equal to or less than 222,285.80 MTCO2E.
The CPU Alternative 1 emissions with GHG reductions would total 244,746.72 MTCO2E annually. This reduction in BAU emissions of 65,275.32 MTCO2E each year would be due to the Pavley and LCFS regulations on auto and fuel manufacturers that would reduce vehicle emissions by 2020. Reduction would also be due to the recently updated Title 24 California Building Code that contains increased energy and water efficiency requirements that would reduce GHG emissions from those sources for new/changing land uses. Of the estimated 244,746.72 MTCO2E of GHGs associated with buildout of Alternative 1, the majority (223,490.45 MTCO2E) would come from new/changing land uses and the remainder (21,256.27 MTCO2E) would come from existing/not changing land uses.
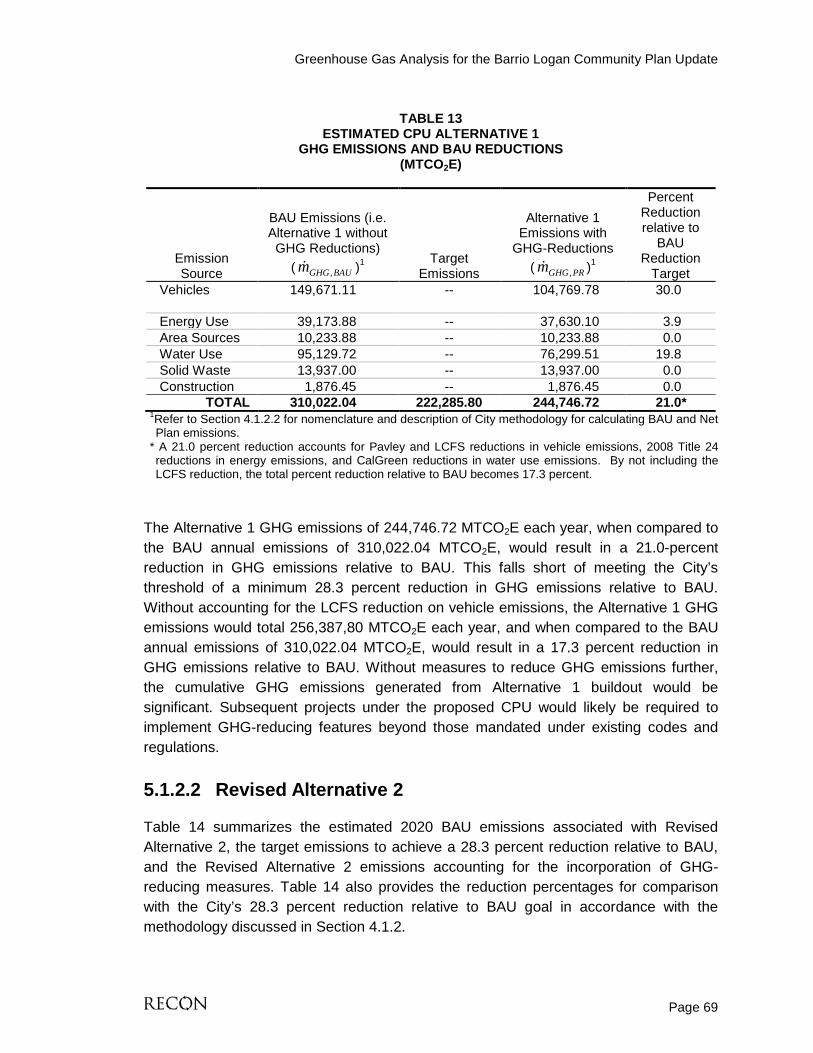
Greenhouse Gas Analysis for the Barrio Logan Community Plan Update
Page 69
TABLE 13
ESTIMATED CPU ALTERNATIVE 1 GHG EMISSIONS AND BAU REDUCTIONS
(MTCO2E)
Emission Source
BAU Emissions (i.e. Alternative 1 without GHG Reductions)
( BAUGHGm , )1 Target
Emissions
Alternative 1 Emissions with
GHG-Reductions ( PRGHGm , )1
Percent Reduction relative to
BAU Reduction
Target Vehicles 149,671.11
-- 104,769.78
30.0
Energy Use 39,173.88 -- 37,630.10 3.9 Area Sources 10,233.88 -- 10,233.88 0.0 Water Use 95,129.72 -- 76,299.51 19.8 Solid Waste 13,937.00 -- 13,937.00 0.0 Construction 1,876.45 -- 1,876.45 0.0
TOTAL 310,022.04 222,285.80 244,746.72 21.0* 1Refer to Section 4.1.2.2 for nomenclature and description of City methodology for calculating BAU and Net Plan emissions.
* A 21.0 percent reduction accounts for Pavley and LCFS reductions in vehicle emissions, 2008 Title 24 reductions in energy emissions, and CalGreen reductions in water use emissions. By not including the LCFS reduction, the total percent reduction relative to BAU becomes 17.3 percent.
The Alternative 1 GHG emissions of 244,746.72 MTCO2E each year, when compared to the BAU annual emissions of 310,022.04 MTCO2E, would result in a 21.0-percent reduction in GHG emissions relative to BAU. This falls short of meeting the City’s threshold of a minimum 28.3 percent reduction in GHG emissions relative to BAU. Without accounting for the LCFS reduction on vehicle emissions, the Alternative 1 GHG emissions would total 256,387,80 MTCO2E each year, and when compared to the BAU annual emissions of 310,022.04 MTCO2E, would result in a 17.3 percent reduction in GHG emissions relative to BAU. Without measures to reduce GHG emissions further, the cumulative GHG emissions generated from Alternative 1 buildout would be significant. Subsequent projects under the proposed CPU would likely be required to implement GHG-reducing features beyond those mandated under existing codes and regulations.
5.1.2.2 Revised Alternative 2
Table 14 summarizes the estimated 2020 BAU emissions associated with Revised Alternative 2, the target emissions to achieve a 28.3 percent reduction relative to BAU, and the Revised Alternative 2 emissions accounting for the incorporation of GHG-reducing measures. Table 14 also provides the reduction percentages for comparison with the City’s 28.3 percent reduction relative to BAU goal in accordance with the methodology discussed in Section 4.1.2.
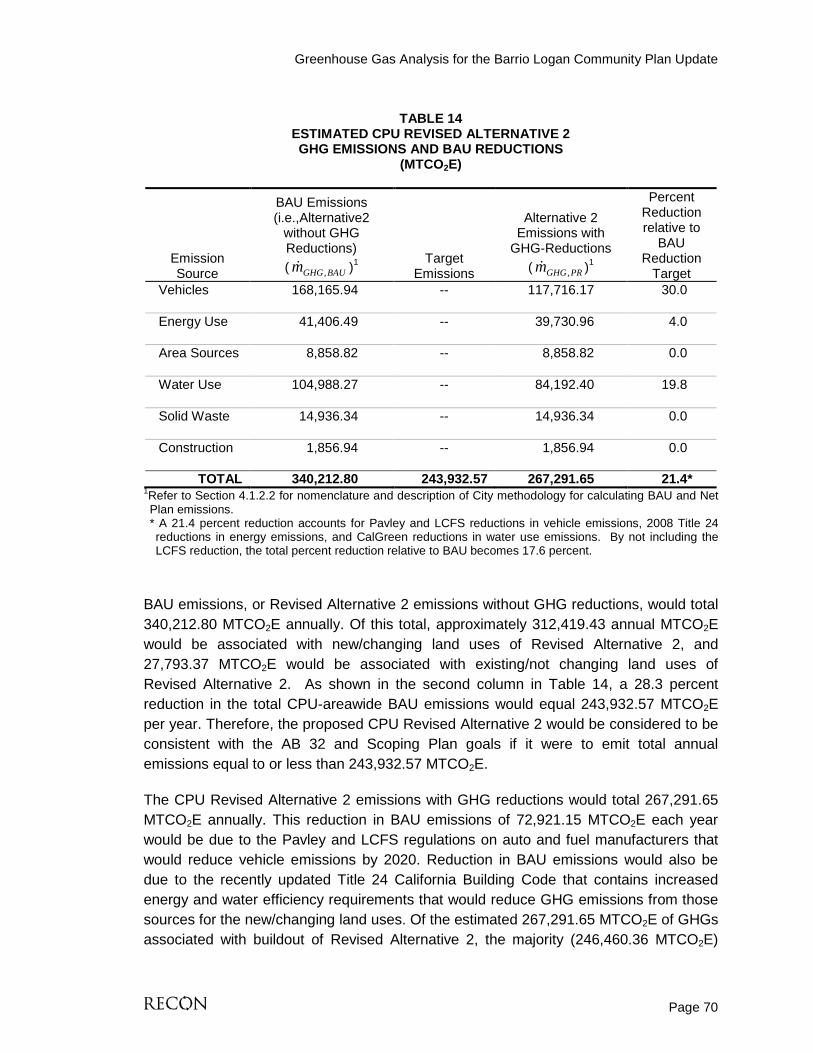
Greenhouse Gas Analysis for the Barrio Logan Community Plan Update
Page 70
TABLE 14
ESTIMATED CPU REVISED ALTERNATIVE 2 GHG EMISSIONS AND BAU REDUCTIONS
(MTCO2E)
Emission Source
BAU Emissions (i.e.,Alternative2
without GHG Reductions) ( BAUGHGm , )1
Target Emissions
Alternative 2 Emissions with
GHG-Reductions ( PRGHGm , )1
Percent Reduction relative to
BAU Reduction
Target Vehicles 168,165.94
-- 117,716.17
30.0
Energy Use 41,406.49
-- 39,730.96
4.0
Area Sources 8,858.82
-- 8,858.82
0.0
Water Use 104,988.27
-- 84,192.40
19.8
Solid Waste 14,936.34
-- 14,936.34
0.0
Construction 1,856.94
-- 1,856.94
0.0
TOTAL 340,212.80 243,932.57 267,291.65 21.4* 1Refer to Section 4.1.2.2 for nomenclature and description of City methodology for calculating BAU and Net Plan emissions. * A 21.4 percent reduction accounts for Pavley and LCFS reductions in vehicle emissions, 2008 Title 24 reductions in energy emissions, and CalGreen reductions in water use emissions. By not including the LCFS reduction, the total percent reduction relative to BAU becomes 17.6 percent.
BAU emissions, or Revised Alternative 2 emissions without GHG reductions, would total 340,212.80 MTCO2E annually. Of this total, approximately 312,419.43 annual MTCO2E would be associated with new/changing land uses of Revised Alternative 2, and 27,793.37 MTCO2E would be associated with existing/not changing land uses of Revised Alternative 2. As shown in the second column in Table 14, a 28.3 percent reduction in the total CPU-areawide BAU emissions would equal 243,932.57 MTCO2E per year. Therefore, the proposed CPU Revised Alternative 2 would be considered to be consistent with the AB 32 and Scoping Plan goals if it were to emit total annual emissions equal to or less than 243,932.57 MTCO2E.
The CPU Revised Alternative 2 emissions with GHG reductions would total 267,291.65 MTCO2E annually. This reduction in BAU emissions of 72,921.15 MTCO2E each year would be due to the Pavley and LCFS regulations on auto and fuel manufacturers that would reduce vehicle emissions by 2020. Reduction in BAU emissions would also be due to the recently updated Title 24 California Building Code that contains increased energy and water efficiency requirements that would reduce GHG emissions from those sources for the new/changing land uses. Of the estimated 267,291.65 MTCO2E of GHGs associated with buildout of Revised Alternative 2, the majority (246,460.36 MTCO2E)
Greenhouse Gas Analysis for the Barrio Logan Community Plan Update
Page 71
would come from new/changing land uses and the remainder (21,831.29 MTCO2E) would come from existing/not changing land uses.
The Revised Alternative 2 net GHG emissions of 267,291.65 MTCO2E each year, when compared to the BAU annual emissions of 340,212.80 MTCO2E, would result in a 21.4 percent reduction in GHG emissions relative to BAU. Without accounting for the LCFS reduction on vehicle emissions, the Revised Alternative 2 net GHG emissions would total 280,371.22 MTCO2E each year, and when compared to the BAU annual emissions of 340,212.80 MTCO2E would result in a 17.6 percent reduction in GHG emissions relative to BAU. This falls short of meeting the City’s goal of a minimum 28.3 percent reduction in GHG emissions relative to BAU. Without measures to reduce GHG emissions further, the cumulative GHG emissions generated from Revised Alternative 2 buildout would be significant. Therefore, subsequent projects under the CPU would likely be required to implement GHG-reducing features beyond those mandated under existing codes and regulations.
5.1.3 Mitigation The proposed Mobility, Urban Design, and Conservation elements of the proposed CPU include specific policies to require dense, compact and diverse development, encourage highly efficient energy and water conservation design, increase walkability and bicycle and transit accessibility, increase urban forestry practices and community gardens, decrease urban heat islands, and increase climate-sensitive community design. These policies would serve to reduce consumption of fossil-fueled vehicles and energy resulting in a reduction in communitywide GHG emissions relative to BAU. These policies are discussed in detail in Section 5.2.
Despite the inclusion of these policies (most of which are not quantifiable in terms of their GHG emissions reductions at the plan level), and despite the GHG reductions gleaned from statewide regulations on vehicle GHG emissions and building energy and water use, the Plan’s projected GHG emissions under both land use alternatives will fall short of meeting the 28.3 percent GHG reduction target relative to 2020 BAU. Instead, as quantified at the Plan-level, buildout GHG emissions would range from 21.0 to 21.4 percent less than 2020 BAU emissions.
The approximate gap of 8 percent in meeting the target reductions could potentially be made up through one or a combination of several effective and quantifiable GHG reduction measures at the level of subsequent projects that pertain to:
• Building and non-building energy use
• Indoor and outdoor water use
• Area sources

Greenhouse Gas Analysis for the Barrio Logan Community Plan Update
Page 72
• Solid waste disposal
• Vegetation/carbon sequestration
• Construction equipment
• Transportation/vehicles
The effectiveness and feasibility of these GHG reduction measures in reducing GHG emissions have been documented in the 2010 CAPCOA publication Quantifying Greenhouse Gas Mitigation Measures (CAPCOA 2010). They have subsequently been included in the mitigation modules of the California Emissions Estimator Model, the CARB-sponsored modeling software released in March 2011 to quantify GHG emissions and reductions (CARB 2011). These measures are the type of measures anticipated to be included in the City’s Climate Mitigation and Adaptation Plan yet to be completed. These measures are best quantified at the project-level, because specific project-level design information is needed to calculate accurate GHG reductions. At the plan level, impacts would remain significant and unmitigated.
5.1.4 Significance of Impacts after Mitigation Plan-level impacts associated with the CPU’s contribution of GHGs to cumulative statewide emissions would be significant and unmitigated.
5.2 Consistency with Adopted Plans, Policies, and Regulations
5.2.1 Impacts
5.2.1.1 Overview of Local and State GHG Reduction Measures
The regulatory plans and policies discussed extensively in Section 3.2 above aim to reduce national, state, and local GHG emissions by primarily targeting the largest emitters of GHGs: the transportation and energy sectors. The goals and regulatory standards discussed in Section 3.2 are thus largely focused on the automobile industry and public utilities. For the transportation sector, the reduction strategy is generally three pronged: to reduce GHG emissions from vehicles by improving engine design; to reduce the carbon content of transportation fuels through research, funding, and incentives to fuel suppliers; and to reduce the miles vehicles traveled through land use change and infrastructure investments. The types of land use changes that can measurably reduce GHG emissions associated with vehicle use include: increased density; increased
Greenhouse Gas Analysis for the Barrio Logan Community Plan Update
Page 73
diversity (mixed use); improved walkability design; improved transit accessibility; transit improvements; integration of below market-rate housing; and constrained parking.
By increasing density, especially within proximity of transit, people’s travel distances are affected and greater options for the mode of travel are provided. This can result in a substantial reduction in VMT depending on the change in density compared to a typical suburban residential density (CAPCOA 2010). By increasing the diversity of land use (i.e., through mixed-use developments), a similar reduction in VMT can occur because trips between land use types would be shorter and may be accommodated by non-auto modes of transport. By increasing transit accessibility (e.g., by locating a high-density project near transit), a shift in travel mode is facilitated along with reduced VMT. Income has a statistically significant effect on the probability that a commuter will take transit or walk to work, as lower income families tend to have lower levels of auto ownership (CAPCOA 2010). Therefore, by integrating affordable and below market rate housing, VMT can be further reduced. By constraining parking supply, either through policy changes (e.g., reduced parking requirements for urban areas) or through pricing and/or preferential parking for ridesharing and fuel-efficient vehicles, VMT would decrease as motorists shift away from single-occupancy vehicle travel and carpool, take transit, or walk/bicycle instead.
The effectiveness of these land-use strategies ranges from less than one percent up to a maximum 30 percent reduction in community wide VMT and are not additive (CAPCOA 2010). For example, where high density mixed use development is located within a five to ten minute walk from a transit station with high-frequency transit or bus service and is combined with walkable neighborhood design, a total VMT reduction up to 24 percent can be achieved (CAPCOA 2010).
For the energy sector, the reduction strategies of local, state and national plans aim to reduce energy demand; impose emission caps on energy providers; establish minimum building energy and green building standards; transition to renewable non-fossil fuels; incentivize homeowners and builders; fully recover landfill gas for energy; expand research and development; and so forth. At the plan or project-level, policies or incentive programs for builders to exceed the current Title 24 energy efficiency standards, to install high efficiency lighting and energy-efficient plug-in appliances (for energy uses not subject to Title 24), and to incorporate on-site renewable energy generation can result in substantial GHG emissions reductions, up to 35 percent or more. Energy use associated with water consumption and wastewater treatment can also be reduced by applying an overall water reduction strategy (e.g., of 20% on indoor and outdoor water use) and/or policies and actions related to using reclaimed and gray water, installation of low-flow plumbing fixtures, use of water-efficient landscape design including turf reduction, and use of water-efficient irrigation systems. The institution of recycling and composting services can also reduce the energy embodied in the disposal of solid waste.
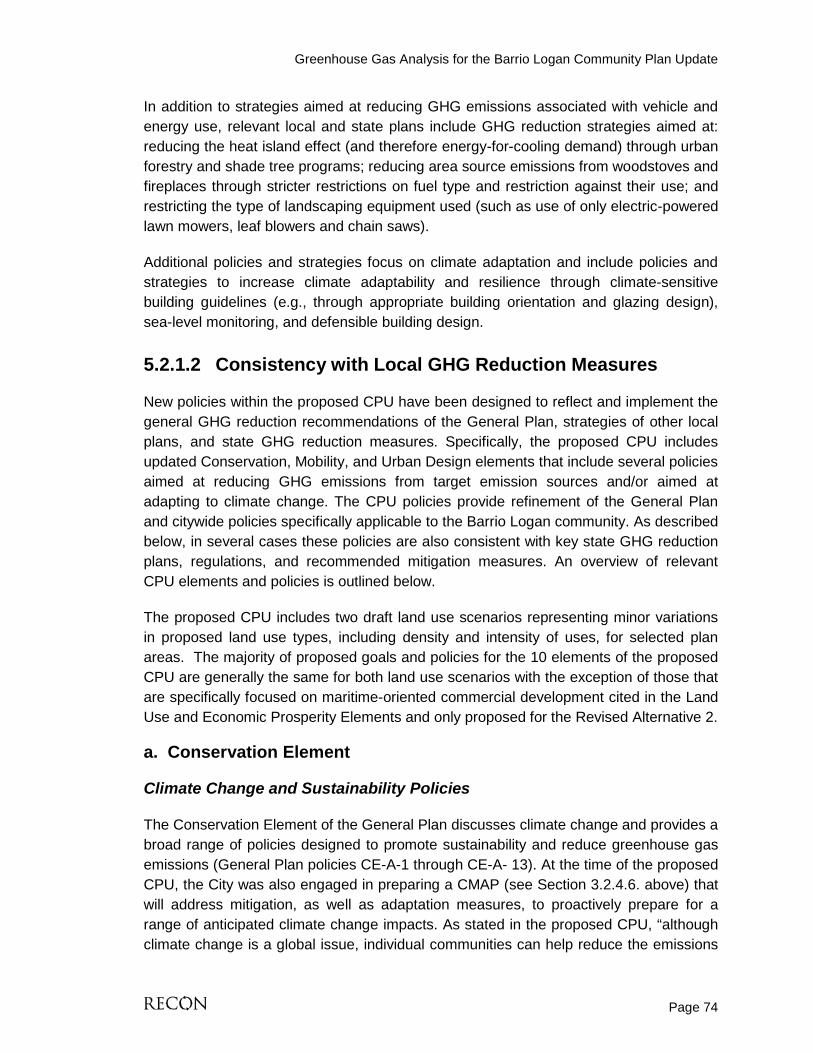
Greenhouse Gas Analysis for the Barrio Logan Community Plan Update
Page 74
In addition to strategies aimed at reducing GHG emissions associated with vehicle and energy use, relevant local and state plans include GHG reduction strategies aimed at: reducing the heat island effect (and therefore energy-for-cooling demand) through urban forestry and shade tree programs; reducing area source emissions from woodstoves and fireplaces through stricter restrictions on fuel type and restriction against their use; and restricting the type of landscaping equipment used (such as use of only electric-powered lawn mowers, leaf blowers and chain saws).
Additional policies and strategies focus on climate adaptation and include policies and strategies to increase climate adaptability and resilience through climate-sensitive building guidelines (e.g., through appropriate building orientation and glazing design), sea-level monitoring, and defensible building design.
5.2.1.2 Consistency with Local GHG Reduction Measures
New policies within the proposed CPU have been designed to reflect and implement the general GHG reduction recommendations of the General Plan, strategies of other local plans, and state GHG reduction measures. Specifically, the proposed CPU includes updated Conservation, Mobility, and Urban Design elements that include several policies aimed at reducing GHG emissions from target emission sources and/or aimed at adapting to climate change. The CPU policies provide refinement of the General Plan and citywide policies specifically applicable to the Barrio Logan community. As described below, in several cases these policies are also consistent with key state GHG reduction plans, regulations, and recommended mitigation measures. An overview of relevant CPU elements and policies is outlined below.
The proposed CPU includes two draft land use scenarios representing minor variations in proposed land use types, including density and intensity of uses, for selected plan areas. The majority of proposed goals and policies for the 10 elements of the proposed CPU are generally the same for both land use scenarios with the exception of those that are specifically focused on maritime-oriented commercial development cited in the Land Use and Economic Prosperity Elements and only proposed for the Revised Alternative 2.
a. Conservation Element
Climate Change and Sustainability Policies
The Conservation Element of the General Plan discusses climate change and provides a broad range of policies designed to promote sustainability and reduce greenhouse gas emissions (General Plan policies CE-A-1 through CE-A- 13). At the time of the proposed CPU, the City was also engaged in preparing a CMAP (see Section 3.2.4.6. above) that will address mitigation, as well as adaptation measures, to proactively prepare for a range of anticipated climate change impacts. As stated in the proposed CPU, “although climate change is a global issue, individual communities can help reduce the emissions

Greenhouse Gas Analysis for the Barrio Logan Community Plan Update
Page 75
that contribute to climate change and devise local plans to adapt to anticipated changes”. The proposed CPU contains the following policies to provide a framework for addressing and adapting to climate change. These strategies are generally consistent with the General Plan Mitigation Framework recommendations and with climate change mitigation and adaptation strategies of state plans and programs.
Policy 8.1.1. Implement General Plan sustainability policies through innovative regulations and the project review process.
Policy 8.1.2. Monitor sea level rise studies and adaptation recommendations and develop an action plan over time.
Policy 8.1.3. Preserve and enhance Barrio Logan’s attributes as a walkable community to provide residents with attractive alternatives to driving, thus reducing VMT and fostering a healthy community (see Mobility Element).
Policy 8.1.4. Reduce project level greenhouse gas emissions to acceptable levels through project design, application of site-specific mitigation measures, or adherence to standardized measures outlined in the City’s adopted citywide climate action plan.
These framework policies include the types of policies anticipated to be set forth in the Climate Mitigation and Adaptation Plan currently being prepared by the City (refer to Section 3.2.4.6).
Sustainable Energy Policies
The CPU includes the following policies consistent with General Plan policies CE-I.1 through CE-I.13.
Policy 8.2.20. Promote development that qualifies for the City’s Sustainable Buildings Expedite Program.
Policy 8.2.21. Educate residents and businesses on efficient appliances and techniques for reducing energy consumption.
Policy 8.2.22. Provide and/or retrofit lighting in the public right-of-way that is energy efficient.
Policy 8.2.23. Provide information on programs and incentives for achieving more energy-efficient buildings and renewable energy production.
By increasing energy efficiency and converting from fossil fuels to renewable energy sources, GHG emissions can be reduced. Project-level incorporation of highly efficient energy design and use of on-site renewable energy generation are measures specifically identified in the 2010 CAPCOA GHG Mitigation Measures report and CalEEMod energy

Greenhouse Gas Analysis for the Barrio Logan Community Plan Update
Page 76
use mitigation module (refer to energy use discussion in Section 5.1). Thus, with subsequent projects, the reductions in GHG emissions can be quantified.
Community Gardens and Urban Agriculture Policies
Barrio Logan has the potential to provide multiple sites for community gardens that would contain individual and shared-plot spaces. For instance, land owned by San Diego Gas & Electric at Sampson Street and Newton Avenue, BNSF railroad along Harbor Drive, Metropolitan Transit System, Caltrans, City of San Diego, as well as San Diego Unified School District may have remnant parcels that could be used as community gardens. As outlined in the new CPU policies below, future community gardens would become attractive focal points that bring the neighborhood together as a way to interact, recreate, and create a sustainable food system within the community.
Policy 8.2.36. Promote the inclusion and development of urban agriculture in Barrio Logan.
Policy 8.2.37. Locate community gardens in Barrio Logan where there is sufficient demand, appropriate land, and where they will not generate adverse impacts on adjacent uses.
Policy 8.2.38. Develop and maintain partnerships with organizations that provide services, programs, and activities that would complement a Community Garden program in Barrio Logan.
Policy 8.2.39. Locate community gardens on publicly-owned properties whenever possible, such as the SDG&E parcel at Sampson Street and Newton Avenue or along the Caltrans-owned parcels along Boston Avenue between 29th and 32nd Streets.
Establishing a community garden has the potential to reduce GHG emissions by providing project residents with a local source of food, potentially resulting in a reduction in the number of trips and VMT traveled by both the food and the consumers to grocery stores and supermarkets. Community gardens can also contribute to GHG reductions by displacing carbon-intensive food production practices. The emissions reductions cannot be reasonably quantified at this time because they are based on several undefined parameters: the relative locations of the farmer’s market, supermarket, and supermarket produce suppliers; the carbon intensity of food production practices; and the role of a farmer’s market in a development.
In most cases, a community garden will reduce emissions associated with the distribution of food from the field to the consumer, since with community gardens the food goes directly from the field to the consumer, while in grocery stores the path is more likely from the field to regional distribution center, to store, and to consumer. If consumers obtain produce from a community garden when they would otherwise drive a

Greenhouse Gas Analysis for the Barrio Logan Community Plan Update
Page 77
farther distance to purchase produce from a grocery store, the trip to the grocery store is displaced, VMT is reduced, and GHG emissions reductions are achieved. However, if a consumer drives to the community garden and then to the grocery store (for example, to purchase food which the community garden cannot provide), the trip to the garden is made in addition to the trip to the grocery store. Thus an additional trip is made, VMT is added, and the GHGs are increased. It is unclear how community gardens affect the food purchasing behavior of consumers, and therefore the effect of a community garden on transportation-related GHG emissions is not quantifiable at this time.
Urban Forestry Policies
Street tree and private tree planting programs are low cost, low-technology methods for improving the visual landscape and air quality in Barrio Logan. As the number and size of trees in the Barrio Logan urban forest increase, so will the benefits. These benefits include lower energy consumption resulting from reduction in the size of the urban heat island; reduced storm water runoff through absorption of water by the trees; improved air quality achieved as the trees convert carbon dioxide into oxygen; and an improved pedestrian environment created by providing pedestrians protection from the heat and glare of the sun. The policies of the CPU conform to General Plan urban forestry policies CE-J.1 through CE-J.5. The following CPU policies refine these General Plan policies for the Barrio Logan community.
Policy 8.2.24. Increase the overall tree canopy cover throughout Barrio Logan by 20 percent in urban residential areas and 10 percent in the business areas so that the natural landscape is sufficient in mass to provide significant benefits to the city in terms of air and water management.
Policy 8.2.25. Work with the City’s Urban Forestry Division to coordinate the appropriate selection and location of shade-producing trees.
Policy 8.2.26. Require that new development retain significant and mature trees.
Policy 8.2.27. Support public outreach efforts to educate business owners, residents, and schoolchildren on the care of and environmental benefits of shade-producing street trees.
Planting shade trees around buildings has been shown to effectively lower the electricity cooling demand of buildings by blocking incident sunlight and reducing heat gain through windows, walls, and roofs (CAPCOA 2010). By reducing cooling demand, shade trees help reduce electricity demand from the local utility and therefore reduce GHG emissions that would otherwise be emitted during the production of electricity. All proposed development within Barrio Logan will be required to plant and maintain street trees as identified in the CPU’s Urban Design Element Urban Forest/Street Trees section as well as its Appendix A.

Greenhouse Gas Analysis for the Barrio Logan Community Plan Update
Page 78
Additionally, the increase of open space preservation as part of the proposed CPU, such as the Chollas Creek Enhancement Program, would provide maintenance and enhancement of vegetation, which sequesters GHGs thereby potentially reducing the communitywide contribution of GHG emissions.
Water Resource Management Policies
The Conservation Element also includes water-conservation measures that through implementation can reduce the need for water, thereby reducing the energy use embodied in water supply and treatment and its associated GHG emissions. The policies are as follows:
Policy 8.2.6. Encourage all landscape design to use water conserving plant material and techniques to comply with the landscape water budget of the Municipal Code.
Policy 8.2.7. Encourage development to incorporate recycled and/or gray water irrigation systems early in the design process.
Policy 8.2.8. Provide ongoing education on water resource conservation opportunities available through the City of San Diego’s Department of Public Works and the San Diego County Water Authority.
These policies are consistent with the indoor and outdoor water reduction strategies of the General Plan and the state Climate Change Scoping Plan, the 2010 CAPCOA GHG Mitigation Measures report, and the recently effective 2011 CalGreen water reduction requirements for residential and non-residential uses (refer to Section 3.2.3.5.e). At the individual project level, some of these measures could be quantified and their GHG reductions accounted for using the CalEEMod water use mitigation module or other appropriate methodology (refer to water discussion in section 5.1.1.2).
Solid Waste Management Policies
Barrio Logan is the location of many recycling facilities, which are important elements in an integrated waste management strategy to conserve raw materials and energy and to reduce emissions of GHGs. The proposed CPU Conservation Element policies related to solid waste management include the following:
Policy 8.2.28. Encourage multi-story developments to include solid waste and recycling management measures, such as dual trash/recycling chutes, in development plans to facilitate compliance with recycling regulations.
Policy 8.2.29. Promote recycling facilities that are well maintained, attractive in appearance, and help promote waste reduction in the community.

Greenhouse Gas Analysis for the Barrio Logan Community Plan Update
Page 79
In 1989 the California Legislature passed AB 939, the Integrated Waste Management Act, which mandated that all cities reduce waste disposed in landfills from generators within their borders by 50 percent by the year 2000. In response, the City of San Diego Environmental Services Department (ESD) developed the Source Reduction and Recycling element, which incorporates waste management policies and programs to meet the City’s long-term disposal needs and achieve the mandated waste reduction. In accordance with these citywide policies, prior to a subsequent project’s occupancy, a long-term waste management program would be developed and implemented for the project to ensure that the development meets or exceeds the requirements set forth in AB 939. The program is to include provisions of sufficient interior and exterior storage space for refuse and recyclable materials, and a means of handling landscaping and green waste materials. By incorporating these and other waste management strategies in subsequent projects, the state/City requirements for waste diversion would be met. Subsequent projects could also exceed the minimum waste reduction requirements through voluntary compliance with the CalGreen Tier I and II levels or with a similar green building rating system such as the U.S. Green Building Council’s Leadership in Energy and Environmental Design (LEED).
These actions would be consistent with the solid waste GHG reduction strategies of the General Plan as well as with the waste reduction strategies discussed in the state Climate Change Scoping Plan and 2010 CAPCOA GHG Mitigation Measures report. At the individual project level, waste reduction beyond mandated requirements could be quantified and their GHG reductions accounted for using the CalEEMod solid waste mitigation module or other appropriate methodology (refer to solid waste discussion in section 5.1.1.2).
b. Mobility Element
Through increasing density, bringing people closer to their work, and providing pedestrian connections to retail, commercial, and residential units, a substantial reduction in VMT can occur (CAPCOA 2010; see discussion under Section 5.2.1). A communitywide reduction in vehicle travel would reduce local VMT, which would in turn reduce emissions associated with vehicle use. The overarching goals set forth in the new Mobility Element of the proposed CPU to achieve VMT reductions include:
Mobility Goals:
• Pedestrian-friendly facilities throughout the community with an emphasis on Cesar E. Chavez Parkway, 28th Street, the National Avenue/26th Street/Boston Avenue corridor, and Harbor Drive.
• Transit as a mode of choice for residents and employees in the area by supporting improvements to transit service and infrastructure.
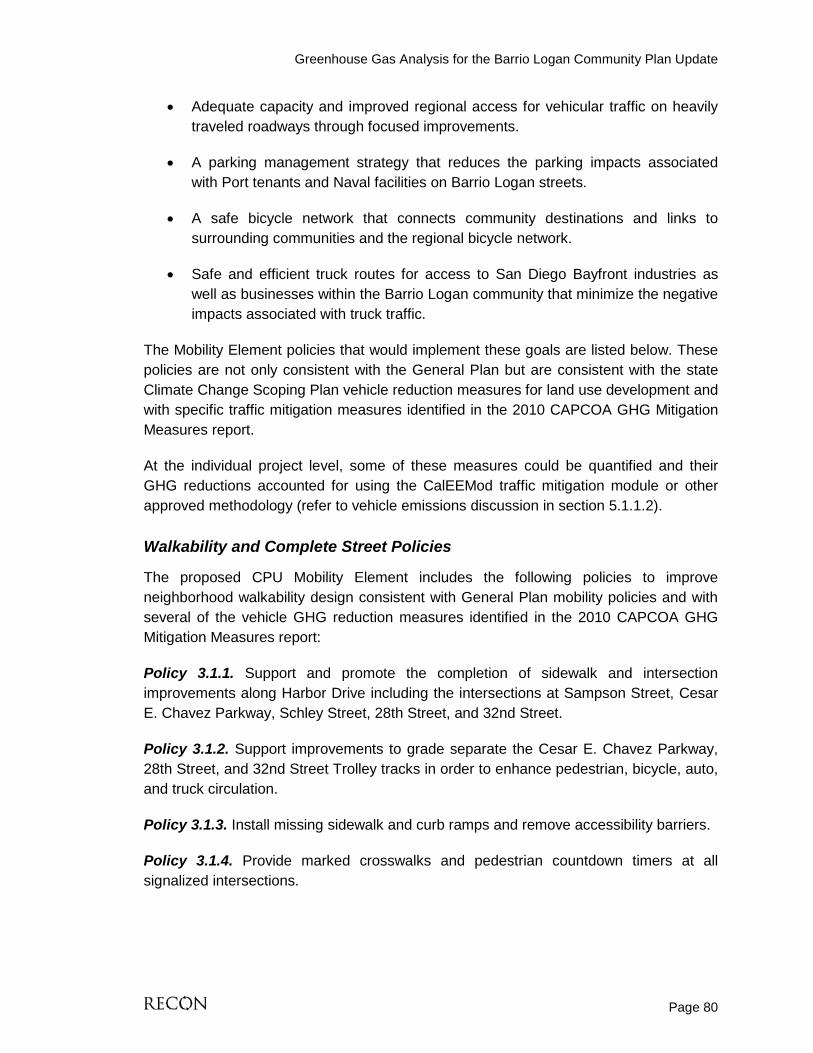
Greenhouse Gas Analysis for the Barrio Logan Community Plan Update
Page 80
• Adequate capacity and improved regional access for vehicular traffic on heavily traveled roadways through focused improvements.
• A parking management strategy that reduces the parking impacts associated with Port tenants and Naval facilities on Barrio Logan streets.
• A safe bicycle network that connects community destinations and links to surrounding communities and the regional bicycle network.
• Safe and efficient truck routes for access to San Diego Bayfront industries as well as businesses within the Barrio Logan community that minimize the negative impacts associated with truck traffic.
The Mobility Element policies that would implement these goals are listed below. These policies are not only consistent with the General Plan but are consistent with the state Climate Change Scoping Plan vehicle reduction measures for land use development and with specific traffic mitigation measures identified in the 2010 CAPCOA GHG Mitigation Measures report.
At the individual project level, some of these measures could be quantified and their GHG reductions accounted for using the CalEEMod traffic mitigation module or other approved methodology (refer to vehicle emissions discussion in section 5.1.1.2).
Walkability and Complete Street Policies
The proposed CPU Mobility Element includes the following policies to improve neighborhood walkability design consistent with General Plan mobility policies and with several of the vehicle GHG reduction measures identified in the 2010 CAPCOA GHG Mitigation Measures report:
Policy 3.1.1. Support and promote the completion of sidewalk and intersection improvements along Harbor Drive including the intersections at Sampson Street, Cesar E. Chavez Parkway, Schley Street, 28th Street, and 32nd Street.
Policy 3.1.2. Support improvements to grade separate the Cesar E. Chavez Parkway, 28th Street, and 32nd Street Trolley tracks in order to enhance pedestrian, bicycle, auto, and truck circulation.
Policy 3.1.3. Install missing sidewalk and curb ramps and remove accessibility barriers.
Policy 3.1.4. Provide marked crosswalks and pedestrian countdown timers at all signalized intersections.
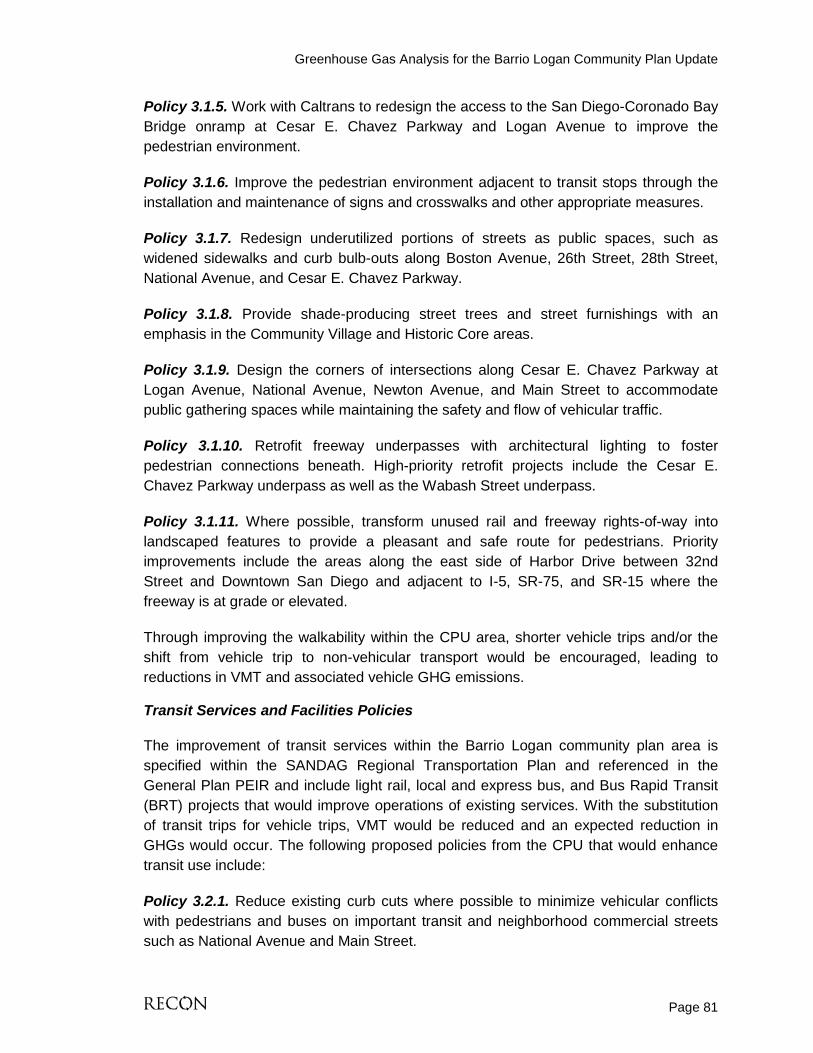
Greenhouse Gas Analysis for the Barrio Logan Community Plan Update
Page 81
Policy 3.1.5. Work with Caltrans to redesign the access to the San Diego-Coronado Bay Bridge onramp at Cesar E. Chavez Parkway and Logan Avenue to improve the pedestrian environment.
Policy 3.1.6. Improve the pedestrian environment adjacent to transit stops through the installation and maintenance of signs and crosswalks and other appropriate measures.
Policy 3.1.7. Redesign underutilized portions of streets as public spaces, such as widened sidewalks and curb bulb-outs along Boston Avenue, 26th Street, 28th Street, National Avenue, and Cesar E. Chavez Parkway.
Policy 3.1.8. Provide shade-producing street trees and street furnishings with an emphasis in the Community Village and Historic Core areas.
Policy 3.1.9. Design the corners of intersections along Cesar E. Chavez Parkway at Logan Avenue, National Avenue, Newton Avenue, and Main Street to accommodate public gathering spaces while maintaining the safety and flow of vehicular traffic.
Policy 3.1.10. Retrofit freeway underpasses with architectural lighting to foster pedestrian connections beneath. High-priority retrofit projects include the Cesar E. Chavez Parkway underpass as well as the Wabash Street underpass.
Policy 3.1.11. Where possible, transform unused rail and freeway rights-of-way into landscaped features to provide a pleasant and safe route for pedestrians. Priority improvements include the areas along the east side of Harbor Drive between 32nd Street and Downtown San Diego and adjacent to I-5, SR-75, and SR-15 where the freeway is at grade or elevated.
Through improving the walkability within the CPU area, shorter vehicle trips and/or the shift from vehicle trip to non-vehicular transport would be encouraged, leading to reductions in VMT and associated vehicle GHG emissions.
Transit Services and Facilities Policies
The improvement of transit services within the Barrio Logan community plan area is specified within the SANDAG Regional Transportation Plan and referenced in the General Plan PEIR and include light rail, local and express bus, and Bus Rapid Transit (BRT) projects that would improve operations of existing services. With the substitution of transit trips for vehicle trips, VMT would be reduced and an expected reduction in GHGs would occur. The following proposed policies from the CPU that would enhance transit use include:
Policy 3.2.1. Reduce existing curb cuts where possible to minimize vehicular conflicts with pedestrians and buses on important transit and neighborhood commercial streets such as National Avenue and Main Street.
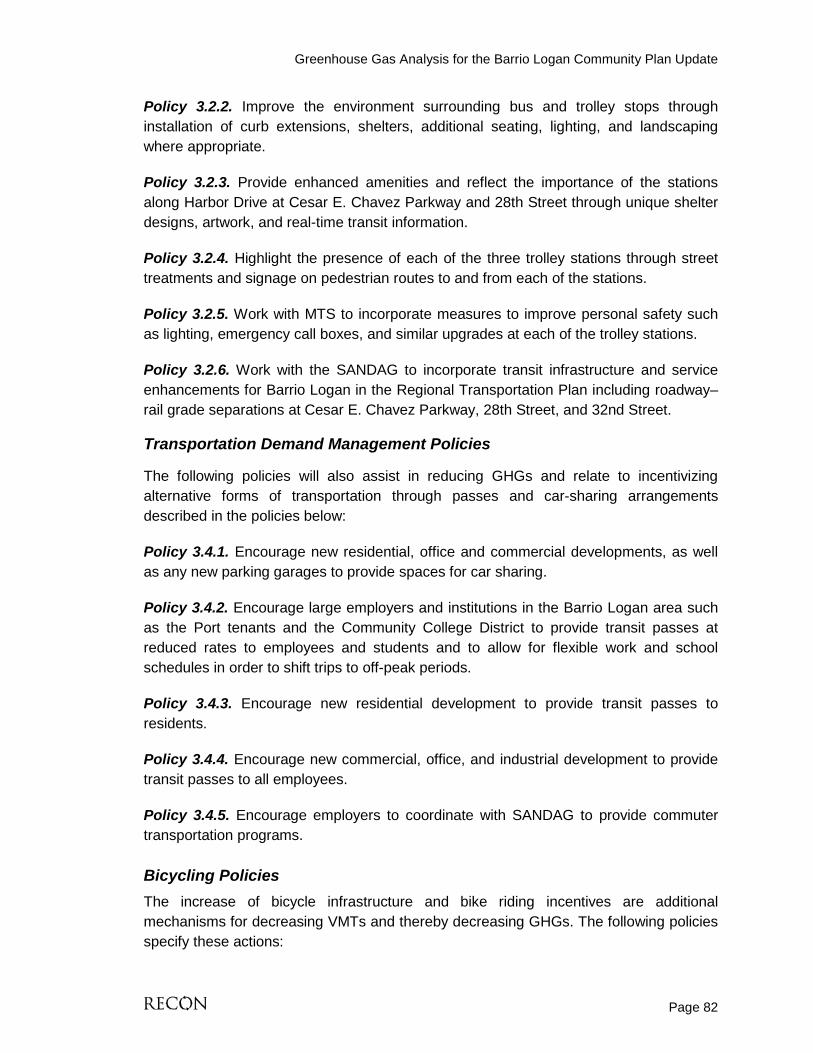
Greenhouse Gas Analysis for the Barrio Logan Community Plan Update
Page 82
Policy 3.2.2. Improve the environment surrounding bus and trolley stops through installation of curb extensions, shelters, additional seating, lighting, and landscaping where appropriate.
Policy 3.2.3. Provide enhanced amenities and reflect the importance of the stations along Harbor Drive at Cesar E. Chavez Parkway and 28th Street through unique shelter designs, artwork, and real-time transit information.
Policy 3.2.4. Highlight the presence of each of the three trolley stations through street treatments and signage on pedestrian routes to and from each of the stations.
Policy 3.2.5. Work with MTS to incorporate measures to improve personal safety such as lighting, emergency call boxes, and similar upgrades at each of the trolley stations.
Policy 3.2.6. Work with the SANDAG to incorporate transit infrastructure and service enhancements for Barrio Logan in the Regional Transportation Plan including roadway–rail grade separations at Cesar E. Chavez Parkway, 28th Street, and 32nd Street.
Transportation Demand Management Policies
The following policies will also assist in reducing GHGs and relate to incentivizing alternative forms of transportation through passes and car-sharing arrangements described in the policies below:
Policy 3.4.1. Encourage new residential, office and commercial developments, as well as any new parking garages to provide spaces for car sharing.
Policy 3.4.2. Encourage large employers and institutions in the Barrio Logan area such as the Port tenants and the Community College District to provide transit passes at reduced rates to employees and students and to allow for flexible work and school schedules in order to shift trips to off-peak periods.
Policy 3.4.3. Encourage new residential development to provide transit passes to residents.
Policy 3.4.4. Encourage new commercial, office, and industrial development to provide transit passes to all employees.
Policy 3.4.5. Encourage employers to coordinate with SANDAG to provide commuter transportation programs.
Bicycling Policies The increase of bicycle infrastructure and bike riding incentives are additional mechanisms for decreasing VMTs and thereby decreasing GHGs. The following policies specify these actions:
Greenhouse Gas Analysis for the Barrio Logan Community Plan Update
Page 83
Policy 3.5.1. Provide and support a continuous network of safe, convenient, and attractive bicycle facilities connecting Barrio Logan to the citywide bicycle network and implementing the San Diego Bicycle Master Plan and the Bayshore Bikeway.
Policy 3.5.2. Provide secure, accessible, and adequate bicycle parking, particularly at Barrio Trolley Station located at Cesar E. Chavez Parkway, 28th Street, and 32nd Street trolley stations, within shopping areas including the Mercado Commercial District, and at concentrations of employment throughout the community.
Policy 3.5.3. Work with Caltrans to retrofit the pedestrian overcrossing stairways over I-5 at Beardsley Street and 30th Street to add bike rails to facilitate wheeling a bicycle up the stairs.
These policies are consistent with the City’s General Plan and they support General Plan implementation at the community level by including specific goals, policies, and recommendations to improve bikability, when compared to the adopted community plan. The implementation of such bicycle policies would assist in decreasing GHG emissions locally.
c. Urban Design Element
Climate Sensitive Building Policies
As stated in the proposed CPU’s Urban Design Element, development of new infill buildings and retrofitting of existing buildings should take into account energy efficient design. The CPU envisions that when energy-efficient design is incorporated into the overall site planning and individual building design, it can create a distinctive context-sensitive architecture that will be unique to the Barrio Logan neighborhood. These policies are consistent not only with General Plan objectives, but with the Revised CP 600-27 and CP 900-14, as well as the Energy Conservation and Management Program and Comprehensive Plan (ECMPCP) and the Housing Enhancement Loan Program (HELP). These policies may also reflect the types of policies and adaptation measures anticipated to be incorporated in the City’s CMAP, which is still under development. These policies are also consistent with the state Climate Change Scoping Plan green building recommendations and with the intent of the energy use reduction measures identified in the 2010 CAPCOA GHG Mitigation Measures report.
Macro and micro level design solutions may include the following:
Policy 4.2.1. Minimize building heat gain and appropriately shade windows through the following techniques:
a) Orient new buildings and lots to minimize east and west facing facades.
Greenhouse Gas Analysis for the Barrio Logan Community Plan Update
Page 84
b) Configure buildings in such way as to create internal courtyards to trap cool air while still encourage interaction with streets and open spaces.
c) Provide awnings, canopies and deep-set windows on south facing windows and entries.
d) Provide exterior shades and shade screens on east, west and south-facing windows.
e) Use horizontal overhangs, awning or shade structures above south facing windows to mitigate summer sun but allow winter sun. Encourage overhang depth to equal half the vertical window height to shade the window from early May to mid-August but still allowing the winter sun.
f) Provide vertical shading and fins on east- and west-facing building facades.
Policy 4.2.2. Maximize natural and passive cooling that builds on the proximity of the nearby San Diego Bay through the following techniques:
a) Install high vents or open windows on the leeward side of the buildings to let the hottest air, near the ceiling, escape.
b) Create low open vents or windows on the windward side that accepts cooler air to replace the hotter air.
c) Ensure that leeward openings have substantially larger total area (50% to 100%) larger than those on the windward side to ensure adequate pressure to facilitate air movement.
d) Include high ceiling vaults and thermal chimneys to promote rapid air changes and to serve as architectural articulation for buildings.
e) Use wing walls (vertical solid panels placed alongside of windows perpendicular to the wall on the windward side of the building) to accelerate the natural wind speed due to pressure differences.
At the level of subsequent projects, given sufficient project-level design information, some of these measures could be quantified and their GHG reductions accounted for using the CalEEMod GHG emissions estimator model or other appropriate methods (refer to energy discussion in section 5.1.1.2).
Green Building Policies
The following green building policies are consistent with similar General Plan policies and with green building strategies recommended in the state Climate Change Scoping

Greenhouse Gas Analysis for the Barrio Logan Community Plan Update
Page 85
Plan and several of the measures identified in the 2010 CAPCOA GHG Mitigations Measures report. The policies are as follows:
Policy 4.2.3. Incorporate environmentally conscious building practices and materials by:
a) Using durable construction materials, as well as re-used and recycled materials.
b) Encouraging the use of permeable paving elements in auto and non-auto-oriented areas.
c) Minimizing impervious surfaces that have large thermal gain.
Policy 4.2.4. Provide on-site landscaping improvements that minimize heat gain and provide attractive and context sensitive landscape environments, by:
a) Planting deciduous trees on the south side of buildings to shade the south face and roof during the summer while allowing sunlight to penetrate buildings in the winter.
b) Planting vegetation adjacent to exposed east and west facing walls.
c) Planting groundcovers that prevent ground reflection and keep the surface cooler, preventing re-radiation.
Policy 4.2.5. Ensure development integrates storm water BMPs on-site to maximize their effectiveness by:
a) Encouraging the use of intensive and extensive green roofs and water collection devices, such as cisterns and rain barrels, to capture rainwater from the building for re-use.
b) Utilizing downspouts to discharge into disconnected impervious areas to interrupt the direct flow of rainwater from the buildings to the storm water system.
c) Minimizing on-site impermeable surfaces, such as concrete and asphalt. Utilizing permeable pavers, porous asphalt, reinforced grass pavement (turf–crete), or cobblestone block pavement to detain and infiltrate run-off on-site.
d) Using shared driveways to reduce impermeable paving.
GHG reductions from these policies are not quantifiable at the plan level. At the level of subsequent projects, given sufficient project-level design information, some of these measures could be quantified and their GHG reductions accounted for using the CalEEMod GHG emissions estimator model or other appropriate methodology (refer to energy discussion in section 5.1.1.2).

Greenhouse Gas Analysis for the Barrio Logan Community Plan Update
Page 86
5.2.1.3 Consistency with State GHG Reduction Measures
a. Consistency with State GHG Reduction Strategies
EO S-3-05 established GHG emission reduction targets for the state, and AB 32 launched the CARB Climate Change Scoping Plan that outlined the reduction measures needed to reach these targets. The Climate Change Scoping Plan and its implementing and complementary regulations are discussed at length in Section 3.2.3 and generally encompass the GHG reduction strategies described at the beginning of this section (in Section 5.2.1.1). Subsequent to the CARB Climate Change Scoping Plan, the CAPCOA (a division of CARB), released the report Quantifying Greenhouse Gas Mitigation Measures: A Resource for Local Government to Assess Emission Reductions from Greenhouse Gas Mitigation Measures (“Mitigation Measures” report), that identifies specific project-level and plan-level GHG reduction measures (CAPCOA 2010). The report includes quantification of the GHG reductions that could be achieved through incorporation of project-level mitigation measures. These measures fall into the same categories as discussed earlier: transportation, energy, water and wastewater, solid waste, area source (woodstoves, fireplaces, landscaping equipment), and construction emissions. Most of the mitigation measures included in the CAPCOA report are identified for project-level analyses, however, the project-level reduction strategies can be extrapolated to the plan-level. The plan-level reduction measures included in the report are few in comparison and are largely unquantifiable. They pertain to funding and incentive programs for increased energy efficiency; establishment of local farmer’s markets and community gardens; urban shade tree planting programs, and communitywide strategies to reduce urban heat island effect. Several of the plan-level measures, as well as the project-level measures, have been generally incorporated into the proposed CPU as indicated in Section 5.2.1.2 above.
In general, the CPU policies outlined above in Section 5.2.1.2 correspond to the general intent of the GHG reduction measures identified in both the 2010 CAPCOA GHG Mitigation Measures report and the 2008 CARB Climate Change Scoping Plan. Where practicable, GHG reductions were included in the quantification of the Plan Update’s GHG emissions, as described in the Section 5.1 cumulative GHG emissions analysis. In the quantification of CPU GHG emissions in Section 5.1, GHG reductions were accounted for vehicle emissions, and energy and water use emissions. These comprised the GHG reduction/mitigation measures that were quantifiable at the plan level. Subsequent projects could achieve further GHG reductions in these emissions sources, as well as in the area source, construction, and solid waste GHG emissions, through project-specific design features. Where practicable, these features are outlined in Section 5.1 under the respective emission source analyses for the Plan with Reductions-scenario (i.e., Section 5.1.1.2 et seq.).
Greenhouse Gas Analysis for the Barrio Logan Community Plan Update
Page 87
b. Consistency with State GHG Reduction Targets
Year 2020 GHG emission reduction targets were identified for the state in AB 32 and the CARB Climate Change Scoping Plan. The reduction targets aim to reduce business-as-usual (BAU) statewide GHG emissions to 1990 levels by 2020. CARB estimated that this would equate to an approximate 28.3 percent reduction in statewide BAU emissions.
The analysis in Section 5.1 of this report provides quantification of the proposed CPU’s GHG emissions relative to a CPU BAU scenario for 2020. Despite plan-level GHG reductions achieved through statewide vehicle regulations, and increased energy and water-efficiency standards, resulting CPU GHG emissions were shown to fall short of meeting the targeted 28.3 percent reduction relative to BAU. It is anticipated, however, that through compliance with the City’s CMAP (once adopted) and/or with project-level GHG analyses, the level of impacts at the individual project level would be reduced to less than applicable significance thresholds.
5.2.2 Significance of Impacts The proposed CPU contains policies that would reduce GHG emissions from transportation and operational building uses (related to water and energy consumption, and solid waste generation, etc.) that are consistent with the goals and strategies of local and state plans, policies, and regulations aimed at reducing GHG emissions from land use and development. The level of impacts associated with potential plan conflict would therefore be less than significant.
6.0 Conclusions and Recommendations With regard to cumulative GHG emissions quantities, the proposed CPU’s GHG emissions, when compared to their BAU emissions, would result in a 21.0 to 21.4 percent reduction in emissions relative to BAU (with inclusion of the LCFS vehicle reductions), and a 17.3 to 17.6 percent reduction in emissions relative to BAU (without inclusion of the LCFS vehicle reductions). This falls short of meeting the City’s threshold of a minimum 28.3 percent reduction in GHG emissions relative to BAU. Without measures to reduce emissions further, the cumulative GHG emissions generated from either CPU alternative would be significant. Subsequent projects under the CPU may be required to implement GHG-reducing features beyond those mandated under existing codes and regulations in order to reduce GHG emissions below threshold levels. Once adopted, subsequent projects would also be required to comply with any GHG reduction compliance measures outlined in the CMAP. However, at the plan-level, the level of impacts associated with each CPU alternative’s contribution of GHGs to cumulative statewide emissions would remain significant and unmitigated.

Greenhouse Gas Analysis for the Barrio Logan Community Plan Update
Page 88
With regard to plan consistency, the proposed CPU would be consistent with the goals, strategies, and reduction targets of relevant local and state plans, and regulations aimed at reducing GHG emissions from land use and development. The level of impact associated with potential plan conflict would therefore be less than significant.
Greenhouse Gas Analysis for the Barrio Logan Community Plan Update
Page 89
7.0 References Cited Association of Environmental Professionals (AEP) 2010 Spring 2010 Advanced CEQA Workshop. San Diego Chapter. May 13. Australian Government 2007 Montreal Protocol on Substances that Deplete the Ozone Layer. Department
of the Environment and Water Resources (DEWR). Obtained from the DEWR website at http://www.environment.gov.au/atmosphere/ozone/legislation/ montp.html on July 27, 2007.
California Air Pollution Control Officers Association (CAPCOA) 2010 Quantifying Greenhouse Gas Mitigation Measures: A Resource for Local
Government to Assess Emission Reductions from Greenhouse Gas Mitigation Measures. August.
California Air Resources Board (CARB) 2007 California 1990 Greenhouse Gas Emissions Level and 2020 Emissions Limit.
November 16. 2008a California 2020 GHG Emissions Forecast. Accessed June 1, 2010 from the
CARB website at http://www.arb.ca.gov/cc/inventory/data/forecast.htm. Last updated October 2008; last reviewed May 28, 2010.
2008b Climate Change Scoping Plan: A Framework for Change. Accessed from the
CARB website April 15, 2010 at http://www.arb.ca.gov/cc/scopingplan/ document/adopted_scoping_plan.pdf. December.
2010a Greenhouse Gas Inventory Data – 2000 to 2008. Obtained from the CARB
website at http://www.arb.ca.gov/cc/inventory/data/data.htm (last updated May 12, 2010) on December 28.
2010b Greenhouse Gas Emission Forecast for 2020: Data Sources, Methods, and
Assumptions, and Status of Scoping Plan Recommended Measures. October 28. Accessed from the CARB website at http://www.arb.ca.gov/cc/inventory/ data/forecast.htm and http://www.arb.ca.gov/cc/scopingplan/status_of_scoping plan measures.pdf on May 4, 2012.
2010c Senate Bill 375 – Regional Targets. Obtained from the CARB website at
http://www.arb.ca.gov/cc/sb375/sb375.htm on October 29.
Greenhouse Gas Analysis for the Barrio Logan Community Plan Update
Page 90
2010d Workshops on Information Regarding the Off-Road, Truck and Bus, and Drayage Truck Regulations: August/September 2010 Workshop Series. Off-Road Rule Emissions Inventory. September 3. Obtained from the CARB website at http://www.arb.ca.gov/msprog/ordiesel/documents/emissions inventory presentation_full_10_09_03.pdf on August 3, 2012.
2011a Final Supplement to the AB 32 Scoping Plan Functional Equivalent Document.
August 19. Accessed from the CARB website at http://www.arb.ca.gov/cc/ scopingplan/document/final_supplement_to_sp_fed.pdf on May 9, 2012.
2011b California Emissions Estimator model (CalEEMod). User’s Guide Version
2011.1. Prepared for the South Coast Air Quality Management district by ENVIRON International Corporation. February.
California Department of Transportation (Caltrans) 2009 2008 California Motor Vehicle Stock, Travel and Fuel Forecast. Division of
Transportation System Information Program. June. California, State of 2006 Press Release - Gov. Schwarzenegger Signs Landmark Legislation to Reduce
Greenhouse Gas Emissions. Office of the Governor. September 27. Obtained from the Governor’s website at http://gov.ca.gov/index.php?/press-release/4111/ on May 24, 2007.
CalRecycle (California Department of Resources Recycling and Recovery) 2008 Statewide Waste Characterization Study. Contractors Report to the California
Integrated Waste Management Board. April. ICLEI Local Governments for Sustainability 2012 Sea Level Rise Adaptation Strategy for San Diego Bay. January 20. Kimley-Horn and Associates, Inc. 2011 Traffic Impact Analysis for the Barrio Logan Community Plan Update. March. Marten Law Group 2008 California Sues EPA over Vehicle Emissions Standards. Accessed May 19,
2008 at: http://www.martenlaw.com/news/?20080109-calif-sues-epa. Sacramento Bee 2007 California gets a win on emissions-cut law. By Dale Kasler, December 13.
Accessed May 19, 2008 at: http://www.shns.com/shns/g_index2.cfm? action=detail&pk=CAL-EMISSIONSCUT-12-13-07.

Greenhouse Gas Analysis for the Barrio Logan Community Plan Update
Page 91
San Diego Association of Governments (SANDAG) 2010 Greenhouse Gas Reduction Targets Set. News story accessed from the
SANDAG website at http://www.sandag.org/index.asp?newsid= 666&fuseaction=news.detail on October 29.
Union of Concerned Scientists (UCS) 2007 SB 1368 (Perata) Greenhouse Gas Emissions Performance Standard for
Major Power Plant Investments – A Fact Sheet of the Union of Concerned Scientists. Obtained from the UCS web site at http://www.ucsusa.org/assets/ documents/global_warming/SB-1368-Perata-fact-sheet.pdf on June 7, 2007.
United Nations Environment Programme (UNEP) 2007 Achievements in Stratospheric Ozone Protection, The Montreal Protocol on
Substances that Deplete the Ozone Layer, Progress Report 1987–2007. Obtained from the UNEP website at http://ozone.unep.org/ Publications/MP_Acheivements-E.pdf on May 23, 2007.
United Nations Framework Convention on Climate Change (UNFCCC) 2007a The United Nations Framework Convention on Climate Change. Obtained
from the UNFCCC website at http://unfccc.int/essential_background/ convention/items/2627.php on May 23, 2007.
2007b Kyoto Protocol. Obtained from the UNFCCC website at
http://unfccc.int/kyoto_protocol/items/2830.php on May 24, 2007. 2009 Status of Ratification. Obtained from the UNFCCC website at
http://unfccc.int/kyoto_protocol/background/status_of_ratification/items/2613.php on July 24, 2009.
U.S. Environmental Protection Agency (U.S. EPA) 2007a International Cooperation. Obtained from the EPA Climate Change website at
http://www.epa.gov/climatechange/policy/internationalcooperation.html on May 24, 2007.
2007b Ozone Depletion Rule and Regulations. Obtained from the EPA Ozone
Depletion website at http://www.epa.gov/ozone/title6/index.html on May 23, 2007.
2007c U.S. Climate Policy and Actions. Obtained from the EPA Climate Change
website at http://www.epa.gov/climatechange/policy/index.html on May 25, 2007.
Greenhouse Gas Analysis for the Barrio Logan Community Plan Update
Page 92
2010a Inventory of U.S. Greenhouse Gas Emissions and Sinks: 1990-2008. U.S. Greenhouse Gas Inventory Program, Office of Atmospheric Programs. 430-R-10-006. April 15.
2010b Amendments to the Montreal Protocol. Obtained from the EPA website at
http://www.epa.gov/ozone/intpol/history.html on December 28. 2010c Waste Reduction Model. Obtained from the EPA website at
http://www.epa.gov/climatechange/wycd/waste/calculators/Warm_home.html. University of San Diego 2008 Greenhouse Gas Inventory: An Analysis of Regional Emissions and Strategies
to Achieve AB 32 Targets. Prepared by the University of San Diego School of Law, Energy Policy Initiative Center (EPIC), and available online at http://www.sandiego.edu/epic/ghginventory/. September.

ATTACHMENTS

ATTACHMENT 1
GHG EMISSIONS
MODEL OUTPUTS

EXISTING CONDITIONS
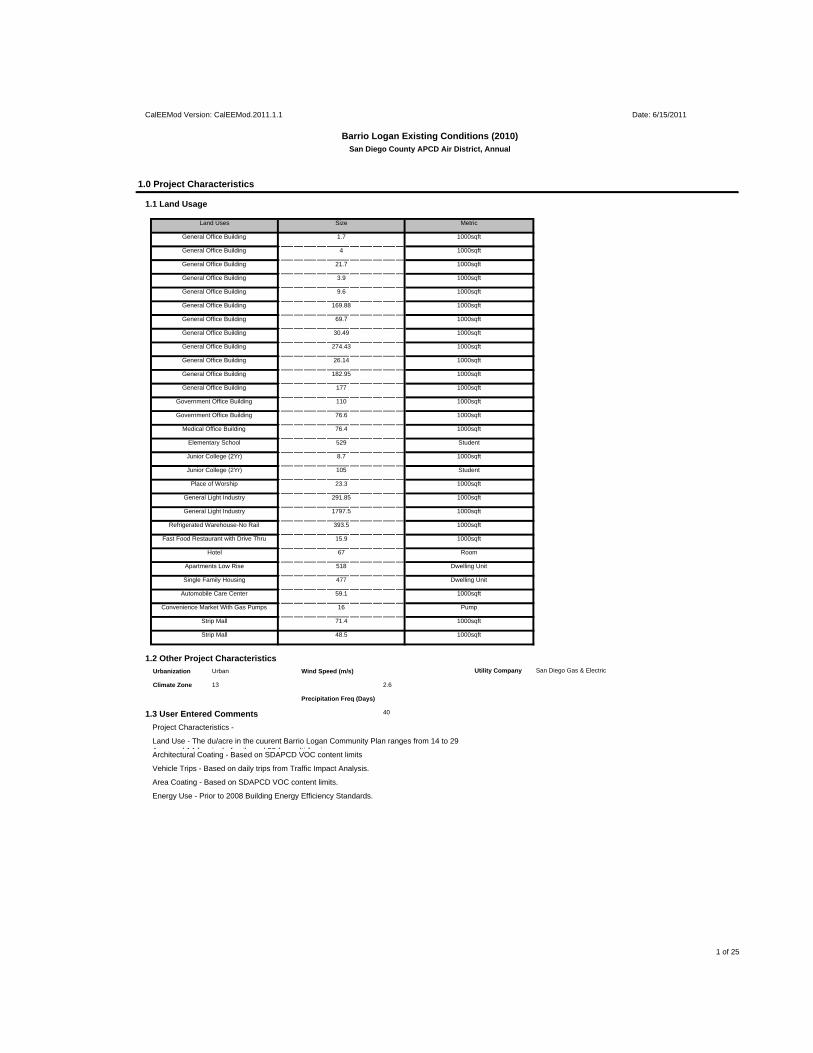
Architectural Coating - Based on SDAPCD VOC content limits
Vehicle Trips - Based on daily trips from Traffic Impact Analysis.
Area Coating - Based on SDAPCD VOC content limits.
Energy Use - Prior to 2008 Building Energy Efficiency Standards.
1.3 User Entered Comments 40
Project Characteristics -
Land Use - The du/acre in the cuurent Barrio Logan Community Plan ranges from 14 to 29Assumed 14 for single family and 29 for multi famiy
Climate Zone 13 2.6
Precipitation Freq (Days)
1.2 Other Project CharacteristicsUtility Company San Diego Gas & ElectricUrbanization Urban Wind Speed (m/s)
Strip Mall 71.4 1000sqft
Strip Mall 48.5 1000sqft
Automobile Care Center 59.1 1000sqft
Convenience Market With Gas Pumps 16 Pump
Apartments Low Rise 518 Dwelling Unit
Single Family Housing 477 Dwelling Unit
Fast Food Restaurant with Drive Thru 15.9 1000sqft
Hotel 67 Room
General Light Industry 1797.5 1000sqft
Refrigerated Warehouse-No Rail 393.5 1000sqft
Place of Worship 23.3 1000sqft
General Light Industry 291.85 1000sqft
Junior College (2Yr) 8.7 1000sqft
Junior College (2Yr) 105 Student
Medical Office Building 76.4 1000sqft
Elementary School 529 Student
Government Office Building 110 1000sqft
Government Office Building 76.6 1000sqft
General Office Building 182.95 1000sqft
General Office Building 177 1000sqft
General Office Building 274.43 1000sqft
General Office Building 26.14 1000sqft
General Office Building 69.7 1000sqft
General Office Building 30.49 1000sqft
General Office Building 9.6 1000sqft
General Office Building 169.88 1000sqft
General Office Building 21.7 1000sqft
General Office Building 3.9 1000sqft
General Office Building 1.7 1000sqft
General Office Building 4 1000sqft
1.0 Project Characteristics
1.1 Land Usage
Land Uses Size Metric
CalEEMod Version: CalEEMod.2011.1.1 Date: 6/15/2011
Barrio Logan Existing Conditions (2010)San Diego County APCD Air District, Annual
1 of 25

65,027.0164,971.670.75 7.37 9.71 17.05 64,971.67 2.63 0.003.15 9.21 12.40 0.00Total 104.63 220.35 288.26
412.38 0.02 0.00 412.780.04 0.05 0.00 412.38
1,743.78
2026 69.11 0.55 1.95 0.01 0.02 0.05 0.07 0.01
1,742.53 1,742.53 0.06 0.000.02 0.23 0.25 0.000.02 0.06 0.24 0.302025 0.82 4.87 6.80
5,031.18 0.14 0.00 5,034.190.48 0.55 0.00 5,031.18
5,022.49
2024 2.03 11.94 17.29 0.06 0.21 0.52 0.72 0.07
5,019.39 5,019.39 0.15 0.000.07 0.49 0.57 0.000.06 0.21 0.53 0.732023 2.09 12.30 17.85
5,049.02 0.15 0.00 5,052.270.51 0.59 0.00 5,049.02
5,104.35
2022 2.18 12.82 18.61 0.06 0.21 0.55 0.76 0.07
5,100.91 5,100.91 0.16 0.000.07 0.54 0.61 0.000.06 0.21 0.58 0.792021 2.28 13.48 19.52
5,135.98 0.17 0.00 5,139.600.57 0.64 0.00 5,135.98
5,158.87
2020 2.40 14.25 20.40 0.06 0.21 0.61 0.82 0.07
5,155.03 5,155.03 0.18 0.000.07 0.61 0.68 0.000.06 0.21 0.64 0.852019 2.52 15.03 21.35
5,197.01 0.20 0.00 5,201.110.65 0.72 0.00 5,197.01
5,227.74
2018 2.68 16.00 22.60 0.06 0.21 0.69 0.89 0.07
5,223.36 5,223.36 0.21 0.000.07 0.69 0.76 0.000.06 0.21 0.73 0.942017 2.85 17.06 23.98
5,293.14 0.23 0.00 5,297.890.75 0.82 0.00 5,293.14
5,351.92
2016 3.06 18.37 25.73 0.06 0.21 0.79 1.00 0.07
5,346.81 5,346.81 0.24 0.000.07 0.80 0.88 0.000.06 0.21 0.85 1.062015 3.28 19.79 27.55
5,398.46 0.26 0.00 5,403.980.87 0.94 0.00 5,398.46
3,722.90
2014 3.54 21.41 29.63 0.06 0.21 0.92 1.13 0.07
3,718.31 3,718.31 0.22 0.000.60 0.80 1.40 0.000.04 1.47 0.83 2.302013 2.88 18.79 21.57
1,230.38 0.13 0.00 1,233.090.63 1.79 0.00 1,230.38
920.05
2012 1.58 13.00 7.16 0.01 2.43 0.63 3.06 1.15
917.78 917.78 0.11 0.000.60 0.55 1.15 0.000.01 1.08 0.55 1.632011 1.33 10.69 6.27
Year tons/yr MT/yr
Bio- CO2 NBio- CO2 Total CO2 CH4PM10 Total PM2.5 Total
65,027.01
Mitigated Construction
ROG NOx CO N2O CO2eSO2 Fugitive PM10
Exhaust PM10
64,971.670.75 52.71 9.71 62.41
Fugitive PM2.5
Exhaust PM2.5
64,971.67 2.63 0.003.15 9.21 12.40 0.00Total 104.63 220.35 288.26
412.38 0.02 0.00 412.780.04 0.05 0.00 412.38
1,743.78
2026 69.11 0.55 1.95 0.01 0.53 0.05 0.58 0.01
1,742.53 1,742.53 0.06 0.000.02 0.23 0.25 0.000.02 1.20 0.24 1.442025 0.82 4.87 6.80
5,031.18 0.14 0.00 5,034.190.48 0.55 0.00 5,031.18
5,022.49
2024 2.03 11.94 17.29 0.06 3.99 0.52 4.51 0.07
5,019.39 5,019.39 0.15 0.000.07 0.49 0.57 0.000.06 3.96 0.53 4.492023 2.09 12.30 17.85
5,049.02 0.15 0.00 5,052.270.51 0.59 0.00 5,049.02
5,104.35
2022 2.18 12.82 18.61 0.06 3.96 0.55 4.51 0.07
5,100.91 5,100.91 0.16 0.000.07 0.54 0.61 0.000.06 3.98 0.58 4.562021 2.28 13.48 19.52
5,135.98 0.17 0.00 5,139.600.57 0.64 0.00 5,135.98
5,158.87
2020 2.40 14.25 20.40 0.06 3.99 0.61 4.60 0.07
5,155.03 5,155.03 0.18 0.000.07 0.61 0.68 0.000.06 3.98 0.64 4.622019 2.52 15.03 21.35
5,197.01 0.20 0.00 5,201.110.65 0.72 0.00 5,197.01
5,227.74
2018 2.68 16.00 22.60 0.06 3.98 0.69 4.66 0.07
5,223.36 5,223.36 0.21 0.000.07 0.69 0.76 0.000.06 3.96 0.73 4.692017 2.85 17.06 23.98
5,293.14 0.23 0.00 5,297.890.75 0.82 0.00 5,293.14
5,351.92
2016 3.06 18.37 25.73 0.06 3.98 0.79 4.77 0.07
5,346.81 5,346.81 0.24 0.000.07 0.80 0.88 0.000.06 3.98 0.85 4.832015 3.28 19.79 27.55
5,398.46 0.26 0.00 5,403.980.87 0.94 0.00 5,398.46
3,722.90
2014 3.54 21.41 29.63 0.06 3.98 0.92 4.90 0.07
3,718.31 3,718.31 0.22 0.000.60 0.80 1.40 0.000.04 3.67 0.83 4.502013 2.88 18.79 21.57
1,230.38 0.13 0.00 1,233.090.63 1.79 0.00 1,230.38
920.05
2012 1.58 13.00 7.16 0.01 2.46 0.63 3.09 1.15
917.78 917.78 0.11 0.000.60 0.55 1.15 0.000.01 1.11 0.55 1.662011 1.33 10.69 6.27
CO2e
Year tons/yr MT/yr
NBio- CO2 Total CO2 CH4 N2OFugitive PM2.5
Exhaust PM2.5
PM2.5 Total
Bio- CO2SO2 Fugitive PM10
Exhaust PM10
PM10 TotalROG NOx CO
2.0 Emissions Summary
2.1 Overall Construction
Unmitigated Construction
2 of 25
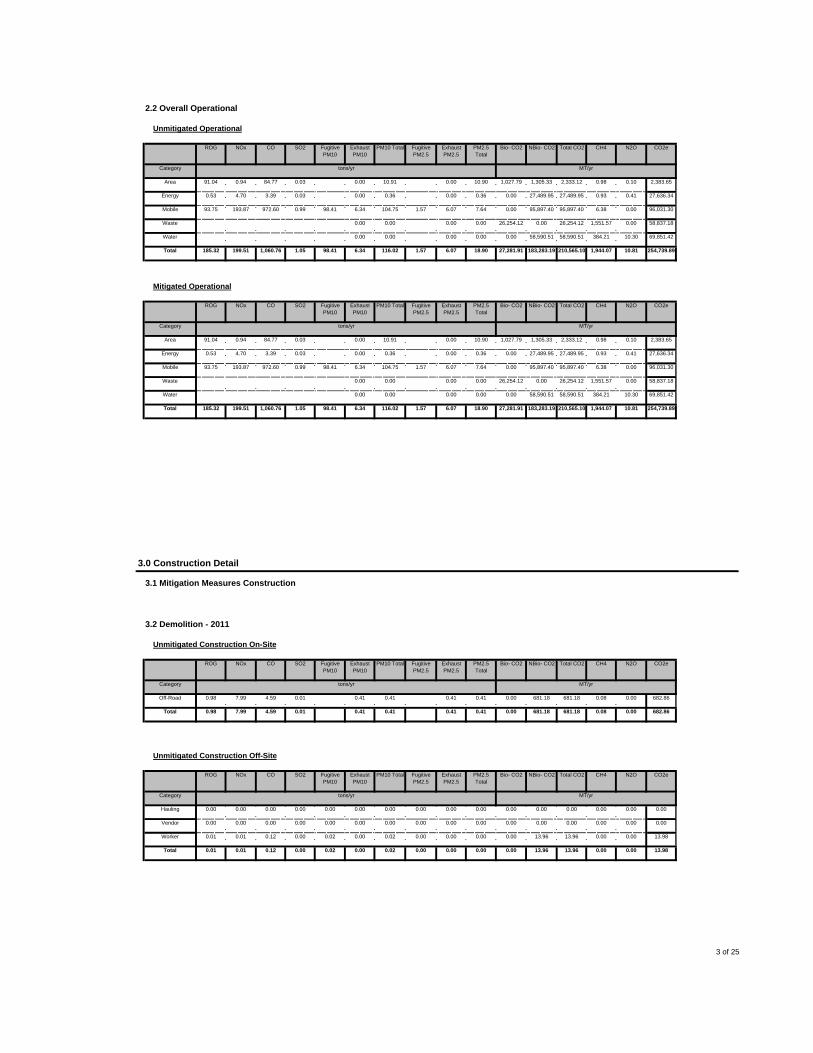
13.96 0.00 0.00 13.980.00 0.00 0.00 13.96
13.98
Total 0.01 0.01 0.12 0.00 0.02 0.00 0.02 0.00
13.96 13.96 0.00 0.000.00 0.00 0.00 0.000.00 0.02 0.00 0.02Worker 0.01 0.01 0.12
0.00 0.00 0.00 0.000.00 0.00 0.00 0.00
0.00
Vendor 0.00 0.00 0.00 0.00 0.00 0.00 0.00 0.00
0.00 0.00 0.00 0.000.00 0.00 0.00 0.000.00 0.00 0.00 0.00Hauling 0.00 0.00 0.00
CO2e
Category tons/yr MT/yr
NBio- CO2 Total CO2 CH4 N2OFugitive PM2.5
Exhaust PM2.5
NOx CO SO2 Fugitive PM10
Exhaust PM10
PM10 Total
681.18 0.08
PM2.5 Total
Bio- CO2
Unmitigated Construction Off-Site
ROG
0.00 682.860.41 0.41 0.00 681.18
682.86
Total 0.98 7.99 4.59 0.01 0.41 0.41
681.18 681.18 0.08 0.000.41 0.41 0.000.01 0.41 0.41Off-Road 0.98 7.99 4.59
Category tons/yr MT/yr
Bio- CO2 NBio- CO2 Total CO2 CH4PM10 Total
3.2 Demolition - 2011
Unmitigated Construction On-Site
ROG NOx CO N2O CO2eSO2 Fugitive PM10
Exhaust PM10
3.0 Construction Detail
3.1 Mitigation Measures Construction
Fugitive PM2.5
Exhaust PM2.5
PM2.5 Total
210,565.10 1,944.07 10.81 254,739.896.07 18.90 27,281.91 183,283.19
69,851.42
Total 185.32 199.51 1,060.76 1.05 98.41 6.34 116.02 1.57
58,590.51 58,590.51 384.21 10.300.00 0.00 0.000.00 0.00Water
26,254.12 1,551.57 0.00 58,837.180.00 0.00 26,254.12 0.00
96,031.30
Waste 0.00 0.00
95,897.40 95,897.40 6.38 0.001.57 6.07 7.64 0.000.99 98.41 6.34 104.75Mobile 93.75 193.87 972.60
27,489.95 0.93 0.41 27,636.340.00 0.36 0.00 27,489.95
2,383.65
Energy 0.53 4.70 3.39 0.03 0.00 0.36
1,305.33 2,333.12 0.98 0.100.00 10.90 1,027.790.03 0.00 10.91Area 91.04 0.94 84.77
CO2e
Category tons/yr MT/yr
NBio- CO2 Total CO2 CH4 N2OFugitive PM2.5
Exhaust PM2.5
NOx CO SO2 Fugitive PM10
Exhaust PM10
PM10 Total
210,565.10 1,944.07
PM2.5 Total
Bio- CO2
Mitigated Operational
ROG
10.81 254,739.896.07 18.90 27,281.91 183,283.19
69,851.42
Total 185.32 199.51 1,060.76 1.05 98.41 6.34 116.02 1.57
58,590.51 58,590.51 384.21 10.300.00 0.00 0.000.00 0.00Water
26,254.12 1,551.57 0.00 58,837.180.00 0.00 26,254.12 0.00
96,031.30
Waste 0.00 0.00
95,897.40 95,897.40 6.38 0.001.57 6.07 7.64 0.000.99 98.41 6.34 104.75Mobile 93.75 193.87 972.60
27,489.95 0.93 0.41 27,636.340.00 0.36 0.00 27,489.95
2,383.65
Energy 0.53 4.70 3.39 0.03 0.00 0.36
1,305.33 2,333.12 0.98 0.100.00 10.90 1,027.790.03 0.00 10.91Area 91.04 0.94 84.77
Category tons/yr MT/yr
Bio- CO2 NBio- CO2 Total CO2 CH4PM10 Total PM2.5 Total
2.2 Overall Operational
Unmitigated Operational
ROG NOx CO N2O CO2eSO2 Fugitive PM10
Exhaust PM10
Fugitive PM2.5
Exhaust PM2.5
3 of 25
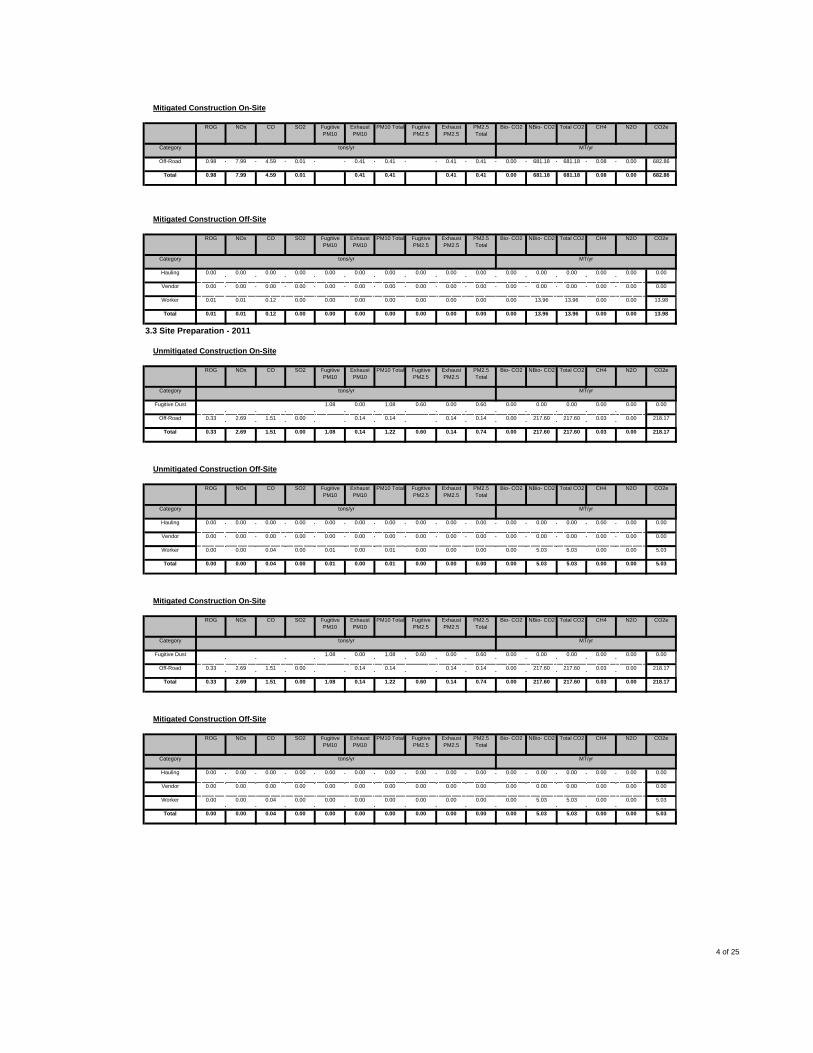
5.03 0.00 0.00 5.030.00 0.00 0.00 5.03
5.03
Total 0.00 0.00 0.04 0.00 0.00 0.00 0.00 0.00
5.03 5.03 0.00 0.000.00 0.00 0.00 0.000.00 0.00 0.00 0.00Worker 0.00 0.00 0.04
0.00 0.00 0.00 0.000.00 0.00 0.00 0.00
0.00
Vendor 0.00 0.00 0.00 0.00 0.00 0.00 0.00 0.00
0.00 0.00 0.00 0.000.00 0.00 0.00 0.000.00 0.00 0.00 0.00Hauling 0.00 0.00 0.00
Category tons/yr MT/yr
Bio- CO2 NBio- CO2 Total CO2 CH4PM10 Total PM2.5 Total
218.17
Mitigated Construction Off-Site
ROG NOx CO N2O CO2eSO2 Fugitive PM10
Exhaust PM10
217.600.00 1.08 0.14 1.22
Fugitive PM2.5
Exhaust PM2.5
217.60 0.03 0.000.60 0.14 0.74 0.00Total 0.33 2.69 1.51
217.60 0.03 0.00 218.170.14 0.14 0.00 217.60
0.00
Off-Road 0.33 2.69 1.51 0.00 0.14 0.14
0.00 0.00 0.00 0.000.60 0.00 0.60 0.001.08 0.00 1.08Fugitive Dust
CO2e
Category tons/yr MT/yr
NBio- CO2 Total CO2 CH4 N2OFugitive PM2.5
Exhaust PM2.5
NOx CO SO2 Fugitive PM10
Exhaust PM10
PM10 Total
5.03 0.00
PM2.5 Total
Bio- CO2
Mitigated Construction On-Site
ROG
0.00 5.030.00 0.00 0.00 5.03
5.03
Total 0.00 0.00 0.04 0.00 0.01 0.00 0.01 0.00
5.03 5.03 0.00 0.000.00 0.00 0.00 0.000.00 0.01 0.00 0.01Worker 0.00 0.00 0.04
0.00 0.00 0.00 0.000.00 0.00 0.00 0.00
0.00
Vendor 0.00 0.00 0.00 0.00 0.00 0.00 0.00 0.00
0.00 0.00 0.00 0.000.00 0.00 0.00 0.000.00 0.00 0.00 0.00Hauling 0.00 0.00 0.00
Category tons/yr MT/yr
Bio- CO2 NBio- CO2 Total CO2 CH4PM10 Total PM2.5 Total
218.17
Unmitigated Construction Off-Site
ROG NOx CO N2O CO2eSO2 Fugitive PM10
Exhaust PM10
217.600.00 1.08 0.14 1.22
Fugitive PM2.5
Exhaust PM2.5
217.60 0.03 0.000.60 0.14 0.74 0.00Total 0.33 2.69 1.51
217.60 0.03 0.00 218.170.14 0.14 0.00 217.60
0.00
Off-Road 0.33 2.69 1.51 0.00 0.14 0.14
0.00 0.00 0.00 0.000.60 0.00 0.60 0.001.08 0.00 1.08Fugitive Dust
CO2e
Category tons/yr MT/yr
NBio- CO2 Total CO2 CH4 N2OFugitive PM2.5
Exhaust PM2.5
NOx CO SO2 Fugitive PM10
Exhaust PM10
PM10 Total
13.96 0.00
PM2.5 Total
Bio- CO2
3.3 Site Preparation - 2011
Unmitigated Construction On-Site
ROG
0.00 13.980.00 0.00 0.00 13.96
13.98
Total 0.01 0.01 0.12 0.00 0.00 0.00 0.00 0.00
13.96 13.96 0.00 0.000.00 0.00 0.00 0.000.00 0.00 0.00 0.00Worker 0.01 0.01 0.12
0.00 0.00 0.00 0.000.00 0.00 0.00 0.00
0.00
Vendor 0.00 0.00 0.00 0.00 0.00 0.00 0.00 0.00
0.00 0.00 0.00 0.000.00 0.00 0.00 0.000.00 0.00 0.00 0.00Hauling 0.00 0.00 0.00
CO2e
Category tons/yr MT/yr
NBio- CO2 Total CO2 CH4 N2OFugitive PM2.5
Exhaust PM2.5
NOx CO SO2 Fugitive PM10
Exhaust PM10
PM10 Total
681.18 0.08
PM2.5 Total
Bio- CO2
Mitigated Construction Off-Site
ROG
0.00 682.860.41 0.41 0.00 681.18
682.86
Total 0.98 7.99 4.59 0.01 0.41 0.41
681.18 681.18 0.08 0.000.41 0.41 0.000.01 0.41 0.41Off-Road 0.98 7.99 4.59
CO2e
Category tons/yr MT/yr
NBio- CO2 Total CO2 CH4 N2OFugitive PM2.5
Exhaust PM2.5
NOx CO SO2 Fugitive PM10
Exhaust PM10
PM10 Total PM2.5 Total
Bio- CO2
Mitigated Construction On-Site
ROG
4 of 25

18.31 0.00 0.00 18.330.00 0.00 0.00 18.31
18.33
Total 0.01 0.01 0.14 0.00 0.02 0.00 0.02 0.00
18.31 18.31 0.00 0.000.00 0.00 0.00 0.000.00 0.02 0.00 0.02Worker 0.01 0.01 0.14
0.00 0.00 0.00 0.000.00 0.00 0.00 0.00
0.00
Vendor 0.00 0.00 0.00 0.00 0.00 0.00 0.00 0.00
0.00 0.00 0.00 0.000.00 0.00 0.00 0.000.00 0.00 0.00 0.00Hauling 0.00 0.00 0.00
Category tons/yr MT/yr
Bio- CO2 NBio- CO2 Total CO2 CH4PM10 Total PM2.5 Total
991.70
Unmitigated Construction Off-Site
ROG NOx CO N2O CO2eSO2 Fugitive PM10
Exhaust PM10
989.550.01 1.34 0.50 1.84
Fugitive PM2.5
Exhaust PM2.5
989.55 0.10 0.000.56 0.50 1.06 0.00Total 1.26 10.44 5.54
989.55 0.10 0.00 991.700.50 0.50 0.00 989.55
0.00
Off-Road 1.26 10.44 5.54 0.01 0.50 0.50
0.00 0.00 0.00 0.000.56 0.00 0.56 0.001.34 0.00 1.34Fugitive Dust
CO2e
Category tons/yr MT/yr
NBio- CO2 Total CO2 CH4 N2OFugitive PM2.5
Exhaust PM2.5
NOx CO SO2 Fugitive PM10
Exhaust PM10
PM10 Total
4.92 0.00
PM2.5 Total
Bio- CO2
3.4 Grading - 2012
Unmitigated Construction On-Site
ROG
0.00 4.930.00 0.00 0.00 4.92
4.93
Total 0.00 0.00 0.04 0.00 0.00 0.00 0.00 0.00
4.92 4.92 0.00 0.000.00 0.00 0.00 0.000.00 0.00 0.00 0.00Worker 0.00 0.00 0.04
0.00 0.00 0.00 0.000.00 0.00 0.00 0.00
0.00
Vendor 0.00 0.00 0.00 0.00 0.00 0.00 0.00 0.00
0.00 0.00 0.00 0.000.00 0.00 0.00 0.000.00 0.00 0.00 0.00Hauling 0.00 0.00 0.00
Category tons/yr MT/yr
Bio- CO2 NBio- CO2 Total CO2 CH4PM10 Total PM2.5 Total
218.14
Mitigated Construction Off-Site
ROG NOx CO N2O CO2eSO2 Fugitive PM10
Exhaust PM10
217.600.00 1.08 0.13 1.21
Fugitive PM2.5
Exhaust PM2.5
217.60 0.03 0.000.60 0.13 0.73 0.00Total 0.31 2.54 1.43
217.60 0.03 0.00 218.140.13 0.13 0.00 217.60
0.00
Off-Road 0.31 2.54 1.43 0.00 0.13 0.13
0.00 0.00 0.00 0.000.60 0.00 0.60 0.001.08 0.00 1.08Fugitive Dust
CO2e
Category tons/yr MT/yr
NBio- CO2 Total CO2 CH4 N2OFugitive PM2.5
Exhaust PM2.5
NOx CO SO2 Fugitive PM10
Exhaust PM10
PM10 Total
4.92 0.00
PM2.5 Total
Bio- CO2
Mitigated Construction On-Site
ROG
0.00 4.930.00 0.00 0.00 4.92
4.93
Total 0.00 0.00 0.04 0.00 0.01 0.00 0.01 0.00
4.92 4.92 0.00 0.000.00 0.00 0.00 0.000.00 0.01 0.00 0.01Worker 0.00 0.00 0.04
0.00 0.00 0.00 0.000.00 0.00 0.00 0.00
0.00
Vendor 0.00 0.00 0.00 0.00 0.00 0.00 0.00 0.00
0.00 0.00 0.00 0.000.00 0.00 0.00 0.000.00 0.00 0.00 0.00Hauling 0.00 0.00 0.00
Category tons/yr MT/yr
Bio- CO2 NBio- CO2 Total CO2 CH4PM10 Total PM2.5 Total
218.14
Unmitigated Construction Off-Site
ROG NOx CO N2O CO2eSO2 Fugitive PM10
Exhaust PM10
217.600.00 1.08 0.13 1.21
Fugitive PM2.5
Exhaust PM2.5
217.60 0.03 0.000.60 0.13 0.73 0.00Total 0.31 2.54 1.43
217.60 0.03 0.00 218.140.13 0.13 0.00 217.60
0.00
Off-Road 0.31 2.54 1.43 0.00 0.13 0.13
0.00 0.00 0.00 0.000.60 0.00 0.60 0.001.08 0.00 1.08Fugitive Dust
CO2e
Category tons/yr MT/yr
NBio- CO2 Total CO2 CH4 N2OFugitive PM2.5
Exhaust PM2.5
NOx CO SO2 Fugitive PM10
Exhaust PM10
PM10 Total PM2.5 Total
Bio- CO2
3.3 Site Preparation - 2012
Unmitigated Construction On-Site
ROG
5 of 25
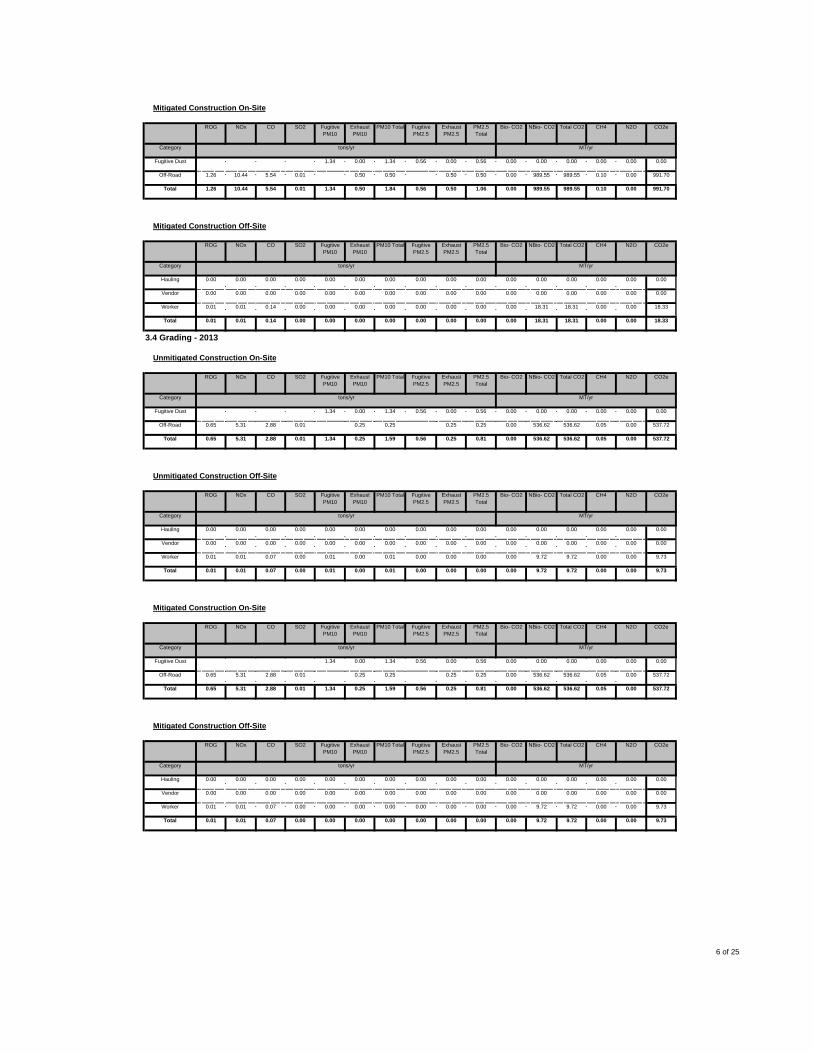
9.72 0.00 0.00 9.730.00 0.00 0.00 9.72
9.73
Total 0.01 0.01 0.07 0.00 0.00 0.00 0.00 0.00
9.72 9.72 0.00 0.000.00 0.00 0.00 0.000.00 0.00 0.00 0.00Worker 0.01 0.01 0.07
0.00 0.00 0.00 0.000.00 0.00 0.00 0.00
0.00
Vendor 0.00 0.00 0.00 0.00 0.00 0.00 0.00 0.00
0.00 0.00 0.00 0.000.00 0.00 0.00 0.000.00 0.00 0.00 0.00Hauling 0.00 0.00 0.00
Category tons/yr MT/yr
Bio- CO2 NBio- CO2 Total CO2 CH4PM10 Total PM2.5 Total
537.72
Mitigated Construction Off-Site
ROG NOx CO N2O CO2eSO2 Fugitive PM10
Exhaust PM10
536.620.01 1.34 0.25 1.59
Fugitive PM2.5
Exhaust PM2.5
536.62 0.05 0.000.56 0.25 0.81 0.00Total 0.65 5.31 2.88
536.62 0.05 0.00 537.720.25 0.25 0.00 536.62
0.00
Off-Road 0.65 5.31 2.88 0.01 0.25 0.25
0.00 0.00 0.00 0.000.56 0.00 0.56 0.001.34 0.00 1.34Fugitive Dust
CO2e
Category tons/yr MT/yr
NBio- CO2 Total CO2 CH4 N2OFugitive PM2.5
Exhaust PM2.5
NOx CO SO2 Fugitive PM10
Exhaust PM10
PM10 Total
9.72 0.00
PM2.5 Total
Bio- CO2
Mitigated Construction On-Site
ROG
0.00 9.730.00 0.00 0.00 9.72
9.73
Total 0.01 0.01 0.07 0.00 0.01 0.00 0.01 0.00
9.72 9.72 0.00 0.000.00 0.00 0.00 0.000.00 0.01 0.00 0.01Worker 0.01 0.01 0.07
0.00 0.00 0.00 0.000.00 0.00 0.00 0.00
0.00
Vendor 0.00 0.00 0.00 0.00 0.00 0.00 0.00 0.00
0.00 0.00 0.00 0.000.00 0.00 0.00 0.000.00 0.00 0.00 0.00Hauling 0.00 0.00 0.00
Category tons/yr MT/yr
Bio- CO2 NBio- CO2 Total CO2 CH4PM10 Total PM2.5 Total
537.72
Unmitigated Construction Off-Site
ROG NOx CO N2O CO2eSO2 Fugitive PM10
Exhaust PM10
536.620.01 1.34 0.25 1.59
Fugitive PM2.5
Exhaust PM2.5
536.62 0.05 0.000.56 0.25 0.81 0.00Total 0.65 5.31 2.88
536.62 0.05 0.00 537.720.25 0.25 0.00 536.62
0.00
Off-Road 0.65 5.31 2.88 0.01 0.25 0.25
0.00 0.00 0.00 0.000.56 0.00 0.56 0.001.34 0.00 1.34Fugitive Dust
CO2e
Category tons/yr MT/yr
NBio- CO2 Total CO2 CH4 N2OFugitive PM2.5
Exhaust PM2.5
NOx CO SO2 Fugitive PM10
Exhaust PM10
PM10 Total
18.31 0.00
PM2.5 Total
Bio- CO2
3.4 Grading - 2013
Unmitigated Construction On-Site
ROG
0.00 18.330.00 0.00 0.00 18.31
18.33
Total 0.01 0.01 0.14 0.00 0.00 0.00 0.00 0.00
18.31 18.31 0.00 0.000.00 0.00 0.00 0.000.00 0.00 0.00 0.00Worker 0.01 0.01 0.14
0.00 0.00 0.00 0.000.00 0.00 0.00 0.00
0.00
Vendor 0.00 0.00 0.00 0.00 0.00 0.00 0.00 0.00
0.00 0.00 0.00 0.000.00 0.00 0.00 0.000.00 0.00 0.00 0.00Hauling 0.00 0.00 0.00
Category tons/yr MT/yr
Bio- CO2 NBio- CO2 Total CO2 CH4PM10 Total PM2.5 Total
991.70
Mitigated Construction Off-Site
ROG NOx CO N2O CO2eSO2 Fugitive PM10
Exhaust PM10
989.550.01 1.34 0.50 1.84
Fugitive PM2.5
Exhaust PM2.5
989.55 0.10 0.000.56 0.50 1.06 0.00Total 1.26 10.44 5.54
989.55 0.10 0.00 991.700.50 0.50 0.00 989.55
0.00
Off-Road 1.26 10.44 5.54 0.01 0.50 0.50
0.00 0.00 0.00 0.000.56 0.00 0.56 0.001.34 0.00 1.34Fugitive Dust
CO2e
Category tons/yr MT/yr
NBio- CO2 Total CO2 CH4 N2OFugitive PM2.5
Exhaust PM2.5
NOx CO SO2 Fugitive PM10
Exhaust PM10
PM10 Total PM2.5 Total
Bio- CO2
Mitigated Construction On-Site
ROG
6 of 25

4,920.23 0.21 0.00 4,924.700.61 0.68 0.00 4,920.23
2,420.15
Total 2.92 17.22 26.61 0.06 3.98 0.66 4.63 0.07
2,417.01 2,417.01 0.15 0.000.05 0.12 0.17 0.000.03 3.16 0.13 3.28Worker 1.51 1.69 16.63
2,503.22 0.06 0.00 2,504.550.49 0.51 0.00 2,503.22
0.00
Vendor 1.41 15.53 9.98 0.03 0.82 0.53 1.35 0.02
0.00 0.00 0.00 0.000.00 0.00 0.00 0.000.00 0.00 0.00 0.00Hauling 0.00 0.00 0.00
CO2e
Category tons/yr MT/yr
NBio- CO2 Total CO2 CH4 N2OFugitive PM2.5
Exhaust PM2.5
NOx CO SO2 Fugitive PM10
Exhaust PM10
PM10 Total
478.23 0.05
PM2.5 Total
Bio- CO2
Unmitigated Construction Off-Site
ROG
0.00 479.280.26 0.26 0.00 478.23
479.28
Total 0.62 4.18 3.03 0.01 0.26 0.26
478.23 478.23 0.05 0.000.26 0.26 0.000.01 0.26 0.26Off-Road 0.62 4.18 3.03
CO2e
Category tons/yr MT/yr
NBio- CO2 Total CO2 CH4 N2OFugitive PM2.5
Exhaust PM2.5
NOx CO SO2 Fugitive PM10
Exhaust PM10
PM10 Total
2,893.46 0.13
PM2.5 Total
Bio- CO2
3.5 Building Construction - 2014
Unmitigated Construction On-Site
ROG
0.00 2,896.270.38 0.42 0.00 2,893.46
1,439.90
Total 1.84 10.84 16.84 0.04 0.12 0.40 0.53 0.04
1,437.93 1,437.93 0.09 0.000.03 0.07 0.10 0.000.02 0.08 0.07 0.15Worker 0.95 1.08 10.56
1,455.53 0.04 0.00 1,456.370.31 0.32 0.00 1,455.53
0.00
Vendor 0.89 9.76 6.28 0.02 0.04 0.33 0.38 0.01
0.00 0.00 0.00 0.000.00 0.00 0.00 0.000.00 0.00 0.00 0.00Hauling 0.00 0.00 0.00
CO2e
Category tons/yr MT/yr
NBio- CO2 Total CO2 CH4 N2OFugitive PM2.5
Exhaust PM2.5
NOx CO SO2 Fugitive PM10
Exhaust PM10
PM10 Total
278.51 0.03
PM2.5 Total
Bio- CO2
Mitigated Construction Off-Site
ROG
0.00 279.180.17 0.17 0.00 278.51
279.18
Total 0.39 2.63 1.78 0.00 0.17 0.17
278.51 278.51 0.03 0.000.17 0.17 0.000.00 0.17 0.17Off-Road 0.39 2.63 1.78
CO2e
Category tons/yr MT/yr
NBio- CO2 Total CO2 CH4 N2OFugitive PM2.5
Exhaust PM2.5
NOx CO SO2 Fugitive PM10
Exhaust PM10
PM10 Total
2,893.46 0.13
PM2.5 Total
Bio- CO2
Mitigated Construction On-Site
ROG
0.00 2,896.270.38 0.42 0.00 2,893.46
1,439.90
Total 1.84 10.84 16.84 0.04 2.32 0.40 2.72 0.04
1,437.93 1,437.93 0.09 0.000.03 0.07 0.10 0.000.02 1.84 0.07 1.91Worker 0.95 1.08 10.56
1,455.53 0.04 0.00 1,456.370.31 0.32 0.00 1,455.53
0.00
Vendor 0.89 9.76 6.28 0.02 0.48 0.33 0.81 0.01
0.00 0.00 0.00 0.000.00 0.00 0.00 0.000.00 0.00 0.00 0.00Hauling 0.00 0.00 0.00
CO2e
Category tons/yr MT/yr
NBio- CO2 Total CO2 CH4 N2OFugitive PM2.5
Exhaust PM2.5
NOx CO SO2 Fugitive PM10
Exhaust PM10
PM10 Total
278.51 0.03
PM2.5 Total
Bio- CO2
Unmitigated Construction Off-Site
ROG
0.00 279.180.17 0.17 0.00 278.51
279.18
Total 0.39 2.63 1.78 0.00 0.17 0.17
278.51 278.51 0.03 0.000.17 0.17 0.000.00 0.17 0.17Off-Road 0.39 2.63 1.78
CO2e
Category tons/yr MT/yr
NBio- CO2 Total CO2 CH4 N2OFugitive PM2.5
Exhaust PM2.5
NOx CO SO2 Fugitive PM10
Exhaust PM10
PM10 Total PM2.5 Total
Bio- CO2
3.5 Building Construction - 2013
Unmitigated Construction On-Site
ROG
7 of 25
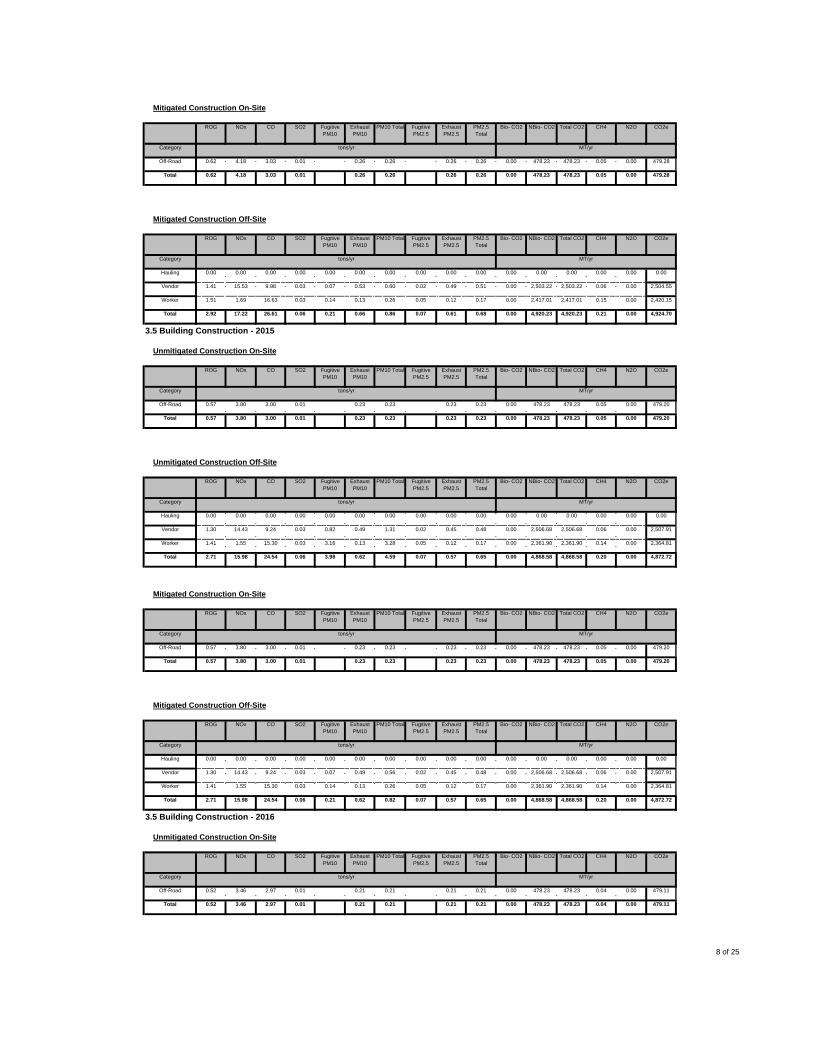
478.23 0.04 0.00 479.110.21 0.21 0.00 478.23
479.11
Total 0.52 3.46 2.97 0.01 0.21 0.21
478.23 478.23 0.04 0.000.21 0.21 0.000.01 0.21 0.21Off-Road 0.52 3.46 2.97
CO2e
Category tons/yr MT/yr
NBio- CO2 Total CO2 CH4 N2OFugitive PM2.5
Exhaust PM2.5
NOx CO SO2 Fugitive PM10
Exhaust PM10
PM10 Total
4,868.58 0.20
PM2.5 Total
Bio- CO2
3.5 Building Construction - 2016
Unmitigated Construction On-Site
ROG
0.00 4,872.720.57 0.65 0.00 4,868.58
2,364.81
Total 2.71 15.98 24.54 0.06 0.21 0.62 0.82 0.07
2,361.90 2,361.90 0.14 0.000.05 0.12 0.17 0.000.03 0.14 0.13 0.26Worker 1.41 1.55 15.30
2,506.68 0.06 0.00 2,507.910.45 0.48 0.00 2,506.68
0.00
Vendor 1.30 14.43 9.24 0.03 0.07 0.49 0.56 0.02
0.00 0.00 0.00 0.000.00 0.00 0.00 0.000.00 0.00 0.00 0.00Hauling 0.00 0.00 0.00
CO2e
Category tons/yr MT/yr
NBio- CO2 Total CO2 CH4 N2OFugitive PM2.5
Exhaust PM2.5
NOx CO SO2 Fugitive PM10
Exhaust PM10
PM10 Total
478.23 0.05
PM2.5 Total
Bio- CO2
Mitigated Construction Off-Site
ROG
0.00 479.200.23 0.23 0.00 478.23
479.20
Total 0.57 3.80 3.00 0.01 0.23 0.23
478.23 478.23 0.05 0.000.23 0.23 0.000.01 0.23 0.23Off-Road 0.57 3.80 3.00
CO2e
Category tons/yr MT/yr
NBio- CO2 Total CO2 CH4 N2OFugitive PM2.5
Exhaust PM2.5
NOx CO SO2 Fugitive PM10
Exhaust PM10
PM10 Total
4,868.58 0.20
PM2.5 Total
Bio- CO2
Mitigated Construction On-Site
ROG
0.00 4,872.720.57 0.65 0.00 4,868.58
2,364.81
Total 2.71 15.98 24.54 0.06 3.98 0.62 4.59 0.07
2,361.90 2,361.90 0.14 0.000.05 0.12 0.17 0.000.03 3.16 0.13 3.28Worker 1.41 1.55 15.30
2,506.68 0.06 0.00 2,507.910.45 0.48 0.00 2,506.68
0.00
Vendor 1.30 14.43 9.24 0.03 0.82 0.49 1.31 0.02
0.00 0.00 0.00 0.000.00 0.00 0.00 0.000.00 0.00 0.00 0.00Hauling 0.00 0.00 0.00
CO2e
Category tons/yr MT/yr
NBio- CO2 Total CO2 CH4 N2OFugitive PM2.5
Exhaust PM2.5
NOx CO SO2 Fugitive PM10
Exhaust PM10
PM10 Total
478.23 0.05
PM2.5 Total
Bio- CO2
Unmitigated Construction Off-Site
ROG
0.00 479.200.23 0.23 0.00 478.23
479.20
Total 0.57 3.80 3.00 0.01 0.23 0.23
478.23 478.23 0.05 0.000.23 0.23 0.000.01 0.23 0.23Off-Road 0.57 3.80 3.00
CO2e
Category tons/yr MT/yr
NBio- CO2 Total CO2 CH4 N2OFugitive PM2.5
Exhaust PM2.5
NOx CO SO2 Fugitive PM10
Exhaust PM10
PM10 Total
4,920.23 0.21
PM2.5 Total
Bio- CO2
3.5 Building Construction - 2015
Unmitigated Construction On-Site
ROG
0.00 4,924.700.61 0.68 0.00 4,920.23
2,420.15
Total 2.92 17.22 26.61 0.06 0.21 0.66 0.86 0.07
2,417.01 2,417.01 0.15 0.000.05 0.12 0.17 0.000.03 0.14 0.13 0.26Worker 1.51 1.69 16.63
2,503.22 0.06 0.00 2,504.550.49 0.51 0.00 2,503.22
0.00
Vendor 1.41 15.53 9.98 0.03 0.07 0.53 0.60 0.02
0.00 0.00 0.00 0.000.00 0.00 0.00 0.000.00 0.00 0.00 0.00Hauling 0.00 0.00 0.00
CO2e
Category tons/yr MT/yr
NBio- CO2 Total CO2 CH4 N2OFugitive PM2.5
Exhaust PM2.5
NOx CO SO2 Fugitive PM10
Exhaust PM10
PM10 Total
478.23 0.05
PM2.5 Total
Bio- CO2
Mitigated Construction Off-Site
ROG
0.00 479.280.26 0.26 0.00 478.23
479.28
Total 0.62 4.18 3.03 0.01 0.26 0.26
478.23 478.23 0.05 0.000.26 0.26 0.000.01 0.26 0.26Off-Road 0.62 4.18 3.03
CO2e
Category tons/yr MT/yr
NBio- CO2 Total CO2 CH4 N2OFugitive PM2.5
Exhaust PM2.5
NOx CO SO2 Fugitive PM10
Exhaust PM10
PM10 Total PM2.5 Total
Bio- CO2
Mitigated Construction On-Site
ROG
8 of 25

476.40 0.04 0.00 477.200.18 0.18 0.00 476.40
477.20
Total 0.48 3.13 2.94 0.01 0.18 0.18
476.40 476.40 0.04 0.000.18 0.18 0.000.01 0.18 0.18Off-Road 0.48 3.13 2.94
CO2e
Category tons/yr MT/yr
NBio- CO2 Total CO2 CH4 N2OFugitive PM2.5
Exhaust PM2.5
NOx CO SO2 Fugitive PM10
Exhaust PM10
PM10 Total
4,746.97 0.17
PM2.5 Total
Bio- CO2
Mitigated Construction On-Site
ROG
0.00 4,750.550.51 0.59 0.00 4,746.97
2,246.21
Total 2.37 13.92 21.05 0.06 3.96 0.56 4.51 0.07
2,243.69 2,243.69 0.12 0.000.05 0.12 0.17 0.000.03 3.14 0.13 3.27Worker 1.24 1.31 12.97
2,503.28 0.05 0.00 2,504.340.39 0.42 0.00 2,503.28
0.00
Vendor 1.13 12.61 8.08 0.03 0.82 0.43 1.24 0.02
0.00 0.00 0.00 0.000.00 0.00 0.00 0.000.00 0.00 0.00 0.00Hauling 0.00 0.00 0.00
CO2e
Category tons/yr MT/yr
NBio- CO2 Total CO2 CH4 N2OFugitive PM2.5
Exhaust PM2.5
NOx CO SO2 Fugitive PM10
Exhaust PM10
PM10 Total
476.40 0.04
PM2.5 Total
Bio- CO2
Unmitigated Construction Off-Site
ROG
0.00 477.200.18 0.18 0.00 476.40
477.20
Total 0.48 3.13 2.94 0.01 0.18 0.18
476.40 476.40 0.04 0.000.18 0.18 0.000.01 0.18 0.18Off-Road 0.48 3.13 2.94
CO2e
Category tons/yr MT/yr
NBio- CO2 Total CO2 CH4 N2OFugitive PM2.5
Exhaust PM2.5
NOx CO SO2 Fugitive PM10
Exhaust PM10
PM10 Total
4,814.92 0.18
PM2.5 Total
Bio- CO2
3.5 Building Construction - 2017
Unmitigated Construction On-Site
ROG
0.00 4,818.770.54 0.62 0.00 4,814.92
2,307.65
Total 2.54 14.91 22.75 0.06 0.21 0.59 0.79 0.07
2,304.93 2,304.93 0.13 0.000.05 0.12 0.17 0.000.03 0.14 0.13 0.26Worker 1.33 1.43 14.12
2,509.99 0.05 0.00 2,511.120.42 0.45 0.00 2,509.99
0.00
Vendor 1.21 13.48 8.63 0.03 0.07 0.46 0.53 0.02
0.00 0.00 0.00 0.000.00 0.00 0.00 0.000.00 0.00 0.00 0.00Hauling 0.00 0.00 0.00
CO2e
Category tons/yr MT/yr
NBio- CO2 Total CO2 CH4 N2OFugitive PM2.5
Exhaust PM2.5
NOx CO SO2 Fugitive PM10
Exhaust PM10
PM10 Total
478.23 0.04
PM2.5 Total
Bio- CO2
Mitigated Construction Off-Site
ROG
0.00 479.110.21 0.21 0.00 478.23
479.11
Total 0.52 3.46 2.97 0.01 0.21 0.21
478.23 478.23 0.04 0.000.21 0.21 0.000.01 0.21 0.21Off-Road 0.52 3.46 2.97
CO2e
Category tons/yr MT/yr
NBio- CO2 Total CO2 CH4 N2OFugitive PM2.5
Exhaust PM2.5
NOx CO SO2 Fugitive PM10
Exhaust PM10
PM10 Total
4,814.92 0.18
PM2.5 Total
Bio- CO2
Mitigated Construction On-Site
ROG
0.00 4,818.770.54 0.62 0.00 4,814.92
2,307.65
Total 2.54 14.91 22.75 0.06 3.98 0.59 4.56 0.07
2,304.93 2,304.93 0.13 0.000.05 0.12 0.17 0.000.03 3.16 0.13 3.28Worker 1.33 1.43 14.12
2,509.99 0.05 0.00 2,511.120.42 0.45 0.00 2,509.99
0.00
Vendor 1.21 13.48 8.63 0.03 0.82 0.46 1.28 0.02
0.00 0.00 0.00 0.000.00 0.00 0.00 0.000.00 0.00 0.00 0.00Hauling 0.00 0.00 0.00
CO2e
Category tons/yr MT/yr
NBio- CO2 Total CO2 CH4 N2OFugitive PM2.5
Exhaust PM2.5
NOx CO SO2 Fugitive PM10
Exhaust PM10
PM10 Total PM2.5 Total
Bio- CO2
Unmitigated Construction Off-Site
ROG
9 of 25

478.23 0.03 0.00 478.910.13 0.13 0.00 478.23
478.91
Total 0.40 2.57 2.92 0.01 0.13 0.13
478.23 478.23 0.03 0.000.13 0.13 0.000.01 0.13 0.13Off-Road 0.40 2.57 2.92
CO2e
Category tons/yr MT/yr
NBio- CO2 Total CO2 CH4 N2OFugitive PM2.5
Exhaust PM2.5
NOx CO SO2 Fugitive PM10
Exhaust PM10
PM10 Total
4,718.78 0.16
PM2.5 Total
Bio- CO2
3.5 Building Construction - 2019
Unmitigated Construction On-Site
ROG
0.00 4,722.140.49 0.57 0.00 4,718.78
2,205.62
Total 2.24 13.16 19.67 0.06 0.21 0.54 0.74 0.07
2,203.26 2,203.26 0.11 0.000.05 0.12 0.17 0.000.03 0.14 0.13 0.26Worker 1.17 1.22 12.02
2,515.52 0.05 0.00 2,516.520.37 0.40 0.00 2,515.52
0.00
Vendor 1.07 11.94 7.65 0.03 0.07 0.41 0.48 0.02
0.00 0.00 0.00 0.000.00 0.00 0.00 0.000.00 0.00 0.00 0.00Hauling 0.00 0.00 0.00
CO2e
Category tons/yr MT/yr
NBio- CO2 Total CO2 CH4 N2OFugitive PM2.5
Exhaust PM2.5
NOx CO SO2 Fugitive PM10
Exhaust PM10
PM10 Total
478.23 0.04
PM2.5 Total
Bio- CO2
Mitigated Construction Off-Site
ROG
0.00 478.970.16 0.16 0.00 478.23
478.97
Total 0.44 2.84 2.93 0.01 0.16 0.16
478.23 478.23 0.04 0.000.16 0.16 0.000.01 0.16 0.16Off-Road 0.44 2.84 2.93
CO2e
Category tons/yr MT/yr
NBio- CO2 Total CO2 CH4 N2OFugitive PM2.5
Exhaust PM2.5
NOx CO SO2 Fugitive PM10
Exhaust PM10
PM10 Total
4,718.78 0.16
PM2.5 Total
Bio- CO2
Mitigated Construction On-Site
ROG
0.00 4,722.140.49 0.57 0.00 4,718.78
2,205.62
Total 2.24 13.16 19.67 0.06 3.98 0.54 4.51 0.07
2,203.26 2,203.26 0.11 0.000.05 0.12 0.17 0.000.03 3.16 0.13 3.28Worker 1.17 1.22 12.02
2,515.52 0.05 0.00 2,516.520.37 0.40 0.00 2,515.52
0.00
Vendor 1.07 11.94 7.65 0.03 0.82 0.41 1.23 0.02
0.00 0.00 0.00 0.000.00 0.00 0.00 0.000.00 0.00 0.00 0.00Hauling 0.00 0.00 0.00
CO2e
Category tons/yr MT/yr
NBio- CO2 Total CO2 CH4 N2OFugitive PM2.5
Exhaust PM2.5
NOx CO SO2 Fugitive PM10
Exhaust PM10
PM10 Total
478.23 0.04
PM2.5 Total
Bio- CO2
Unmitigated Construction Off-Site
ROG
0.00 478.970.16 0.16 0.00 478.23
478.97
Total 0.44 2.84 2.93 0.01 0.16 0.16
478.23 478.23 0.04 0.000.16 0.16 0.000.01 0.16 0.16Off-Road 0.44 2.84 2.93
CO2e
Category tons/yr MT/yr
NBio- CO2 Total CO2 CH4 N2OFugitive PM2.5
Exhaust PM2.5
NOx CO SO2 Fugitive PM10
Exhaust PM10
PM10 Total
4,746.97 0.17
PM2.5 Total
Bio- CO2
3.5 Building Construction - 2018
Unmitigated Construction On-Site
ROG
0.00 4,750.550.51 0.59 0.00 4,746.97
2,246.21
Total 2.37 13.92 21.05 0.06 0.20 0.56 0.76 0.07
2,243.69 2,243.69 0.12 0.000.05 0.12 0.17 0.000.03 0.13 0.13 0.26Worker 1.24 1.31 12.97
2,503.28 0.05 0.00 2,504.340.39 0.42 0.00 2,503.28
0.00
Vendor 1.13 12.61 8.08 0.03 0.07 0.43 0.50 0.02
0.00 0.00 0.00 0.000.00 0.00 0.00 0.000.00 0.00 0.00 0.00Hauling 0.00 0.00 0.00
CO2e
Category tons/yr MT/yr
NBio- CO2 Total CO2 CH4 N2OFugitive PM2.5
Exhaust PM2.5
NOx CO SO2 Fugitive PM10
Exhaust PM10
PM10 Total PM2.5 Total
Bio- CO2
Mitigated Construction Off-Site
ROG
10 of 25

480.06 0.03 0.00 480.680.11 0.11 0.00 480.06
480.68
Total 0.37 2.34 2.91 0.01 0.11 0.11
480.06 480.06 0.03 0.000.11 0.11 0.000.01 0.11 0.11Off-Road 0.37 2.34 2.91
CO2e
Category tons/yr MT/yr
NBio- CO2 Total CO2 CH4 N2OFugitive PM2.5
Exhaust PM2.5
NOx CO SO2 Fugitive PM10
Exhaust PM10
PM10 Total
4,655.92 0.14
PM2.5 Total
Bio- CO2
Mitigated Construction On-Site
ROG
0.00 4,658.910.46 0.53 0.00 4,655.92
2,127.64
Total 2.03 11.91 17.48 0.06 3.99 0.50 4.49 0.07
2,125.54 2,125.54 0.10 0.000.05 0.12 0.17 0.000.03 3.17 0.13 3.30Worker 1.07 1.06 10.58
2,530.38 0.04 0.00 2,531.270.34 0.36 0.00 2,530.38
0.00
Vendor 0.96 10.85 6.90 0.03 0.82 0.37 1.19 0.02
0.00 0.00 0.00 0.000.00 0.00 0.00 0.000.00 0.00 0.00 0.00Hauling 0.00 0.00 0.00
CO2e
Category tons/yr MT/yr
NBio- CO2 Total CO2 CH4 N2OFugitive PM2.5
Exhaust PM2.5
NOx CO SO2 Fugitive PM10
Exhaust PM10
PM10 Total
480.06 0.03
PM2.5 Total
Bio- CO2
Unmitigated Construction Off-Site
ROG
0.00 480.680.11 0.11 0.00 480.06
480.68
Total 0.37 2.34 2.91 0.01 0.11 0.11
480.06 480.06 0.03 0.000.11 0.11 0.000.01 0.11 0.11Off-Road 0.37 2.34 2.91
CO2e
Category tons/yr MT/yr
NBio- CO2 Total CO2 CH4 N2OFugitive PM2.5
Exhaust PM2.5
NOx CO SO2 Fugitive PM10
Exhaust PM10
PM10 Total
4,676.80 0.15
PM2.5 Total
Bio- CO2
3.5 Building Construction - 2020
Unmitigated Construction On-Site
ROG
0.00 4,679.970.47 0.55 0.00 4,676.80
2,160.68
Total 2.12 12.46 18.43 0.06 0.21 0.51 0.72 0.07
2,158.45 2,158.45 0.11 0.000.05 0.12 0.17 0.000.03 0.14 0.13 0.26Worker 1.11 1.13 11.22
2,518.35 0.04 0.00 2,519.290.35 0.38 0.00 2,518.35
0.00
Vendor 1.01 11.33 7.21 0.03 0.07 0.38 0.46 0.02
0.00 0.00 0.00 0.000.00 0.00 0.00 0.000.00 0.00 0.00 0.00Hauling 0.00 0.00 0.00
CO2e
Category tons/yr MT/yr
NBio- CO2 Total CO2 CH4 N2OFugitive PM2.5
Exhaust PM2.5
NOx CO SO2 Fugitive PM10
Exhaust PM10
PM10 Total
478.23 0.03
PM2.5 Total
Bio- CO2
Mitigated Construction Off-Site
ROG
0.00 478.910.13 0.13 0.00 478.23
478.91
Total 0.40 2.57 2.92 0.01 0.13 0.13
478.23 478.23 0.03 0.000.13 0.13 0.000.01 0.13 0.13Off-Road 0.40 2.57 2.92
CO2e
Category tons/yr MT/yr
NBio- CO2 Total CO2 CH4 N2OFugitive PM2.5
Exhaust PM2.5
NOx CO SO2 Fugitive PM10
Exhaust PM10
PM10 Total
4,676.80 0.15
PM2.5 Total
Bio- CO2
Mitigated Construction On-Site
ROG
0.00 4,679.970.47 0.55 0.00 4,676.80
2,160.68
Total 2.12 12.46 18.43 0.06 3.98 0.51 4.48 0.07
2,158.45 2,158.45 0.11 0.000.05 0.12 0.17 0.000.03 3.16 0.13 3.28Worker 1.11 1.13 11.22
2,518.35 0.04 0.00 2,519.290.35 0.38 0.00 2,518.35
0.00
Vendor 1.01 11.33 7.21 0.03 0.82 0.38 1.20 0.02
0.00 0.00 0.00 0.000.00 0.00 0.00 0.000.00 0.00 0.00 0.00Hauling 0.00 0.00 0.00
CO2e
Category tons/yr MT/yr
NBio- CO2 Total CO2 CH4 N2OFugitive PM2.5
Exhaust PM2.5
NOx CO SO2 Fugitive PM10
Exhaust PM10
PM10 Total PM2.5 Total
Bio- CO2
Unmitigated Construction Off-Site
ROG
11 of 25

476.40 0.02 0.00 476.920.08 0.08 0.00 476.40
476.92
Total 0.31 1.89 2.86 0.01 0.08 0.08
476.40 476.40 0.02 0.000.08 0.08 0.000.01 0.08 0.08Off-Road 0.31 1.89 2.86
CO2e
Category tons/yr MT/yr
NBio- CO2 Total CO2 CH4 N2OFugitive PM2.5
Exhaust PM2.5
NOx CO SO2 Fugitive PM10
Exhaust PM10
PM10 Total
4,622.68 0.14
PM2.5 Total
Bio- CO2
3.5 Building Construction - 2022
Unmitigated Construction On-Site
ROG
0.00 4,625.560.45 0.52 0.00 4,622.68
2,101.74
Total 1.95 11.38 16.64 0.06 0.21 0.48 0.69 0.07
2,099.71 2,099.71 0.10 0.000.05 0.12 0.17 0.000.03 0.14 0.13 0.26Worker 1.03 0.99 10.09
2,522.97 0.04 0.00 2,523.820.33 0.35 0.00 2,522.97
0.00
Vendor 0.92 10.39 6.55 0.03 0.07 0.35 0.43 0.02
0.00 0.00 0.00 0.000.00 0.00 0.00 0.000.00 0.00 0.00 0.00Hauling 0.00 0.00 0.00
CO2e
Category tons/yr MT/yr
NBio- CO2 Total CO2 CH4 N2OFugitive PM2.5
Exhaust PM2.5
NOx CO SO2 Fugitive PM10
Exhaust PM10
PM10 Total
478.23 0.03
PM2.5 Total
Bio- CO2
Mitigated Construction Off-Site
ROG
0.00 478.790.10 0.10 0.00 478.23
478.79
Total 0.33 2.10 2.88 0.01 0.10 0.10
478.23 478.23 0.03 0.000.10 0.10 0.000.01 0.10 0.10Off-Road 0.33 2.10 2.88
CO2e
Category tons/yr MT/yr
NBio- CO2 Total CO2 CH4 N2OFugitive PM2.5
Exhaust PM2.5
NOx CO SO2 Fugitive PM10
Exhaust PM10
PM10 Total
4,622.68 0.14
PM2.5 Total
Bio- CO2
Mitigated Construction On-Site
ROG
0.00 4,625.560.45 0.52 0.00 4,622.68
2,101.74
Total 1.95 11.38 16.64 0.06 3.98 0.48 4.46 0.07
2,099.71 2,099.71 0.10 0.000.05 0.12 0.17 0.000.03 3.16 0.13 3.29Worker 1.03 0.99 10.09
2,522.97 0.04 0.00 2,523.820.33 0.35 0.00 2,522.97
0.00
Vendor 0.92 10.39 6.55 0.03 0.82 0.35 1.17 0.02
0.00 0.00 0.00 0.000.00 0.00 0.00 0.000.00 0.00 0.00 0.00Hauling 0.00 0.00 0.00
CO2e
Category tons/yr MT/yr
NBio- CO2 Total CO2 CH4 N2OFugitive PM2.5
Exhaust PM2.5
NOx CO SO2 Fugitive PM10
Exhaust PM10
PM10 Total
478.23 0.03
PM2.5 Total
Bio- CO2
Unmitigated Construction Off-Site
ROG
0.00 478.790.10 0.10 0.00 478.23
478.79
Total 0.33 2.10 2.88 0.01 0.10 0.10
478.23 478.23 0.03 0.000.10 0.10 0.000.01 0.10 0.10Off-Road 0.33 2.10 2.88
CO2e
Category tons/yr MT/yr
NBio- CO2 Total CO2 CH4 N2OFugitive PM2.5
Exhaust PM2.5
NOx CO SO2 Fugitive PM10
Exhaust PM10
PM10 Total
4,655.92 0.14
PM2.5 Total
Bio- CO2
3.5 Building Construction - 2021
Unmitigated Construction On-Site
ROG
0.00 4,658.910.46 0.53 0.00 4,655.92
2,127.64
Total 2.03 11.91 17.48 0.06 0.21 0.50 0.70 0.07
2,125.54 2,125.54 0.10 0.000.05 0.12 0.17 0.000.03 0.14 0.13 0.26Worker 1.07 1.06 10.58
2,530.38 0.04 0.00 2,531.270.34 0.36 0.00 2,530.38
0.00
Vendor 0.96 10.85 6.90 0.03 0.07 0.37 0.44 0.02
0.00 0.00 0.00 0.000.00 0.00 0.00 0.000.00 0.00 0.00 0.00Hauling 0.00 0.00 0.00
CO2e
Category tons/yr MT/yr
NBio- CO2 Total CO2 CH4 N2OFugitive PM2.5
Exhaust PM2.5
NOx CO SO2 Fugitive PM10
Exhaust PM10
PM10 Total PM2.5 Total
Bio- CO2
Mitigated Construction Off-Site
ROG
12 of 25
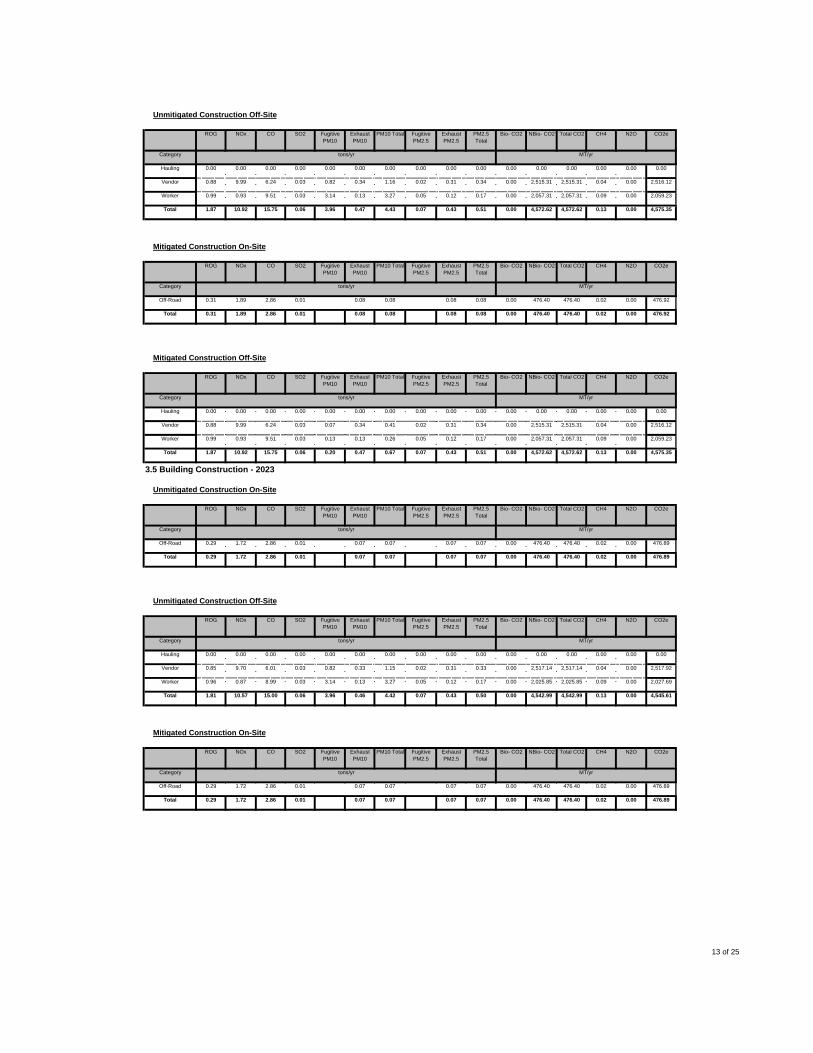
476.40 0.02 0.00 476.890.07 0.07 0.00 476.40
476.89
Total 0.29 1.72 2.86 0.01 0.07 0.07
476.40 476.40 0.02 0.000.07 0.07 0.000.01 0.07 0.07Off-Road 0.29 1.72 2.86
CO2e
Category tons/yr MT/yr
NBio- CO2 Total CO2 CH4 N2OFugitive PM2.5
Exhaust PM2.5
NOx CO SO2 Fugitive PM10
Exhaust PM10
PM10 Total
4,542.99 0.13
PM2.5 Total
Bio- CO2
Mitigated Construction On-Site
ROG
0.00 4,545.610.43 0.50 0.00 4,542.99
2,027.69
Total 1.81 10.57 15.00 0.06 3.96 0.46 4.42 0.07
2,025.85 2,025.85 0.09 0.000.05 0.12 0.17 0.000.03 3.14 0.13 3.27Worker 0.96 0.87 8.99
2,517.14 0.04 0.00 2,517.920.31 0.33 0.00 2,517.14
0.00
Vendor 0.85 9.70 6.01 0.03 0.82 0.33 1.15 0.02
0.00 0.00 0.00 0.000.00 0.00 0.00 0.000.00 0.00 0.00 0.00Hauling 0.00 0.00 0.00
CO2e
Category tons/yr MT/yr
NBio- CO2 Total CO2 CH4 N2OFugitive PM2.5
Exhaust PM2.5
NOx CO SO2 Fugitive PM10
Exhaust PM10
PM10 Total
476.40 0.02
PM2.5 Total
Bio- CO2
Unmitigated Construction Off-Site
ROG
0.00 476.890.07 0.07 0.00 476.40
476.89
Total 0.29 1.72 2.86 0.01 0.07 0.07
476.40 476.40 0.02 0.000.07 0.07 0.000.01 0.07 0.07Off-Road 0.29 1.72 2.86
CO2e
Category tons/yr MT/yr
NBio- CO2 Total CO2 CH4 N2OFugitive PM2.5
Exhaust PM2.5
NOx CO SO2 Fugitive PM10
Exhaust PM10
PM10 Total
4,572.62 0.13
PM2.5 Total
Bio- CO2
3.5 Building Construction - 2023
Unmitigated Construction On-Site
ROG
0.00 4,575.350.43 0.51 0.00 4,572.62
2,059.23
Total 1.87 10.92 15.75 0.06 0.20 0.47 0.67 0.07
2,057.31 2,057.31 0.09 0.000.05 0.12 0.17 0.000.03 0.13 0.13 0.26Worker 0.99 0.93 9.51
2,515.31 0.04 0.00 2,516.120.31 0.34 0.00 2,515.31
0.00
Vendor 0.88 9.99 6.24 0.03 0.07 0.34 0.41 0.02
0.00 0.00 0.00 0.000.00 0.00 0.00 0.000.00 0.00 0.00 0.00Hauling 0.00 0.00 0.00
CO2e
Category tons/yr MT/yr
NBio- CO2 Total CO2 CH4 N2OFugitive PM2.5
Exhaust PM2.5
NOx CO SO2 Fugitive PM10
Exhaust PM10
PM10 Total
476.40 0.02
PM2.5 Total
Bio- CO2
Mitigated Construction Off-Site
ROG
0.00 476.920.08 0.08 0.00 476.40
476.92
Total 0.31 1.89 2.86 0.01 0.08 0.08
476.40 476.40 0.02 0.000.08 0.08 0.000.01 0.08 0.08Off-Road 0.31 1.89 2.86
CO2e
Category tons/yr MT/yr
NBio- CO2 Total CO2 CH4 N2OFugitive PM2.5
Exhaust PM2.5
NOx CO SO2 Fugitive PM10
Exhaust PM10
PM10 Total
4,572.62 0.13
PM2.5 Total
Bio- CO2
Mitigated Construction On-Site
ROG
0.00 4,575.350.43 0.51 0.00 4,572.62
2,059.23
Total 1.87 10.92 15.75 0.06 3.96 0.47 4.43 0.07
2,057.31 2,057.31 0.09 0.000.05 0.12 0.17 0.000.03 3.14 0.13 3.27Worker 0.99 0.93 9.51
2,515.31 0.04 0.00 2,516.120.31 0.34 0.00 2,515.31
0.00
Vendor 0.88 9.99 6.24 0.03 0.82 0.34 1.16 0.02
0.00 0.00 0.00 0.000.00 0.00 0.00 0.000.00 0.00 0.00 0.00Hauling 0.00 0.00 0.00
CO2e
Category tons/yr MT/yr
NBio- CO2 Total CO2 CH4 N2OFugitive PM2.5
Exhaust PM2.5
NOx CO SO2 Fugitive PM10
Exhaust PM10
PM10 Total PM2.5 Total
Bio- CO2
Unmitigated Construction Off-Site
ROG
13 of 25
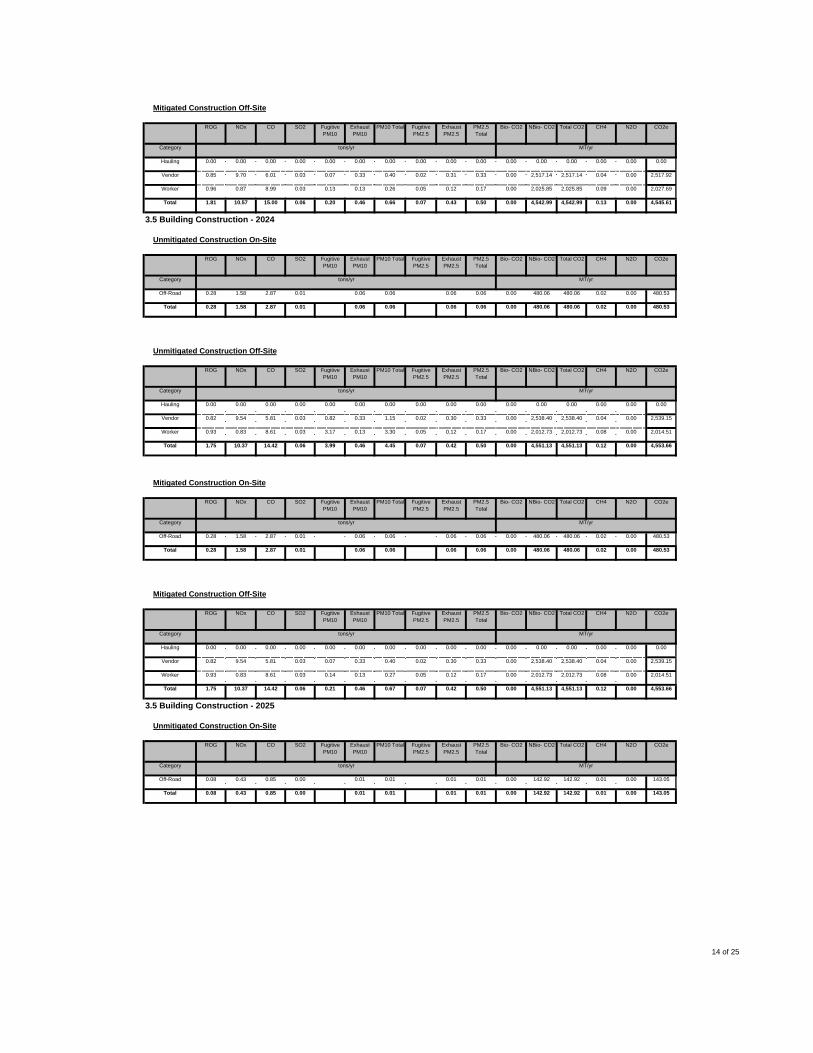
142.92 0.01 0.00 143.050.01 0.01 0.00 142.92
143.05
Total 0.08 0.43 0.85 0.00 0.01 0.01
142.92 142.92 0.01 0.000.01 0.01 0.000.00 0.01 0.01Off-Road 0.08 0.43 0.85
CO2e
Category tons/yr MT/yr
NBio- CO2 Total CO2 CH4 N2OFugitive PM2.5
Exhaust PM2.5
NOx CO SO2 Fugitive PM10
Exhaust PM10
PM10 Total
4,551.13 0.12
PM2.5 Total
Bio- CO2
3.5 Building Construction - 2025
Unmitigated Construction On-Site
ROG
0.00 4,553.660.42 0.50 0.00 4,551.13
2,014.51
Total 1.75 10.37 14.42 0.06 0.21 0.46 0.67 0.07
2,012.73 2,012.73 0.08 0.000.05 0.12 0.17 0.000.03 0.14 0.13 0.27Worker 0.93 0.83 8.61
2,538.40 0.04 0.00 2,539.150.30 0.33 0.00 2,538.40
0.00
Vendor 0.82 9.54 5.81 0.03 0.07 0.33 0.40 0.02
0.00 0.00 0.00 0.000.00 0.00 0.00 0.000.00 0.00 0.00 0.00Hauling 0.00 0.00 0.00
CO2e
Category tons/yr MT/yr
NBio- CO2 Total CO2 CH4 N2OFugitive PM2.5
Exhaust PM2.5
NOx CO SO2 Fugitive PM10
Exhaust PM10
PM10 Total
480.06 0.02
PM2.5 Total
Bio- CO2
Mitigated Construction Off-Site
ROG
0.00 480.530.06 0.06 0.00 480.06
480.53
Total 0.28 1.58 2.87 0.01 0.06 0.06
480.06 480.06 0.02 0.000.06 0.06 0.000.01 0.06 0.06Off-Road 0.28 1.58 2.87
CO2e
Category tons/yr MT/yr
NBio- CO2 Total CO2 CH4 N2OFugitive PM2.5
Exhaust PM2.5
NOx CO SO2 Fugitive PM10
Exhaust PM10
PM10 Total
4,551.13 0.12
PM2.5 Total
Bio- CO2
Mitigated Construction On-Site
ROG
0.00 4,553.660.42 0.50 0.00 4,551.13
2,014.51
Total 1.75 10.37 14.42 0.06 3.99 0.46 4.45 0.07
2,012.73 2,012.73 0.08 0.000.05 0.12 0.17 0.000.03 3.17 0.13 3.30Worker 0.93 0.83 8.61
2,538.40 0.04 0.00 2,539.150.30 0.33 0.00 2,538.40
0.00
Vendor 0.82 9.54 5.81 0.03 0.82 0.33 1.15 0.02
0.00 0.00 0.00 0.000.00 0.00 0.00 0.000.00 0.00 0.00 0.00Hauling 0.00 0.00 0.00
CO2e
Category tons/yr MT/yr
NBio- CO2 Total CO2 CH4 N2OFugitive PM2.5
Exhaust PM2.5
NOx CO SO2 Fugitive PM10
Exhaust PM10
PM10 Total
480.06 0.02
PM2.5 Total
Bio- CO2
Unmitigated Construction Off-Site
ROG
0.00 480.530.06 0.06 0.00 480.06
480.53
Total 0.28 1.58 2.87 0.01 0.06 0.06
480.06 480.06 0.02 0.000.06 0.06 0.000.01 0.06 0.06Off-Road 0.28 1.58 2.87
CO2e
Category tons/yr MT/yr
NBio- CO2 Total CO2 CH4 N2OFugitive PM2.5
Exhaust PM2.5
NOx CO SO2 Fugitive PM10
Exhaust PM10
PM10 Total
4,542.99 0.13
PM2.5 Total
Bio- CO2
3.5 Building Construction - 2024
Unmitigated Construction On-Site
ROG
0.00 4,545.610.43 0.50 0.00 4,542.99
2,027.69
Total 1.81 10.57 15.00 0.06 0.20 0.46 0.66 0.07
2,025.85 2,025.85 0.09 0.000.05 0.12 0.17 0.000.03 0.13 0.13 0.26Worker 0.96 0.87 8.99
2,517.14 0.04 0.00 2,517.920.31 0.33 0.00 2,517.14
0.00
Vendor 0.85 9.70 6.01 0.03 0.07 0.33 0.40 0.02
0.00 0.00 0.00 0.000.00 0.00 0.00 0.000.00 0.00 0.00 0.00Hauling 0.00 0.00 0.00
CO2e
Category tons/yr MT/yr
NBio- CO2 Total CO2 CH4 N2OFugitive PM2.5
Exhaust PM2.5
NOx CO SO2 Fugitive PM10
Exhaust PM10
PM10 Total PM2.5 Total
Bio- CO2
Mitigated Construction Off-Site
ROG
14 of 25
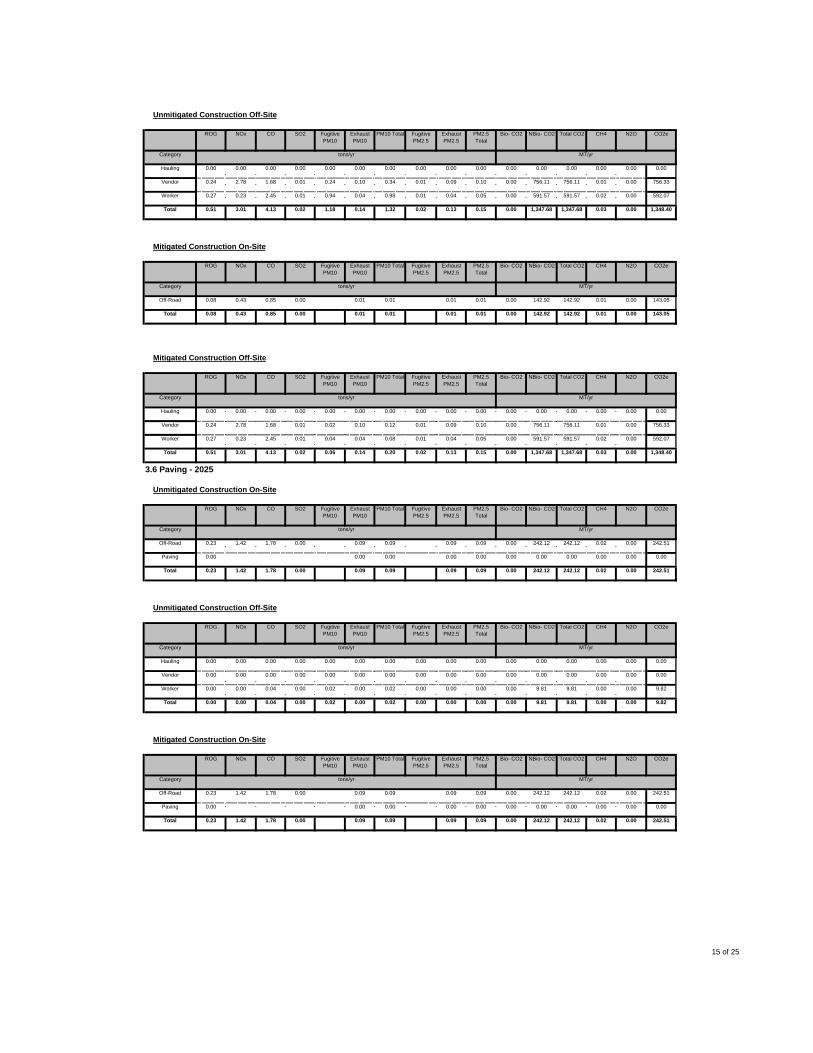
242.51242.120.00 0.09 0.09 242.12 0.02 0.000.09 0.09 0.00Total 0.23 1.42 1.78
0.00 0.00 0.00 0.000.00 0.00 0.00 0.00
242.51
Paving 0.00 0.00 0.00
242.12 242.12 0.02 0.000.09 0.09 0.000.00 0.09 0.09Off-Road 0.23 1.42 1.78
CO2e
Category tons/yr MT/yr
NBio- CO2 Total CO2 CH4 N2OFugitive PM2.5
Exhaust PM2.5
NOx CO SO2 Fugitive PM10
Exhaust PM10
PM10 Total
9.81 0.00
PM2.5 Total
Bio- CO2
Mitigated Construction On-Site
ROG
0.00 9.820.00 0.00 0.00 9.81
9.82
Total 0.00 0.00 0.04 0.00 0.02 0.00 0.02 0.00
9.81 9.81 0.00 0.000.00 0.00 0.00 0.000.00 0.02 0.00 0.02Worker 0.00 0.00 0.04
0.00 0.00 0.00 0.000.00 0.00 0.00 0.00
0.00
Vendor 0.00 0.00 0.00 0.00 0.00 0.00 0.00 0.00
0.00 0.00 0.00 0.000.00 0.00 0.00 0.000.00 0.00 0.00 0.00Hauling 0.00 0.00 0.00
Category tons/yr MT/yr
Bio- CO2 NBio- CO2 Total CO2 CH4PM10 Total PM2.5 Total
242.51
Unmitigated Construction Off-Site
ROG NOx CO N2O CO2eSO2 Fugitive PM10
Exhaust PM10
242.120.00 0.09 0.09
Fugitive PM2.5
Exhaust PM2.5
242.12 0.02 0.000.09 0.09 0.00Total 0.23 1.42 1.78
0.00 0.00 0.00 0.000.00 0.00 0.00 0.00
242.51
Paving 0.00 0.00 0.00
242.12 242.12 0.02 0.000.09 0.09 0.000.00 0.09 0.09Off-Road 0.23 1.42 1.78
CO2e
Category tons/yr MT/yr
NBio- CO2 Total CO2 CH4 N2OFugitive PM2.5
Exhaust PM2.5
NOx CO SO2 Fugitive PM10
Exhaust PM10
PM10 Total
1,347.68 0.03
PM2.5 Total
Bio- CO2
3.6 Paving - 2025
Unmitigated Construction On-Site
ROG
0.00 1,348.400.13 0.15 0.00 1,347.68
592.07
Total 0.51 3.01 4.13 0.02 0.06 0.14 0.20 0.02
591.57 591.57 0.02 0.000.01 0.04 0.05 0.000.01 0.04 0.04 0.08Worker 0.27 0.23 2.45
756.11 0.01 0.00 756.330.09 0.10 0.00 756.11
0.00
Vendor 0.24 2.78 1.68 0.01 0.02 0.10 0.12 0.01
0.00 0.00 0.00 0.000.00 0.00 0.00 0.000.00 0.00 0.00 0.00Hauling 0.00 0.00 0.00
CO2e
Category tons/yr MT/yr
NBio- CO2 Total CO2 CH4 N2OFugitive PM2.5
Exhaust PM2.5
NOx CO SO2 Fugitive PM10
Exhaust PM10
PM10 Total
142.92 0.01
PM2.5 Total
Bio- CO2
Mitigated Construction Off-Site
ROG
0.00 143.050.01 0.01 0.00 142.92
143.05
Total 0.08 0.43 0.85 0.00 0.01 0.01
142.92 142.92 0.01 0.000.01 0.01 0.000.00 0.01 0.01Off-Road 0.08 0.43 0.85
CO2e
Category tons/yr MT/yr
NBio- CO2 Total CO2 CH4 N2OFugitive PM2.5
Exhaust PM2.5
NOx CO SO2 Fugitive PM10
Exhaust PM10
PM10 Total
1,347.68 0.03
PM2.5 Total
Bio- CO2
Mitigated Construction On-Site
ROG
0.00 1,348.400.13 0.15 0.00 1,347.68
592.07
Total 0.51 3.01 4.13 0.02 1.18 0.14 1.32 0.02
591.57 591.57 0.02 0.000.01 0.04 0.05 0.000.01 0.94 0.04 0.98Worker 0.27 0.23 2.45
756.11 0.01 0.00 756.330.09 0.10 0.00 756.11
0.00
Vendor 0.24 2.78 1.68 0.01 0.24 0.10 0.34 0.01
0.00 0.00 0.00 0.000.00 0.00 0.00 0.000.00 0.00 0.00 0.00Hauling 0.00 0.00 0.00
CO2e
Category tons/yr MT/yr
NBio- CO2 Total CO2 CH4 N2OFugitive PM2.5
Exhaust PM2.5
NOx CO SO2 Fugitive PM10
Exhaust PM10
PM10 Total PM2.5 Total
Bio- CO2
Unmitigated Construction Off-Site
ROG
15 of 25

28.0828.050.00 0.01 0.01 28.05 0.00 0.000.01 0.01 0.00Total 68.92 0.13 0.20
28.05 0.00 0.00 28.080.01 0.01 0.00 28.05
0.00
Off-Road 0.02 0.13 0.20 0.00 0.01 0.01
0.00 0.00 0.00 0.000.00 0.00 0.000.00 0.00Archit. Coating 68.90
CO2e
Category tons/yr MT/yr
NBio- CO2 Total CO2 CH4 N2OFugitive PM2.5
Exhaust PM2.5
NOx CO SO2 Fugitive PM10
Exhaust PM10
PM10 Total
1.98 0.00
PM2.5 Total
Bio- CO2
3.7 Architectural Coating - 2026
Unmitigated Construction On-Site
ROG
0.00 1.990.00 0.00 0.00 1.98
1.99
Total 0.00 0.00 0.01 0.00 0.00 0.00 0.00 0.00
1.98 1.98 0.00 0.000.00 0.00 0.00 0.000.00 0.00 0.00 0.00Worker 0.00 0.00 0.01
0.00 0.00 0.00 0.000.00 0.00 0.00 0.00
0.00
Vendor 0.00 0.00 0.00 0.00 0.00 0.00 0.00 0.00
0.00 0.00 0.00 0.000.00 0.00 0.00 0.000.00 0.00 0.00 0.00Hauling 0.00 0.00 0.00
Category tons/yr MT/yr
Bio- CO2 NBio- CO2 Total CO2 CH4PM10 Total PM2.5 Total
49.03
Mitigated Construction Off-Site
ROG NOx CO N2O CO2eSO2 Fugitive PM10
Exhaust PM10
48.950.00 0.02 0.02
Fugitive PM2.5
Exhaust PM2.5
48.95 0.00 0.000.02 0.02 0.00Total 0.05 0.29 0.36
0.00 0.00 0.00 0.000.00 0.00 0.00 0.00
49.03
Paving 0.00 0.00 0.00
48.95 48.95 0.00 0.000.02 0.02 0.000.00 0.02 0.02Off-Road 0.05 0.29 0.36
CO2e
Category tons/yr MT/yr
NBio- CO2 Total CO2 CH4 N2OFugitive PM2.5
Exhaust PM2.5
NOx CO SO2 Fugitive PM10
Exhaust PM10
PM10 Total
1.98 0.00
PM2.5 Total
Bio- CO2
Mitigated Construction On-Site
ROG
0.00 1.990.00 0.00 0.00 1.98
1.99
Total 0.00 0.00 0.01 0.00 0.00 0.00 0.00 0.00
1.98 1.98 0.00 0.000.00 0.00 0.00 0.000.00 0.00 0.00 0.00Worker 0.00 0.00 0.01
0.00 0.00 0.00 0.000.00 0.00 0.00 0.00
0.00
Vendor 0.00 0.00 0.00 0.00 0.00 0.00 0.00 0.00
0.00 0.00 0.00 0.000.00 0.00 0.00 0.000.00 0.00 0.00 0.00Hauling 0.00 0.00 0.00
Category tons/yr MT/yr
Bio- CO2 NBio- CO2 Total CO2 CH4PM10 Total PM2.5 Total
49.03
Unmitigated Construction Off-Site
ROG NOx CO N2O CO2eSO2 Fugitive PM10
Exhaust PM10
48.950.00 0.02 0.02
Fugitive PM2.5
Exhaust PM2.5
48.95 0.00 0.000.02 0.02 0.00Total 0.05 0.29 0.36
0.00 0.00 0.00 0.000.00 0.00 0.00 0.00
49.03
Paving 0.00 0.00 0.00
48.95 48.95 0.00 0.000.02 0.02 0.000.00 0.02 0.02Off-Road 0.05 0.29 0.36
CO2e
Category tons/yr MT/yr
NBio- CO2 Total CO2 CH4 N2OFugitive PM2.5
Exhaust PM2.5
NOx CO SO2 Fugitive PM10
Exhaust PM10
PM10 Total
9.81 0.00
PM2.5 Total
Bio- CO2
3.6 Paving - 2026
Unmitigated Construction On-Site
ROG
0.00 9.820.00 0.00 0.00 9.81
9.82
Total 0.00 0.00 0.04 0.00 0.00 0.00 0.00 0.00
9.81 9.81 0.00 0.000.00 0.00 0.00 0.000.00 0.00 0.00 0.00Worker 0.00 0.00 0.04
0.00 0.00 0.00 0.000.00 0.00 0.00 0.00
0.00
Vendor 0.00 0.00 0.00 0.00 0.00 0.00 0.00 0.00
0.00 0.00 0.00 0.000.00 0.00 0.00 0.000.00 0.00 0.00 0.00Hauling 0.00 0.00 0.00
Category tons/yr MT/yr
Bio- CO2 NBio- CO2 Total CO2 CH4PM10 Total PM2.5 Total
Mitigated Construction Off-Site
ROG NOx CO N2O CO2eSO2 Fugitive PM10
Exhaust PM10
Fugitive PM2.5
Exhaust PM2.5
16 of 25
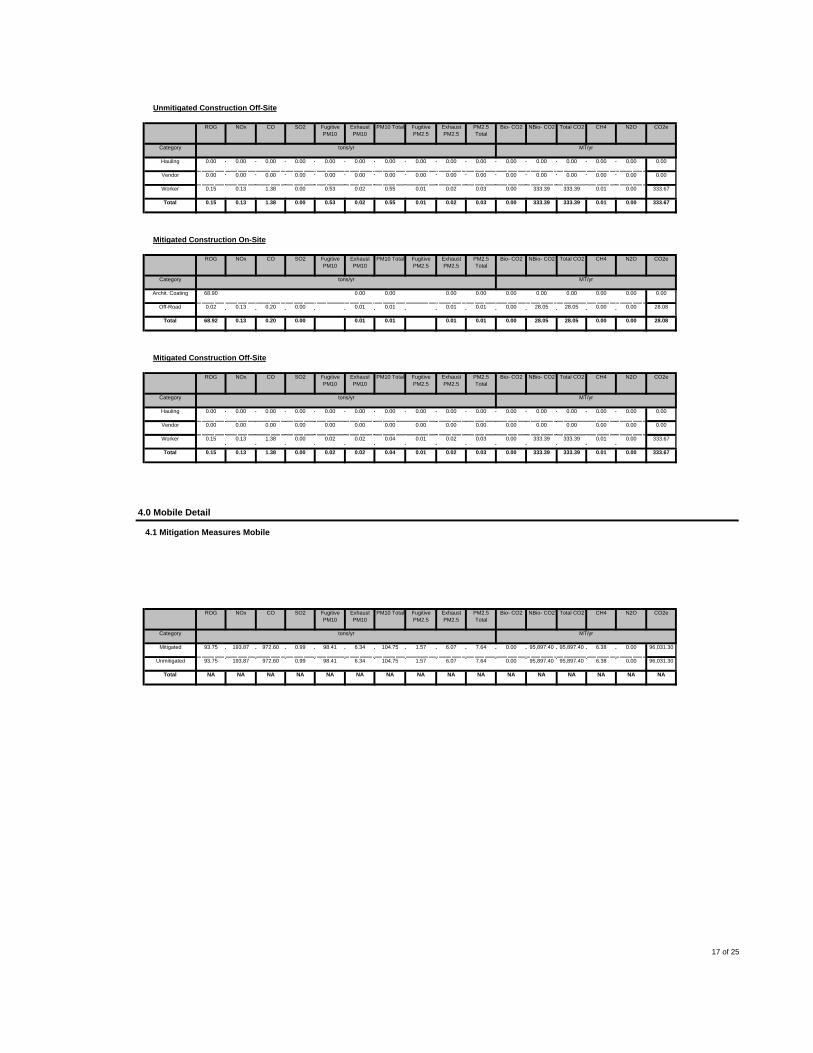
NANA NA NA NANA NA NA NANA NA NA NATotal NA NA NA
95,897.40 6.38 0.00 96,031.306.07 7.64 0.00 95,897.40
96,031.30
Unmitigated 93.75 193.87 972.60 0.99 98.41 6.34 104.75 1.57
95,897.40 95,897.40 6.38 0.001.57 6.07 7.64 0.000.99 98.41 6.34 104.75Mitigated 93.75 193.87 972.60
Category tons/yr MT/yr
Bio- CO2 NBio- CO2 Total CO2 CH4PM10 TotalROG NOx CO N2O CO2eSO2 Fugitive PM10
Exhaust PM10
4.0 Mobile Detail
4.1 Mitigation Measures Mobile
Fugitive PM2.5
Exhaust PM2.5
PM2.5 Total
333.39 0.01 0.00 333.670.02 0.03 0.00 333.39
333.67
Total 0.15 0.13 1.38 0.00 0.02 0.02 0.04 0.01
333.39 333.39 0.01 0.000.01 0.02 0.03 0.000.00 0.02 0.02 0.04Worker 0.15 0.13 1.38
0.00 0.00 0.00 0.000.00 0.00 0.00 0.00
0.00
Vendor 0.00 0.00 0.00 0.00 0.00 0.00 0.00 0.00
0.00 0.00 0.00 0.000.00 0.00 0.00 0.000.00 0.00 0.00 0.00Hauling 0.00 0.00 0.00
Category tons/yr MT/yr
Bio- CO2 NBio- CO2 Total CO2 CH4PM10 Total PM2.5 Total
28.08
Mitigated Construction Off-Site
ROG NOx CO N2O CO2eSO2 Fugitive PM10
Exhaust PM10
28.050.00 0.01 0.01
Fugitive PM2.5
Exhaust PM2.5
28.05 0.00 0.000.01 0.01 0.00Total 68.92 0.13 0.20
28.05 0.00 0.00 28.080.01 0.01 0.00 28.05
0.00
Off-Road 0.02 0.13 0.20 0.00 0.01 0.01
0.00 0.00 0.00 0.000.00 0.00 0.000.00 0.00Archit. Coating 68.90
CO2e
Category tons/yr MT/yr
NBio- CO2 Total CO2 CH4 N2OFugitive PM2.5
Exhaust PM2.5
NOx CO SO2 Fugitive PM10
Exhaust PM10
PM10 Total
333.39 0.01
PM2.5 Total
Bio- CO2
Mitigated Construction On-Site
ROG
0.00 333.670.02 0.03 0.00 333.39
333.67
Total 0.15 0.13 1.38 0.00 0.53 0.02 0.55 0.01
333.39 333.39 0.01 0.000.01 0.02 0.03 0.000.00 0.53 0.02 0.55Worker 0.15 0.13 1.38
0.00 0.00 0.00 0.000.00 0.00 0.00 0.00
0.00
Vendor 0.00 0.00 0.00 0.00 0.00 0.00 0.00 0.00
0.00 0.00 0.00 0.000.00 0.00 0.00 0.000.00 0.00 0.00 0.00Hauling 0.00 0.00 0.00
Category tons/yr MT/yr
Bio- CO2 NBio- CO2 Total CO2 CH4PM10 Total PM2.5 Total
Unmitigated Construction Off-Site
ROG NOx CO N2O CO2eSO2 Fugitive PM10
Exhaust PM10
Fugitive PM2.5
Exhaust PM2.5
17 of 25
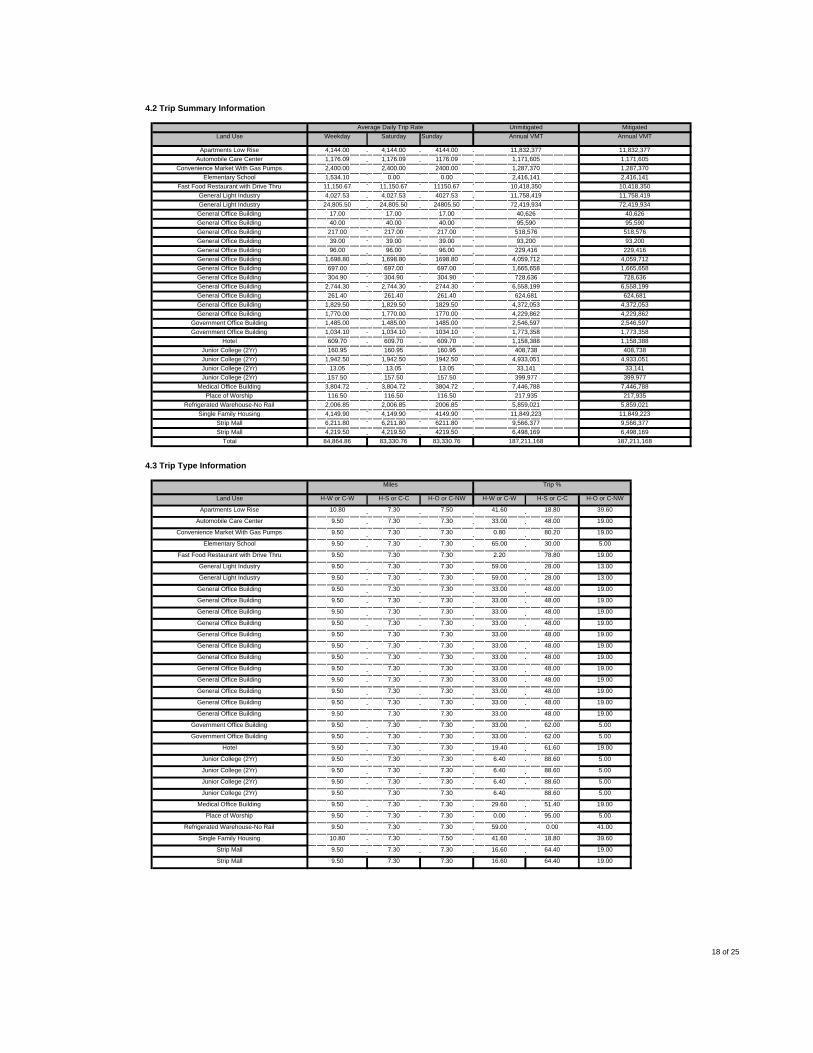
16.60 64.40 19.00Strip Mall 9.50 7.30 7.30
41.60 18.80 39.60
Strip Mall 9.50 7.30 7.30 16.60 64.40 19.00
Single Family Housing 10.80 7.30 7.50
0.00 95.00 5.00
Refrigerated Warehouse-No Rail 9.50 7.30 7.30 59.00 0.00 41.00
Place of Worship 9.50 7.30 7.30
6.40 88.60 5.00
Medical Office Building 9.50 7.30 7.30 29.60 51.40 19.00
Junior College (2Yr) 9.50 7.30 7.30
6.40 88.60 5.00
Junior College (2Yr) 9.50 7.30 7.30 6.40 88.60 5.00
Junior College (2Yr) 9.50 7.30 7.30
19.40 61.60 19.00
Junior College (2Yr) 9.50 7.30 7.30 6.40 88.60 5.00
Hotel 9.50 7.30 7.30
33.00 62.00 5.00
Government Office Building 9.50 7.30 7.30 33.00 62.00 5.00
Government Office Building 9.50 7.30 7.30
33.00 48.00 19.00
General Office Building 9.50 7.30 7.30 33.00 48.00 19.00
General Office Building 9.50 7.30 7.30
33.00 48.00 19.00
General Office Building 9.50 7.30 7.30 33.00 48.00 19.00
General Office Building 9.50 7.30 7.30
33.00 48.00 19.00
General Office Building 9.50 7.30 7.30 33.00 48.00 19.00
General Office Building 9.50 7.30 7.30
33.00 48.00 19.00
General Office Building 9.50 7.30 7.30 33.00 48.00 19.00
General Office Building 9.50 7.30 7.30
33.00 48.00 19.00
General Office Building 9.50 7.30 7.30 33.00 48.00 19.00
General Office Building 9.50 7.30 7.30
33.00 48.00 19.00
General Office Building 9.50 7.30 7.30 33.00 48.00 19.00
General Office Building 9.50 7.30 7.30
59.00 28.00 13.00
General Light Industry 9.50 7.30 7.30 59.00 28.00 13.00
General Light Industry 9.50 7.30 7.30
65.00 30.00 5.00
Fast Food Restaurant with Drive Thru 9.50 7.30 7.30 2.20 78.80 19.00
Elementary School 9.50 7.30 7.30
33.00 48.00 19.00
Convenience Market With Gas Pumps 9.50 7.30 7.30 0.80 80.20 19.00
Automobile Care Center 9.50 7.30 7.30
H-W or C-W H-S or C-C H-O or C-NW
Apartments Low Rise 10.80 7.30 7.50 41.60 18.80 39.60
Land Use H-W or C-W H-S or C-C H-O or C-NW
4.3 Trip Type Information
Miles Trip %
187,211,168 187,211,168Strip Mall 4,219.50
Total 84,864.86 83,330.76 83,330.764,219.50 4219.50
11,849,223 11,849,2239,566,377 9,566,3776,498,169 6,498,169
Strip Mall 6,211.80 6,211.80 6211.80Single Family Housing 4,149.90 4,149.90 4149.90
5,859,021 5,859,021Place of Worship 116.50
Refrigerated Warehouse-No Rail 2,006.85 2,006.85 2006.85116.50 116.50
399,977 399,9777,446,788 7,446,788217,935 217,935
Medical Office Building 3,804.72 3,804.72 3804.72Junior College (2Yr) 157.50 157.50 157.50
33,141 33,141Junior College (2Yr) 1,942.50Junior College (2Yr) 13.05 13.05 13.05
1,942.50 1942.50
1,158,388 1,158,388408,738 408,738
4,933,051 4,933,051Junior College (2Yr) 160.95 160.95 160.95
Hotel 609.70 609.70 609.701,773,358 1,773,358
Government Office Building 1,485.00Government Office Building 1,034.10 1,034.10 1034.10
1,485.00 1485.00
4,372,053 4,372,0534,229,862 4,229,8622,546,597 2,546,597
General Office Building 1,770.00 1,770.00 1770.00General Office Building 1,829.50 1,829.50 1829.50
624,681 624,681General Office Building 2,744.30General Office Building 261.40 261.40 261.40
2,744.30 2744.30
1,665,658 1,665,658728,636 728,636
6,558,199 6,558,199General Office Building 304.90 304.90 304.90General Office Building 697.00 697.00 697.00
4,059,712 4,059,712General Office Building 96.00General Office Building 1,698.80 1,698.80 1698.80
96.00 96.00
518,576 518,57693,200 93,200
229,416 229,416General Office Building 39.00 39.00 39.00General Office Building 217.00 217.00 217.00
95,590 95,590General Office Building 17.00General Office Building 40.00 40.00 40.00
17.00 17.00
11,758,419 11,758,41972,419,934 72,419,934
40,626 40,626General Light Industry 24,805.50 24,805.50 24805.50General Light Industry 4,027.53 4,027.53 4027.53
10,418,350 10,418,350Elementary School 1,534.10
Fast Food Restaurant with Drive Thru 11,150.67 11,150.67 11150.670.00 0.00
1,171,605 1,171,6051,287,370 1,287,3702,416,141 2,416,141
Convenience Market With Gas Pumps 2,400.00 2,400.00 2400.00Automobile Care Center 1,176.09 1,176.09 1176.09
Annual VMT Annual VMT
Apartments Low Rise 4,144.00 4,144.00 4144.00 11,832,377 11,832,377
Land Use Weekday Saturday Sunday
4.2 Trip Summary Information
Average Daily Trip Rate Unmitigated Mitigated
18 of 25

5,207.82 0.070.34 0.00 5,207.820.00 0.34
0.00 9.240.00 9.18 9.18 0.00
0.07 5,239.54Total 0.49 4.71 3.38 0.02 0.00
0.00 0.00 0.00
0.00 6.28
Strip Mall 172074 0.00 0.01 0.01 0.00 0.00
0.00 6.24 6.24 0.000.00 0.00 0.00
0.02 1,068.27
Strip Mall 116885 0.00 0.01 0.00 0.00 0.00
0.00 1,061.81 1,061.81 0.020.07 0.00 0.07
0.00 148.73
Single Family Housing
1.98976e+007 0.11 0.92 0.39 0.01 0.00
0.00 147.83 147.83 0.000.01 0.00 0.01
0.00 15.37
Refrigerated Warehouse-No Rail
2.77024e+006 0.01 0.14 0.11 0.00 0.00
0.00 15.28 15.28 0.000.00 0.00 0.00
0.00 96.64
Place of Worship 286357 0.00 0.01 0.01 0.00 0.00
0.00 96.05 96.05 0.000.01 0.00 0.01
0.00 19.27
Medical Office Building
1.79998e+006 0.01 0.09 0.07 0.00 0.00
0.00 19.15 19.15 0.000.00 0.00 0.00
0.00 10.15
Junior College (2Yr) 358875 0.00 0.02 0.01 0.00 0.00
0.00 10.09 10.09 0.000.00 0.00 0.00
0.01 321.69
Junior College (2Yr) 189069 0.00 0.01 0.01 0.00 0.00
0.00 319.74 319.74 0.010.02 0.00 0.02
0.00 139.14
Hotel 5.99172e+006 0.03 0.29 0.25 0.00 0.00
0.00 138.30 138.30 0.000.01 0.00 0.01
0.00 96.89
Government Office Building
2.5916e+006 0.01 0.13 0.11 0.00 0.00
0.00 96.31 96.31 0.000.01 0.00 0.01
0.00 5.06
Government Office Building
1.8047e+006 0.01 0.09 0.07 0.00 0.00
0.00 5.03 5.03 0.000.00 0.00 0.00
0.00 4.93
General Office Building
94240 0.00 0.00 0.00 0.00 0.00
0.00 4.90 4.90 0.000.00 0.00 0.00
0.00 38.57
General Office Building
91884 0.00 0.00 0.00 0.00 0.00
0.00 38.33 38.33 0.000.00 0.00 0.00
0.00 33.06
General Office Building
718344 0.00 0.04 0.03 0.00 0.00
0.00 32.86 32.86 0.000.00 0.00 0.00
0.01 347.13
General Office Building
615858 0.00 0.03 0.03 0.00 0.00
0.00 345.03 345.03 0.010.02 0.00 0.02
0.00 27.45
General Office Building
6.46557e+006 0.03 0.32 0.27 0.00 0.00
0.00 27.28 27.28 0.000.00 0.00 0.00
0.00 2.15
General Office Building
511252 0.00 0.03 0.02 0.00 0.00
0.00 2.14 2.14 0.000.00 0.00 0.00
0.00 231.41
General Office Building
40052 0.00 0.00 0.00 0.00 0.00
0.00 230.01 230.01 0.000.02 0.00 0.02
0.00 223.89
General Office Building
4.3103e+006 0.02 0.21 0.18 0.00 0.00
0.00 222.53 222.53 0.000.02 0.00 0.02
0.00 214.88
General Office Building
4.17012e+006 0.02 0.20 0.17 0.00 0.00
0.00 213.58 213.58 0.000.01 0.00 0.01
0.00 12.14
General Office Building
4.00237e+006 0.02 0.20 0.16 0.00 0.00
0.00 12.07 12.07 0.000.00 0.00 0.00
0.00 88.16
General Office Building
226176 0.00 0.01 0.01 0.00 0.00
0.00 87.63 87.63 0.000.01 0.00 0.01
0.00 192.57
General Office Building
1.64213e+006 0.01 0.08 0.07 0.00 0.00
0.00 191.41 191.41 0.000.01 0.00 0.01
0.02 1,186.05
General Light Industry
3.58684e+006 0.02 0.18 0.15 0.00 0.00
0.00 1,178.87 1,178.87 0.020.08 0.00 0.08
0.00 150.86
General Light Industry
2.20913e+007 0.12 1.08 0.91 0.01 0.00
0.00 149.94 149.94 0.000.01 0.00 0.01
0.00 16.34
Fast Food Restaurant with Drive
2.80985e+006 0.02 0.14 0.12 0.00 0.00
0.00 16.24 16.24 0.000.00 0.00 0.00
0.00 0.29
Elementary School 304276 0.00 0.01 0.01 0.00 0.00
0.00 0.29 0.29 0.000.00 0.00 0.00
0.00 39.00
Convenience Market With Gas Pumps
5443.71 0.00 0.00 0.00 0.00 0.00
0.00 38.76 38.76 0.000.00 0.00 0.00
0.01 493.93
Automobile Care Center
726339 0.00 0.04 0.03 0.00 0.00
0.00 490.94 490.94 0.010.03 0.00 0.030.18 0.00 0.00Apartments Low Rise 9.19984e+006 0.05 0.42
N2O CO2e
Land Use kBTU tons/yr MT/yr
Bio- CO2 NBio- CO2 Total CO2 CH4PM10 Total Fugitive PM2.5
Exhaust PM2.5
PM2.5 Total
5.2 Energy by Land Use - NaturalGas
Unmitigated
NaturalGas Use ROG NOx CO SO2 Fugitive PM10
Exhaust PM10
NA NA NA NANA NA NA NA
5,239.54
Total NA NA NA NA NA NA NA NA
5,207.84 5,207.84 0.10 0.100.00 0.36 0.000.03 0.00 0.36NaturalGas Unmitigated
0.53 4.70 3.39
5,207.84 0.10 0.10 5,239.540.00 0.36 0.00 5,207.84
22,396.80
NaturalGas Mitigated 0.53 4.70 3.39 0.03 0.00 0.36
22,282.11 22,282.11 0.83 0.310.00 0.00 0.00
0.31 22,396.80
Electricity Unmitigated
0.00 0.00
0.00 22,282.11 22,282.11 0.830.00 0.00 0.00
Category tons/yr MT/yr
Electricity Mitigated 0.00
Total CO2 CH4 N2O CO2eExhaust PM2.5
PM2.5 Total
Bio- CO2 NBio- CO2ROG NOx CO SO2 Fugitive PM10
Exhaust PM10
PM10 Total Fugitive PM2.5
5.1 Mitigation Measures Energy
5.0 Energy Detail
19 of 25

5,207.82 0.070.34 0.00 5,207.820.00 0.34
0.00 9.240.00 9.18 9.18 0.00
0.07 5,239.54Total 0.49 4.71 3.38 0.02 0.00
0.00 0.00 0.00
0.00 6.28
Strip Mall 172074 0.00 0.01 0.01 0.00 0.00
0.00 6.24 6.24 0.000.00 0.00 0.00
0.02 1,068.27
Strip Mall 116885 0.00 0.01 0.00 0.00 0.00
0.00 1,061.81 1,061.81 0.020.07 0.00 0.07
0.00 148.73
Single Family Housing
1.98976e+007 0.11 0.92 0.39 0.01 0.00
0.00 147.83 147.83 0.000.01 0.00 0.01
0.00 15.37
Refrigerated Warehouse-No Rail
2.77024e+006 0.01 0.14 0.11 0.00 0.00
0.00 15.28 15.28 0.000.00 0.00 0.00
0.00 96.64
Place of Worship 286357 0.00 0.01 0.01 0.00 0.00
0.00 96.05 96.05 0.000.01 0.00 0.01
0.00 19.27
Medical Office Building
1.79998e+006 0.01 0.09 0.07 0.00 0.00
0.00 19.15 19.15 0.000.00 0.00 0.00
0.00 10.15
Junior College (2Yr) 358875 0.00 0.02 0.01 0.00 0.00
0.00 10.09 10.09 0.000.00 0.00 0.00
0.01 321.69
Junior College (2Yr) 189069 0.00 0.01 0.01 0.00 0.00
0.00 319.74 319.74 0.010.02 0.00 0.02
0.00 139.14
Hotel 5.99172e+006 0.03 0.29 0.25 0.00 0.00
0.00 138.30 138.30 0.000.01 0.00 0.01
0.00 96.89
Government Office Building
2.5916e+006 0.01 0.13 0.11 0.00 0.00
0.00 96.31 96.31 0.000.01 0.00 0.01
0.00 5.06
Government Office Building
1.8047e+006 0.01 0.09 0.07 0.00 0.00
0.00 5.03 5.03 0.000.00 0.00 0.00
0.00 4.93
General Office Building
94240 0.00 0.00 0.00 0.00 0.00
0.00 4.90 4.90 0.000.00 0.00 0.00
0.00 38.57
General Office Building
91884 0.00 0.00 0.00 0.00 0.00
0.00 38.33 38.33 0.000.00 0.00 0.00
0.00 33.06
General Office Building
718344 0.00 0.04 0.03 0.00 0.00
0.00 32.86 32.86 0.000.00 0.00 0.00
0.01 347.13
General Office Building
615858 0.00 0.03 0.03 0.00 0.00
0.00 345.03 345.03 0.010.02 0.00 0.02
0.00 27.45
General Office Building
6.46557e+006 0.03 0.32 0.27 0.00 0.00
0.00 27.28 27.28 0.000.00 0.00 0.00
0.00 2.15
General Office Building
511252 0.00 0.03 0.02 0.00 0.00
0.00 2.14 2.14 0.000.00 0.00 0.00
0.00 231.41
General Office Building
40052 0.00 0.00 0.00 0.00 0.00
0.00 230.01 230.01 0.000.02 0.00 0.02
0.00 223.89
General Office Building
4.3103e+006 0.02 0.21 0.18 0.00 0.00
0.00 222.53 222.53 0.000.02 0.00 0.02
0.00 214.88
General Office Building
4.17012e+006 0.02 0.20 0.17 0.00 0.00
0.00 213.58 213.58 0.000.01 0.00 0.01
0.00 12.14
General Office Building
4.00237e+006 0.02 0.20 0.16 0.00 0.00
0.00 12.07 12.07 0.000.00 0.00 0.00
0.00 88.16
General Office Building
226176 0.00 0.01 0.01 0.00 0.00
0.00 87.63 87.63 0.000.01 0.00 0.01
0.00 192.57
General Office Building
1.64213e+006 0.01 0.08 0.07 0.00 0.00
0.00 191.41 191.41 0.000.01 0.00 0.01
0.02 1,186.05
General Light Industry
3.58684e+006 0.02 0.18 0.15 0.00 0.00
0.00 1,178.87 1,178.87 0.020.08 0.00 0.08
0.00 150.86
General Light Industry
2.20913e+007 0.12 1.08 0.91 0.01 0.00
0.00 149.94 149.94 0.000.01 0.00 0.01
0.00 16.34
Fast Food Restaurant with Drive
2.80985e+006 0.02 0.14 0.12 0.00 0.00
0.00 16.24 16.24 0.000.00 0.00 0.00
0.00 0.29
Elementary School 304276 0.00 0.01 0.01 0.00 0.00
0.00 0.29 0.29 0.000.00 0.00 0.00
0.00 39.00
Convenience Market With Gas Pumps
5443.71 0.00 0.00 0.00 0.00 0.00
0.00 38.76 38.76 0.000.00 0.00 0.00
0.01 493.93
Automobile Care Center
726339 0.00 0.04 0.03 0.00 0.00
0.00 490.94 490.94 0.010.03 0.00 0.030.18 0.00 0.00Apartments Low Rise 9.19984e+006 0.05 0.42
N2O CO2e
Land Use kBTU tons/yr MT/yr
Bio- CO2 NBio- CO2 Total CO2 CH4PM10 Total Fugitive PM2.5
Exhaust PM2.5
PM2.5 TotalCO SO2 Fugitive PM10
Exhaust PM10
NaturalGas Use ROG NOx
Mitigated
20 of 25

0.30 22,396.78
0.00 255.35
Total 22,282.11 0.83
0.01 375.92
Strip Mall 717315 254.04 0.01
0.02 1,111.47
Strip Mall 1.05601e+006 374.00 0.01
0.07 4,890.17
Single Family Housing
3.12225e+006 1,105.78 0.04
0.00 77.80
Refrigerated Warehouse-No Rail
1.37371e+007 4,865.13 0.18
0.01 428.08
Place of Worship 218554 77.40 0.00
0.00 33.36
Medical Office Building
1.20254e+006 425.89 0.02
0.00 17.57
Junior College (2Yr) 93699 33.18 0.00
0.01 532.98
Junior College (2Yr) 49364.1 17.48 0.00
0.01 616.35
Hotel 1.4972e+006 530.25 0.02
0.01 429.20
Government Office Building
1.7314e+006 613.19 0.02
0.00 22.41
Government Office Building
1.20568e+006 427.01 0.02
0.00 21.85
General Office Building
62960 22.30 0.00
0.00 170.84
General Office Building
61386 21.74 0.00
0.00 146.47
General Office Building
479913 169.97 0.01
0.02 1,537.68
General Office Building
411444 145.72 0.01
0.00 121.59
General Office Building
4.31953e+006 1,529.81 0.06
0.00 9.53
General Office Building
341558 120.97 0.00
0.01 1,025.10
General Office Building
26758 9.48 0.00
0.01 991.76
General Office Building
2.87963e+006 1,019.85 0.04
0.01 951.87
General Office Building
2.78598e+006 986.68 0.04
0.00 53.79
General Office Building
2.67391e+006 946.99 0.04
0.01 390.54
General Office Building
151104 53.52 0.00
0.01 974.52
General Office Building
1.09708e+006 388.54 0.01
0.08 6,002.08
General Light Industry
2.73755e+006 969.53 0.04
0.00 240.84
General Light Industry
1.68606e+007 5,971.34 0.22
0.00 99.97
Fast Food Restaurant with Drive
676545 239.61 0.01
0.00 11.89
Elementary School 280836 99.46 0.00
0.00 197.34
Convenience Market With Gas Pumps
33407.7 11.83 0.00
0.01 658.46
Automobile Care Center
554358 196.33 0.01
655.09 0.02Apartments Low Rise 1.84971e+006
N2O CO2e
Land Use kWh tons/yr MT/yr
CO SO2 Total CO2 CH4Electricity Use ROG NOx
5.3 Energy by Land Use - Electricity
Unmitigated
21 of 25

NANANA NA NA NA NA NA NANA NA NA NATotal NA NA NA
2,333.12 0.98 0.10 2,383.650.00 10.90 1,027.79 1,305.33
2,383.65
Unmitigated 91.04 0.94 84.77 0.03 0.00 10.91
1,305.33 2,333.12 0.98 0.100.00 10.90 1,027.790.03 0.00 10.91Mitigated 91.04 0.94 84.77
CO2e
Category tons/yr MT/yr
NBio- CO2 Total CO2 CH4 N2OFugitive PM2.5
Exhaust PM2.5
PM2.5 Total
Bio- CO2SO2 Fugitive PM10
Exhaust PM10
PM10 TotalROG NOx CO
6.1 Mitigation Measures Area
0.30 22,396.78
6.0 Area Detail
0.00 255.35
Total 22,282.11 0.83
0.01 375.92
Strip Mall 717315 254.04 0.01
0.02 1,111.47
Strip Mall 1.05601e+006 374.00 0.01
0.07 4,890.17
Single Family Housing
3.12225e+006 1,105.78 0.04
0.00 77.80
Refrigerated Warehouse-No Rail
1.37371e+007 4,865.13 0.18
0.01 428.08
Place of Worship 218554 77.40 0.00
0.00 33.36
Medical Office Building
1.20254e+006 425.89 0.02
0.00 17.57
Junior College (2Yr) 93699 33.18 0.00
0.01 532.98
Junior College (2Yr) 49364.1 17.48 0.00
0.01 616.35
Hotel 1.4972e+006 530.25 0.02
0.01 429.20
Government Office Building
1.7314e+006 613.19 0.02
0.00 22.41
Government Office Building
1.20568e+006 427.01 0.02
0.00 21.85
General Office Building
62960 22.30 0.00
0.00 170.84
General Office Building
61386 21.74 0.00
0.00 146.47
General Office Building
479913 169.97 0.01
0.02 1,537.68
General Office Building
411444 145.72 0.01
0.00 121.59
General Office Building
4.31953e+006 1,529.81 0.06
0.00 9.53
General Office Building
341558 120.97 0.00
0.01 1,025.10
General Office Building
26758 9.48 0.00
0.01 991.76
General Office Building
2.87963e+006 1,019.85 0.04
0.01 951.87
General Office Building
2.78598e+006 986.68 0.04
0.00 53.79
General Office Building
2.67391e+006 946.99 0.04
0.01 390.54
General Office Building
151104 53.52 0.00
0.01 974.52
General Office Building
1.09708e+006 388.54 0.01
0.08 6,002.08
General Light Industry
2.73755e+006 969.53 0.04
0.00 240.84
General Light Industry
1.68606e+007 5,971.34 0.22
0.00 99.97
Fast Food Restaurant with Drive
676545 239.61 0.01
0.00 11.89
Elementary School 280836 99.46 0.00
0.00 197.34
Convenience Market With Gas Pumps
33407.7 11.83 0.00
0.01 658.46
Automobile Care Center
554358 196.33 0.01
655.09 0.02Apartments Low Rise 1.84971e+006
N2O CO2e
Land Use kWh tons/yr MT/yr
CO SO2 Total CO2 CH4Electricity Use ROG NOx
Mitigated
22 of 25

10.29 69,851.41
0.01 70.57
Total 58,590.52 384.21
0.03 249.11
Strip Mall 8.8813 / 5.44337 62.47 0.27
1.59 10,684.36
Single Family Housing
31.0785 / 19.5929
220.76 0.96
0.00 8.54
Refrigerated Warehouse-No Rail
1934.82 / 0 8,944.15 59.39
0.01 60.16
Place of Worship 0.729032 / 1.14028
7.86 0.02
0.00 5.00
Medical Office Building
9.58671 / 1.82604
51.50 0.29
0.00 2.63
Junior College (2Yr) 0.426727 / 0.667444
4.60 0.01
0.00 10.13
Junior College (2Yr) 0.224816 / 0.351635
2.42 0.01
0.03 294.56
Hotel 1.69957 / 0.188842
8.60 0.05
0.15 1,372.04
Government Office Building
37.0699 / 22.7203
260.76 1.14
8.44 56,730.29
General Office Building
172.667 / 105.828
1,214.60 5.32
0.00 27.87
General Light Industry
10273.2 / 0 47,490.35 315.34
0.00 20.12
Fast Food Restaurant with Drive
4.82619 / 0.308054
23.52 0.15
0.00 1.33
Elementary School 1.28242 / 3.29766
18.90 0.04
0.00 44.18
Convenience Market With Gas Pumps
0.167315 / 0.102548
1.18 0.01
0.03 270.52
Automobile Care Center
5.56019 / 3.40786
39.11 0.17
239.74 1.04Apartments Low Rise 33.7498 / 21.277
CH4 N2O CO2e
Land Use Mgal tons/yr MT/yr
NA
7.2 Water by Land Use
Unmitigated
Indoor/Outdoor Use
ROG NOx CO SO2 Total CO2
NA NA NA NATotal NA NA NA
69,851.42
Unmitigated 58,590.51 384.21 10.30 69,851.42
58,590.51 384.21 10.30Mitigated
N2O CO2e
Category tons/yr MT/yr
ROG NOx CO SO2 Total CO2 CH4
2,383.65
7.0 Water Detail
7.1 Mitigation Measures Water
1,305.33 2,333.13 0.98 0.100.00 10.90 1,027.790.03 0.00 10.91Total 91.04 0.94 84.77
12.21 0.01 0.00 12.510.00 0.04 0.00 12.21
2,371.14
Landscaping 0.27 0.09 7.86 0.00 0.00 0.04
1,293.12 2,320.92 0.97 0.100.00 10.86 1,027.790.03 0.00 10.87Hearth 62.52 0.85 76.91
0.00 0.00 0.00 0.000.00 0.00 0.00 0.00
0.00
Consumer Products 21.36 0.00 0.00
0.00 0.00 0.00 0.000.00 0.00 0.000.00 0.00Architectural Coating 6.89
SubCategory tons/yr MT/yr
Bio- CO2 NBio- CO2 Total CO2 CH4PM10 Total PM2.5 Total
2,383.65
Mitigated
ROG NOx CO N2O CO2eSO2 Fugitive PM10
Exhaust PM10
1,305.330.03 0.00 10.91
Fugitive PM2.5
Exhaust PM2.5
2,333.13 0.98 0.100.00 10.90 1,027.79Total 91.04 0.94 84.77
12.21 0.01 0.00 12.510.00 0.04 0.00 12.21
2,371.14
Landscaping 0.27 0.09 7.86 0.00 0.00 0.04
1,293.12 2,320.92 0.97 0.100.00 10.86 1,027.790.03 0.00 10.87Hearth 62.52 0.85 76.91
0.00 0.00 0.00 0.000.00 0.00 0.00 0.00
0.00
Consumer Products 21.36 0.00 0.00
0.00 0.00 0.00 0.000.00 0.00 0.000.00 0.00Architectural Coating 6.89
SubCategory tons/yr MT/yr
Bio- CO2 NBio- CO2 Total CO2 CH4PM10 Total PM2.5 Total
6.2 Area by SubCategory
Unmitigated
ROG NOx CO N2O CO2eSO2 Fugitive PM10
Exhaust PM10
Fugitive PM2.5
Exhaust PM2.5
23 of 25

0.00 58,837.20
0.00 57.27
Total 26,254.15 1,551.58
0.00 254.41
Strip Mall 125.9 25.56 1.51
0.00 1,933.30
Single Family Housing
559.24 113.52 6.71
0.00 60.42
Refrigerated Warehouse-No Rail
4249.8 862.67 50.98
0.00 375.36
Place of Worship 132.81 26.96 1.59
0.00 8.72
Medical Office Building
825.12 167.49 9.90
0.00 5.15
Junior College (2Yr) 19.16 3.89 0.23
0.00 16.69
Junior College (2Yr) 11.31 2.30 0.14
0.00 78.95
Hotel 36.68 7.45 0.44
0.00 411.01
Government Office Building
173.54 35.23 2.08
0.00 55,297.58
General Office Building
903.49 183.40 10.84
0.00 83.32
General Light Industry
121556 24,674.70 1,458.23
0.00 43.92
Fast Food Restaurant with Drive
183.15 37.18 2.20
0.00 102.70
Elementary School 96.54 19.60 1.16
0.00 108.40
Automobile Care Center
225.76 45.83 2.71
48.37 2.86Apartments Low Rise 238.28
CH4 N2O CO2e
Land Use tons tons/yr MT/yr
NA
8.2 Waste by Land Use
Unmitigated
Waste Disposed ROG NOx CO SO2 Total CO2
NA NA NA NATotal NA NA NA
58,837.18
Unmitigated 26,254.12 1,551.57 0.00 58,837.18
26,254.12 1,551.57 0.00 Mitigated
tons/yr MT/yr
SO2 Total CO2 CH4 N2OROG NOx CO
8.1 Mitigation Measures Waste
Category/Year
CO2e
10.29 69,851.41
8.0 Waste Detail
0.01 70.57
Total 58,590.52 384.21
0.03 249.11
Strip Mall 8.8813 / 5.44337 62.47 0.27
1.59 10,684.36
Single Family Housing
31.0785 / 19.5929
220.76 0.96
0.00 8.54
Refrigerated Warehouse-No Rail
1934.82 / 0 8,944.15 59.39
0.01 60.16
Place of Worship 0.729032 / 1.14028
7.86 0.02
0.00 5.00
Medical Office Building
9.58671 / 1.82604
51.50 0.29
0.00 2.63
Junior College (2Yr) 0.426727 / 0.667444
4.60 0.01
0.00 10.13
Junior College (2Yr) 0.224816 / 0.351635
2.42 0.01
0.03 294.56
Hotel 1.69957 / 0.188842
8.60 0.05
0.15 1,372.04
Government Office Building
37.0699 / 22.7203
260.76 1.14
8.44 56,730.29
General Office Building
172.667 / 105.828
1,214.60 5.32
0.00 27.87
General Light Industry
10273.2 / 0 47,490.35 315.34
0.00 20.12
Fast Food Restaurant with Drive
4.82619 / 0.308054
23.52 0.15
0.00 1.33
Elementary School 1.28242 / 3.29766
18.90 0.04
0.00 44.18
Convenience Market With Gas Pumps
0.167315 / 0.102548
1.18 0.01
0.03 270.52
Automobile Care Center
5.56019 / 3.40786
39.11 0.17
239.74 1.04Apartments Low Rise 33.7498 / 21.277
N2O CO2e
Land Use Mgal tons/yr MT/yr
CO SO2 Total CO2 CH4Indoor/Outdoor Use
ROG NOx
Mitigated
24 of 25
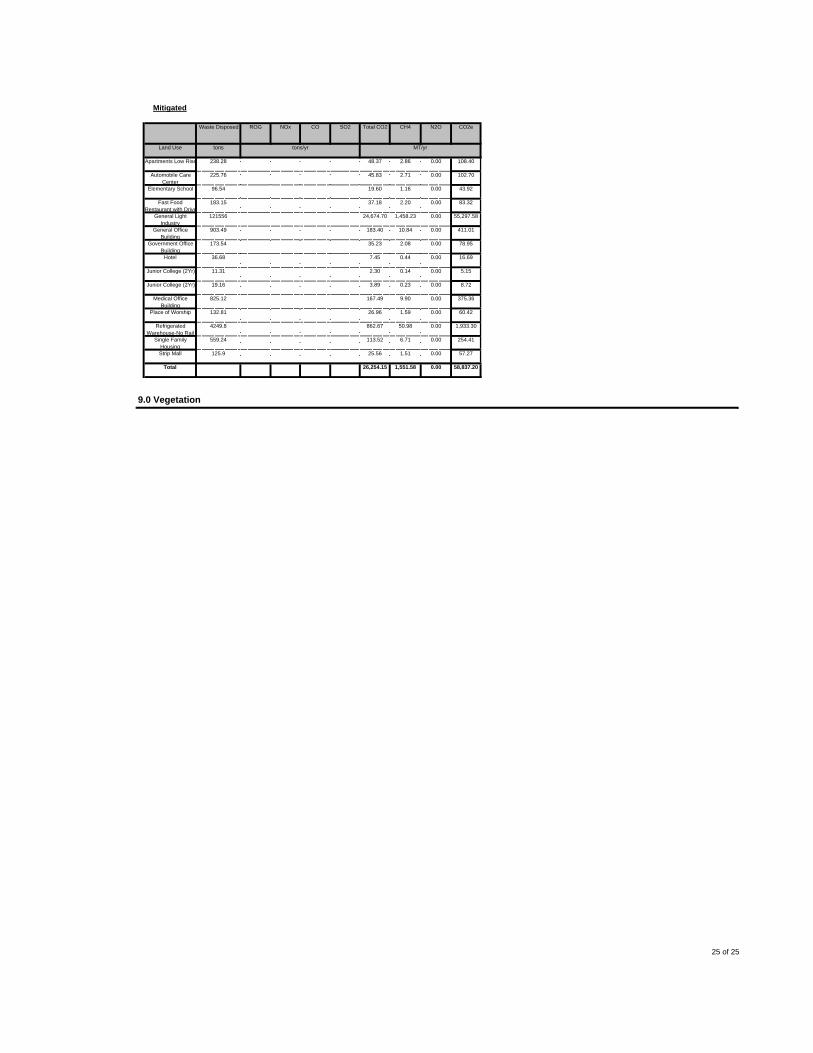
0.00 58,837.20
9.0 Vegetation
0.00 57.27
Total 26,254.15 1,551.58
0.00 254.41
Strip Mall 125.9 25.56 1.51
0.00 1,933.30
Single Family Housing
559.24 113.52 6.71
0.00 60.42
Refrigerated Warehouse-No Rail
4249.8 862.67 50.98
0.00 375.36
Place of Worship 132.81 26.96 1.59
0.00 8.72
Medical Office Building
825.12 167.49 9.90
0.00 5.15
Junior College (2Yr) 19.16 3.89 0.23
0.00 16.69
Junior College (2Yr) 11.31 2.30 0.14
0.00 78.95
Hotel 36.68 7.45 0.44
0.00 411.01
Government Office Building
173.54 35.23 2.08
0.00 55,297.58
General Office Building
903.49 183.40 10.84
0.00 83.32
General Light Industry
121556 24,674.70 1,458.23
0.00 43.92
Fast Food Restaurant with Drive
183.15 37.18 2.20
0.00 102.70
Elementary School 96.54 19.60 1.16
0.00 108.40
Automobile Care Center
225.76 45.83 2.71
48.37 2.86Apartments Low Rise 238.28
N2O CO2e
Land Use tons tons/yr MT/yr
CO SO2 Total CO2 CH4Waste Disposed ROG NOx
Mitigated
25 of 25

BAU – ALTERNATIVE 1
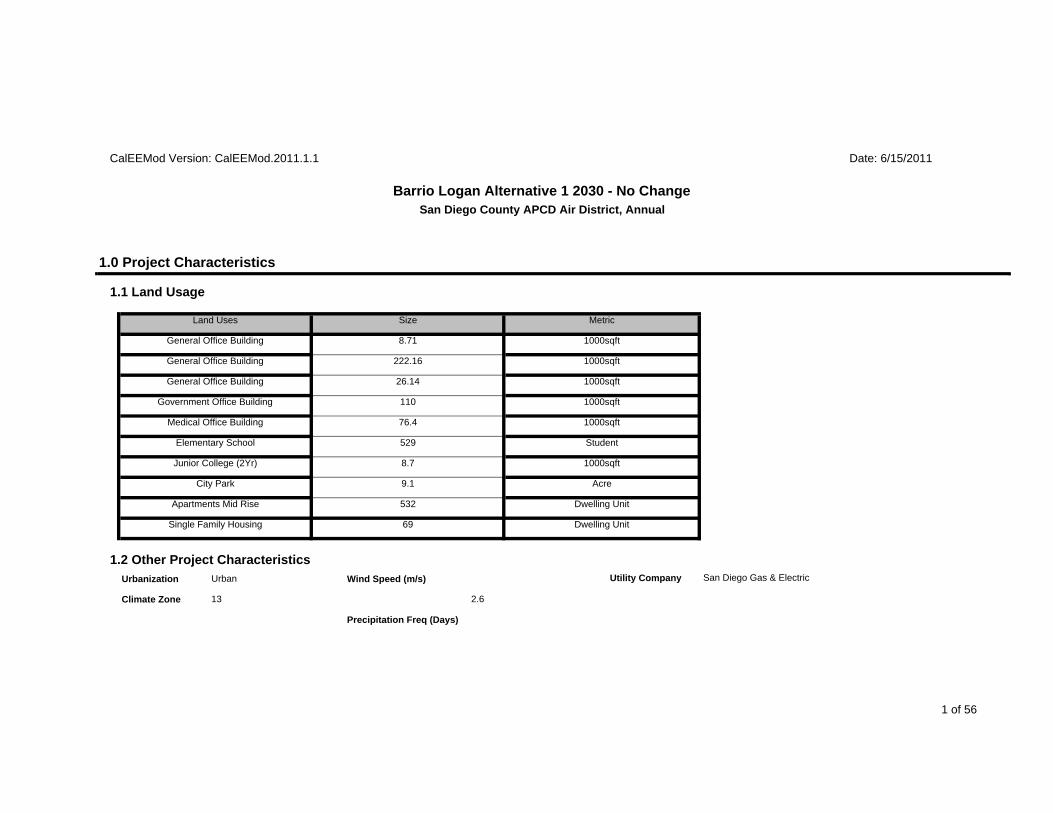
CalEEMod Version: CalEEMod.2011.1.1 Date: 6/15/2011
Barrio Logan Alternative 1 2030 - No ChangeSan Diego County APCD Air District, Annual
1.0 Project Characteristics
1.1 Land Usage
Land Uses Size Metric
General Office Building 8.71 1000sqft
General Office Building 222.16 1000sqft
General Office Building 26.14 1000sqft
Government Office Building 110 1000sqft
Medical Office Building 76.4 1000sqft
Elementary School 529 Student
Junior College (2Yr) 8.7 1000sqft
City Park 9.1 Acre
Apartments Mid Rise 532 Dwelling Unit
Single Family Housing 69 Dwelling Unit
1.2 Other Project CharacteristicsUtility Company San Diego Gas & ElectricUrbanization Urban Wind Speed (m/s)
Climate Zone 13 2.6
Precipitation Freq (Days)
1 of 56
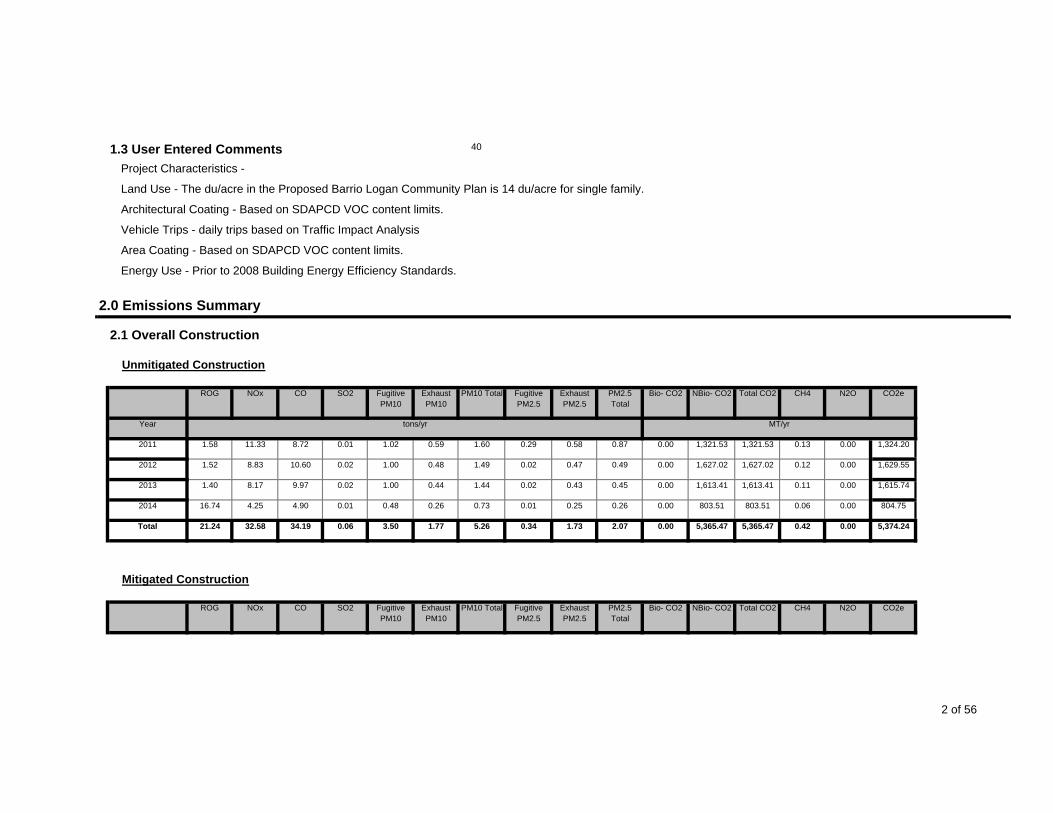
1.3 User Entered Comments 40
Project Characteristics -
Land Use - The du/acre in the Proposed Barrio Logan Community Plan is 14 du/acre for single family.
Architectural Coating - Based on SDAPCD VOC content limits.
Vehicle Trips - daily trips based on Traffic Impact Analysis
Area Coating - Based on SDAPCD VOC content limits.
Energy Use - Prior to 2008 Building Energy Efficiency Standards.
2.0 Emissions Summary
2.1 Overall Construction
Unmitigated Construction
ROG NOx CO PM2.5 Total
Bio- CO2SO2 Fugitive PM10
Exhaust PM10
PM10 Total CO2e
Year tons/yr MT/yr
NBio- CO2 Total CO2 CH4 N2OFugitive PM2.5
Exhaust PM2.5
2011 1.58 11.33 8.72 0.01 1.02 0.59 1.60 0.29 0.58 0.87 0.00 1,321.53 1,321.53 0.13 0.00 1,324.20
2012 1.52 8.83 10.60 0.02 1.00 0.48 1.49 0.02 0.47 0.49 0.00 1,627.02 1,627.02 0.12 0.00 1,629.55
2013 1.40 8.17 9.97 0.02 1.00 0.44 1.44 0.02 0.43 0.45 0.00 1,613.41 1,613.41 0.11 0.00 1,615.74
2014 16.74 4.25 4.90 0.01 0.48 0.26 0.73 0.01 0.25 0.26 0.00 803.51 803.51 0.06 0.00 804.75
Total 21.24 32.58 34.19 5,365.47 0.42 0.000.34 1.73 2.07 0.00
SO2 Fugitive PM10
Exhaust PM10
5,365.470.06 3.50 1.77 5.26
Fugitive PM2.5
Exhaust PM2.5
PM2.5 Total
5,374.24
Mitigated Construction
ROG NOx CO N2O CO2eBio- CO2 NBio- CO2 Total CO2 CH4PM10 Total
2 of 56
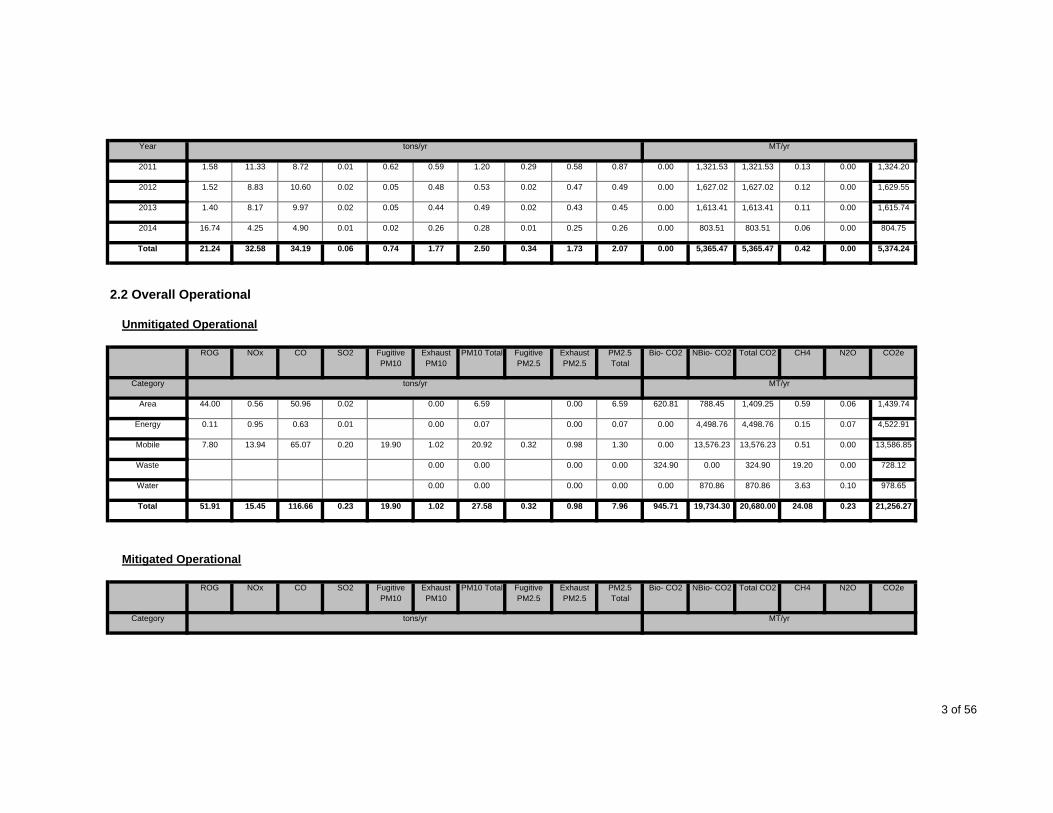
Year tons/yr MT/yr
2011 1.58 11.33 8.72 0.01 0.62 0.59 1.20 0.29 0.58 0.87 0.00 1,321.53 1,321.53 0.13 0.00 1,324.20
2012 1.52 8.83 10.60 0.02 0.05 0.48 0.53 0.02 0.47 0.49 0.00 1,627.02 1,627.02 0.12 0.00 1,629.55
2013 1.40 8.17 9.97 0.02 0.05 0.44 0.49 0.02 0.43 0.45 0.00 1,613.41 1,613.41 0.11 0.00 1,615.74
2014 16.74 4.25 4.90 0.01 0.02 0.26 0.28 0.01 0.25 0.26 0.00 803.51 803.51 0.06 0.00 804.75
Total 21.24 32.58 34.19 5,365.47 0.42 0.000.34 1.73 2.07 0.00
SO2 Fugitive PM10
Exhaust PM10
5,365.470.06 0.74 1.77 2.50
Fugitive PM2.5
Exhaust PM2.5
PM2.5 Total
5,374.24
2.2 Overall Operational
Unmitigated Operational
ROG NOx CO N2O CO2e
Category tons/yr MT/yr
Bio- CO2 NBio- CO2 Total CO2 CH4PM10 Total
Area 44.00 0.56 50.96 0.02 0.00 6.59 0.00 6.59 620.81 788.45 1,409.25 0.59 0.06 1,439.74
Energy 0.11 0.95 0.63 0.01 0.00 0.07 0.00 0.07 0.00 4,498.76 4,498.76 0.15 0.07 4,522.91
Mobile 7.80 13.94 65.07 0.20 19.90 1.02 20.92 0.32 0.98 1.30 0.00 13,576.23 13,576.23 0.51 0.00 13,586.85
Waste 0.00 0.00 0.00 0.00 324.90 0.00 324.90 19.20 0.00 728.12
Water 0.00 0.00 0.00 0.00 0.00 870.86 870.86 3.63 0.10 978.65
Total 51.91 15.45 116.66 0.23 19.90 1.02 27.58 0.32 0.23 21,256.270.98 7.96 945.71 19,734.30
Exhaust PM10
PM10 Total
20,680.00 24.08
PM2.5 Total
Bio- CO2
Mitigated Operational
ROG NOx CO SO2 Fugitive PM10
CO2e
Category tons/yr MT/yr
NBio- CO2 Total CO2 CH4 N2OFugitive PM2.5
Exhaust PM2.5
3 of 56
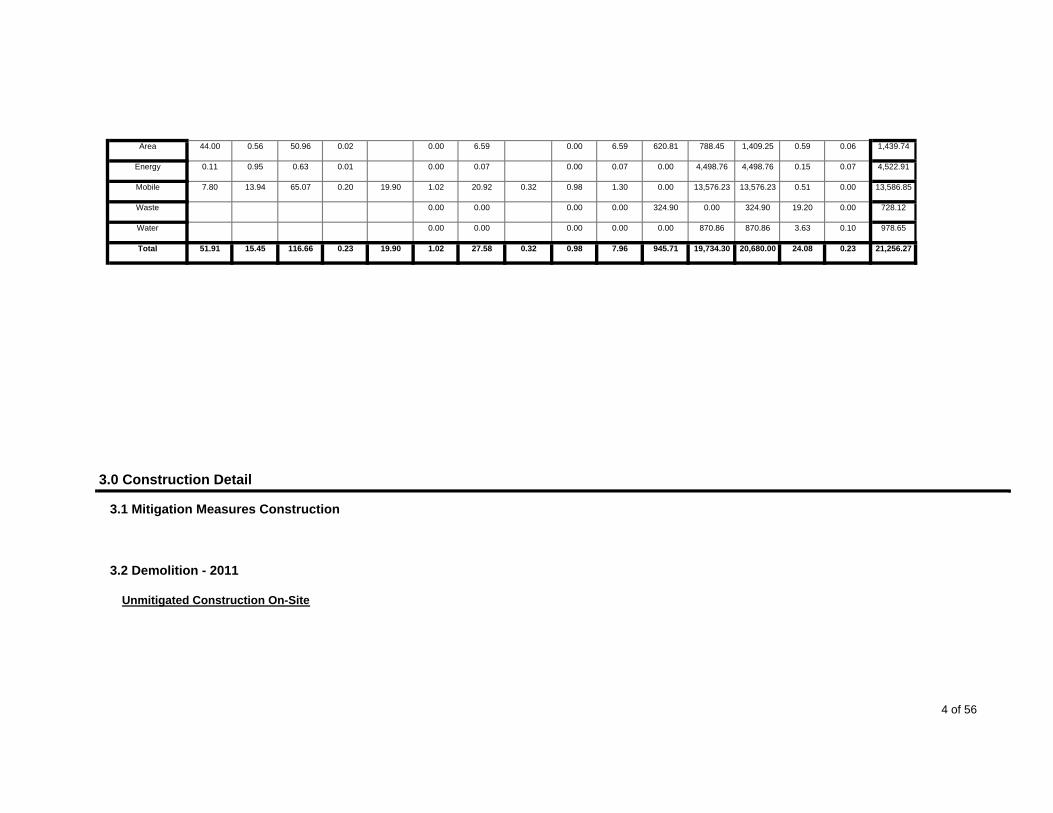
Area 44.00 0.56 50.96 0.02 0.00 6.59 0.00 6.59 620.81 788.45 1,409.25 0.59 0.06 1,439.74
Energy 0.11 0.95 0.63 0.01 0.00 0.07 0.00 0.07 0.00 4,498.76 4,498.76 0.15 0.07 4,522.91
Mobile 7.80 13.94 65.07 0.20 19.90 1.02 20.92 0.32 0.98 1.30 0.00 13,576.23 13,576.23 0.51 0.00 13,586.85
Waste 0.00 0.00 0.00 0.00 324.90 0.00 324.90 19.20 0.00 728.12
Water 0.00 0.00 0.00 0.00 0.00 870.86 870.86 3.63 0.10 978.65
Total 51.91 15.45 116.66 0.23 19.90 1.02 27.58 0.32 0.98 7.96 945.71 19,734.30 20,680.00 24.08 0.23 21,256.27
3.0 Construction Detail
3.1 Mitigation Measures Construction
3.2 Demolition - 2011
Unmitigated Construction On-Site
4 of 56

SO2 Fugitive PM10
Exhaust PM10
Fugitive PM2.5
Exhaust PM2.5
PM2.5 Total
ROG NOx CO N2O CO2e
Category tons/yr MT/yr
Bio- CO2 NBio- CO2 Total CO2 CH4PM10 Total
Off-Road 0.25 2.00 1.15 0.00 0.10 0.10 0.10 0.10 0.00 170.30 170.30 0.02 0.00 170.72
Total 0.25 2.00 1.15 0.00 0.10 0.10 0.00 170.720.10 0.10 0.00 170.30
Exhaust PM10
PM10 Total
170.30 0.02
PM2.5 Total
Bio- CO2
Unmitigated Construction Off-Site
ROG NOx CO SO2 Fugitive PM10
CO2e
Category tons/yr MT/yr
NBio- CO2 Total CO2 CH4 N2OFugitive PM2.5
Exhaust PM2.5
Hauling 0.00 0.00 0.00 0.00 0.00 0.00 0.00 0.00 0.00 0.00 0.00 0.00 0.00 0.00 0.00 0.00
Vendor 0.00 0.00 0.00 0.00 0.00 0.00 0.00 0.00 0.00 0.00 0.00 0.00 0.00 0.00 0.00 0.00
Worker 0.00 0.00 0.03 0.00 0.00 0.00 0.00 0.00 0.00 0.00 0.00 3.49 3.49 0.00 0.00 3.50
Total 0.00 0.00 0.03 0.00 0.00 0.00 0.00 0.00 0.00 3.500.00 0.00 0.00 3.49
Exhaust PM10
PM10 Total
3.49 0.00
PM2.5 Total
Bio- CO2
Mitigated Construction On-Site
ROG NOx CO SO2 Fugitive PM10
CO2e
Category tons/yr MT/yr
NBio- CO2 Total CO2 CH4 N2OFugitive PM2.5
Exhaust PM2.5
Off-Road 0.25 2.00 1.15 0.00 0.10 0.10 0.10 0.10 0.00 170.30 170.30 0.02 0.00 170.72
Total 0.25 2.00 1.15 0.00 0.10 0.10 0.00 170.720.10 0.10 0.00 170.30 170.30 0.02
5 of 56

Exhaust PM10
PM10 Total PM2.5 Total
Bio- CO2
Mitigated Construction Off-Site
ROG NOx CO SO2 Fugitive PM10
CO2e
Category tons/yr MT/yr
NBio- CO2 Total CO2 CH4 N2OFugitive PM2.5
Exhaust PM2.5
Hauling 0.00 0.00 0.00 0.00 0.00 0.00 0.00 0.00 0.00 0.00 0.00 0.00 0.00 0.00 0.00 0.00
Vendor 0.00 0.00 0.00 0.00 0.00 0.00 0.00 0.00 0.00 0.00 0.00 0.00 0.00 0.00 0.00 0.00
Worker 0.00 0.00 0.03 0.00 0.00 0.00 0.00 0.00 0.00 0.00 0.00 3.49 3.49 0.00 0.00 3.50
Total 0.00 0.00 0.03 0.00 0.00 0.00 0.00 0.00 0.00 3.500.00 0.00 0.00 3.49
Exhaust PM10
PM10 Total
3.49 0.00
PM2.5 Total
Bio- CO2
3.3 Site Preparation - 2011
Unmitigated Construction On-Site
ROG NOx CO SO2 Fugitive PM10
CO2e
Category tons/yr MT/yr
NBio- CO2 Total CO2 CH4 N2OFugitive PM2.5
Exhaust PM2.5
Fugitive Dust 0.27 0.00 0.27 0.15 0.00 0.15 0.00 0.00 0.00 0.00 0.00 0.00
Off-Road 0.16 1.35 0.76 0.00 0.07 0.07 0.07 0.07 0.00 108.80 108.80 0.01 0.00 109.08
Total 0.16 1.35 0.76 108.80 0.01 0.000.15 0.07 0.22 0.00
SO2 Fugitive PM10
Exhaust PM10
108.800.00 0.27 0.07 0.34
Fugitive PM2.5
Exhaust PM2.5
PM2.5 Total
109.08
Unmitigated Construction Off-Site
ROG NOx CO N2O CO2e
Category tons/yr MT/yr
Bio- CO2 NBio- CO2 Total CO2 CH4PM10 Total
Hauling 0.00 0.00 0.00 0.00 0.00 0.00 0.00 0.00 0.00 0.00 0.00 0.00 0.00 0.00 0.00 0.00
Vendor 0.00 0.00 0.00 0.00 0.00 0.00 0.00 0.00 0.00 0.00 0.00 0.00 0.00 0.00 0.00 0.00
6 of 56

Worker 0.00 0.00 0.02 0.00 0.00 0.00 0.00 0.00 0.00 0.00 0.00 2.51 2.51 0.00 0.00 2.52
Total 0.00 0.00 0.02 0.00 0.00 0.00 0.00 0.00 0.00 2.520.00 0.00 0.00 2.51
Exhaust PM10
PM10 Total
2.51 0.00
PM2.5 Total
Bio- CO2
Mitigated Construction On-Site
ROG NOx CO SO2 Fugitive PM10
CO2e
Category tons/yr MT/yr
NBio- CO2 Total CO2 CH4 N2OFugitive PM2.5
Exhaust PM2.5
Fugitive Dust 0.27 0.00 0.27 0.15 0.00 0.15 0.00 0.00 0.00 0.00 0.00 0.00
Off-Road 0.16 1.35 0.76 0.00 0.07 0.07 0.07 0.07 0.00 108.80 108.80 0.01 0.00 109.08
Total 0.16 1.35 0.76 108.80 0.01 0.000.15 0.07 0.22 0.00
SO2 Fugitive PM10
Exhaust PM10
108.800.00 0.27 0.07 0.34
Fugitive PM2.5
Exhaust PM2.5
PM2.5 Total
109.08
Mitigated Construction Off-Site
ROG NOx CO N2O CO2e
Category tons/yr MT/yr
Bio- CO2 NBio- CO2 Total CO2 CH4PM10 Total
Hauling 0.00 0.00 0.00 0.00 0.00 0.00 0.00 0.00 0.00 0.00 0.00 0.00 0.00 0.00 0.00 0.00
Vendor 0.00 0.00 0.00 0.00 0.00 0.00 0.00 0.00 0.00 0.00 0.00 0.00 0.00 0.00 0.00 0.00
Worker 0.00 0.00 0.02 0.00 0.00 0.00 0.00 0.00 0.00 0.00 0.00 2.51 2.51 0.00 0.00 2.52
Total 0.00 0.00 0.02 0.00 0.00 0.00 0.00 0.00 0.00 2.520.00 0.00 0.00 2.51
Exhaust PM10
PM10 Total
2.51 0.00
PM2.5 Total
Bio- CO2
3.4 Grading - 2011
Unmitigated Construction On-Site
ROG NOx CO SO2 Fugitive PM10
CO2eNBio- CO2 Total CO2 CH4 N2OFugitive PM2.5
Exhaust PM2.5
7 of 56

Category tons/yr MT/yr
Fugitive Dust 0.33 0.00 0.33 0.13 0.00 0.13 0.00 0.00 0.00 0.00 0.00 0.00
Off-Road 0.49 4.15 2.16 0.00 0.20 0.20 0.20 0.20 0.00 369.24 369.24 0.04 0.00 370.08
Total 0.49 4.15 2.16 369.24 0.04 0.000.13 0.20 0.33 0.00
SO2 Fugitive PM10
Exhaust PM10
369.240.00 0.33 0.20 0.53
Fugitive PM2.5
Exhaust PM2.5
PM2.5 Total
370.08
Unmitigated Construction Off-Site
ROG NOx CO N2O CO2e
Category tons/yr MT/yr
Bio- CO2 NBio- CO2 Total CO2 CH4PM10 Total
Hauling 0.00 0.00 0.00 0.00 0.00 0.00 0.00 0.00 0.00 0.00 0.00 0.00 0.00 0.00 0.00 0.00
Vendor 0.00 0.00 0.00 0.00 0.00 0.00 0.00 0.00 0.00 0.00 0.00 0.00 0.00 0.00 0.00 0.00
Worker 0.01 0.01 0.06 0.00 0.01 0.00 0.01 0.00 0.00 0.00 0.00 6.98 6.98 0.00 0.00 6.99
Total 0.01 0.01 0.06 0.00 0.01 0.00 0.01 0.00 0.00 6.990.00 0.00 0.00 6.98
Exhaust PM10
PM10 Total
6.98 0.00
PM2.5 Total
Bio- CO2
Mitigated Construction On-Site
ROG NOx CO SO2 Fugitive PM10
CO2e
Category tons/yr MT/yr
NBio- CO2 Total CO2 CH4 N2OFugitive PM2.5
Exhaust PM2.5
Fugitive Dust 0.33 0.00 0.33 0.13 0.00 0.13 0.00 0.00 0.00 0.00 0.00 0.00
Off-Road 0.49 4.15 2.16 0.00 0.20 0.20 0.20 0.20 0.00 369.24 369.24 0.04 0.00 370.08
Total 0.49 4.15 2.16 369.24 0.04 0.000.13 0.20 0.33 0.00 369.240.00 0.33 0.20 0.53 370.08
Mitigated Construction Off-Site
8 of 56

SO2 Fugitive PM10
Exhaust PM10
Fugitive PM2.5
Exhaust PM2.5
PM2.5 Total
ROG NOx CO N2O CO2e
Category tons/yr MT/yr
Bio- CO2 NBio- CO2 Total CO2 CH4PM10 Total
Hauling 0.00 0.00 0.00 0.00 0.00 0.00 0.00 0.00 0.00 0.00 0.00 0.00 0.00 0.00 0.00 0.00
Vendor 0.00 0.00 0.00 0.00 0.00 0.00 0.00 0.00 0.00 0.00 0.00 0.00 0.00 0.00 0.00 0.00
Worker 0.01 0.01 0.06 0.00 0.00 0.00 0.00 0.00 0.00 0.00 0.00 6.98 6.98 0.00 0.00 6.99
Total 0.01 0.01 0.06 0.00 0.00 0.00 0.00 0.00 0.00 6.990.00 0.00 0.00 6.98
Exhaust PM10
PM10 Total
6.98 0.00
PM2.5 Total
Bio- CO2
3.5 Building Construction - 2011
Unmitigated Construction On-Site
ROG NOx CO SO2 Fugitive PM10
CO2e
Category tons/yr MT/yr
NBio- CO2 Total CO2 CH4 N2OFugitive PM2.5
Exhaust PM2.5
Off-Road 0.32 2.11 1.26 0.00 0.15 0.15 0.15 0.15 0.00 192.39 192.39 0.03 0.00 192.94
Total 0.32 2.11 1.26 0.00 0.15 0.15 0.00 192.940.15 0.15 0.00 192.39
Exhaust PM10
PM10 Total
192.39 0.03
PM2.5 Total
Bio- CO2
Unmitigated Construction Off-Site
ROG NOx CO SO2 Fugitive PM10
CO2e
Category tons/yr MT/yr
NBio- CO2 Total CO2 CH4 N2OFugitive PM2.5
Exhaust PM2.5
Hauling 0.00 0.00 0.00 0.00 0.00 0.00 0.00 0.00 0.00 0.00 0.00 0.00 0.00 0.00 0.00 0.00
Vendor 0.14 1.48 0.95 0.00 0.06 0.05 0.11 0.00 0.05 0.05 0.00 188.30 188.30 0.01 0.00 188.43
Worker 0.21 0.24 2.34 0.00 0.34 0.01 0.36 0.01 0.01 0.02 0.00 279.52 279.52 0.02 0.00 279.95
Total 0.35 1.72 3.29 0.00 0.40 0.06 0.47 0.01 0.00 468.380.06 0.07 0.00 467.82 467.82 0.03
9 of 56
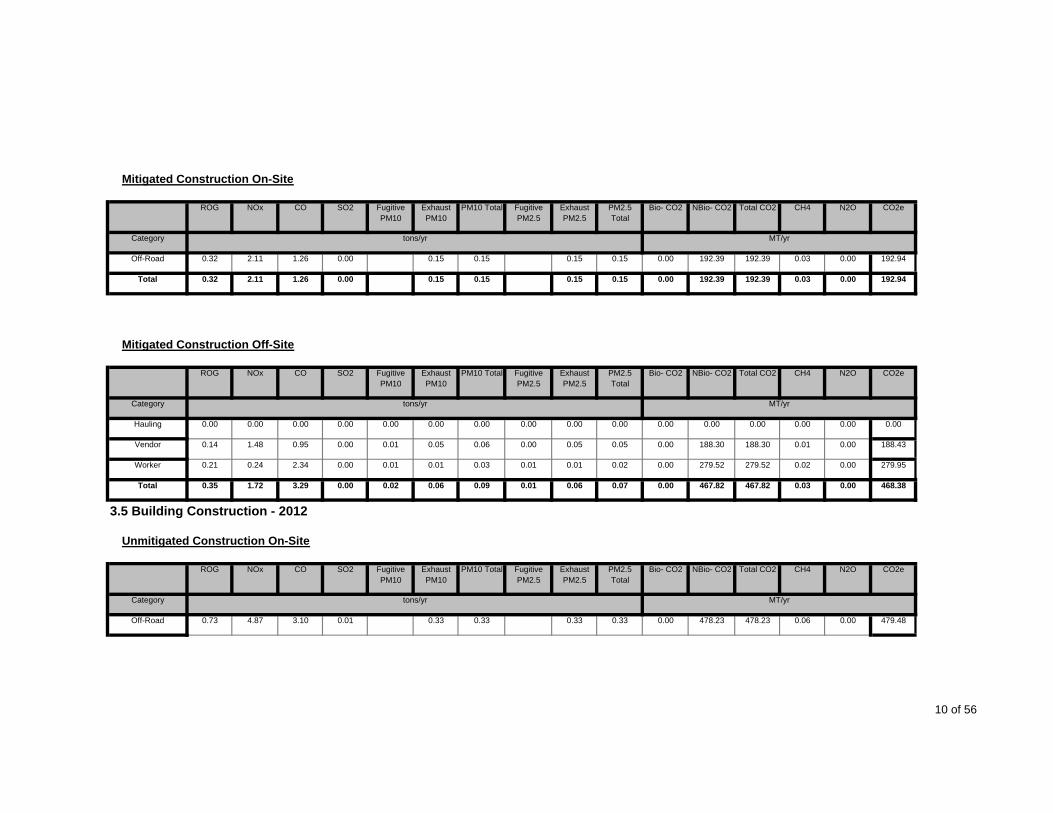
Exhaust PM10
PM10 Total PM2.5 Total
Bio- CO2
Mitigated Construction On-Site
ROG NOx CO SO2 Fugitive PM10
CO2e
Category tons/yr MT/yr
NBio- CO2 Total CO2 CH4 N2OFugitive PM2.5
Exhaust PM2.5
Off-Road 0.32 2.11 1.26 0.00 0.15 0.15 0.15 0.15 0.00 192.39 192.39 0.03 0.00 192.94
Total 0.32 2.11 1.26 0.00 0.15 0.15 0.00 192.940.15 0.15 0.00 192.39
Exhaust PM10
PM10 Total
192.39 0.03
PM2.5 Total
Bio- CO2
Mitigated Construction Off-Site
ROG NOx CO SO2 Fugitive PM10
CO2e
Category tons/yr MT/yr
NBio- CO2 Total CO2 CH4 N2OFugitive PM2.5
Exhaust PM2.5
Hauling 0.00 0.00 0.00 0.00 0.00 0.00 0.00 0.00 0.00 0.00 0.00 0.00 0.00 0.00 0.00 0.00
Vendor 0.14 1.48 0.95 0.00 0.01 0.05 0.06 0.00 0.05 0.05 0.00 188.30 188.30 0.01 0.00 188.43
Worker 0.21 0.24 2.34 0.00 0.01 0.01 0.03 0.01 0.01 0.02 0.00 279.52 279.52 0.02 0.00 279.95
Total 0.35 1.72 3.29 0.00 0.02 0.06 0.09 0.01 0.00 468.380.06 0.07 0.00 467.82
Exhaust PM10
PM10 Total
467.82 0.03
PM2.5 Total
Bio- CO2
3.5 Building Construction - 2012
Unmitigated Construction On-Site
ROG NOx CO SO2 Fugitive PM10
CO2e
Category tons/yr MT/yr
NBio- CO2 Total CO2 CH4 N2OFugitive PM2.5
Exhaust PM2.5
Off-Road 0.73 4.87 3.10 0.01 0.33 0.33 0.33 0.33 0.00 478.23 478.23 0.06 0.00 479.48
10 of 56

Total 0.73 4.87 3.10 0.01 0.33 0.33 0.00 479.480.33 0.33 0.00 478.23
Exhaust PM10
PM10 Total
478.23 0.06
PM2.5 Total
Bio- CO2
Unmitigated Construction Off-Site
ROG NOx CO SO2 Fugitive PM10
CO2e
Category tons/yr MT/yr
NBio- CO2 Total CO2 CH4 N2OFugitive PM2.5
Exhaust PM2.5
Hauling 0.00 0.00 0.00 0.00 0.00 0.00 0.00 0.00 0.00 0.00 0.00 0.00 0.00 0.00 0.00 0.00
Vendor 0.31 3.41 2.18 0.00 0.15 0.12 0.27 0.00 0.11 0.11 0.00 468.87 468.87 0.01 0.00 469.16
Worker 0.47 0.54 5.32 0.01 0.85 0.03 0.88 0.01 0.03 0.04 0.00 679.93 679.93 0.05 0.00 680.91
Total 0.78 3.95 7.50 0.01 1.00 0.15 1.15 0.01 0.00 1,150.070.14 0.15 0.00 1,148.80
Exhaust PM10
PM10 Total
1,148.80 0.06
PM2.5 Total
Bio- CO2
Mitigated Construction On-Site
ROG NOx CO SO2 Fugitive PM10
CO2e
Category tons/yr MT/yr
NBio- CO2 Total CO2 CH4 N2OFugitive PM2.5
Exhaust PM2.5
Off-Road 0.73 4.87 3.10 0.01 0.33 0.33 0.33 0.33 0.00 478.23 478.23 0.06 0.00 479.48
Total 0.73 4.87 3.10 0.01 0.33 0.33 0.00 479.480.33 0.33 0.00 478.23
Exhaust PM10
PM10 Total
478.23 0.06
PM2.5 Total
Bio- CO2
Mitigated Construction Off-Site
ROG NOx CO SO2 Fugitive PM10
CO2e
Category tons/yr MT/yr
NBio- CO2 Total CO2 CH4 N2OFugitive PM2.5
Exhaust PM2.5
11 of 56
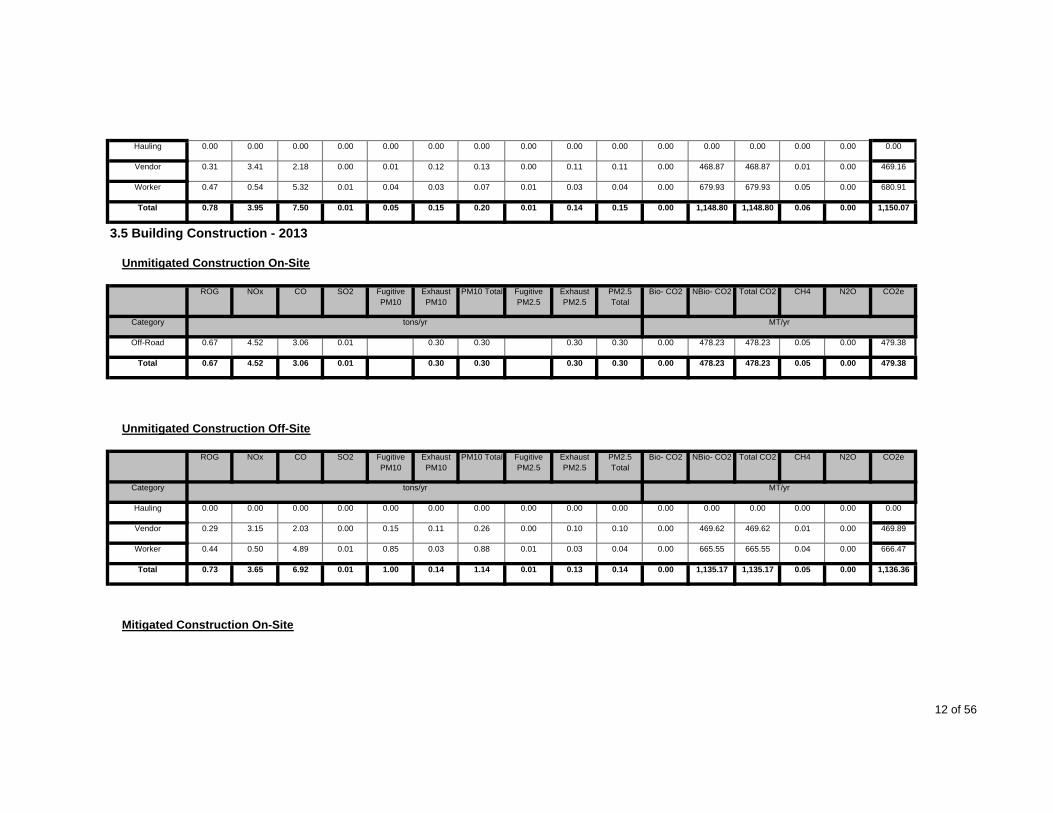
Hauling 0.00 0.00 0.00 0.00 0.00 0.00 0.00 0.00 0.00 0.00 0.00 0.00 0.00 0.00 0.00 0.00
Vendor 0.31 3.41 2.18 0.00 0.01 0.12 0.13 0.00 0.11 0.11 0.00 468.87 468.87 0.01 0.00 469.16
Worker 0.47 0.54 5.32 0.01 0.04 0.03 0.07 0.01 0.03 0.04 0.00 679.93 679.93 0.05 0.00 680.91
Total 0.78 3.95 7.50 0.01 0.05 0.15 0.20 0.01 0.00 1,150.070.14 0.15 0.00 1,148.80
Exhaust PM10
PM10 Total
1,148.80 0.06
PM2.5 Total
Bio- CO2
3.5 Building Construction - 2013
Unmitigated Construction On-Site
ROG NOx CO SO2 Fugitive PM10
CO2e
Category tons/yr MT/yr
NBio- CO2 Total CO2 CH4 N2OFugitive PM2.5
Exhaust PM2.5
Off-Road 0.67 4.52 3.06 0.01 0.30 0.30 0.30 0.30 0.00 478.23 478.23 0.05 0.00 479.38
Total 0.67 4.52 3.06 0.01 0.30 0.30 0.00 479.380.30 0.30 0.00 478.23
Exhaust PM10
PM10 Total
478.23 0.05
PM2.5 Total
Bio- CO2
Unmitigated Construction Off-Site
ROG NOx CO SO2 Fugitive PM10
CO2e
Category tons/yr MT/yr
NBio- CO2 Total CO2 CH4 N2OFugitive PM2.5
Exhaust PM2.5
Hauling 0.00 0.00 0.00 0.00 0.00 0.00 0.00 0.00 0.00 0.00 0.00 0.00 0.00 0.00 0.00 0.00
Vendor 0.29 3.15 2.03 0.00 0.15 0.11 0.26 0.00 0.10 0.10 0.00 469.62 469.62 0.01 0.00 469.89
Worker 0.44 0.50 4.89 0.01 0.85 0.03 0.88 0.01 0.03 0.04 0.00 665.55 665.55 0.04 0.00 666.47
Total 0.73 3.65 6.92 0.01 1.00 0.14 1.14 0.01 0.00 1,136.360.13 0.14 0.00 1,135.17 1,135.17 0.05
Mitigated Construction On-Site
12 of 56

Exhaust PM10
PM10 Total PM2.5 Total
Bio- CO2ROG NOx CO SO2 Fugitive PM10
CO2e
Category tons/yr MT/yr
NBio- CO2 Total CO2 CH4 N2OFugitive PM2.5
Exhaust PM2.5
Off-Road 0.67 4.52 3.06 0.01 0.30 0.30 0.30 0.30 0.00 478.23 478.23 0.05 0.00 479.38
Total 0.67 4.52 3.06 0.01 0.30 0.30 0.00 479.380.30 0.30 0.00 478.23
Exhaust PM10
PM10 Total
478.23 0.05
PM2.5 Total
Bio- CO2
Mitigated Construction Off-Site
ROG NOx CO SO2 Fugitive PM10
CO2e
Category tons/yr MT/yr
NBio- CO2 Total CO2 CH4 N2OFugitive PM2.5
Exhaust PM2.5
Hauling 0.00 0.00 0.00 0.00 0.00 0.00 0.00 0.00 0.00 0.00 0.00 0.00 0.00 0.00 0.00 0.00
Vendor 0.29 3.15 2.03 0.00 0.01 0.11 0.12 0.00 0.10 0.10 0.00 469.62 469.62 0.01 0.00 469.89
Worker 0.44 0.50 4.89 0.01 0.04 0.03 0.07 0.01 0.03 0.04 0.00 665.55 665.55 0.04 0.00 666.47
Total 0.73 3.65 6.92 0.01 0.05 0.14 0.19 0.01 0.00 1,136.360.13 0.14 0.00 1,135.17
Exhaust PM10
PM10 Total
1,135.17 0.05
PM2.5 Total
Bio- CO2
3.5 Building Construction - 2014
Unmitigated Construction On-Site
ROG NOx CO SO2 Fugitive PM10
CO2e
Category tons/yr MT/yr
NBio- CO2 Total CO2 CH4 N2OFugitive PM2.5
Exhaust PM2.5
Off-Road 0.27 1.81 1.31 0.00 0.11 0.11 0.11 0.11 0.00 207.05 207.05 0.02 0.00 207.50
Total 0.27 1.81 1.31 0.00 0.11 0.11 0.00 207.500.11 0.11 0.00 207.05 207.05 0.02
13 of 56

Exhaust PM10
PM10 Total PM2.5 Total
Bio- CO2
Unmitigated Construction Off-Site
ROG NOx CO SO2 Fugitive PM10
CO2e
Category tons/yr MT/yr
NBio- CO2 Total CO2 CH4 N2OFugitive PM2.5
Exhaust PM2.5
Hauling 0.00 0.00 0.00 0.00 0.00 0.00 0.00 0.00 0.00 0.00 0.00 0.00 0.00 0.00 0.00 0.00
Vendor 0.11 1.26 0.81 0.00 0.07 0.04 0.11 0.00 0.04 0.04 0.00 203.64 203.64 0.01 0.00 203.75
Worker 0.18 0.20 1.94 0.00 0.37 0.01 0.38 0.01 0.01 0.02 0.00 282.08 282.08 0.02 0.00 282.44
Total 0.29 1.46 2.75 0.00 0.44 0.05 0.49 0.01 0.00 486.190.05 0.06 0.00 485.72
Exhaust PM10
PM10 Total
485.72 0.03
PM2.5 Total
Bio- CO2
Mitigated Construction On-Site
ROG NOx CO SO2 Fugitive PM10
CO2e
Category tons/yr MT/yr
NBio- CO2 Total CO2 CH4 N2OFugitive PM2.5
Exhaust PM2.5
Off-Road 0.27 1.81 1.31 0.00 0.11 0.11 0.11 0.11 0.00 207.05 207.05 0.02 0.00 207.50
Total 0.27 1.81 1.31 0.00 0.11 0.11 0.00 207.500.11 0.11 0.00 207.05
Exhaust PM10
PM10 Total
207.05 0.02
PM2.5 Total
Bio- CO2
Mitigated Construction Off-Site
ROG NOx CO SO2 Fugitive PM10
CO2e
Category tons/yr MT/yr
NBio- CO2 Total CO2 CH4 N2OFugitive PM2.5
Exhaust PM2.5
Hauling 0.00 0.00 0.00 0.00 0.00 0.00 0.00 0.00 0.00 0.00 0.00 0.00 0.00 0.00 0.00 0.00
Vendor 0.11 1.26 0.81 0.00 0.01 0.04 0.05 0.00 0.04 0.04 0.00 203.64 203.64 0.01 0.00 203.75
Worker 0.18 0.20 1.94 0.00 0.02 0.01 0.03 0.01 0.01 0.02 0.00 282.08 282.08 0.02 0.00 282.44
14 of 56

Total 0.29 1.46 2.75 0.00 0.03 0.05 0.08 0.01 0.00 486.190.05 0.06 0.00 485.72
Exhaust PM10
PM10 Total
485.72 0.03
PM2.5 Total
Bio- CO2
3.6 Paving - 2014
Unmitigated Construction On-Site
ROG NOx CO SO2 Fugitive PM10
CO2e
Category tons/yr MT/yr
NBio- CO2 Total CO2 CH4 N2OFugitive PM2.5
Exhaust PM2.5
Off-Road 0.14 0.88 0.57 0.00 0.08 0.08 0.08 0.08 0.00 72.77 72.77 0.01 0.00 73.01
Paving 0.00 0.00 0.00 0.00 0.00 0.00 0.00 0.00 0.00 0.00 0.00
Total 0.14 0.88 0.57 72.77 0.01 0.000.08 0.08 0.00
SO2 Fugitive PM10
Exhaust PM10
72.770.00 0.08 0.08
Fugitive PM2.5
Exhaust PM2.5
PM2.5 Total
73.01
Unmitigated Construction Off-Site
ROG NOx CO N2O CO2e
Category tons/yr MT/yr
Bio- CO2 NBio- CO2 Total CO2 CH4PM10 Total
Hauling 0.00 0.00 0.00 0.00 0.00 0.00 0.00 0.00 0.00 0.00 0.00 0.00 0.00 0.00 0.00 0.00
Vendor 0.00 0.00 0.00 0.00 0.00 0.00 0.00 0.00 0.00 0.00 0.00 0.00 0.00 0.00 0.00 0.00
Worker 0.00 0.00 0.02 0.00 0.00 0.00 0.00 0.00 0.00 0.00 0.00 3.60 3.60 0.00 0.00 3.61
Total 0.00 0.00 0.02 0.00 0.00 0.00 0.00 0.00 0.00 3.610.00 0.00 0.00 3.60
Exhaust PM10
PM10 Total
3.60 0.00
PM2.5 Total
Bio- CO2
Mitigated Construction On-Site
ROG NOx CO SO2 Fugitive PM10
CO2e
Category tons/yr MT/yr
NBio- CO2 Total CO2 CH4 N2OFugitive PM2.5
Exhaust PM2.5
15 of 56
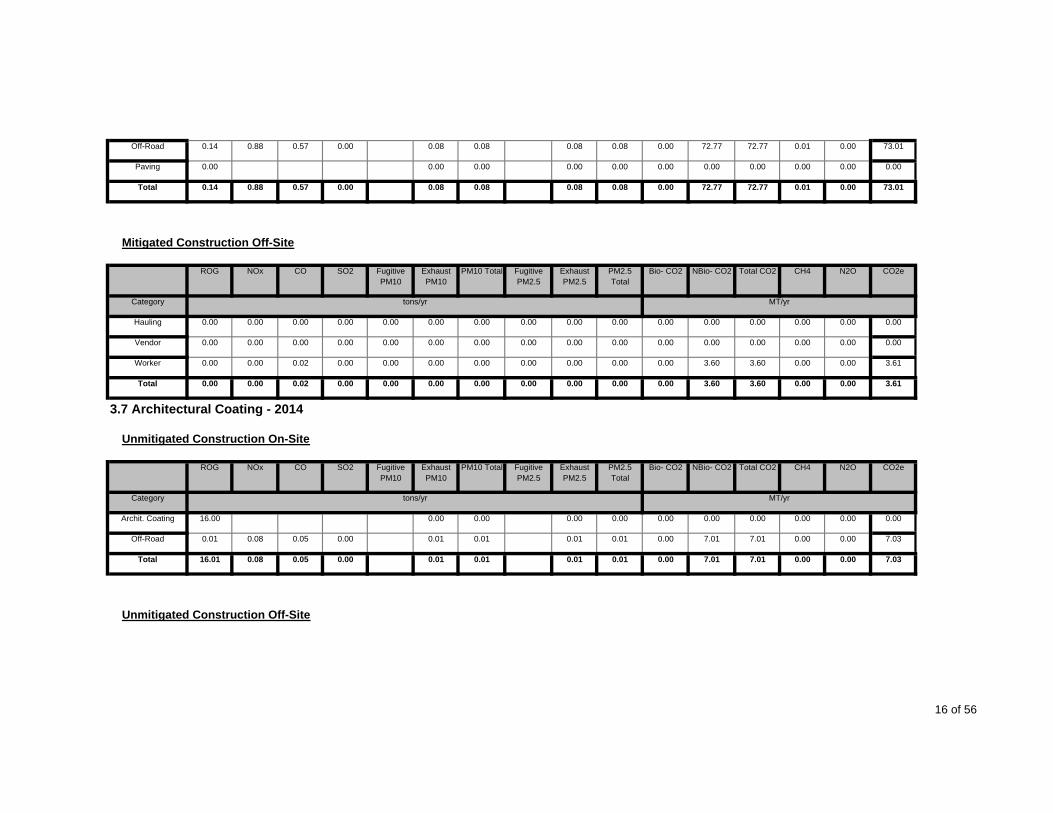
Off-Road 0.14 0.88 0.57 0.00 0.08 0.08 0.08 0.08 0.00 72.77 72.77 0.01 0.00 73.01
Paving 0.00 0.00 0.00 0.00 0.00 0.00 0.00 0.00 0.00 0.00 0.00
Total 0.14 0.88 0.57 72.77 0.01 0.000.08 0.08 0.00
SO2 Fugitive PM10
Exhaust PM10
72.770.00 0.08 0.08
Fugitive PM2.5
Exhaust PM2.5
PM2.5 Total
73.01
Mitigated Construction Off-Site
ROG NOx CO N2O CO2e
Category tons/yr MT/yr
Bio- CO2 NBio- CO2 Total CO2 CH4PM10 Total
Hauling 0.00 0.00 0.00 0.00 0.00 0.00 0.00 0.00 0.00 0.00 0.00 0.00 0.00 0.00 0.00 0.00
Vendor 0.00 0.00 0.00 0.00 0.00 0.00 0.00 0.00 0.00 0.00 0.00 0.00 0.00 0.00 0.00 0.00
Worker 0.00 0.00 0.02 0.00 0.00 0.00 0.00 0.00 0.00 0.00 0.00 3.60 3.60 0.00 0.00 3.61
Total 0.00 0.00 0.02 0.00 0.00 0.00 0.00 0.00 0.00 3.610.00 0.00 0.00 3.60
Exhaust PM10
PM10 Total
3.60 0.00
PM2.5 Total
Bio- CO2
3.7 Architectural Coating - 2014
Unmitigated Construction On-Site
ROG NOx CO SO2 Fugitive PM10
CO2e
Category tons/yr MT/yr
NBio- CO2 Total CO2 CH4 N2OFugitive PM2.5
Exhaust PM2.5
Archit. Coating 16.00 0.00 0.00 0.00 0.00 0.00 0.00 0.00 0.00 0.00 0.00
Off-Road 0.01 0.08 0.05 0.00 0.01 0.01 0.01 0.01 0.00 7.01 7.01 0.00 0.00 7.03
Total 16.01 0.08 0.05 7.01 0.00 0.000.01 0.01 0.00 7.010.00 0.01 0.01 7.03
Unmitigated Construction Off-Site
16 of 56

SO2 Fugitive PM10
Exhaust PM10
Fugitive PM2.5
Exhaust PM2.5
PM2.5 Total
ROG NOx CO N2O CO2e
Category tons/yr MT/yr
Bio- CO2 NBio- CO2 Total CO2 CH4PM10 Total
Hauling 0.00 0.00 0.00 0.00 0.00 0.00 0.00 0.00 0.00 0.00 0.00 0.00 0.00 0.00 0.00 0.00
Vendor 0.00 0.00 0.00 0.00 0.00 0.00 0.00 0.00 0.00 0.00 0.00 0.00 0.00 0.00 0.00 0.00
Worker 0.02 0.02 0.19 0.00 0.04 0.00 0.04 0.00 0.00 0.00 0.00 27.36 27.36 0.00 0.00 27.40
Total 0.02 0.02 0.19 0.00 0.04 0.00 0.04 0.00 0.00 27.400.00 0.00 0.00 27.36
Exhaust PM10
PM10 Total
27.36 0.00
PM2.5 Total
Bio- CO2
Mitigated Construction On-Site
ROG NOx CO SO2 Fugitive PM10
CO2e
Category tons/yr MT/yr
NBio- CO2 Total CO2 CH4 N2OFugitive PM2.5
Exhaust PM2.5
Archit. Coating 16.00 0.00 0.00 0.00 0.00 0.00 0.00 0.00 0.00 0.00 0.00
Off-Road 0.01 0.08 0.05 0.00 0.01 0.01 0.01 0.01 0.00 7.01 7.01 0.00 0.00 7.03
Total 16.01 0.08 0.05 7.01 0.00 0.000.01 0.01 0.00
SO2 Fugitive PM10
Exhaust PM10
7.010.00 0.01 0.01
Fugitive PM2.5
Exhaust PM2.5
PM2.5 Total
7.03
Mitigated Construction Off-Site
ROG NOx CO N2O CO2e
Category tons/yr MT/yr
Bio- CO2 NBio- CO2 Total CO2 CH4PM10 Total
Hauling 0.00 0.00 0.00 0.00 0.00 0.00 0.00 0.00 0.00 0.00 0.00 0.00 0.00 0.00 0.00 0.00
Vendor 0.00 0.00 0.00 0.00 0.00 0.00 0.00 0.00 0.00 0.00 0.00 0.00 0.00 0.00 0.00 0.00
Worker 0.02 0.02 0.19 0.00 0.00 0.00 0.00 0.00 0.00 0.00 0.00 27.36 27.36 0.00 0.00 27.40
Total 0.02 0.02 0.19 0.00 0.00 0.00 0.00 0.00 0.00 0.00 0.00 27.36 27.36 0.00 0.00 27.40
17 of 56

SO2 Fugitive PM10
Exhaust PM10
4.0 Mobile Detail
4.1 Mitigation Measures Mobile
Fugitive PM2.5
Exhaust PM2.5
PM2.5 Total
ROG NOx CO N2O CO2e
Category tons/yr MT/yr
Bio- CO2 NBio- CO2 Total CO2 CH4PM10 Total
Mitigated 7.80 13.94 65.07 0.20 19.90 1.02 20.92 0.32 0.98 1.30 0.00 13,576.23 13,576.23 0.51 0.00 13,586.85
Unmitigated 7.80 13.94 65.07 0.20 19.90 1.02 20.92 0.32 0.98 1.30 0.00 13,576.23 13,576.23 0.51 0.00 13,586.85
Total NA NA NA NA NA NA NA NA NA NA NA NA
4.2 Trip Summary Information
Average Daily Trip Rate Unmitigated Mitigated
NA NA NA NA
Land Use Weekday Saturday Sunday
Apartments Mid Rise 3,245.20 3,245.20 3245.20397.67 397.67
Annual VMT Annual VMT
9,266,030 9,266,030848,967 848,967
Elementary School 1,534.10 1,534.10 1534.10 3,382,597 3,382,597City Park 397.67
General Office Building 203.81 203.81 203.81General Office Building 5,198.54 5,198.54 5198.54
611.68 611.68
487,065 487,06512,423,235 12,423,2351,461,754 1,461,754
Government Office Building 231.00 231.00 231.00 396,137 396,137General Office Building 611.68
18 of 56
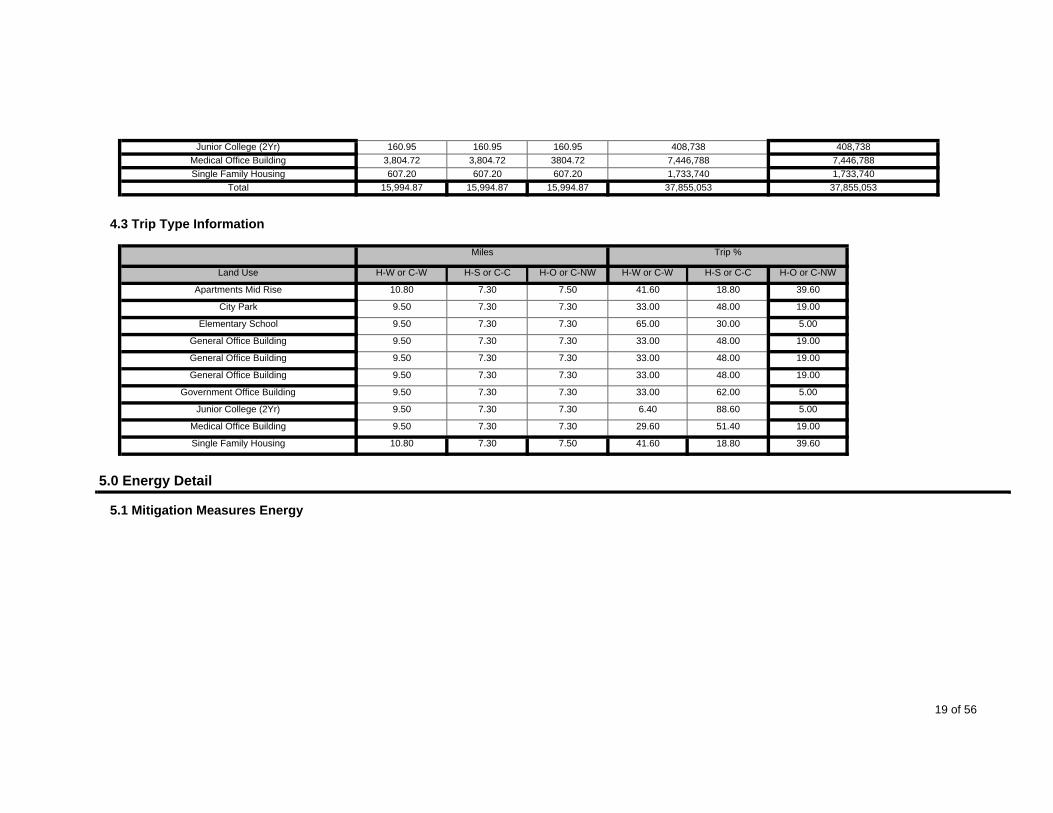
Junior College (2Yr) 160.95 160.95 160.95Medical Office Building 3,804.72 3,804.72 3804.72
607.20 607.20
408,738 408,7387,446,788 7,446,7881,733,740 1,733,740
Total 15,994.87 15,994.87 15,994.87 37,855,053 37,855,053Single Family Housing 607.20
4.3 Trip Type Information
Miles Trip %
Land Use H-W or C-W H-S or C-C H-O or C-NW H-W or C-W H-S or C-C H-O or C-NW
Apartments Mid Rise 10.80 7.30 7.50 41.60 18.80 39.60
City Park 9.50 7.30 7.30 33.00 48.00 19.00
Elementary School 9.50 7.30 7.30 65.00 30.00 5.00
General Office Building 9.50 7.30 7.30 33.00 48.00 19.00
General Office Building 9.50 7.30 7.30 33.00 48.00 19.00
General Office Building 9.50 7.30 7.30 33.00 48.00 19.00
Government Office Building 9.50 7.30 7.30 33.00 62.00 5.00
Junior College (2Yr) 9.50 7.30 7.30 6.40 88.60 5.00
Medical Office Building 9.50 7.30 7.30 29.60 51.40 19.00
41.60 18.80 39.60
5.0 Energy Detail
Single Family Housing 10.80 7.30 7.50
5.1 Mitigation Measures Energy
19 of 56
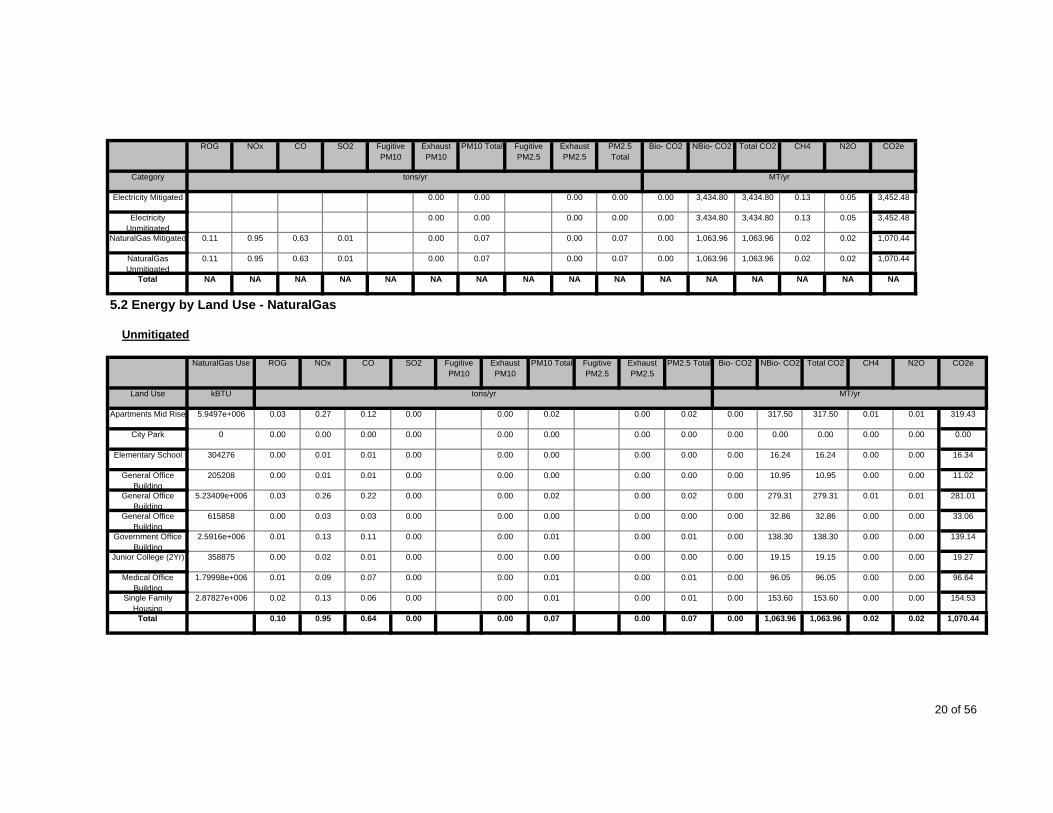
ROG NOx CO SO2 Fugitive PM10
Exhaust PM10
PM10 Total Fugitive PM2.5
Exhaust PM2.5
PM2.5 Total
Bio- CO2 NBio- CO2 Total CO2 CH4 N2O CO2e
Category tons/yr MT/yr
Electricity Mitigated 0.00 0.00 0.00 0.00 0.00 3,434.80 3,434.80 0.13 0.05 3,452.48
Electricity Unmitigated
0.00 0.00 0.00 0.00 0.00 3,434.80 3,434.80 0.13 0.05 3,452.48
NaturalGas Mitigated 0.11 0.95 0.63 0.01 0.00 0.07 0.00 0.07 0.00 1,063.96 1,063.96 0.02 0.02 1,070.44
NaturalGas Unmitigated
0.11 0.95 0.63 0.01 0.00 0.07 0.00 0.07 0.00 1,063.96 1,063.96 0.02 0.02 1,070.44
Total NA NA NA NA NA NA NA NA NA NA NA NA NA NA NA NA
5.2 Energy by Land Use - NaturalGas
Unmitigated
NaturalGas Use ROG NOx CO SO2 Fugitive PM10
Exhaust PM10
PM10 Total Fugitive PM2.5
Exhaust PM2.5
PM2.5 Total N2O CO2e
Land Use kBTU tons/yr MT/yr
Bio- CO2 NBio- CO2 Total CO2 CH4
Apartments Mid Rise 5.9497e+006 0.03 0.27 0.12 0.00 0.00 0.02 0.00 0.02 0.00 317.50 317.50 0.01 0.01 319.43
City Park 0 0.00 0.00 0.00 0.00 0.00 0.00 0.00 0.00 0.00 0.00 0.00 0.00 0.00 0.00
Elementary School 304276 0.00 0.01 0.01 0.00 0.00 0.00 0.00 0.00 0.00 16.24 16.24 0.00 0.00 16.34
General Office Building
205208 0.00 0.01 0.01 0.00 0.00 0.00 0.00 0.00 0.00 10.95 10.95 0.00 0.00 11.02
General Office Building
5.23409e+006 0.03 0.26 0.22 0.00 0.00 0.02 0.00 0.02 0.00 279.31 279.31 0.01 0.01 281.01
General Office Building
615858 0.00 0.03 0.03 0.00 0.00 0.00 0.00 0.00 0.00 32.86 32.86 0.00 0.00 33.06
Government Office Building
2.5916e+006 0.01 0.13 0.11 0.00 0.00 0.01 0.00 0.01 0.00 138.30 138.30 0.00 0.00 139.14
Junior College (2Yr) 358875 0.00 0.02 0.01 0.00 0.00 0.00 0.00 0.00 0.00 19.15 19.15 0.00 0.00 19.27
Medical Office Building
1.79998e+006 0.01 0.09 0.07 0.00 0.00 0.01 0.00 0.01 0.00 96.05 96.05 0.00 0.00 96.64
Single Family Housing
2.87827e+006 0.02 0.13 0.06 0.00 0.00 0.01 0.00 0.01
0.64 0.00 0.00Total 0.10 0.95 0.00 0.07
0.00 154.530.00 153.60 153.60 0.00
0.02 1,070.440.00 1,063.96 1,063.96 0.020.07
20 of 56
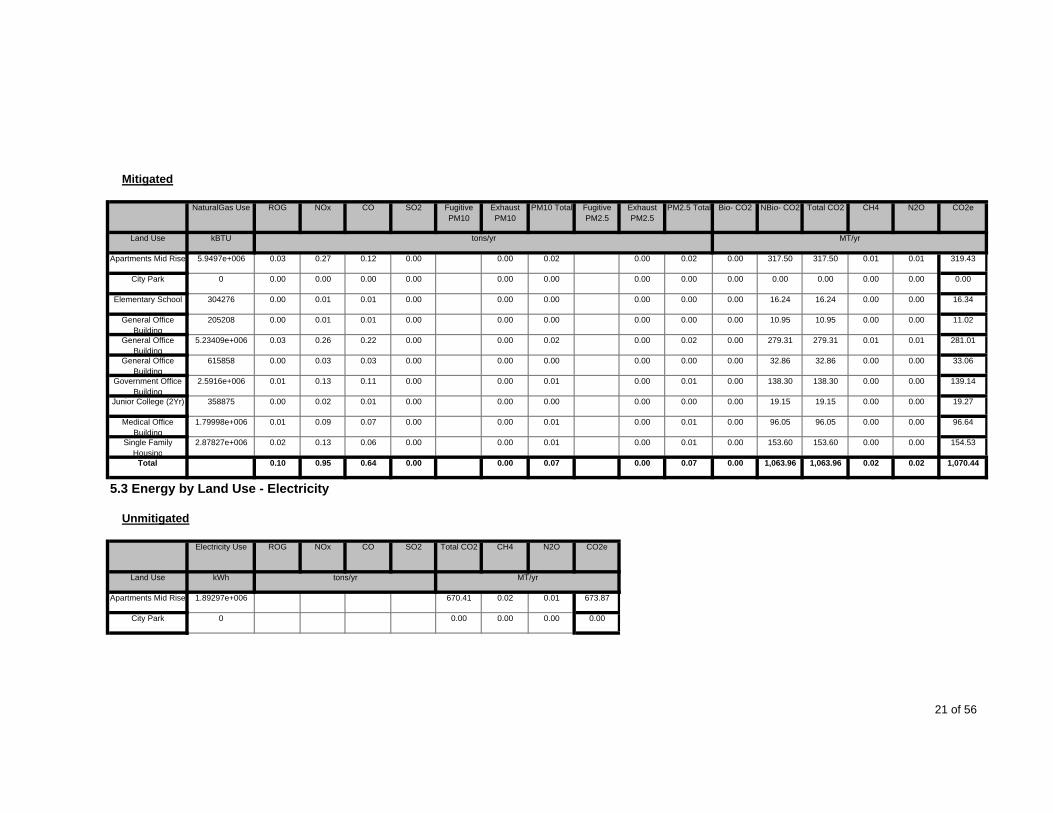
Mitigated
NaturalGas Use ROG NOx CO SO2 Fugitive PM10
Exhaust PM10
PM10 Total Fugitive PM2.5
Exhaust PM2.5
PM2.5 Total N2O CO2e
Land Use kBTU tons/yr MT/yr
Bio- CO2 NBio- CO2 Total CO2 CH4
Apartments Mid Rise 5.9497e+006 0.03 0.27 0.12 0.00 0.00 0.02 0.00 0.02 0.00 317.50 317.50 0.01 0.01 319.43
City Park 0 0.00 0.00 0.00 0.00 0.00 0.00 0.00 0.00 0.00 0.00 0.00 0.00 0.00 0.00
Elementary School 304276 0.00 0.01 0.01 0.00 0.00 0.00 0.00 0.00 0.00 16.24 16.24 0.00 0.00 16.34
General Office Building
205208 0.00 0.01 0.01 0.00 0.00 0.00 0.00 0.00 0.00 10.95 10.95 0.00 0.00 11.02
General Office Building
5.23409e+006 0.03 0.26 0.22 0.00 0.00 0.02 0.00 0.02 0.00 279.31 279.31 0.01 0.01 281.01
General Office Building
615858 0.00 0.03 0.03 0.00 0.00 0.00 0.00 0.00 0.00 32.86 32.86 0.00 0.00 33.06
Government Office Building
2.5916e+006 0.01 0.13 0.11 0.00 0.00 0.01 0.00 0.01 0.00 138.30 138.30 0.00 0.00 139.14
Junior College (2Yr) 358875 0.00 0.02 0.01 0.00 0.00 0.00 0.00 0.00 0.00 19.15 19.15 0.00 0.00 19.27
Medical Office Building
1.79998e+006 0.01 0.09 0.07 0.00 0.00 0.01 0.00 0.01 0.00 96.05 96.05 0.00 0.00 96.64
Single Family Housing
2.87827e+006 0.02 0.13 0.06 0.00 0.00 0.01 0.00 0.01
0.64 0.00 0.00Total 0.10 0.95 0.00 0.07
0.00 154.530.00 153.60 153.60 0.00
0.02 1,070.44
5.3 Energy by Land Use - Electricity
Unmitigated
0.00 1,063.96 1,063.96 0.020.07
Electricity Use ROG NOx N2O CO2e
Land Use kWh tons/yr MT/yr
CO SO2 Total CO2 CH4
Apartments Mid Rise 1.89297e+006 670.41 0.02 0.01 673.87
City Park 0 0.00 0.00 0.00 0.00
21 of 56

Elementary School 280836 99.46 0.00 0.00 99.97
General Office Building
137095 48.55 0.00 0.00 48.80
General Office Building
3.4968e+006 1,238.43 0.05 0.02 1,244.80
General Office Building
411444 145.72 0.01 0.00 146.47
Government Office Building
1.7314e+006 613.19 0.02 0.01 616.35
Junior College (2Yr) 93699 33.18 0.00 0.00 33.36
Medical Office Building
1.20254e+006 425.89 0.02 0.01 428.08
Single Family Housing
451646 159.96 0.01 0.00 160.78
Total 3,434.79 0.13 0.05 3,452.48
Mitigated
Electricity Use ROG NOx N2O CO2e
Land Use kWh tons/yr MT/yr
CO SO2 Total CO2 CH4
Apartments Mid Rise 1.89297e+006 670.41 0.02 0.01 673.87
City Park 0 0.00 0.00 0.00 0.00
Elementary School 280836 99.46 0.00 0.00 99.97
General Office Building
137095 48.55 0.00 0.00 48.80
General Office Building
3.4968e+006 1,238.43 0.05 0.02 1,244.80
General Office Building
411444 145.72 0.01 0.00 146.47
Government Office Building
1.7314e+006 613.19 0.02 0.01 616.35
Junior College (2Yr) 93699 33.18 0.00 0.00 33.36
Medical Office Building
1.20254e+006 425.89 0.02 0.01 428.08
Single Family Housing
451646 159.96 0.01 0.00 160.78
22 of 56

Total 3,434.79 0.13 0.05 3,452.48
6.0 Area Detail
6.1 Mitigation Measures Area
ROG NOx CO PM2.5 Total
Bio- CO2SO2 Fugitive PM10
Exhaust PM10
PM10 Total CO2e
Category tons/yr MT/yr
NBio- CO2 Total CO2 CH4 N2OFugitive PM2.5
Exhaust PM2.5
Mitigated 44.00 0.56 50.96 0.02 0.00 6.59 0.00 6.59 620.81 788.45 1,409.25 0.59 0.06 1,439.74
Unmitigated 44.00 0.56 50.96 0.02 0.00 6.59 0.00 6.59 620.81 788.45 1,409.25 0.59 0.06 1,439.74
Total NA NA NA NA NA NANA NA NA NA
SO2 Fugitive PM10
Exhaust PM10
NANA NA NA NA
Fugitive PM2.5
Exhaust PM2.5
PM2.5 Total
NA
6.2 Area by SubCategory
Unmitigated
ROG NOx CO N2O CO2e
SubCategory tons/yr MT/yr
Bio- CO2 NBio- CO2 Total CO2 CH4PM10 Total
Architectural Coating 1.60 0.00 0.00 0.00 0.00 0.00 0.00 0.00 0.00 0.00 0.00
Consumer Products 4.50 0.00 0.00 0.00 0.00 0.00 0.00 0.00 0.00 0.00 0.00
Hearth 37.76 0.51 46.46 0.02 0.00 6.56 0.00 6.56 620.81 781.07 1,401.88 0.58 0.06 1,432.22
Landscaping 0.13 0.05 4.50 0.00 0.00 0.02 0.00 0.02 0.00 7.37 7.37 0.01 0.00 7.52
23 of 56
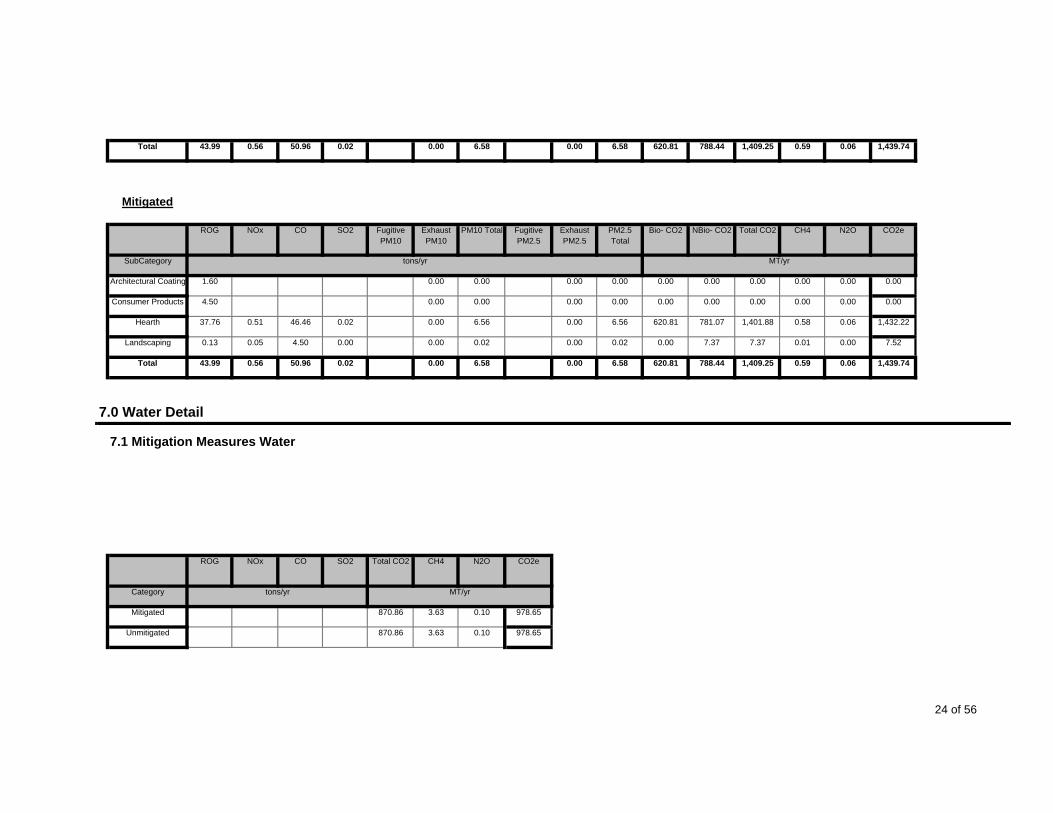
Total 43.99 0.56 50.96 1,409.25 0.59 0.060.00 6.58 620.81
SO2 Fugitive PM10
Exhaust PM10
788.440.02 0.00 6.58
Fugitive PM2.5
Exhaust PM2.5
PM2.5 Total
1,439.74
Mitigated
ROG NOx CO N2O CO2e
SubCategory tons/yr MT/yr
Bio- CO2 NBio- CO2 Total CO2 CH4PM10 Total
Architectural Coating 1.60 0.00 0.00 0.00 0.00 0.00 0.00 0.00 0.00 0.00 0.00
Consumer Products 4.50 0.00 0.00 0.00 0.00 0.00 0.00 0.00 0.00 0.00 0.00
Hearth 37.76 0.51 46.46 0.02 0.00 6.56 0.00 6.56 620.81 781.07 1,401.88 0.58 0.06 1,432.22
Landscaping 0.13 0.05 4.50 0.00 0.00 0.02 0.00 0.02 0.00 7.37 7.37 0.01 0.00 7.52
Total 43.99 0.56 50.96 6.58 620.810.02 0.00 6.58 1,439.74
7.0 Water Detail
7.1 Mitigation Measures Water
788.44 1,409.25 0.59 0.060.00
ROG NOx CO SO2 Total CO2 CH4 N2O CO2e
Category tons/yr MT/yr
Mitigated 870.86 3.63 0.10 978.65
Unmitigated 870.86 3.63 0.10 978.65
24 of 56
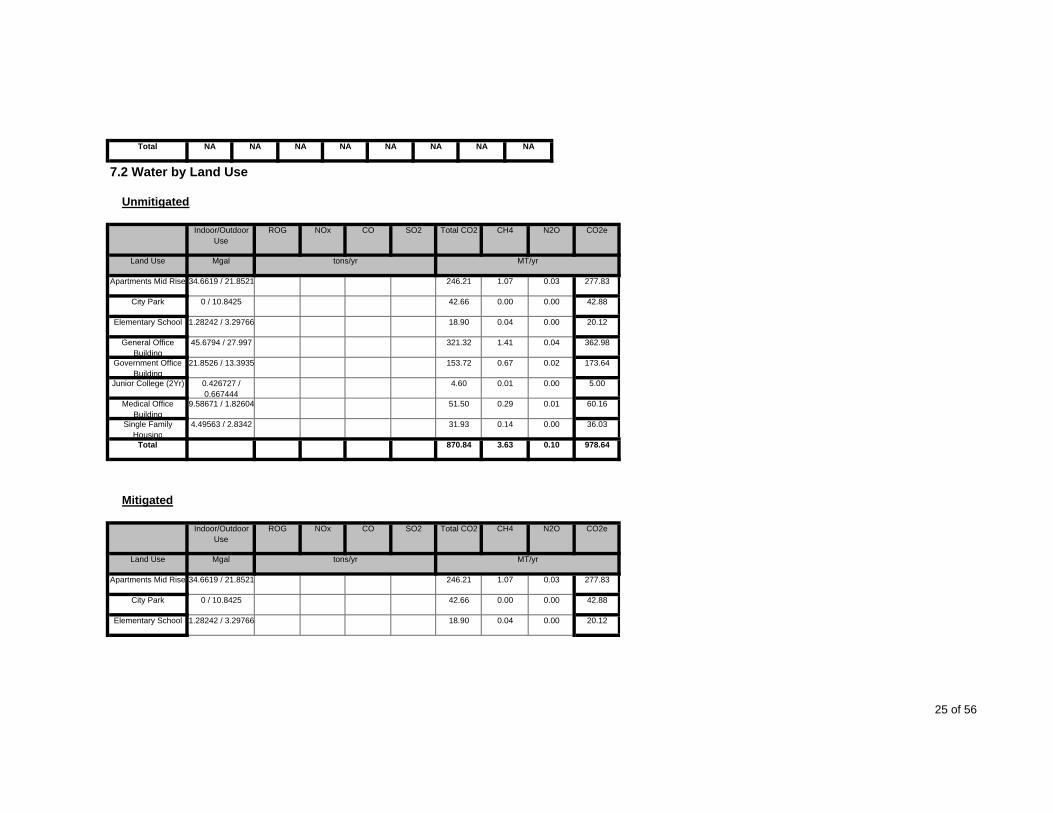
Total NA NA NA NA NA NA NA NA
7.2 Water by Land Use
Unmitigated
Indoor/Outdoor Use
ROG NOx CO SO2 Total CO2 CH4 N2O CO2e
Land Use Mgal tons/yr MT/yr
Apartments Mid Rise 34.6619 / 21.8521 246.21 1.07 0.03 277.83
City Park 0 / 10.8425 42.66 0.00 0.00 42.88
Elementary School 1.28242 / 3.29766 18.90 0.04 0.00 20.12
General Office Building
45.6794 / 27.997 321.32 1.41 0.04 362.98
Government Office Building
21.8526 / 13.3935 153.72 0.67 0.02 173.64
Junior College (2Yr) 0.426727 / 0.667444
4.60 0.01 0.00 5.00
Medical Office Building
9.58671 / 1.82604 51.50 0.29 0.01 60.16
Single Family Housing
4.49563 / 2.8342 31.93 0.14 0.00 36.03
Total 870.84 3.63 0.10 978.64
Mitigated
Indoor/Outdoor Use
ROG NOx N2O CO2e
Land Use Mgal tons/yr MT/yr
CO SO2 Total CO2 CH4
Apartments Mid Rise 34.6619 / 21.8521 246.21 1.07 0.03 277.83
City Park 0 / 10.8425 42.66 0.00 0.00 42.88
Elementary School 1.28242 / 3.29766 18.90 0.04 0.00 20.12
25 of 56

General Office Building
45.6794 / 27.997 321.32 1.41 0.04 362.98
Government Office Building
21.8526 / 13.3935 153.72 0.67 0.02 173.64
Junior College (2Yr) 0.426727 / 0.667444
4.60 0.01 0.00 5.00
Medical Office Building
9.58671 / 1.82604 51.50 0.29 0.01 60.16
Single Family Housing
4.49563 / 2.8342 31.93 0.14 0.00 36.03
Total 870.84 3.63 0.10 978.64
8.0 Waste Detail
NOx CO
8.1 Mitigation Measures Waste
Category/Year
CO2e
tons/yr MT/yr
SO2 Total CO2 CH4 N2OROG
Mitigated 324.90 19.20 0.00 728.12
Unmitigated 324.90 19.20 0.00 728.12
Total NA NA NA NA NA NA NA NA
8.2 Waste by Land Use
Unmitigated
Waste Disposed ROG NOx CO SO2 Total CO2 CH4 N2O CO2e
26 of 56

Land Use tons tons/yr MT/yr
Apartments Mid Rise 244.72 49.68 2.94 0.00 111.33
City Park 0.78 0.16 0.01 0.00 0.35
Elementary School 96.54 19.60 1.16 0.00 43.92
General Office Building
239.02 48.52 2.87 0.00 108.73
Government Office Building
102.3 20.77 1.23 0.00 46.54
Junior College (2Yr) 11.31 2.30 0.14 0.00 5.15
Medical Office Building
825.12 167.49 9.90 0.00 375.36
Single Family Housing
80.77 16.40 0.97 0.00 36.74
Total 324.92 19.22 0.00 728.12
Mitigated
Waste Disposed ROG NOx N2O CO2e
Land Use tons tons/yr MT/yr
CO SO2 Total CO2 CH4
Apartments Mid Rise 244.72 49.68 2.94 0.00 111.33
City Park 0.78 0.16 0.01 0.00 0.35
Elementary School 96.54 19.60 1.16 0.00 43.92
General Office Building
239.02 48.52 2.87 0.00 108.73
Government Office Building
102.3 20.77 1.23 0.00 46.54
Junior College (2Yr) 11.31 2.30 0.14 0.00 5.15
Medical Office Building
825.12 167.49 9.90 0.00 375.36
Single Family Housing
80.77 16.40 0.97 0.00 36.74
Total 324.92 19.22 0.00 728.12
27 of 56

9.0 Vegetation
28 of 56

CalEEMod Version: CalEEMod.2011.1.1 Date: 6/15/2011
Barrio Logan Alternative 1 (2030) - ChangeSan Diego Air Basin, Annual
1.0 Project Characteristics
1.1 Land Usage
Land Uses Size Metric
General Office Building 258.5 1000sqft
General Office Building 162.9 1000sqft
General Office Building 81.9 1000sqft
General Office Building 15.7 1000sqft
General Office Building 121.3 1000sqft
General Office Building 1071.3 1000sqft
Medical Office Building 36.3 1000sqft
Junior College (2Yr) 61.3 1000sqft
General Heavy Industry 3130.4 1000sqft
General Light Industry 79.5 1000sqft
Refrigerated Warehouse-No Rail 90.6 1000sqft
Fast Food Restaurant with Drive Thru 19.5 1000sqft
Apartments Mid Rise 3671 Dwelling Unit
Strip Mall 175.1 1000sqft
1 of 60

1.2 Other Project CharacteristicsUtility Company San Diego Gas & ElectricUrbanization Urban Wind Speed (m/s)
Climate Zone 13 2.6
Precipitation Freq (Days)
1.3 User Entered Comments 40
Project Characteristics -
Land Use -
Architectural Coating - Based on CalGreen VOC content limits.
Vehicle Trips - daily trips based on Traffic Impact Analysis
Area Coating - Based on SDAPCD VOC content limits.
Energy Use -
Water Mitigation - CalGReen and Water Conservation Act reduction
2.0 Emissions Summary
2.1 Overall Construction
Unmitigated Construction
ROG NOx CO SO2 Fugitive PM10
Exhaust PM10
PM10 Total Fugitive PM2.5
Exhaust PM2.5
PM2.5 Total
Bio- CO2 NBio- CO2 Total CO2 CH4 N2O CO2e
Year tons/yr MT/yr
2011 1.29 10.40 6.12 0.01 0.02 0.53 0.56 0.00 0.53 0.53 0.00 903.69 903.69 0.11 0.00 905.90
2012 1.40 11.27 6.48 0.01 3.67 0.56 4.23 1.73 0.56 2.29 0.00 1,012.12 1,012.12 0.11 0.00 1,014.50
2013 1.56 12.73 7.07 0.01 2.05 0.60 2.65 0.84 0.60 1.44 0.00 1,308.22 1,308.22 0.13 0.00 1,310.88
2014 3.27 19.84 25.23 0.05 5.15 0.87 6.02 0.89 0.83 1.73 0.00 4,523.97 4,523.97 0.26 0.00 4,529.35
2015 5.80 30.67 51.76 0.11 8.29 1.31 9.60 0.15 1.23 1.37 0.00 9,757.54 9,757.54 0.45 0.00 9,766.93
2 of 60
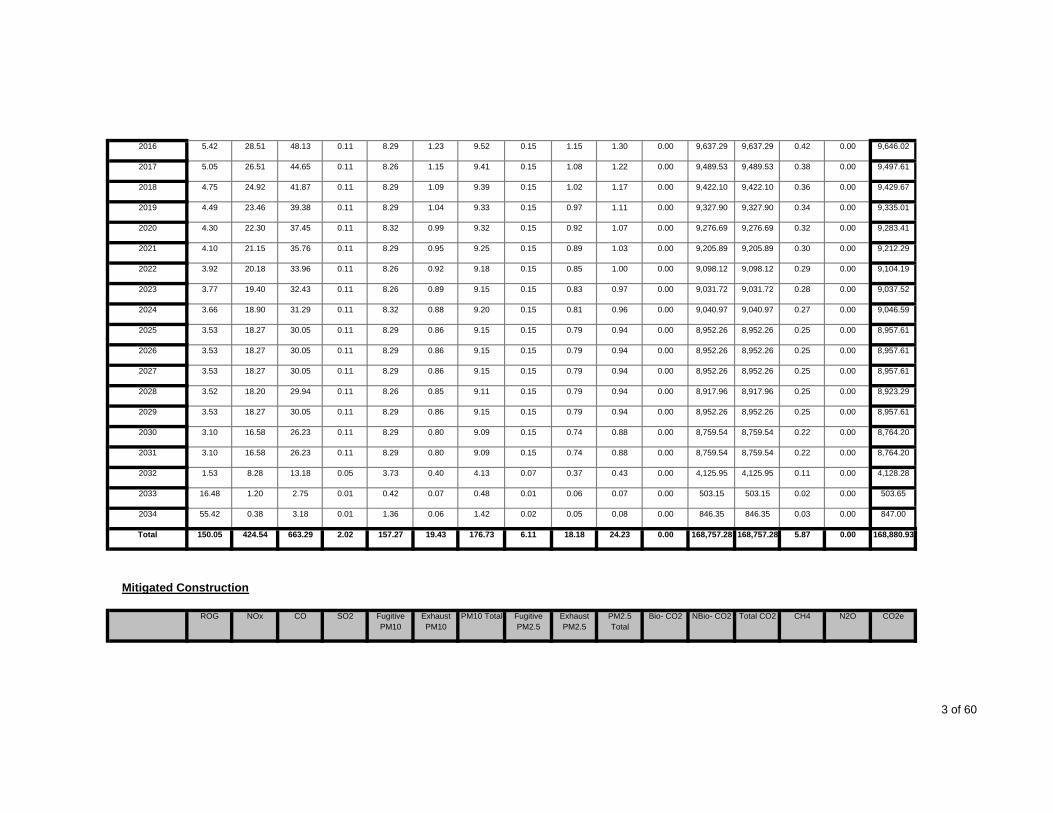
2016 5.42 28.51 48.13 0.11 8.29 1.23 9.52 0.15 1.15 1.30 0.00 9,637.29 9,637.29 0.42 0.00 9,646.02
2017 5.05 26.51 44.65 0.11 8.26 1.15 9.41 0.15 1.08 1.22 0.00 9,489.53 9,489.53 0.38 0.00 9,497.61
2018 4.75 24.92 41.87 0.11 8.29 1.09 9.39 0.15 1.02 1.17 0.00 9,422.10 9,422.10 0.36 0.00 9,429.67
2019 4.49 23.46 39.38 0.11 8.29 1.04 9.33 0.15 0.97 1.11 0.00 9,327.90 9,327.90 0.34 0.00 9,335.01
2020 4.30 22.30 37.45 0.11 8.32 0.99 9.32 0.15 0.92 1.07 0.00 9,276.69 9,276.69 0.32 0.00 9,283.41
2021 4.10 21.15 35.76 0.11 8.29 0.95 9.25 0.15 0.89 1.03 0.00 9,205.89 9,205.89 0.30 0.00 9,212.29
2022 3.92 20.18 33.96 0.11 8.26 0.92 9.18 0.15 0.85 1.00 0.00 9,098.12 9,098.12 0.29 0.00 9,104.19
2023 3.77 19.40 32.43 0.11 8.26 0.89 9.15 0.15 0.83 0.97 0.00 9,031.72 9,031.72 0.28 0.00 9,037.52
2024 3.66 18.90 31.29 0.11 8.32 0.88 9.20 0.15 0.81 0.96 0.00 9,040.97 9,040.97 0.27 0.00 9,046.59
2025 3.53 18.27 30.05 0.11 8.29 0.86 9.15 0.15 0.79 0.94 0.00 8,952.26 8,952.26 0.25 0.00 8,957.61
2026 3.53 18.27 30.05 0.11 8.29 0.86 9.15 0.15 0.79 0.94 0.00 8,952.26 8,952.26 0.25 0.00 8,957.61
2027 3.53 18.27 30.05 0.11 8.29 0.86 9.15 0.15 0.79 0.94 0.00 8,952.26 8,952.26 0.25 0.00 8,957.61
2028 3.52 18.20 29.94 0.11 8.26 0.85 9.11 0.15 0.79 0.94 0.00 8,917.96 8,917.96 0.25 0.00 8,923.29
2029 3.53 18.27 30.05 0.11 8.29 0.86 9.15 0.15 0.79 0.94 0.00 8,952.26 8,952.26 0.25 0.00 8,957.61
2030 3.10 16.58 26.23 0.11 8.29 0.80 9.09 0.15 0.74 0.88 0.00 8,759.54 8,759.54 0.22 0.00 8,764.20
2031 3.10 16.58 26.23 0.11 8.29 0.80 9.09 0.15 0.74 0.88 0.00 8,759.54 8,759.54 0.22 0.00 8,764.20
2032 1.53 8.28 13.18 0.05 3.73 0.40 4.13 0.07 0.37 0.43 0.00 4,125.95 4,125.95 0.11 0.00 4,128.28
2033 16.48 1.20 2.75 0.01 0.42 0.07 0.48 0.01 0.06 0.07 0.00 503.15 503.15 0.02 0.00 503.65
2034 55.42 0.38 3.18 0.01 1.36 0.06 1.42 0.02 0.05 0.08 0.00 846.35 846.35 0.03 0.00 847.00
Total 150.05 424.54 663.29 2.02 157.27 19.43 176.73 6.11 0.00 168,880.9318.18 24.23 0.00 168,757.28
Exhaust PM10
PM10 Total
168,757.28 5.87
PM2.5 Total
Bio- CO2
Mitigated Construction
ROG NOx CO SO2 Fugitive PM10
CO2eNBio- CO2 Total CO2 CH4 N2OFugitive PM2.5
Exhaust PM2.5
3 of 60

Year tons/yr MT/yr
2011 1.29 10.40 6.12 0.01 0.00 0.53 0.53 0.00 0.53 0.53 0.00 903.69 903.69 0.11 0.00 905.90
2012 1.40 11.27 6.48 0.01 3.64 0.56 4.21 1.73 0.56 2.29 0.00 1,012.12 1,012.12 0.11 0.00 1,014.50
2013 1.56 12.73 7.07 0.01 2.02 0.60 2.62 0.84 0.60 1.44 0.00 1,308.22 1,308.22 0.13 0.00 1,310.88
2014 3.27 19.84 25.23 0.05 2.17 0.87 3.04 0.89 0.83 1.73 0.00 4,523.97 4,523.97 0.26 0.00 4,529.35
2015 5.80 30.67 51.76 0.11 0.41 1.31 1.72 0.15 1.23 1.37 0.00 9,757.54 9,757.54 0.45 0.00 9,766.93
2016 5.42 28.51 48.13 0.11 0.41 1.23 1.64 0.15 1.15 1.30 0.00 9,637.29 9,637.29 0.42 0.00 9,646.02
2017 5.05 26.51 44.65 0.11 0.41 1.15 1.56 0.15 1.08 1.22 0.00 9,489.53 9,489.53 0.38 0.00 9,497.61
2018 4.75 24.92 41.87 0.11 0.41 1.09 1.51 0.15 1.02 1.17 0.00 9,422.10 9,422.10 0.36 0.00 9,429.67
2019 4.49 23.46 39.38 0.11 0.41 1.04 1.45 0.15 0.97 1.11 0.00 9,327.90 9,327.90 0.34 0.00 9,335.01
2020 4.30 22.30 37.45 0.11 0.42 0.99 1.41 0.15 0.92 1.07 0.00 9,276.69 9,276.69 0.32 0.00 9,283.41
2021 4.10 21.15 35.76 0.11 0.41 0.95 1.37 0.15 0.89 1.03 0.00 9,205.89 9,205.89 0.30 0.00 9,212.29
2022 3.92 20.18 33.96 0.11 0.41 0.92 1.33 0.15 0.85 1.00 0.00 9,098.12 9,098.12 0.29 0.00 9,104.19
2023 3.77 19.40 32.43 0.11 0.41 0.89 1.30 0.15 0.83 0.97 0.00 9,031.72 9,031.72 0.28 0.00 9,037.52
2024 3.66 18.90 31.29 0.11 0.42 0.88 1.29 0.15 0.81 0.96 0.00 9,040.97 9,040.97 0.27 0.00 9,046.59
2025 3.53 18.27 30.05 0.11 0.41 0.86 1.27 0.15 0.79 0.94 0.00 8,952.26 8,952.26 0.25 0.00 8,957.61
2026 3.53 18.27 30.05 0.11 0.41 0.86 1.27 0.15 0.79 0.94 0.00 8,952.26 8,952.26 0.25 0.00 8,957.61
2027 3.53 18.27 30.05 0.11 0.41 0.86 1.27 0.15 0.79 0.94 0.00 8,952.26 8,952.26 0.25 0.00 8,957.61
2028 3.52 18.20 29.94 0.11 0.41 0.85 1.27 0.15 0.79 0.94 0.00 8,917.96 8,917.96 0.25 0.00 8,923.29
2029 3.53 18.27 30.05 0.11 0.41 0.86 1.27 0.15 0.79 0.94 0.00 8,952.26 8,952.26 0.25 0.00 8,957.61
2030 3.10 16.58 26.23 0.11 0.41 0.80 1.21 0.15 0.74 0.88 0.00 8,759.54 8,759.54 0.22 0.00 8,764.20
2031 3.10 16.58 26.23 0.11 0.41 0.80 1.21 0.15 0.74 0.88 0.00 8,759.54 8,759.54 0.22 0.00 8,764.20
2032 1.53 8.28 13.18 0.05 0.19 0.40 0.58 0.07 0.37 0.43 0.00 4,125.95 4,125.95 0.11 0.00 4,128.28
2033 16.48 1.20 2.75 0.01 0.02 0.07 0.08 0.01 0.06 0.07 0.00 503.15 503.15 0.02 0.00 503.65
2034 55.42 0.38 3.18 0.01 0.06 0.06 0.12 0.02 0.05 0.08 0.00 846.35 846.35 0.03 0.00 847.00
4 of 60

Total 150.05 424.54 663.29 168,757.28 5.87 0.006.11 18.18 24.23 0.00
SO2 Fugitive PM10
Exhaust PM10
168,757.282.02 15.09 19.43 34.53
Fugitive PM2.5
Exhaust PM2.5
PM2.5 Total
168,880.93
2.2 Overall Operational
Unmitigated Operational
ROG NOx CO N2O CO2e
Category tons/yr MT/yr
Bio- CO2 NBio- CO2 Total CO2 CH4PM10 Total
Area 278.42 3.44 311.25 0.11 0.00 40.24 0.00 40.24 3,791.99 4,815.94 8,607.93 3.60 0.36 8,794.14
Energy 0.65 5.77 4.11 0.04 0.00 0.45 0.00 0.45 0.00 32,931.67 32,931.67 1.11 0.49 33,107.19
Mobile 126.98 262.52 1,317.15 1.34 133.22 8.59 141.81 2.12 8.22 10.34 0.00 129,830.30 129,830.30 8.63 0.00 130,011.61
Waste 0.00 0.00 0.00 0.00 5,894.02 0.00 5,894.02 348.33 0.00 13,208.88
Water 0.00 0.00 0.00 0.00 0.00 79,035.29 79,035.29 515.69 13.83 94,151.07
Total 406.05 271.73 1,632.51 1.49 133.22 8.59 182.50 2.12 14.68 279,272.898.22 51.03 9,686.01 246,613.20
Exhaust PM10
PM10 Total
256,299.21 877.36
PM2.5 Total
Bio- CO2
Mitigated Operational
ROG NOx CO SO2 Fugitive PM10
CO2e
Category tons/yr MT/yr
NBio- CO2 Total CO2 CH4 N2OFugitive PM2.5
Exhaust PM2.5
Area 278.42 3.44 311.25 0.11 0.00 40.24 0.00 40.24 3,791.99 4,815.94 8,607.93 3.60 0.36 8,794.14
Energy 0.65 5.77 4.11 0.04 0.00 0.45 0.00 0.45 0.00 32,931.67 32,931.67 1.11 0.49 33,107.19
Mobile 126.98 262.52 1,317.15 1.34 133.22 8.59 141.81 2.12 8.22 10.34 0.00 129,830.30 129,830.30 8.63 0.00 130,011.61
Waste 0.00 0.00 0.00 0.00 5,894.02 0.00 5,894.02 348.33 0.00 13,208.88
Water 0.00 0.00 0.00 0.00 0.00 63,228.23 63,228.23 412.55 11.06 75,320.86
5 of 60

Total 406.05 271.73 1,632.51 1.49 133.22 8.59 182.50 2.12 8.22 51.03 9,686.01 230,806.14 240,492.15 774.22 11.91 260,442.68
SO2 Fugitive PM10
Exhaust PM10
3.0 Construction Detail
3.1 Mitigation Measures Construction
Fugitive PM2.5
Exhaust PM2.5
PM2.5 Total
3.2 Demolition - 2011
Unmitigated Construction On-Site
ROG NOx CO N2O CO2e
Category tons/yr MT/yr
Bio- CO2 NBio- CO2 Total CO2 CH4PM10 Total
Off-Road 1.28 10.38 5.97 0.01 0.53 0.53 0.53 0.53 0.00 885.54 885.54 0.10 0.00 887.72
Total 1.28 10.38 5.97 0.01 0.53 0.53 0.00 887.720.53 0.53 0.00 885.54 885.54 0.10
6 of 60

Exhaust PM10
PM10 Total PM2.5 Total
Bio- CO2
Unmitigated Construction Off-Site
ROG NOx CO SO2 Fugitive PM10
CO2e
Category tons/yr MT/yr
NBio- CO2 Total CO2 CH4 N2OFugitive PM2.5
Exhaust PM2.5
Hauling 0.00 0.00 0.00 0.00 0.00 0.00 0.00 0.00 0.00 0.00 0.00 0.00 0.00 0.00 0.00 0.00
Vendor 0.00 0.00 0.00 0.00 0.00 0.00 0.00 0.00 0.00 0.00 0.00 0.00 0.00 0.00 0.00 0.00
Worker 0.01 0.02 0.15 0.00 0.02 0.00 0.02 0.00 0.00 0.00 0.00 18.15 18.15 0.00 0.00 18.18
Total 0.01 0.02 0.15 0.00 0.02 0.00 0.02 0.00 0.00 18.180.00 0.00 0.00 18.15
Exhaust PM10
PM10 Total
18.15 0.00
PM2.5 Total
Bio- CO2
Mitigated Construction On-Site
ROG NOx CO SO2 Fugitive PM10
CO2e
Category tons/yr MT/yr
NBio- CO2 Total CO2 CH4 N2OFugitive PM2.5
Exhaust PM2.5
Off-Road 1.28 10.38 5.97 0.01 0.53 0.53 0.53 0.53 0.00 885.54 885.54 0.10 0.00 887.72
Total 1.28 10.38 5.97 0.01 0.53 0.53 0.00 887.720.53 0.53 0.00 885.54
Exhaust PM10
PM10 Total
885.54 0.10
PM2.5 Total
Bio- CO2
Mitigated Construction Off-Site
ROG NOx CO SO2 Fugitive PM10
CO2e
Category tons/yr MT/yr
NBio- CO2 Total CO2 CH4 N2OFugitive PM2.5
Exhaust PM2.5
Hauling 0.00 0.00 0.00 0.00 0.00 0.00 0.00 0.00 0.00 0.00 0.00 0.00 0.00 0.00 0.00 0.00
Vendor 0.00 0.00 0.00 0.00 0.00 0.00 0.00 0.00 0.00 0.00 0.00 0.00 0.00 0.00 0.00 0.00
7 of 60
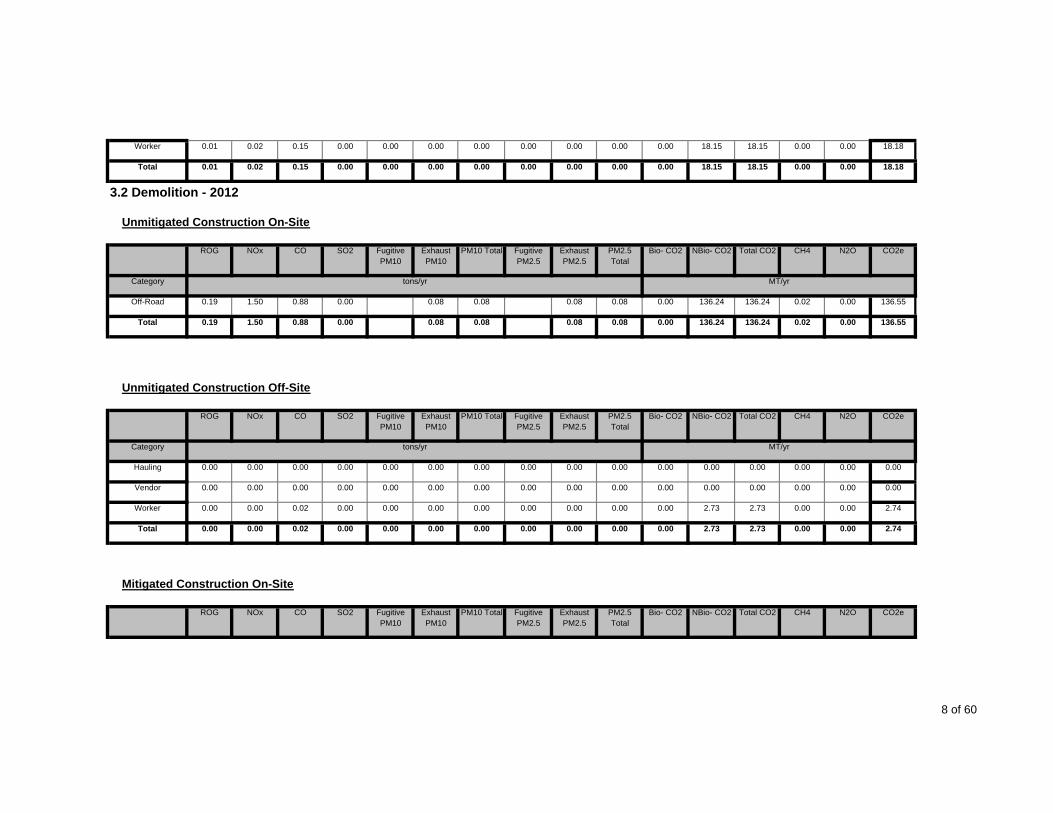
Worker 0.01 0.02 0.15 0.00 0.00 0.00 0.00 0.00 0.00 0.00 0.00 18.15 18.15 0.00 0.00 18.18
Total 0.01 0.02 0.15 0.00 0.00 0.00 0.00 0.00 0.00 18.180.00 0.00 0.00 18.15
Exhaust PM10
PM10 Total
18.15 0.00
PM2.5 Total
Bio- CO2
3.2 Demolition - 2012
Unmitigated Construction On-Site
ROG NOx CO SO2 Fugitive PM10
CO2e
Category tons/yr MT/yr
NBio- CO2 Total CO2 CH4 N2OFugitive PM2.5
Exhaust PM2.5
Off-Road 0.19 1.50 0.88 0.00 0.08 0.08 0.08 0.08 0.00 136.24 136.24 0.02 0.00 136.55
Total 0.19 1.50 0.88 0.00 0.08 0.08 0.00 136.550.08 0.08 0.00 136.24
Exhaust PM10
PM10 Total
136.24 0.02
PM2.5 Total
Bio- CO2
Unmitigated Construction Off-Site
ROG NOx CO SO2 Fugitive PM10
CO2e
Category tons/yr MT/yr
NBio- CO2 Total CO2 CH4 N2OFugitive PM2.5
Exhaust PM2.5
Hauling 0.00 0.00 0.00 0.00 0.00 0.00 0.00 0.00 0.00 0.00 0.00 0.00 0.00 0.00 0.00 0.00
Vendor 0.00 0.00 0.00 0.00 0.00 0.00 0.00 0.00 0.00 0.00 0.00 0.00 0.00 0.00 0.00 0.00
Worker 0.00 0.00 0.02 0.00 0.00 0.00 0.00 0.00 0.00 0.00 0.00 2.73 2.73 0.00 0.00 2.74
Total 0.00 0.00 0.02 0.00 0.00 0.00 0.00 0.00 0.00 2.740.00 0.00 0.00 2.73
Exhaust PM10
PM10 Total
2.73 0.00
PM2.5 Total
Bio- CO2
Mitigated Construction On-Site
ROG NOx CO SO2 Fugitive PM10
CO2eNBio- CO2 Total CO2 CH4 N2OFugitive PM2.5
Exhaust PM2.5
8 of 60

Category tons/yr MT/yr
Off-Road 0.19 1.50 0.88 0.00 0.08 0.08 0.08 0.08 0.00 136.24 136.24 0.02 0.00 136.55
Total 0.19 1.50 0.88 0.00 0.08 0.08 0.00 136.550.08 0.08 0.00 136.24
Exhaust PM10
PM10 Total
136.24 0.02
PM2.5 Total
Bio- CO2
Mitigated Construction Off-Site
ROG NOx CO SO2 Fugitive PM10
CO2e
Category tons/yr MT/yr
NBio- CO2 Total CO2 CH4 N2OFugitive PM2.5
Exhaust PM2.5
Hauling 0.00 0.00 0.00 0.00 0.00 0.00 0.00 0.00 0.00 0.00 0.00 0.00 0.00 0.00 0.00 0.00
Vendor 0.00 0.00 0.00 0.00 0.00 0.00 0.00 0.00 0.00 0.00 0.00 0.00 0.00 0.00 0.00 0.00
Worker 0.00 0.00 0.02 0.00 0.00 0.00 0.00 0.00 0.00 0.00 0.00 2.73 2.73 0.00 0.00 2.74
Total 0.00 0.00 0.02 0.00 0.00 0.00 0.00 0.00 0.00 2.740.00 0.00 0.00 2.73
Exhaust PM10
PM10 Total
2.73 0.00
PM2.5 Total
Bio- CO2
3.3 Site Preparation - 2012
Unmitigated Construction On-Site
ROG NOx CO SO2 Fugitive PM10
CO2e
Category tons/yr MT/yr
NBio- CO2 Total CO2 CH4 N2OFugitive PM2.5
Exhaust PM2.5
Fugitive Dust 1.63 0.00 1.63 0.89 0.00 0.89 0.00 0.00 0.00 0.00 0.00 0.00
Off-Road 0.94 7.62 4.30 0.01 0.38 0.38 0.38 0.38 0.00 652.81 652.81 0.08 0.00 654.41
Total 0.94 7.62 4.30 652.81 0.08 0.000.89 0.38 1.27 0.00 652.810.01 1.63 0.38 2.01 654.41
Unmitigated Construction Off-Site
9 of 60

SO2 Fugitive PM10
Exhaust PM10
Fugitive PM2.5
Exhaust PM2.5
PM2.5 Total
ROG NOx CO N2O CO2e
Category tons/yr MT/yr
Bio- CO2 NBio- CO2 Total CO2 CH4PM10 Total
Hauling 0.00 0.00 0.00 0.00 0.00 0.00 0.00 0.00 0.00 0.00 0.00 0.00 0.00 0.00 0.00 0.00
Vendor 0.00 0.00 0.00 0.00 0.00 0.00 0.00 0.00 0.00 0.00 0.00 0.00 0.00 0.00 0.00 0.00
Worker 0.01 0.01 0.12 0.00 0.02 0.00 0.02 0.00 0.00 0.00 0.00 14.76 14.76 0.00 0.00 14.78
Total 0.01 0.01 0.12 0.00 0.02 0.00 0.02 0.00 0.00 14.780.00 0.00 0.00 14.76
Exhaust PM10
PM10 Total
14.76 0.00
PM2.5 Total
Bio- CO2
Mitigated Construction On-Site
ROG NOx CO SO2 Fugitive PM10
CO2e
Category tons/yr MT/yr
NBio- CO2 Total CO2 CH4 N2OFugitive PM2.5
Exhaust PM2.5
Fugitive Dust 1.63 0.00 1.63 0.89 0.00 0.89 0.00 0.00 0.00 0.00 0.00 0.00
Off-Road 0.94 7.62 4.30 0.01 0.38 0.38 0.38 0.38 0.00 652.81 652.81 0.08 0.00 654.41
Total 0.94 7.62 4.30 652.81 0.08 0.000.89 0.38 1.27 0.00
SO2 Fugitive PM10
Exhaust PM10
652.810.01 1.63 0.38 2.01
Fugitive PM2.5
Exhaust PM2.5
PM2.5 Total
654.41
Mitigated Construction Off-Site
ROG NOx CO N2O CO2e
Category tons/yr MT/yr
Bio- CO2 NBio- CO2 Total CO2 CH4PM10 Total
Hauling 0.00 0.00 0.00 0.00 0.00 0.00 0.00 0.00 0.00 0.00 0.00 0.00 0.00 0.00 0.00 0.00
Vendor 0.00 0.00 0.00 0.00 0.00 0.00 0.00 0.00 0.00 0.00 0.00 0.00 0.00 0.00 0.00 0.00
Worker 0.01 0.01 0.12 0.00 0.00 0.00 0.00 0.00 0.00 0.00 0.00 14.76 14.76 0.00 0.00 14.78
Total 0.01 0.01 0.12 0.00 0.00 0.00 0.00 0.00 0.00 14.780.00 0.00 0.00 14.76 14.76 0.00
10 of 60

Exhaust PM10
PM10 Total PM2.5 Total
Bio- CO2
3.4 Grading - 2012
Unmitigated Construction On-Site
ROG NOx CO SO2 Fugitive PM10
CO2e
Category tons/yr MT/yr
NBio- CO2 Total CO2 CH4 N2OFugitive PM2.5
Exhaust PM2.5
Fugitive Dust 2.02 0.00 2.02 0.84 0.00 0.84 0.00 0.00 0.00 0.00 0.00 0.00
Off-Road 0.26 2.13 1.13 0.00 0.10 0.10 0.10 0.10 0.00 201.85 201.85 0.02 0.00 202.29
Total 0.26 2.13 1.13 201.85 0.02 0.000.84 0.10 0.94 0.00
SO2 Fugitive PM10
Exhaust PM10
201.850.00 2.02 0.10 2.12
Fugitive PM2.5
Exhaust PM2.5
PM2.5 Total
202.29
Unmitigated Construction Off-Site
ROG NOx CO N2O CO2e
Category tons/yr MT/yr
Bio- CO2 NBio- CO2 Total CO2 CH4PM10 Total
Hauling 0.00 0.00 0.00 0.00 0.00 0.00 0.00 0.00 0.00 0.00 0.00 0.00 0.00 0.00 0.00 0.00
Vendor 0.00 0.00 0.00 0.00 0.00 0.00 0.00 0.00 0.00 0.00 0.00 0.00 0.00 0.00 0.00 0.00
Worker 0.00 0.00 0.03 0.00 0.00 0.00 0.00 0.00 0.00 0.00 0.00 3.73 3.73 0.00 0.00 3.74
Total 0.00 0.00 0.03 0.00 0.00 0.00 0.00 0.00 0.00 3.740.00 0.00 0.00 3.73
Exhaust PM10
PM10 Total
3.73 0.00
PM2.5 Total
Bio- CO2
Mitigated Construction On-Site
ROG NOx CO SO2 Fugitive PM10
CO2e
Category tons/yr MT/yr
NBio- CO2 Total CO2 CH4 N2OFugitive PM2.5
Exhaust PM2.5
Fugitive Dust 2.02 0.00 2.02 0.84 0.00 0.84 0.00 0.00 0.00 0.00 0.00 0.00
11 of 60
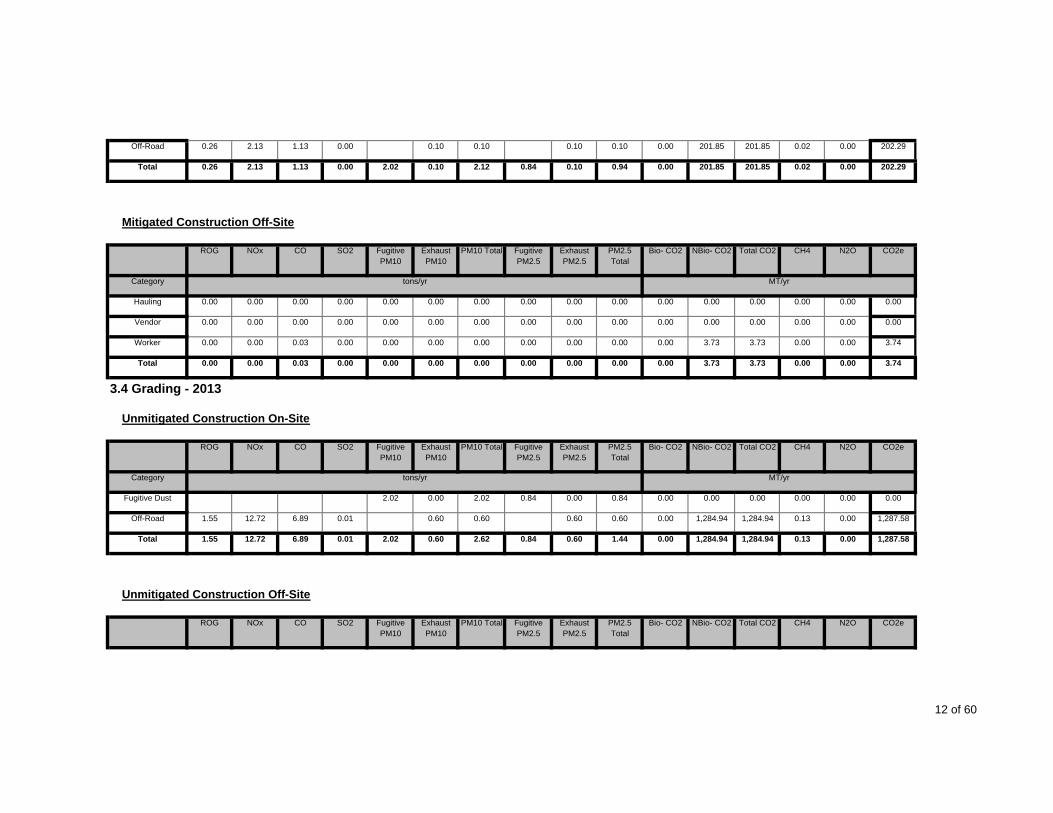
Off-Road 0.26 2.13 1.13 0.00 0.10 0.10 0.10 0.10 0.00 201.85 201.85 0.02 0.00 202.29
Total 0.26 2.13 1.13 201.85 0.02 0.000.84 0.10 0.94 0.00
SO2 Fugitive PM10
Exhaust PM10
201.850.00 2.02 0.10 2.12
Fugitive PM2.5
Exhaust PM2.5
PM2.5 Total
202.29
Mitigated Construction Off-Site
ROG NOx CO N2O CO2e
Category tons/yr MT/yr
Bio- CO2 NBio- CO2 Total CO2 CH4PM10 Total
Hauling 0.00 0.00 0.00 0.00 0.00 0.00 0.00 0.00 0.00 0.00 0.00 0.00 0.00 0.00 0.00 0.00
Vendor 0.00 0.00 0.00 0.00 0.00 0.00 0.00 0.00 0.00 0.00 0.00 0.00 0.00 0.00 0.00 0.00
Worker 0.00 0.00 0.03 0.00 0.00 0.00 0.00 0.00 0.00 0.00 0.00 3.73 3.73 0.00 0.00 3.74
Total 0.00 0.00 0.03 0.00 0.00 0.00 0.00 0.00 0.00 3.740.00 0.00 0.00 3.73
Exhaust PM10
PM10 Total
3.73 0.00
PM2.5 Total
Bio- CO2
3.4 Grading - 2013
Unmitigated Construction On-Site
ROG NOx CO SO2 Fugitive PM10
CO2e
Category tons/yr MT/yr
NBio- CO2 Total CO2 CH4 N2OFugitive PM2.5
Exhaust PM2.5
Fugitive Dust 2.02 0.00 2.02 0.84 0.00 0.84 0.00 0.00 0.00 0.00 0.00 0.00
Off-Road 1.55 12.72 6.89 0.01 0.60 0.60 0.60 0.60 0.00 1,284.94 1,284.94 0.13 0.00 1,287.58
Total 1.55 12.72 6.89 1,284.94 0.13 0.000.84 0.60 1.44 0.00
SO2 Fugitive PM10
Exhaust PM10
1,284.940.01 2.02 0.60 2.62
Fugitive PM2.5
Exhaust PM2.5
PM2.5 Total
1,287.58
Unmitigated Construction Off-Site
ROG NOx CO N2O CO2eBio- CO2 NBio- CO2 Total CO2 CH4PM10 Total
12 of 60

Category tons/yr MT/yr
Hauling 0.00 0.00 0.00 0.00 0.00 0.00 0.00 0.00 0.00 0.00 0.00 0.00 0.00 0.00 0.00 0.00
Vendor 0.00 0.00 0.00 0.00 0.00 0.00 0.00 0.00 0.00 0.00 0.00 0.00 0.00 0.00 0.00 0.00
Worker 0.02 0.02 0.17 0.00 0.03 0.00 0.03 0.00 0.00 0.00 0.00 23.27 23.27 0.00 0.00 23.30
Total 0.02 0.02 0.17 0.00 0.03 0.00 0.03 0.00 0.00 23.300.00 0.00 0.00 23.27
Exhaust PM10
PM10 Total
23.27 0.00
PM2.5 Total
Bio- CO2
Mitigated Construction On-Site
ROG NOx CO SO2 Fugitive PM10
CO2e
Category tons/yr MT/yr
NBio- CO2 Total CO2 CH4 N2OFugitive PM2.5
Exhaust PM2.5
Fugitive Dust 2.02 0.00 2.02 0.84 0.00 0.84 0.00 0.00 0.00 0.00 0.00 0.00
Off-Road 1.55 12.72 6.89 0.01 0.60 0.60 0.60 0.60 0.00 1,284.94 1,284.94 0.13 0.00 1,287.58
Total 1.55 12.72 6.89 1,284.94 0.13 0.000.84 0.60 1.44 0.00
SO2 Fugitive PM10
Exhaust PM10
1,284.940.01 2.02 0.60 2.62
Fugitive PM2.5
Exhaust PM2.5
PM2.5 Total
1,287.58
Mitigated Construction Off-Site
ROG NOx CO N2O CO2e
Category tons/yr MT/yr
Bio- CO2 NBio- CO2 Total CO2 CH4PM10 Total
Hauling 0.00 0.00 0.00 0.00 0.00 0.00 0.00 0.00 0.00 0.00 0.00 0.00 0.00 0.00 0.00 0.00
Vendor 0.00 0.00 0.00 0.00 0.00 0.00 0.00 0.00 0.00 0.00 0.00 0.00 0.00 0.00 0.00 0.00
Worker 0.02 0.02 0.17 0.00 0.00 0.00 0.00 0.00 0.00 0.00 0.00 23.27 23.27 0.00 0.00 23.30
Total 0.02 0.02 0.17 0.00 0.00 0.00 0.00 0.00 0.00 23.300.00 0.00 0.00 23.27 23.27 0.00
3.4 Grading - 2014
13 of 60

Exhaust PM10
PM10 Total PM2.5 Total
Bio- CO2
Unmitigated Construction On-Site
ROG NOx CO SO2 Fugitive PM10
CO2e
Category tons/yr MT/yr
NBio- CO2 Total CO2 CH4 N2OFugitive PM2.5
Exhaust PM2.5
Fugitive Dust 2.02 0.00 2.02 0.84 0.00 0.84 0.00 0.00 0.00 0.00 0.00 0.00
Off-Road 0.91 7.39 4.14 0.01 0.34 0.34 0.34 0.34 0.00 802.47 802.47 0.07 0.00 804.03
Total 0.91 7.39 4.14 802.47 0.07 0.000.84 0.34 1.18 0.00
SO2 Fugitive PM10
Exhaust PM10
802.470.01 2.02 0.34 2.36
Fugitive PM2.5
Exhaust PM2.5
PM2.5 Total
804.03
Unmitigated Construction Off-Site
ROG NOx CO N2O CO2e
Category tons/yr MT/yr
Bio- CO2 NBio- CO2 Total CO2 CH4PM10 Total
Hauling 0.00 0.00 0.00 0.00 0.00 0.00 0.00 0.00 0.00 0.00 0.00 0.00 0.00 0.00 0.00 0.00
Vendor 0.00 0.00 0.00 0.00 0.00 0.00 0.00 0.00 0.00 0.00 0.00 0.00 0.00 0.00 0.00 0.00
Worker 0.01 0.01 0.10 0.00 0.02 0.00 0.02 0.00 0.00 0.00 0.00 14.23 14.23 0.00 0.00 14.25
Total 0.01 0.01 0.10 0.00 0.02 0.00 0.02 0.00 0.00 14.250.00 0.00 0.00 14.23
Exhaust PM10
PM10 Total
14.23 0.00
PM2.5 Total
Bio- CO2
Mitigated Construction On-Site
ROG NOx CO SO2 Fugitive PM10
CO2e
Category tons/yr MT/yr
NBio- CO2 Total CO2 CH4 N2OFugitive PM2.5
Exhaust PM2.5
Fugitive Dust 2.02 0.00 2.02 0.84 0.00 0.84 0.00 0.00 0.00 0.00 0.00 0.00
Off-Road 0.91 7.39 4.14 0.01 0.34 0.34 0.34 0.34 0.00 802.47 802.47 0.07 0.00 804.03
14 of 60

Total 0.91 7.39 4.14 802.47 0.07 0.000.84 0.34 1.18 0.00
SO2 Fugitive PM10
Exhaust PM10
802.470.01 2.02 0.34 2.36
Fugitive PM2.5
Exhaust PM2.5
PM2.5 Total
804.03
Mitigated Construction Off-Site
ROG NOx CO N2O CO2e
Category tons/yr MT/yr
Bio- CO2 NBio- CO2 Total CO2 CH4PM10 Total
Hauling 0.00 0.00 0.00 0.00 0.00 0.00 0.00 0.00 0.00 0.00 0.00 0.00 0.00 0.00 0.00 0.00
Vendor 0.00 0.00 0.00 0.00 0.00 0.00 0.00 0.00 0.00 0.00 0.00 0.00 0.00 0.00 0.00 0.00
Worker 0.01 0.01 0.10 0.00 0.00 0.00 0.00 0.00 0.00 0.00 0.00 14.23 14.23 0.00 0.00 14.25
Total 0.01 0.01 0.10 0.00 0.00 0.00 0.00 0.00 0.00 14.250.00 0.00 0.00 14.23
Exhaust PM10
PM10 Total
14.23 0.00
PM2.5 Total
Bio- CO2
3.5 Building Construction - 2014
Unmitigated Construction On-Site
ROG NOx CO SO2 Fugitive PM10
CO2e
Category tons/yr MT/yr
NBio- CO2 Total CO2 CH4 N2OFugitive PM2.5
Exhaust PM2.5
Off-Road 0.23 1.57 1.14 0.00 0.10 0.10 0.10 0.10 0.00 179.56 179.56 0.02 0.00 179.96
Total 0.23 1.57 1.14 0.00 0.10 0.10 0.00 179.960.10 0.10 0.00 179.56
Exhaust PM10
PM10 Total
179.56 0.02
PM2.5 Total
Bio- CO2
Unmitigated Construction Off-Site
ROG NOx CO SO2 Fugitive PM10
CO2e
Category tons/yr MT/yr
NBio- CO2 Total CO2 CH4 N2OFugitive PM2.5
Exhaust PM2.5
15 of 60

Hauling 0.00 0.00 0.00 0.00 0.00 0.00 0.00 0.00 0.00 0.00 0.00 0.00 0.00 0.00 0.00 0.00
Vendor 0.86 9.47 6.08 0.02 0.50 0.32 0.82 0.01 0.30 0.31 0.00 1,526.59 1,526.59 0.04 0.00 1,527.40
Worker 1.25 1.40 13.77 0.02 2.61 0.10 2.72 0.04 0.10 0.14 0.00 2,001.11 2,001.11 0.12 0.00 2,003.72
Total 2.11 10.87 19.85 0.04 3.11 0.42 3.54 0.05 0.00 3,531.120.40 0.45 0.00 3,527.70
Exhaust PM10
PM10 Total
3,527.70 0.16
PM2.5 Total
Bio- CO2
Mitigated Construction On-Site
ROG NOx CO SO2 Fugitive PM10
CO2e
Category tons/yr MT/yr
NBio- CO2 Total CO2 CH4 N2OFugitive PM2.5
Exhaust PM2.5
Off-Road 0.23 1.57 1.14 0.00 0.10 0.10 0.10 0.10 0.00 179.56 179.56 0.02 0.00 179.96
Total 0.23 1.57 1.14 0.00 0.10 0.10 0.00 179.960.10 0.10 0.00 179.56
Exhaust PM10
PM10 Total
179.56 0.02
PM2.5 Total
Bio- CO2
Mitigated Construction Off-Site
ROG NOx CO SO2 Fugitive PM10
CO2e
Category tons/yr MT/yr
NBio- CO2 Total CO2 CH4 N2OFugitive PM2.5
Exhaust PM2.5
Hauling 0.00 0.00 0.00 0.00 0.00 0.00 0.00 0.00 0.00 0.00 0.00 0.00 0.00 0.00 0.00 0.00
Vendor 0.86 9.47 6.08 0.02 0.04 0.32 0.37 0.01 0.30 0.31 0.00 1,526.59 1,526.59 0.04 0.00 1,527.40
Worker 1.25 1.40 13.77 0.02 0.11 0.10 0.22 0.04 0.10 0.14 0.00 2,001.11 2,001.11 0.12 0.00 2,003.72
Total 2.11 10.87 19.85 0.04 0.15 0.42 0.59 0.05 0.00 3,531.120.40 0.45 0.00 3,527.70 3,527.70 0.16
3.5 Building Construction - 2015
Unmitigated Construction On-Site
16 of 60
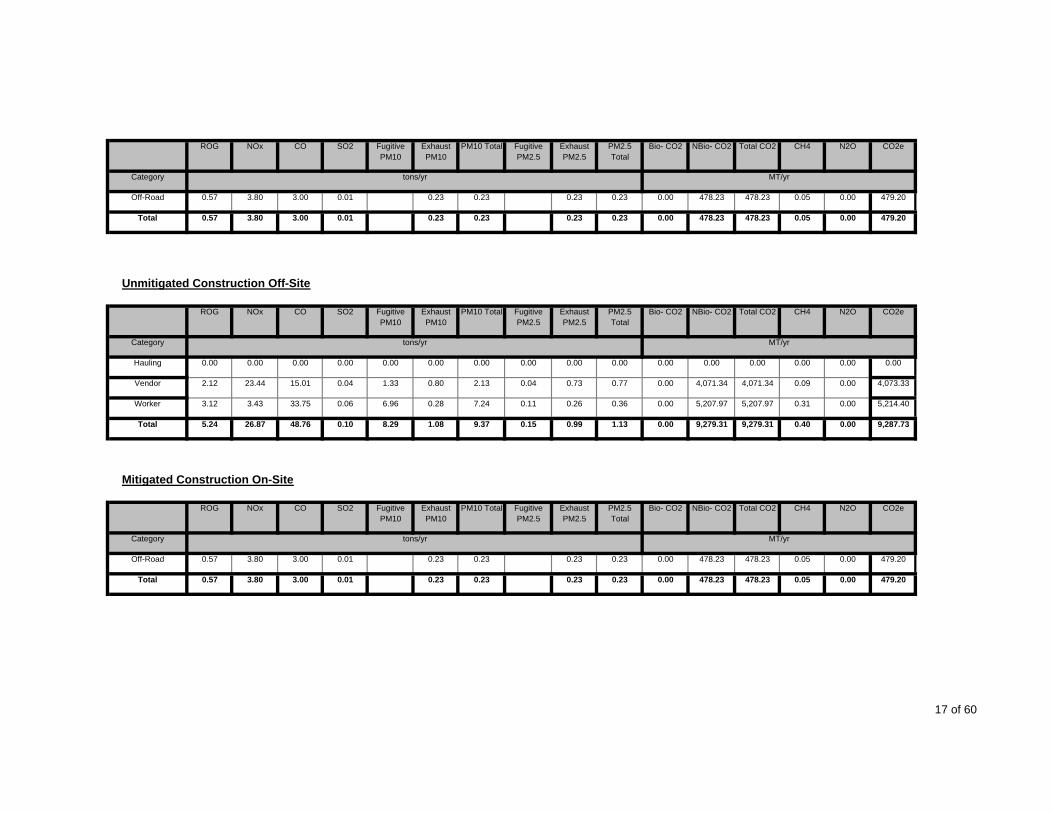
Exhaust PM10
PM10 Total PM2.5 Total
Bio- CO2ROG NOx CO SO2 Fugitive PM10
CO2e
Category tons/yr MT/yr
NBio- CO2 Total CO2 CH4 N2OFugitive PM2.5
Exhaust PM2.5
Off-Road 0.57 3.80 3.00 0.01 0.23 0.23 0.23 0.23 0.00 478.23 478.23 0.05 0.00 479.20
Total 0.57 3.80 3.00 0.01 0.23 0.23 0.00 479.200.23 0.23 0.00 478.23
Exhaust PM10
PM10 Total
478.23 0.05
PM2.5 Total
Bio- CO2
Unmitigated Construction Off-Site
ROG NOx CO SO2 Fugitive PM10
CO2e
Category tons/yr MT/yr
NBio- CO2 Total CO2 CH4 N2OFugitive PM2.5
Exhaust PM2.5
Hauling 0.00 0.00 0.00 0.00 0.00 0.00 0.00 0.00 0.00 0.00 0.00 0.00 0.00 0.00 0.00 0.00
Vendor 2.12 23.44 15.01 0.04 1.33 0.80 2.13 0.04 0.73 0.77 0.00 4,071.34 4,071.34 0.09 0.00 4,073.33
Worker 3.12 3.43 33.75 0.06 6.96 0.28 7.24 0.11 0.26 0.36 0.00 5,207.97 5,207.97 0.31 0.00 5,214.40
Total 5.24 26.87 48.76 0.10 8.29 1.08 9.37 0.15 0.00 9,287.730.99 1.13 0.00 9,279.31
Exhaust PM10
PM10 Total
9,279.31 0.40
PM2.5 Total
Bio- CO2
Mitigated Construction On-Site
ROG NOx CO SO2 Fugitive PM10
CO2e
Category tons/yr MT/yr
NBio- CO2 Total CO2 CH4 N2OFugitive PM2.5
Exhaust PM2.5
Off-Road 0.57 3.80 3.00 0.01 0.23 0.23 0.23 0.23 0.00 478.23 478.23 0.05 0.00 479.20
Total 0.57 3.80 3.00 0.01 0.23 0.23 0.00 479.200.23 0.23 0.00 478.23 478.23 0.05
17 of 60

Exhaust PM10
PM10 Total PM2.5 Total
Bio- CO2
Mitigated Construction Off-Site
ROG NOx CO SO2 Fugitive PM10
CO2e
Category tons/yr MT/yr
NBio- CO2 Total CO2 CH4 N2OFugitive PM2.5
Exhaust PM2.5
Hauling 0.00 0.00 0.00 0.00 0.00 0.00 0.00 0.00 0.00 0.00 0.00 0.00 0.00 0.00 0.00 0.00
Vendor 2.12 23.44 15.01 0.04 0.12 0.80 0.91 0.04 0.73 0.77 0.00 4,071.34 4,071.34 0.09 0.00 4,073.33
Worker 3.12 3.43 33.75 0.06 0.30 0.28 0.58 0.11 0.26 0.36 0.00 5,207.97 5,207.97 0.31 0.00 5,214.40
Total 5.24 26.87 48.76 0.10 0.42 1.08 1.49 0.15 0.00 9,287.730.99 1.13 0.00 9,279.31
Exhaust PM10
PM10 Total
9,279.31 0.40
PM2.5 Total
Bio- CO2
3.5 Building Construction - 2016
Unmitigated Construction On-Site
ROG NOx CO SO2 Fugitive PM10
CO2e
Category tons/yr MT/yr
NBio- CO2 Total CO2 CH4 N2OFugitive PM2.5
Exhaust PM2.5
Off-Road 0.52 3.46 2.97 0.01 0.21 0.21 0.21 0.21 0.00 478.23 478.23 0.04 0.00 479.11
Total 0.52 3.46 2.97 0.01 0.21 0.21 0.00 479.110.21 0.21 0.00 478.23
Exhaust PM10
PM10 Total
478.23 0.04
PM2.5 Total
Bio- CO2
Unmitigated Construction Off-Site
ROG NOx CO SO2 Fugitive PM10
CO2e
Category tons/yr MT/yr
NBio- CO2 Total CO2 CH4 N2OFugitive PM2.5
Exhaust PM2.5
Hauling 0.00 0.00 0.00 0.00 0.00 0.00 0.00 0.00 0.00 0.00 0.00 0.00 0.00 0.00 0.00 0.00
Vendor 1.97 21.89 14.01 0.04 1.33 0.74 2.08 0.04 0.68 0.72 0.00 4,076.71 4,076.71 0.09 0.00 4,078.56
Worker 2.93 3.16 31.14 0.06 6.96 0.28 7.24 0.11 0.26 0.37 0.00 5,082.35 5,082.35 0.29 0.00 5,088.35
18 of 60

Total 4.90 25.05 45.15 0.10 8.29 1.02 9.32 0.15 0.00 9,166.910.94 1.09 0.00 9,159.06
Exhaust PM10
PM10 Total
9,159.06 0.38
PM2.5 Total
Bio- CO2
Mitigated Construction On-Site
ROG NOx CO SO2 Fugitive PM10
CO2e
Category tons/yr MT/yr
NBio- CO2 Total CO2 CH4 N2OFugitive PM2.5
Exhaust PM2.5
Off-Road 0.52 3.46 2.97 0.01 0.21 0.21 0.21 0.21 0.00 478.23 478.23 0.04 0.00 479.11
Total 0.52 3.46 2.97 0.01 0.21 0.21 0.00 479.110.21 0.21 0.00 478.23
Exhaust PM10
PM10 Total
478.23 0.04
PM2.5 Total
Bio- CO2
Mitigated Construction Off-Site
ROG NOx CO SO2 Fugitive PM10
CO2e
Category tons/yr MT/yr
NBio- CO2 Total CO2 CH4 N2OFugitive PM2.5
Exhaust PM2.5
Hauling 0.00 0.00 0.00 0.00 0.00 0.00 0.00 0.00 0.00 0.00 0.00 0.00 0.00 0.00 0.00 0.00
Vendor 1.97 21.89 14.01 0.04 0.12 0.74 0.86 0.04 0.68 0.72 0.00 4,076.71 4,076.71 0.09 0.00 4,078.56
Worker 2.93 3.16 31.14 0.06 0.30 0.28 0.58 0.11 0.26 0.37 0.00 5,082.35 5,082.35 0.29 0.00 5,088.35
Total 4.90 25.05 45.15 0.10 0.42 1.02 1.44 0.15 0.00 9,166.910.94 1.09 0.00 9,159.06
Exhaust PM10
PM10 Total
9,159.06 0.38
PM2.5 Total
Bio- CO2
3.5 Building Construction - 2017
Unmitigated Construction On-Site
ROG NOx CO SO2 Fugitive PM10
CO2e
Category tons/yr MT/yr
NBio- CO2 Total CO2 CH4 N2OFugitive PM2.5
Exhaust PM2.5
19 of 60

Off-Road 0.48 3.13 2.94 0.01 0.18 0.18 0.18 0.18 0.00 476.40 476.40 0.04 0.00 477.20
Total 0.48 3.13 2.94 0.01 0.18 0.18 0.00 477.200.18 0.18 0.00 476.40
Exhaust PM10
PM10 Total
476.40 0.04
PM2.5 Total
Bio- CO2
Unmitigated Construction Off-Site
ROG NOx CO SO2 Fugitive PM10
CO2e
Category tons/yr MT/yr
NBio- CO2 Total CO2 CH4 N2OFugitive PM2.5
Exhaust PM2.5
Hauling 0.00 0.00 0.00 0.00 0.00 0.00 0.00 0.00 0.00 0.00 0.00 0.00 0.00 0.00 0.00 0.00
Vendor 1.84 20.48 13.12 0.04 1.33 0.70 2.02 0.04 0.64 0.68 0.00 4,065.81 4,065.81 0.08 0.00 4,067.53
Worker 2.74 2.90 28.59 0.06 6.93 0.28 7.21 0.11 0.26 0.36 0.00 4,947.32 4,947.32 0.26 0.00 4,952.87
Total 4.58 23.38 41.71 0.10 8.26 0.98 9.23 0.15 0.00 9,020.400.90 1.04 0.00 9,013.13
Exhaust PM10
PM10 Total
9,013.13 0.34
PM2.5 Total
Bio- CO2
Mitigated Construction On-Site
ROG NOx CO SO2 Fugitive PM10
CO2e
Category tons/yr MT/yr
NBio- CO2 Total CO2 CH4 N2OFugitive PM2.5
Exhaust PM2.5
Off-Road 0.48 3.13 2.94 0.01 0.18 0.18 0.18 0.18 0.00 476.40 476.40 0.04 0.00 477.20
Total 0.48 3.13 2.94 0.01 0.18 0.18 0.00 477.200.18 0.18 0.00 476.40
Exhaust PM10
PM10 Total
476.40 0.04
PM2.5 Total
Bio- CO2
Mitigated Construction Off-Site
ROG NOx CO SO2 Fugitive PM10
CO2eNBio- CO2 Total CO2 CH4 N2OFugitive PM2.5
Exhaust PM2.5
20 of 60

Category tons/yr MT/yr
Hauling 0.00 0.00 0.00 0.00 0.00 0.00 0.00 0.00 0.00 0.00 0.00 0.00 0.00 0.00 0.00 0.00
Vendor 1.84 20.48 13.12 0.04 0.12 0.70 0.81 0.04 0.64 0.68 0.00 4,065.81 4,065.81 0.08 0.00 4,067.53
Worker 2.74 2.90 28.59 0.06 0.30 0.28 0.57 0.11 0.26 0.36 0.00 4,947.32 4,947.32 0.26 0.00 4,952.87
Total 4.58 23.38 41.71 0.10 0.42 0.98 1.38 0.15 0.00 9,020.400.90 1.04 0.00 9,013.13
Exhaust PM10
PM10 Total
9,013.13 0.34
PM2.5 Total
Bio- CO2
3.5 Building Construction - 2018
Unmitigated Construction On-Site
ROG NOx CO SO2 Fugitive PM10
CO2e
Category tons/yr MT/yr
NBio- CO2 Total CO2 CH4 N2OFugitive PM2.5
Exhaust PM2.5
Off-Road 0.44 2.84 2.93 0.01 0.16 0.16 0.16 0.16 0.00 478.23 478.23 0.04 0.00 478.97
Total 0.44 2.84 2.93 0.01 0.16 0.16 0.00 478.970.16 0.16 0.00 478.23
Exhaust PM10
PM10 Total
478.23 0.04
PM2.5 Total
Bio- CO2
Unmitigated Construction Off-Site
ROG NOx CO SO2 Fugitive PM10
CO2e
Category tons/yr MT/yr
NBio- CO2 Total CO2 CH4 N2OFugitive PM2.5
Exhaust PM2.5
Hauling 0.00 0.00 0.00 0.00 0.00 0.00 0.00 0.00 0.00 0.00 0.00 0.00 0.00 0.00 0.00 0.00
Vendor 1.74 19.39 12.42 0.04 1.33 0.66 1.99 0.04 0.61 0.64 0.00 4,085.70 4,085.70 0.08 0.00 4,087.32
Worker 2.58 2.68 26.51 0.06 6.96 0.28 7.24 0.11 0.26 0.37 0.00 4,858.17 4,858.17 0.25 0.00 4,863.38
Total 4.32 22.07 38.93 0.10 8.29 0.94 9.23 0.15 0.00 8,950.700.87 1.01 0.00 8,943.87 8,943.87 0.33
21 of 60

Exhaust PM10
PM10 Total PM2.5 Total
Bio- CO2
Mitigated Construction On-Site
ROG NOx CO SO2 Fugitive PM10
CO2e
Category tons/yr MT/yr
NBio- CO2 Total CO2 CH4 N2OFugitive PM2.5
Exhaust PM2.5
Off-Road 0.44 2.84 2.93 0.01 0.16 0.16 0.16 0.16 0.00 478.23 478.23 0.04 0.00 478.97
Total 0.44 2.84 2.93 0.01 0.16 0.16 0.00 478.970.16 0.16 0.00 478.23
Exhaust PM10
PM10 Total
478.23 0.04
PM2.5 Total
Bio- CO2
Mitigated Construction Off-Site
ROG NOx CO SO2 Fugitive PM10
CO2e
Category tons/yr MT/yr
NBio- CO2 Total CO2 CH4 N2OFugitive PM2.5
Exhaust PM2.5
Hauling 0.00 0.00 0.00 0.00 0.00 0.00 0.00 0.00 0.00 0.00 0.00 0.00 0.00 0.00 0.00 0.00
Vendor 1.74 19.39 12.42 0.04 0.12 0.66 0.78 0.04 0.61 0.64 0.00 4,085.70 4,085.70 0.08 0.00 4,087.32
Worker 2.58 2.68 26.51 0.06 0.30 0.28 0.58 0.11 0.26 0.37 0.00 4,858.17 4,858.17 0.25 0.00 4,863.38
Total 4.32 22.07 38.93 0.10 0.42 0.94 1.36 0.15 0.00 8,950.700.87 1.01 0.00 8,943.87
Exhaust PM10
PM10 Total
8,943.87 0.33
PM2.5 Total
Bio- CO2
3.5 Building Construction - 2019
Unmitigated Construction On-Site
ROG NOx CO SO2 Fugitive PM10
CO2e
Category tons/yr MT/yr
NBio- CO2 Total CO2 CH4 N2OFugitive PM2.5
Exhaust PM2.5
Off-Road 0.40 2.57 2.92 0.01 0.13 0.13 0.13 0.13 0.00 478.23 478.23 0.03 0.00 478.91
Total 0.40 2.57 2.92 0.01 0.13 0.13 0.00 478.910.13 0.13 0.00 478.23 478.23 0.03
22 of 60

Exhaust PM10
PM10 Total PM2.5 Total
Bio- CO2
Unmitigated Construction Off-Site
ROG NOx CO SO2 Fugitive PM10
CO2e
Category tons/yr MT/yr
NBio- CO2 Total CO2 CH4 N2OFugitive PM2.5
Exhaust PM2.5
Hauling 0.00 0.00 0.00 0.00 0.00 0.00 0.00 0.00 0.00 0.00 0.00 0.00 0.00 0.00 0.00 0.00
Vendor 1.64 18.40 11.72 0.04 1.33 0.62 1.96 0.04 0.57 0.61 0.00 4,090.29 4,090.29 0.07 0.00 4,091.81
Worker 2.46 2.49 24.75 0.06 6.96 0.28 7.24 0.11 0.26 0.37 0.00 4,759.38 4,759.38 0.23 0.00 4,764.28
Total 4.10 20.89 36.47 0.10 8.29 0.90 9.20 0.15 0.00 8,856.090.83 0.98 0.00 8,849.67
Exhaust PM10
PM10 Total
8,849.67 0.30
PM2.5 Total
Bio- CO2
Mitigated Construction On-Site
ROG NOx CO SO2 Fugitive PM10
CO2e
Category tons/yr MT/yr
NBio- CO2 Total CO2 CH4 N2OFugitive PM2.5
Exhaust PM2.5
Off-Road 0.40 2.57 2.92 0.01 0.13 0.13 0.13 0.13 0.00 478.23 478.23 0.03 0.00 478.91
Total 0.40 2.57 2.92 0.01 0.13 0.13 0.00 478.910.13 0.13 0.00 478.23
Exhaust PM10
PM10 Total
478.23 0.03
PM2.5 Total
Bio- CO2
Mitigated Construction Off-Site
ROG NOx CO SO2 Fugitive PM10
CO2e
Category tons/yr MT/yr
NBio- CO2 Total CO2 CH4 N2OFugitive PM2.5
Exhaust PM2.5
Hauling 0.00 0.00 0.00 0.00 0.00 0.00 0.00 0.00 0.00 0.00 0.00 0.00 0.00 0.00 0.00 0.00
23 of 60

Vendor 1.64 18.40 11.72 0.04 0.12 0.62 0.74 0.04 0.57 0.61 0.00 4,090.29 4,090.29 0.07 0.00 4,091.81
Worker 2.46 2.49 24.75 0.06 0.30 0.28 0.58 0.11 0.26 0.37 0.00 4,759.38 4,759.38 0.23 0.00 4,764.28
Total 4.10 20.89 36.47 0.10 0.42 0.90 1.32 0.15 0.00 8,856.090.83 0.98 0.00 8,849.67
Exhaust PM10
PM10 Total
8,849.67 0.30
PM2.5 Total
Bio- CO2
3.5 Building Construction - 2020
Unmitigated Construction On-Site
ROG NOx CO SO2 Fugitive PM10
CO2e
Category tons/yr MT/yr
NBio- CO2 Total CO2 CH4 N2OFugitive PM2.5
Exhaust PM2.5
Off-Road 0.37 2.34 2.91 0.01 0.11 0.11 0.11 0.11 0.00 480.06 480.06 0.03 0.00 480.68
Total 0.37 2.34 2.91 0.01 0.11 0.11 0.00 480.680.11 0.11 0.00 480.06
Exhaust PM10
PM10 Total
480.06 0.03
PM2.5 Total
Bio- CO2
Unmitigated Construction Off-Site
ROG NOx CO SO2 Fugitive PM10
CO2e
Category tons/yr MT/yr
NBio- CO2 Total CO2 CH4 N2OFugitive PM2.5
Exhaust PM2.5
Hauling 0.00 0.00 0.00 0.00 0.00 0.00 0.00 0.00 0.00 0.00 0.00 0.00 0.00 0.00 0.00 0.00
Vendor 1.57 17.62 11.21 0.04 1.34 0.60 1.94 0.04 0.55 0.59 0.00 4,109.83 4,109.83 0.07 0.00 4,111.28
Worker 2.37 2.34 23.33 0.06 6.99 0.28 7.27 0.11 0.26 0.37 0.00 4,686.80 4,686.80 0.22 0.00 4,691.45
Total 3.94 19.96 34.54 0.10 8.33 0.88 9.21 0.15 0.00 8,802.730.81 0.96 0.00 8,796.63 8,796.63 0.29
Mitigated Construction On-Site
24 of 60

Exhaust PM10
PM10 Total PM2.5 Total
Bio- CO2ROG NOx CO SO2 Fugitive PM10
CO2e
Category tons/yr MT/yr
NBio- CO2 Total CO2 CH4 N2OFugitive PM2.5
Exhaust PM2.5
Off-Road 0.37 2.34 2.91 0.01 0.11 0.11 0.11 0.11 0.00 480.06 480.06 0.03 0.00 480.68
Total 0.37 2.34 2.91 0.01 0.11 0.11 0.00 480.680.11 0.11 0.00 480.06
Exhaust PM10
PM10 Total
480.06 0.03
PM2.5 Total
Bio- CO2
Mitigated Construction Off-Site
ROG NOx CO SO2 Fugitive PM10
CO2e
Category tons/yr MT/yr
NBio- CO2 Total CO2 CH4 N2OFugitive PM2.5
Exhaust PM2.5
Hauling 0.00 0.00 0.00 0.00 0.00 0.00 0.00 0.00 0.00 0.00 0.00 0.00 0.00 0.00 0.00 0.00
Vendor 1.57 17.62 11.21 0.04 0.12 0.60 0.72 0.04 0.55 0.59 0.00 4,109.83 4,109.83 0.07 0.00 4,111.28
Worker 2.37 2.34 23.33 0.06 0.30 0.28 0.58 0.11 0.26 0.37 0.00 4,686.80 4,686.80 0.22 0.00 4,691.45
Total 3.94 19.96 34.54 0.10 0.42 0.88 1.30 0.15 0.00 8,802.730.81 0.96 0.00 8,796.63
Exhaust PM10
PM10 Total
8,796.63 0.29
PM2.5 Total
Bio- CO2
3.5 Building Construction - 2021
Unmitigated Construction On-Site
ROG NOx CO SO2 Fugitive PM10
CO2e
Category tons/yr MT/yr
NBio- CO2 Total CO2 CH4 N2OFugitive PM2.5
Exhaust PM2.5
Off-Road 0.33 2.10 2.88 0.01 0.10 0.10 0.10 0.10 0.00 478.23 478.23 0.03 0.00 478.79
Total 0.33 2.10 2.88 0.01 0.10 0.10 0.00 478.790.10 0.10 0.00 478.23 478.23 0.03
25 of 60

Exhaust PM10
PM10 Total PM2.5 Total
Bio- CO2
Unmitigated Construction Off-Site
ROG NOx CO SO2 Fugitive PM10
CO2e
Category tons/yr MT/yr
NBio- CO2 Total CO2 CH4 N2OFugitive PM2.5
Exhaust PM2.5
Hauling 0.00 0.00 0.00 0.00 0.00 0.00 0.00 0.00 0.00 0.00 0.00 0.00 0.00 0.00 0.00 0.00
Vendor 1.49 16.87 10.63 0.04 1.33 0.57 1.91 0.04 0.53 0.57 0.00 4,097.80 4,097.80 0.07 0.00 4,099.17
Worker 2.28 2.19 22.25 0.06 6.96 0.28 7.25 0.11 0.26 0.37 0.00 4,629.86 4,629.86 0.21 0.00 4,634.33
Total 3.77 19.06 32.88 0.10 8.29 0.85 9.16 0.15 0.00 8,733.500.79 0.94 0.00 8,727.66
Exhaust PM10
PM10 Total
8,727.66 0.28
PM2.5 Total
Bio- CO2
Mitigated Construction On-Site
ROG NOx CO SO2 Fugitive PM10
CO2e
Category tons/yr MT/yr
NBio- CO2 Total CO2 CH4 N2OFugitive PM2.5
Exhaust PM2.5
Off-Road 0.33 2.10 2.88 0.01 0.10 0.10 0.10 0.10 0.00 478.23 478.23 0.03 0.00 478.79
Total 0.33 2.10 2.88 0.01 0.10 0.10 0.00 478.790.10 0.10 0.00 478.23
Exhaust PM10
PM10 Total
478.23 0.03
PM2.5 Total
Bio- CO2
Mitigated Construction Off-Site
ROG NOx CO SO2 Fugitive PM10
CO2e
Category tons/yr MT/yr
NBio- CO2 Total CO2 CH4 N2OFugitive PM2.5
Exhaust PM2.5
Hauling 0.00 0.00 0.00 0.00 0.00 0.00 0.00 0.00 0.00 0.00 0.00 0.00 0.00 0.00 0.00 0.00
Vendor 1.49 16.87 10.63 0.04 0.12 0.57 0.69 0.04 0.53 0.57 0.00 4,097.80 4,097.80 0.07 0.00 4,099.17
Worker 2.28 2.19 22.25 0.06 0.30 0.28 0.58 0.11 0.26 0.37 0.00 4,629.86 4,629.86 0.21 0.00 4,634.33
26 of 60

Total 3.77 19.06 32.88 0.10 0.42 0.85 1.27 0.15 0.00 8,733.500.79 0.94 0.00 8,727.66
Exhaust PM10
PM10 Total
8,727.66 0.28
PM2.5 Total
Bio- CO2
3.5 Building Construction - 2022
Unmitigated Construction On-Site
ROG NOx CO SO2 Fugitive PM10
CO2e
Category tons/yr MT/yr
NBio- CO2 Total CO2 CH4 N2OFugitive PM2.5
Exhaust PM2.5
Off-Road 0.31 1.89 2.86 0.01 0.08 0.08 0.08 0.08 0.00 476.40 476.40 0.02 0.00 476.92
Total 0.31 1.89 2.86 0.01 0.08 0.08 0.00 476.920.08 0.08 0.00 476.40
Exhaust PM10
PM10 Total
476.40 0.02
PM2.5 Total
Bio- CO2
Unmitigated Construction Off-Site
ROG NOx CO SO2 Fugitive PM10
CO2e
Category tons/yr MT/yr
NBio- CO2 Total CO2 CH4 N2OFugitive PM2.5
Exhaust PM2.5
Hauling 0.00 0.00 0.00 0.00 0.00 0.00 0.00 0.00 0.00 0.00 0.00 0.00 0.00 0.00 0.00 0.00
Vendor 1.42 16.23 10.13 0.04 1.33 0.55 1.88 0.04 0.51 0.55 0.00 4,085.36 4,085.36 0.06 0.00 4,086.67
Worker 2.19 2.05 20.96 0.06 6.93 0.28 7.22 0.11 0.26 0.37 0.00 4,536.37 4,536.37 0.20 0.00 4,540.60
Total 3.61 18.28 31.09 0.10 8.26 0.83 9.10 0.15 0.00 8,627.270.77 0.92 0.00 8,621.73
Exhaust PM10
PM10 Total
8,621.73 0.26
PM2.5 Total
Bio- CO2
Mitigated Construction On-Site
ROG NOx CO SO2 Fugitive PM10
CO2e
Category tons/yr MT/yr
NBio- CO2 Total CO2 CH4 N2OFugitive PM2.5
Exhaust PM2.5
27 of 60

Off-Road 0.31 1.89 2.86 0.01 0.08 0.08 0.08 0.08 0.00 476.40 476.40 0.02 0.00 476.92
Total 0.31 1.89 2.86 0.01 0.08 0.08 0.00 476.920.08 0.08 0.00 476.40
Exhaust PM10
PM10 Total
476.40 0.02
PM2.5 Total
Bio- CO2
Mitigated Construction Off-Site
ROG NOx CO SO2 Fugitive PM10
CO2e
Category tons/yr MT/yr
NBio- CO2 Total CO2 CH4 N2OFugitive PM2.5
Exhaust PM2.5
Hauling 0.00 0.00 0.00 0.00 0.00 0.00 0.00 0.00 0.00 0.00 0.00 0.00 0.00 0.00 0.00 0.00
Vendor 1.42 16.23 10.13 0.04 0.12 0.55 0.67 0.04 0.51 0.55 0.00 4,085.36 4,085.36 0.06 0.00 4,086.67
Worker 2.19 2.05 20.96 0.06 0.30 0.28 0.58 0.11 0.26 0.37 0.00 4,536.37 4,536.37 0.20 0.00 4,540.60
Total 3.61 18.28 31.09 0.10 0.42 0.83 1.25 0.15 0.00 8,627.270.77 0.92 0.00 8,621.73
Exhaust PM10
PM10 Total
8,621.73 0.26
PM2.5 Total
Bio- CO2
3.5 Building Construction - 2023
Unmitigated Construction On-Site
ROG NOx CO SO2 Fugitive PM10
CO2e
Category tons/yr MT/yr
NBio- CO2 Total CO2 CH4 N2OFugitive PM2.5
Exhaust PM2.5
Off-Road 0.29 1.72 2.86 0.01 0.07 0.07 0.07 0.07 0.00 476.40 476.40 0.02 0.00 476.89
Total 0.29 1.72 2.86 0.01 0.07 0.07 0.00 476.890.07 0.07 0.00 476.40
Exhaust PM10
PM10 Total
476.40 0.02
PM2.5 Total
Bio- CO2
Unmitigated Construction Off-Site
ROG NOx CO SO2 Fugitive PM10
CO2eNBio- CO2 Total CO2 CH4 N2OFugitive PM2.5
Exhaust PM2.5
28 of 60

Category tons/yr MT/yr
Hauling 0.00 0.00 0.00 0.00 0.00 0.00 0.00 0.00 0.00 0.00 0.00 0.00 0.00 0.00 0.00 0.00
Vendor 1.37 15.76 9.76 0.04 1.33 0.54 1.87 0.04 0.50 0.54 0.00 4,088.33 4,088.33 0.06 0.00 4,089.59
Worker 2.11 1.92 19.82 0.06 6.93 0.28 7.22 0.11 0.26 0.37 0.00 4,466.99 4,466.99 0.19 0.00 4,471.04
Total 3.48 17.68 29.58 0.10 8.26 0.82 9.09 0.15 0.00 8,560.630.76 0.91 0.00 8,555.32
Exhaust PM10
PM10 Total
8,555.32 0.25
PM2.5 Total
Bio- CO2
Mitigated Construction On-Site
ROG NOx CO SO2 Fugitive PM10
CO2e
Category tons/yr MT/yr
NBio- CO2 Total CO2 CH4 N2OFugitive PM2.5
Exhaust PM2.5
Off-Road 0.29 1.72 2.86 0.01 0.07 0.07 0.07 0.07 0.00 476.40 476.40 0.02 0.00 476.89
Total 0.29 1.72 2.86 0.01 0.07 0.07 0.00 476.890.07 0.07 0.00 476.40
Exhaust PM10
PM10 Total
476.40 0.02
PM2.5 Total
Bio- CO2
Mitigated Construction Off-Site
ROG NOx CO SO2 Fugitive PM10
CO2e
Category tons/yr MT/yr
NBio- CO2 Total CO2 CH4 N2OFugitive PM2.5
Exhaust PM2.5
Hauling 0.00 0.00 0.00 0.00 0.00 0.00 0.00 0.00 0.00 0.00 0.00 0.00 0.00 0.00 0.00 0.00
Vendor 1.37 15.76 9.76 0.04 0.12 0.54 0.66 0.04 0.50 0.54 0.00 4,088.33 4,088.33 0.06 0.00 4,089.59
Worker 2.11 1.92 19.82 0.06 0.30 0.28 0.58 0.11 0.26 0.37 0.00 4,466.99 4,466.99 0.19 0.00 4,471.04
Total 3.48 17.68 29.58 0.10 0.42 0.82 1.24 0.15 0.00 8,560.630.76 0.91 0.00 8,555.32 8,555.32 0.25
3.5 Building Construction - 2024
29 of 60

Exhaust PM10
PM10 Total PM2.5 Total
Bio- CO2
Unmitigated Construction On-Site
ROG NOx CO SO2 Fugitive PM10
CO2e
Category tons/yr MT/yr
NBio- CO2 Total CO2 CH4 N2OFugitive PM2.5
Exhaust PM2.5
Off-Road 0.28 1.58 2.87 0.01 0.06 0.06 0.06 0.06 0.00 480.06 480.06 0.02 0.00 480.53
Total 0.28 1.58 2.87 0.01 0.06 0.06 0.00 480.530.06 0.06 0.00 480.06
Exhaust PM10
PM10 Total
480.06 0.02
PM2.5 Total
Bio- CO2
Unmitigated Construction Off-Site
ROG NOx CO SO2 Fugitive PM10
CO2e
Category tons/yr MT/yr
NBio- CO2 Total CO2 CH4 N2OFugitive PM2.5
Exhaust PM2.5
Hauling 0.00 0.00 0.00 0.00 0.00 0.00 0.00 0.00 0.00 0.00 0.00 0.00 0.00 0.00 0.00 0.00
Vendor 1.34 15.49 9.43 0.04 1.34 0.53 1.87 0.04 0.49 0.53 0.00 4,122.85 4,122.85 0.06 0.00 4,124.08
Worker 2.05 1.83 18.99 0.06 6.99 0.29 7.27 0.11 0.27 0.37 0.00 4,438.06 4,438.06 0.19 0.00 4,441.98
Total 3.39 17.32 28.42 0.10 8.33 0.82 9.14 0.15 0.00 8,566.060.76 0.90 0.00 8,560.91
Exhaust PM10
PM10 Total
8,560.91 0.25
PM2.5 Total
Bio- CO2
Mitigated Construction On-Site
ROG NOx CO SO2 Fugitive PM10
CO2e
Category tons/yr MT/yr
NBio- CO2 Total CO2 CH4 N2OFugitive PM2.5
Exhaust PM2.5
Off-Road 0.28 1.58 2.87 0.01 0.06 0.06 0.06 0.06 0.00 480.06 480.06 0.02 0.00 480.53
Total 0.28 1.58 2.87 0.01 0.06 0.06 0.00 480.530.06 0.06 0.00 480.06 480.06 0.02
30 of 60

Exhaust PM10
PM10 Total PM2.5 Total
Bio- CO2
Mitigated Construction Off-Site
ROG NOx CO SO2 Fugitive PM10
CO2e
Category tons/yr MT/yr
NBio- CO2 Total CO2 CH4 N2OFugitive PM2.5
Exhaust PM2.5
Hauling 0.00 0.00 0.00 0.00 0.00 0.00 0.00 0.00 0.00 0.00 0.00 0.00 0.00 0.00 0.00 0.00
Vendor 1.34 15.49 9.43 0.04 0.12 0.53 0.65 0.04 0.49 0.53 0.00 4,122.85 4,122.85 0.06 0.00 4,124.08
Worker 2.05 1.83 18.99 0.06 0.30 0.29 0.58 0.11 0.27 0.37 0.00 4,438.06 4,438.06 0.19 0.00 4,441.98
Total 3.39 17.32 28.42 0.10 0.42 0.82 1.23 0.15 0.00 8,566.060.76 0.90 0.00 8,560.91
Exhaust PM10
PM10 Total
8,560.91 0.25
PM2.5 Total
Bio- CO2
3.5 Building Construction - 2025
Unmitigated Construction On-Site
ROG NOx CO SO2 Fugitive PM10
CO2e
Category tons/yr MT/yr
NBio- CO2 Total CO2 CH4 N2OFugitive PM2.5
Exhaust PM2.5
Off-Road 0.26 1.44 2.86 0.01 0.05 0.05 0.05 0.05 0.00 478.23 478.23 0.02 0.00 478.66
Total 0.26 1.44 2.86 0.01 0.05 0.05 0.00 478.660.05 0.05 0.00 478.23
Exhaust PM10
PM10 Total
478.23 0.02
PM2.5 Total
Bio- CO2
Unmitigated Construction Off-Site
ROG NOx CO SO2 Fugitive PM10
CO2e
Category tons/yr MT/yr
NBio- CO2 Total CO2 CH4 N2OFugitive PM2.5
Exhaust PM2.5
Hauling 0.00 0.00 0.00 0.00 0.00 0.00 0.00 0.00 0.00 0.00 0.00 0.00 0.00 0.00 0.00 0.00
31 of 60

Vendor 1.30 15.10 9.12 0.04 1.33 0.52 1.85 0.04 0.48 0.52 0.00 4,109.31 4,109.31 0.06 0.00 4,110.50
Worker 1.97 1.73 18.07 0.06 6.96 0.29 7.25 0.11 0.26 0.37 0.00 4,364.72 4,364.72 0.18 0.00 4,368.45
Total 3.27 16.83 27.19 0.10 8.29 0.81 9.10 0.15 0.00 8,478.950.74 0.89 0.00 8,474.03
Exhaust PM10
PM10 Total
8,474.03 0.24
PM2.5 Total
Bio- CO2
Mitigated Construction On-Site
ROG NOx CO SO2 Fugitive PM10
CO2e
Category tons/yr MT/yr
NBio- CO2 Total CO2 CH4 N2OFugitive PM2.5
Exhaust PM2.5
Off-Road 0.26 1.44 2.86 0.01 0.05 0.05 0.05 0.05 0.00 478.23 478.23 0.02 0.00 478.66
Total 0.26 1.44 2.86 0.01 0.05 0.05 0.00 478.660.05 0.05 0.00 478.23
Exhaust PM10
PM10 Total
478.23 0.02
PM2.5 Total
Bio- CO2
Mitigated Construction Off-Site
ROG NOx CO SO2 Fugitive PM10
CO2e
Category tons/yr MT/yr
NBio- CO2 Total CO2 CH4 N2OFugitive PM2.5
Exhaust PM2.5
Hauling 0.00 0.00 0.00 0.00 0.00 0.00 0.00 0.00 0.00 0.00 0.00 0.00 0.00 0.00 0.00 0.00
Vendor 1.30 15.10 9.12 0.04 0.12 0.52 0.64 0.04 0.48 0.52 0.00 4,109.31 4,109.31 0.06 0.00 4,110.50
Worker 1.97 1.73 18.07 0.06 0.30 0.29 0.58 0.11 0.26 0.37 0.00 4,364.72 4,364.72 0.18 0.00 4,368.45
Total 3.27 16.83 27.19 0.10 0.42 0.81 1.22 0.15 0.00 8,478.950.74 0.89 0.00 8,474.03 8,474.03 0.24
3.5 Building Construction - 2026
Unmitigated Construction On-Site
32 of 60

Exhaust PM10
PM10 Total PM2.5 Total
Bio- CO2ROG NOx CO SO2 Fugitive PM10
CO2e
Category tons/yr MT/yr
NBio- CO2 Total CO2 CH4 N2OFugitive PM2.5
Exhaust PM2.5
Off-Road 0.26 1.44 2.86 0.01 0.05 0.05 0.05 0.05 0.00 478.23 478.23 0.02 0.00 478.66
Total 0.26 1.44 2.86 0.01 0.05 0.05 0.00 478.660.05 0.05 0.00 478.23
Exhaust PM10
PM10 Total
478.23 0.02
PM2.5 Total
Bio- CO2
Unmitigated Construction Off-Site
ROG NOx CO SO2 Fugitive PM10
CO2e
Category tons/yr MT/yr
NBio- CO2 Total CO2 CH4 N2OFugitive PM2.5
Exhaust PM2.5
Hauling 0.00 0.00 0.00 0.00 0.00 0.00 0.00 0.00 0.00 0.00 0.00 0.00 0.00 0.00 0.00 0.00
Vendor 1.30 15.10 9.12 0.04 1.33 0.52 1.85 0.04 0.48 0.52 0.00 4,109.31 4,109.31 0.06 0.00 4,110.50
Worker 1.97 1.73 18.07 0.06 6.96 0.29 7.25 0.11 0.26 0.37 0.00 4,364.72 4,364.72 0.18 0.00 4,368.45
Total 3.27 16.83 27.19 0.10 8.29 0.81 9.10 0.15 0.00 8,478.950.74 0.89 0.00 8,474.03
Exhaust PM10
PM10 Total
8,474.03 0.24
PM2.5 Total
Bio- CO2
Mitigated Construction On-Site
ROG NOx CO SO2 Fugitive PM10
CO2e
Category tons/yr MT/yr
NBio- CO2 Total CO2 CH4 N2OFugitive PM2.5
Exhaust PM2.5
Off-Road 0.26 1.44 2.86 0.01 0.05 0.05 0.05 0.05 0.00 478.23 478.23 0.02 0.00 478.66
Total 0.26 1.44 2.86 0.01 0.05 0.05 0.00 478.660.05 0.05 0.00 478.23 478.23 0.02
33 of 60

Exhaust PM10
PM10 Total PM2.5 Total
Bio- CO2
Mitigated Construction Off-Site
ROG NOx CO SO2 Fugitive PM10
CO2e
Category tons/yr MT/yr
NBio- CO2 Total CO2 CH4 N2OFugitive PM2.5
Exhaust PM2.5
Hauling 0.00 0.00 0.00 0.00 0.00 0.00 0.00 0.00 0.00 0.00 0.00 0.00 0.00 0.00 0.00 0.00
Vendor 1.30 15.10 9.12 0.04 0.12 0.52 0.64 0.04 0.48 0.52 0.00 4,109.31 4,109.31 0.06 0.00 4,110.50
Worker 1.97 1.73 18.07 0.06 0.30 0.29 0.58 0.11 0.26 0.37 0.00 4,364.72 4,364.72 0.18 0.00 4,368.45
Total 3.27 16.83 27.19 0.10 0.42 0.81 1.22 0.15 0.00 8,478.950.74 0.89 0.00 8,474.03
Exhaust PM10
PM10 Total
8,474.03 0.24
PM2.5 Total
Bio- CO2
3.5 Building Construction - 2027
Unmitigated Construction On-Site
ROG NOx CO SO2 Fugitive PM10
CO2e
Category tons/yr MT/yr
NBio- CO2 Total CO2 CH4 N2OFugitive PM2.5
Exhaust PM2.5
Off-Road 0.26 1.44 2.86 0.01 0.05 0.05 0.05 0.05 0.00 478.23 478.23 0.02 0.00 478.66
Total 0.26 1.44 2.86 0.01 0.05 0.05 0.00 478.660.05 0.05 0.00 478.23
Exhaust PM10
PM10 Total
478.23 0.02
PM2.5 Total
Bio- CO2
Unmitigated Construction Off-Site
ROG NOx CO SO2 Fugitive PM10
CO2e
Category tons/yr MT/yr
NBio- CO2 Total CO2 CH4 N2OFugitive PM2.5
Exhaust PM2.5
Hauling 0.00 0.00 0.00 0.00 0.00 0.00 0.00 0.00 0.00 0.00 0.00 0.00 0.00 0.00 0.00 0.00
Vendor 1.30 15.10 9.12 0.04 1.33 0.52 1.85 0.04 0.48 0.52 0.00 4,109.31 4,109.31 0.06 0.00 4,110.50
Worker 1.97 1.73 18.07 0.06 6.96 0.29 7.25 0.11 0.26 0.37 0.00 4,364.72 4,364.72 0.18 0.00 4,368.45
34 of 60

Total 3.27 16.83 27.19 0.10 8.29 0.81 9.10 0.15 0.00 8,478.950.74 0.89 0.00 8,474.03
Exhaust PM10
PM10 Total
8,474.03 0.24
PM2.5 Total
Bio- CO2
Mitigated Construction On-Site
ROG NOx CO SO2 Fugitive PM10
CO2e
Category tons/yr MT/yr
NBio- CO2 Total CO2 CH4 N2OFugitive PM2.5
Exhaust PM2.5
Off-Road 0.26 1.44 2.86 0.01 0.05 0.05 0.05 0.05 0.00 478.23 478.23 0.02 0.00 478.66
Total 0.26 1.44 2.86 0.01 0.05 0.05 0.00 478.660.05 0.05 0.00 478.23
Exhaust PM10
PM10 Total
478.23 0.02
PM2.5 Total
Bio- CO2
Mitigated Construction Off-Site
ROG NOx CO SO2 Fugitive PM10
CO2e
Category tons/yr MT/yr
NBio- CO2 Total CO2 CH4 N2OFugitive PM2.5
Exhaust PM2.5
Hauling 0.00 0.00 0.00 0.00 0.00 0.00 0.00 0.00 0.00 0.00 0.00 0.00 0.00 0.00 0.00 0.00
Vendor 1.30 15.10 9.12 0.04 0.12 0.52 0.64 0.04 0.48 0.52 0.00 4,109.31 4,109.31 0.06 0.00 4,110.50
Worker 1.97 1.73 18.07 0.06 0.30 0.29 0.58 0.11 0.26 0.37 0.00 4,364.72 4,364.72 0.18 0.00 4,368.45
Total 3.27 16.83 27.19 0.10 0.42 0.81 1.22 0.15 0.00 8,478.950.74 0.89 0.00 8,474.03
Exhaust PM10
PM10 Total
8,474.03 0.24
PM2.5 Total
Bio- CO2
3.5 Building Construction - 2028
Unmitigated Construction On-Site
ROG NOx CO SO2 Fugitive PM10
CO2e
Category tons/yr MT/yr
NBio- CO2 Total CO2 CH4 N2OFugitive PM2.5
Exhaust PM2.5
35 of 60
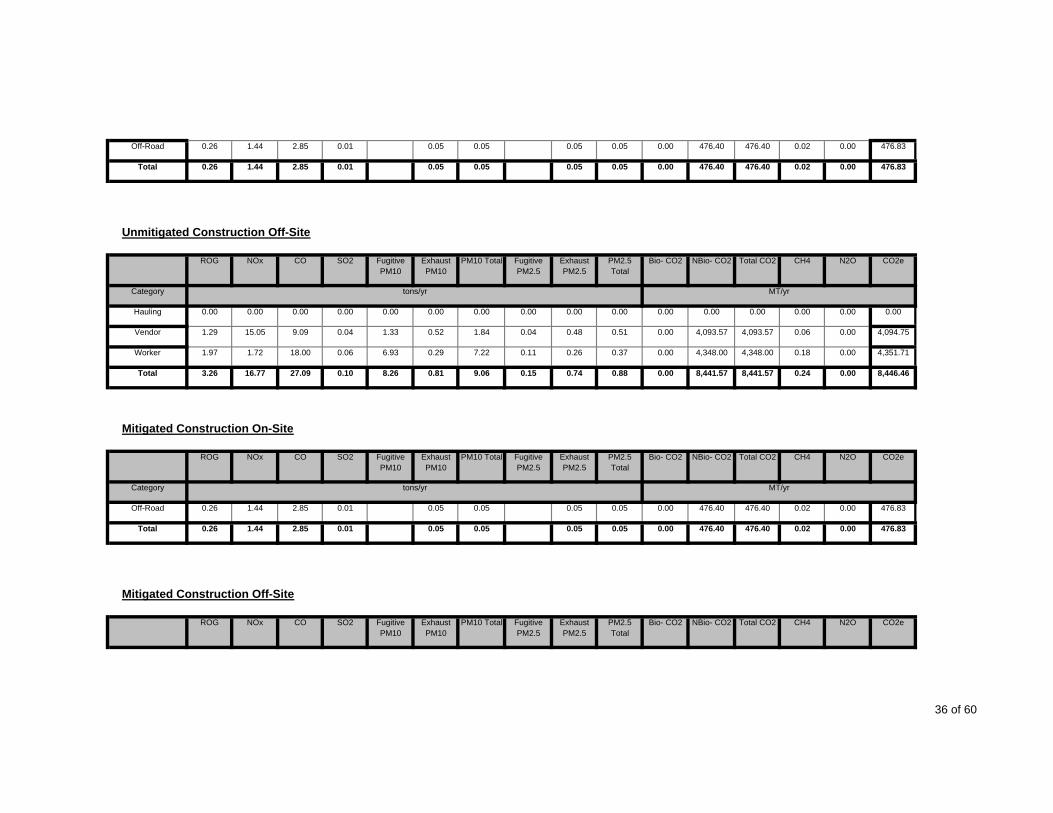
Off-Road 0.26 1.44 2.85 0.01 0.05 0.05 0.05 0.05 0.00 476.40 476.40 0.02 0.00 476.83
Total 0.26 1.44 2.85 0.01 0.05 0.05 0.00 476.830.05 0.05 0.00 476.40
Exhaust PM10
PM10 Total
476.40 0.02
PM2.5 Total
Bio- CO2
Unmitigated Construction Off-Site
ROG NOx CO SO2 Fugitive PM10
CO2e
Category tons/yr MT/yr
NBio- CO2 Total CO2 CH4 N2OFugitive PM2.5
Exhaust PM2.5
Hauling 0.00 0.00 0.00 0.00 0.00 0.00 0.00 0.00 0.00 0.00 0.00 0.00 0.00 0.00 0.00 0.00
Vendor 1.29 15.05 9.09 0.04 1.33 0.52 1.84 0.04 0.48 0.51 0.00 4,093.57 4,093.57 0.06 0.00 4,094.75
Worker 1.97 1.72 18.00 0.06 6.93 0.29 7.22 0.11 0.26 0.37 0.00 4,348.00 4,348.00 0.18 0.00 4,351.71
Total 3.26 16.77 27.09 0.10 8.26 0.81 9.06 0.15 0.00 8,446.460.74 0.88 0.00 8,441.57
Exhaust PM10
PM10 Total
8,441.57 0.24
PM2.5 Total
Bio- CO2
Mitigated Construction On-Site
ROG NOx CO SO2 Fugitive PM10
CO2e
Category tons/yr MT/yr
NBio- CO2 Total CO2 CH4 N2OFugitive PM2.5
Exhaust PM2.5
Off-Road 0.26 1.44 2.85 0.01 0.05 0.05 0.05 0.05 0.00 476.40 476.40 0.02 0.00 476.83
Total 0.26 1.44 2.85 0.01 0.05 0.05 0.00 476.830.05 0.05 0.00 476.40
Exhaust PM10
PM10 Total
476.40 0.02
PM2.5 Total
Bio- CO2
Mitigated Construction Off-Site
ROG NOx CO SO2 Fugitive PM10
CO2eNBio- CO2 Total CO2 CH4 N2OFugitive PM2.5
Exhaust PM2.5
36 of 60

Category tons/yr MT/yr
Hauling 0.00 0.00 0.00 0.00 0.00 0.00 0.00 0.00 0.00 0.00 0.00 0.00 0.00 0.00 0.00 0.00
Vendor 1.29 15.05 9.09 0.04 0.12 0.52 0.63 0.04 0.48 0.51 0.00 4,093.57 4,093.57 0.06 0.00 4,094.75
Worker 1.97 1.72 18.00 0.06 0.30 0.29 0.58 0.11 0.26 0.37 0.00 4,348.00 4,348.00 0.18 0.00 4,351.71
Total 3.26 16.77 27.09 0.10 0.42 0.81 1.21 0.15 0.00 8,446.460.74 0.88 0.00 8,441.57
Exhaust PM10
PM10 Total
8,441.57 0.24
PM2.5 Total
Bio- CO2
3.5 Building Construction - 2029
Unmitigated Construction On-Site
ROG NOx CO SO2 Fugitive PM10
CO2e
Category tons/yr MT/yr
NBio- CO2 Total CO2 CH4 N2OFugitive PM2.5
Exhaust PM2.5
Off-Road 0.26 1.44 2.86 0.01 0.05 0.05 0.05 0.05 0.00 478.23 478.23 0.02 0.00 478.66
Total 0.26 1.44 2.86 0.01 0.05 0.05 0.00 478.660.05 0.05 0.00 478.23
Exhaust PM10
PM10 Total
478.23 0.02
PM2.5 Total
Bio- CO2
Unmitigated Construction Off-Site
ROG NOx CO SO2 Fugitive PM10
CO2e
Category tons/yr MT/yr
NBio- CO2 Total CO2 CH4 N2OFugitive PM2.5
Exhaust PM2.5
Hauling 0.00 0.00 0.00 0.00 0.00 0.00 0.00 0.00 0.00 0.00 0.00 0.00 0.00 0.00 0.00 0.00
Vendor 1.30 15.10 9.12 0.04 1.33 0.52 1.85 0.04 0.48 0.52 0.00 4,109.31 4,109.31 0.06 0.00 4,110.50
Worker 1.97 1.73 18.07 0.06 6.96 0.29 7.25 0.11 0.26 0.37 0.00 4,364.72 4,364.72 0.18 0.00 4,368.45
Total 3.27 16.83 27.19 0.10 8.29 0.81 9.10 0.15 0.00 8,478.950.74 0.89 0.00 8,474.03 8,474.03 0.24
37 of 60

Exhaust PM10
PM10 Total PM2.5 Total
Bio- CO2
Mitigated Construction On-Site
ROG NOx CO SO2 Fugitive PM10
CO2e
Category tons/yr MT/yr
NBio- CO2 Total CO2 CH4 N2OFugitive PM2.5
Exhaust PM2.5
Off-Road 0.26 1.44 2.86 0.01 0.05 0.05 0.05 0.05 0.00 478.23 478.23 0.02 0.00 478.66
Total 0.26 1.44 2.86 0.01 0.05 0.05 0.00 478.660.05 0.05 0.00 478.23
Exhaust PM10
PM10 Total
478.23 0.02
PM2.5 Total
Bio- CO2
Mitigated Construction Off-Site
ROG NOx CO SO2 Fugitive PM10
CO2e
Category tons/yr MT/yr
NBio- CO2 Total CO2 CH4 N2OFugitive PM2.5
Exhaust PM2.5
Hauling 0.00 0.00 0.00 0.00 0.00 0.00 0.00 0.00 0.00 0.00 0.00 0.00 0.00 0.00 0.00 0.00
Vendor 1.30 15.10 9.12 0.04 0.12 0.52 0.64 0.04 0.48 0.52 0.00 4,109.31 4,109.31 0.06 0.00 4,110.50
Worker 1.97 1.73 18.07 0.06 0.30 0.29 0.58 0.11 0.26 0.37 0.00 4,364.72 4,364.72 0.18 0.00 4,368.45
Total 3.27 16.83 27.19 0.10 0.42 0.81 1.22 0.15 0.00 8,478.950.74 0.89 0.00 8,474.03
Exhaust PM10
PM10 Total
8,474.03 0.24
PM2.5 Total
Bio- CO2
3.5 Building Construction - 2030
Unmitigated Construction On-Site
ROG NOx CO SO2 Fugitive PM10
CO2e
Category tons/yr MT/yr
NBio- CO2 Total CO2 CH4 N2OFugitive PM2.5
Exhaust PM2.5
Off-Road 0.22 1.05 2.85 0.01 0.02 0.02 0.02 0.02 0.00 478.23 478.23 0.02 0.00 478.60
Total 0.22 1.05 2.85 0.01 0.02 0.02 0.00 478.600.02 0.02 0.00 478.23 478.23 0.02
38 of 60

Exhaust PM10
PM10 Total PM2.5 Total
Bio- CO2
Unmitigated Construction Off-Site
ROG NOx CO SO2 Fugitive PM10
CO2e
Category tons/yr MT/yr
NBio- CO2 Total CO2 CH4 N2OFugitive PM2.5
Exhaust PM2.5
Hauling 0.00 0.00 0.00 0.00 0.00 0.00 0.00 0.00 0.00 0.00 0.00 0.00 0.00 0.00 0.00 0.00
Vendor 1.19 14.15 8.27 0.04 1.33 0.49 1.82 0.04 0.45 0.49 0.00 4,117.29 4,117.29 0.05 0.00 4,118.37
Worker 1.69 1.38 15.11 0.06 6.96 0.29 7.25 0.11 0.26 0.37 0.00 4,164.03 4,164.03 0.15 0.00 4,167.23
Total 2.88 15.53 23.38 0.10 8.29 0.78 9.07 0.15 0.00 8,285.600.71 0.86 0.00 8,281.32
Exhaust PM10
PM10 Total
8,281.32 0.20
PM2.5 Total
Bio- CO2
Mitigated Construction On-Site
ROG NOx CO SO2 Fugitive PM10
CO2e
Category tons/yr MT/yr
NBio- CO2 Total CO2 CH4 N2OFugitive PM2.5
Exhaust PM2.5
Off-Road 0.22 1.05 2.85 0.01 0.02 0.02 0.02 0.02 0.00 478.23 478.23 0.02 0.00 478.60
Total 0.22 1.05 2.85 0.01 0.02 0.02 0.00 478.600.02 0.02 0.00 478.23
Exhaust PM10
PM10 Total
478.23 0.02
PM2.5 Total
Bio- CO2
Mitigated Construction Off-Site
ROG NOx CO SO2 Fugitive PM10
CO2e
Category tons/yr MT/yr
NBio- CO2 Total CO2 CH4 N2OFugitive PM2.5
Exhaust PM2.5
Hauling 0.00 0.00 0.00 0.00 0.00 0.00 0.00 0.00 0.00 0.00 0.00 0.00 0.00 0.00 0.00 0.00
39 of 60

Vendor 1.19 14.15 8.27 0.04 0.12 0.49 0.60 0.04 0.45 0.49 0.00 4,117.29 4,117.29 0.05 0.00 4,118.37
Worker 1.69 1.38 15.11 0.06 0.30 0.29 0.59 0.11 0.26 0.37 0.00 4,164.03 4,164.03 0.15 0.00 4,167.23
Total 2.88 15.53 23.38 0.10 0.42 0.78 1.19 0.15 0.00 8,285.600.71 0.86 0.00 8,281.32
Exhaust PM10
PM10 Total
8,281.32 0.20
PM2.5 Total
Bio- CO2
3.5 Building Construction - 2031
Unmitigated Construction On-Site
ROG NOx CO SO2 Fugitive PM10
CO2e
Category tons/yr MT/yr
NBio- CO2 Total CO2 CH4 N2OFugitive PM2.5
Exhaust PM2.5
Off-Road 0.22 1.05 2.85 0.01 0.02 0.02 0.02 0.02 0.00 478.23 478.23 0.02 0.00 478.60
Total 0.22 1.05 2.85 0.01 0.02 0.02 0.00 478.600.02 0.02 0.00 478.23
Exhaust PM10
PM10 Total
478.23 0.02
PM2.5 Total
Bio- CO2
Unmitigated Construction Off-Site
ROG NOx CO SO2 Fugitive PM10
CO2e
Category tons/yr MT/yr
NBio- CO2 Total CO2 CH4 N2OFugitive PM2.5
Exhaust PM2.5
Hauling 0.00 0.00 0.00 0.00 0.00 0.00 0.00 0.00 0.00 0.00 0.00 0.00 0.00 0.00 0.00 0.00
Vendor 1.19 14.15 8.27 0.04 1.33 0.49 1.82 0.04 0.45 0.49 0.00 4,117.29 4,117.29 0.05 0.00 4,118.37
Worker 1.69 1.38 15.11 0.06 6.96 0.29 7.25 0.11 0.26 0.37 0.00 4,164.03 4,164.03 0.15 0.00 4,167.23
Total 2.88 15.53 23.38 0.10 8.29 0.78 9.07 0.15 0.00 8,285.600.71 0.86 0.00 8,281.32 8,281.32 0.20
Mitigated Construction On-Site
40 of 60

Exhaust PM10
PM10 Total PM2.5 Total
Bio- CO2ROG NOx CO SO2 Fugitive PM10
CO2e
Category tons/yr MT/yr
NBio- CO2 Total CO2 CH4 N2OFugitive PM2.5
Exhaust PM2.5
Off-Road 0.22 1.05 2.85 0.01 0.02 0.02 0.02 0.02 0.00 478.23 478.23 0.02 0.00 478.60
Total 0.22 1.05 2.85 0.01 0.02 0.02 0.00 478.600.02 0.02 0.00 478.23
Exhaust PM10
PM10 Total
478.23 0.02
PM2.5 Total
Bio- CO2
Mitigated Construction Off-Site
ROG NOx CO SO2 Fugitive PM10
CO2e
Category tons/yr MT/yr
NBio- CO2 Total CO2 CH4 N2OFugitive PM2.5
Exhaust PM2.5
Hauling 0.00 0.00 0.00 0.00 0.00 0.00 0.00 0.00 0.00 0.00 0.00 0.00 0.00 0.00 0.00 0.00
Vendor 1.19 14.15 8.27 0.04 0.12 0.49 0.60 0.04 0.45 0.49 0.00 4,117.29 4,117.29 0.05 0.00 4,118.37
Worker 1.69 1.38 15.11 0.06 0.30 0.29 0.59 0.11 0.26 0.37 0.00 4,164.03 4,164.03 0.15 0.00 4,167.23
Total 2.88 15.53 23.38 0.10 0.42 0.78 1.19 0.15 0.00 8,285.600.71 0.86 0.00 8,281.32
Exhaust PM10
PM10 Total
8,281.32 0.20
PM2.5 Total
Bio- CO2
3.5 Building Construction - 2032
Unmitigated Construction On-Site
ROG NOx CO SO2 Fugitive PM10
CO2e
Category tons/yr MT/yr
NBio- CO2 Total CO2 CH4 N2OFugitive PM2.5
Exhaust PM2.5
Off-Road 0.10 0.47 1.28 0.00 0.01 0.01 0.01 0.01 0.00 214.38 214.38 0.01 0.00 214.54
Total 0.10 0.47 1.28 0.00 0.01 0.01 0.00 214.540.01 0.01 0.00 214.38 214.38 0.01
41 of 60

Exhaust PM10
PM10 Total PM2.5 Total
Bio- CO2
Unmitigated Construction Off-Site
ROG NOx CO SO2 Fugitive PM10
CO2e
Category tons/yr MT/yr
NBio- CO2 Total CO2 CH4 N2OFugitive PM2.5
Exhaust PM2.5
Hauling 0.00 0.00 0.00 0.00 0.00 0.00 0.00 0.00 0.00 0.00 0.00 0.00 0.00 0.00 0.00 0.00
Vendor 0.53 6.34 3.71 0.02 0.60 0.22 0.82 0.02 0.20 0.22 0.00 1,845.68 1,845.68 0.02 0.00 1,846.17
Worker 0.76 0.62 6.77 0.03 3.12 0.13 3.25 0.05 0.12 0.17 0.00 1,866.63 1,866.63 0.07 0.00 1,868.07
Total 1.29 6.96 10.48 0.05 3.72 0.35 4.07 0.07 0.00 3,714.240.32 0.39 0.00 3,712.31
Exhaust PM10
PM10 Total
3,712.31 0.09
PM2.5 Total
Bio- CO2
Mitigated Construction On-Site
ROG NOx CO SO2 Fugitive PM10
CO2e
Category tons/yr MT/yr
NBio- CO2 Total CO2 CH4 N2OFugitive PM2.5
Exhaust PM2.5
Off-Road 0.10 0.47 1.28 0.00 0.01 0.01 0.01 0.01 0.00 214.38 214.38 0.01 0.00 214.54
Total 0.10 0.47 1.28 0.00 0.01 0.01 0.00 214.540.01 0.01 0.00 214.38
Exhaust PM10
PM10 Total
214.38 0.01
PM2.5 Total
Bio- CO2
Mitigated Construction Off-Site
ROG NOx CO SO2 Fugitive PM10
CO2e
Category tons/yr MT/yr
NBio- CO2 Total CO2 CH4 N2OFugitive PM2.5
Exhaust PM2.5
Hauling 0.00 0.00 0.00 0.00 0.00 0.00 0.00 0.00 0.00 0.00 0.00 0.00 0.00 0.00 0.00 0.00
Vendor 0.53 6.34 3.71 0.02 0.05 0.22 0.27 0.02 0.20 0.22 0.00 1,845.68 1,845.68 0.02 0.00 1,846.17
Worker 0.76 0.62 6.77 0.03 0.13 0.13 0.26 0.05 0.12 0.17 0.00 1,866.63 1,866.63 0.07 0.00 1,868.07
42 of 60
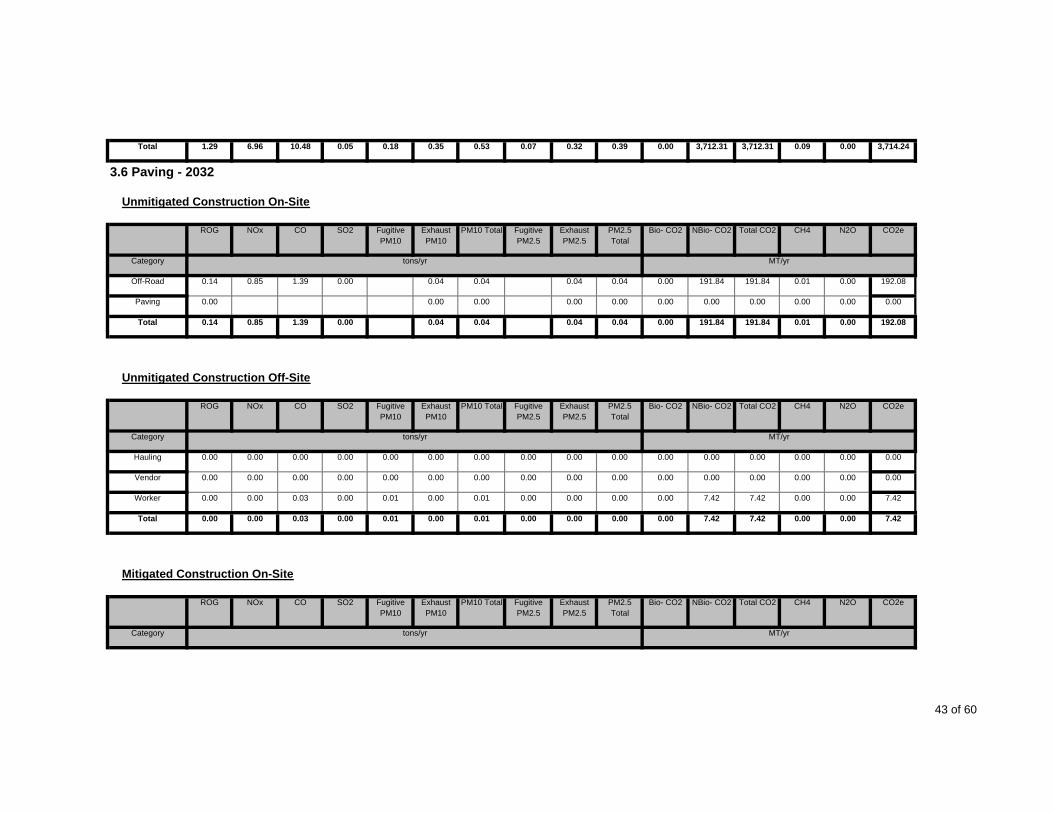
Total 1.29 6.96 10.48 0.05 0.18 0.35 0.53 0.07 0.00 3,714.240.32 0.39 0.00 3,712.31
Exhaust PM10
PM10 Total
3,712.31 0.09
PM2.5 Total
Bio- CO2
3.6 Paving - 2032
Unmitigated Construction On-Site
ROG NOx CO SO2 Fugitive PM10
CO2e
Category tons/yr MT/yr
NBio- CO2 Total CO2 CH4 N2OFugitive PM2.5
Exhaust PM2.5
Off-Road 0.14 0.85 1.39 0.00 0.04 0.04 0.04 0.04 0.00 191.84 191.84 0.01 0.00 192.08
Paving 0.00 0.00 0.00 0.00 0.00 0.00 0.00 0.00 0.00 0.00 0.00
Total 0.14 0.85 1.39 191.84 0.01 0.000.04 0.04 0.00
SO2 Fugitive PM10
Exhaust PM10
191.840.00 0.04 0.04
Fugitive PM2.5
Exhaust PM2.5
PM2.5 Total
192.08
Unmitigated Construction Off-Site
ROG NOx CO N2O CO2e
Category tons/yr MT/yr
Bio- CO2 NBio- CO2 Total CO2 CH4PM10 Total
Hauling 0.00 0.00 0.00 0.00 0.00 0.00 0.00 0.00 0.00 0.00 0.00 0.00 0.00 0.00 0.00 0.00
Vendor 0.00 0.00 0.00 0.00 0.00 0.00 0.00 0.00 0.00 0.00 0.00 0.00 0.00 0.00 0.00 0.00
Worker 0.00 0.00 0.03 0.00 0.01 0.00 0.01 0.00 0.00 0.00 0.00 7.42 7.42 0.00 0.00 7.42
Total 0.00 0.00 0.03 0.00 0.01 0.00 0.01 0.00 0.00 7.420.00 0.00 0.00 7.42
Exhaust PM10
PM10 Total
7.42 0.00
PM2.5 Total
Bio- CO2
Mitigated Construction On-Site
ROG NOx CO SO2 Fugitive PM10
CO2e
Category tons/yr MT/yr
NBio- CO2 Total CO2 CH4 N2OFugitive PM2.5
Exhaust PM2.5
43 of 60

Off-Road 0.14 0.85 1.39 0.00 0.04 0.04 0.04 0.04 0.00 191.84 191.84 0.01 0.00 192.08
Paving 0.00 0.00 0.00 0.00 0.00 0.00 0.00 0.00 0.00 0.00 0.00
Total 0.14 0.85 1.39 191.84 0.01 0.000.04 0.04 0.00
SO2 Fugitive PM10
Exhaust PM10
191.840.00 0.04 0.04
Fugitive PM2.5
Exhaust PM2.5
PM2.5 Total
192.08
Mitigated Construction Off-Site
ROG NOx CO N2O CO2e
Category tons/yr MT/yr
Bio- CO2 NBio- CO2 Total CO2 CH4PM10 Total
Hauling 0.00 0.00 0.00 0.00 0.00 0.00 0.00 0.00 0.00 0.00 0.00 0.00 0.00 0.00 0.00 0.00
Vendor 0.00 0.00 0.00 0.00 0.00 0.00 0.00 0.00 0.00 0.00 0.00 0.00 0.00 0.00 0.00 0.00
Worker 0.00 0.00 0.03 0.00 0.00 0.00 0.00 0.00 0.00 0.00 0.00 7.42 7.42 0.00 0.00 7.42
Total 0.00 0.00 0.03 0.00 0.00 0.00 0.00 0.00 0.00 7.420.00 0.00 0.00 7.42
Exhaust PM10
PM10 Total
7.42 0.00
PM2.5 Total
Bio- CO2
3.6 Paving - 2033
Unmitigated Construction On-Site
ROG NOx CO SO2 Fugitive PM10
CO2e
Category tons/yr MT/yr
NBio- CO2 Total CO2 CH4 N2OFugitive PM2.5
Exhaust PM2.5
Off-Road 0.17 1.08 1.78 0.00 0.05 0.05 0.05 0.05 0.00 244.77 244.77 0.01 0.00 245.06
Paving 0.00 0.00 0.00 0.00 0.00 0.00 0.00 0.00 0.00 0.00 0.00
Total 0.17 1.08 1.78 244.77 0.01 0.000.05 0.05 0.00 244.770.00 0.05 0.05 245.06
Unmitigated Construction Off-Site
44 of 60
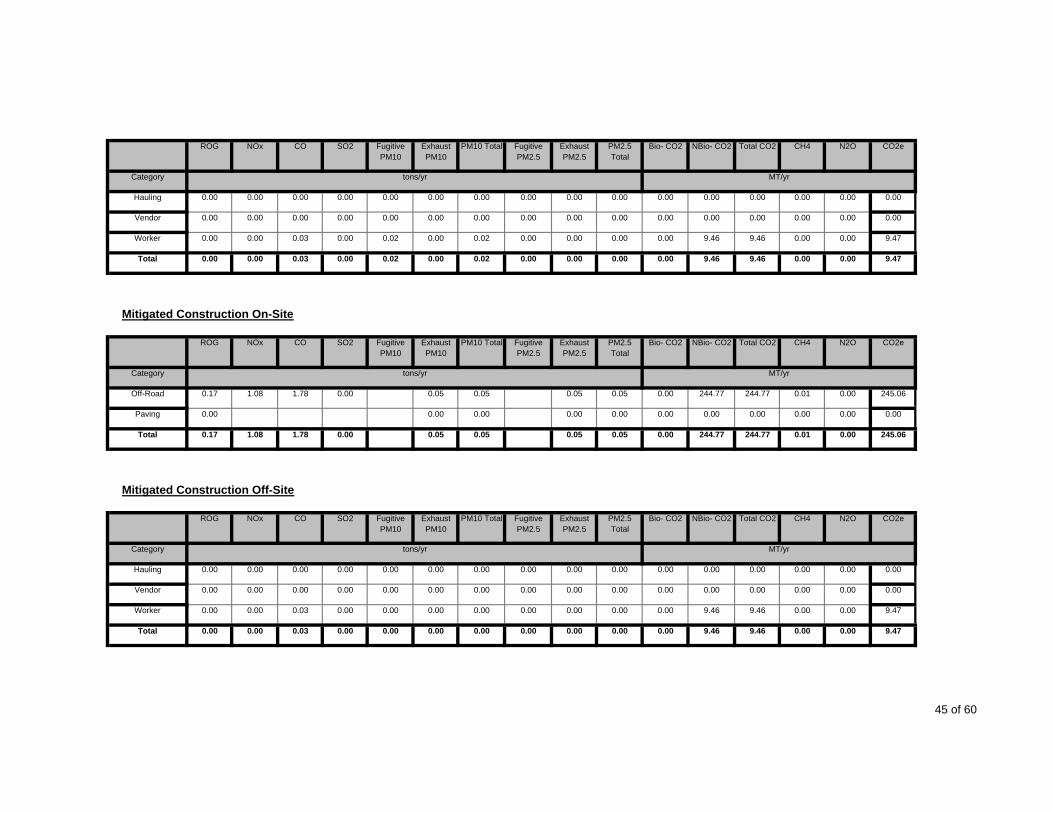
SO2 Fugitive PM10
Exhaust PM10
Fugitive PM2.5
Exhaust PM2.5
PM2.5 Total
ROG NOx CO N2O CO2e
Category tons/yr MT/yr
Bio- CO2 NBio- CO2 Total CO2 CH4PM10 Total
Hauling 0.00 0.00 0.00 0.00 0.00 0.00 0.00 0.00 0.00 0.00 0.00 0.00 0.00 0.00 0.00 0.00
Vendor 0.00 0.00 0.00 0.00 0.00 0.00 0.00 0.00 0.00 0.00 0.00 0.00 0.00 0.00 0.00 0.00
Worker 0.00 0.00 0.03 0.00 0.02 0.00 0.02 0.00 0.00 0.00 0.00 9.46 9.46 0.00 0.00 9.47
Total 0.00 0.00 0.03 0.00 0.02 0.00 0.02 0.00 0.00 9.470.00 0.00 0.00 9.46
Exhaust PM10
PM10 Total
9.46 0.00
PM2.5 Total
Bio- CO2
Mitigated Construction On-Site
ROG NOx CO SO2 Fugitive PM10
CO2e
Category tons/yr MT/yr
NBio- CO2 Total CO2 CH4 N2OFugitive PM2.5
Exhaust PM2.5
Off-Road 0.17 1.08 1.78 0.00 0.05 0.05 0.05 0.05 0.00 244.77 244.77 0.01 0.00 245.06
Paving 0.00 0.00 0.00 0.00 0.00 0.00 0.00 0.00 0.00 0.00 0.00
Total 0.17 1.08 1.78 244.77 0.01 0.000.05 0.05 0.00
SO2 Fugitive PM10
Exhaust PM10
244.770.00 0.05 0.05
Fugitive PM2.5
Exhaust PM2.5
PM2.5 Total
245.06
Mitigated Construction Off-Site
ROG NOx CO N2O CO2e
Category tons/yr MT/yr
Bio- CO2 NBio- CO2 Total CO2 CH4PM10 Total
Hauling 0.00 0.00 0.00 0.00 0.00 0.00 0.00 0.00 0.00 0.00 0.00 0.00 0.00 0.00 0.00 0.00
Vendor 0.00 0.00 0.00 0.00 0.00 0.00 0.00 0.00 0.00 0.00 0.00 0.00 0.00 0.00 0.00 0.00
Worker 0.00 0.00 0.03 0.00 0.00 0.00 0.00 0.00 0.00 0.00 0.00 9.46 9.46 0.00 0.00 9.47
Total 0.00 0.00 0.03 0.00 0.00 0.00 0.00 0.00 0.00 9.470.00 0.00 0.00 9.46 9.46 0.00
45 of 60

Exhaust PM10
PM10 Total PM2.5 Total
Bio- CO2
3.7 Architectural Coating - 2033
Unmitigated Construction On-Site
ROG NOx CO SO2 Fugitive PM10
CO2e
Category tons/yr MT/yr
NBio- CO2 Total CO2 CH4 N2OFugitive PM2.5
Exhaust PM2.5
Archit. Coating 16.20 0.00 0.00 0.00 0.00 0.00 0.00 0.00 0.00 0.00 0.00
Off-Road 0.00 0.03 0.07 0.00 0.00 0.00 0.00 0.00 0.00 9.56 9.56 0.00 0.00 9.57
Total 16.20 0.03 0.07 9.56 0.00 0.000.00 0.00 0.00
SO2 Fugitive PM10
Exhaust PM10
9.560.00 0.00 0.00
Fugitive PM2.5
Exhaust PM2.5
PM2.5 Total
9.57
Unmitigated Construction Off-Site
ROG NOx CO N2O CO2e
Category tons/yr MT/yr
Bio- CO2 NBio- CO2 Total CO2 CH4PM10 Total
Hauling 0.00 0.00 0.00 0.00 0.00 0.00 0.00 0.00 0.00 0.00 0.00 0.00 0.00 0.00 0.00 0.00
Vendor 0.00 0.00 0.00 0.00 0.00 0.00 0.00 0.00 0.00 0.00 0.00 0.00 0.00 0.00 0.00 0.00
Worker 0.10 0.08 0.87 0.00 0.40 0.02 0.42 0.01 0.02 0.02 0.00 239.36 239.36 0.01 0.00 239.55
Total 0.10 0.08 0.87 0.00 0.40 0.02 0.42 0.01 0.00 239.550.02 0.02 0.00 239.36
Exhaust PM10
PM10 Total
239.36 0.01
PM2.5 Total
Bio- CO2
Mitigated Construction On-Site
ROG NOx CO SO2 Fugitive PM10
CO2e
Category tons/yr MT/yr
NBio- CO2 Total CO2 CH4 N2OFugitive PM2.5
Exhaust PM2.5
Archit. Coating 16.20 0.00 0.00 0.00 0.00 0.00 0.00 0.00 0.00 0.00 0.00
46 of 60

Off-Road 0.00 0.03 0.07 0.00 0.00 0.00 0.00 0.00 0.00 9.56 9.56 0.00 0.00 9.57
Total 16.20 0.03 0.07 9.56 0.00 0.000.00 0.00 0.00
SO2 Fugitive PM10
Exhaust PM10
9.560.00 0.00 0.00
Fugitive PM2.5
Exhaust PM2.5
PM2.5 Total
9.57
Mitigated Construction Off-Site
ROG NOx CO N2O CO2e
Category tons/yr MT/yr
Bio- CO2 NBio- CO2 Total CO2 CH4PM10 Total
Hauling 0.00 0.00 0.00 0.00 0.00 0.00 0.00 0.00 0.00 0.00 0.00 0.00 0.00 0.00 0.00 0.00
Vendor 0.00 0.00 0.00 0.00 0.00 0.00 0.00 0.00 0.00 0.00 0.00 0.00 0.00 0.00 0.00 0.00
Worker 0.10 0.08 0.87 0.00 0.02 0.02 0.03 0.01 0.02 0.02 0.00 239.36 239.36 0.01 0.00 239.55
Total 0.10 0.08 0.87 0.00 0.02 0.02 0.03 0.01 0.00 239.550.02 0.02 0.00 239.36
Exhaust PM10
PM10 Total
239.36 0.01
PM2.5 Total
Bio- CO2
3.7 Architectural Coating - 2034
Unmitigated Construction On-Site
ROG NOx CO SO2 Fugitive PM10
CO2e
Category tons/yr MT/yr
NBio- CO2 Total CO2 CH4 N2OFugitive PM2.5
Exhaust PM2.5
Archit. Coating 55.07 0.00 0.00 0.00 0.00 0.00 0.00 0.00 0.00 0.00 0.00
Off-Road 0.02 0.11 0.23 0.00 0.00 0.00 0.00 0.00 0.00 32.52 32.52 0.00 0.00 32.54
Total 55.09 0.11 0.23 32.52 0.00 0.000.00 0.00 0.00
SO2 Fugitive PM10
Exhaust PM10
32.520.00 0.00 0.00
Fugitive PM2.5
Exhaust PM2.5
PM2.5 Total
32.54
Unmitigated Construction Off-Site
ROG NOx CO N2O CO2eBio- CO2 NBio- CO2 Total CO2 CH4PM10 Total
47 of 60

Category tons/yr MT/yr
Hauling 0.00 0.00 0.00 0.00 0.00 0.00 0.00 0.00 0.00 0.00 0.00 0.00 0.00 0.00 0.00 0.00
Vendor 0.00 0.00 0.00 0.00 0.00 0.00 0.00 0.00 0.00 0.00 0.00 0.00 0.00 0.00 0.00 0.00
Worker 0.33 0.27 2.95 0.01 1.36 0.06 1.42 0.02 0.05 0.07 0.00 813.83 813.83 0.03 0.00 814.46
Total 0.33 0.27 2.95 0.01 1.36 0.06 1.42 0.02 0.00 814.460.05 0.07 0.00 813.83
Exhaust PM10
PM10 Total
813.83 0.03
PM2.5 Total
Bio- CO2
Mitigated Construction On-Site
ROG NOx CO SO2 Fugitive PM10
CO2e
Category tons/yr MT/yr
NBio- CO2 Total CO2 CH4 N2OFugitive PM2.5
Exhaust PM2.5
Archit. Coating 55.07 0.00 0.00 0.00 0.00 0.00 0.00 0.00 0.00 0.00 0.00
Off-Road 0.02 0.11 0.23 0.00 0.00 0.00 0.00 0.00 0.00 32.52 32.52 0.00 0.00 32.54
Total 55.09 0.11 0.23 32.52 0.00 0.000.00 0.00 0.00
SO2 Fugitive PM10
Exhaust PM10
32.520.00 0.00 0.00
Fugitive PM2.5
Exhaust PM2.5
PM2.5 Total
32.54
Mitigated Construction Off-Site
ROG NOx CO N2O CO2e
Category tons/yr MT/yr
Bio- CO2 NBio- CO2 Total CO2 CH4PM10 Total
Hauling 0.00 0.00 0.00 0.00 0.00 0.00 0.00 0.00 0.00 0.00 0.00 0.00 0.00 0.00 0.00 0.00
Vendor 0.00 0.00 0.00 0.00 0.00 0.00 0.00 0.00 0.00 0.00 0.00 0.00 0.00 0.00 0.00 0.00
Worker 0.33 0.27 2.95 0.01 0.06 0.06 0.11 0.02 0.05 0.07 0.00 813.83 813.83 0.03 0.00 814.46
Total 0.33 0.27 2.95 0.01 0.06 0.06 0.11 0.02 0.05 0.07 0.00 813.83 813.83 0.03 0.00 814.46
48 of 60

SO2 Fugitive PM10
Exhaust PM10
4.0 Mobile Detail
4.1 Mitigation Measures Mobile
Fugitive PM2.5
Exhaust PM2.5
PM2.5 Total
ROG NOx CO N2O CO2e
Category tons/yr MT/yr
Bio- CO2 NBio- CO2 Total CO2 CH4PM10 Total
Mitigated 126.98 262.52 1,317.15 1.34 133.22 8.59 141.81 2.12 8.22 10.34 0.00 129,830.30 129,830.30 8.63 0.00 130,011.61
Unmitigated 126.98 262.52 1,317.15 1.34 133.22 8.59 141.81 2.12 8.22 10.34 0.00 129,830.30 129,830.30 8.63 0.00 130,011.61
Total NA NA NA NA NA NA NA NA NA NA NA NA
4.2 Trip Summary Information
Average Daily Trip Rate Unmitigated Mitigated
NA NA NA NA
Land Use Weekday Saturday Sunday
Apartments Mid Rise 22,393.10 22,393.10 22393.1013,675.35 13675.35
Annual VMT Annual VMT
63,939,094 63,939,09412,777,222 12,777,222
General Heavy Industry 12,834.64 12,834.64 12834.64 37,470,874 37,470,874Fast Food Restaurant with Drive Thru 13,675.35
General Light Industry 1,272.00 1,272.00 1272.00General Office Building 6,048.90 6,048.90 6048.90
3,811.86 3811.86
3,713,618 3,713,61814,455,376 14,455,3769,109,403 9,109,403
General Office Building 1,916.46 1,916.46 1916.46 4,579,866 4,579,866General Office Building 3,811.86
General Office Building 367.38 367.38 367.38 877,947 877,947
49 of 60

General Office Building 2,838.42 2,838.42 2838.4225,068.42 25068.42
6,783,122 6,783,12259,907,327 59,907,327
Junior College (2Yr) 1,134.05 1,134.05 1134.05 2,879,962 2,879,962General Office Building 25,068.42
Medical Office Building 1,807.74 1,807.74 1807.74Refrigerated Warehouse-No Rail 462.06 462.06 462.06
20,819.39 20819.39
3,538,199 3,538,1991,348,989 1,348,989
32,062,548 32,062,548Total 114,449.77 114,449.77 114,449.77 253,443,548 253,443,548
Strip Mall 20,819.39
4.3 Trip Type Information
Miles Trip %
Land Use H-W or C-W H-S or C-C H-O or C-NW H-W or C-W H-S or C-C H-O or C-NW
Apartments Mid Rise 10.80 7.30 7.50 41.60 18.80 39.60
Fast Food Restaurant with Drive Thru 9.50 7.30 7.30 2.20 78.80 19.00
General Heavy Industry 9.50 7.30 7.30 59.00 28.00 13.00
General Light Industry 9.50 7.30 7.30 59.00 28.00 13.00
General Office Building 9.50 7.30 7.30 33.00 48.00 19.00
General Office Building 9.50 7.30 7.30 33.00 48.00 19.00
General Office Building 9.50 7.30 7.30 33.00 48.00 19.00
General Office Building 9.50 7.30 7.30 33.00 48.00 19.00
General Office Building 9.50 7.30 7.30 33.00 48.00 19.00
General Office Building 9.50 7.30 7.30 33.00 48.00 19.00
Junior College (2Yr) 9.50 7.30 7.30 6.40 88.60 5.00
Medical Office Building 9.50 7.30 7.30 29.60 51.40 19.00
Refrigerated Warehouse-No Rail 9.50 7.30 7.30 59.00 0.00 41.00
16.60 64.40 19.00
5.0 Energy Detail
Strip Mall 9.50 7.30 7.30
5.1 Mitigation Measures Energy
50 of 60

ROG NOx CO SO2 Fugitive PM10
Exhaust PM10
PM10 Total Fugitive PM2.5
Exhaust PM2.5
PM2.5 Total
Bio- CO2 NBio- CO2 Total CO2 CH4 N2O CO2e
Category tons/yr MT/yr
Electricity Mitigated 0.00 0.00 0.00 0.00 0.00 26,524.40 26,524.40 0.99 0.37 26,660.93
Electricity Unmitigated
0.00 0.00 0.00 0.00 0.00 26,524.40 26,524.40 0.99 0.37 26,660.93
NaturalGas Mitigated 0.65 5.77 4.11 0.04 0.00 0.45 0.00 0.45 0.00 6,407.27 6,407.27 0.12 0.12 6,446.26
NaturalGas Unmitigated
0.65 5.77 4.11 0.04 0.00 0.45 0.00 0.45 0.00 6,407.27 6,407.27 0.12 0.12 6,446.26
Total NA NA NA NA NA NA NA NA NA NA NA NA NA NA NA NA
5.2 Energy by Land Use - NaturalGas
Unmitigated
NaturalGas Use ROG NOx CO SO2 Fugitive PM10
Exhaust PM10
PM10 Total Fugitive PM2.5
Exhaust PM2.5
PM2.5 Total N2O CO2e
Land Use kBTU tons/yr MT/yr
Bio- CO2 NBio- CO2 Total CO2 CH4
Apartments Mid Rise 3.8692e+007 0.21 1.78 0.76 0.01 0.00 0.14 0.00 0.14 0.00 2,064.75 2,064.75 0.04 0.04 2,077.32
Fast Food Restaurant with
3.43707e+006 0.02 0.17 0.14 0.00 0.00 0.01 0.00 0.01 0.00 183.42 183.42 0.00 0.00 184.53
General Heavy Industry
3.69074e+007 0.20 1.81 1.52 0.01 0.00 0.14 0.00 0.14 0.00 1,969.52 1,969.52 0.04 0.04 1,981.51
General Light Industry
937305 0.01 0.05 0.04 0.00 0.00 0.00 0.00 0.00 0.00 50.02 50.02 0.00 0.00 50.32
General Office Building
1.72236e+006 0.01 0.08 0.07 0.00 0.00 0.01 0.00 0.01 0.00 91.91 91.91 0.00 0.00 92.47
General Office Building
2.25294e+007 0.12 1.10 0.93 0.01 0.00 0.08 0.00 0.08 0.00 1,202.26 1,202.26 0.02 0.02 1,209.57
General Office Building
2.55094e+006 0.01 0.13 0.11 0.00 0.00 0.01 0.00 0.01 0.00 136.13 136.13 0.00 0.00 136.96
51 of 60
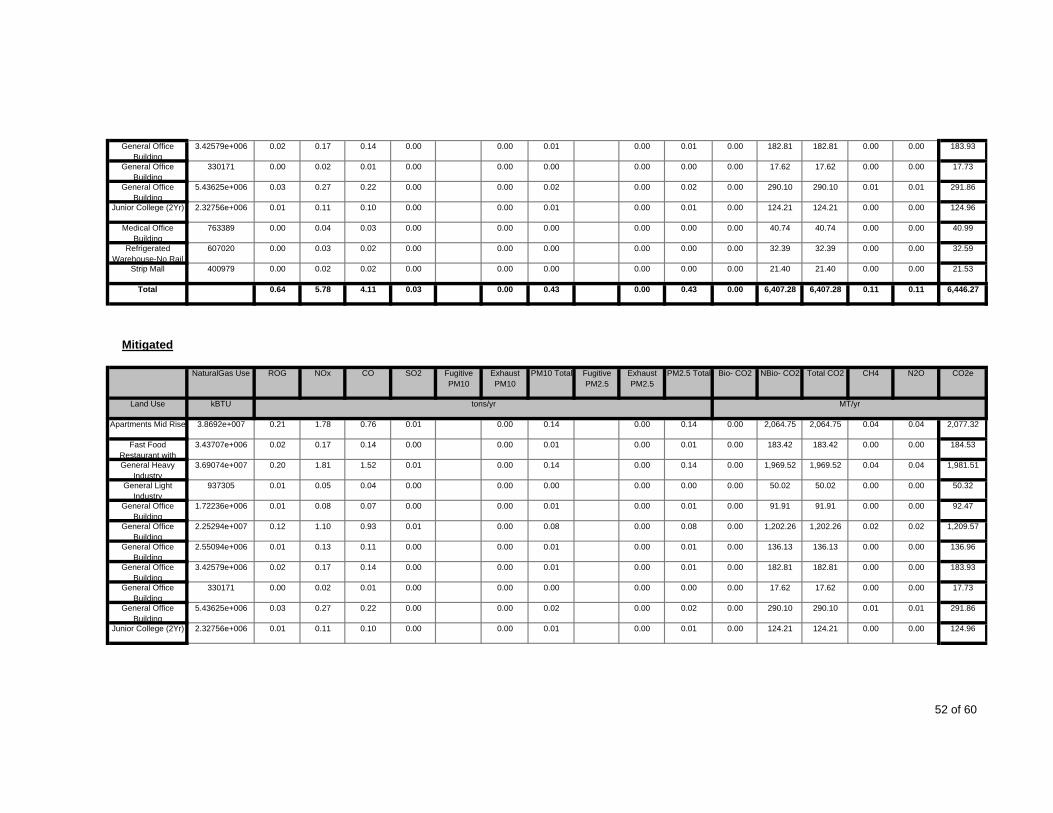
General Office Building
3.42579e+006 0.02 0.17 0.14 0.00 0.00 0.01 0.00 0.01 0.00 182.81 182.81 0.00 0.00 183.93
General Office Building
330171 0.00 0.02 0.01 0.00 0.00 0.00 0.00 0.00 0.00 17.62 17.62 0.00 0.00 17.73
General Office Building
5.43625e+006 0.03 0.27 0.22 0.00 0.00 0.02 0.00 0.02 0.00 290.10 290.10 0.01 0.01 291.86
Junior College (2Yr) 2.32756e+006 0.01 0.11 0.10 0.00 0.00 0.01 0.00 0.01 0.00 124.21 124.21 0.00 0.00 124.96
Medical Office Building
763389 0.00 0.04 0.03 0.00 0.00 0.00 0.00 0.00 0.00 40.74 40.74 0.00 0.00 40.99
Refrigerated Warehouse-No Rail
607020 0.00 0.03 0.02 0.00 0.00 0.00 0.00 0.00 0.00 32.39 32.39 0.00 0.00 32.59
Strip Mall 400979 0.00 0.02 0.02 0.00 0.00 0.00 0.00 0.00
4.11 0.03 0.00Total 0.64 5.78 0.00 0.43
0.00 21.530.00 21.40 21.40 0.00
0.11 6,446.27
Mitigated
0.00 6,407.28 6,407.28 0.110.43
NaturalGas Use ROG NOx CO SO2 Fugitive PM10
Exhaust PM10
PM10 Total Fugitive PM2.5
Exhaust PM2.5
PM2.5 Total N2O CO2e
Land Use kBTU tons/yr MT/yr
Bio- CO2 NBio- CO2 Total CO2 CH4
Apartments Mid Rise 3.8692e+007 0.21 1.78 0.76 0.01 0.00 0.14 0.00 0.14 0.00 2,064.75 2,064.75 0.04 0.04 2,077.32
Fast Food Restaurant with
3.43707e+006 0.02 0.17 0.14 0.00 0.00 0.01 0.00 0.01 0.00 183.42 183.42 0.00 0.00 184.53
General Heavy Industry
3.69074e+007 0.20 1.81 1.52 0.01 0.00 0.14 0.00 0.14 0.00 1,969.52 1,969.52 0.04 0.04 1,981.51
General Light Industry
937305 0.01 0.05 0.04 0.00 0.00 0.00 0.00 0.00 0.00 50.02 50.02 0.00 0.00 50.32
General Office Building
1.72236e+006 0.01 0.08 0.07 0.00 0.00 0.01 0.00 0.01 0.00 91.91 91.91 0.00 0.00 92.47
General Office Building
2.25294e+007 0.12 1.10 0.93 0.01 0.00 0.08 0.00 0.08 0.00 1,202.26 1,202.26 0.02 0.02 1,209.57
General Office Building
2.55094e+006 0.01 0.13 0.11 0.00 0.00 0.01 0.00 0.01 0.00 136.13 136.13 0.00 0.00 136.96
General Office Building
3.42579e+006 0.02 0.17 0.14 0.00 0.00 0.01 0.00 0.01 0.00 182.81 182.81 0.00 0.00 183.93
General Office Building
330171 0.00 0.02 0.01 0.00 0.00 0.00 0.00 0.00 0.00 17.62 17.62 0.00 0.00 17.73
General Office Building
5.43625e+006 0.03 0.27 0.22 0.00 0.00 0.02 0.00 0.02 0.00 290.10 290.10 0.01 0.01 291.86
Junior College (2Yr) 2.32756e+006 0.01 0.11 0.10 0.00 0.00 0.01 0.00 0.01 0.00 124.21 124.21 0.00 0.00 124.96
52 of 60

Medical Office Building
763389 0.00 0.04 0.03 0.00 0.00 0.00 0.00 0.00 0.00 40.74 40.74 0.00 0.00 40.99
Refrigerated Warehouse-No Rail
607020 0.00 0.03 0.02 0.00 0.00 0.00 0.00 0.00 0.00 32.39 32.39 0.00 0.00 32.59
Strip Mall 400979 0.00 0.02 0.02 0.00 0.00 0.00 0.00 0.00
4.11 0.03 0.00Total 0.64 5.78 0.00 0.43
0.00 21.530.00 21.40 21.40 0.00
0.11 6,446.27
5.3 Energy by Land Use - Electricity
Unmitigated
0.00 6,407.28 6,407.28 0.110.43
Electricity Use ROG NOx N2O CO2e
Land Use kWh tons/yr MT/yr
CO SO2 Total CO2 CH4
Apartments Mid Rise 1.28015e+007 4,533.80 0.17 0.06 4,557.14
Fast Food Restaurant with
806520 285.64 0.01 0.00 287.11
General Heavy Industry
2.81736e+007 9,977.97 0.37 0.14 10,029.33
General Light Industry
715500 253.40 0.01 0.00 254.71
General Office Building
1.22768e+006 434.80 0.02 0.01 437.03
General Office Building
1.60588e+007 5,687.39 0.21 0.08 5,716.66
General Office Building
1.81829e+006 643.97 0.02 0.01 647.28
General Office Building
2.44187e+006 864.81 0.03 0.01 869.27
General Office Building
235343 83.35 0.00 0.00 83.78
General Office Building
3.87492e+006 1,372.34 0.05 0.02 1,379.41
Junior College (2Yr) 610548 216.23 0.01 0.00 217.34
Medical Office Building
544137 192.71 0.01 0.00 193.70
Refrigerated Warehouse-No Rail
3.12661e+006 1,107.32 0.04 0.02 1,113.02
Strip Mall 2.4584e+006 870.67 0.03 0.01 875.15
Total 26,524.40 0.98 0.36 26,660.93
53 of 60
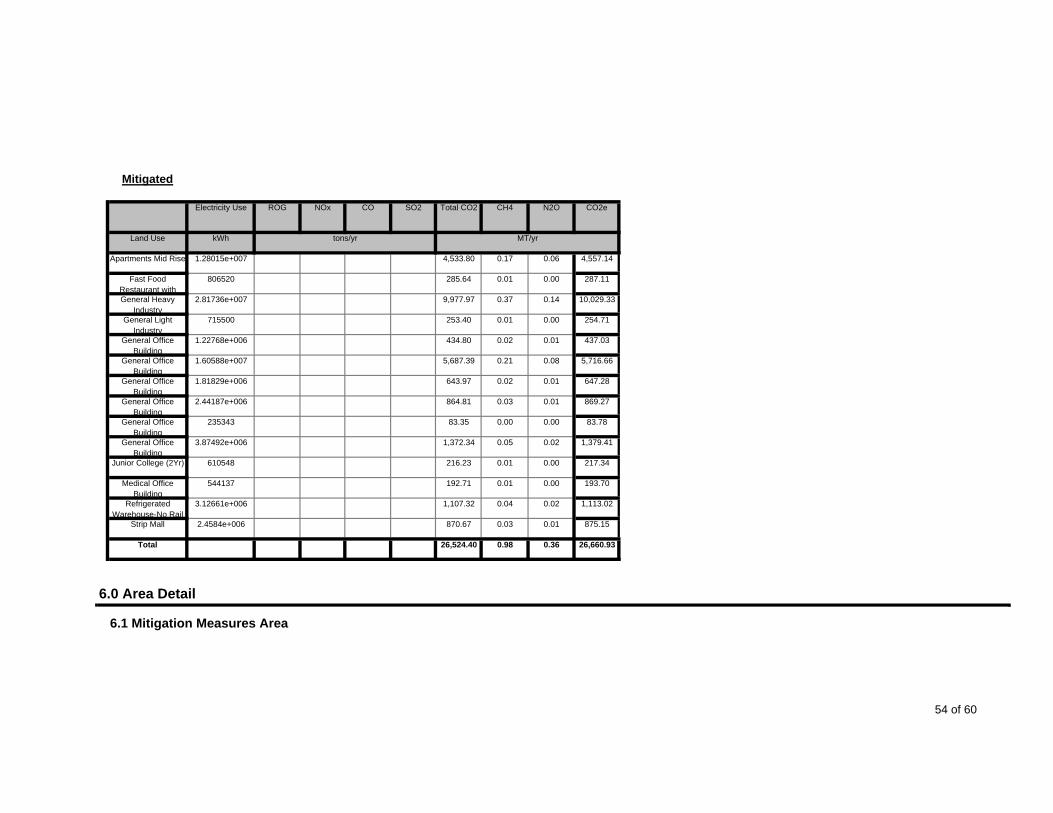
Mitigated
Electricity Use ROG NOx N2O CO2e
Land Use kWh tons/yr MT/yr
CO SO2 Total CO2 CH4
Apartments Mid Rise 1.28015e+007 4,533.80 0.17 0.06 4,557.14
Fast Food Restaurant with
806520 285.64 0.01 0.00 287.11
General Heavy Industry
2.81736e+007 9,977.97 0.37 0.14 10,029.33
General Light Industry
715500 253.40 0.01 0.00 254.71
General Office Building
1.22768e+006 434.80 0.02 0.01 437.03
General Office Building
1.60588e+007 5,687.39 0.21 0.08 5,716.66
General Office Building
1.81829e+006 643.97 0.02 0.01 647.28
General Office Building
2.44187e+006 864.81 0.03 0.01 869.27
General Office Building
235343 83.35 0.00 0.00 83.78
General Office Building
3.87492e+006 1,372.34 0.05 0.02 1,379.41
Junior College (2Yr) 610548 216.23 0.01 0.00 217.34
Medical Office Building
544137 192.71 0.01 0.00 193.70
Refrigerated Warehouse-No Rail
3.12661e+006 1,107.32 0.04 0.02 1,113.02
Strip Mall 2.4584e+006 870.67 0.03 0.01 875.15
Total 26,524.40 0.98 0.36 26,660.93
6.0 Area Detail
6.1 Mitigation Measures Area
54 of 60
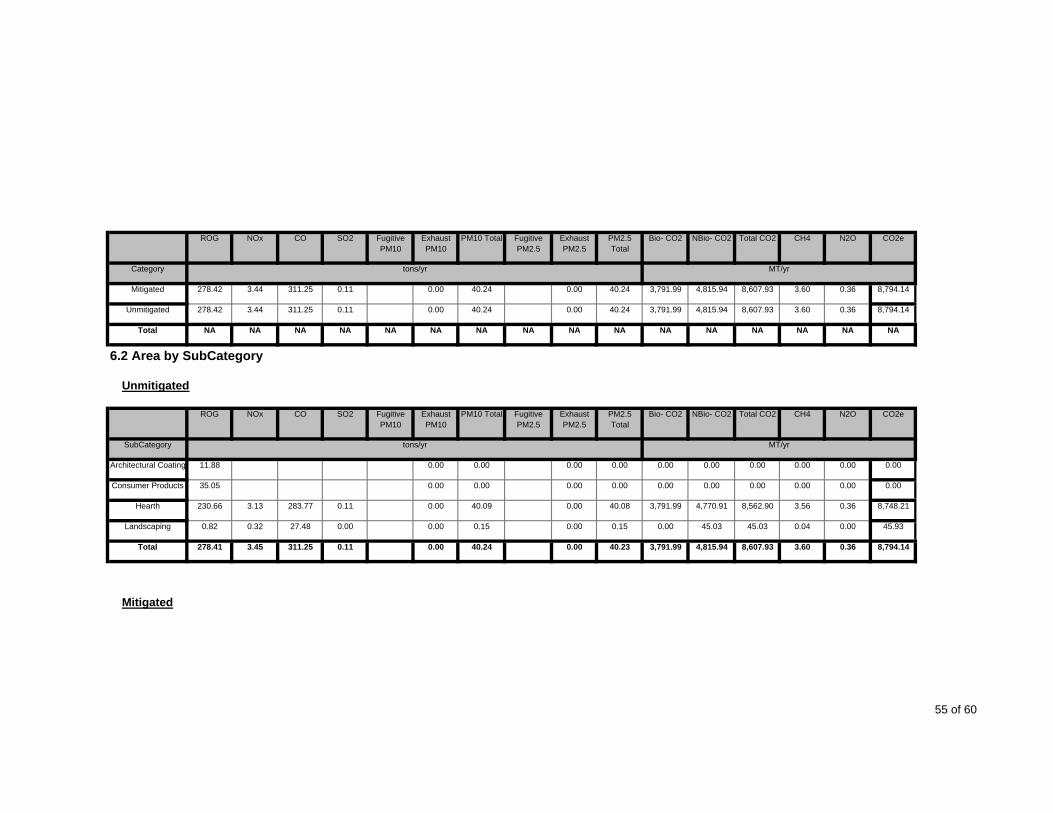
ROG NOx CO PM2.5 Total
Bio- CO2SO2 Fugitive PM10
Exhaust PM10
PM10 Total CO2e
Category tons/yr MT/yr
NBio- CO2 Total CO2 CH4 N2OFugitive PM2.5
Exhaust PM2.5
Mitigated 278.42 3.44 311.25 0.11 0.00 40.24 0.00 40.24 3,791.99 4,815.94 8,607.93 3.60 0.36 8,794.14
Unmitigated 278.42 3.44 311.25 0.11 0.00 40.24 0.00 40.24 3,791.99 4,815.94 8,607.93 3.60 0.36 8,794.14
Total NA NA NA NA NA NANA NA NA NA
SO2 Fugitive PM10
Exhaust PM10
NANA NA NA NA
Fugitive PM2.5
Exhaust PM2.5
PM2.5 Total
NA
6.2 Area by SubCategory
Unmitigated
ROG NOx CO N2O CO2e
SubCategory tons/yr MT/yr
Bio- CO2 NBio- CO2 Total CO2 CH4PM10 Total
Architectural Coating 11.88 0.00 0.00 0.00 0.00 0.00 0.00 0.00 0.00 0.00 0.00
Consumer Products 35.05 0.00 0.00 0.00 0.00 0.00 0.00 0.00 0.00 0.00 0.00
Hearth 230.66 3.13 283.77 0.11 0.00 40.09 0.00 40.08 3,791.99 4,770.91 8,562.90 3.56 0.36 8,748.21
Landscaping 0.82 0.32 27.48 0.00 0.00 0.15 0.00 0.15 0.00 45.03 45.03 0.04 0.00 45.93
Total 278.41 3.45 311.25 8,607.93 3.60 0.360.00 40.23 3,791.99 4,815.940.11 0.00 40.24 8,794.14
Mitigated
55 of 60
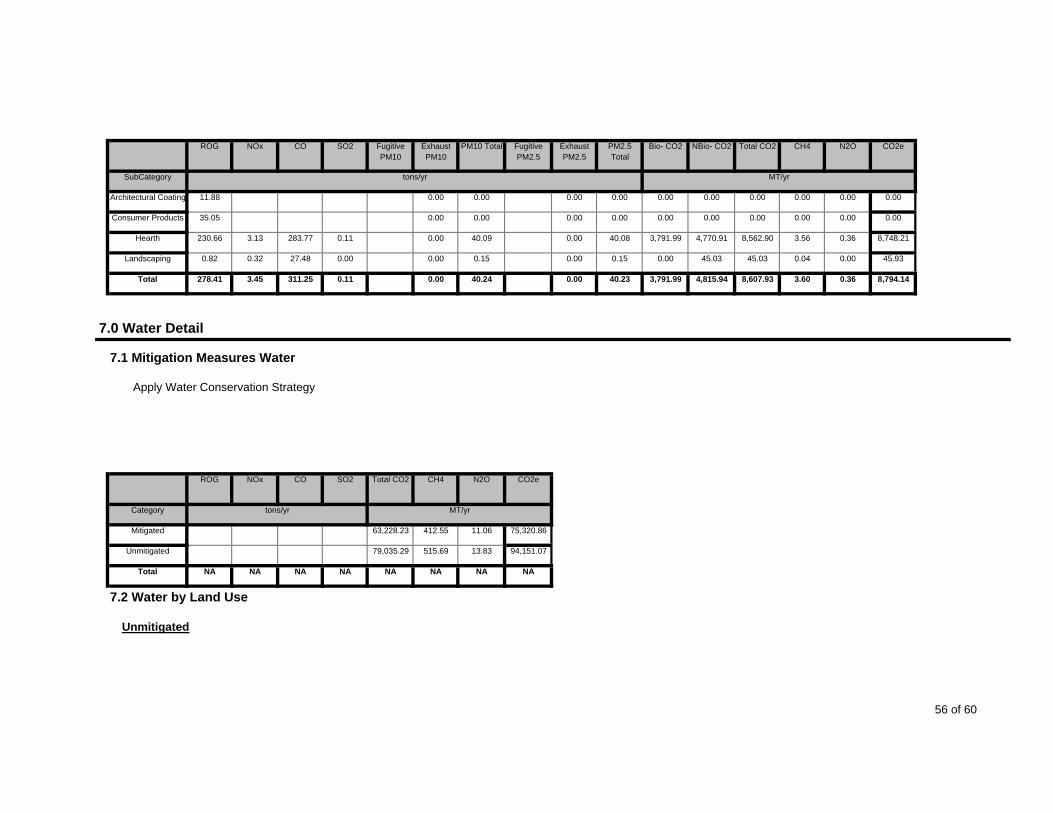
SO2 Fugitive PM10
Exhaust PM10
Fugitive PM2.5
Exhaust PM2.5
PM2.5 Total
ROG NOx CO N2O CO2e
SubCategory tons/yr MT/yr
Bio- CO2 NBio- CO2 Total CO2 CH4PM10 Total
Architectural Coating 11.88 0.00 0.00 0.00 0.00 0.00 0.00 0.00 0.00 0.00 0.00
Consumer Products 35.05 0.00 0.00 0.00 0.00 0.00 0.00 0.00 0.00 0.00 0.00
Hearth 230.66 3.13 283.77 0.11 0.00 40.09 0.00 40.08 3,791.99 4,770.91 8,562.90 3.56 0.36 8,748.21
Landscaping 0.82 0.32 27.48 0.00 0.00 0.15 0.00 0.15 0.00 45.03 45.03 0.04 0.00 45.93
Total 278.41 3.45 311.25 40.23 3,791.990.11 0.00 40.24 8,794.14
7.0 Water Detail
7.1 Mitigation Measures Water
4,815.94 8,607.93 3.60 0.360.00
Apply Water Conservation Strategy
ROG NOx CO SO2 Total CO2 CH4 N2O CO2e
Category tons/yr MT/yr
Mitigated 63,228.23 412.55 11.06 75,320.86
Unmitigated 79,035.29 515.69 13.83 94,151.07
Total NA NA NA NA NA NA NA NA
7.2 Water by Land Use
Unmitigated
56 of 60

Indoor/Outdoor Use
ROG NOx CO SO2 Total CO2 CH4 N2O CO2e
Land Use Mgal tons/yr MT/yr
Apartments Mid Rise 239.18 / 150.788 1,698.98 7.36 0.20 1,917.15
Fast Food Restaurant with
5.91891 / 0.377803
28.85 0.18 0.00 34.18
General Heavy Industry
15392 / 0 71,153.12 472.47 12.65 84,997.01
General Light Industry
390.897 / 0 1,807.01 12.00 0.32 2,158.59
General Office Building
304.209 / 186.451 2,139.91 9.37 0.26 2,417.30
Junior College (2Yr) 3.00671 / 4.7028 32.40 0.09 0.00 35.20
Medical Office Building
4.55494 / 0.867608
24.47 0.14 0.00 28.58
Refrigerated Warehouse-No Rail
445.475 / 0 2,059.31 13.67 0.37 2,459.98
Strip Mall 12.9701 / 7.94942 91.24 0.40 0.01 103.06
Total 79,035.29 515.68 13.81 94,151.05
Mitigated
Indoor/Outdoor Use
ROG NOx N2O CO2e
Land Use Mgal tons/yr MT/yr
CO SO2 Total CO2 CH4
Apartments Mid Rise 191.344 / 120.63 1,359.18 5.89 0.16 1,533.72
Fast Food Restaurant with
4.73513 / 0.302242
23.08 0.15 0.00 27.34
General Heavy Industry
12313.6 / 0 56,922.50 377.98 10.12 67,997.61
General Light Industry
312.717 / 0 1,445.61 9.60 0.26 1,726.88
General Office Building
243.367 / 149.161 1,711.93 7.49 0.21 1,933.84
Junior College (2Yr) 2.40536 / 3.76224 25.92 0.07 0.00 28.16
57 of 60
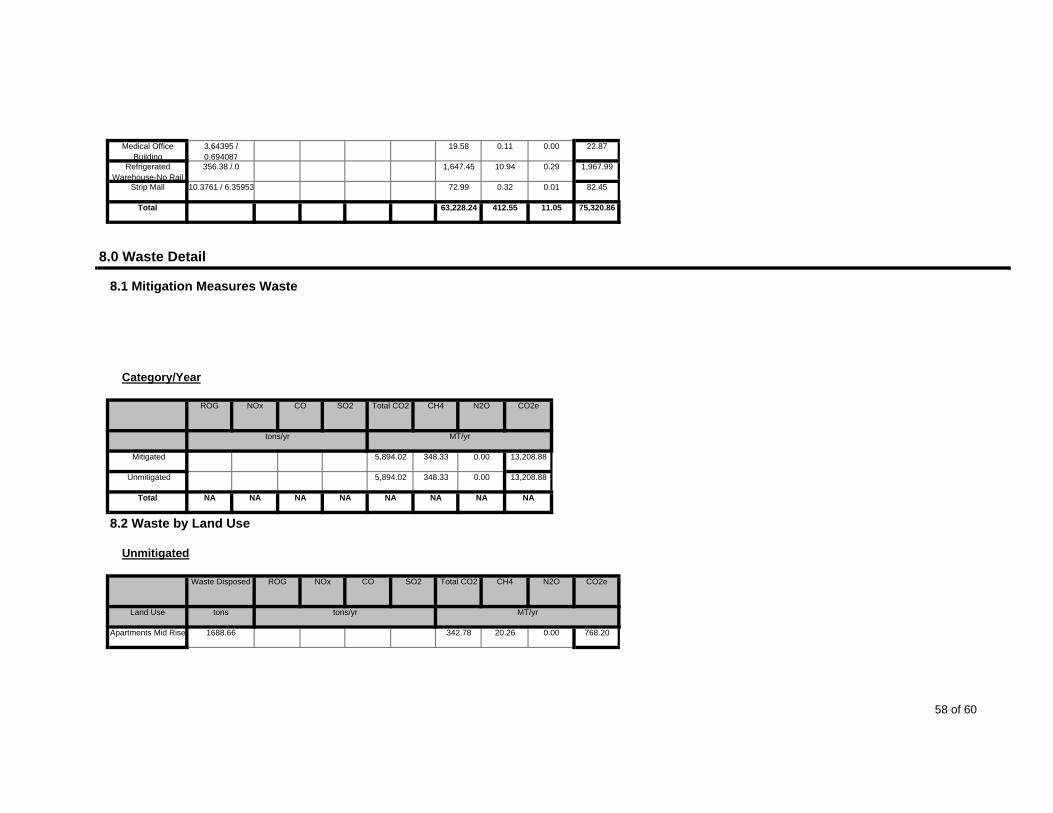
Medical Office Building
3.64395 / 0.694087
19.58 0.11 0.00 22.87
Refrigerated Warehouse-No Rail
356.38 / 0 1,647.45 10.94 0.29 1,967.99
Strip Mall 10.3761 / 6.35953 72.99 0.32 0.01 82.45
Total 63,228.24 412.55 11.05 75,320.86
8.0 Waste Detail
NOx CO
8.1 Mitigation Measures Waste
Category/Year
CO2e
tons/yr MT/yr
SO2 Total CO2 CH4 N2OROG
Mitigated 5,894.02 348.33 0.00 13,208.88
Unmitigated 5,894.02 348.33 0.00 13,208.88
Total NA NA NA NA NA NA NA NA
8.2 Waste by Land Use
Unmitigated
Waste Disposed ROG NOx CO SO2 Total CO2 CH4 N2O CO2e
Land Use tons tons/yr MT/yr
Apartments Mid Rise 1688.66 342.78 20.26 0.00 768.20
58 of 60

Fast Food Restaurant with
224.62 45.60 2.69 0.00 102.18
General Heavy Industry
19271.5 3,911.95 231.19 0.00 8,766.92
General Light Industry
4625.21 938.88 55.49 0.00 2,104.08
General Office Building
1591.79 323.12 19.10 0.00 724.13
Junior College (2Yr) 79.69 16.18 0.96 0.00 36.25
Medical Office Building
392.04 79.58 4.70 0.00 178.35
Refrigerated Warehouse-No Rail
978.48 198.62 11.74 0.00 445.13
Strip Mall 183.85 37.32 2.21 0.00 83.64
Total 5,894.03 348.34 0.00 13,208.88
Mitigated
Waste Disposed ROG NOx N2O CO2e
Land Use tons tons/yr MT/yr
CO SO2 Total CO2 CH4
Apartments Mid Rise 1688.66 342.78 20.26 0.00 768.20
Fast Food Restaurant with
224.62 45.60 2.69 0.00 102.18
General Heavy Industry
19271.5 3,911.95 231.19 0.00 8,766.92
General Light Industry
4625.21 938.88 55.49 0.00 2,104.08
General Office Building
1591.79 323.12 19.10 0.00 724.13
Junior College (2Yr) 79.69 16.18 0.96 0.00 36.25
Medical Office Building
392.04 79.58 4.70 0.00 178.35
Refrigerated Warehouse-No Rail
978.48 198.62 11.74 0.00 445.13
Strip Mall 183.85 37.32 2.21 0.00 83.64
Total 5,894.03 348.34 0.00 13,208.88
59 of 60
9.0 Vegetation
60 of 60

BAU - ALTERNATIVE 2

CalEEMod Version: CalEEMod.2011.1.1 Date: 6/15/2011
Barrio Logan Alternative 2 (2030) - No ChangeSan Diego County APCD Air District, Annual
1.0 Project Characteristics
1.1 Land Usage
Land Uses Size Metric
General Office Building 8.71 1000sqft
General Office Building 222.16 1000sqft
General Office Building 26.14 1000sqft
Government Office Building 110 1000sqft
Medical Office Building 76.4 1000sqft
Elementary School 529 Student
Junior College (2Yr) 8.7 1000sqft
City Park 9.1 Acre
Apartments Mid Rise 603 Dwelling Unit
Single Family Housing 56 Dwelling Unit
1.2 Other Project CharacteristicsUtility Company San Diego Gas & ElectricUrbanization Urban Wind Speed (m/s)
Climate Zone 13 2.6
Precipitation Freq (Days)
1 of 28

1.3 User Entered Comments 40
Project Characteristics -
Land Use - The du/acre in the Proposed Barrio Logan Community Plan is 14 du/acre for single family.
Architectural Coating - based on SDAPCD VOC content limits
Vehicle Trips - daily trips based on Traffic Impact Analysis
Area Coating - Based on SDAPCD VOC content limits.
Energy Use - Prior to 2008 Building Energy Efficiency Standards.
2.0 Emissions Summary
2.1 Overall Construction
Unmitigated Construction
ROG NOx CO PM2.5 Total
Bio- CO2SO2 Fugitive PM10
Exhaust PM10
PM10 Total CO2e
Year tons/yr MT/yr
NBio- CO2 Total CO2 CH4 N2OFugitive PM2.5
Exhaust PM2.5
2011 1.60 11.41 8.95 0.01 1.05 0.59 1.64 0.29 0.59 0.88 0.00 1,351.75 1,351.75 0.13 0.00 1,354.45
2012 1.57 9.01 11.12 0.02 1.08 0.49 1.57 0.02 0.48 0.50 0.00 1,700.97 1,700.97 0.12 0.00 1,703.59
2013 1.45 8.34 10.45 0.02 1.08 0.45 1.53 0.02 0.43 0.45 0.00 1,686.23 1,686.23 0.12 0.00 1,688.65
2014 17.50 4.32 5.10 0.01 0.51 0.26 0.77 0.01 0.25 0.26 0.00 836.97 836.97 0.06 0.00 838.24
Total 22.12 33.08 35.62 5,575.92 0.43 0.000.34 1.75 2.09 0.00
SO2 Fugitive PM10
Exhaust PM10
5,575.920.06 3.72 1.79 5.51
Fugitive PM2.5
Exhaust PM2.5
PM2.5 Total
5,584.93
Mitigated Construction
ROG NOx CO N2O CO2eBio- CO2 NBio- CO2 Total CO2 CH4PM10 Total
2 of 28

Year tons/yr MT/yr
2011 1.60 11.41 8.95 0.01 0.62 0.59 1.21 0.29 0.59 0.88 0.00 1,351.75 1,351.75 0.13 0.00 1,354.45
2012 1.57 9.01 11.12 0.02 0.05 0.49 0.54 0.02 0.48 0.50 0.00 1,700.97 1,700.97 0.12 0.00 1,703.59
2013 1.45 8.34 10.45 0.02 0.05 0.45 0.50 0.02 0.43 0.45 0.00 1,686.23 1,686.23 0.12 0.00 1,688.65
2014 17.50 4.32 5.10 0.01 0.02 0.26 0.28 0.01 0.25 0.26 0.00 836.97 836.97 0.06 0.00 838.24
Total 22.12 33.08 35.62 5,575.92 0.43 0.000.34 1.75 2.09 0.00
SO2 Fugitive PM10
Exhaust PM10
5,575.920.06 0.74 1.79 2.53
Fugitive PM2.5
Exhaust PM2.5
PM2.5 Total
5,584.93
2.2 Overall Operational
Unmitigated Operational
ROG NOx CO N2O CO2e
Category tons/yr MT/yr
Bio- CO2 NBio- CO2 Total CO2 CH4PM10 Total
Area 47.92 0.62 55.87 0.02 0.00 7.22 0.00 7.22 680.72 864.53 1,545.25 0.65 0.06 1,578.68
Energy 0.11 0.96 0.64 0.01 0.00 0.08 0.00 0.08 0.00 4,571.53 4,571.53 0.15 0.07 4,596.07
Mobile 7.98 14.26 66.57 0.20 20.38 1.04 21.42 0.32 1.01 1.33 0.00 13,900.64 13,900.64 0.52 0.00 13,911.52
Waste 0.00 0.00 0.00 0.00 328.45 0.00 328.45 19.41 0.00 736.08
Water 0.00 0.00 0.00 0.00 0.00 897.70 897.70 3.75 0.10 1,008.94
Total 56.01 15.84 123.08 0.23 20.38 1.04 28.72 0.32 0.23 21,831.291.01 8.63 1,009.17 20,234.40
Exhaust PM10
PM10 Total
21,243.57 24.48
PM2.5 Total
Bio- CO2
Mitigated Operational
ROG NOx CO SO2 Fugitive PM10
CO2e
Category tons/yr MT/yr
NBio- CO2 Total CO2 CH4 N2OFugitive PM2.5
Exhaust PM2.5
3 of 28

Area 47.92 0.62 55.87 0.02 0.00 7.22 0.00 7.22 680.72 864.53 1,545.25 0.65 0.06 1,578.68
Energy 0.11 0.96 0.64 0.01 0.00 0.08 0.00 0.08 0.00 4,571.53 4,571.53 0.15 0.07 4,596.07
Mobile 7.98 14.26 66.57 0.20 20.38 1.04 21.42 0.32 1.01 1.33 0.00 13,900.64 13,900.64 0.52 0.00 13,911.52
Waste 0.00 0.00 0.00 0.00 328.45 0.00 328.45 19.41 0.00 736.08
Water 0.00 0.00 0.00 0.00 0.00 897.70 897.70 3.75 0.10 1,008.94
Total 56.01 15.84 123.08 0.23 20.38 1.04 28.72 0.32 1.01 8.63 1,009.17 20,234.40 21,243.57 24.48 0.23 21,831.29
3.0 Construction Detail
3.1 Mitigation Measures Construction
3.2 Demolition - 2011
Unmitigated Construction On-Site
4 of 28

SO2 Fugitive PM10
Exhaust PM10
Fugitive PM2.5
Exhaust PM2.5
PM2.5 Total
ROG NOx CO N2O CO2e
Category tons/yr MT/yr
Bio- CO2 NBio- CO2 Total CO2 CH4PM10 Total
Off-Road 0.25 2.00 1.15 0.00 0.10 0.10 0.10 0.10 0.00 170.30 170.30 0.02 0.00 170.72
Total 0.25 2.00 1.15 0.00 0.10 0.10 0.00 170.720.10 0.10 0.00 170.30
Exhaust PM10
PM10 Total
170.30 0.02
PM2.5 Total
Bio- CO2
Unmitigated Construction Off-Site
ROG NOx CO SO2 Fugitive PM10
CO2e
Category tons/yr MT/yr
NBio- CO2 Total CO2 CH4 N2OFugitive PM2.5
Exhaust PM2.5
Hauling 0.00 0.00 0.00 0.00 0.00 0.00 0.00 0.00 0.00 0.00 0.00 0.00 0.00 0.00 0.00 0.00
Vendor 0.00 0.00 0.00 0.00 0.00 0.00 0.00 0.00 0.00 0.00 0.00 0.00 0.00 0.00 0.00 0.00
Worker 0.00 0.00 0.03 0.00 0.00 0.00 0.00 0.00 0.00 0.00 0.00 3.49 3.49 0.00 0.00 3.50
Total 0.00 0.00 0.03 0.00 0.00 0.00 0.00 0.00 0.00 3.500.00 0.00 0.00 3.49
Exhaust PM10
PM10 Total
3.49 0.00
PM2.5 Total
Bio- CO2
Mitigated Construction On-Site
ROG NOx CO SO2 Fugitive PM10
CO2e
Category tons/yr MT/yr
NBio- CO2 Total CO2 CH4 N2OFugitive PM2.5
Exhaust PM2.5
Off-Road 0.25 2.00 1.15 0.00 0.10 0.10 0.10 0.10 0.00 170.30 170.30 0.02 0.00 170.72
Total 0.25 2.00 1.15 0.00 0.10 0.10 0.00 170.720.10 0.10 0.00 170.30 170.30 0.02
5 of 28

Exhaust PM10
PM10 Total PM2.5 Total
Bio- CO2
Mitigated Construction Off-Site
ROG NOx CO SO2 Fugitive PM10
CO2e
Category tons/yr MT/yr
NBio- CO2 Total CO2 CH4 N2OFugitive PM2.5
Exhaust PM2.5
Hauling 0.00 0.00 0.00 0.00 0.00 0.00 0.00 0.00 0.00 0.00 0.00 0.00 0.00 0.00 0.00 0.00
Vendor 0.00 0.00 0.00 0.00 0.00 0.00 0.00 0.00 0.00 0.00 0.00 0.00 0.00 0.00 0.00 0.00
Worker 0.00 0.00 0.03 0.00 0.00 0.00 0.00 0.00 0.00 0.00 0.00 3.49 3.49 0.00 0.00 3.50
Total 0.00 0.00 0.03 0.00 0.00 0.00 0.00 0.00 0.00 3.500.00 0.00 0.00 3.49
Exhaust PM10
PM10 Total
3.49 0.00
PM2.5 Total
Bio- CO2
3.3 Site Preparation - 2011
Unmitigated Construction On-Site
ROG NOx CO SO2 Fugitive PM10
CO2e
Category tons/yr MT/yr
NBio- CO2 Total CO2 CH4 N2OFugitive PM2.5
Exhaust PM2.5
Fugitive Dust 0.27 0.00 0.27 0.15 0.00 0.15 0.00 0.00 0.00 0.00 0.00 0.00
Off-Road 0.16 1.35 0.76 0.00 0.07 0.07 0.07 0.07 0.00 108.80 108.80 0.01 0.00 109.08
Total 0.16 1.35 0.76 108.80 0.01 0.000.15 0.07 0.22 0.00
SO2 Fugitive PM10
Exhaust PM10
108.800.00 0.27 0.07 0.34
Fugitive PM2.5
Exhaust PM2.5
PM2.5 Total
109.08
Unmitigated Construction Off-Site
ROG NOx CO N2O CO2e
Category tons/yr MT/yr
Bio- CO2 NBio- CO2 Total CO2 CH4PM10 Total
Hauling 0.00 0.00 0.00 0.00 0.00 0.00 0.00 0.00 0.00 0.00 0.00 0.00 0.00 0.00 0.00 0.00
Vendor 0.00 0.00 0.00 0.00 0.00 0.00 0.00 0.00 0.00 0.00 0.00 0.00 0.00 0.00 0.00 0.00
6 of 28

Worker 0.00 0.00 0.02 0.00 0.00 0.00 0.00 0.00 0.00 0.00 0.00 2.51 2.51 0.00 0.00 2.52
Total 0.00 0.00 0.02 0.00 0.00 0.00 0.00 0.00 0.00 2.520.00 0.00 0.00 2.51
Exhaust PM10
PM10 Total
2.51 0.00
PM2.5 Total
Bio- CO2
Mitigated Construction On-Site
ROG NOx CO SO2 Fugitive PM10
CO2e
Category tons/yr MT/yr
NBio- CO2 Total CO2 CH4 N2OFugitive PM2.5
Exhaust PM2.5
Fugitive Dust 0.27 0.00 0.27 0.15 0.00 0.15 0.00 0.00 0.00 0.00 0.00 0.00
Off-Road 0.16 1.35 0.76 0.00 0.07 0.07 0.07 0.07 0.00 108.80 108.80 0.01 0.00 109.08
Total 0.16 1.35 0.76 108.80 0.01 0.000.15 0.07 0.22 0.00
SO2 Fugitive PM10
Exhaust PM10
108.800.00 0.27 0.07 0.34
Fugitive PM2.5
Exhaust PM2.5
PM2.5 Total
109.08
Mitigated Construction Off-Site
ROG NOx CO N2O CO2e
Category tons/yr MT/yr
Bio- CO2 NBio- CO2 Total CO2 CH4PM10 Total
Hauling 0.00 0.00 0.00 0.00 0.00 0.00 0.00 0.00 0.00 0.00 0.00 0.00 0.00 0.00 0.00 0.00
Vendor 0.00 0.00 0.00 0.00 0.00 0.00 0.00 0.00 0.00 0.00 0.00 0.00 0.00 0.00 0.00 0.00
Worker 0.00 0.00 0.02 0.00 0.00 0.00 0.00 0.00 0.00 0.00 0.00 2.51 2.51 0.00 0.00 2.52
Total 0.00 0.00 0.02 0.00 0.00 0.00 0.00 0.00 0.00 2.520.00 0.00 0.00 2.51
Exhaust PM10
PM10 Total
2.51 0.00
PM2.5 Total
Bio- CO2
3.4 Grading - 2011
Unmitigated Construction On-Site
ROG NOx CO SO2 Fugitive PM10
CO2eNBio- CO2 Total CO2 CH4 N2OFugitive PM2.5
Exhaust PM2.5
7 of 28
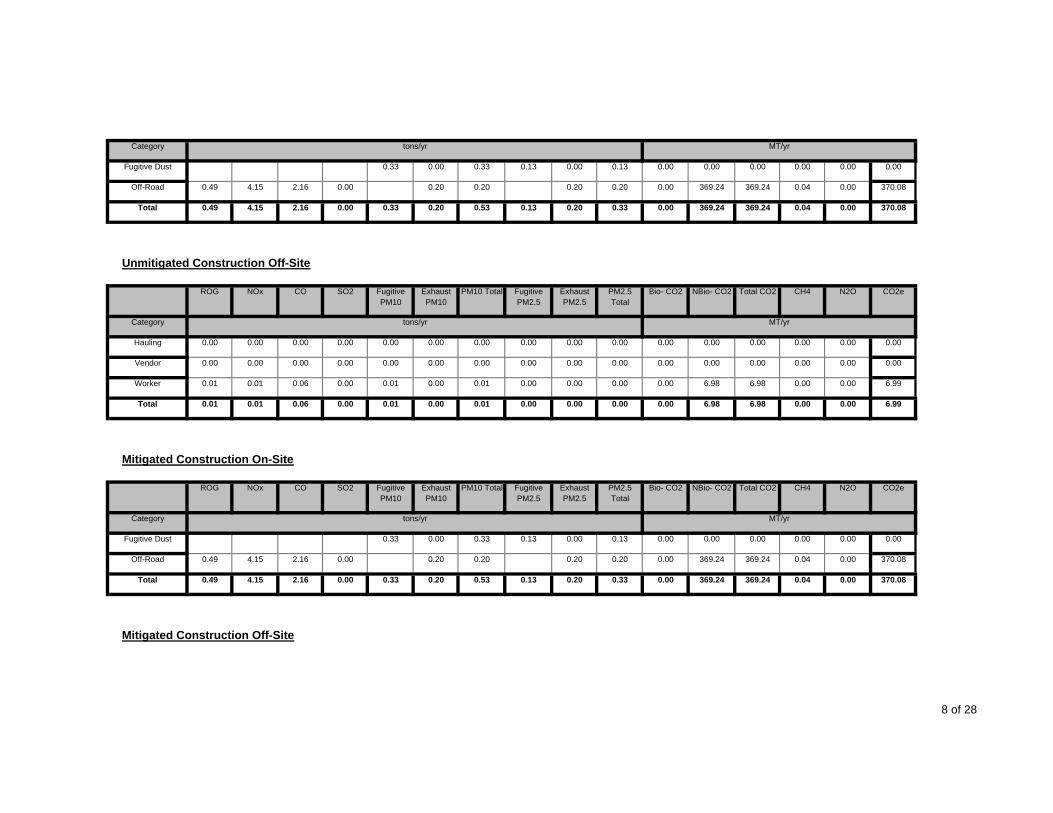
Category tons/yr MT/yr
Fugitive Dust 0.33 0.00 0.33 0.13 0.00 0.13 0.00 0.00 0.00 0.00 0.00 0.00
Off-Road 0.49 4.15 2.16 0.00 0.20 0.20 0.20 0.20 0.00 369.24 369.24 0.04 0.00 370.08
Total 0.49 4.15 2.16 369.24 0.04 0.000.13 0.20 0.33 0.00
SO2 Fugitive PM10
Exhaust PM10
369.240.00 0.33 0.20 0.53
Fugitive PM2.5
Exhaust PM2.5
PM2.5 Total
370.08
Unmitigated Construction Off-Site
ROG NOx CO N2O CO2e
Category tons/yr MT/yr
Bio- CO2 NBio- CO2 Total CO2 CH4PM10 Total
Hauling 0.00 0.00 0.00 0.00 0.00 0.00 0.00 0.00 0.00 0.00 0.00 0.00 0.00 0.00 0.00 0.00
Vendor 0.00 0.00 0.00 0.00 0.00 0.00 0.00 0.00 0.00 0.00 0.00 0.00 0.00 0.00 0.00 0.00
Worker 0.01 0.01 0.06 0.00 0.01 0.00 0.01 0.00 0.00 0.00 0.00 6.98 6.98 0.00 0.00 6.99
Total 0.01 0.01 0.06 0.00 0.01 0.00 0.01 0.00 0.00 6.990.00 0.00 0.00 6.98
Exhaust PM10
PM10 Total
6.98 0.00
PM2.5 Total
Bio- CO2
Mitigated Construction On-Site
ROG NOx CO SO2 Fugitive PM10
CO2e
Category tons/yr MT/yr
NBio- CO2 Total CO2 CH4 N2OFugitive PM2.5
Exhaust PM2.5
Fugitive Dust 0.33 0.00 0.33 0.13 0.00 0.13 0.00 0.00 0.00 0.00 0.00 0.00
Off-Road 0.49 4.15 2.16 0.00 0.20 0.20 0.20 0.20 0.00 369.24 369.24 0.04 0.00 370.08
Total 0.49 4.15 2.16 369.24 0.04 0.000.13 0.20 0.33 0.00 369.240.00 0.33 0.20 0.53 370.08
Mitigated Construction Off-Site
8 of 28

SO2 Fugitive PM10
Exhaust PM10
Fugitive PM2.5
Exhaust PM2.5
PM2.5 Total
ROG NOx CO N2O CO2e
Category tons/yr MT/yr
Bio- CO2 NBio- CO2 Total CO2 CH4PM10 Total
Hauling 0.00 0.00 0.00 0.00 0.00 0.00 0.00 0.00 0.00 0.00 0.00 0.00 0.00 0.00 0.00 0.00
Vendor 0.00 0.00 0.00 0.00 0.00 0.00 0.00 0.00 0.00 0.00 0.00 0.00 0.00 0.00 0.00 0.00
Worker 0.01 0.01 0.06 0.00 0.00 0.00 0.00 0.00 0.00 0.00 0.00 6.98 6.98 0.00 0.00 6.99
Total 0.01 0.01 0.06 0.00 0.00 0.00 0.00 0.00 0.00 6.990.00 0.00 0.00 6.98
Exhaust PM10
PM10 Total
6.98 0.00
PM2.5 Total
Bio- CO2
3.5 Building Construction - 2011
Unmitigated Construction On-Site
ROG NOx CO SO2 Fugitive PM10
CO2e
Category tons/yr MT/yr
NBio- CO2 Total CO2 CH4 N2OFugitive PM2.5
Exhaust PM2.5
Off-Road 0.32 2.11 1.26 0.00 0.15 0.15 0.15 0.15 0.00 192.39 192.39 0.03 0.00 192.94
Total 0.32 2.11 1.26 0.00 0.15 0.15 0.00 192.940.15 0.15 0.00 192.39
Exhaust PM10
PM10 Total
192.39 0.03
PM2.5 Total
Bio- CO2
Unmitigated Construction Off-Site
ROG NOx CO SO2 Fugitive PM10
CO2e
Category tons/yr MT/yr
NBio- CO2 Total CO2 CH4 N2OFugitive PM2.5
Exhaust PM2.5
Hauling 0.00 0.00 0.00 0.00 0.00 0.00 0.00 0.00 0.00 0.00 0.00 0.00 0.00 0.00 0.00 0.00
Vendor 0.14 1.54 0.99 0.00 0.06 0.05 0.12 0.00 0.05 0.05 0.00 196.04 196.04 0.01 0.00 196.17
Worker 0.22 0.26 2.53 0.00 0.37 0.01 0.38 0.01 0.01 0.02 0.00 302.00 302.00 0.02 0.00 302.46
Total 0.36 1.80 3.52 0.00 0.43 0.06 0.50 0.01 0.00 498.630.06 0.07 0.00 498.04 498.04 0.03
9 of 28

Exhaust PM10
PM10 Total PM2.5 Total
Bio- CO2
Mitigated Construction On-Site
ROG NOx CO SO2 Fugitive PM10
CO2e
Category tons/yr MT/yr
NBio- CO2 Total CO2 CH4 N2OFugitive PM2.5
Exhaust PM2.5
Off-Road 0.32 2.11 1.26 0.00 0.15 0.15 0.15 0.15 0.00 192.39 192.39 0.03 0.00 192.94
Total 0.32 2.11 1.26 0.00 0.15 0.15 0.00 192.940.15 0.15 0.00 192.39
Exhaust PM10
PM10 Total
192.39 0.03
PM2.5 Total
Bio- CO2
Mitigated Construction Off-Site
ROG NOx CO SO2 Fugitive PM10
CO2e
Category tons/yr MT/yr
NBio- CO2 Total CO2 CH4 N2OFugitive PM2.5
Exhaust PM2.5
Hauling 0.00 0.00 0.00 0.00 0.00 0.00 0.00 0.00 0.00 0.00 0.00 0.00 0.00 0.00 0.00 0.00
Vendor 0.14 1.54 0.99 0.00 0.01 0.05 0.06 0.00 0.05 0.05 0.00 196.04 196.04 0.01 0.00 196.17
Worker 0.22 0.26 2.53 0.00 0.02 0.01 0.03 0.01 0.01 0.02 0.00 302.00 302.00 0.02 0.00 302.46
Total 0.36 1.80 3.52 0.00 0.03 0.06 0.09 0.01 0.00 498.630.06 0.07 0.00 498.04
Exhaust PM10
PM10 Total
498.04 0.03
PM2.5 Total
Bio- CO2
3.5 Building Construction - 2012
Unmitigated Construction On-Site
ROG NOx CO SO2 Fugitive PM10
CO2e
Category tons/yr MT/yr
NBio- CO2 Total CO2 CH4 N2OFugitive PM2.5
Exhaust PM2.5
Off-Road 0.73 4.87 3.10 0.01 0.33 0.33 0.33 0.33 0.00 478.23 478.23 0.06 0.00 479.48
10 of 28
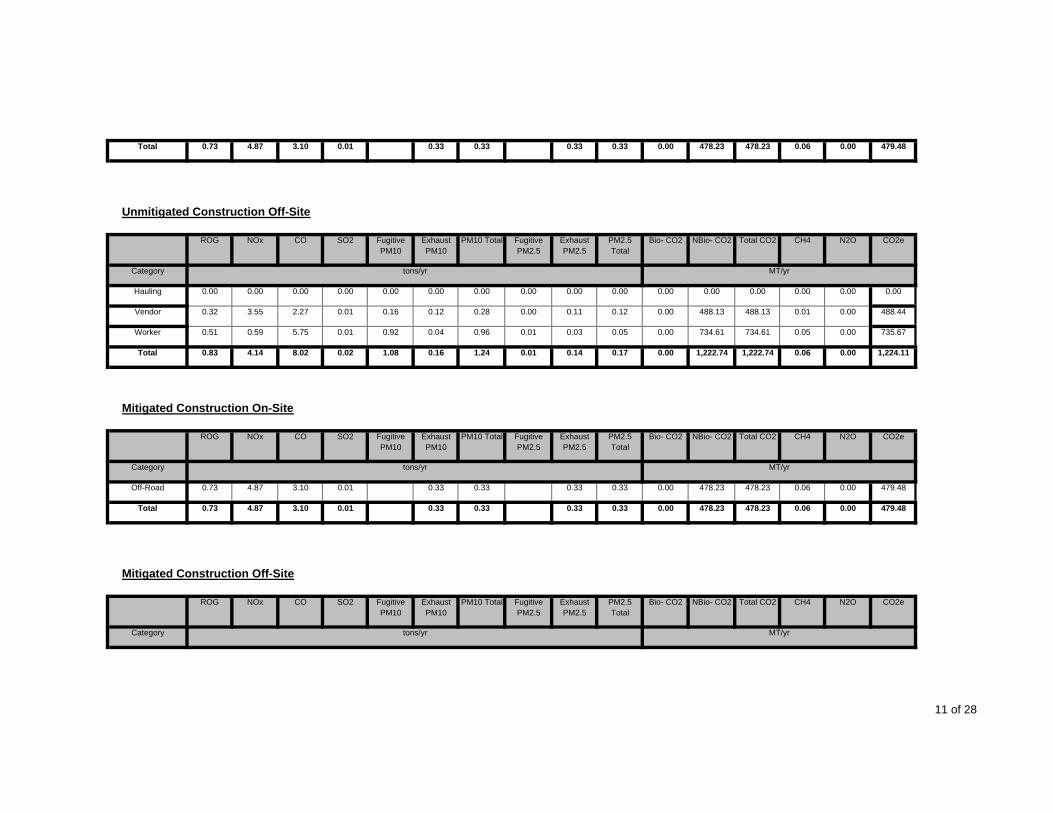
Total 0.73 4.87 3.10 0.01 0.33 0.33 0.00 479.480.33 0.33 0.00 478.23
Exhaust PM10
PM10 Total
478.23 0.06
PM2.5 Total
Bio- CO2
Unmitigated Construction Off-Site
ROG NOx CO SO2 Fugitive PM10
CO2e
Category tons/yr MT/yr
NBio- CO2 Total CO2 CH4 N2OFugitive PM2.5
Exhaust PM2.5
Hauling 0.00 0.00 0.00 0.00 0.00 0.00 0.00 0.00 0.00 0.00 0.00 0.00 0.00 0.00 0.00 0.00
Vendor 0.32 3.55 2.27 0.01 0.16 0.12 0.28 0.00 0.11 0.12 0.00 488.13 488.13 0.01 0.00 488.44
Worker 0.51 0.59 5.75 0.01 0.92 0.04 0.96 0.01 0.03 0.05 0.00 734.61 734.61 0.05 0.00 735.67
Total 0.83 4.14 8.02 0.02 1.08 0.16 1.24 0.01 0.00 1,224.110.14 0.17 0.00 1,222.74
Exhaust PM10
PM10 Total
1,222.74 0.06
PM2.5 Total
Bio- CO2
Mitigated Construction On-Site
ROG NOx CO SO2 Fugitive PM10
CO2e
Category tons/yr MT/yr
NBio- CO2 Total CO2 CH4 N2OFugitive PM2.5
Exhaust PM2.5
Off-Road 0.73 4.87 3.10 0.01 0.33 0.33 0.33 0.33 0.00 478.23 478.23 0.06 0.00 479.48
Total 0.73 4.87 3.10 0.01 0.33 0.33 0.00 479.480.33 0.33 0.00 478.23
Exhaust PM10
PM10 Total
478.23 0.06
PM2.5 Total
Bio- CO2
Mitigated Construction Off-Site
ROG NOx CO SO2 Fugitive PM10
CO2e
Category tons/yr MT/yr
NBio- CO2 Total CO2 CH4 N2OFugitive PM2.5
Exhaust PM2.5
11 of 28

Hauling 0.00 0.00 0.00 0.00 0.00 0.00 0.00 0.00 0.00 0.00 0.00 0.00 0.00 0.00 0.00 0.00
Vendor 0.32 3.55 2.27 0.01 0.01 0.12 0.14 0.00 0.11 0.12 0.00 488.13 488.13 0.01 0.00 488.44
Worker 0.51 0.59 5.75 0.01 0.04 0.04 0.08 0.01 0.03 0.05 0.00 734.61 734.61 0.05 0.00 735.67
Total 0.83 4.14 8.02 0.02 0.05 0.16 0.22 0.01 0.00 1,224.110.14 0.17 0.00 1,222.74
Exhaust PM10
PM10 Total
1,222.74 0.06
PM2.5 Total
Bio- CO2
3.5 Building Construction - 2013
Unmitigated Construction On-Site
ROG NOx CO SO2 Fugitive PM10
CO2e
Category tons/yr MT/yr
NBio- CO2 Total CO2 CH4 N2OFugitive PM2.5
Exhaust PM2.5
Off-Road 0.67 4.52 3.06 0.01 0.30 0.30 0.30 0.30 0.00 478.23 478.23 0.05 0.00 479.38
Total 0.67 4.52 3.06 0.01 0.30 0.30 0.00 479.380.30 0.30 0.00 478.23
Exhaust PM10
PM10 Total
478.23 0.05
PM2.5 Total
Bio- CO2
Unmitigated Construction Off-Site
ROG NOx CO SO2 Fugitive PM10
CO2e
Category tons/yr MT/yr
NBio- CO2 Total CO2 CH4 N2OFugitive PM2.5
Exhaust PM2.5
Hauling 0.00 0.00 0.00 0.00 0.00 0.00 0.00 0.00 0.00 0.00 0.00 0.00 0.00 0.00 0.00 0.00
Vendor 0.30 3.28 2.11 0.01 0.16 0.11 0.27 0.00 0.10 0.11 0.00 488.92 488.92 0.01 0.00 489.21
Worker 0.47 0.54 5.28 0.01 0.92 0.04 0.96 0.01 0.03 0.05 0.00 719.08 719.08 0.05 0.00 720.06
Total 0.77 3.82 7.39 0.02 1.08 0.15 1.23 0.01 0.00 1,209.270.13 0.16 0.00 1,208.00 1,208.00 0.06
Mitigated Construction On-Site
12 of 28
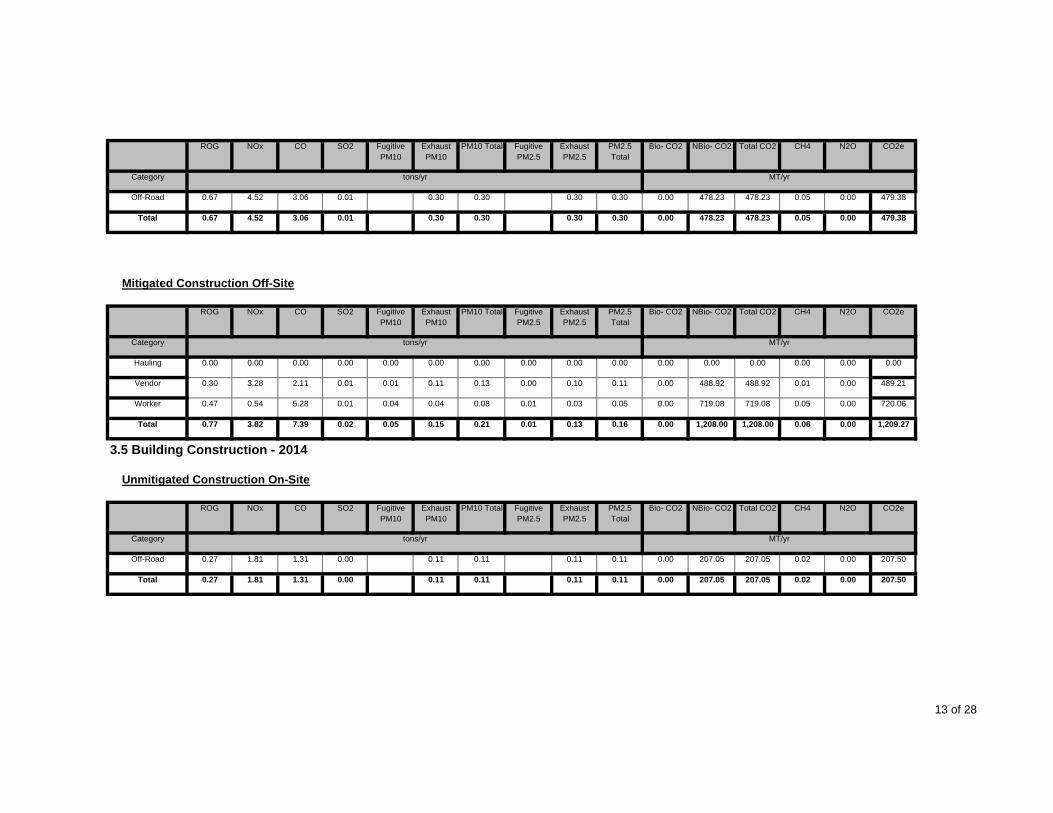
Exhaust PM10
PM10 Total PM2.5 Total
Bio- CO2ROG NOx CO SO2 Fugitive PM10
CO2e
Category tons/yr MT/yr
NBio- CO2 Total CO2 CH4 N2OFugitive PM2.5
Exhaust PM2.5
Off-Road 0.67 4.52 3.06 0.01 0.30 0.30 0.30 0.30 0.00 478.23 478.23 0.05 0.00 479.38
Total 0.67 4.52 3.06 0.01 0.30 0.30 0.00 479.380.30 0.30 0.00 478.23
Exhaust PM10
PM10 Total
478.23 0.05
PM2.5 Total
Bio- CO2
Mitigated Construction Off-Site
ROG NOx CO SO2 Fugitive PM10
CO2e
Category tons/yr MT/yr
NBio- CO2 Total CO2 CH4 N2OFugitive PM2.5
Exhaust PM2.5
Hauling 0.00 0.00 0.00 0.00 0.00 0.00 0.00 0.00 0.00 0.00 0.00 0.00 0.00 0.00 0.00 0.00
Vendor 0.30 3.28 2.11 0.01 0.01 0.11 0.13 0.00 0.10 0.11 0.00 488.92 488.92 0.01 0.00 489.21
Worker 0.47 0.54 5.28 0.01 0.04 0.04 0.08 0.01 0.03 0.05 0.00 719.08 719.08 0.05 0.00 720.06
Total 0.77 3.82 7.39 0.02 0.05 0.15 0.21 0.01 0.00 1,209.270.13 0.16 0.00 1,208.00
Exhaust PM10
PM10 Total
1,208.00 0.06
PM2.5 Total
Bio- CO2
3.5 Building Construction - 2014
Unmitigated Construction On-Site
ROG NOx CO SO2 Fugitive PM10
CO2e
Category tons/yr MT/yr
NBio- CO2 Total CO2 CH4 N2OFugitive PM2.5
Exhaust PM2.5
Off-Road 0.27 1.81 1.31 0.00 0.11 0.11 0.11 0.11 0.00 207.05 207.05 0.02 0.00 207.50
Total 0.27 1.81 1.31 0.00 0.11 0.11 0.00 207.500.11 0.11 0.00 207.05 207.05 0.02
13 of 28

Exhaust PM10
PM10 Total PM2.5 Total
Bio- CO2
Unmitigated Construction Off-Site
ROG NOx CO SO2 Fugitive PM10
CO2e
Category tons/yr MT/yr
NBio- CO2 Total CO2 CH4 N2OFugitive PM2.5
Exhaust PM2.5
Hauling 0.00 0.00 0.00 0.00 0.00 0.00 0.00 0.00 0.00 0.00 0.00 0.00 0.00 0.00 0.00 0.00
Vendor 0.12 1.32 0.84 0.00 0.07 0.04 0.11 0.00 0.04 0.04 0.00 212.01 212.01 0.01 0.00 212.12
Worker 0.19 0.21 2.10 0.00 0.40 0.02 0.41 0.01 0.01 0.02 0.00 304.76 304.76 0.02 0.00 305.16
Total 0.31 1.53 2.94 0.00 0.47 0.06 0.52 0.01 0.00 517.280.05 0.06 0.00 516.77
Exhaust PM10
PM10 Total
516.77 0.03
PM2.5 Total
Bio- CO2
Mitigated Construction On-Site
ROG NOx CO SO2 Fugitive PM10
CO2e
Category tons/yr MT/yr
NBio- CO2 Total CO2 CH4 N2OFugitive PM2.5
Exhaust PM2.5
Off-Road 0.27 1.81 1.31 0.00 0.11 0.11 0.11 0.11 0.00 207.05 207.05 0.02 0.00 207.50
Total 0.27 1.81 1.31 0.00 0.11 0.11 0.00 207.500.11 0.11 0.00 207.05
Exhaust PM10
PM10 Total
207.05 0.02
PM2.5 Total
Bio- CO2
Mitigated Construction Off-Site
ROG NOx CO SO2 Fugitive PM10
CO2e
Category tons/yr MT/yr
NBio- CO2 Total CO2 CH4 N2OFugitive PM2.5
Exhaust PM2.5
Hauling 0.00 0.00 0.00 0.00 0.00 0.00 0.00 0.00 0.00 0.00 0.00 0.00 0.00 0.00 0.00 0.00
Vendor 0.12 1.32 0.84 0.00 0.01 0.04 0.05 0.00 0.04 0.04 0.00 212.01 212.01 0.01 0.00 212.12
Worker 0.19 0.21 2.10 0.00 0.02 0.02 0.03 0.01 0.01 0.02 0.00 304.76 304.76 0.02 0.00 305.16
14 of 28

Total 0.31 1.53 2.94 0.00 0.03 0.06 0.08 0.01 0.00 517.280.05 0.06 0.00 516.77
Exhaust PM10
PM10 Total
516.77 0.03
PM2.5 Total
Bio- CO2
3.6 Paving - 2014
Unmitigated Construction On-Site
ROG NOx CO SO2 Fugitive PM10
CO2e
Category tons/yr MT/yr
NBio- CO2 Total CO2 CH4 N2OFugitive PM2.5
Exhaust PM2.5
Off-Road 0.14 0.88 0.57 0.00 0.08 0.08 0.08 0.08 0.00 72.77 72.77 0.01 0.00 73.01
Paving 0.00 0.00 0.00 0.00 0.00 0.00 0.00 0.00 0.00 0.00 0.00
Total 0.14 0.88 0.57 72.77 0.01 0.000.08 0.08 0.00
SO2 Fugitive PM10
Exhaust PM10
72.770.00 0.08 0.08
Fugitive PM2.5
Exhaust PM2.5
PM2.5 Total
73.01
Unmitigated Construction Off-Site
ROG NOx CO N2O CO2e
Category tons/yr MT/yr
Bio- CO2 NBio- CO2 Total CO2 CH4PM10 Total
Hauling 0.00 0.00 0.00 0.00 0.00 0.00 0.00 0.00 0.00 0.00 0.00 0.00 0.00 0.00 0.00 0.00
Vendor 0.00 0.00 0.00 0.00 0.00 0.00 0.00 0.00 0.00 0.00 0.00 0.00 0.00 0.00 0.00 0.00
Worker 0.00 0.00 0.02 0.00 0.00 0.00 0.00 0.00 0.00 0.00 0.00 3.60 3.60 0.00 0.00 3.61
Total 0.00 0.00 0.02 0.00 0.00 0.00 0.00 0.00 0.00 3.610.00 0.00 0.00 3.60
Exhaust PM10
PM10 Total
3.60 0.00
PM2.5 Total
Bio- CO2
Mitigated Construction On-Site
ROG NOx CO SO2 Fugitive PM10
CO2e
Category tons/yr MT/yr
NBio- CO2 Total CO2 CH4 N2OFugitive PM2.5
Exhaust PM2.5
15 of 28

Off-Road 0.14 0.88 0.57 0.00 0.08 0.08 0.08 0.08 0.00 72.77 72.77 0.01 0.00 73.01
Paving 0.00 0.00 0.00 0.00 0.00 0.00 0.00 0.00 0.00 0.00 0.00
Total 0.14 0.88 0.57 72.77 0.01 0.000.08 0.08 0.00
SO2 Fugitive PM10
Exhaust PM10
72.770.00 0.08 0.08
Fugitive PM2.5
Exhaust PM2.5
PM2.5 Total
73.01
Mitigated Construction Off-Site
ROG NOx CO N2O CO2e
Category tons/yr MT/yr
Bio- CO2 NBio- CO2 Total CO2 CH4PM10 Total
Hauling 0.00 0.00 0.00 0.00 0.00 0.00 0.00 0.00 0.00 0.00 0.00 0.00 0.00 0.00 0.00 0.00
Vendor 0.00 0.00 0.00 0.00 0.00 0.00 0.00 0.00 0.00 0.00 0.00 0.00 0.00 0.00 0.00 0.00
Worker 0.00 0.00 0.02 0.00 0.00 0.00 0.00 0.00 0.00 0.00 0.00 3.60 3.60 0.00 0.00 3.61
Total 0.00 0.00 0.02 0.00 0.00 0.00 0.00 0.00 0.00 3.610.00 0.00 0.00 3.60
Exhaust PM10
PM10 Total
3.60 0.00
PM2.5 Total
Bio- CO2
3.7 Architectural Coating - 2014
Unmitigated Construction On-Site
ROG NOx CO SO2 Fugitive PM10
CO2e
Category tons/yr MT/yr
NBio- CO2 Total CO2 CH4 N2OFugitive PM2.5
Exhaust PM2.5
Archit. Coating 16.75 0.00 0.00 0.00 0.00 0.00 0.00 0.00 0.00 0.00 0.00
Off-Road 0.01 0.08 0.05 0.00 0.01 0.01 0.01 0.01 0.00 7.01 7.01 0.00 0.00 7.03
Total 16.76 0.08 0.05 7.01 0.00 0.000.01 0.01 0.00 7.010.00 0.01 0.01 7.03
Unmitigated Construction Off-Site
16 of 28

SO2 Fugitive PM10
Exhaust PM10
Fugitive PM2.5
Exhaust PM2.5
PM2.5 Total
ROG NOx CO N2O CO2e
Category tons/yr MT/yr
Bio- CO2 NBio- CO2 Total CO2 CH4PM10 Total
Hauling 0.00 0.00 0.00 0.00 0.00 0.00 0.00 0.00 0.00 0.00 0.00 0.00 0.00 0.00 0.00 0.00
Vendor 0.00 0.00 0.00 0.00 0.00 0.00 0.00 0.00 0.00 0.00 0.00 0.00 0.00 0.00 0.00 0.00
Worker 0.02 0.02 0.20 0.00 0.04 0.00 0.04 0.00 0.00 0.00 0.00 29.76 29.76 0.00 0.00 29.80
Total 0.02 0.02 0.20 0.00 0.04 0.00 0.04 0.00 0.00 29.800.00 0.00 0.00 29.76
Exhaust PM10
PM10 Total
29.76 0.00
PM2.5 Total
Bio- CO2
Mitigated Construction On-Site
ROG NOx CO SO2 Fugitive PM10
CO2e
Category tons/yr MT/yr
NBio- CO2 Total CO2 CH4 N2OFugitive PM2.5
Exhaust PM2.5
Archit. Coating 16.75 0.00 0.00 0.00 0.00 0.00 0.00 0.00 0.00 0.00 0.00
Off-Road 0.01 0.08 0.05 0.00 0.01 0.01 0.01 0.01 0.00 7.01 7.01 0.00 0.00 7.03
Total 16.76 0.08 0.05 7.01 0.00 0.000.01 0.01 0.00
SO2 Fugitive PM10
Exhaust PM10
7.010.00 0.01 0.01
Fugitive PM2.5
Exhaust PM2.5
PM2.5 Total
7.03
Mitigated Construction Off-Site
ROG NOx CO N2O CO2e
Category tons/yr MT/yr
Bio- CO2 NBio- CO2 Total CO2 CH4PM10 Total
Hauling 0.00 0.00 0.00 0.00 0.00 0.00 0.00 0.00 0.00 0.00 0.00 0.00 0.00 0.00 0.00 0.00
Vendor 0.00 0.00 0.00 0.00 0.00 0.00 0.00 0.00 0.00 0.00 0.00 0.00 0.00 0.00 0.00 0.00
Worker 0.02 0.02 0.20 0.00 0.00 0.00 0.00 0.00 0.00 0.00 0.00 29.76 29.76 0.00 0.00 29.80
Total 0.02 0.02 0.20 0.00 0.00 0.00 0.00 0.00 0.00 0.00 0.00 29.76 29.76 0.00 0.00 29.80
17 of 28

SO2 Fugitive PM10
Exhaust PM10
4.0 Mobile Detail
4.1 Mitigation Measures Mobile
Fugitive PM2.5
Exhaust PM2.5
PM2.5 Total
ROG NOx CO N2O CO2e
Category tons/yr MT/yr
Bio- CO2 NBio- CO2 Total CO2 CH4PM10 Total
Mitigated 7.98 14.26 66.57 0.20 20.38 1.04 21.42 0.32 1.01 1.33 0.00 13,900.64 13,900.64 0.52 0.00 13,911.52
Unmitigated 7.98 14.26 66.57 0.20 20.38 1.04 21.42 0.32 1.01 1.33 0.00 13,900.64 13,900.64 0.52 0.00 13,911.52
Total NA NA NA NA NA NA NA NA NA NA NA NA
4.2 Trip Summary Information
Average Daily Trip Rate Unmitigated Mitigated
NA NA NA NA
Land Use Weekday Saturday Sunday
Apartments Mid Rise 3,678.30 3,678.30 3678.30397.67 397.67
Annual VMT Annual VMT
10,502,662 10,502,662848,967 848,967
Elementary School 1,534.10 1,534.10 1534.10 3,382,597 3,382,597City Park 397.67
General Office Building 203.81 203.81 203.81General Office Building 5,198.54 5,198.54 5198.54
611.68 611.68
487,065 487,06512,423,235 12,423,2351,461,754 1,461,754
Government Office Building 231.00 231.00 231.00 396,137 396,137General Office Building 611.68
18 of 28

Junior College (2Yr) 160.95 160.95 160.95Medical Office Building 3,804.72 3,804.72 3804.72
492.80 492.80
408,738 408,7387,446,788 7,446,7881,407,093 1,407,093
Total 16,313.57 16,313.57 16,313.57 38,765,038 38,765,038Single Family Housing 492.80
4.3 Trip Type Information
Miles Trip %
Land Use H-W or C-W H-S or C-C H-O or C-NW H-W or C-W H-S or C-C H-O or C-NW
Apartments Mid Rise 10.80 7.30 7.50 41.60 18.80 39.60
City Park 9.50 7.30 7.30 33.00 48.00 19.00
Elementary School 9.50 7.30 7.30 65.00 30.00 5.00
General Office Building 9.50 7.30 7.30 33.00 48.00 19.00
General Office Building 9.50 7.30 7.30 33.00 48.00 19.00
General Office Building 9.50 7.30 7.30 33.00 48.00 19.00
Government Office Building 9.50 7.30 7.30 33.00 62.00 5.00
Junior College (2Yr) 9.50 7.30 7.30 6.40 88.60 5.00
Medical Office Building 9.50 7.30 7.30 29.60 51.40 19.00
41.60 18.80 39.60
5.0 Energy Detail
Single Family Housing 10.80 7.30 7.50
5.1 Mitigation Measures Energy
19 of 28

ROG NOx CO SO2 Fugitive PM10
Exhaust PM10
PM10 Total Fugitive PM2.5
Exhaust PM2.5
PM2.5 Total
Bio- CO2 NBio- CO2 Total CO2 CH4 N2O CO2e
Category tons/yr MT/yr
Electricity Mitigated 0.00 0.00 0.00 0.00 0.00 3,494.13 3,494.13 0.13 0.05 3,512.12
Electricity Unmitigated
0.00 0.00 0.00 0.00 0.00 3,494.13 3,494.13 0.13 0.05 3,512.12
NaturalGas Mitigated 0.11 0.96 0.64 0.01 0.00 0.08 0.00 0.08 0.00 1,077.39 1,077.39 0.02 0.02 1,083.95
NaturalGas Unmitigated
0.11 0.96 0.64 0.01 0.00 0.08 0.00 0.08 0.00 1,077.39 1,077.39 0.02 0.02 1,083.95
Total NA NA NA NA NA NA NA NA NA NA NA NA NA NA NA NA
5.2 Energy by Land Use - NaturalGas
Unmitigated
NaturalGas Use ROG NOx CO SO2 Fugitive PM10
Exhaust PM10
PM10 Total Fugitive PM2.5
Exhaust PM2.5
PM2.5 Total N2O CO2e
Land Use kBTU tons/yr MT/yr
Bio- CO2 NBio- CO2 Total CO2 CH4
Apartments Mid Rise 6.74374e+006 0.04 0.31 0.13 0.00 0.00 0.03 0.00 0.03 0.00 359.87 359.87 0.01 0.01 362.06
City Park 0 0.00 0.00 0.00 0.00 0.00 0.00 0.00 0.00 0.00 0.00 0.00 0.00 0.00 0.00
Elementary School 304276 0.00 0.01 0.01 0.00 0.00 0.00 0.00 0.00 0.00 16.24 16.24 0.00 0.00 16.34
General Office Building
205208 0.00 0.01 0.01 0.00 0.00 0.00 0.00 0.00 0.00 10.95 10.95 0.00 0.00 11.02
General Office Building
5.23409e+006 0.03 0.26 0.22 0.00 0.00 0.02 0.00 0.02 0.00 279.31 279.31 0.01 0.01 281.01
General Office Building
615858 0.00 0.03 0.03 0.00 0.00 0.00 0.00 0.00 0.00 32.86 32.86 0.00 0.00 33.06
Government Office Building
2.5916e+006 0.01 0.13 0.11 0.00 0.00 0.01 0.00 0.01 0.00 138.30 138.30 0.00 0.00 139.14
Junior College (2Yr) 358875 0.00 0.02 0.01 0.00 0.00 0.00 0.00 0.00 0.00 19.15 19.15 0.00 0.00 19.27
Medical Office Building
1.79998e+006 0.01 0.09 0.07 0.00 0.00 0.01 0.00 0.01 0.00 96.05 96.05 0.00 0.00 96.64
Single Family Housing
2.33599e+006 0.01 0.11 0.05 0.00 0.00 0.01 0.00 0.01
0.64 0.00 0.00Total 0.10 0.97 0.00 0.08
0.00 125.420.00 124.66 124.66 0.00
0.02 1,083.960.00 1,077.39 1,077.39 0.020.08
20 of 28

Mitigated
NaturalGas Use ROG NOx CO SO2 Fugitive PM10
Exhaust PM10
PM10 Total Fugitive PM2.5
Exhaust PM2.5
PM2.5 Total N2O CO2e
Land Use kBTU tons/yr MT/yr
Bio- CO2 NBio- CO2 Total CO2 CH4
Apartments Mid Rise 6.74374e+006 0.04 0.31 0.13 0.00 0.00 0.03 0.00 0.03 0.00 359.87 359.87 0.01 0.01 362.06
City Park 0 0.00 0.00 0.00 0.00 0.00 0.00 0.00 0.00 0.00 0.00 0.00 0.00 0.00 0.00
Elementary School 304276 0.00 0.01 0.01 0.00 0.00 0.00 0.00 0.00 0.00 16.24 16.24 0.00 0.00 16.34
General Office Building
205208 0.00 0.01 0.01 0.00 0.00 0.00 0.00 0.00 0.00 10.95 10.95 0.00 0.00 11.02
General Office Building
5.23409e+006 0.03 0.26 0.22 0.00 0.00 0.02 0.00 0.02 0.00 279.31 279.31 0.01 0.01 281.01
General Office Building
615858 0.00 0.03 0.03 0.00 0.00 0.00 0.00 0.00 0.00 32.86 32.86 0.00 0.00 33.06
Government Office Building
2.5916e+006 0.01 0.13 0.11 0.00 0.00 0.01 0.00 0.01 0.00 138.30 138.30 0.00 0.00 139.14
Junior College (2Yr) 358875 0.00 0.02 0.01 0.00 0.00 0.00 0.00 0.00 0.00 19.15 19.15 0.00 0.00 19.27
Medical Office Building
1.79998e+006 0.01 0.09 0.07 0.00 0.00 0.01 0.00 0.01 0.00 96.05 96.05 0.00 0.00 96.64
Single Family Housing
2.33599e+006 0.01 0.11 0.05 0.00 0.00 0.01 0.00 0.01
0.64 0.00 0.00Total 0.10 0.97 0.00 0.08
0.00 125.420.00 124.66 124.66 0.00
0.02 1,083.96
5.3 Energy by Land Use - Electricity
Unmitigated
0.00 1,077.39 1,077.39 0.020.08
Electricity Use ROG NOx N2O CO2e
Land Use kWh tons/yr MT/yr
CO SO2 Total CO2 CH4
Apartments Mid Rise 2.1456e+006 759.89 0.03 0.01 763.80
City Park 0 0.00 0.00 0.00 0.00
21 of 28

Elementary School 280836 99.46 0.00 0.00 99.97
General Office Building
137095 48.55 0.00 0.00 48.80
General Office Building
3.4968e+006 1,238.43 0.05 0.02 1,244.80
General Office Building
411444 145.72 0.01 0.00 146.47
Government Office Building
1.7314e+006 613.19 0.02 0.01 616.35
Junior College (2Yr) 93699 33.18 0.00 0.00 33.36
Medical Office Building
1.20254e+006 425.89 0.02 0.01 428.08
Single Family Housing
366553 129.82 0.00 0.00 130.49
Total 3,494.13 0.13 0.05 3,512.12
Mitigated
Electricity Use ROG NOx N2O CO2e
Land Use kWh tons/yr MT/yr
CO SO2 Total CO2 CH4
Apartments Mid Rise 2.1456e+006 759.89 0.03 0.01 763.80
City Park 0 0.00 0.00 0.00 0.00
Elementary School 280836 99.46 0.00 0.00 99.97
General Office Building
137095 48.55 0.00 0.00 48.80
General Office Building
3.4968e+006 1,238.43 0.05 0.02 1,244.80
General Office Building
411444 145.72 0.01 0.00 146.47
Government Office Building
1.7314e+006 613.19 0.02 0.01 616.35
Junior College (2Yr) 93699 33.18 0.00 0.00 33.36
Medical Office Building
1.20254e+006 425.89 0.02 0.01 428.08
Single Family Housing
366553 129.82 0.00 0.00 130.49
22 of 28
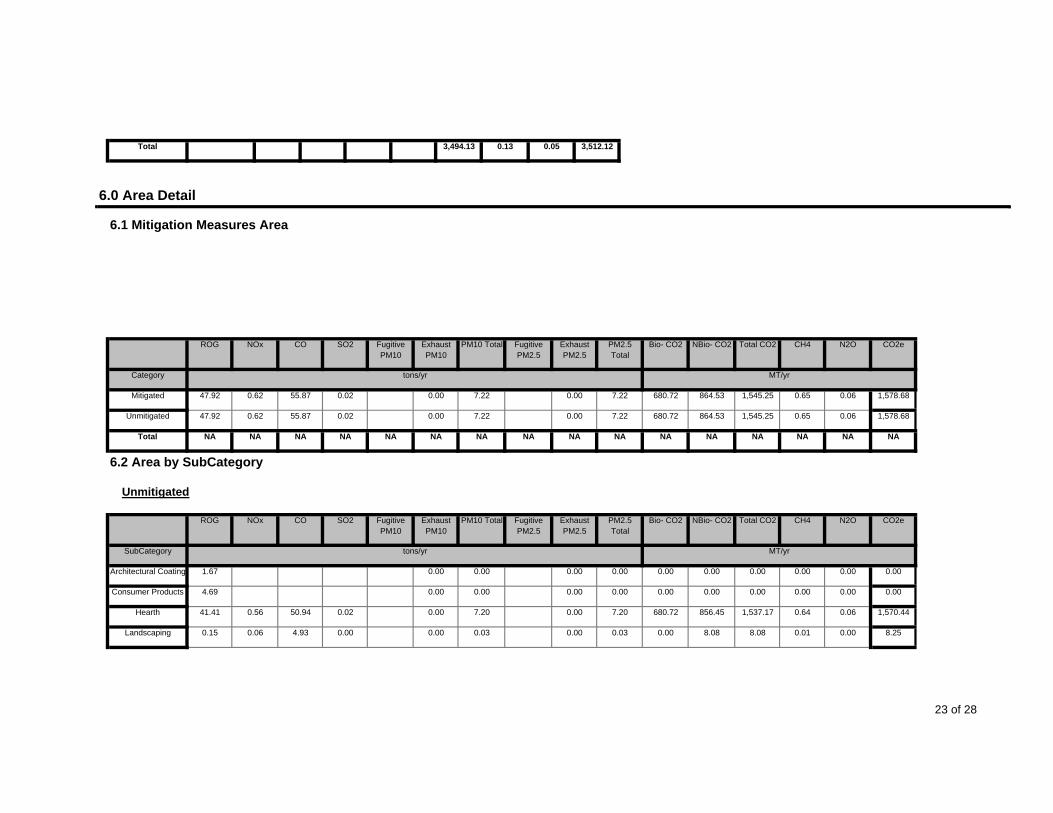
Total 3,494.13 0.13 0.05 3,512.12
6.0 Area Detail
6.1 Mitigation Measures Area
ROG NOx CO PM2.5 Total
Bio- CO2SO2 Fugitive PM10
Exhaust PM10
PM10 Total CO2e
Category tons/yr MT/yr
NBio- CO2 Total CO2 CH4 N2OFugitive PM2.5
Exhaust PM2.5
Mitigated 47.92 0.62 55.87 0.02 0.00 7.22 0.00 7.22 680.72 864.53 1,545.25 0.65 0.06 1,578.68
Unmitigated 47.92 0.62 55.87 0.02 0.00 7.22 0.00 7.22 680.72 864.53 1,545.25 0.65 0.06 1,578.68
Total NA NA NA NA NA NANA NA NA NA
SO2 Fugitive PM10
Exhaust PM10
NANA NA NA NA
Fugitive PM2.5
Exhaust PM2.5
PM2.5 Total
NA
6.2 Area by SubCategory
Unmitigated
ROG NOx CO N2O CO2e
SubCategory tons/yr MT/yr
Bio- CO2 NBio- CO2 Total CO2 CH4PM10 Total
Architectural Coating 1.67 0.00 0.00 0.00 0.00 0.00 0.00 0.00 0.00 0.00 0.00
Consumer Products 4.69 0.00 0.00 0.00 0.00 0.00 0.00 0.00 0.00 0.00 0.00
Hearth 41.41 0.56 50.94 0.02 0.00 7.20 0.00 7.20 680.72 856.45 1,537.17 0.64 0.06 1,570.44
Landscaping 0.15 0.06 4.93 0.00 0.00 0.03 0.00 0.03 0.00 8.08 8.08 0.01 0.00 8.25
23 of 28

Total 47.92 0.62 55.87 1,545.25 0.65 0.060.00 7.23 680.72
SO2 Fugitive PM10
Exhaust PM10
864.530.02 0.00 7.23
Fugitive PM2.5
Exhaust PM2.5
PM2.5 Total
1,578.69
Mitigated
ROG NOx CO N2O CO2e
SubCategory tons/yr MT/yr
Bio- CO2 NBio- CO2 Total CO2 CH4PM10 Total
Architectural Coating 1.67 0.00 0.00 0.00 0.00 0.00 0.00 0.00 0.00 0.00 0.00
Consumer Products 4.69 0.00 0.00 0.00 0.00 0.00 0.00 0.00 0.00 0.00 0.00
Hearth 41.41 0.56 50.94 0.02 0.00 7.20 0.00 7.20 680.72 856.45 1,537.17 0.64 0.06 1,570.44
Landscaping 0.15 0.06 4.93 0.00 0.00 0.03 0.00 0.03 0.00 8.08 8.08 0.01 0.00 8.25
Total 47.92 0.62 55.87 7.23 680.720.02 0.00 7.23 1,578.69
7.0 Water Detail
7.1 Mitigation Measures Water
864.53 1,545.25 0.65 0.060.00
ROG NOx CO SO2 Total CO2 CH4 N2O CO2e
Category tons/yr MT/yr
Mitigated 897.70 3.75 0.10 1,008.94
Unmitigated 897.70 3.75 0.10 1,008.94
24 of 28

Total NA NA NA NA NA NA NA NA
7.2 Water by Land Use
Unmitigated
Indoor/Outdoor Use
ROG NOx CO SO2 Total CO2 CH4 N2O CO2e
Land Use Mgal tons/yr MT/yr
Apartments Mid Rise 39.2879 / 24.7684 279.07 1.21 0.03 314.91
City Park 0 / 10.8425 42.66 0.00 0.00 42.88
Elementary School 1.28242 / 3.29766 18.90 0.04 0.00 20.12
General Office Building
45.6794 / 27.997 321.32 1.41 0.04 362.98
Government Office Building
21.8526 / 13.3935 153.72 0.67 0.02 173.64
Junior College (2Yr) 0.426727 / 0.667444
4.60 0.01 0.00 5.00
Medical Office Building
9.58671 / 1.82604 51.50 0.29 0.01 60.16
Single Family Housing
3.64863 / 2.30022 25.92 0.11 0.00 29.25
Total 897.69 3.74 0.10 1,008.94
Mitigated
Indoor/Outdoor Use
ROG NOx N2O CO2e
Land Use Mgal tons/yr MT/yr
CO SO2 Total CO2 CH4
Apartments Mid Rise 39.2879 / 24.7684 279.07 1.21 0.03 314.91
City Park 0 / 10.8425 42.66 0.00 0.00 42.88
Elementary School 1.28242 / 3.29766 18.90 0.04 0.00 20.12
25 of 28
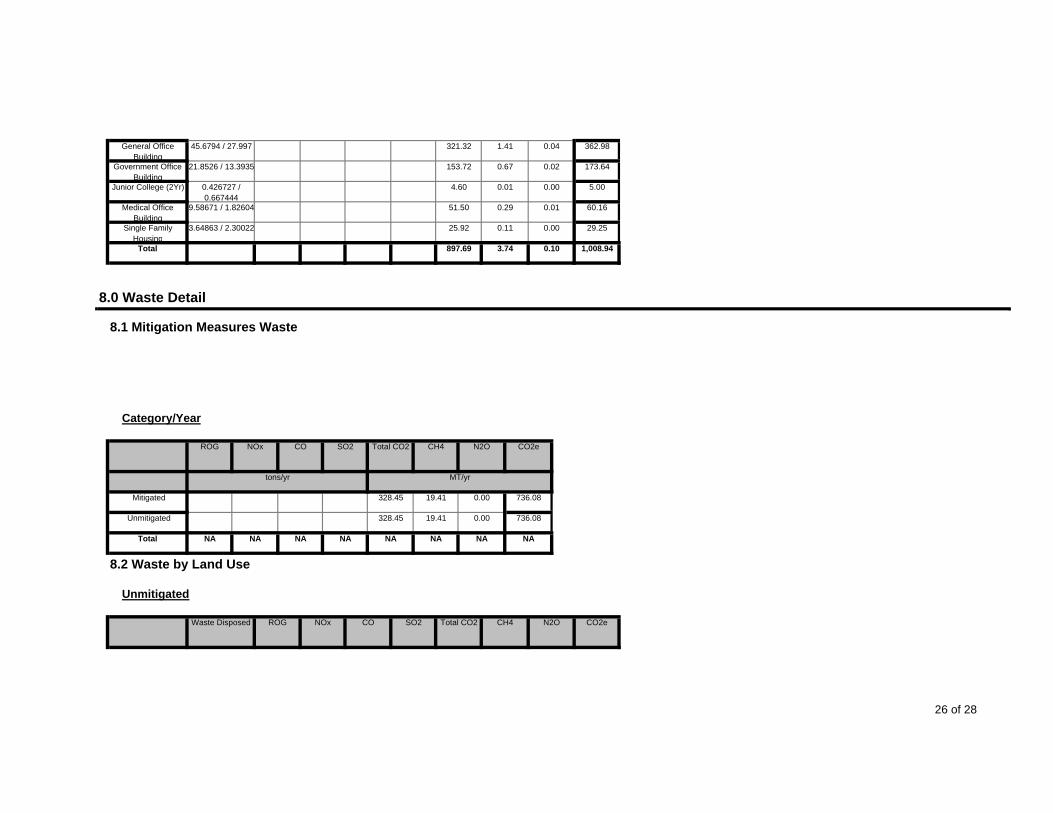
General Office Building
45.6794 / 27.997 321.32 1.41 0.04 362.98
Government Office Building
21.8526 / 13.3935 153.72 0.67 0.02 173.64
Junior College (2Yr) 0.426727 / 0.667444
4.60 0.01 0.00 5.00
Medical Office Building
9.58671 / 1.82604 51.50 0.29 0.01 60.16
Single Family Housing
3.64863 / 2.30022 25.92 0.11 0.00 29.25
Total 897.69 3.74 0.10 1,008.94
8.0 Waste Detail
NOx CO
8.1 Mitigation Measures Waste
Category/Year
CO2e
tons/yr MT/yr
SO2 Total CO2 CH4 N2OROG
Mitigated 328.45 19.41 0.00 736.08
Unmitigated 328.45 19.41 0.00 736.08
Total NA NA NA NA NA NA NA NA
8.2 Waste by Land Use
Unmitigated
Waste Disposed ROG NOx CO SO2 Total CO2 CH4 N2O CO2e
26 of 28

Land Use tons tons/yr MT/yr
Apartments Mid Rise 277.38 56.31 3.33 0.00 126.18
City Park 0.78 0.16 0.01 0.00 0.35
Elementary School 96.54 19.60 1.16 0.00 43.92
General Office Building
239.02 48.52 2.87 0.00 108.73
Government Office Building
102.3 20.77 1.23 0.00 46.54
Junior College (2Yr) 11.31 2.30 0.14 0.00 5.15
Medical Office Building
825.12 167.49 9.90 0.00 375.36
Single Family Housing
65.6 13.32 0.79 0.00 29.84
Total 328.47 19.43 0.00 736.07
Mitigated
Waste Disposed ROG NOx N2O CO2e
Land Use tons tons/yr MT/yr
CO SO2 Total CO2 CH4
Apartments Mid Rise 277.38 56.31 3.33 0.00 126.18
City Park 0.78 0.16 0.01 0.00 0.35
Elementary School 96.54 19.60 1.16 0.00 43.92
General Office Building
239.02 48.52 2.87 0.00 108.73
Government Office Building
102.3 20.77 1.23 0.00 46.54
Junior College (2Yr) 11.31 2.30 0.14 0.00 5.15
Medical Office Building
825.12 167.49 9.90 0.00 375.36
Single Family Housing
65.6 13.32 0.79 0.00 29.84
Total 328.47 19.43 0.00 736.07
27 of 28

9.0 Vegetation
28 of 28
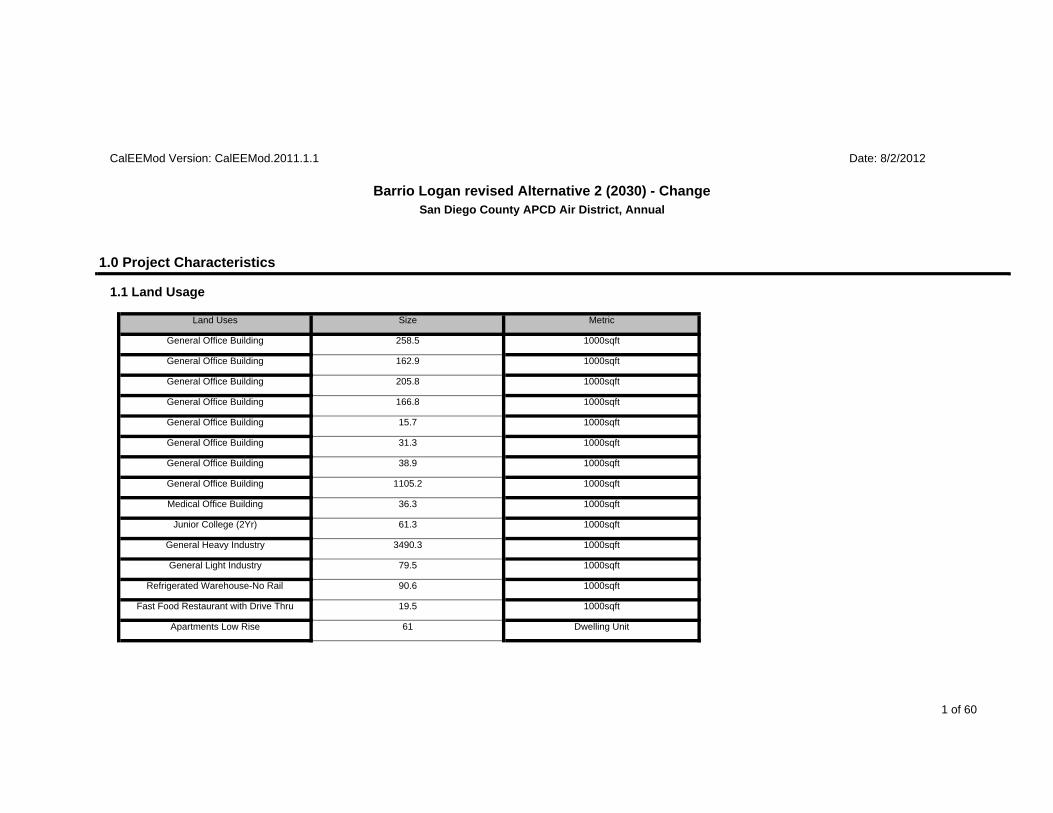
CalEEMod Version: CalEEMod.2011.1.1 Date: 8/2/2012
Barrio Logan revised Alternative 2 (2030) - ChangeSan Diego County APCD Air District, Annual
1.0 Project Characteristics
1.1 Land Usage
Land Uses Size Metric
General Office Building 258.5 1000sqft
General Office Building 162.9 1000sqft
General Office Building 205.8 1000sqft
General Office Building 166.8 1000sqft
General Office Building 15.7 1000sqft
General Office Building 31.3 1000sqft
General Office Building 38.9 1000sqft
General Office Building 1105.2 1000sqft
Medical Office Building 36.3 1000sqft
Junior College (2Yr) 61.3 1000sqft
General Heavy Industry 3490.3 1000sqft
General Light Industry 79.5 1000sqft
Refrigerated Warehouse-No Rail 90.6 1000sqft
Fast Food Restaurant with Drive Thru 19.5 1000sqft
Apartments Low Rise 61 Dwelling Unit
1 of 60
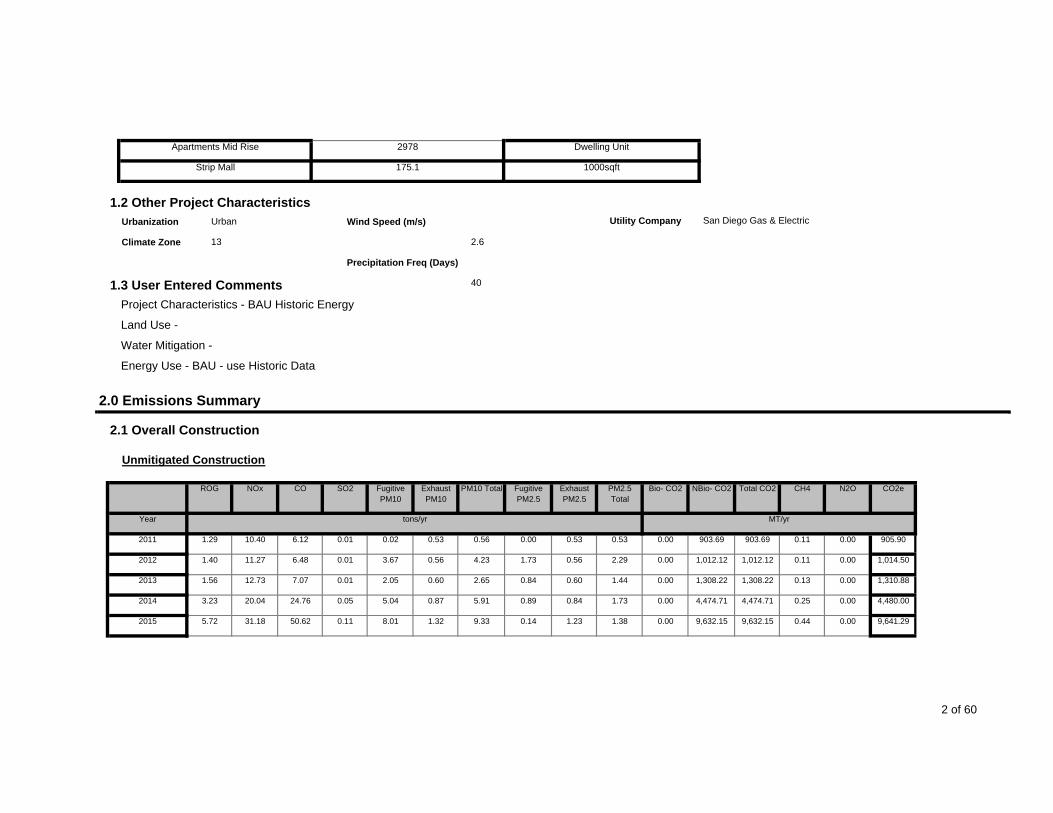
Apartments Mid Rise 2978 Dwelling Unit
Strip Mall 175.1 1000sqft
1.2 Other Project CharacteristicsUtility Company San Diego Gas & ElectricUrbanization Urban Wind Speed (m/s)
Climate Zone 13 2.6
Precipitation Freq (Days)
1.3 User Entered Comments 40
Project Characteristics - BAU Historic Energy
Land Use -
Exhaust PM10
PM10 Total
Water Mitigation -
Energy Use - BAU - use Historic Data
2.0 Emissions Summary
PM2.5 Total
Bio- CO2
2.1 Overall Construction
Unmitigated Construction
ROG NOx CO SO2 Fugitive PM10
CO2e
Year tons/yr MT/yr
NBio- CO2 Total CO2 CH4 N2OFugitive PM2.5
Exhaust PM2.5
2011 1.29 10.40 6.12 0.01 0.02 0.53 0.56 0.00 0.53 0.53 0.00 903.69 903.69 0.11 0.00 905.90
2012 1.40 11.27 6.48 0.01 3.67 0.56 4.23 1.73 0.56 2.29 0.00 1,012.12 1,012.12 0.11 0.00 1,014.50
2013 1.56 12.73 7.07 0.01 2.05 0.60 2.65 0.84 0.60 1.44 0.00 1,308.22 1,308.22 0.13 0.00 1,310.88
2014 3.23 20.04 24.76 0.05 5.04 0.87 5.91 0.89 0.84 1.73 0.00 4,474.71 4,474.71 0.25 0.00 4,480.00
2015 5.72 31.18 50.62 0.11 8.01 1.32 9.33 0.14 1.23 1.38 0.00 9,632.15 9,632.15 0.44 0.00 9,641.29
2 of 60
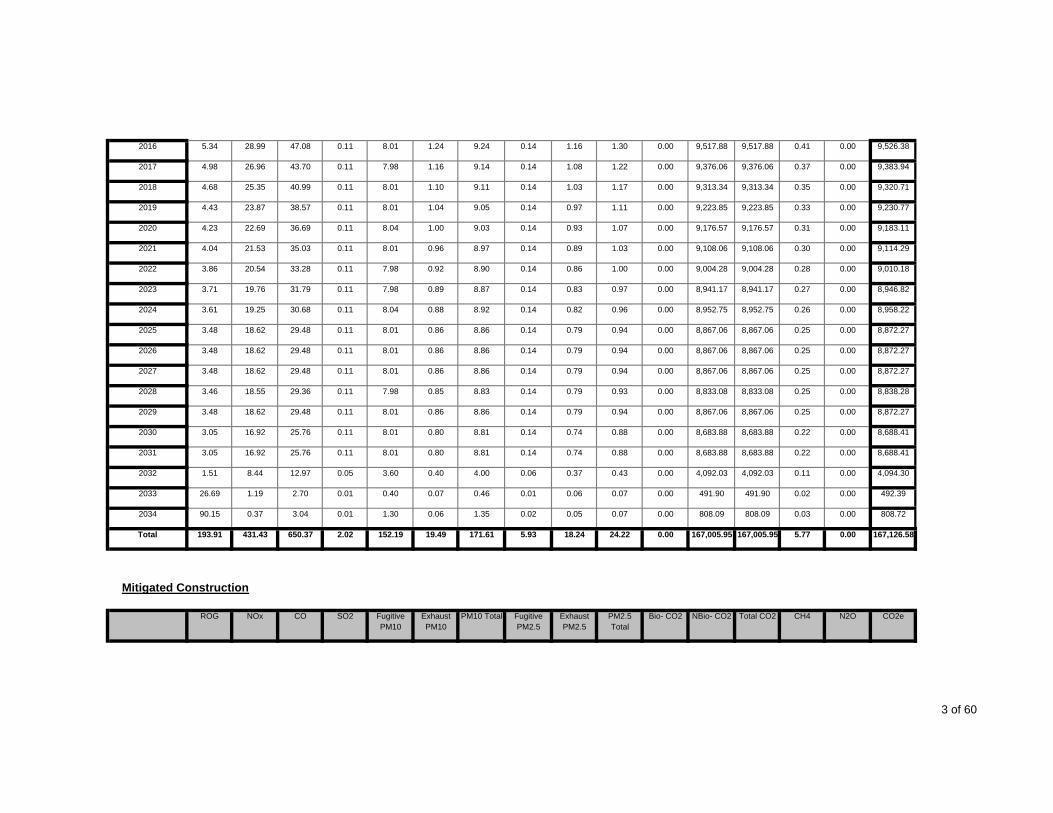
2016 5.34 28.99 47.08 0.11 8.01 1.24 9.24 0.14 1.16 1.30 0.00 9,517.88 9,517.88 0.41 0.00 9,526.38
2017 4.98 26.96 43.70 0.11 7.98 1.16 9.14 0.14 1.08 1.22 0.00 9,376.06 9,376.06 0.37 0.00 9,383.94
2018 4.68 25.35 40.99 0.11 8.01 1.10 9.11 0.14 1.03 1.17 0.00 9,313.34 9,313.34 0.35 0.00 9,320.71
2019 4.43 23.87 38.57 0.11 8.01 1.04 9.05 0.14 0.97 1.11 0.00 9,223.85 9,223.85 0.33 0.00 9,230.77
2020 4.23 22.69 36.69 0.11 8.04 1.00 9.03 0.14 0.93 1.07 0.00 9,176.57 9,176.57 0.31 0.00 9,183.11
2021 4.04 21.53 35.03 0.11 8.01 0.96 8.97 0.14 0.89 1.03 0.00 9,108.06 9,108.06 0.30 0.00 9,114.29
2022 3.86 20.54 33.28 0.11 7.98 0.92 8.90 0.14 0.86 1.00 0.00 9,004.28 9,004.28 0.28 0.00 9,010.18
2023 3.71 19.76 31.79 0.11 7.98 0.89 8.87 0.14 0.83 0.97 0.00 8,941.17 8,941.17 0.27 0.00 8,946.82
2024 3.61 19.25 30.68 0.11 8.04 0.88 8.92 0.14 0.82 0.96 0.00 8,952.75 8,952.75 0.26 0.00 8,958.22
2025 3.48 18.62 29.48 0.11 8.01 0.86 8.86 0.14 0.79 0.94 0.00 8,867.06 8,867.06 0.25 0.00 8,872.27
2026 3.48 18.62 29.48 0.11 8.01 0.86 8.86 0.14 0.79 0.94 0.00 8,867.06 8,867.06 0.25 0.00 8,872.27
2027 3.48 18.62 29.48 0.11 8.01 0.86 8.86 0.14 0.79 0.94 0.00 8,867.06 8,867.06 0.25 0.00 8,872.27
2028 3.46 18.55 29.36 0.11 7.98 0.85 8.83 0.14 0.79 0.93 0.00 8,833.08 8,833.08 0.25 0.00 8,838.28
2029 3.48 18.62 29.48 0.11 8.01 0.86 8.86 0.14 0.79 0.94 0.00 8,867.06 8,867.06 0.25 0.00 8,872.27
2030 3.05 16.92 25.76 0.11 8.01 0.80 8.81 0.14 0.74 0.88 0.00 8,683.88 8,683.88 0.22 0.00 8,688.41
2031 3.05 16.92 25.76 0.11 8.01 0.80 8.81 0.14 0.74 0.88 0.00 8,683.88 8,683.88 0.22 0.00 8,688.41
2032 1.51 8.44 12.97 0.05 3.60 0.40 4.00 0.06 0.37 0.43 0.00 4,092.03 4,092.03 0.11 0.00 4,094.30
2033 26.69 1.19 2.70 0.01 0.40 0.07 0.46 0.01 0.06 0.07 0.00 491.90 491.90 0.02 0.00 492.39
2034 90.15 0.37 3.04 0.01 1.30 0.06 1.35 0.02 0.05 0.07 0.00 808.09 808.09 0.03 0.00 808.72
Total 193.91 431.43 650.37 167,005.95 5.77 0.005.93 18.24 24.22 0.00
SO2 Fugitive PM10
Exhaust PM10
167,005.952.02 152.19 19.49 171.61
Fugitive PM2.5
Exhaust PM2.5
PM2.5 Total
167,126.58
Mitigated Construction
ROG NOx CO N2O CO2eBio- CO2 NBio- CO2 Total CO2 CH4PM10 Total
3 of 60
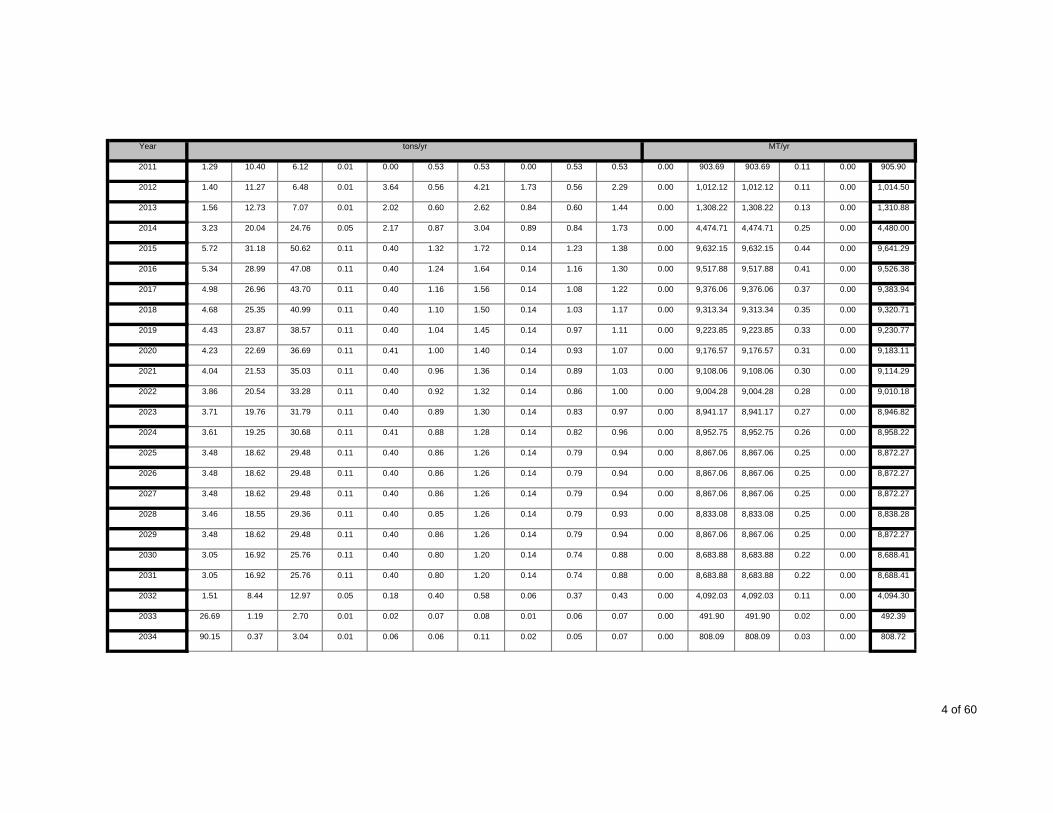
Year tons/yr MT/yr
2011 1.29 10.40 6.12 0.01 0.00 0.53 0.53 0.00 0.53 0.53 0.00 903.69 903.69 0.11 0.00 905.90
2012 1.40 11.27 6.48 0.01 3.64 0.56 4.21 1.73 0.56 2.29 0.00 1,012.12 1,012.12 0.11 0.00 1,014.50
2013 1.56 12.73 7.07 0.01 2.02 0.60 2.62 0.84 0.60 1.44 0.00 1,308.22 1,308.22 0.13 0.00 1,310.88
2014 3.23 20.04 24.76 0.05 2.17 0.87 3.04 0.89 0.84 1.73 0.00 4,474.71 4,474.71 0.25 0.00 4,480.00
2015 5.72 31.18 50.62 0.11 0.40 1.32 1.72 0.14 1.23 1.38 0.00 9,632.15 9,632.15 0.44 0.00 9,641.29
2016 5.34 28.99 47.08 0.11 0.40 1.24 1.64 0.14 1.16 1.30 0.00 9,517.88 9,517.88 0.41 0.00 9,526.38
2017 4.98 26.96 43.70 0.11 0.40 1.16 1.56 0.14 1.08 1.22 0.00 9,376.06 9,376.06 0.37 0.00 9,383.94
2018 4.68 25.35 40.99 0.11 0.40 1.10 1.50 0.14 1.03 1.17 0.00 9,313.34 9,313.34 0.35 0.00 9,320.71
2019 4.43 23.87 38.57 0.11 0.40 1.04 1.45 0.14 0.97 1.11 0.00 9,223.85 9,223.85 0.33 0.00 9,230.77
2020 4.23 22.69 36.69 0.11 0.41 1.00 1.40 0.14 0.93 1.07 0.00 9,176.57 9,176.57 0.31 0.00 9,183.11
2021 4.04 21.53 35.03 0.11 0.40 0.96 1.36 0.14 0.89 1.03 0.00 9,108.06 9,108.06 0.30 0.00 9,114.29
2022 3.86 20.54 33.28 0.11 0.40 0.92 1.32 0.14 0.86 1.00 0.00 9,004.28 9,004.28 0.28 0.00 9,010.18
2023 3.71 19.76 31.79 0.11 0.40 0.89 1.30 0.14 0.83 0.97 0.00 8,941.17 8,941.17 0.27 0.00 8,946.82
2024 3.61 19.25 30.68 0.11 0.41 0.88 1.28 0.14 0.82 0.96 0.00 8,952.75 8,952.75 0.26 0.00 8,958.22
2025 3.48 18.62 29.48 0.11 0.40 0.86 1.26 0.14 0.79 0.94 0.00 8,867.06 8,867.06 0.25 0.00 8,872.27
2026 3.48 18.62 29.48 0.11 0.40 0.86 1.26 0.14 0.79 0.94 0.00 8,867.06 8,867.06 0.25 0.00 8,872.27
2027 3.48 18.62 29.48 0.11 0.40 0.86 1.26 0.14 0.79 0.94 0.00 8,867.06 8,867.06 0.25 0.00 8,872.27
2028 3.46 18.55 29.36 0.11 0.40 0.85 1.26 0.14 0.79 0.93 0.00 8,833.08 8,833.08 0.25 0.00 8,838.28
2029 3.48 18.62 29.48 0.11 0.40 0.86 1.26 0.14 0.79 0.94 0.00 8,867.06 8,867.06 0.25 0.00 8,872.27
2030 3.05 16.92 25.76 0.11 0.40 0.80 1.20 0.14 0.74 0.88 0.00 8,683.88 8,683.88 0.22 0.00 8,688.41
2031 3.05 16.92 25.76 0.11 0.40 0.80 1.20 0.14 0.74 0.88 0.00 8,683.88 8,683.88 0.22 0.00 8,688.41
2032 1.51 8.44 12.97 0.05 0.18 0.40 0.58 0.06 0.37 0.43 0.00 4,092.03 4,092.03 0.11 0.00 4,094.30
2033 26.69 1.19 2.70 0.01 0.02 0.07 0.08 0.01 0.06 0.07 0.00 491.90 491.90 0.02 0.00 492.39
2034 90.15 0.37 3.04 0.01 0.06 0.06 0.11 0.02 0.05 0.07 0.00 808.09 808.09 0.03 0.00 808.72
4 of 60
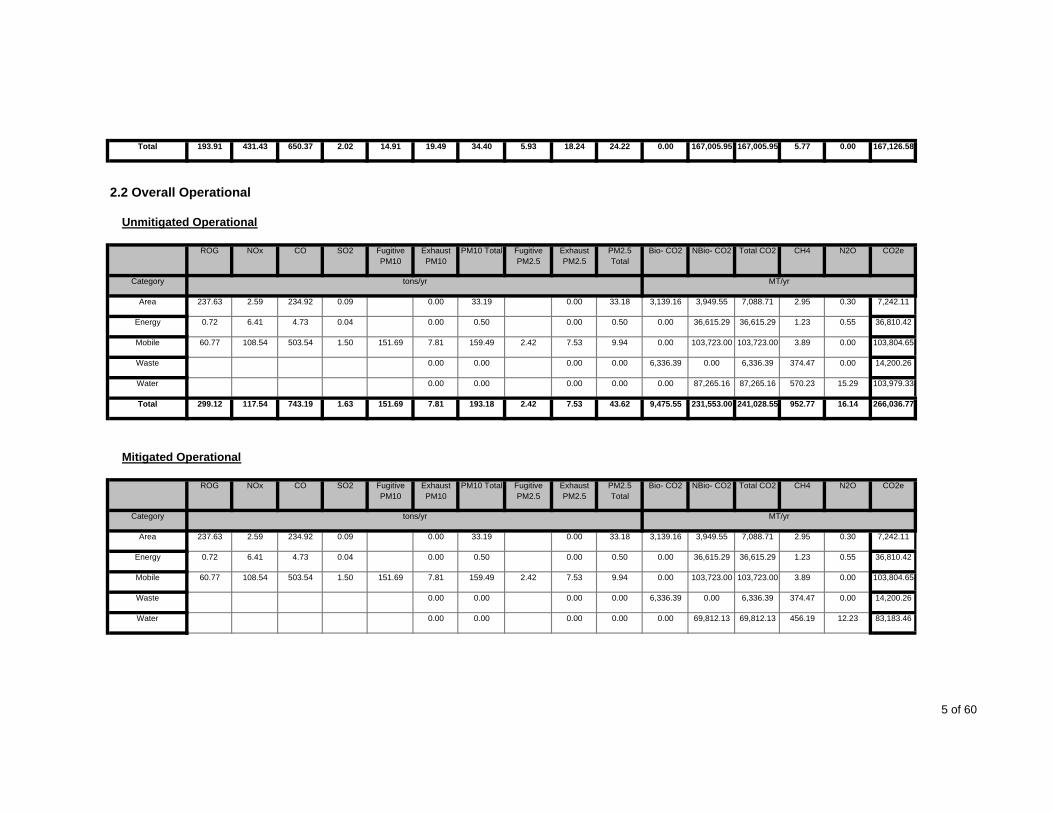
Total 193.91 431.43 650.37 167,005.95 5.77 0.005.93 18.24 24.22 0.00
SO2 Fugitive PM10
Exhaust PM10
167,005.952.02 14.91 19.49 34.40
Fugitive PM2.5
Exhaust PM2.5
PM2.5 Total
167,126.58
2.2 Overall Operational
Unmitigated Operational
ROG NOx CO N2O CO2e
Category tons/yr MT/yr
Bio- CO2 NBio- CO2 Total CO2 CH4PM10 Total
Area 237.63 2.59 234.92 0.09 0.00 33.19 0.00 33.18 3,139.16 3,949.55 7,088.71 2.95 0.30 7,242.11
Energy 0.72 6.41 4.73 0.04 0.00 0.50 0.00 0.50 0.00 36,615.29 36,615.29 1.23 0.55 36,810.42
Mobile 60.77 108.54 503.54 1.50 151.69 7.81 159.49 2.42 7.53 9.94 0.00 103,723.00 103,723.00 3.89 0.00 103,804.65
Waste 0.00 0.00 0.00 0.00 6,336.39 0.00 6,336.39 374.47 0.00 14,200.26
Water 0.00 0.00 0.00 0.00 0.00 87,265.16 87,265.16 570.23 15.29 103,979.33
Total 299.12 117.54 743.19 1.63 151.69 7.81 193.18 2.42 16.14 266,036.777.53 43.62 9,475.55 231,553.00
Exhaust PM10
PM10 Total
241,028.55 952.77
PM2.5 Total
Bio- CO2
Mitigated Operational
ROG NOx CO SO2 Fugitive PM10
CO2e
Category tons/yr MT/yr
NBio- CO2 Total CO2 CH4 N2OFugitive PM2.5
Exhaust PM2.5
Area 237.63 2.59 234.92 0.09 0.00 33.19 0.00 33.18 3,139.16 3,949.55 7,088.71 2.95 0.30 7,242.11
Energy 0.72 6.41 4.73 0.04 0.00 0.50 0.00 0.50 0.00 36,615.29 36,615.29 1.23 0.55 36,810.42
Mobile 60.77 108.54 503.54 1.50 151.69 7.81 159.49 2.42 7.53 9.94 0.00 103,723.00 103,723.00 3.89 0.00 103,804.65
Waste 0.00 0.00 0.00 0.00 6,336.39 0.00 6,336.39 374.47 0.00 14,200.26
Water 0.00 0.00 0.00 0.00 0.00 69,812.13 69,812.13 456.19 12.23 83,183.46
5 of 60

Total 299.12 117.54 743.19 1.63 151.69 7.81 193.18 2.42 7.53 43.62 9,475.55 214,099.97 223,575.52 838.73 13.08 245,240.90
SO2 Fugitive PM10
Exhaust PM10
3.0 Construction Detail
3.1 Mitigation Measures Construction
Fugitive PM2.5
Exhaust PM2.5
PM2.5 Total
3.2 Demolition - 2011
Unmitigated Construction On-Site
ROG NOx CO N2O CO2e
Category tons/yr MT/yr
Bio- CO2 NBio- CO2 Total CO2 CH4PM10 Total
Off-Road 1.28 10.38 5.97 0.01 0.53 0.53 0.53 0.53 0.00 885.54 885.54 0.10 0.00 887.72
Total 1.28 10.38 5.97 0.01 0.53 0.53 0.00 887.720.53 0.53 0.00 885.54 885.54 0.10
6 of 60
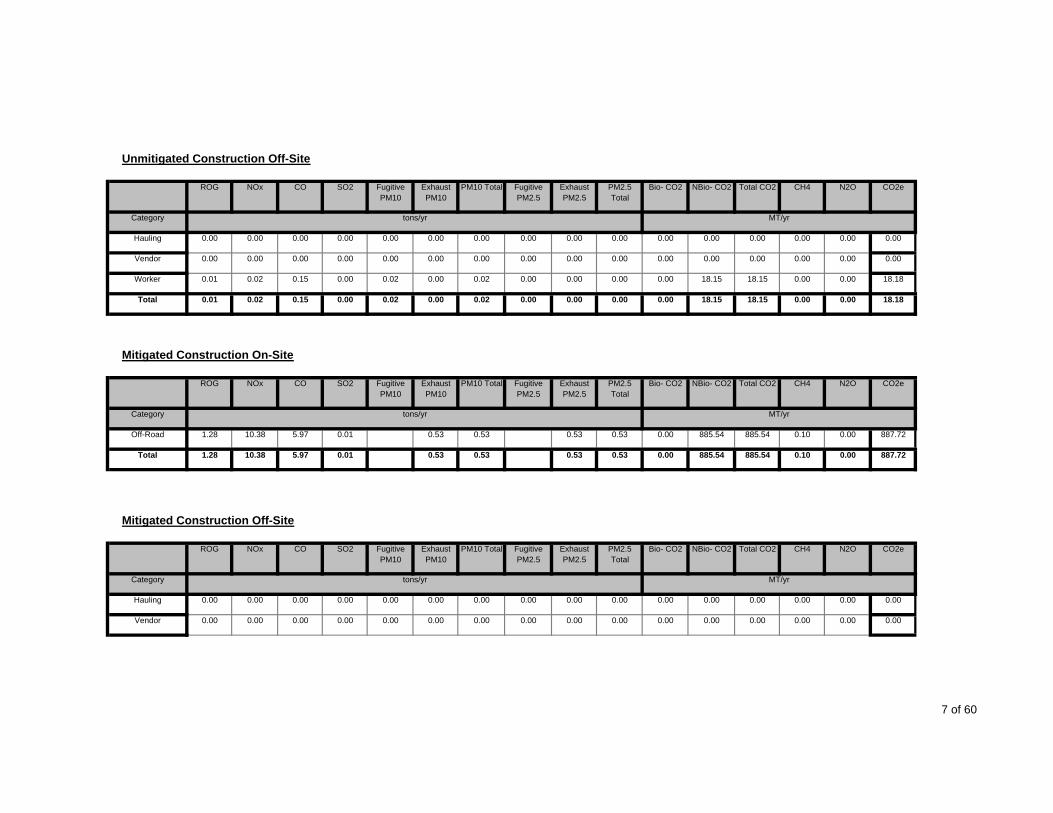
Exhaust PM10
PM10 Total PM2.5 Total
Bio- CO2
Unmitigated Construction Off-Site
ROG NOx CO SO2 Fugitive PM10
CO2e
Category tons/yr MT/yr
NBio- CO2 Total CO2 CH4 N2OFugitive PM2.5
Exhaust PM2.5
Hauling 0.00 0.00 0.00 0.00 0.00 0.00 0.00 0.00 0.00 0.00 0.00 0.00 0.00 0.00 0.00 0.00
Vendor 0.00 0.00 0.00 0.00 0.00 0.00 0.00 0.00 0.00 0.00 0.00 0.00 0.00 0.00 0.00 0.00
Worker 0.01 0.02 0.15 0.00 0.02 0.00 0.02 0.00 0.00 0.00 0.00 18.15 18.15 0.00 0.00 18.18
Total 0.01 0.02 0.15 0.00 0.02 0.00 0.02 0.00 0.00 18.180.00 0.00 0.00 18.15
Exhaust PM10
PM10 Total
18.15 0.00
PM2.5 Total
Bio- CO2
Mitigated Construction On-Site
ROG NOx CO SO2 Fugitive PM10
CO2e
Category tons/yr MT/yr
NBio- CO2 Total CO2 CH4 N2OFugitive PM2.5
Exhaust PM2.5
Off-Road 1.28 10.38 5.97 0.01 0.53 0.53 0.53 0.53 0.00 885.54 885.54 0.10 0.00 887.72
Total 1.28 10.38 5.97 0.01 0.53 0.53 0.00 887.720.53 0.53 0.00 885.54
Exhaust PM10
PM10 Total
885.54 0.10
PM2.5 Total
Bio- CO2
Mitigated Construction Off-Site
ROG NOx CO SO2 Fugitive PM10
CO2e
Category tons/yr MT/yr
NBio- CO2 Total CO2 CH4 N2OFugitive PM2.5
Exhaust PM2.5
Hauling 0.00 0.00 0.00 0.00 0.00 0.00 0.00 0.00 0.00 0.00 0.00 0.00 0.00 0.00 0.00 0.00
Vendor 0.00 0.00 0.00 0.00 0.00 0.00 0.00 0.00 0.00 0.00 0.00 0.00 0.00 0.00 0.00 0.00
7 of 60

Worker 0.01 0.02 0.15 0.00 0.00 0.00 0.00 0.00 0.00 0.00 0.00 18.15 18.15 0.00 0.00 18.18
Total 0.01 0.02 0.15 0.00 0.00 0.00 0.00 0.00 0.00 18.180.00 0.00 0.00 18.15
Exhaust PM10
PM10 Total
18.15 0.00
PM2.5 Total
Bio- CO2
3.2 Demolition - 2012
Unmitigated Construction On-Site
ROG NOx CO SO2 Fugitive PM10
CO2e
Category tons/yr MT/yr
NBio- CO2 Total CO2 CH4 N2OFugitive PM2.5
Exhaust PM2.5
Off-Road 0.19 1.50 0.88 0.00 0.08 0.08 0.08 0.08 0.00 136.24 136.24 0.02 0.00 136.55
Total 0.19 1.50 0.88 0.00 0.08 0.08 0.00 136.550.08 0.08 0.00 136.24
Exhaust PM10
PM10 Total
136.24 0.02
PM2.5 Total
Bio- CO2
Unmitigated Construction Off-Site
ROG NOx CO SO2 Fugitive PM10
CO2e
Category tons/yr MT/yr
NBio- CO2 Total CO2 CH4 N2OFugitive PM2.5
Exhaust PM2.5
Hauling 0.00 0.00 0.00 0.00 0.00 0.00 0.00 0.00 0.00 0.00 0.00 0.00 0.00 0.00 0.00 0.00
Vendor 0.00 0.00 0.00 0.00 0.00 0.00 0.00 0.00 0.00 0.00 0.00 0.00 0.00 0.00 0.00 0.00
Worker 0.00 0.00 0.02 0.00 0.00 0.00 0.00 0.00 0.00 0.00 0.00 2.73 2.73 0.00 0.00 2.74
Total 0.00 0.00 0.02 0.00 0.00 0.00 0.00 0.00 0.00 2.740.00 0.00 0.00 2.73
Exhaust PM10
PM10 Total
2.73 0.00
PM2.5 Total
Bio- CO2
Mitigated Construction On-Site
ROG NOx CO SO2 Fugitive PM10
CO2eNBio- CO2 Total CO2 CH4 N2OFugitive PM2.5
Exhaust PM2.5
8 of 60

Category tons/yr MT/yr
Off-Road 0.19 1.50 0.88 0.00 0.08 0.08 0.08 0.08 0.00 136.24 136.24 0.02 0.00 136.55
Total 0.19 1.50 0.88 0.00 0.08 0.08 0.00 136.550.08 0.08 0.00 136.24
Exhaust PM10
PM10 Total
136.24 0.02
PM2.5 Total
Bio- CO2
Mitigated Construction Off-Site
ROG NOx CO SO2 Fugitive PM10
CO2e
Category tons/yr MT/yr
NBio- CO2 Total CO2 CH4 N2OFugitive PM2.5
Exhaust PM2.5
Hauling 0.00 0.00 0.00 0.00 0.00 0.00 0.00 0.00 0.00 0.00 0.00 0.00 0.00 0.00 0.00 0.00
Vendor 0.00 0.00 0.00 0.00 0.00 0.00 0.00 0.00 0.00 0.00 0.00 0.00 0.00 0.00 0.00 0.00
Worker 0.00 0.00 0.02 0.00 0.00 0.00 0.00 0.00 0.00 0.00 0.00 2.73 2.73 0.00 0.00 2.74
Total 0.00 0.00 0.02 0.00 0.00 0.00 0.00 0.00 0.00 2.740.00 0.00 0.00 2.73
Exhaust PM10
PM10 Total
2.73 0.00
PM2.5 Total
Bio- CO2
3.3 Site Preparation - 2012
Unmitigated Construction On-Site
ROG NOx CO SO2 Fugitive PM10
CO2e
Category tons/yr MT/yr
NBio- CO2 Total CO2 CH4 N2OFugitive PM2.5
Exhaust PM2.5
Fugitive Dust 1.63 0.00 1.63 0.89 0.00 0.89 0.00 0.00 0.00 0.00 0.00 0.00
Off-Road 0.94 7.62 4.30 0.01 0.38 0.38 0.38 0.38 0.00 652.81 652.81 0.08 0.00 654.41
Total 0.94 7.62 4.30 652.81 0.08 0.000.89 0.38 1.27 0.00 652.810.01 1.63 0.38 2.01 654.41
Unmitigated Construction Off-Site
9 of 60

SO2 Fugitive PM10
Exhaust PM10
Fugitive PM2.5
Exhaust PM2.5
PM2.5 Total
ROG NOx CO N2O CO2e
Category tons/yr MT/yr
Bio- CO2 NBio- CO2 Total CO2 CH4PM10 Total
Hauling 0.00 0.00 0.00 0.00 0.00 0.00 0.00 0.00 0.00 0.00 0.00 0.00 0.00 0.00 0.00 0.00
Vendor 0.00 0.00 0.00 0.00 0.00 0.00 0.00 0.00 0.00 0.00 0.00 0.00 0.00 0.00 0.00 0.00
Worker 0.01 0.01 0.12 0.00 0.02 0.00 0.02 0.00 0.00 0.00 0.00 14.76 14.76 0.00 0.00 14.78
Total 0.01 0.01 0.12 0.00 0.02 0.00 0.02 0.00 0.00 14.780.00 0.00 0.00 14.76
Exhaust PM10
PM10 Total
14.76 0.00
PM2.5 Total
Bio- CO2
Mitigated Construction On-Site
ROG NOx CO SO2 Fugitive PM10
CO2e
Category tons/yr MT/yr
NBio- CO2 Total CO2 CH4 N2OFugitive PM2.5
Exhaust PM2.5
Fugitive Dust 1.63 0.00 1.63 0.89 0.00 0.89 0.00 0.00 0.00 0.00 0.00 0.00
Off-Road 0.94 7.62 4.30 0.01 0.38 0.38 0.38 0.38 0.00 652.81 652.81 0.08 0.00 654.41
Total 0.94 7.62 4.30 652.81 0.08 0.000.89 0.38 1.27 0.00
SO2 Fugitive PM10
Exhaust PM10
652.810.01 1.63 0.38 2.01
Fugitive PM2.5
Exhaust PM2.5
PM2.5 Total
654.41
Mitigated Construction Off-Site
ROG NOx CO N2O CO2e
Category tons/yr MT/yr
Bio- CO2 NBio- CO2 Total CO2 CH4PM10 Total
Hauling 0.00 0.00 0.00 0.00 0.00 0.00 0.00 0.00 0.00 0.00 0.00 0.00 0.00 0.00 0.00 0.00
Vendor 0.00 0.00 0.00 0.00 0.00 0.00 0.00 0.00 0.00 0.00 0.00 0.00 0.00 0.00 0.00 0.00
Worker 0.01 0.01 0.12 0.00 0.00 0.00 0.00 0.00 0.00 0.00 0.00 14.76 14.76 0.00 0.00 14.78
Total 0.01 0.01 0.12 0.00 0.00 0.00 0.00 0.00 0.00 14.780.00 0.00 0.00 14.76 14.76 0.00
10 of 60
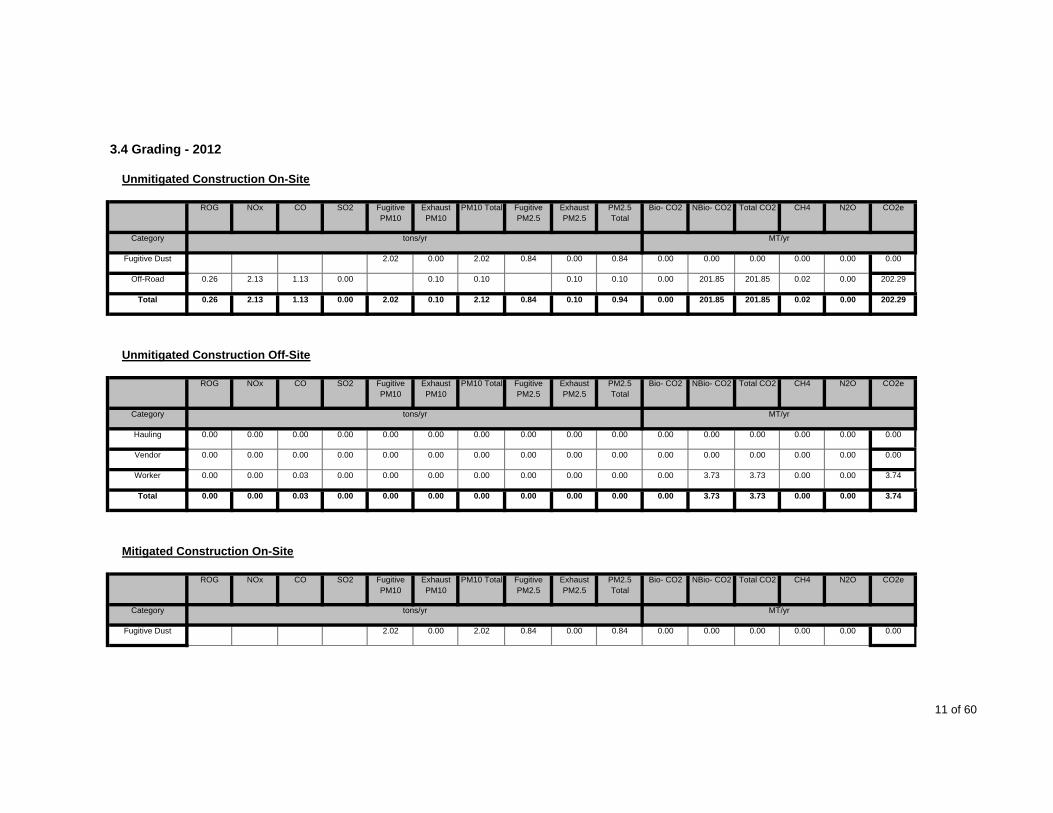
Exhaust PM10
PM10 Total PM2.5 Total
Bio- CO2
3.4 Grading - 2012
Unmitigated Construction On-Site
ROG NOx CO SO2 Fugitive PM10
CO2e
Category tons/yr MT/yr
NBio- CO2 Total CO2 CH4 N2OFugitive PM2.5
Exhaust PM2.5
Fugitive Dust 2.02 0.00 2.02 0.84 0.00 0.84 0.00 0.00 0.00 0.00 0.00 0.00
Off-Road 0.26 2.13 1.13 0.00 0.10 0.10 0.10 0.10 0.00 201.85 201.85 0.02 0.00 202.29
Total 0.26 2.13 1.13 201.85 0.02 0.000.84 0.10 0.94 0.00
SO2 Fugitive PM10
Exhaust PM10
201.850.00 2.02 0.10 2.12
Fugitive PM2.5
Exhaust PM2.5
PM2.5 Total
202.29
Unmitigated Construction Off-Site
ROG NOx CO N2O CO2e
Category tons/yr MT/yr
Bio- CO2 NBio- CO2 Total CO2 CH4PM10 Total
Hauling 0.00 0.00 0.00 0.00 0.00 0.00 0.00 0.00 0.00 0.00 0.00 0.00 0.00 0.00 0.00 0.00
Vendor 0.00 0.00 0.00 0.00 0.00 0.00 0.00 0.00 0.00 0.00 0.00 0.00 0.00 0.00 0.00 0.00
Worker 0.00 0.00 0.03 0.00 0.00 0.00 0.00 0.00 0.00 0.00 0.00 3.73 3.73 0.00 0.00 3.74
Total 0.00 0.00 0.03 0.00 0.00 0.00 0.00 0.00 0.00 3.740.00 0.00 0.00 3.73
Exhaust PM10
PM10 Total
3.73 0.00
PM2.5 Total
Bio- CO2
Mitigated Construction On-Site
ROG NOx CO SO2 Fugitive PM10
CO2e
Category tons/yr MT/yr
NBio- CO2 Total CO2 CH4 N2OFugitive PM2.5
Exhaust PM2.5
Fugitive Dust 2.02 0.00 2.02 0.84 0.00 0.84 0.00 0.00 0.00 0.00 0.00 0.00
11 of 60

Off-Road 0.26 2.13 1.13 0.00 0.10 0.10 0.10 0.10 0.00 201.85 201.85 0.02 0.00 202.29
Total 0.26 2.13 1.13 201.85 0.02 0.000.84 0.10 0.94 0.00
SO2 Fugitive PM10
Exhaust PM10
201.850.00 2.02 0.10 2.12
Fugitive PM2.5
Exhaust PM2.5
PM2.5 Total
202.29
Mitigated Construction Off-Site
ROG NOx CO N2O CO2e
Category tons/yr MT/yr
Bio- CO2 NBio- CO2 Total CO2 CH4PM10 Total
Hauling 0.00 0.00 0.00 0.00 0.00 0.00 0.00 0.00 0.00 0.00 0.00 0.00 0.00 0.00 0.00 0.00
Vendor 0.00 0.00 0.00 0.00 0.00 0.00 0.00 0.00 0.00 0.00 0.00 0.00 0.00 0.00 0.00 0.00
Worker 0.00 0.00 0.03 0.00 0.00 0.00 0.00 0.00 0.00 0.00 0.00 3.73 3.73 0.00 0.00 3.74
Total 0.00 0.00 0.03 0.00 0.00 0.00 0.00 0.00 0.00 3.740.00 0.00 0.00 3.73
Exhaust PM10
PM10 Total
3.73 0.00
PM2.5 Total
Bio- CO2
3.4 Grading - 2013
Unmitigated Construction On-Site
ROG NOx CO SO2 Fugitive PM10
CO2e
Category tons/yr MT/yr
NBio- CO2 Total CO2 CH4 N2OFugitive PM2.5
Exhaust PM2.5
Fugitive Dust 2.02 0.00 2.02 0.84 0.00 0.84 0.00 0.00 0.00 0.00 0.00 0.00
Off-Road 1.55 12.72 6.89 0.01 0.60 0.60 0.60 0.60 0.00 1,284.94 1,284.94 0.13 0.00 1,287.58
Total 1.55 12.72 6.89 1,284.94 0.13 0.000.84 0.60 1.44 0.00
SO2 Fugitive PM10
Exhaust PM10
1,284.940.01 2.02 0.60 2.62
Fugitive PM2.5
Exhaust PM2.5
PM2.5 Total
1,287.58
Unmitigated Construction Off-Site
ROG NOx CO N2O CO2eBio- CO2 NBio- CO2 Total CO2 CH4PM10 Total
12 of 60

Category tons/yr MT/yr
Hauling 0.00 0.00 0.00 0.00 0.00 0.00 0.00 0.00 0.00 0.00 0.00 0.00 0.00 0.00 0.00 0.00
Vendor 0.00 0.00 0.00 0.00 0.00 0.00 0.00 0.00 0.00 0.00 0.00 0.00 0.00 0.00 0.00 0.00
Worker 0.02 0.02 0.17 0.00 0.03 0.00 0.03 0.00 0.00 0.00 0.00 23.27 23.27 0.00 0.00 23.30
Total 0.02 0.02 0.17 0.00 0.03 0.00 0.03 0.00 0.00 23.300.00 0.00 0.00 23.27
Exhaust PM10
PM10 Total
23.27 0.00
PM2.5 Total
Bio- CO2
Mitigated Construction On-Site
ROG NOx CO SO2 Fugitive PM10
CO2e
Category tons/yr MT/yr
NBio- CO2 Total CO2 CH4 N2OFugitive PM2.5
Exhaust PM2.5
Fugitive Dust 2.02 0.00 2.02 0.84 0.00 0.84 0.00 0.00 0.00 0.00 0.00 0.00
Off-Road 1.55 12.72 6.89 0.01 0.60 0.60 0.60 0.60 0.00 1,284.94 1,284.94 0.13 0.00 1,287.58
Total 1.55 12.72 6.89 1,284.94 0.13 0.000.84 0.60 1.44 0.00
SO2 Fugitive PM10
Exhaust PM10
1,284.940.01 2.02 0.60 2.62
Fugitive PM2.5
Exhaust PM2.5
PM2.5 Total
1,287.58
Mitigated Construction Off-Site
ROG NOx CO N2O CO2e
Category tons/yr MT/yr
Bio- CO2 NBio- CO2 Total CO2 CH4PM10 Total
Hauling 0.00 0.00 0.00 0.00 0.00 0.00 0.00 0.00 0.00 0.00 0.00 0.00 0.00 0.00 0.00 0.00
Vendor 0.00 0.00 0.00 0.00 0.00 0.00 0.00 0.00 0.00 0.00 0.00 0.00 0.00 0.00 0.00 0.00
Worker 0.02 0.02 0.17 0.00 0.00 0.00 0.00 0.00 0.00 0.00 0.00 23.27 23.27 0.00 0.00 23.30
Total 0.02 0.02 0.17 0.00 0.00 0.00 0.00 0.00 0.00 23.300.00 0.00 0.00 23.27 23.27 0.00
3.4 Grading - 2014
13 of 60

Exhaust PM10
PM10 Total PM2.5 Total
Bio- CO2
Unmitigated Construction On-Site
ROG NOx CO SO2 Fugitive PM10
CO2e
Category tons/yr MT/yr
NBio- CO2 Total CO2 CH4 N2OFugitive PM2.5
Exhaust PM2.5
Fugitive Dust 2.02 0.00 2.02 0.84 0.00 0.84 0.00 0.00 0.00 0.00 0.00 0.00
Off-Road 0.91 7.39 4.14 0.01 0.34 0.34 0.34 0.34 0.00 802.47 802.47 0.07 0.00 804.03
Total 0.91 7.39 4.14 802.47 0.07 0.000.84 0.34 1.18 0.00
SO2 Fugitive PM10
Exhaust PM10
802.470.01 2.02 0.34 2.36
Fugitive PM2.5
Exhaust PM2.5
PM2.5 Total
804.03
Unmitigated Construction Off-Site
ROG NOx CO N2O CO2e
Category tons/yr MT/yr
Bio- CO2 NBio- CO2 Total CO2 CH4PM10 Total
Hauling 0.00 0.00 0.00 0.00 0.00 0.00 0.00 0.00 0.00 0.00 0.00 0.00 0.00 0.00 0.00 0.00
Vendor 0.00 0.00 0.00 0.00 0.00 0.00 0.00 0.00 0.00 0.00 0.00 0.00 0.00 0.00 0.00 0.00
Worker 0.01 0.01 0.10 0.00 0.02 0.00 0.02 0.00 0.00 0.00 0.00 14.23 14.23 0.00 0.00 14.25
Total 0.01 0.01 0.10 0.00 0.02 0.00 0.02 0.00 0.00 14.250.00 0.00 0.00 14.23
Exhaust PM10
PM10 Total
14.23 0.00
PM2.5 Total
Bio- CO2
Mitigated Construction On-Site
ROG NOx CO SO2 Fugitive PM10
CO2e
Category tons/yr MT/yr
NBio- CO2 Total CO2 CH4 N2OFugitive PM2.5
Exhaust PM2.5
Fugitive Dust 2.02 0.00 2.02 0.84 0.00 0.84 0.00 0.00 0.00 0.00 0.00 0.00
Off-Road 0.91 7.39 4.14 0.01 0.34 0.34 0.34 0.34 0.00 802.47 802.47 0.07 0.00 804.03
14 of 60

Total 0.91 7.39 4.14 802.47 0.07 0.000.84 0.34 1.18 0.00
SO2 Fugitive PM10
Exhaust PM10
802.470.01 2.02 0.34 2.36
Fugitive PM2.5
Exhaust PM2.5
PM2.5 Total
804.03
Mitigated Construction Off-Site
ROG NOx CO N2O CO2e
Category tons/yr MT/yr
Bio- CO2 NBio- CO2 Total CO2 CH4PM10 Total
Hauling 0.00 0.00 0.00 0.00 0.00 0.00 0.00 0.00 0.00 0.00 0.00 0.00 0.00 0.00 0.00 0.00
Vendor 0.00 0.00 0.00 0.00 0.00 0.00 0.00 0.00 0.00 0.00 0.00 0.00 0.00 0.00 0.00 0.00
Worker 0.01 0.01 0.10 0.00 0.00 0.00 0.00 0.00 0.00 0.00 0.00 14.23 14.23 0.00 0.00 14.25
Total 0.01 0.01 0.10 0.00 0.00 0.00 0.00 0.00 0.00 14.250.00 0.00 0.00 14.23
Exhaust PM10
PM10 Total
14.23 0.00
PM2.5 Total
Bio- CO2
3.5 Building Construction - 2014
Unmitigated Construction On-Site
ROG NOx CO SO2 Fugitive PM10
CO2e
Category tons/yr MT/yr
NBio- CO2 Total CO2 CH4 N2OFugitive PM2.5
Exhaust PM2.5
Off-Road 0.23 1.57 1.14 0.00 0.10 0.10 0.10 0.10 0.00 179.56 179.56 0.02 0.00 179.96
Total 0.23 1.57 1.14 0.00 0.10 0.10 0.00 179.960.10 0.10 0.00 179.56
Exhaust PM10
PM10 Total
179.56 0.02
PM2.5 Total
Bio- CO2
Unmitigated Construction Off-Site
ROG NOx CO SO2 Fugitive PM10
CO2e
Category tons/yr MT/yr
NBio- CO2 Total CO2 CH4 N2OFugitive PM2.5
Exhaust PM2.5
15 of 60

Hauling 0.00 0.00 0.00 0.00 0.00 0.00 0.00 0.00 0.00 0.00 0.00 0.00 0.00 0.00 0.00 0.00
Vendor 0.88 9.74 6.26 0.02 0.51 0.33 0.85 0.01 0.31 0.32 0.00 1,570.14 1,570.14 0.04 0.00 1,570.97
Worker 1.19 1.34 13.13 0.02 2.49 0.10 2.59 0.04 0.09 0.13 0.00 1,908.30 1,908.30 0.12 0.00 1,910.79
Total 2.07 11.08 19.39 0.04 3.00 0.43 3.44 0.05 0.00 3,481.760.40 0.45 0.00 3,478.44
Exhaust PM10
PM10 Total
3,478.44 0.16
PM2.5 Total
Bio- CO2
Mitigated Construction On-Site
ROG NOx CO SO2 Fugitive PM10
CO2e
Category tons/yr MT/yr
NBio- CO2 Total CO2 CH4 N2OFugitive PM2.5
Exhaust PM2.5
Off-Road 0.23 1.57 1.14 0.00 0.10 0.10 0.10 0.10 0.00 179.56 179.56 0.02 0.00 179.96
Total 0.23 1.57 1.14 0.00 0.10 0.10 0.00 179.960.10 0.10 0.00 179.56
Exhaust PM10
PM10 Total
179.56 0.02
PM2.5 Total
Bio- CO2
Mitigated Construction Off-Site
ROG NOx CO SO2 Fugitive PM10
CO2e
Category tons/yr MT/yr
NBio- CO2 Total CO2 CH4 N2OFugitive PM2.5
Exhaust PM2.5
Hauling 0.00 0.00 0.00 0.00 0.00 0.00 0.00 0.00 0.00 0.00 0.00 0.00 0.00 0.00 0.00 0.00
Vendor 0.88 9.74 6.26 0.02 0.04 0.33 0.38 0.01 0.31 0.32 0.00 1,570.14 1,570.14 0.04 0.00 1,570.97
Worker 1.19 1.34 13.13 0.02 0.11 0.10 0.21 0.04 0.09 0.13 0.00 1,908.30 1,908.30 0.12 0.00 1,910.79
Total 2.07 11.08 19.39 0.04 0.15 0.43 0.59 0.05 0.00 3,481.760.40 0.45 0.00 3,478.44 3,478.44 0.16
3.5 Building Construction - 2015
Unmitigated Construction On-Site
16 of 60

Exhaust PM10
PM10 Total PM2.5 Total
Bio- CO2ROG NOx CO SO2 Fugitive PM10
CO2e
Category tons/yr MT/yr
NBio- CO2 Total CO2 CH4 N2OFugitive PM2.5
Exhaust PM2.5
Off-Road 0.57 3.80 3.00 0.01 0.23 0.23 0.23 0.23 0.00 478.23 478.23 0.05 0.00 479.20
Total 0.57 3.80 3.00 0.01 0.23 0.23 0.00 479.200.23 0.23 0.00 478.23
Exhaust PM10
PM10 Total
478.23 0.05
PM2.5 Total
Bio- CO2
Unmitigated Construction Off-Site
ROG NOx CO SO2 Fugitive PM10
CO2e
Category tons/yr MT/yr
NBio- CO2 Total CO2 CH4 N2OFugitive PM2.5
Exhaust PM2.5
Hauling 0.00 0.00 0.00 0.00 0.00 0.00 0.00 0.00 0.00 0.00 0.00 0.00 0.00 0.00 0.00 0.00
Vendor 2.18 24.10 15.44 0.04 1.37 0.82 2.19 0.04 0.76 0.80 0.00 4,187.48 4,187.48 0.10 0.00 4,189.53
Worker 2.97 3.27 32.18 0.06 6.64 0.27 6.90 0.10 0.24 0.35 0.00 4,966.44 4,966.44 0.29 0.00 4,972.57
Total 5.15 27.37 47.62 0.10 8.01 1.09 9.09 0.14 0.00 9,162.101.00 1.15 0.00 9,153.92
Exhaust PM10
PM10 Total
9,153.92 0.39
PM2.5 Total
Bio- CO2
Mitigated Construction On-Site
ROG NOx CO SO2 Fugitive PM10
CO2e
Category tons/yr MT/yr
NBio- CO2 Total CO2 CH4 N2OFugitive PM2.5
Exhaust PM2.5
Off-Road 0.57 3.80 3.00 0.01 0.23 0.23 0.23 0.23 0.00 478.23 478.23 0.05 0.00 479.20
Total 0.57 3.80 3.00 0.01 0.23 0.23 0.00 479.200.23 0.23 0.00 478.23 478.23 0.05
17 of 60

Exhaust PM10
PM10 Total PM2.5 Total
Bio- CO2
Mitigated Construction Off-Site
ROG NOx CO SO2 Fugitive PM10
CO2e
Category tons/yr MT/yr
NBio- CO2 Total CO2 CH4 N2OFugitive PM2.5
Exhaust PM2.5
Hauling 0.00 0.00 0.00 0.00 0.00 0.00 0.00 0.00 0.00 0.00 0.00 0.00 0.00 0.00 0.00 0.00
Vendor 2.18 24.10 15.44 0.04 0.12 0.82 0.94 0.04 0.76 0.80 0.00 4,187.48 4,187.48 0.10 0.00 4,189.53
Worker 2.97 3.27 32.18 0.06 0.28 0.27 0.55 0.10 0.24 0.35 0.00 4,966.44 4,966.44 0.29 0.00 4,972.57
Total 5.15 27.37 47.62 0.10 0.40 1.09 1.49 0.14 0.00 9,162.101.00 1.15 0.00 9,153.92
Exhaust PM10
PM10 Total
9,153.92 0.39
PM2.5 Total
Bio- CO2
3.5 Building Construction - 2016
Unmitigated Construction On-Site
ROG NOx CO SO2 Fugitive PM10
CO2e
Category tons/yr MT/yr
NBio- CO2 Total CO2 CH4 N2OFugitive PM2.5
Exhaust PM2.5
Off-Road 0.52 3.46 2.97 0.01 0.21 0.21 0.21 0.21 0.00 478.23 478.23 0.04 0.00 479.11
Total 0.52 3.46 2.97 0.01 0.21 0.21 0.00 479.110.21 0.21 0.00 478.23
Exhaust PM10
PM10 Total
478.23 0.04
PM2.5 Total
Bio- CO2
Unmitigated Construction Off-Site
ROG NOx CO SO2 Fugitive PM10
CO2e
Category tons/yr MT/yr
NBio- CO2 Total CO2 CH4 N2OFugitive PM2.5
Exhaust PM2.5
Hauling 0.00 0.00 0.00 0.00 0.00 0.00 0.00 0.00 0.00 0.00 0.00 0.00 0.00 0.00 0.00 0.00
Vendor 2.03 22.52 14.41 0.04 1.37 0.77 2.13 0.04 0.70 0.74 0.00 4,193.00 4,193.00 0.09 0.00 4,194.90
Worker 2.79 3.01 29.70 0.06 6.64 0.27 6.90 0.10 0.25 0.35 0.00 4,846.64 4,846.64 0.27 0.00 4,852.36
18 of 60

Total 4.82 25.53 44.11 0.10 8.01 1.04 9.03 0.14 0.00 9,047.260.95 1.09 0.00 9,039.64
Exhaust PM10
PM10 Total
9,039.64 0.36
PM2.5 Total
Bio- CO2
Mitigated Construction On-Site
ROG NOx CO SO2 Fugitive PM10
CO2e
Category tons/yr MT/yr
NBio- CO2 Total CO2 CH4 N2OFugitive PM2.5
Exhaust PM2.5
Off-Road 0.52 3.46 2.97 0.01 0.21 0.21 0.21 0.21 0.00 478.23 478.23 0.04 0.00 479.11
Total 0.52 3.46 2.97 0.01 0.21 0.21 0.00 479.110.21 0.21 0.00 478.23
Exhaust PM10
PM10 Total
478.23 0.04
PM2.5 Total
Bio- CO2
Mitigated Construction Off-Site
ROG NOx CO SO2 Fugitive PM10
CO2e
Category tons/yr MT/yr
NBio- CO2 Total CO2 CH4 N2OFugitive PM2.5
Exhaust PM2.5
Hauling 0.00 0.00 0.00 0.00 0.00 0.00 0.00 0.00 0.00 0.00 0.00 0.00 0.00 0.00 0.00 0.00
Vendor 2.03 22.52 14.41 0.04 0.12 0.77 0.89 0.04 0.70 0.74 0.00 4,193.00 4,193.00 0.09 0.00 4,194.90
Worker 2.79 3.01 29.70 0.06 0.28 0.27 0.55 0.10 0.25 0.35 0.00 4,846.64 4,846.64 0.27 0.00 4,852.36
Total 4.82 25.53 44.11 0.10 0.40 1.04 1.44 0.14 0.00 9,047.260.95 1.09 0.00 9,039.64
Exhaust PM10
PM10 Total
9,039.64 0.36
PM2.5 Total
Bio- CO2
3.5 Building Construction - 2017
Unmitigated Construction On-Site
ROG NOx CO SO2 Fugitive PM10
CO2e
Category tons/yr MT/yr
NBio- CO2 Total CO2 CH4 N2OFugitive PM2.5
Exhaust PM2.5
19 of 60

Off-Road 0.48 3.13 2.94 0.01 0.18 0.18 0.18 0.18 0.00 476.40 476.40 0.04 0.00 477.20
Total 0.48 3.13 2.94 0.01 0.18 0.18 0.00 477.200.18 0.18 0.00 476.40
Exhaust PM10
PM10 Total
476.40 0.04
PM2.5 Total
Bio- CO2
Unmitigated Construction Off-Site
ROG NOx CO SO2 Fugitive PM10
CO2e
Category tons/yr MT/yr
NBio- CO2 Total CO2 CH4 N2OFugitive PM2.5
Exhaust PM2.5
Hauling 0.00 0.00 0.00 0.00 0.00 0.00 0.00 0.00 0.00 0.00 0.00 0.00 0.00 0.00 0.00 0.00
Vendor 1.89 21.07 13.49 0.04 1.36 0.72 2.08 0.04 0.66 0.70 0.00 4,181.79 4,181.79 0.08 0.00 4,183.56
Worker 2.61 2.76 27.26 0.06 6.61 0.26 6.88 0.10 0.25 0.35 0.00 4,717.88 4,717.88 0.25 0.00 4,723.17
Total 4.50 23.83 40.75 0.10 7.97 0.98 8.96 0.14 0.00 8,906.730.91 1.05 0.00 8,899.67
Exhaust PM10
PM10 Total
8,899.67 0.33
PM2.5 Total
Bio- CO2
Mitigated Construction On-Site
ROG NOx CO SO2 Fugitive PM10
CO2e
Category tons/yr MT/yr
NBio- CO2 Total CO2 CH4 N2OFugitive PM2.5
Exhaust PM2.5
Off-Road 0.48 3.13 2.94 0.01 0.18 0.18 0.18 0.18 0.00 476.40 476.40 0.04 0.00 477.20
Total 0.48 3.13 2.94 0.01 0.18 0.18 0.00 477.200.18 0.18 0.00 476.40
Exhaust PM10
PM10 Total
476.40 0.04
PM2.5 Total
Bio- CO2
Mitigated Construction Off-Site
ROG NOx CO SO2 Fugitive PM10
CO2eNBio- CO2 Total CO2 CH4 N2OFugitive PM2.5
Exhaust PM2.5
20 of 60

Category tons/yr MT/yr
Hauling 0.00 0.00 0.00 0.00 0.00 0.00 0.00 0.00 0.00 0.00 0.00 0.00 0.00 0.00 0.00 0.00
Vendor 1.89 21.07 13.49 0.04 0.12 0.72 0.83 0.04 0.66 0.70 0.00 4,181.79 4,181.79 0.08 0.00 4,183.56
Worker 2.61 2.76 27.26 0.06 0.28 0.26 0.55 0.10 0.25 0.35 0.00 4,717.88 4,717.88 0.25 0.00 4,723.17
Total 4.50 23.83 40.75 0.10 0.40 0.98 1.38 0.14 0.00 8,906.730.91 1.05 0.00 8,899.67
Exhaust PM10
PM10 Total
8,899.67 0.33
PM2.5 Total
Bio- CO2
3.5 Building Construction - 2018
Unmitigated Construction On-Site
ROG NOx CO SO2 Fugitive PM10
CO2e
Category tons/yr MT/yr
NBio- CO2 Total CO2 CH4 N2OFugitive PM2.5
Exhaust PM2.5
Off-Road 0.44 2.84 2.93 0.01 0.16 0.16 0.16 0.16 0.00 478.23 478.23 0.04 0.00 478.97
Total 0.44 2.84 2.93 0.01 0.16 0.16 0.00 478.970.16 0.16 0.00 478.23
Exhaust PM10
PM10 Total
478.23 0.04
PM2.5 Total
Bio- CO2
Unmitigated Construction Off-Site
ROG NOx CO SO2 Fugitive PM10
CO2e
Category tons/yr MT/yr
NBio- CO2 Total CO2 CH4 N2OFugitive PM2.5
Exhaust PM2.5
Hauling 0.00 0.00 0.00 0.00 0.00 0.00 0.00 0.00 0.00 0.00 0.00 0.00 0.00 0.00 0.00 0.00
Vendor 1.79 19.95 12.78 0.04 1.37 0.68 2.05 0.04 0.62 0.66 0.00 4,202.25 4,202.25 0.08 0.00 4,203.91
Worker 2.46 2.56 25.28 0.06 6.64 0.26 6.90 0.10 0.25 0.35 0.00 4,632.86 4,632.86 0.24 0.00 4,637.83
Total 4.25 22.51 38.06 0.10 8.01 0.94 8.95 0.14 0.00 8,841.740.87 1.01 0.00 8,835.11 8,835.11 0.32
21 of 60

Exhaust PM10
PM10 Total PM2.5 Total
Bio- CO2
Mitigated Construction On-Site
ROG NOx CO SO2 Fugitive PM10
CO2e
Category tons/yr MT/yr
NBio- CO2 Total CO2 CH4 N2OFugitive PM2.5
Exhaust PM2.5
Off-Road 0.44 2.84 2.93 0.01 0.16 0.16 0.16 0.16 0.00 478.23 478.23 0.04 0.00 478.97
Total 0.44 2.84 2.93 0.01 0.16 0.16 0.00 478.970.16 0.16 0.00 478.23
Exhaust PM10
PM10 Total
478.23 0.04
PM2.5 Total
Bio- CO2
Mitigated Construction Off-Site
ROG NOx CO SO2 Fugitive PM10
CO2e
Category tons/yr MT/yr
NBio- CO2 Total CO2 CH4 N2OFugitive PM2.5
Exhaust PM2.5
Hauling 0.00 0.00 0.00 0.00 0.00 0.00 0.00 0.00 0.00 0.00 0.00 0.00 0.00 0.00 0.00 0.00
Vendor 1.79 19.95 12.78 0.04 0.12 0.68 0.80 0.04 0.62 0.66 0.00 4,202.25 4,202.25 0.08 0.00 4,203.91
Worker 2.46 2.56 25.28 0.06 0.28 0.26 0.55 0.10 0.25 0.35 0.00 4,632.86 4,632.86 0.24 0.00 4,637.83
Total 4.25 22.51 38.06 0.10 0.40 0.94 1.35 0.14 0.00 8,841.740.87 1.01 0.00 8,835.11
Exhaust PM10
PM10 Total
8,835.11 0.32
PM2.5 Total
Bio- CO2
3.5 Building Construction - 2019
Unmitigated Construction On-Site
ROG NOx CO SO2 Fugitive PM10
CO2e
Category tons/yr MT/yr
NBio- CO2 Total CO2 CH4 N2OFugitive PM2.5
Exhaust PM2.5
Off-Road 0.40 2.57 2.92 0.01 0.13 0.13 0.13 0.13 0.00 478.23 478.23 0.03 0.00 478.91
Total 0.40 2.57 2.92 0.01 0.13 0.13 0.00 478.910.13 0.13 0.00 478.23 478.23 0.03
22 of 60

Exhaust PM10
PM10 Total PM2.5 Total
Bio- CO2
Unmitigated Construction Off-Site
ROG NOx CO SO2 Fugitive PM10
CO2e
Category tons/yr MT/yr
NBio- CO2 Total CO2 CH4 N2OFugitive PM2.5
Exhaust PM2.5
Hauling 0.00 0.00 0.00 0.00 0.00 0.00 0.00 0.00 0.00 0.00 0.00 0.00 0.00 0.00 0.00 0.00
Vendor 1.69 18.92 12.05 0.04 1.37 0.64 2.01 0.04 0.59 0.63 0.00 4,206.97 4,206.97 0.07 0.00 4,208.54
Worker 2.34 2.38 23.60 0.06 6.64 0.26 6.90 0.10 0.25 0.35 0.00 4,538.66 4,538.66 0.22 0.00 4,543.33
Total 4.03 21.30 35.65 0.10 8.01 0.90 8.91 0.14 0.00 8,751.870.84 0.98 0.00 8,745.63
Exhaust PM10
PM10 Total
8,745.63 0.29
PM2.5 Total
Bio- CO2
Mitigated Construction On-Site
ROG NOx CO SO2 Fugitive PM10
CO2e
Category tons/yr MT/yr
NBio- CO2 Total CO2 CH4 N2OFugitive PM2.5
Exhaust PM2.5
Off-Road 0.40 2.57 2.92 0.01 0.13 0.13 0.13 0.13 0.00 478.23 478.23 0.03 0.00 478.91
Total 0.40 2.57 2.92 0.01 0.13 0.13 0.00 478.910.13 0.13 0.00 478.23
Exhaust PM10
PM10 Total
478.23 0.03
PM2.5 Total
Bio- CO2
Mitigated Construction Off-Site
ROG NOx CO SO2 Fugitive PM10
CO2e
Category tons/yr MT/yr
NBio- CO2 Total CO2 CH4 N2OFugitive PM2.5
Exhaust PM2.5
Hauling 0.00 0.00 0.00 0.00 0.00 0.00 0.00 0.00 0.00 0.00 0.00 0.00 0.00 0.00 0.00 0.00
23 of 60

Vendor 1.69 18.92 12.05 0.04 0.12 0.64 0.76 0.04 0.59 0.63 0.00 4,206.97 4,206.97 0.07 0.00 4,208.54
Worker 2.34 2.38 23.60 0.06 0.28 0.26 0.55 0.10 0.25 0.35 0.00 4,538.66 4,538.66 0.22 0.00 4,543.33
Total 4.03 21.30 35.65 0.10 0.40 0.90 1.31 0.14 0.00 8,751.870.84 0.98 0.00 8,745.63
Exhaust PM10
PM10 Total
8,745.63 0.29
PM2.5 Total
Bio- CO2
3.5 Building Construction - 2020
Unmitigated Construction On-Site
ROG NOx CO SO2 Fugitive PM10
CO2e
Category tons/yr MT/yr
NBio- CO2 Total CO2 CH4 N2OFugitive PM2.5
Exhaust PM2.5
Off-Road 0.37 2.34 2.91 0.01 0.11 0.11 0.11 0.11 0.00 480.06 480.06 0.03 0.00 480.68
Total 0.37 2.34 2.91 0.01 0.11 0.11 0.00 480.680.11 0.11 0.00 480.06
Exhaust PM10
PM10 Total
480.06 0.03
PM2.5 Total
Bio- CO2
Unmitigated Construction Off-Site
ROG NOx CO SO2 Fugitive PM10
CO2e
Category tons/yr MT/yr
NBio- CO2 Total CO2 CH4 N2OFugitive PM2.5
Exhaust PM2.5
Hauling 0.00 0.00 0.00 0.00 0.00 0.00 0.00 0.00 0.00 0.00 0.00 0.00 0.00 0.00 0.00 0.00
Vendor 1.61 18.12 11.53 0.04 1.37 0.62 1.99 0.04 0.57 0.61 0.00 4,227.07 4,227.07 0.07 0.00 4,228.56
Worker 2.26 2.23 22.25 0.06 6.66 0.27 6.93 0.10 0.25 0.35 0.00 4,469.44 4,469.44 0.21 0.00 4,473.87
Total 3.87 20.35 33.78 0.10 8.03 0.89 8.92 0.14 0.00 8,702.430.82 0.96 0.00 8,696.51 8,696.51 0.28
Mitigated Construction On-Site
24 of 60

Exhaust PM10
PM10 Total PM2.5 Total
Bio- CO2ROG NOx CO SO2 Fugitive PM10
CO2e
Category tons/yr MT/yr
NBio- CO2 Total CO2 CH4 N2OFugitive PM2.5
Exhaust PM2.5
Off-Road 0.37 2.34 2.91 0.01 0.11 0.11 0.11 0.11 0.00 480.06 480.06 0.03 0.00 480.68
Total 0.37 2.34 2.91 0.01 0.11 0.11 0.00 480.680.11 0.11 0.00 480.06
Exhaust PM10
PM10 Total
480.06 0.03
PM2.5 Total
Bio- CO2
Mitigated Construction Off-Site
ROG NOx CO SO2 Fugitive PM10
CO2e
Category tons/yr MT/yr
NBio- CO2 Total CO2 CH4 N2OFugitive PM2.5
Exhaust PM2.5
Hauling 0.00 0.00 0.00 0.00 0.00 0.00 0.00 0.00 0.00 0.00 0.00 0.00 0.00 0.00 0.00 0.00
Vendor 1.61 18.12 11.53 0.04 0.12 0.62 0.74 0.04 0.57 0.61 0.00 4,227.07 4,227.07 0.07 0.00 4,228.56
Worker 2.26 2.23 22.25 0.06 0.29 0.27 0.55 0.10 0.25 0.35 0.00 4,469.44 4,469.44 0.21 0.00 4,473.87
Total 3.87 20.35 33.78 0.10 0.41 0.89 1.29 0.14 0.00 8,702.430.82 0.96 0.00 8,696.51
Exhaust PM10
PM10 Total
8,696.51 0.28
PM2.5 Total
Bio- CO2
3.5 Building Construction - 2021
Unmitigated Construction On-Site
ROG NOx CO SO2 Fugitive PM10
CO2e
Category tons/yr MT/yr
NBio- CO2 Total CO2 CH4 N2OFugitive PM2.5
Exhaust PM2.5
Off-Road 0.33 2.10 2.88 0.01 0.10 0.10 0.10 0.10 0.00 478.23 478.23 0.03 0.00 478.79
Total 0.33 2.10 2.88 0.01 0.10 0.10 0.00 478.790.10 0.10 0.00 478.23 478.23 0.03
25 of 60

Exhaust PM10
PM10 Total PM2.5 Total
Bio- CO2
Unmitigated Construction Off-Site
ROG NOx CO SO2 Fugitive PM10
CO2e
Category tons/yr MT/yr
NBio- CO2 Total CO2 CH4 N2OFugitive PM2.5
Exhaust PM2.5
Hauling 0.00 0.00 0.00 0.00 0.00 0.00 0.00 0.00 0.00 0.00 0.00 0.00 0.00 0.00 0.00 0.00
Vendor 1.53 17.35 10.93 0.04 1.37 0.59 1.96 0.04 0.54 0.58 0.00 4,214.69 4,214.69 0.07 0.00 4,216.10
Worker 2.18 2.08 21.21 0.06 6.64 0.27 6.91 0.10 0.25 0.35 0.00 4,415.14 4,415.14 0.20 0.00 4,419.40
Total 3.71 19.43 32.14 0.10 8.01 0.86 8.87 0.14 0.00 8,635.500.79 0.93 0.00 8,629.83
Exhaust PM10
PM10 Total
8,629.83 0.27
PM2.5 Total
Bio- CO2
Mitigated Construction On-Site
ROG NOx CO SO2 Fugitive PM10
CO2e
Category tons/yr MT/yr
NBio- CO2 Total CO2 CH4 N2OFugitive PM2.5
Exhaust PM2.5
Off-Road 0.33 2.10 2.88 0.01 0.10 0.10 0.10 0.10 0.00 478.23 478.23 0.03 0.00 478.79
Total 0.33 2.10 2.88 0.01 0.10 0.10 0.00 478.790.10 0.10 0.00 478.23
Exhaust PM10
PM10 Total
478.23 0.03
PM2.5 Total
Bio- CO2
Mitigated Construction Off-Site
ROG NOx CO SO2 Fugitive PM10
CO2e
Category tons/yr MT/yr
NBio- CO2 Total CO2 CH4 N2OFugitive PM2.5
Exhaust PM2.5
Hauling 0.00 0.00 0.00 0.00 0.00 0.00 0.00 0.00 0.00 0.00 0.00 0.00 0.00 0.00 0.00 0.00
Vendor 1.53 17.35 10.93 0.04 0.12 0.59 0.71 0.04 0.54 0.58 0.00 4,214.69 4,214.69 0.07 0.00 4,216.10
Worker 2.18 2.08 21.21 0.06 0.28 0.27 0.56 0.10 0.25 0.35 0.00 4,415.14 4,415.14 0.20 0.00 4,419.40
26 of 60

Total 3.71 19.43 32.14 0.10 0.40 0.86 1.27 0.14 0.00 8,635.500.79 0.93 0.00 8,629.83
Exhaust PM10
PM10 Total
8,629.83 0.27
PM2.5 Total
Bio- CO2
3.5 Building Construction - 2022
Unmitigated Construction On-Site
ROG NOx CO SO2 Fugitive PM10
CO2e
Category tons/yr MT/yr
NBio- CO2 Total CO2 CH4 N2OFugitive PM2.5
Exhaust PM2.5
Off-Road 0.31 1.89 2.86 0.01 0.08 0.08 0.08 0.08 0.00 476.40 476.40 0.02 0.00 476.92
Total 0.31 1.89 2.86 0.01 0.08 0.08 0.00 476.920.08 0.08 0.00 476.40
Exhaust PM10
PM10 Total
476.40 0.02
PM2.5 Total
Bio- CO2
Unmitigated Construction Off-Site
ROG NOx CO SO2 Fugitive PM10
CO2e
Category tons/yr MT/yr
NBio- CO2 Total CO2 CH4 N2OFugitive PM2.5
Exhaust PM2.5
Hauling 0.00 0.00 0.00 0.00 0.00 0.00 0.00 0.00 0.00 0.00 0.00 0.00 0.00 0.00 0.00 0.00
Vendor 1.46 16.70 10.42 0.04 1.36 0.57 1.93 0.04 0.52 0.56 0.00 4,201.90 4,201.90 0.06 0.00 4,203.24
Worker 2.09 1.96 19.99 0.06 6.61 0.27 6.88 0.10 0.25 0.35 0.00 4,325.98 4,325.98 0.19 0.00 4,330.02
Total 3.55 18.66 30.41 0.10 7.97 0.84 8.81 0.14 0.00 8,533.260.77 0.91 0.00 8,527.88
Exhaust PM10
PM10 Total
8,527.88 0.25
PM2.5 Total
Bio- CO2
Mitigated Construction On-Site
ROG NOx CO SO2 Fugitive PM10
CO2e
Category tons/yr MT/yr
NBio- CO2 Total CO2 CH4 N2OFugitive PM2.5
Exhaust PM2.5
27 of 60

Off-Road 0.31 1.89 2.86 0.01 0.08 0.08 0.08 0.08 0.00 476.40 476.40 0.02 0.00 476.92
Total 0.31 1.89 2.86 0.01 0.08 0.08 0.00 476.920.08 0.08 0.00 476.40
Exhaust PM10
PM10 Total
476.40 0.02
PM2.5 Total
Bio- CO2
Mitigated Construction Off-Site
ROG NOx CO SO2 Fugitive PM10
CO2e
Category tons/yr MT/yr
NBio- CO2 Total CO2 CH4 N2OFugitive PM2.5
Exhaust PM2.5
Hauling 0.00 0.00 0.00 0.00 0.00 0.00 0.00 0.00 0.00 0.00 0.00 0.00 0.00 0.00 0.00 0.00
Vendor 1.46 16.70 10.42 0.04 0.12 0.57 0.69 0.04 0.52 0.56 0.00 4,201.90 4,201.90 0.06 0.00 4,203.24
Worker 2.09 1.96 19.99 0.06 0.28 0.27 0.55 0.10 0.25 0.35 0.00 4,325.98 4,325.98 0.19 0.00 4,330.02
Total 3.55 18.66 30.41 0.10 0.40 0.84 1.24 0.14 0.00 8,533.260.77 0.91 0.00 8,527.88
Exhaust PM10
PM10 Total
8,527.88 0.25
PM2.5 Total
Bio- CO2
3.5 Building Construction - 2023
Unmitigated Construction On-Site
ROG NOx CO SO2 Fugitive PM10
CO2e
Category tons/yr MT/yr
NBio- CO2 Total CO2 CH4 N2OFugitive PM2.5
Exhaust PM2.5
Off-Road 0.29 1.72 2.86 0.01 0.07 0.07 0.07 0.07 0.00 476.40 476.40 0.02 0.00 476.89
Total 0.29 1.72 2.86 0.01 0.07 0.07 0.00 476.890.07 0.07 0.00 476.40
Exhaust PM10
PM10 Total
476.40 0.02
PM2.5 Total
Bio- CO2
Unmitigated Construction Off-Site
ROG NOx CO SO2 Fugitive PM10
CO2eNBio- CO2 Total CO2 CH4 N2OFugitive PM2.5
Exhaust PM2.5
28 of 60

Category tons/yr MT/yr
Hauling 0.00 0.00 0.00 0.00 0.00 0.00 0.00 0.00 0.00 0.00 0.00 0.00 0.00 0.00 0.00 0.00
Vendor 1.41 16.21 10.04 0.04 1.36 0.56 1.92 0.04 0.51 0.55 0.00 4,204.95 4,204.95 0.06 0.00 4,206.25
Worker 2.01 1.83 18.90 0.06 6.61 0.27 6.88 0.10 0.25 0.35 0.00 4,259.82 4,259.82 0.18 0.00 4,263.69
Total 3.42 18.04 28.94 0.10 7.97 0.83 8.80 0.14 0.00 8,469.940.76 0.90 0.00 8,464.77
Exhaust PM10
PM10 Total
8,464.77 0.24
PM2.5 Total
Bio- CO2
Mitigated Construction On-Site
ROG NOx CO SO2 Fugitive PM10
CO2e
Category tons/yr MT/yr
NBio- CO2 Total CO2 CH4 N2OFugitive PM2.5
Exhaust PM2.5
Off-Road 0.29 1.72 2.86 0.01 0.07 0.07 0.07 0.07 0.00 476.40 476.40 0.02 0.00 476.89
Total 0.29 1.72 2.86 0.01 0.07 0.07 0.00 476.890.07 0.07 0.00 476.40
Exhaust PM10
PM10 Total
476.40 0.02
PM2.5 Total
Bio- CO2
Mitigated Construction Off-Site
ROG NOx CO SO2 Fugitive PM10
CO2e
Category tons/yr MT/yr
NBio- CO2 Total CO2 CH4 N2OFugitive PM2.5
Exhaust PM2.5
Hauling 0.00 0.00 0.00 0.00 0.00 0.00 0.00 0.00 0.00 0.00 0.00 0.00 0.00 0.00 0.00 0.00
Vendor 1.41 16.21 10.04 0.04 0.12 0.56 0.68 0.04 0.51 0.55 0.00 4,204.95 4,204.95 0.06 0.00 4,206.25
Worker 2.01 1.83 18.90 0.06 0.28 0.27 0.55 0.10 0.25 0.35 0.00 4,259.82 4,259.82 0.18 0.00 4,263.69
Total 3.42 18.04 28.94 0.10 0.40 0.83 1.23 0.14 0.00 8,469.940.76 0.90 0.00 8,464.77 8,464.77 0.24
3.5 Building Construction - 2024
29 of 60

Exhaust PM10
PM10 Total PM2.5 Total
Bio- CO2
Unmitigated Construction On-Site
ROG NOx CO SO2 Fugitive PM10
CO2e
Category tons/yr MT/yr
NBio- CO2 Total CO2 CH4 N2OFugitive PM2.5
Exhaust PM2.5
Off-Road 0.28 1.58 2.87 0.01 0.06 0.06 0.06 0.06 0.00 480.06 480.06 0.02 0.00 480.53
Total 0.28 1.58 2.87 0.01 0.06 0.06 0.00 480.530.06 0.06 0.00 480.06
Exhaust PM10
PM10 Total
480.06 0.02
PM2.5 Total
Bio- CO2
Unmitigated Construction Off-Site
ROG NOx CO SO2 Fugitive PM10
CO2e
Category tons/yr MT/yr
NBio- CO2 Total CO2 CH4 N2OFugitive PM2.5
Exhaust PM2.5
Hauling 0.00 0.00 0.00 0.00 0.00 0.00 0.00 0.00 0.00 0.00 0.00 0.00 0.00 0.00 0.00 0.00
Vendor 1.38 15.93 9.70 0.04 1.37 0.55 1.92 0.04 0.50 0.54 0.00 4,240.46 4,240.46 0.06 0.00 4,241.72
Worker 1.95 1.74 18.11 0.06 6.66 0.27 6.94 0.10 0.25 0.36 0.00 4,232.23 4,232.23 0.18 0.00 4,235.97
Total 3.33 17.67 27.81 0.10 8.03 0.82 8.86 0.14 0.00 8,477.690.75 0.90 0.00 8,472.69
Exhaust PM10
PM10 Total
8,472.69 0.24
PM2.5 Total
Bio- CO2
Mitigated Construction On-Site
ROG NOx CO SO2 Fugitive PM10
CO2e
Category tons/yr MT/yr
NBio- CO2 Total CO2 CH4 N2OFugitive PM2.5
Exhaust PM2.5
Off-Road 0.28 1.58 2.87 0.01 0.06 0.06 0.06 0.06 0.00 480.06 480.06 0.02 0.00 480.53
Total 0.28 1.58 2.87 0.01 0.06 0.06 0.00 480.530.06 0.06 0.00 480.06 480.06 0.02
30 of 60
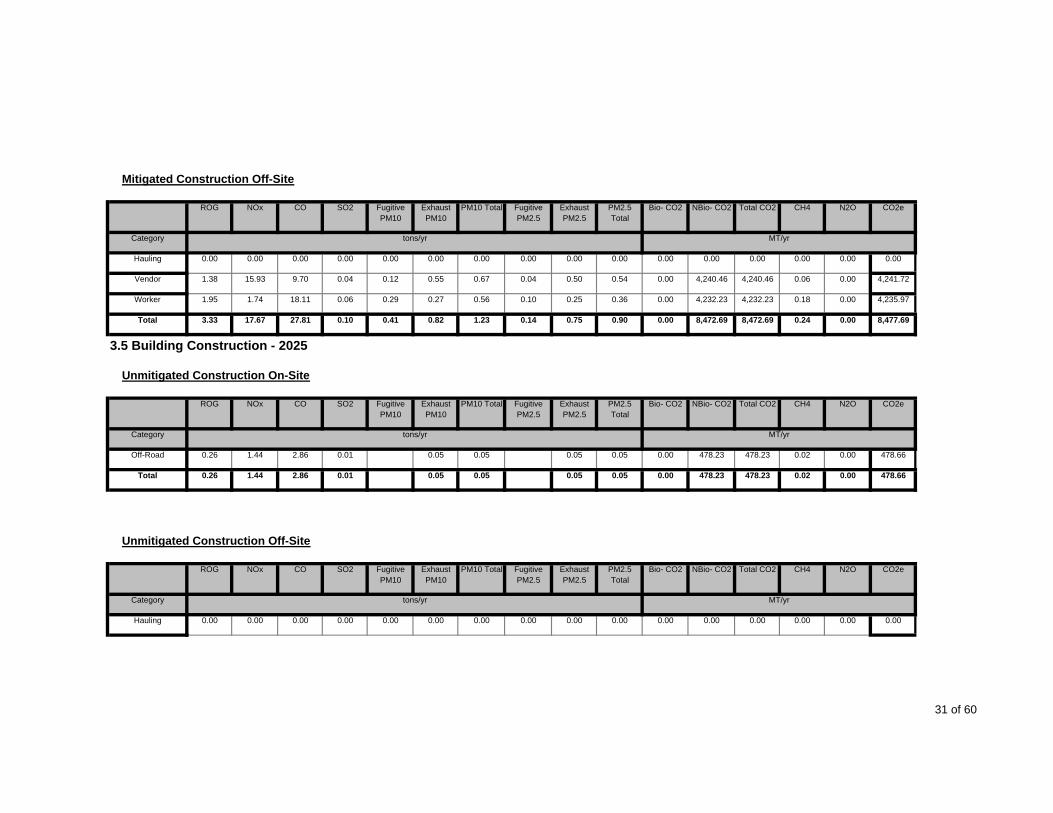
Exhaust PM10
PM10 Total PM2.5 Total
Bio- CO2
Mitigated Construction Off-Site
ROG NOx CO SO2 Fugitive PM10
CO2e
Category tons/yr MT/yr
NBio- CO2 Total CO2 CH4 N2OFugitive PM2.5
Exhaust PM2.5
Hauling 0.00 0.00 0.00 0.00 0.00 0.00 0.00 0.00 0.00 0.00 0.00 0.00 0.00 0.00 0.00 0.00
Vendor 1.38 15.93 9.70 0.04 0.12 0.55 0.67 0.04 0.50 0.54 0.00 4,240.46 4,240.46 0.06 0.00 4,241.72
Worker 1.95 1.74 18.11 0.06 0.29 0.27 0.56 0.10 0.25 0.36 0.00 4,232.23 4,232.23 0.18 0.00 4,235.97
Total 3.33 17.67 27.81 0.10 0.41 0.82 1.23 0.14 0.00 8,477.690.75 0.90 0.00 8,472.69
Exhaust PM10
PM10 Total
8,472.69 0.24
PM2.5 Total
Bio- CO2
3.5 Building Construction - 2025
Unmitigated Construction On-Site
ROG NOx CO SO2 Fugitive PM10
CO2e
Category tons/yr MT/yr
NBio- CO2 Total CO2 CH4 N2OFugitive PM2.5
Exhaust PM2.5
Off-Road 0.26 1.44 2.86 0.01 0.05 0.05 0.05 0.05 0.00 478.23 478.23 0.02 0.00 478.66
Total 0.26 1.44 2.86 0.01 0.05 0.05 0.00 478.660.05 0.05 0.00 478.23
Exhaust PM10
PM10 Total
478.23 0.02
PM2.5 Total
Bio- CO2
Unmitigated Construction Off-Site
ROG NOx CO SO2 Fugitive PM10
CO2e
Category tons/yr MT/yr
NBio- CO2 Total CO2 CH4 N2OFugitive PM2.5
Exhaust PM2.5
Hauling 0.00 0.00 0.00 0.00 0.00 0.00 0.00 0.00 0.00 0.00 0.00 0.00 0.00 0.00 0.00 0.00
31 of 60

Vendor 1.34 15.54 9.38 0.04 1.37 0.53 1.90 0.04 0.49 0.53 0.00 4,226.53 4,226.53 0.06 0.00 4,227.75
Worker 1.88 1.65 17.23 0.06 6.64 0.27 6.91 0.10 0.25 0.36 0.00 4,162.29 4,162.29 0.17 0.00 4,165.85
Total 3.22 17.19 26.61 0.10 8.01 0.80 8.81 0.14 0.00 8,393.600.74 0.89 0.00 8,388.82
Exhaust PM10
PM10 Total
8,388.82 0.23
PM2.5 Total
Bio- CO2
Mitigated Construction On-Site
ROG NOx CO SO2 Fugitive PM10
CO2e
Category tons/yr MT/yr
NBio- CO2 Total CO2 CH4 N2OFugitive PM2.5
Exhaust PM2.5
Off-Road 0.26 1.44 2.86 0.01 0.05 0.05 0.05 0.05 0.00 478.23 478.23 0.02 0.00 478.66
Total 0.26 1.44 2.86 0.01 0.05 0.05 0.00 478.660.05 0.05 0.00 478.23
Exhaust PM10
PM10 Total
478.23 0.02
PM2.5 Total
Bio- CO2
Mitigated Construction Off-Site
ROG NOx CO SO2 Fugitive PM10
CO2e
Category tons/yr MT/yr
NBio- CO2 Total CO2 CH4 N2OFugitive PM2.5
Exhaust PM2.5
Hauling 0.00 0.00 0.00 0.00 0.00 0.00 0.00 0.00 0.00 0.00 0.00 0.00 0.00 0.00 0.00 0.00
Vendor 1.34 15.54 9.38 0.04 0.12 0.53 0.65 0.04 0.49 0.53 0.00 4,226.53 4,226.53 0.06 0.00 4,227.75
Worker 1.88 1.65 17.23 0.06 0.28 0.27 0.56 0.10 0.25 0.36 0.00 4,162.29 4,162.29 0.17 0.00 4,165.85
Total 3.22 17.19 26.61 0.10 0.40 0.80 1.21 0.14 0.00 8,393.600.74 0.89 0.00 8,388.82 8,388.82 0.23
3.5 Building Construction - 2026
Unmitigated Construction On-Site
32 of 60

Exhaust PM10
PM10 Total PM2.5 Total
Bio- CO2ROG NOx CO SO2 Fugitive PM10
CO2e
Category tons/yr MT/yr
NBio- CO2 Total CO2 CH4 N2OFugitive PM2.5
Exhaust PM2.5
Off-Road 0.26 1.44 2.86 0.01 0.05 0.05 0.05 0.05 0.00 478.23 478.23 0.02 0.00 478.66
Total 0.26 1.44 2.86 0.01 0.05 0.05 0.00 478.660.05 0.05 0.00 478.23
Exhaust PM10
PM10 Total
478.23 0.02
PM2.5 Total
Bio- CO2
Unmitigated Construction Off-Site
ROG NOx CO SO2 Fugitive PM10
CO2e
Category tons/yr MT/yr
NBio- CO2 Total CO2 CH4 N2OFugitive PM2.5
Exhaust PM2.5
Hauling 0.00 0.00 0.00 0.00 0.00 0.00 0.00 0.00 0.00 0.00 0.00 0.00 0.00 0.00 0.00 0.00
Vendor 1.34 15.54 9.38 0.04 1.37 0.53 1.90 0.04 0.49 0.53 0.00 4,226.53 4,226.53 0.06 0.00 4,227.75
Worker 1.88 1.65 17.23 0.06 6.64 0.27 6.91 0.10 0.25 0.36 0.00 4,162.29 4,162.29 0.17 0.00 4,165.85
Total 3.22 17.19 26.61 0.10 8.01 0.80 8.81 0.14 0.00 8,393.600.74 0.89 0.00 8,388.82
Exhaust PM10
PM10 Total
8,388.82 0.23
PM2.5 Total
Bio- CO2
Mitigated Construction On-Site
ROG NOx CO SO2 Fugitive PM10
CO2e
Category tons/yr MT/yr
NBio- CO2 Total CO2 CH4 N2OFugitive PM2.5
Exhaust PM2.5
Off-Road 0.26 1.44 2.86 0.01 0.05 0.05 0.05 0.05 0.00 478.23 478.23 0.02 0.00 478.66
Total 0.26 1.44 2.86 0.01 0.05 0.05 0.00 478.660.05 0.05 0.00 478.23 478.23 0.02
33 of 60
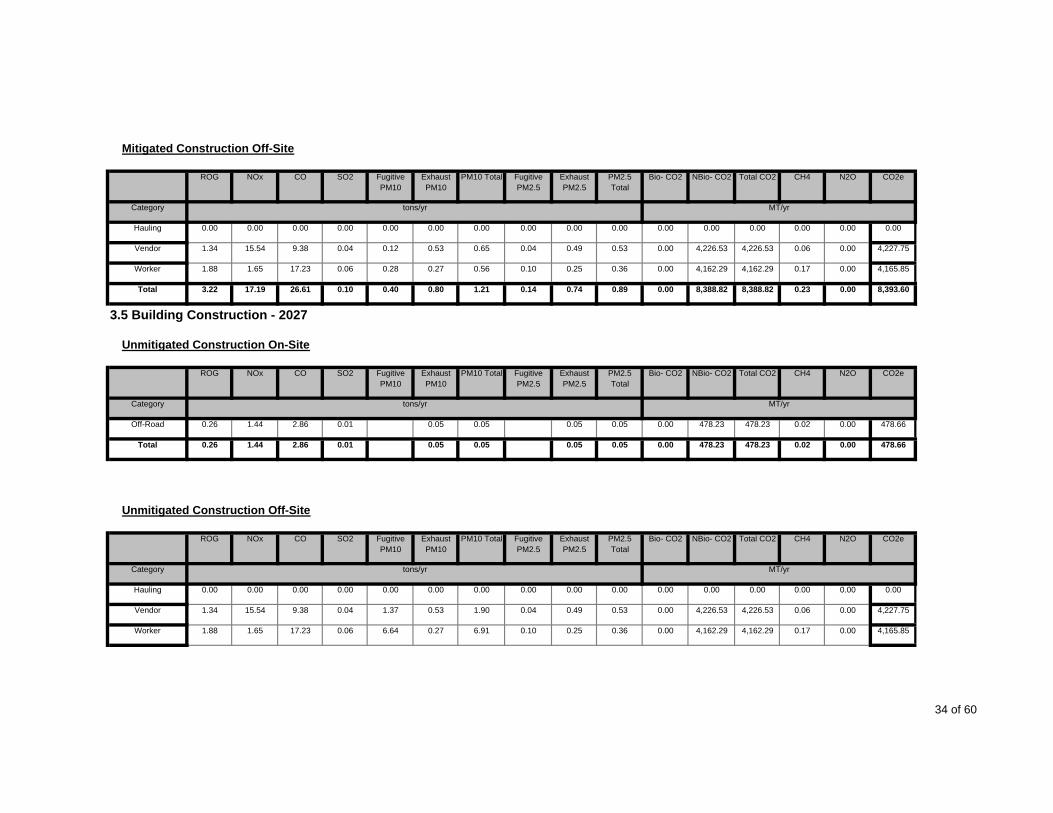
Exhaust PM10
PM10 Total PM2.5 Total
Bio- CO2
Mitigated Construction Off-Site
ROG NOx CO SO2 Fugitive PM10
CO2e
Category tons/yr MT/yr
NBio- CO2 Total CO2 CH4 N2OFugitive PM2.5
Exhaust PM2.5
Hauling 0.00 0.00 0.00 0.00 0.00 0.00 0.00 0.00 0.00 0.00 0.00 0.00 0.00 0.00 0.00 0.00
Vendor 1.34 15.54 9.38 0.04 0.12 0.53 0.65 0.04 0.49 0.53 0.00 4,226.53 4,226.53 0.06 0.00 4,227.75
Worker 1.88 1.65 17.23 0.06 0.28 0.27 0.56 0.10 0.25 0.36 0.00 4,162.29 4,162.29 0.17 0.00 4,165.85
Total 3.22 17.19 26.61 0.10 0.40 0.80 1.21 0.14 0.00 8,393.600.74 0.89 0.00 8,388.82
Exhaust PM10
PM10 Total
8,388.82 0.23
PM2.5 Total
Bio- CO2
3.5 Building Construction - 2027
Unmitigated Construction On-Site
ROG NOx CO SO2 Fugitive PM10
CO2e
Category tons/yr MT/yr
NBio- CO2 Total CO2 CH4 N2OFugitive PM2.5
Exhaust PM2.5
Off-Road 0.26 1.44 2.86 0.01 0.05 0.05 0.05 0.05 0.00 478.23 478.23 0.02 0.00 478.66
Total 0.26 1.44 2.86 0.01 0.05 0.05 0.00 478.660.05 0.05 0.00 478.23
Exhaust PM10
PM10 Total
478.23 0.02
PM2.5 Total
Bio- CO2
Unmitigated Construction Off-Site
ROG NOx CO SO2 Fugitive PM10
CO2e
Category tons/yr MT/yr
NBio- CO2 Total CO2 CH4 N2OFugitive PM2.5
Exhaust PM2.5
Hauling 0.00 0.00 0.00 0.00 0.00 0.00 0.00 0.00 0.00 0.00 0.00 0.00 0.00 0.00 0.00 0.00
Vendor 1.34 15.54 9.38 0.04 1.37 0.53 1.90 0.04 0.49 0.53 0.00 4,226.53 4,226.53 0.06 0.00 4,227.75
Worker 1.88 1.65 17.23 0.06 6.64 0.27 6.91 0.10 0.25 0.36 0.00 4,162.29 4,162.29 0.17 0.00 4,165.85
34 of 60

Total 3.22 17.19 26.61 0.10 8.01 0.80 8.81 0.14 0.00 8,393.600.74 0.89 0.00 8,388.82
Exhaust PM10
PM10 Total
8,388.82 0.23
PM2.5 Total
Bio- CO2
Mitigated Construction On-Site
ROG NOx CO SO2 Fugitive PM10
CO2e
Category tons/yr MT/yr
NBio- CO2 Total CO2 CH4 N2OFugitive PM2.5
Exhaust PM2.5
Off-Road 0.26 1.44 2.86 0.01 0.05 0.05 0.05 0.05 0.00 478.23 478.23 0.02 0.00 478.66
Total 0.26 1.44 2.86 0.01 0.05 0.05 0.00 478.660.05 0.05 0.00 478.23
Exhaust PM10
PM10 Total
478.23 0.02
PM2.5 Total
Bio- CO2
Mitigated Construction Off-Site
ROG NOx CO SO2 Fugitive PM10
CO2e
Category tons/yr MT/yr
NBio- CO2 Total CO2 CH4 N2OFugitive PM2.5
Exhaust PM2.5
Hauling 0.00 0.00 0.00 0.00 0.00 0.00 0.00 0.00 0.00 0.00 0.00 0.00 0.00 0.00 0.00 0.00
Vendor 1.34 15.54 9.38 0.04 0.12 0.53 0.65 0.04 0.49 0.53 0.00 4,226.53 4,226.53 0.06 0.00 4,227.75
Worker 1.88 1.65 17.23 0.06 0.28 0.27 0.56 0.10 0.25 0.36 0.00 4,162.29 4,162.29 0.17 0.00 4,165.85
Total 3.22 17.19 26.61 0.10 0.40 0.80 1.21 0.14 0.00 8,393.600.74 0.89 0.00 8,388.82
Exhaust PM10
PM10 Total
8,388.82 0.23
PM2.5 Total
Bio- CO2
3.5 Building Construction - 2028
Unmitigated Construction On-Site
ROG NOx CO SO2 Fugitive PM10
CO2e
Category tons/yr MT/yr
NBio- CO2 Total CO2 CH4 N2OFugitive PM2.5
Exhaust PM2.5
35 of 60

Off-Road 0.26 1.44 2.85 0.01 0.05 0.05 0.05 0.05 0.00 476.40 476.40 0.02 0.00 476.83
Total 0.26 1.44 2.85 0.01 0.05 0.05 0.00 476.830.05 0.05 0.00 476.40
Exhaust PM10
PM10 Total
476.40 0.02
PM2.5 Total
Bio- CO2
Unmitigated Construction Off-Site
ROG NOx CO SO2 Fugitive PM10
CO2e
Category tons/yr MT/yr
NBio- CO2 Total CO2 CH4 N2OFugitive PM2.5
Exhaust PM2.5
Hauling 0.00 0.00 0.00 0.00 0.00 0.00 0.00 0.00 0.00 0.00 0.00 0.00 0.00 0.00 0.00 0.00
Vendor 1.33 15.48 9.35 0.04 1.36 0.53 1.90 0.04 0.49 0.53 0.00 4,210.34 4,210.34 0.06 0.00 4,211.56
Worker 1.87 1.64 17.17 0.06 6.61 0.27 6.88 0.10 0.25 0.35 0.00 4,146.35 4,146.35 0.17 0.00 4,149.89
Total 3.20 17.12 26.52 0.10 7.97 0.80 8.78 0.14 0.00 8,361.450.74 0.88 0.00 8,356.69
Exhaust PM10
PM10 Total
8,356.69 0.23
PM2.5 Total
Bio- CO2
Mitigated Construction On-Site
ROG NOx CO SO2 Fugitive PM10
CO2e
Category tons/yr MT/yr
NBio- CO2 Total CO2 CH4 N2OFugitive PM2.5
Exhaust PM2.5
Off-Road 0.26 1.44 2.85 0.01 0.05 0.05 0.05 0.05 0.00 476.40 476.40 0.02 0.00 476.83
Total 0.26 1.44 2.85 0.01 0.05 0.05 0.00 476.830.05 0.05 0.00 476.40
Exhaust PM10
PM10 Total
476.40 0.02
PM2.5 Total
Bio- CO2
Mitigated Construction Off-Site
ROG NOx CO SO2 Fugitive PM10
CO2eNBio- CO2 Total CO2 CH4 N2OFugitive PM2.5
Exhaust PM2.5
36 of 60

Category tons/yr MT/yr
Hauling 0.00 0.00 0.00 0.00 0.00 0.00 0.00 0.00 0.00 0.00 0.00 0.00 0.00 0.00 0.00 0.00
Vendor 1.33 15.48 9.35 0.04 0.12 0.53 0.65 0.04 0.49 0.53 0.00 4,210.34 4,210.34 0.06 0.00 4,211.56
Worker 1.87 1.64 17.17 0.06 0.28 0.27 0.55 0.10 0.25 0.35 0.00 4,146.35 4,146.35 0.17 0.00 4,149.89
Total 3.20 17.12 26.52 0.10 0.40 0.80 1.20 0.14 0.00 8,361.450.74 0.88 0.00 8,356.69
Exhaust PM10
PM10 Total
8,356.69 0.23
PM2.5 Total
Bio- CO2
3.5 Building Construction - 2029
Unmitigated Construction On-Site
ROG NOx CO SO2 Fugitive PM10
CO2e
Category tons/yr MT/yr
NBio- CO2 Total CO2 CH4 N2OFugitive PM2.5
Exhaust PM2.5
Off-Road 0.26 1.44 2.86 0.01 0.05 0.05 0.05 0.05 0.00 478.23 478.23 0.02 0.00 478.66
Total 0.26 1.44 2.86 0.01 0.05 0.05 0.00 478.660.05 0.05 0.00 478.23
Exhaust PM10
PM10 Total
478.23 0.02
PM2.5 Total
Bio- CO2
Unmitigated Construction Off-Site
ROG NOx CO SO2 Fugitive PM10
CO2e
Category tons/yr MT/yr
NBio- CO2 Total CO2 CH4 N2OFugitive PM2.5
Exhaust PM2.5
Hauling 0.00 0.00 0.00 0.00 0.00 0.00 0.00 0.00 0.00 0.00 0.00 0.00 0.00 0.00 0.00 0.00
Vendor 1.34 15.54 9.38 0.04 1.37 0.53 1.90 0.04 0.49 0.53 0.00 4,226.53 4,226.53 0.06 0.00 4,227.75
Worker 1.88 1.65 17.23 0.06 6.64 0.27 6.91 0.10 0.25 0.36 0.00 4,162.29 4,162.29 0.17 0.00 4,165.85
Total 3.22 17.19 26.61 0.10 8.01 0.80 8.81 0.14 0.00 8,393.600.74 0.89 0.00 8,388.82 8,388.82 0.23
37 of 60

Exhaust PM10
PM10 Total PM2.5 Total
Bio- CO2
Mitigated Construction On-Site
ROG NOx CO SO2 Fugitive PM10
CO2e
Category tons/yr MT/yr
NBio- CO2 Total CO2 CH4 N2OFugitive PM2.5
Exhaust PM2.5
Off-Road 0.26 1.44 2.86 0.01 0.05 0.05 0.05 0.05 0.00 478.23 478.23 0.02 0.00 478.66
Total 0.26 1.44 2.86 0.01 0.05 0.05 0.00 478.660.05 0.05 0.00 478.23
Exhaust PM10
PM10 Total
478.23 0.02
PM2.5 Total
Bio- CO2
Mitigated Construction Off-Site
ROG NOx CO SO2 Fugitive PM10
CO2e
Category tons/yr MT/yr
NBio- CO2 Total CO2 CH4 N2OFugitive PM2.5
Exhaust PM2.5
Hauling 0.00 0.00 0.00 0.00 0.00 0.00 0.00 0.00 0.00 0.00 0.00 0.00 0.00 0.00 0.00 0.00
Vendor 1.34 15.54 9.38 0.04 0.12 0.53 0.65 0.04 0.49 0.53 0.00 4,226.53 4,226.53 0.06 0.00 4,227.75
Worker 1.88 1.65 17.23 0.06 0.28 0.27 0.56 0.10 0.25 0.36 0.00 4,162.29 4,162.29 0.17 0.00 4,165.85
Total 3.22 17.19 26.61 0.10 0.40 0.80 1.21 0.14 0.00 8,393.600.74 0.89 0.00 8,388.82
Exhaust PM10
PM10 Total
8,388.82 0.23
PM2.5 Total
Bio- CO2
3.5 Building Construction - 2030
Unmitigated Construction On-Site
ROG NOx CO SO2 Fugitive PM10
CO2e
Category tons/yr MT/yr
NBio- CO2 Total CO2 CH4 N2OFugitive PM2.5
Exhaust PM2.5
Off-Road 0.22 1.05 2.85 0.01 0.02 0.02 0.02 0.02 0.00 478.23 478.23 0.02 0.00 478.60
Total 0.22 1.05 2.85 0.01 0.02 0.02 0.00 478.600.02 0.02 0.00 478.23 478.23 0.02
38 of 60

Exhaust PM10
PM10 Total PM2.5 Total
Bio- CO2
Unmitigated Construction Off-Site
ROG NOx CO SO2 Fugitive PM10
CO2e
Category tons/yr MT/yr
NBio- CO2 Total CO2 CH4 N2OFugitive PM2.5
Exhaust PM2.5
Hauling 0.00 0.00 0.00 0.00 0.00 0.00 0.00 0.00 0.00 0.00 0.00 0.00 0.00 0.00 0.00 0.00
Vendor 1.23 14.56 8.51 0.04 1.37 0.50 1.87 0.04 0.46 0.50 0.00 4,234.74 4,234.74 0.05 0.00 4,235.85
Worker 1.61 1.31 14.41 0.06 6.64 0.27 6.91 0.10 0.25 0.36 0.00 3,970.91 3,970.91 0.15 0.00 3,973.97
Total 2.84 15.87 22.92 0.10 8.01 0.77 8.78 0.14 0.00 8,209.820.71 0.86 0.00 8,205.65
Exhaust PM10
PM10 Total
8,205.65 0.20
PM2.5 Total
Bio- CO2
Mitigated Construction On-Site
ROG NOx CO SO2 Fugitive PM10
CO2e
Category tons/yr MT/yr
NBio- CO2 Total CO2 CH4 N2OFugitive PM2.5
Exhaust PM2.5
Off-Road 0.22 1.05 2.85 0.01 0.02 0.02 0.02 0.02 0.00 478.23 478.23 0.02 0.00 478.60
Total 0.22 1.05 2.85 0.01 0.02 0.02 0.00 478.600.02 0.02 0.00 478.23
Exhaust PM10
PM10 Total
478.23 0.02
PM2.5 Total
Bio- CO2
Mitigated Construction Off-Site
ROG NOx CO SO2 Fugitive PM10
CO2e
Category tons/yr MT/yr
NBio- CO2 Total CO2 CH4 N2OFugitive PM2.5
Exhaust PM2.5
Hauling 0.00 0.00 0.00 0.00 0.00 0.00 0.00 0.00 0.00 0.00 0.00 0.00 0.00 0.00 0.00 0.00
39 of 60

Vendor 1.23 14.56 8.51 0.04 0.12 0.50 0.62 0.04 0.46 0.50 0.00 4,234.74 4,234.74 0.05 0.00 4,235.85
Worker 1.61 1.31 14.41 0.06 0.28 0.27 0.56 0.10 0.25 0.36 0.00 3,970.91 3,970.91 0.15 0.00 3,973.97
Total 2.84 15.87 22.92 0.10 0.40 0.77 1.18 0.14 0.00 8,209.820.71 0.86 0.00 8,205.65
Exhaust PM10
PM10 Total
8,205.65 0.20
PM2.5 Total
Bio- CO2
3.5 Building Construction - 2031
Unmitigated Construction On-Site
ROG NOx CO SO2 Fugitive PM10
CO2e
Category tons/yr MT/yr
NBio- CO2 Total CO2 CH4 N2OFugitive PM2.5
Exhaust PM2.5
Off-Road 0.22 1.05 2.85 0.01 0.02 0.02 0.02 0.02 0.00 478.23 478.23 0.02 0.00 478.60
Total 0.22 1.05 2.85 0.01 0.02 0.02 0.00 478.600.02 0.02 0.00 478.23
Exhaust PM10
PM10 Total
478.23 0.02
PM2.5 Total
Bio- CO2
Unmitigated Construction Off-Site
ROG NOx CO SO2 Fugitive PM10
CO2e
Category tons/yr MT/yr
NBio- CO2 Total CO2 CH4 N2OFugitive PM2.5
Exhaust PM2.5
Hauling 0.00 0.00 0.00 0.00 0.00 0.00 0.00 0.00 0.00 0.00 0.00 0.00 0.00 0.00 0.00 0.00
Vendor 1.23 14.56 8.51 0.04 1.37 0.50 1.87 0.04 0.46 0.50 0.00 4,234.74 4,234.74 0.05 0.00 4,235.85
Worker 1.61 1.31 14.41 0.06 6.64 0.27 6.91 0.10 0.25 0.36 0.00 3,970.91 3,970.91 0.15 0.00 3,973.97
Total 2.84 15.87 22.92 0.10 8.01 0.77 8.78 0.14 0.00 8,209.820.71 0.86 0.00 8,205.65 8,205.65 0.20
Mitigated Construction On-Site
40 of 60

Exhaust PM10
PM10 Total PM2.5 Total
Bio- CO2ROG NOx CO SO2 Fugitive PM10
CO2e
Category tons/yr MT/yr
NBio- CO2 Total CO2 CH4 N2OFugitive PM2.5
Exhaust PM2.5
Off-Road 0.22 1.05 2.85 0.01 0.02 0.02 0.02 0.02 0.00 478.23 478.23 0.02 0.00 478.60
Total 0.22 1.05 2.85 0.01 0.02 0.02 0.00 478.600.02 0.02 0.00 478.23
Exhaust PM10
PM10 Total
478.23 0.02
PM2.5 Total
Bio- CO2
Mitigated Construction Off-Site
ROG NOx CO SO2 Fugitive PM10
CO2e
Category tons/yr MT/yr
NBio- CO2 Total CO2 CH4 N2OFugitive PM2.5
Exhaust PM2.5
Hauling 0.00 0.00 0.00 0.00 0.00 0.00 0.00 0.00 0.00 0.00 0.00 0.00 0.00 0.00 0.00 0.00
Vendor 1.23 14.56 8.51 0.04 0.12 0.50 0.62 0.04 0.46 0.50 0.00 4,234.74 4,234.74 0.05 0.00 4,235.85
Worker 1.61 1.31 14.41 0.06 0.28 0.27 0.56 0.10 0.25 0.36 0.00 3,970.91 3,970.91 0.15 0.00 3,973.97
Total 2.84 15.87 22.92 0.10 0.40 0.77 1.18 0.14 0.00 8,209.820.71 0.86 0.00 8,205.65
Exhaust PM10
PM10 Total
8,205.65 0.20
PM2.5 Total
Bio- CO2
3.5 Building Construction - 2032
Unmitigated Construction On-Site
ROG NOx CO SO2 Fugitive PM10
CO2e
Category tons/yr MT/yr
NBio- CO2 Total CO2 CH4 N2OFugitive PM2.5
Exhaust PM2.5
Off-Road 0.10 0.47 1.28 0.00 0.01 0.01 0.01 0.01 0.00 214.38 214.38 0.01 0.00 214.54
Total 0.10 0.47 1.28 0.00 0.01 0.01 0.00 214.540.01 0.01 0.00 214.38 214.38 0.01
41 of 60

Exhaust PM10
PM10 Total PM2.5 Total
Bio- CO2
Unmitigated Construction Off-Site
ROG NOx CO SO2 Fugitive PM10
CO2e
Category tons/yr MT/yr
NBio- CO2 Total CO2 CH4 N2OFugitive PM2.5
Exhaust PM2.5
Hauling 0.00 0.00 0.00 0.00 0.00 0.00 0.00 0.00 0.00 0.00 0.00 0.00 0.00 0.00 0.00 0.00
Vendor 0.55 6.53 3.81 0.02 0.61 0.23 0.84 0.02 0.21 0.22 0.00 1,898.33 1,898.33 0.02 0.00 1,898.83
Worker 0.72 0.59 6.46 0.03 2.98 0.12 3.10 0.05 0.11 0.16 0.00 1,780.06 1,780.06 0.07 0.00 1,781.43
Total 1.27 7.12 10.27 0.05 3.59 0.35 3.94 0.07 0.00 3,680.260.32 0.38 0.00 3,678.39
Exhaust PM10
PM10 Total
3,678.39 0.09
PM2.5 Total
Bio- CO2
Mitigated Construction On-Site
ROG NOx CO SO2 Fugitive PM10
CO2e
Category tons/yr MT/yr
NBio- CO2 Total CO2 CH4 N2OFugitive PM2.5
Exhaust PM2.5
Off-Road 0.10 0.47 1.28 0.00 0.01 0.01 0.01 0.01 0.00 214.38 214.38 0.01 0.00 214.54
Total 0.10 0.47 1.28 0.00 0.01 0.01 0.00 214.540.01 0.01 0.00 214.38
Exhaust PM10
PM10 Total
214.38 0.01
PM2.5 Total
Bio- CO2
Mitigated Construction Off-Site
ROG NOx CO SO2 Fugitive PM10
CO2e
Category tons/yr MT/yr
NBio- CO2 Total CO2 CH4 N2OFugitive PM2.5
Exhaust PM2.5
Hauling 0.00 0.00 0.00 0.00 0.00 0.00 0.00 0.00 0.00 0.00 0.00 0.00 0.00 0.00 0.00 0.00
Vendor 0.55 6.53 3.81 0.02 0.05 0.23 0.28 0.02 0.21 0.22 0.00 1,898.33 1,898.33 0.02 0.00 1,898.83
Worker 0.72 0.59 6.46 0.03 0.13 0.12 0.25 0.05 0.11 0.16 0.00 1,780.06 1,780.06 0.07 0.00 1,781.43
42 of 60

Total 1.27 7.12 10.27 0.05 0.18 0.35 0.53 0.07 0.00 3,680.260.32 0.38 0.00 3,678.39
Exhaust PM10
PM10 Total
3,678.39 0.09
PM2.5 Total
Bio- CO2
3.6 Paving - 2032
Unmitigated Construction On-Site
ROG NOx CO SO2 Fugitive PM10
CO2e
Category tons/yr MT/yr
NBio- CO2 Total CO2 CH4 N2OFugitive PM2.5
Exhaust PM2.5
Off-Road 0.14 0.85 1.39 0.00 0.04 0.04 0.04 0.04 0.00 191.84 191.84 0.01 0.00 192.08
Paving 0.00 0.00 0.00 0.00 0.00 0.00 0.00 0.00 0.00 0.00 0.00
Total 0.14 0.85 1.39 191.84 0.01 0.000.04 0.04 0.00
SO2 Fugitive PM10
Exhaust PM10
191.840.00 0.04 0.04
Fugitive PM2.5
Exhaust PM2.5
PM2.5 Total
192.08
Unmitigated Construction Off-Site
ROG NOx CO N2O CO2e
Category tons/yr MT/yr
Bio- CO2 NBio- CO2 Total CO2 CH4PM10 Total
Hauling 0.00 0.00 0.00 0.00 0.00 0.00 0.00 0.00 0.00 0.00 0.00 0.00 0.00 0.00 0.00 0.00
Vendor 0.00 0.00 0.00 0.00 0.00 0.00 0.00 0.00 0.00 0.00 0.00 0.00 0.00 0.00 0.00 0.00
Worker 0.00 0.00 0.03 0.00 0.01 0.00 0.01 0.00 0.00 0.00 0.00 7.42 7.42 0.00 0.00 7.42
Total 0.00 0.00 0.03 0.00 0.01 0.00 0.01 0.00 0.00 7.420.00 0.00 0.00 7.42
Exhaust PM10
PM10 Total
7.42 0.00
PM2.5 Total
Bio- CO2
Mitigated Construction On-Site
ROG NOx CO SO2 Fugitive PM10
CO2e
Category tons/yr MT/yr
NBio- CO2 Total CO2 CH4 N2OFugitive PM2.5
Exhaust PM2.5
43 of 60

Off-Road 0.14 0.85 1.39 0.00 0.04 0.04 0.04 0.04 0.00 191.84 191.84 0.01 0.00 192.08
Paving 0.00 0.00 0.00 0.00 0.00 0.00 0.00 0.00 0.00 0.00 0.00
Total 0.14 0.85 1.39 191.84 0.01 0.000.04 0.04 0.00
SO2 Fugitive PM10
Exhaust PM10
191.840.00 0.04 0.04
Fugitive PM2.5
Exhaust PM2.5
PM2.5 Total
192.08
Mitigated Construction Off-Site
ROG NOx CO N2O CO2e
Category tons/yr MT/yr
Bio- CO2 NBio- CO2 Total CO2 CH4PM10 Total
Hauling 0.00 0.00 0.00 0.00 0.00 0.00 0.00 0.00 0.00 0.00 0.00 0.00 0.00 0.00 0.00 0.00
Vendor 0.00 0.00 0.00 0.00 0.00 0.00 0.00 0.00 0.00 0.00 0.00 0.00 0.00 0.00 0.00 0.00
Worker 0.00 0.00 0.03 0.00 0.00 0.00 0.00 0.00 0.00 0.00 0.00 7.42 7.42 0.00 0.00 7.42
Total 0.00 0.00 0.03 0.00 0.00 0.00 0.00 0.00 0.00 7.420.00 0.00 0.00 7.42
Exhaust PM10
PM10 Total
7.42 0.00
PM2.5 Total
Bio- CO2
3.6 Paving - 2033
Unmitigated Construction On-Site
ROG NOx CO SO2 Fugitive PM10
CO2e
Category tons/yr MT/yr
NBio- CO2 Total CO2 CH4 N2OFugitive PM2.5
Exhaust PM2.5
Off-Road 0.17 1.08 1.78 0.00 0.05 0.05 0.05 0.05 0.00 244.77 244.77 0.01 0.00 245.06
Paving 0.00 0.00 0.00 0.00 0.00 0.00 0.00 0.00 0.00 0.00 0.00
Total 0.17 1.08 1.78 244.77 0.01 0.000.05 0.05 0.00 244.770.00 0.05 0.05 245.06
Unmitigated Construction Off-Site
44 of 60

SO2 Fugitive PM10
Exhaust PM10
Fugitive PM2.5
Exhaust PM2.5
PM2.5 Total
ROG NOx CO N2O CO2e
Category tons/yr MT/yr
Bio- CO2 NBio- CO2 Total CO2 CH4PM10 Total
Hauling 0.00 0.00 0.00 0.00 0.00 0.00 0.00 0.00 0.00 0.00 0.00 0.00 0.00 0.00 0.00 0.00
Vendor 0.00 0.00 0.00 0.00 0.00 0.00 0.00 0.00 0.00 0.00 0.00 0.00 0.00 0.00 0.00 0.00
Worker 0.00 0.00 0.03 0.00 0.02 0.00 0.02 0.00 0.00 0.00 0.00 9.46 9.46 0.00 0.00 9.47
Total 0.00 0.00 0.03 0.00 0.02 0.00 0.02 0.00 0.00 9.470.00 0.00 0.00 9.46
Exhaust PM10
PM10 Total
9.46 0.00
PM2.5 Total
Bio- CO2
Mitigated Construction On-Site
ROG NOx CO SO2 Fugitive PM10
CO2e
Category tons/yr MT/yr
NBio- CO2 Total CO2 CH4 N2OFugitive PM2.5
Exhaust PM2.5
Off-Road 0.17 1.08 1.78 0.00 0.05 0.05 0.05 0.05 0.00 244.77 244.77 0.01 0.00 245.06
Paving 0.00 0.00 0.00 0.00 0.00 0.00 0.00 0.00 0.00 0.00 0.00
Total 0.17 1.08 1.78 244.77 0.01 0.000.05 0.05 0.00
SO2 Fugitive PM10
Exhaust PM10
244.770.00 0.05 0.05
Fugitive PM2.5
Exhaust PM2.5
PM2.5 Total
245.06
Mitigated Construction Off-Site
ROG NOx CO N2O CO2e
Category tons/yr MT/yr
Bio- CO2 NBio- CO2 Total CO2 CH4PM10 Total
Hauling 0.00 0.00 0.00 0.00 0.00 0.00 0.00 0.00 0.00 0.00 0.00 0.00 0.00 0.00 0.00 0.00
Vendor 0.00 0.00 0.00 0.00 0.00 0.00 0.00 0.00 0.00 0.00 0.00 0.00 0.00 0.00 0.00 0.00
Worker 0.00 0.00 0.03 0.00 0.00 0.00 0.00 0.00 0.00 0.00 0.00 9.46 9.46 0.00 0.00 9.47
Total 0.00 0.00 0.03 0.00 0.00 0.00 0.00 0.00 0.00 9.470.00 0.00 0.00 9.46 9.46 0.00
45 of 60

Exhaust PM10
PM10 Total PM2.5 Total
Bio- CO2
3.7 Architectural Coating - 2033
Unmitigated Construction On-Site
ROG NOx CO SO2 Fugitive PM10
CO2e
Category tons/yr MT/yr
NBio- CO2 Total CO2 CH4 N2OFugitive PM2.5
Exhaust PM2.5
Archit. Coating 26.42 0.00 0.00 0.00 0.00 0.00 0.00 0.00 0.00 0.00 0.00
Off-Road 0.00 0.03 0.07 0.00 0.00 0.00 0.00 0.00 0.00 9.56 9.56 0.00 0.00 9.57
Total 26.42 0.03 0.07 9.56 0.00 0.000.00 0.00 0.00
SO2 Fugitive PM10
Exhaust PM10
9.560.00 0.00 0.00
Fugitive PM2.5
Exhaust PM2.5
PM2.5 Total
9.57
Unmitigated Construction Off-Site
ROG NOx CO N2O CO2e
Category tons/yr MT/yr
Bio- CO2 NBio- CO2 Total CO2 CH4PM10 Total
Hauling 0.00 0.00 0.00 0.00 0.00 0.00 0.00 0.00 0.00 0.00 0.00 0.00 0.00 0.00 0.00 0.00
Vendor 0.00 0.00 0.00 0.00 0.00 0.00 0.00 0.00 0.00 0.00 0.00 0.00 0.00 0.00 0.00 0.00
Worker 0.09 0.08 0.83 0.00 0.38 0.02 0.40 0.01 0.01 0.02 0.00 228.11 228.11 0.01 0.00 228.29
Total 0.09 0.08 0.83 0.00 0.38 0.02 0.40 0.01 0.00 228.290.01 0.02 0.00 228.11
Exhaust PM10
PM10 Total
228.11 0.01
PM2.5 Total
Bio- CO2
Mitigated Construction On-Site
ROG NOx CO SO2 Fugitive PM10
CO2e
Category tons/yr MT/yr
NBio- CO2 Total CO2 CH4 N2OFugitive PM2.5
Exhaust PM2.5
Archit. Coating 26.42 0.00 0.00 0.00 0.00 0.00 0.00 0.00 0.00 0.00 0.00
46 of 60
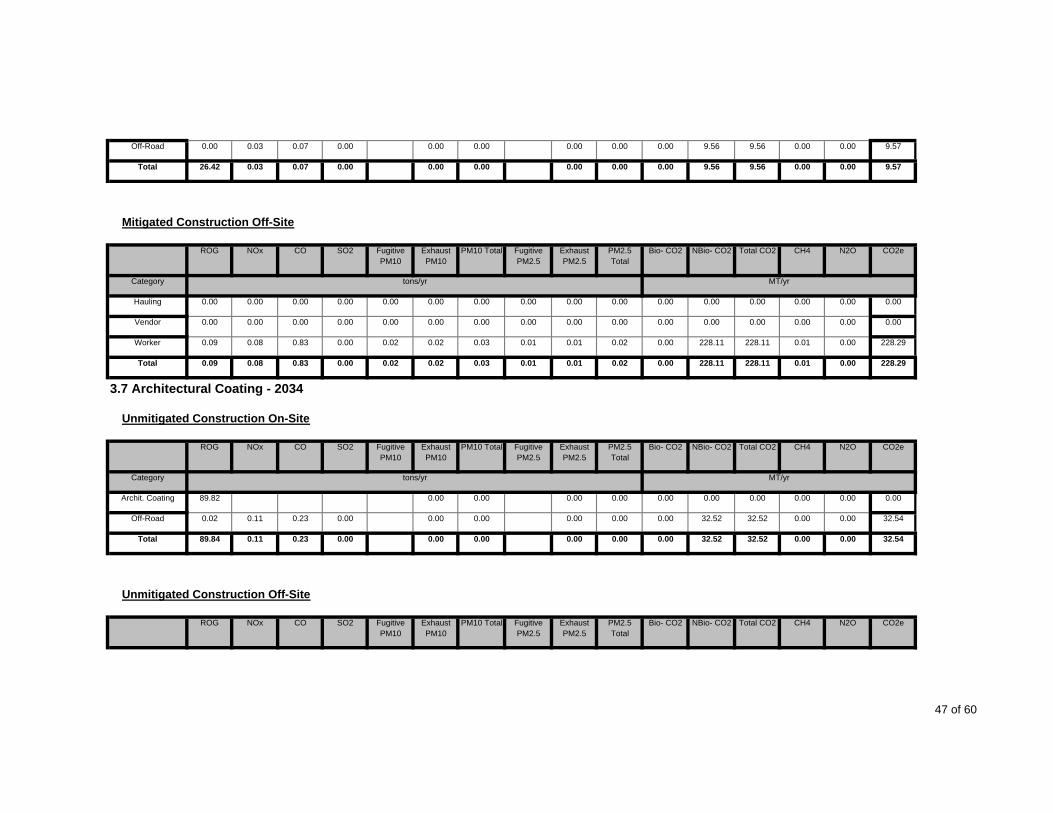
Off-Road 0.00 0.03 0.07 0.00 0.00 0.00 0.00 0.00 0.00 9.56 9.56 0.00 0.00 9.57
Total 26.42 0.03 0.07 9.56 0.00 0.000.00 0.00 0.00
SO2 Fugitive PM10
Exhaust PM10
9.560.00 0.00 0.00
Fugitive PM2.5
Exhaust PM2.5
PM2.5 Total
9.57
Mitigated Construction Off-Site
ROG NOx CO N2O CO2e
Category tons/yr MT/yr
Bio- CO2 NBio- CO2 Total CO2 CH4PM10 Total
Hauling 0.00 0.00 0.00 0.00 0.00 0.00 0.00 0.00 0.00 0.00 0.00 0.00 0.00 0.00 0.00 0.00
Vendor 0.00 0.00 0.00 0.00 0.00 0.00 0.00 0.00 0.00 0.00 0.00 0.00 0.00 0.00 0.00 0.00
Worker 0.09 0.08 0.83 0.00 0.02 0.02 0.03 0.01 0.01 0.02 0.00 228.11 228.11 0.01 0.00 228.29
Total 0.09 0.08 0.83 0.00 0.02 0.02 0.03 0.01 0.00 228.290.01 0.02 0.00 228.11
Exhaust PM10
PM10 Total
228.11 0.01
PM2.5 Total
Bio- CO2
3.7 Architectural Coating - 2034
Unmitigated Construction On-Site
ROG NOx CO SO2 Fugitive PM10
CO2e
Category tons/yr MT/yr
NBio- CO2 Total CO2 CH4 N2OFugitive PM2.5
Exhaust PM2.5
Archit. Coating 89.82 0.00 0.00 0.00 0.00 0.00 0.00 0.00 0.00 0.00 0.00
Off-Road 0.02 0.11 0.23 0.00 0.00 0.00 0.00 0.00 0.00 32.52 32.52 0.00 0.00 32.54
Total 89.84 0.11 0.23 32.52 0.00 0.000.00 0.00 0.00
SO2 Fugitive PM10
Exhaust PM10
32.520.00 0.00 0.00
Fugitive PM2.5
Exhaust PM2.5
PM2.5 Total
32.54
Unmitigated Construction Off-Site
ROG NOx CO N2O CO2eBio- CO2 NBio- CO2 Total CO2 CH4PM10 Total
47 of 60

Category tons/yr MT/yr
Hauling 0.00 0.00 0.00 0.00 0.00 0.00 0.00 0.00 0.00 0.00 0.00 0.00 0.00 0.00 0.00 0.00
Vendor 0.00 0.00 0.00 0.00 0.00 0.00 0.00 0.00 0.00 0.00 0.00 0.00 0.00 0.00 0.00 0.00
Worker 0.31 0.26 2.81 0.01 1.30 0.05 1.35 0.02 0.05 0.07 0.00 775.58 775.58 0.03 0.00 776.17
Total 0.31 0.26 2.81 0.01 1.30 0.05 1.35 0.02 0.00 776.170.05 0.07 0.00 775.58
Exhaust PM10
PM10 Total
775.58 0.03
PM2.5 Total
Bio- CO2
Mitigated Construction On-Site
ROG NOx CO SO2 Fugitive PM10
CO2e
Category tons/yr MT/yr
NBio- CO2 Total CO2 CH4 N2OFugitive PM2.5
Exhaust PM2.5
Archit. Coating 89.82 0.00 0.00 0.00 0.00 0.00 0.00 0.00 0.00 0.00 0.00
Off-Road 0.02 0.11 0.23 0.00 0.00 0.00 0.00 0.00 0.00 32.52 32.52 0.00 0.00 32.54
Total 89.84 0.11 0.23 32.52 0.00 0.000.00 0.00 0.00
SO2 Fugitive PM10
Exhaust PM10
32.520.00 0.00 0.00
Fugitive PM2.5
Exhaust PM2.5
PM2.5 Total
32.54
Mitigated Construction Off-Site
ROG NOx CO N2O CO2e
Category tons/yr MT/yr
Bio- CO2 NBio- CO2 Total CO2 CH4PM10 Total
Hauling 0.00 0.00 0.00 0.00 0.00 0.00 0.00 0.00 0.00 0.00 0.00 0.00 0.00 0.00 0.00 0.00
Vendor 0.00 0.00 0.00 0.00 0.00 0.00 0.00 0.00 0.00 0.00 0.00 0.00 0.00 0.00 0.00 0.00
Worker 0.31 0.26 2.81 0.01 0.06 0.05 0.11 0.02 0.05 0.07 0.00 775.58 775.58 0.03 0.00 776.17
Total 0.31 0.26 2.81 0.01 0.06 0.05 0.11 0.02 0.05 0.07 0.00 775.58 775.58 0.03 0.00 776.17
48 of 60

SO2 Fugitive PM10
Exhaust PM10
4.0 Mobile Detail
4.1 Mitigation Measures Mobile
Fugitive PM2.5
Exhaust PM2.5
PM2.5 Total
ROG NOx CO N2O CO2e
Category tons/yr MT/yr
Bio- CO2 NBio- CO2 Total CO2 CH4PM10 Total
Mitigated 60.77 108.54 503.54 1.50 151.69 7.81 159.49 2.42 7.53 9.94 0.00 103,723.00 103,723.00 3.89 0.00 103,804.65
Unmitigated 60.77 108.54 503.54 1.50 151.69 7.81 159.49 2.42 7.53 9.94 0.00 103,723.00 103,723.00 3.89 0.00 103,804.65
Total NA NA NA NA NA NA NA NA NANA NA NA NA
Saturday Sunday
NA
4.2 Trip Summary Information
Average Daily Trip Rate Unmitigated Mitigated
NA NA
Annual VMT Annual VMT
Apartments Low Rise 366.00 366.00 366.00 1,045,041 1,045,041
Land Use Weekday
Apartments Mid Rise 18,165.80 18,165.80 18165.80Fast Food Restaurant with Drive Thru 13,675.35 13,675.35 13675.35
14,310.23 14310.23
51,868,870 51,868,87012,777,222 12,777,22241,778,876 41,778,876
General Light Industry 1,272.00 1,272.00 1272.00 3,713,618 3,713,618General Heavy Industry 14,310.23
General Office Building 7,496.50 7,496.50 7496.50General Office Building 4,724.10 4,724.10 4724.10
5,968.20 5968.20
17,914,782 17,914,78211,289,431 11,289,43114,262,523 14,262,523General Office Building 5,968.20
49 of 60
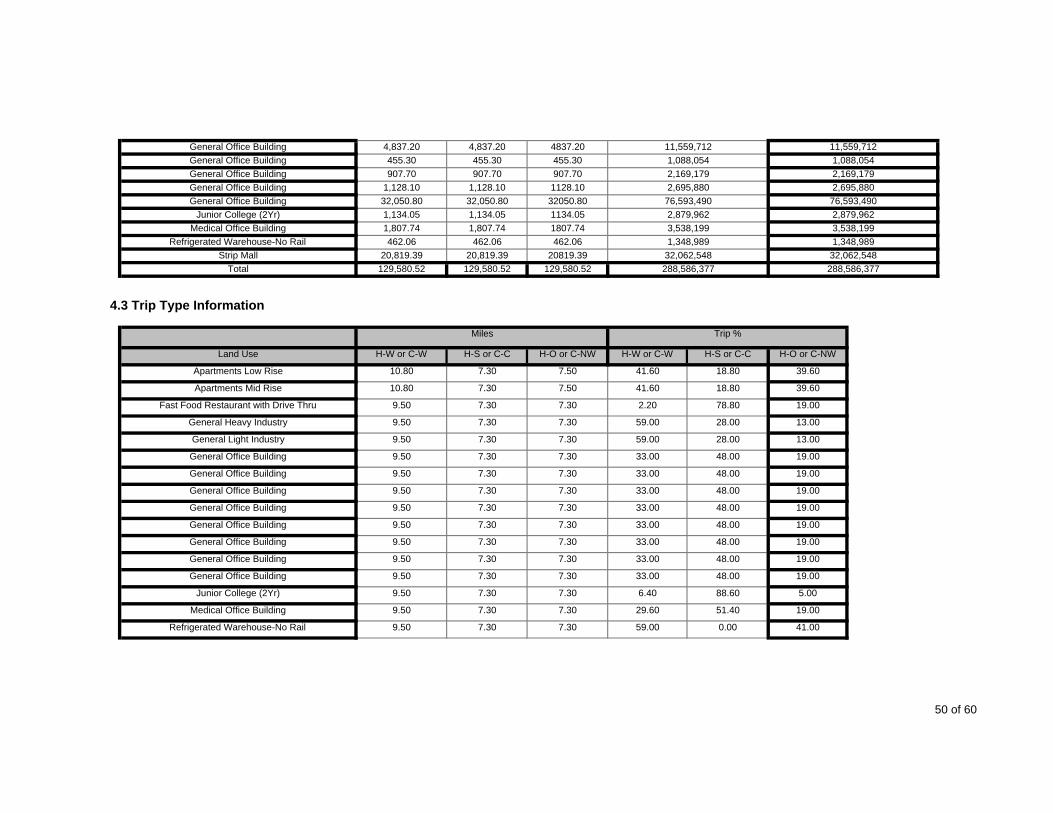
General Office Building 4,837.20 4,837.20 4837.20 11,559,712 11,559,712General Office Building 455.30 455.30 455.30General Office Building 907.70 907.70 907.70
1,128.10 1128.10
1,088,054 1,088,0542,169,179 2,169,1792,695,880 2,695,880
General Office Building 32,050.80 32,050.80 32050.80 76,593,490 76,593,490General Office Building 1,128.10
Junior College (2Yr) 1,134.05 1,134.05 1134.05Medical Office Building 1,807.74 1,807.74 1807.74
462.06 462.06
2,879,962 2,879,9623,538,199 3,538,1991,348,989 1,348,989
Strip Mall 20,819.39 20,819.39 20819.39 32,062,548 32,062,548Refrigerated Warehouse-No Rail 462.06
288,586,377 288,586,377
4.3 Trip Type Information
Miles Trip %
Total 129,580.52 129,580.52 129,580.52
Land Use H-W or C-W H-S or C-C H-O or C-NW H-W or C-W H-S or C-C H-O or C-NW
Apartments Low Rise 10.80 7.30 7.50 41.60 18.80 39.60
Apartments Mid Rise 10.80 7.30 7.50 41.60 18.80 39.60
Fast Food Restaurant with Drive Thru 9.50 7.30 7.30 2.20 78.80 19.00
General Heavy Industry 9.50 7.30 7.30 59.00 28.00 13.00
General Light Industry 9.50 7.30 7.30 59.00 28.00 13.00
General Office Building 9.50 7.30 7.30 33.00 48.00 19.00
General Office Building 9.50 7.30 7.30 33.00 48.00 19.00
General Office Building 9.50 7.30 7.30 33.00 48.00 19.00
General Office Building 9.50 7.30 7.30 33.00 48.00 19.00
General Office Building 9.50 7.30 7.30 33.00 48.00 19.00
General Office Building 9.50 7.30 7.30 33.00 48.00 19.00
General Office Building 9.50 7.30 7.30 33.00 48.00 19.00
General Office Building 9.50 7.30 7.30 33.00 48.00 19.00
Junior College (2Yr) 9.50 7.30 7.30 6.40 88.60 5.00
Medical Office Building 9.50 7.30 7.30 29.60 51.40 19.00
Refrigerated Warehouse-No Rail 9.50 7.30 7.30 59.00 0.00 41.00
50 of 60

Strip Mall 9.50 7.30 7.30 16.60 64.40 19.00
Exhaust PM10
PM10 Total
5.0 Energy Detail
5.1 Mitigation Measures Energy
PM2.5 Total
Bio- CO2ROG NOx CO SO2 Fugitive PM10
CO2e
Category tons/yr MT/yr
NBio- CO2 Total CO2 CH4 N2OFugitive PM2.5
Exhaust PM2.5
Electricity Mitigated 0.00 0.00 0.00 0.00 0.00 29,522.18 29,522.18 1.10 0.42 29,674.15
Electricity Unmitigated
0.00 0.00 0.00 0.00 0.00 29,522.18 29,522.18 1.10 0.42 29,674.15
NaturalGas Mitigated 0.72 6.41 4.73 0.04 0.00 0.50 0.00 0.50 0.00 7,093.11 7,093.11 0.14 0.13 7,136.27
NaturalGas Unmitigated
0.72 6.41 4.73 0.04 0.00 0.50 0.00 0.50 0.00 7,093.11 7,093.11 0.14 0.13 7,136.27
Total NA NA NA NA NA NA NA NA NA NA NA NA NA NA NA NA
5.2 Energy by Land Use - NaturalGas
Unmitigated
NaturalGas Use ROG NOx CO SO2 Fugitive PM10
Total CO2Exhaust PM10
PM10 Total Fugitive PM2.5
Exhaust PM2.5
CH4 N2O CO2e
Land Use kBTU tons/yr MT/yr
PM2.5 Total Bio- CO2 NBio- CO2
Apartments Low Rise
1.08338e+006 0.01 0.05 0.02 0.00 0.00 0.00 0.00 0.00 0.00 57.81 57.81 0.00 0.00 58.17
Apartments Mid Rise 3.33049e+007 0.18 1.53 0.65 0.01 0.00 0.12 0.00 0.12 0.00 1,777.28 1,777.28 0.03 0.03 1,788.09
51 of 60
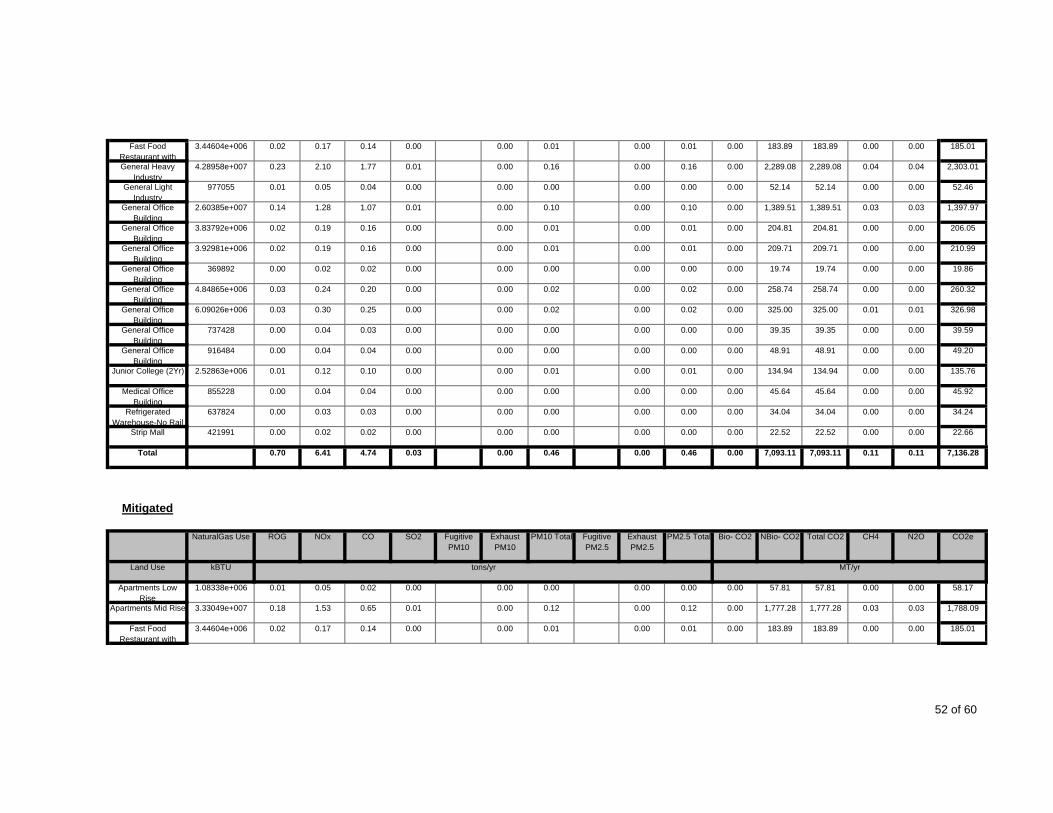
Fast Food Restaurant with
3.44604e+006 0.02 0.17 0.14 0.00 0.00 0.01 0.00 0.01 0.00 183.89 183.89 0.00 0.00 185.01
General Heavy Industry
4.28958e+007 0.23 2.10 1.77 0.01 0.00 0.16 0.00 0.16 0.00 2,289.08 2,289.08 0.04 0.04 2,303.01
General Light Industry
977055 0.01 0.05 0.04 0.00 0.00 0.00 0.00 0.00 0.00 52.14 52.14 0.00 0.00 52.46
General Office Building
2.60385e+007 0.14 1.28 1.07 0.01 0.00 0.10 0.00 0.10 0.00 1,389.51 1,389.51 0.03 0.03 1,397.97
General Office Building
3.83792e+006 0.02 0.19 0.16 0.00 0.00 0.01 0.00 0.01 0.00 204.81 204.81 0.00 0.00 206.05
General Office Building
3.92981e+006 0.02 0.19 0.16 0.00 0.00 0.01 0.00 0.01 0.00 209.71 209.71 0.00 0.00 210.99
General Office Building
369892 0.00 0.02 0.02 0.00 0.00 0.00 0.00 0.00 0.00 19.74 19.74 0.00 0.00 19.86
General Office Building
4.84865e+006 0.03 0.24 0.20 0.00 0.00 0.02 0.00 0.02 0.00 258.74 258.74 0.00 0.00 260.32
General Office Building
6.09026e+006 0.03 0.30 0.25 0.00 0.00 0.02 0.00 0.02 0.00 325.00 325.00 0.01 0.01 326.98
General Office Building
737428 0.00 0.04 0.03 0.00 0.00 0.00 0.00 0.00 0.00 39.35 39.35 0.00 0.00 39.59
General Office Building
916484 0.00 0.04 0.04 0.00 0.00 0.00 0.00 0.00 0.00 48.91 48.91 0.00 0.00 49.20
Junior College (2Yr) 2.52863e+006 0.01 0.12 0.10 0.00 0.00 0.01 0.00 0.01 0.00 134.94 134.94 0.00 0.00 135.76
Medical Office Building
855228 0.00 0.04 0.04 0.00 0.00 0.00 0.00 0.00 0.00 45.64 45.64 0.00 0.00 45.92
Refrigerated Warehouse-No Rail
637824 0.00 0.03 0.03 0.00 0.00 0.00 0.00 0.00 0.00 34.04 34.04 0.00 0.00 34.24
Strip Mall 421991 0.00 0.02 0.02 0.00 0.00 0.00 0.00 0.00
4.74 0.03 0.00Total 0.70 6.41 0.00 0.46
0.00 22.660.00 22.52 22.52 0.00
0.11 7,136.28
Mitigated
0.00 7,093.11 7,093.11 0.110.46
NaturalGas Use ROG NOx CO SO2 Fugitive PM10
Exhaust PM10
PM10 Total Fugitive PM2.5
Exhaust PM2.5
PM2.5 Total N2O CO2e
Land Use kBTU tons/yr MT/yr
Bio- CO2 NBio- CO2 Total CO2 CH4
Apartments Low Rise
1.08338e+006 0.01 0.05 0.02 0.00 0.00 0.00 0.00 0.00 0.00 57.81 57.81 0.00 0.00 58.17
Apartments Mid Rise 3.33049e+007 0.18 1.53 0.65 0.01 0.00 0.12 0.00 0.12 0.00 1,777.28 1,777.28 0.03 0.03 1,788.09
Fast Food Restaurant with
3.44604e+006 0.02 0.17 0.14 0.00 0.00 0.01 0.00 0.01 0.00 183.89 183.89 0.00 0.00 185.01
52 of 60

General Heavy Industry
4.28958e+007 0.23 2.10 1.77 0.01 0.00 0.16 0.00 0.16 0.00 2,289.08 2,289.08 0.04 0.04 2,303.01
General Light Industry
977055 0.01 0.05 0.04 0.00 0.00 0.00 0.00 0.00 0.00 52.14 52.14 0.00 0.00 52.46
General Office Building
2.60385e+007 0.14 1.28 1.07 0.01 0.00 0.10 0.00 0.10 0.00 1,389.51 1,389.51 0.03 0.03 1,397.97
General Office Building
3.83792e+006 0.02 0.19 0.16 0.00 0.00 0.01 0.00 0.01 0.00 204.81 204.81 0.00 0.00 206.05
General Office Building
3.92981e+006 0.02 0.19 0.16 0.00 0.00 0.01 0.00 0.01 0.00 209.71 209.71 0.00 0.00 210.99
General Office Building
369892 0.00 0.02 0.02 0.00 0.00 0.00 0.00 0.00 0.00 19.74 19.74 0.00 0.00 19.86
General Office Building
4.84865e+006 0.03 0.24 0.20 0.00 0.00 0.02 0.00 0.02 0.00 258.74 258.74 0.00 0.00 260.32
General Office Building
6.09026e+006 0.03 0.30 0.25 0.00 0.00 0.02 0.00 0.02 0.00 325.00 325.00 0.01 0.01 326.98
General Office Building
737428 0.00 0.04 0.03 0.00 0.00 0.00 0.00 0.00 0.00 39.35 39.35 0.00 0.00 39.59
General Office Building
916484 0.00 0.04 0.04 0.00 0.00 0.00 0.00 0.00 0.00 48.91 48.91 0.00 0.00 49.20
Junior College (2Yr) 2.52863e+006 0.01 0.12 0.10 0.00 0.00 0.01 0.00 0.01 0.00 134.94 134.94 0.00 0.00 135.76
Medical Office Building
855228 0.00 0.04 0.04 0.00 0.00 0.00 0.00 0.00 0.00 45.64 45.64 0.00 0.00 45.92
Refrigerated Warehouse-No Rail
637824 0.00 0.03 0.03 0.00 0.00 0.00 0.00 0.00 0.00 34.04 34.04 0.00 0.00 34.24
Strip Mall 421991 0.00 0.02 0.02 0.00 0.00 0.00 0.00 0.00
4.74 0.03 0.00Total 0.70 6.41 0.00 0.46
0.00 22.660.00 22.52 22.52 0.00
0.11 7,136.28
5.3 Energy by Land Use - Electricity
Unmitigated
0.00 7,093.11 7,093.11 0.110.46
Electricity Use ROG NOx N2O CO2e
Land Use kWh tons/yr MT/yr
CO SO2 Total CO2 CH4
Apartments Low Rise
217822 77.14 0.00 0.00 77.54
Apartments Mid Rise 1.05963e+007 3,752.81 0.14 0.05 3,772.12
Fast Food Restaurant with
829725 293.86 0.01 0.00 295.37
General Heavy Industry
3.2739e+007 11,594.86 0.43 0.16 11,654.54
53 of 60
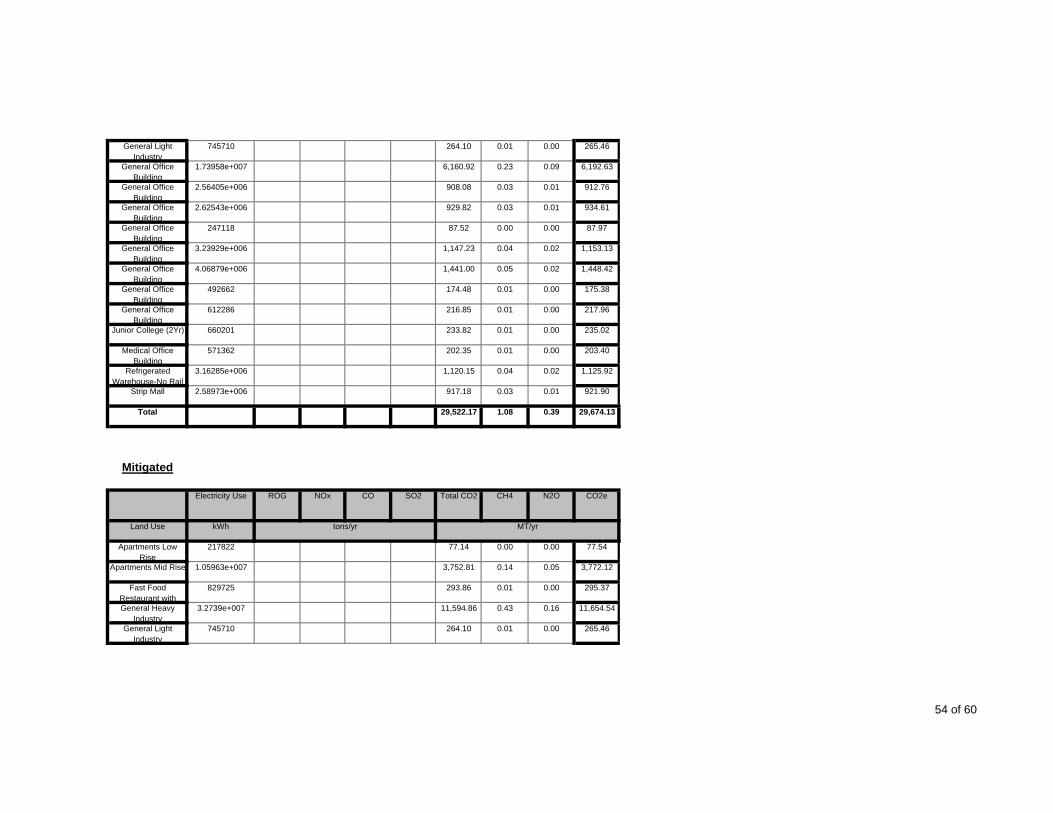
General Light Industry
745710 264.10 0.01 0.00 265.46
General Office Building
1.73958e+007 6,160.92 0.23 0.09 6,192.63
General Office Building
2.56405e+006 908.08 0.03 0.01 912.76
General Office Building
2.62543e+006 929.82 0.03 0.01 934.61
General Office Building
247118 87.52 0.00 0.00 87.97
General Office Building
3.23929e+006 1,147.23 0.04 0.02 1,153.13
General Office Building
4.06879e+006 1,441.00 0.05 0.02 1,448.42
General Office Building
492662 174.48 0.01 0.00 175.38
General Office Building
612286 216.85 0.01 0.00 217.96
Junior College (2Yr) 660201 233.82 0.01 0.00 235.02
Medical Office Building
571362 202.35 0.01 0.00 203.40
Refrigerated Warehouse-No Rail
3.16285e+006 1,120.15 0.04 0.02 1,125.92
Strip Mall 2.58973e+006 917.18 0.03 0.01 921.90
Total 29,522.17 1.08 0.39 29,674.13
Mitigated
Electricity Use ROG NOx N2O CO2e
Land Use kWh tons/yr MT/yr
CO SO2 Total CO2 CH4
Apartments Low Rise
217822 77.14 0.00 0.00 77.54
Apartments Mid Rise 1.05963e+007 3,752.81 0.14 0.05 3,772.12
Fast Food Restaurant with
829725 293.86 0.01 0.00 295.37
General Heavy Industry
3.2739e+007 11,594.86 0.43 0.16 11,654.54
General Light Industry
745710 264.10 0.01 0.00 265.46
54 of 60

General Office Building
1.73958e+007 6,160.92 0.23 0.09 6,192.63
General Office Building
2.56405e+006 908.08 0.03 0.01 912.76
General Office Building
2.62543e+006 929.82 0.03 0.01 934.61
General Office Building
247118 87.52 0.00 0.00 87.97
General Office Building
3.23929e+006 1,147.23 0.04 0.02 1,153.13
General Office Building
4.06879e+006 1,441.00 0.05 0.02 1,448.42
General Office Building
492662 174.48 0.01 0.00 175.38
General Office Building
612286 216.85 0.01 0.00 217.96
Junior College (2Yr) 660201 233.82 0.01 0.00 235.02
Medical Office Building
571362 202.35 0.01 0.00 203.40
Refrigerated Warehouse-No Rail
3.16285e+006 1,120.15 0.04 0.02 1,125.92
Strip Mall 2.58973e+006 917.18 0.03 0.01 921.90
Total 29,522.17 1.08 0.39 29,674.13
6.0 Area Detail
6.1 Mitigation Measures Area
ROG NOx CO PM2.5 Total
Bio- CO2SO2 Fugitive PM10
Exhaust PM10
PM10 Total CO2e
Category tons/yr MT/yr
NBio- CO2 Total CO2 CH4 N2OFugitive PM2.5
Exhaust PM2.5
55 of 60
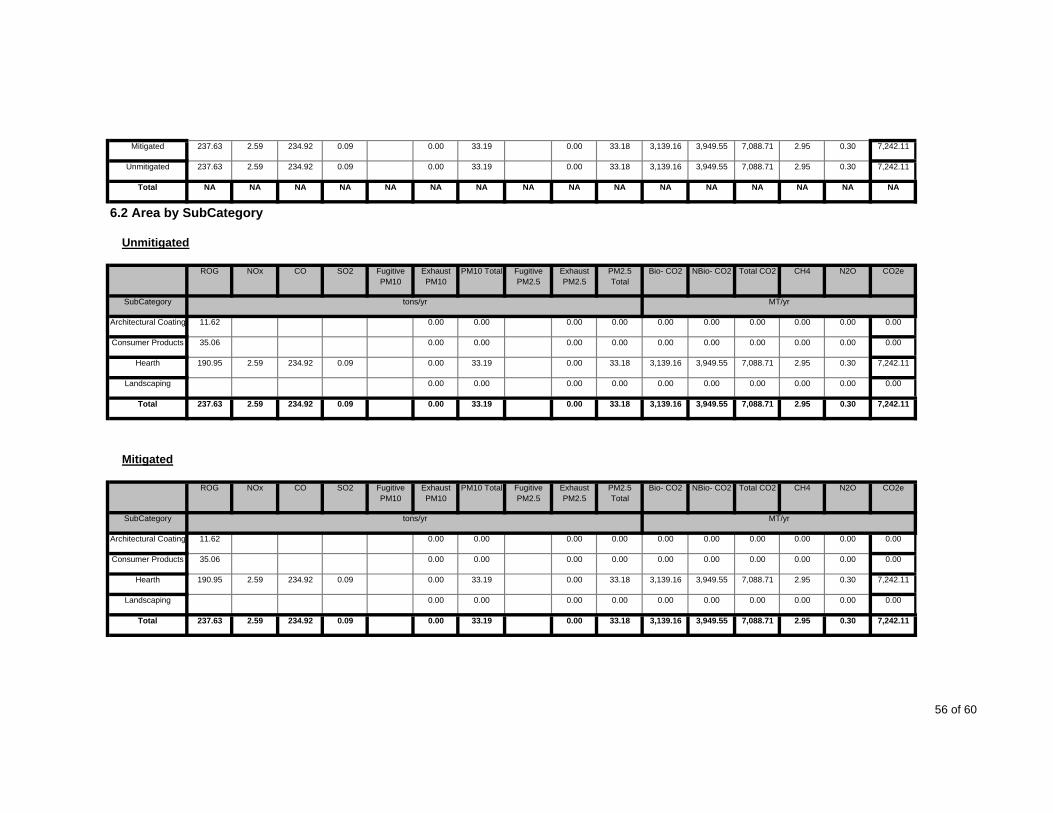
Mitigated 237.63 2.59 234.92 0.09 0.00 33.19 0.00 33.18 3,139.16 3,949.55 7,088.71 2.95 0.30 7,242.11
Unmitigated 237.63 2.59 234.92 0.09 0.00 33.19 0.00 33.18 3,139.16 3,949.55 7,088.71 2.95 0.30 7,242.11
Total NA NA NA NA NA NANA NA NA NA
SO2 Fugitive PM10
Exhaust PM10
NANA NA NA NA
Fugitive PM2.5
Exhaust PM2.5
PM2.5 Total
NA
6.2 Area by SubCategory
Unmitigated
ROG NOx CO N2O CO2e
SubCategory tons/yr MT/yr
Bio- CO2 NBio- CO2 Total CO2 CH4PM10 Total
Architectural Coating 11.62 0.00 0.00 0.00 0.00 0.00 0.00 0.00 0.00 0.00 0.00
Consumer Products 35.06 0.00 0.00 0.00 0.00 0.00 0.00 0.00 0.00 0.00 0.00
Hearth 190.95 2.59 234.92 0.09 0.00 33.19 0.00 33.18 3,139.16 3,949.55 7,088.71 2.95 0.30 7,242.11
Landscaping 0.00 0.00 0.00 0.00 0.00 0.00 0.00 0.00 0.00 0.00
Total 237.63 2.59 234.92 7,088.71 2.95 0.300.00 33.18 3,139.16
SO2 Fugitive PM10
Exhaust PM10
3,949.550.09 0.00 33.19
Fugitive PM2.5
Exhaust PM2.5
PM2.5 Total
7,242.11
Mitigated
ROG NOx CO N2O CO2e
SubCategory tons/yr MT/yr
Bio- CO2 NBio- CO2 Total CO2 CH4PM10 Total
Architectural Coating 11.62 0.00 0.00 0.00 0.00 0.00 0.00 0.00 0.00 0.00 0.00
Consumer Products 35.06 0.00 0.00 0.00 0.00 0.00 0.00 0.00 0.00 0.00 0.00
Hearth 190.95 2.59 234.92 0.09 0.00 33.19 0.00 33.18 3,139.16 3,949.55 7,088.71 2.95 0.30 7,242.11
Landscaping 0.00 0.00 0.00 0.00 0.00 0.00 0.00 0.00 0.00 0.00
Total 237.63 2.59 234.92 33.18 3,139.160.09 0.00 33.19 7,242.113,949.55 7,088.71 2.95 0.300.00
56 of 60

7.0 Water Detail
7.1 Mitigation Measures Water
Apply Water Conservation Strategy
ROG NOx CO SO2 Total CO2 CH4 N2O CO2e
Category tons/yr MT/yr
Mitigated 69,812.13 456.19 12.23 83,183.46
Unmitigated 87,265.16 570.23 15.29 103,979.33
Total NA NA NA NA NA NA NA NA
7.2 Water by Land Use
Unmitigated
Indoor/Outdoor Use
ROG NOx CO SO2 Total CO2 CH4 N2O CO2e
Land Use Mgal tons/yr MT/yr
Apartments Low Rise
3.9744 / 2.5056 28.23 0.12 0.00 31.86
Apartments Mid Rise 194.029 / 122.322 1,378.25 5.97 0.17 1,555.24
Fast Food Restaurant with
5.91891 / 0.377803
28.85 0.18 0.00 34.18
General Heavy Industry
17161.6 / 0 79,333.55 526.79 14.11 94,769.06
General Light Industry
390.897 / 0 1,807.01 12.00 0.32 2,158.59
57 of 60

General Office Building
352.819 / 216.244 2,481.85 10.86 0.30 2,803.56
Junior College (2Yr) 3.00671 / 4.7028 32.40 0.09 0.00 35.20
Medical Office Building
4.55494 / 0.867608
24.47 0.14 0.00 28.58
Refrigerated Warehouse-No Rail
445.475 / 0 2,059.31 13.67 0.37 2,459.98
Strip Mall 12.9701 / 7.94942 91.24 0.40 0.01 103.06
Total 87,265.16 570.22 15.28 103,979.31
Mitigated
Indoor/Outdoor Use
ROG NOx N2O CO2e
Land Use Mgal tons/yr MT/yr
CO SO2 Total CO2 CH4
Apartments Low Rise
3.17952 / 2.00448 22.59 0.10 0.00 25.49
Apartments Mid Rise 155.223 / 97.8579 1,102.60 4.78 0.13 1,244.19
Fast Food Restaurant with
4.73513 / 0.302242
23.08 0.15 0.00 27.34
General Heavy Industry
13729.3 / 0 63,466.84 421.43 11.29 75,815.25
General Light Industry
312.717 / 0 1,445.61 9.60 0.26 1,726.88
General Office Building
282.255 / 172.995 1,985.48 8.69 0.24 2,242.85
Junior College (2Yr) 2.40536 / 3.76224 25.92 0.07 0.00 28.16
Medical Office Building
3.64395 / 0.694087
19.58 0.11 0.00 22.87
Refrigerated Warehouse-No Rail
356.38 / 0 1,647.45 10.94 0.29 1,967.99
Strip Mall 10.3761 / 6.35953 72.99 0.32 0.01 82.45
Total 69,812.14 456.19 12.22 83,183.47
8.0 Waste Detail
58 of 60

NOx CO
8.1 Mitigation Measures Waste
Category/Year
CO2e
tons/yr MT/yr
SO2 Total CO2 CH4 N2OROG
Mitigated 6,336.39 374.47 0.00 14,200.26
Unmitigated 6,336.39 374.47 0.00 14,200.26
Total NA NA NA NA NA NA NA NA
8.2 Waste by Land Use
Unmitigated
Waste Disposed ROG NOx CO SO2 Total CO2 CH4 N2O CO2e
Land Use tons tons/yr MT/yr
Apartments Low Rise
28.06 5.70 0.34 0.00 12.76
Apartments Mid Rise 1369.88 278.07 16.43 0.00 623.18
Fast Food Restaurant with
224.62 45.60 2.69 0.00 102.18
General Heavy Industry
21487.2 4,361.70 257.77 0.00 9,774.85
General Light Industry
4625.21 938.88 55.49 0.00 2,104.08
General Office Building
1846.14 374.75 22.15 0.00 839.84
Junior College (2Yr) 79.69 16.18 0.96 0.00 36.25
59 of 60
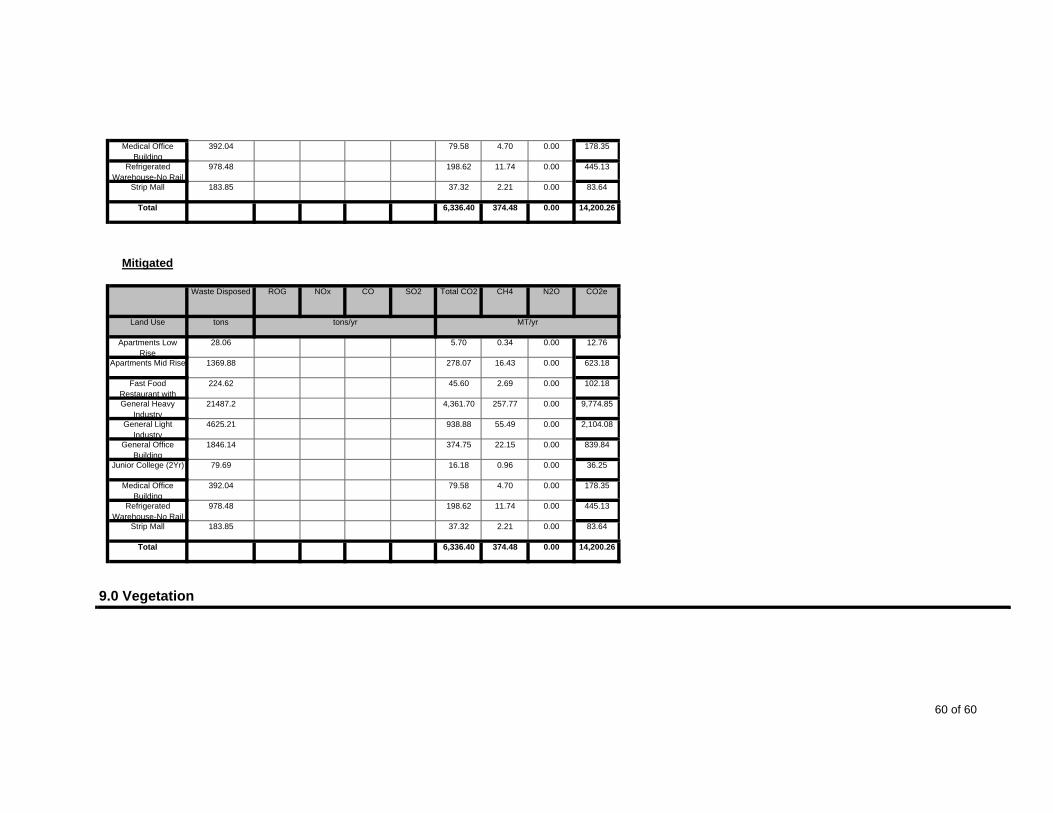
Medical Office Building
392.04 79.58 4.70 0.00 178.35
Refrigerated Warehouse-No Rail
978.48 198.62 11.74 0.00 445.13
Strip Mall 183.85 37.32 2.21 0.00 83.64
Total 6,336.40 374.48 0.00 14,200.26
Mitigated
Waste Disposed ROG NOx N2O CO2e
Land Use tons tons/yr MT/yr
CO SO2 Total CO2 CH4
Apartments Low Rise
28.06 5.70 0.34 0.00 12.76
Apartments Mid Rise 1369.88 278.07 16.43 0.00 623.18
Fast Food Restaurant with
224.62 45.60 2.69 0.00 102.18
General Heavy Industry
21487.2 4,361.70 257.77 0.00 9,774.85
General Light Industry
4625.21 938.88 55.49 0.00 2,104.08
General Office Building
1846.14 374.75 22.15 0.00 839.84
Junior College (2Yr) 79.69 16.18 0.96 0.00 36.25
Medical Office Building
392.04 79.58 4.70 0.00 178.35
Refrigerated Warehouse-No Rail
978.48 198.62 11.74 0.00 445.13
Strip Mall 183.85 37.32 2.21 0.00 83.64
Total 6,336.40 374.48 0.00 14,200.26
9.0 Vegetation
60 of 60
WITH GHG REDUCTIONS - ALTERNATIVE 1

CalEEMod Version: CalEEMod.2011.1.1 Date: 6/15/2011
Barrio Logan Alternative 1 2030 - No ChangeSan Diego County APCD Air District, Annual
1.0 Project Characteristics
1.1 Land Usage
Land Uses Size Metric
General Office Building 8.71 1000sqft
General Office Building 222.16 1000sqft
General Office Building 26.14 1000sqft
Government Office Building 110 1000sqft
Medical Office Building 76.4 1000sqft
Elementary School 529 Student
Junior College (2Yr) 8.7 1000sqft
City Park 9.1 Acre
Apartments Mid Rise 532 Dwelling Unit
Single Family Housing 69 Dwelling Unit
1.2 Other Project CharacteristicsUtility Company San Diego Gas & ElectricUrbanization Urban Wind Speed (m/s)
Climate Zone 13 2.6
Precipitation Freq (Days)
1 of 28

1.3 User Entered Comments 40
Project Characteristics -
Land Use - The du/acre in the Proposed Barrio Logan Community Plan is 14 du/acre for single family.
Architectural Coating - Based on SDAPCD VOC content limits.
Vehicle Trips - daily trips based on Traffic Impact Analysis
Area Coating - Based on SDAPCD VOC content limits.
Energy Use - Prior to 2008 Building Energy Efficiency Standards.
2.0 Emissions Summary
2.1 Overall Construction
Unmitigated Construction
ROG NOx CO PM2.5 Total
Bio- CO2SO2 Fugitive PM10
Exhaust PM10
PM10 Total CO2e
Year tons/yr MT/yr
NBio- CO2 Total CO2 CH4 N2OFugitive PM2.5
Exhaust PM2.5
2011 1.58 11.33 8.72 0.01 1.02 0.59 1.60 0.29 0.58 0.87 0.00 1,321.53 1,321.53 0.13 0.00 1,324.20
2012 1.52 8.83 10.60 0.02 1.00 0.48 1.49 0.02 0.47 0.49 0.00 1,627.02 1,627.02 0.12 0.00 1,629.55
2013 1.40 8.17 9.97 0.02 1.00 0.44 1.44 0.02 0.43 0.45 0.00 1,613.41 1,613.41 0.11 0.00 1,615.74
2014 16.74 4.25 4.90 0.01 0.48 0.26 0.73 0.01 0.25 0.26 0.00 803.51 803.51 0.06 0.00 804.75
Total 21.24 32.58 34.19 5,365.47 0.42 0.000.34 1.73 2.07 0.00
SO2 Fugitive PM10
Exhaust PM10
5,365.470.06 3.50 1.77 5.26
Fugitive PM2.5
Exhaust PM2.5
PM2.5 Total
5,374.24
Mitigated Construction
ROG NOx CO N2O CO2eBio- CO2 NBio- CO2 Total CO2 CH4PM10 Total
2 of 28

Year tons/yr MT/yr
2011 1.58 11.33 8.72 0.01 0.62 0.59 1.20 0.29 0.58 0.87 0.00 1,321.53 1,321.53 0.13 0.00 1,324.20
2012 1.52 8.83 10.60 0.02 0.05 0.48 0.53 0.02 0.47 0.49 0.00 1,627.02 1,627.02 0.12 0.00 1,629.55
2013 1.40 8.17 9.97 0.02 0.05 0.44 0.49 0.02 0.43 0.45 0.00 1,613.41 1,613.41 0.11 0.00 1,615.74
2014 16.74 4.25 4.90 0.01 0.02 0.26 0.28 0.01 0.25 0.26 0.00 803.51 803.51 0.06 0.00 804.75
Total 21.24 32.58 34.19 5,365.47 0.42 0.000.34 1.73 2.07 0.00
SO2 Fugitive PM10
Exhaust PM10
5,365.470.06 0.74 1.77 2.50
Fugitive PM2.5
Exhaust PM2.5
PM2.5 Total
5,374.24
2.2 Overall Operational
Unmitigated Operational
ROG NOx CO N2O CO2e
Category tons/yr MT/yr
Bio- CO2 NBio- CO2 Total CO2 CH4PM10 Total
Area 44.00 0.56 50.96 0.02 0.00 6.59 0.00 6.59 620.81 788.45 1,409.25 0.59 0.06 1,439.74
Energy 0.11 0.95 0.63 0.01 0.00 0.07 0.00 0.07 0.00 4,498.76 4,498.76 0.15 0.07 4,522.91
Mobile 7.80 13.94 65.07 0.20 19.90 1.02 20.92 0.32 0.98 1.30 0.00 13,576.23 13,576.23 0.51 0.00 13,586.85
Waste 0.00 0.00 0.00 0.00 324.90 0.00 324.90 19.20 0.00 728.12
Water 0.00 0.00 0.00 0.00 0.00 870.86 870.86 3.63 0.10 978.65
Total 51.91 15.45 116.66 0.23 19.90 1.02 27.58 0.32 0.23 21,256.270.98 7.96 945.71 19,734.30
Exhaust PM10
PM10 Total
20,680.00 24.08
PM2.5 Total
Bio- CO2
Mitigated Operational
ROG NOx CO SO2 Fugitive PM10
CO2e
Category tons/yr MT/yr
NBio- CO2 Total CO2 CH4 N2OFugitive PM2.5
Exhaust PM2.5
3 of 28

Area 44.00 0.56 50.96 0.02 0.00 6.59 0.00 6.59 620.81 788.45 1,409.25 0.59 0.06 1,439.74
Energy 0.11 0.95 0.63 0.01 0.00 0.07 0.00 0.07 0.00 4,498.76 4,498.76 0.15 0.07 4,522.91
Mobile 7.80 13.94 65.07 0.20 19.90 1.02 20.92 0.32 0.98 1.30 0.00 13,576.23 13,576.23 0.51 0.00 13,586.85
Waste 0.00 0.00 0.00 0.00 324.90 0.00 324.90 19.20 0.00 728.12
Water 0.00 0.00 0.00 0.00 0.00 870.86 870.86 3.63 0.10 978.65
Total 51.91 15.45 116.66 0.23 19.90 1.02 27.58 0.32 0.98 7.96 945.71 19,734.30 20,680.00 24.08 0.23 21,256.27
3.0 Construction Detail
3.1 Mitigation Measures Construction
3.2 Demolition - 2011
Unmitigated Construction On-Site
4 of 28

SO2 Fugitive PM10
Exhaust PM10
Fugitive PM2.5
Exhaust PM2.5
PM2.5 Total
ROG NOx CO N2O CO2e
Category tons/yr MT/yr
Bio- CO2 NBio- CO2 Total CO2 CH4PM10 Total
Off-Road 0.25 2.00 1.15 0.00 0.10 0.10 0.10 0.10 0.00 170.30 170.30 0.02 0.00 170.72
Total 0.25 2.00 1.15 0.00 0.10 0.10 0.00 170.720.10 0.10 0.00 170.30
Exhaust PM10
PM10 Total
170.30 0.02
PM2.5 Total
Bio- CO2
Unmitigated Construction Off-Site
ROG NOx CO SO2 Fugitive PM10
CO2e
Category tons/yr MT/yr
NBio- CO2 Total CO2 CH4 N2OFugitive PM2.5
Exhaust PM2.5
Hauling 0.00 0.00 0.00 0.00 0.00 0.00 0.00 0.00 0.00 0.00 0.00 0.00 0.00 0.00 0.00 0.00
Vendor 0.00 0.00 0.00 0.00 0.00 0.00 0.00 0.00 0.00 0.00 0.00 0.00 0.00 0.00 0.00 0.00
Worker 0.00 0.00 0.03 0.00 0.00 0.00 0.00 0.00 0.00 0.00 0.00 3.49 3.49 0.00 0.00 3.50
Total 0.00 0.00 0.03 0.00 0.00 0.00 0.00 0.00 0.00 3.500.00 0.00 0.00 3.49
Exhaust PM10
PM10 Total
3.49 0.00
PM2.5 Total
Bio- CO2
Mitigated Construction On-Site
ROG NOx CO SO2 Fugitive PM10
CO2e
Category tons/yr MT/yr
NBio- CO2 Total CO2 CH4 N2OFugitive PM2.5
Exhaust PM2.5
Off-Road 0.25 2.00 1.15 0.00 0.10 0.10 0.10 0.10 0.00 170.30 170.30 0.02 0.00 170.72
Total 0.25 2.00 1.15 0.00 0.10 0.10 0.00 170.720.10 0.10 0.00 170.30 170.30 0.02
5 of 28

Exhaust PM10
PM10 Total PM2.5 Total
Bio- CO2
Mitigated Construction Off-Site
ROG NOx CO SO2 Fugitive PM10
CO2e
Category tons/yr MT/yr
NBio- CO2 Total CO2 CH4 N2OFugitive PM2.5
Exhaust PM2.5
Hauling 0.00 0.00 0.00 0.00 0.00 0.00 0.00 0.00 0.00 0.00 0.00 0.00 0.00 0.00 0.00 0.00
Vendor 0.00 0.00 0.00 0.00 0.00 0.00 0.00 0.00 0.00 0.00 0.00 0.00 0.00 0.00 0.00 0.00
Worker 0.00 0.00 0.03 0.00 0.00 0.00 0.00 0.00 0.00 0.00 0.00 3.49 3.49 0.00 0.00 3.50
Total 0.00 0.00 0.03 0.00 0.00 0.00 0.00 0.00 0.00 3.500.00 0.00 0.00 3.49
Exhaust PM10
PM10 Total
3.49 0.00
PM2.5 Total
Bio- CO2
3.3 Site Preparation - 2011
Unmitigated Construction On-Site
ROG NOx CO SO2 Fugitive PM10
CO2e
Category tons/yr MT/yr
NBio- CO2 Total CO2 CH4 N2OFugitive PM2.5
Exhaust PM2.5
Fugitive Dust 0.27 0.00 0.27 0.15 0.00 0.15 0.00 0.00 0.00 0.00 0.00 0.00
Off-Road 0.16 1.35 0.76 0.00 0.07 0.07 0.07 0.07 0.00 108.80 108.80 0.01 0.00 109.08
Total 0.16 1.35 0.76 108.80 0.01 0.000.15 0.07 0.22 0.00
SO2 Fugitive PM10
Exhaust PM10
108.800.00 0.27 0.07 0.34
Fugitive PM2.5
Exhaust PM2.5
PM2.5 Total
109.08
Unmitigated Construction Off-Site
ROG NOx CO N2O CO2e
Category tons/yr MT/yr
Bio- CO2 NBio- CO2 Total CO2 CH4PM10 Total
Hauling 0.00 0.00 0.00 0.00 0.00 0.00 0.00 0.00 0.00 0.00 0.00 0.00 0.00 0.00 0.00 0.00
Vendor 0.00 0.00 0.00 0.00 0.00 0.00 0.00 0.00 0.00 0.00 0.00 0.00 0.00 0.00 0.00 0.00
6 of 28
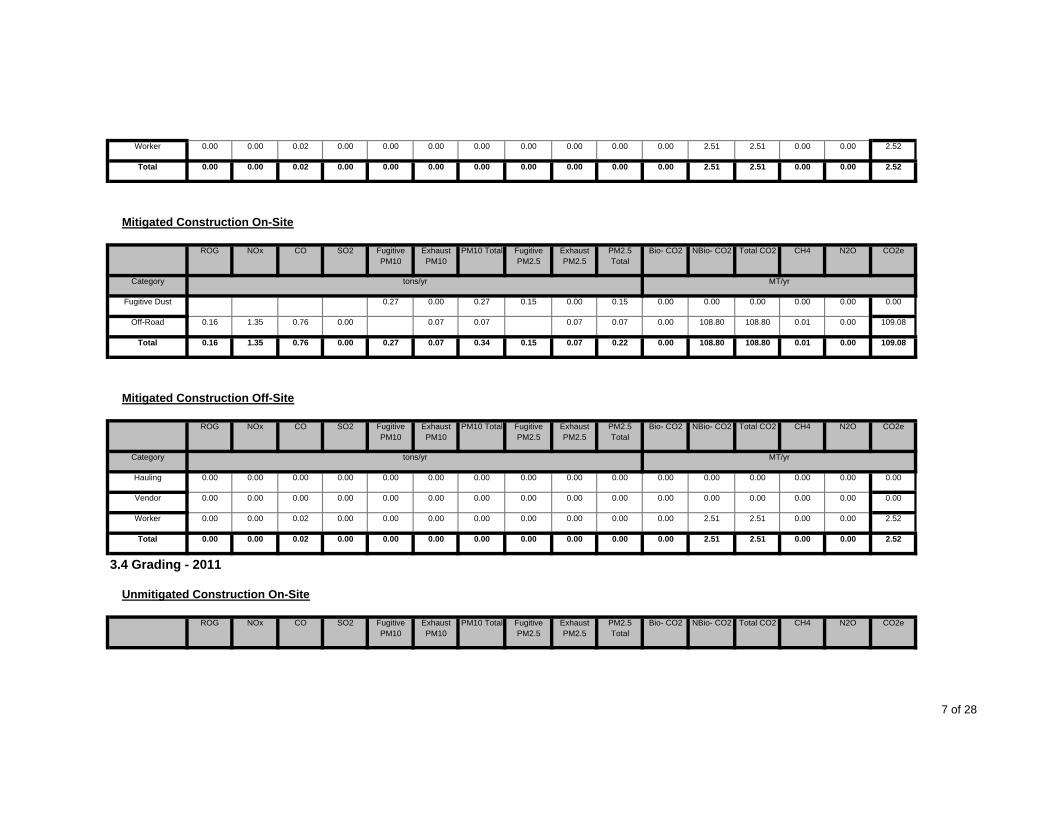
Worker 0.00 0.00 0.02 0.00 0.00 0.00 0.00 0.00 0.00 0.00 0.00 2.51 2.51 0.00 0.00 2.52
Total 0.00 0.00 0.02 0.00 0.00 0.00 0.00 0.00 0.00 2.520.00 0.00 0.00 2.51
Exhaust PM10
PM10 Total
2.51 0.00
PM2.5 Total
Bio- CO2
Mitigated Construction On-Site
ROG NOx CO SO2 Fugitive PM10
CO2e
Category tons/yr MT/yr
NBio- CO2 Total CO2 CH4 N2OFugitive PM2.5
Exhaust PM2.5
Fugitive Dust 0.27 0.00 0.27 0.15 0.00 0.15 0.00 0.00 0.00 0.00 0.00 0.00
Off-Road 0.16 1.35 0.76 0.00 0.07 0.07 0.07 0.07 0.00 108.80 108.80 0.01 0.00 109.08
Total 0.16 1.35 0.76 108.80 0.01 0.000.15 0.07 0.22 0.00
SO2 Fugitive PM10
Exhaust PM10
108.800.00 0.27 0.07 0.34
Fugitive PM2.5
Exhaust PM2.5
PM2.5 Total
109.08
Mitigated Construction Off-Site
ROG NOx CO N2O CO2e
Category tons/yr MT/yr
Bio- CO2 NBio- CO2 Total CO2 CH4PM10 Total
Hauling 0.00 0.00 0.00 0.00 0.00 0.00 0.00 0.00 0.00 0.00 0.00 0.00 0.00 0.00 0.00 0.00
Vendor 0.00 0.00 0.00 0.00 0.00 0.00 0.00 0.00 0.00 0.00 0.00 0.00 0.00 0.00 0.00 0.00
Worker 0.00 0.00 0.02 0.00 0.00 0.00 0.00 0.00 0.00 0.00 0.00 2.51 2.51 0.00 0.00 2.52
Total 0.00 0.00 0.02 0.00 0.00 0.00 0.00 0.00 0.00 2.520.00 0.00 0.00 2.51
Exhaust PM10
PM10 Total
2.51 0.00
PM2.5 Total
Bio- CO2
3.4 Grading - 2011
Unmitigated Construction On-Site
ROG NOx CO SO2 Fugitive PM10
CO2eNBio- CO2 Total CO2 CH4 N2OFugitive PM2.5
Exhaust PM2.5
7 of 28

Category tons/yr MT/yr
Fugitive Dust 0.33 0.00 0.33 0.13 0.00 0.13 0.00 0.00 0.00 0.00 0.00 0.00
Off-Road 0.49 4.15 2.16 0.00 0.20 0.20 0.20 0.20 0.00 369.24 369.24 0.04 0.00 370.08
Total 0.49 4.15 2.16 369.24 0.04 0.000.13 0.20 0.33 0.00
SO2 Fugitive PM10
Exhaust PM10
369.240.00 0.33 0.20 0.53
Fugitive PM2.5
Exhaust PM2.5
PM2.5 Total
370.08
Unmitigated Construction Off-Site
ROG NOx CO N2O CO2e
Category tons/yr MT/yr
Bio- CO2 NBio- CO2 Total CO2 CH4PM10 Total
Hauling 0.00 0.00 0.00 0.00 0.00 0.00 0.00 0.00 0.00 0.00 0.00 0.00 0.00 0.00 0.00 0.00
Vendor 0.00 0.00 0.00 0.00 0.00 0.00 0.00 0.00 0.00 0.00 0.00 0.00 0.00 0.00 0.00 0.00
Worker 0.01 0.01 0.06 0.00 0.01 0.00 0.01 0.00 0.00 0.00 0.00 6.98 6.98 0.00 0.00 6.99
Total 0.01 0.01 0.06 0.00 0.01 0.00 0.01 0.00 0.00 6.990.00 0.00 0.00 6.98
Exhaust PM10
PM10 Total
6.98 0.00
PM2.5 Total
Bio- CO2
Mitigated Construction On-Site
ROG NOx CO SO2 Fugitive PM10
CO2e
Category tons/yr MT/yr
NBio- CO2 Total CO2 CH4 N2OFugitive PM2.5
Exhaust PM2.5
Fugitive Dust 0.33 0.00 0.33 0.13 0.00 0.13 0.00 0.00 0.00 0.00 0.00 0.00
Off-Road 0.49 4.15 2.16 0.00 0.20 0.20 0.20 0.20 0.00 369.24 369.24 0.04 0.00 370.08
Total 0.49 4.15 2.16 369.24 0.04 0.000.13 0.20 0.33 0.00 369.240.00 0.33 0.20 0.53 370.08
Mitigated Construction Off-Site
8 of 28

SO2 Fugitive PM10
Exhaust PM10
Fugitive PM2.5
Exhaust PM2.5
PM2.5 Total
ROG NOx CO N2O CO2e
Category tons/yr MT/yr
Bio- CO2 NBio- CO2 Total CO2 CH4PM10 Total
Hauling 0.00 0.00 0.00 0.00 0.00 0.00 0.00 0.00 0.00 0.00 0.00 0.00 0.00 0.00 0.00 0.00
Vendor 0.00 0.00 0.00 0.00 0.00 0.00 0.00 0.00 0.00 0.00 0.00 0.00 0.00 0.00 0.00 0.00
Worker 0.01 0.01 0.06 0.00 0.00 0.00 0.00 0.00 0.00 0.00 0.00 6.98 6.98 0.00 0.00 6.99
Total 0.01 0.01 0.06 0.00 0.00 0.00 0.00 0.00 0.00 6.990.00 0.00 0.00 6.98
Exhaust PM10
PM10 Total
6.98 0.00
PM2.5 Total
Bio- CO2
3.5 Building Construction - 2011
Unmitigated Construction On-Site
ROG NOx CO SO2 Fugitive PM10
CO2e
Category tons/yr MT/yr
NBio- CO2 Total CO2 CH4 N2OFugitive PM2.5
Exhaust PM2.5
Off-Road 0.32 2.11 1.26 0.00 0.15 0.15 0.15 0.15 0.00 192.39 192.39 0.03 0.00 192.94
Total 0.32 2.11 1.26 0.00 0.15 0.15 0.00 192.940.15 0.15 0.00 192.39
Exhaust PM10
PM10 Total
192.39 0.03
PM2.5 Total
Bio- CO2
Unmitigated Construction Off-Site
ROG NOx CO SO2 Fugitive PM10
CO2e
Category tons/yr MT/yr
NBio- CO2 Total CO2 CH4 N2OFugitive PM2.5
Exhaust PM2.5
Hauling 0.00 0.00 0.00 0.00 0.00 0.00 0.00 0.00 0.00 0.00 0.00 0.00 0.00 0.00 0.00 0.00
Vendor 0.14 1.48 0.95 0.00 0.06 0.05 0.11 0.00 0.05 0.05 0.00 188.30 188.30 0.01 0.00 188.43
Worker 0.21 0.24 2.34 0.00 0.34 0.01 0.36 0.01 0.01 0.02 0.00 279.52 279.52 0.02 0.00 279.95
Total 0.35 1.72 3.29 0.00 0.40 0.06 0.47 0.01 0.00 468.380.06 0.07 0.00 467.82 467.82 0.03
9 of 28

Exhaust PM10
PM10 Total PM2.5 Total
Bio- CO2
Mitigated Construction On-Site
ROG NOx CO SO2 Fugitive PM10
CO2e
Category tons/yr MT/yr
NBio- CO2 Total CO2 CH4 N2OFugitive PM2.5
Exhaust PM2.5
Off-Road 0.32 2.11 1.26 0.00 0.15 0.15 0.15 0.15 0.00 192.39 192.39 0.03 0.00 192.94
Total 0.32 2.11 1.26 0.00 0.15 0.15 0.00 192.940.15 0.15 0.00 192.39
Exhaust PM10
PM10 Total
192.39 0.03
PM2.5 Total
Bio- CO2
Mitigated Construction Off-Site
ROG NOx CO SO2 Fugitive PM10
CO2e
Category tons/yr MT/yr
NBio- CO2 Total CO2 CH4 N2OFugitive PM2.5
Exhaust PM2.5
Hauling 0.00 0.00 0.00 0.00 0.00 0.00 0.00 0.00 0.00 0.00 0.00 0.00 0.00 0.00 0.00 0.00
Vendor 0.14 1.48 0.95 0.00 0.01 0.05 0.06 0.00 0.05 0.05 0.00 188.30 188.30 0.01 0.00 188.43
Worker 0.21 0.24 2.34 0.00 0.01 0.01 0.03 0.01 0.01 0.02 0.00 279.52 279.52 0.02 0.00 279.95
Total 0.35 1.72 3.29 0.00 0.02 0.06 0.09 0.01 0.00 468.380.06 0.07 0.00 467.82
Exhaust PM10
PM10 Total
467.82 0.03
PM2.5 Total
Bio- CO2
3.5 Building Construction - 2012
Unmitigated Construction On-Site
ROG NOx CO SO2 Fugitive PM10
CO2e
Category tons/yr MT/yr
NBio- CO2 Total CO2 CH4 N2OFugitive PM2.5
Exhaust PM2.5
Off-Road 0.73 4.87 3.10 0.01 0.33 0.33 0.33 0.33 0.00 478.23 478.23 0.06 0.00 479.48
10 of 28

Total 0.73 4.87 3.10 0.01 0.33 0.33 0.00 479.480.33 0.33 0.00 478.23
Exhaust PM10
PM10 Total
478.23 0.06
PM2.5 Total
Bio- CO2
Unmitigated Construction Off-Site
ROG NOx CO SO2 Fugitive PM10
CO2e
Category tons/yr MT/yr
NBio- CO2 Total CO2 CH4 N2OFugitive PM2.5
Exhaust PM2.5
Hauling 0.00 0.00 0.00 0.00 0.00 0.00 0.00 0.00 0.00 0.00 0.00 0.00 0.00 0.00 0.00 0.00
Vendor 0.31 3.41 2.18 0.00 0.15 0.12 0.27 0.00 0.11 0.11 0.00 468.87 468.87 0.01 0.00 469.16
Worker 0.47 0.54 5.32 0.01 0.85 0.03 0.88 0.01 0.03 0.04 0.00 679.93 679.93 0.05 0.00 680.91
Total 0.78 3.95 7.50 0.01 1.00 0.15 1.15 0.01 0.00 1,150.070.14 0.15 0.00 1,148.80
Exhaust PM10
PM10 Total
1,148.80 0.06
PM2.5 Total
Bio- CO2
Mitigated Construction On-Site
ROG NOx CO SO2 Fugitive PM10
CO2e
Category tons/yr MT/yr
NBio- CO2 Total CO2 CH4 N2OFugitive PM2.5
Exhaust PM2.5
Off-Road 0.73 4.87 3.10 0.01 0.33 0.33 0.33 0.33 0.00 478.23 478.23 0.06 0.00 479.48
Total 0.73 4.87 3.10 0.01 0.33 0.33 0.00 479.480.33 0.33 0.00 478.23
Exhaust PM10
PM10 Total
478.23 0.06
PM2.5 Total
Bio- CO2
Mitigated Construction Off-Site
ROG NOx CO SO2 Fugitive PM10
CO2e
Category tons/yr MT/yr
NBio- CO2 Total CO2 CH4 N2OFugitive PM2.5
Exhaust PM2.5
11 of 28

Hauling 0.00 0.00 0.00 0.00 0.00 0.00 0.00 0.00 0.00 0.00 0.00 0.00 0.00 0.00 0.00 0.00
Vendor 0.31 3.41 2.18 0.00 0.01 0.12 0.13 0.00 0.11 0.11 0.00 468.87 468.87 0.01 0.00 469.16
Worker 0.47 0.54 5.32 0.01 0.04 0.03 0.07 0.01 0.03 0.04 0.00 679.93 679.93 0.05 0.00 680.91
Total 0.78 3.95 7.50 0.01 0.05 0.15 0.20 0.01 0.00 1,150.070.14 0.15 0.00 1,148.80
Exhaust PM10
PM10 Total
1,148.80 0.06
PM2.5 Total
Bio- CO2
3.5 Building Construction - 2013
Unmitigated Construction On-Site
ROG NOx CO SO2 Fugitive PM10
CO2e
Category tons/yr MT/yr
NBio- CO2 Total CO2 CH4 N2OFugitive PM2.5
Exhaust PM2.5
Off-Road 0.67 4.52 3.06 0.01 0.30 0.30 0.30 0.30 0.00 478.23 478.23 0.05 0.00 479.38
Total 0.67 4.52 3.06 0.01 0.30 0.30 0.00 479.380.30 0.30 0.00 478.23
Exhaust PM10
PM10 Total
478.23 0.05
PM2.5 Total
Bio- CO2
Unmitigated Construction Off-Site
ROG NOx CO SO2 Fugitive PM10
CO2e
Category tons/yr MT/yr
NBio- CO2 Total CO2 CH4 N2OFugitive PM2.5
Exhaust PM2.5
Hauling 0.00 0.00 0.00 0.00 0.00 0.00 0.00 0.00 0.00 0.00 0.00 0.00 0.00 0.00 0.00 0.00
Vendor 0.29 3.15 2.03 0.00 0.15 0.11 0.26 0.00 0.10 0.10 0.00 469.62 469.62 0.01 0.00 469.89
Worker 0.44 0.50 4.89 0.01 0.85 0.03 0.88 0.01 0.03 0.04 0.00 665.55 665.55 0.04 0.00 666.47
Total 0.73 3.65 6.92 0.01 1.00 0.14 1.14 0.01 0.00 1,136.360.13 0.14 0.00 1,135.17 1,135.17 0.05
Mitigated Construction On-Site
12 of 28
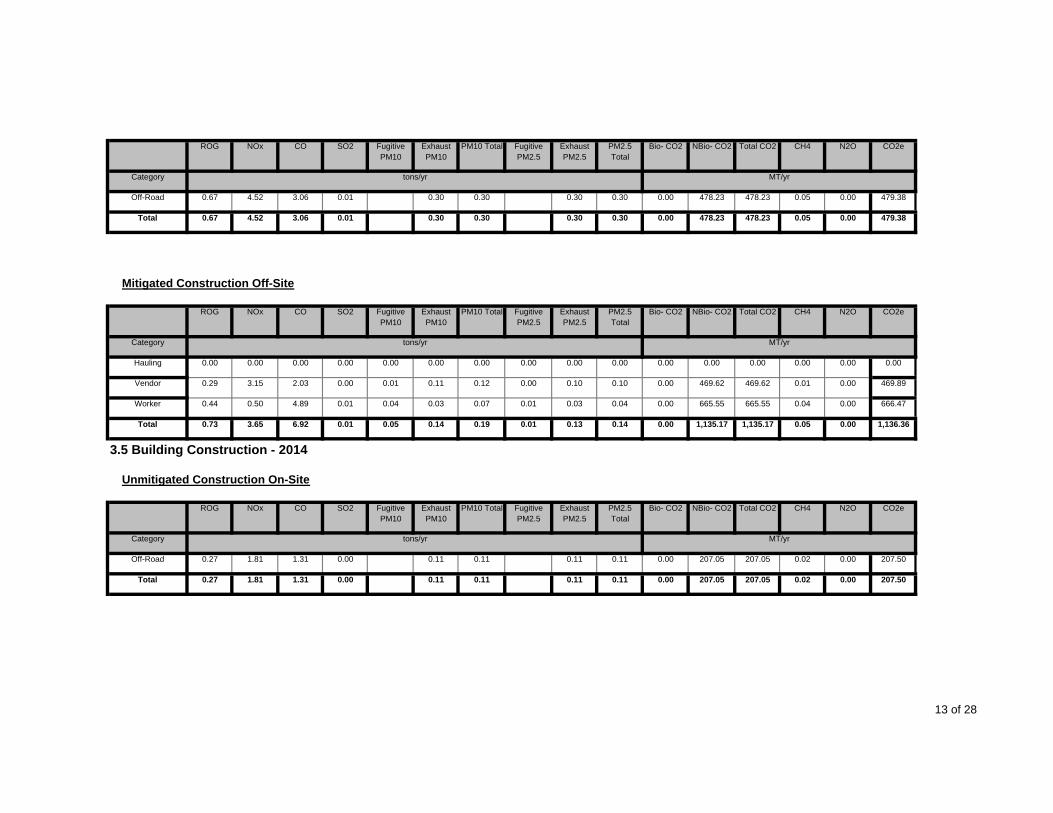
Exhaust PM10
PM10 Total PM2.5 Total
Bio- CO2ROG NOx CO SO2 Fugitive PM10
CO2e
Category tons/yr MT/yr
NBio- CO2 Total CO2 CH4 N2OFugitive PM2.5
Exhaust PM2.5
Off-Road 0.67 4.52 3.06 0.01 0.30 0.30 0.30 0.30 0.00 478.23 478.23 0.05 0.00 479.38
Total 0.67 4.52 3.06 0.01 0.30 0.30 0.00 479.380.30 0.30 0.00 478.23
Exhaust PM10
PM10 Total
478.23 0.05
PM2.5 Total
Bio- CO2
Mitigated Construction Off-Site
ROG NOx CO SO2 Fugitive PM10
CO2e
Category tons/yr MT/yr
NBio- CO2 Total CO2 CH4 N2OFugitive PM2.5
Exhaust PM2.5
Hauling 0.00 0.00 0.00 0.00 0.00 0.00 0.00 0.00 0.00 0.00 0.00 0.00 0.00 0.00 0.00 0.00
Vendor 0.29 3.15 2.03 0.00 0.01 0.11 0.12 0.00 0.10 0.10 0.00 469.62 469.62 0.01 0.00 469.89
Worker 0.44 0.50 4.89 0.01 0.04 0.03 0.07 0.01 0.03 0.04 0.00 665.55 665.55 0.04 0.00 666.47
Total 0.73 3.65 6.92 0.01 0.05 0.14 0.19 0.01 0.00 1,136.360.13 0.14 0.00 1,135.17
Exhaust PM10
PM10 Total
1,135.17 0.05
PM2.5 Total
Bio- CO2
3.5 Building Construction - 2014
Unmitigated Construction On-Site
ROG NOx CO SO2 Fugitive PM10
CO2e
Category tons/yr MT/yr
NBio- CO2 Total CO2 CH4 N2OFugitive PM2.5
Exhaust PM2.5
Off-Road 0.27 1.81 1.31 0.00 0.11 0.11 0.11 0.11 0.00 207.05 207.05 0.02 0.00 207.50
Total 0.27 1.81 1.31 0.00 0.11 0.11 0.00 207.500.11 0.11 0.00 207.05 207.05 0.02
13 of 28

Exhaust PM10
PM10 Total PM2.5 Total
Bio- CO2
Unmitigated Construction Off-Site
ROG NOx CO SO2 Fugitive PM10
CO2e
Category tons/yr MT/yr
NBio- CO2 Total CO2 CH4 N2OFugitive PM2.5
Exhaust PM2.5
Hauling 0.00 0.00 0.00 0.00 0.00 0.00 0.00 0.00 0.00 0.00 0.00 0.00 0.00 0.00 0.00 0.00
Vendor 0.11 1.26 0.81 0.00 0.07 0.04 0.11 0.00 0.04 0.04 0.00 203.64 203.64 0.01 0.00 203.75
Worker 0.18 0.20 1.94 0.00 0.37 0.01 0.38 0.01 0.01 0.02 0.00 282.08 282.08 0.02 0.00 282.44
Total 0.29 1.46 2.75 0.00 0.44 0.05 0.49 0.01 0.00 486.190.05 0.06 0.00 485.72
Exhaust PM10
PM10 Total
485.72 0.03
PM2.5 Total
Bio- CO2
Mitigated Construction On-Site
ROG NOx CO SO2 Fugitive PM10
CO2e
Category tons/yr MT/yr
NBio- CO2 Total CO2 CH4 N2OFugitive PM2.5
Exhaust PM2.5
Off-Road 0.27 1.81 1.31 0.00 0.11 0.11 0.11 0.11 0.00 207.05 207.05 0.02 0.00 207.50
Total 0.27 1.81 1.31 0.00 0.11 0.11 0.00 207.500.11 0.11 0.00 207.05
Exhaust PM10
PM10 Total
207.05 0.02
PM2.5 Total
Bio- CO2
Mitigated Construction Off-Site
ROG NOx CO SO2 Fugitive PM10
CO2e
Category tons/yr MT/yr
NBio- CO2 Total CO2 CH4 N2OFugitive PM2.5
Exhaust PM2.5
Hauling 0.00 0.00 0.00 0.00 0.00 0.00 0.00 0.00 0.00 0.00 0.00 0.00 0.00 0.00 0.00 0.00
Vendor 0.11 1.26 0.81 0.00 0.01 0.04 0.05 0.00 0.04 0.04 0.00 203.64 203.64 0.01 0.00 203.75
Worker 0.18 0.20 1.94 0.00 0.02 0.01 0.03 0.01 0.01 0.02 0.00 282.08 282.08 0.02 0.00 282.44
14 of 28

Total 0.29 1.46 2.75 0.00 0.03 0.05 0.08 0.01 0.00 486.190.05 0.06 0.00 485.72
Exhaust PM10
PM10 Total
485.72 0.03
PM2.5 Total
Bio- CO2
3.6 Paving - 2014
Unmitigated Construction On-Site
ROG NOx CO SO2 Fugitive PM10
CO2e
Category tons/yr MT/yr
NBio- CO2 Total CO2 CH4 N2OFugitive PM2.5
Exhaust PM2.5
Off-Road 0.14 0.88 0.57 0.00 0.08 0.08 0.08 0.08 0.00 72.77 72.77 0.01 0.00 73.01
Paving 0.00 0.00 0.00 0.00 0.00 0.00 0.00 0.00 0.00 0.00 0.00
Total 0.14 0.88 0.57 72.77 0.01 0.000.08 0.08 0.00
SO2 Fugitive PM10
Exhaust PM10
72.770.00 0.08 0.08
Fugitive PM2.5
Exhaust PM2.5
PM2.5 Total
73.01
Unmitigated Construction Off-Site
ROG NOx CO N2O CO2e
Category tons/yr MT/yr
Bio- CO2 NBio- CO2 Total CO2 CH4PM10 Total
Hauling 0.00 0.00 0.00 0.00 0.00 0.00 0.00 0.00 0.00 0.00 0.00 0.00 0.00 0.00 0.00 0.00
Vendor 0.00 0.00 0.00 0.00 0.00 0.00 0.00 0.00 0.00 0.00 0.00 0.00 0.00 0.00 0.00 0.00
Worker 0.00 0.00 0.02 0.00 0.00 0.00 0.00 0.00 0.00 0.00 0.00 3.60 3.60 0.00 0.00 3.61
Total 0.00 0.00 0.02 0.00 0.00 0.00 0.00 0.00 0.00 3.610.00 0.00 0.00 3.60
Exhaust PM10
PM10 Total
3.60 0.00
PM2.5 Total
Bio- CO2
Mitigated Construction On-Site
ROG NOx CO SO2 Fugitive PM10
CO2e
Category tons/yr MT/yr
NBio- CO2 Total CO2 CH4 N2OFugitive PM2.5
Exhaust PM2.5
15 of 28

Off-Road 0.14 0.88 0.57 0.00 0.08 0.08 0.08 0.08 0.00 72.77 72.77 0.01 0.00 73.01
Paving 0.00 0.00 0.00 0.00 0.00 0.00 0.00 0.00 0.00 0.00 0.00
Total 0.14 0.88 0.57 72.77 0.01 0.000.08 0.08 0.00
SO2 Fugitive PM10
Exhaust PM10
72.770.00 0.08 0.08
Fugitive PM2.5
Exhaust PM2.5
PM2.5 Total
73.01
Mitigated Construction Off-Site
ROG NOx CO N2O CO2e
Category tons/yr MT/yr
Bio- CO2 NBio- CO2 Total CO2 CH4PM10 Total
Hauling 0.00 0.00 0.00 0.00 0.00 0.00 0.00 0.00 0.00 0.00 0.00 0.00 0.00 0.00 0.00 0.00
Vendor 0.00 0.00 0.00 0.00 0.00 0.00 0.00 0.00 0.00 0.00 0.00 0.00 0.00 0.00 0.00 0.00
Worker 0.00 0.00 0.02 0.00 0.00 0.00 0.00 0.00 0.00 0.00 0.00 3.60 3.60 0.00 0.00 3.61
Total 0.00 0.00 0.02 0.00 0.00 0.00 0.00 0.00 0.00 3.610.00 0.00 0.00 3.60
Exhaust PM10
PM10 Total
3.60 0.00
PM2.5 Total
Bio- CO2
3.7 Architectural Coating - 2014
Unmitigated Construction On-Site
ROG NOx CO SO2 Fugitive PM10
CO2e
Category tons/yr MT/yr
NBio- CO2 Total CO2 CH4 N2OFugitive PM2.5
Exhaust PM2.5
Archit. Coating 16.00 0.00 0.00 0.00 0.00 0.00 0.00 0.00 0.00 0.00 0.00
Off-Road 0.01 0.08 0.05 0.00 0.01 0.01 0.01 0.01 0.00 7.01 7.01 0.00 0.00 7.03
Total 16.01 0.08 0.05 7.01 0.00 0.000.01 0.01 0.00 7.010.00 0.01 0.01 7.03
Unmitigated Construction Off-Site
16 of 28

SO2 Fugitive PM10
Exhaust PM10
Fugitive PM2.5
Exhaust PM2.5
PM2.5 Total
ROG NOx CO N2O CO2e
Category tons/yr MT/yr
Bio- CO2 NBio- CO2 Total CO2 CH4PM10 Total
Hauling 0.00 0.00 0.00 0.00 0.00 0.00 0.00 0.00 0.00 0.00 0.00 0.00 0.00 0.00 0.00 0.00
Vendor 0.00 0.00 0.00 0.00 0.00 0.00 0.00 0.00 0.00 0.00 0.00 0.00 0.00 0.00 0.00 0.00
Worker 0.02 0.02 0.19 0.00 0.04 0.00 0.04 0.00 0.00 0.00 0.00 27.36 27.36 0.00 0.00 27.40
Total 0.02 0.02 0.19 0.00 0.04 0.00 0.04 0.00 0.00 27.400.00 0.00 0.00 27.36
Exhaust PM10
PM10 Total
27.36 0.00
PM2.5 Total
Bio- CO2
Mitigated Construction On-Site
ROG NOx CO SO2 Fugitive PM10
CO2e
Category tons/yr MT/yr
NBio- CO2 Total CO2 CH4 N2OFugitive PM2.5
Exhaust PM2.5
Archit. Coating 16.00 0.00 0.00 0.00 0.00 0.00 0.00 0.00 0.00 0.00 0.00
Off-Road 0.01 0.08 0.05 0.00 0.01 0.01 0.01 0.01 0.00 7.01 7.01 0.00 0.00 7.03
Total 16.01 0.08 0.05 7.01 0.00 0.000.01 0.01 0.00
SO2 Fugitive PM10
Exhaust PM10
7.010.00 0.01 0.01
Fugitive PM2.5
Exhaust PM2.5
PM2.5 Total
7.03
Mitigated Construction Off-Site
ROG NOx CO N2O CO2e
Category tons/yr MT/yr
Bio- CO2 NBio- CO2 Total CO2 CH4PM10 Total
Hauling 0.00 0.00 0.00 0.00 0.00 0.00 0.00 0.00 0.00 0.00 0.00 0.00 0.00 0.00 0.00 0.00
Vendor 0.00 0.00 0.00 0.00 0.00 0.00 0.00 0.00 0.00 0.00 0.00 0.00 0.00 0.00 0.00 0.00
Worker 0.02 0.02 0.19 0.00 0.00 0.00 0.00 0.00 0.00 0.00 0.00 27.36 27.36 0.00 0.00 27.40
Total 0.02 0.02 0.19 0.00 0.00 0.00 0.00 0.00 0.00 0.00 0.00 27.36 27.36 0.00 0.00 27.40
17 of 28

SO2 Fugitive PM10
Exhaust PM10
4.0 Mobile Detail
4.1 Mitigation Measures Mobile
Fugitive PM2.5
Exhaust PM2.5
PM2.5 Total
ROG NOx CO N2O CO2e
Category tons/yr MT/yr
Bio- CO2 NBio- CO2 Total CO2 CH4PM10 Total
Mitigated 7.80 13.94 65.07 0.20 19.90 1.02 20.92 0.32 0.98 1.30 0.00 13,576.23 13,576.23 0.51 0.00 13,586.85
Unmitigated 7.80 13.94 65.07 0.20 19.90 1.02 20.92 0.32 0.98 1.30 0.00 13,576.23 13,576.23 0.51 0.00 13,586.85
Total NA NA NA NA NA NA NA NA NA NA NA NA
4.2 Trip Summary Information
Average Daily Trip Rate Unmitigated Mitigated
NA NA NA NA
Land Use Weekday Saturday Sunday
Apartments Mid Rise 3,245.20 3,245.20 3245.20397.67 397.67
Annual VMT Annual VMT
9,266,030 9,266,030848,967 848,967
Elementary School 1,534.10 1,534.10 1534.10 3,382,597 3,382,597City Park 397.67
General Office Building 203.81 203.81 203.81General Office Building 5,198.54 5,198.54 5198.54
611.68 611.68
487,065 487,06512,423,235 12,423,2351,461,754 1,461,754
Government Office Building 231.00 231.00 231.00 396,137 396,137General Office Building 611.68
18 of 28

Junior College (2Yr) 160.95 160.95 160.95Medical Office Building 3,804.72 3,804.72 3804.72
607.20 607.20
408,738 408,7387,446,788 7,446,7881,733,740 1,733,740
Total 15,994.87 15,994.87 15,994.87 37,855,053 37,855,053Single Family Housing 607.20
4.3 Trip Type Information
Miles Trip %
Land Use H-W or C-W H-S or C-C H-O or C-NW H-W or C-W H-S or C-C H-O or C-NW
Apartments Mid Rise 10.80 7.30 7.50 41.60 18.80 39.60
City Park 9.50 7.30 7.30 33.00 48.00 19.00
Elementary School 9.50 7.30 7.30 65.00 30.00 5.00
General Office Building 9.50 7.30 7.30 33.00 48.00 19.00
General Office Building 9.50 7.30 7.30 33.00 48.00 19.00
General Office Building 9.50 7.30 7.30 33.00 48.00 19.00
Government Office Building 9.50 7.30 7.30 33.00 62.00 5.00
Junior College (2Yr) 9.50 7.30 7.30 6.40 88.60 5.00
Medical Office Building 9.50 7.30 7.30 29.60 51.40 19.00
41.60 18.80 39.60
5.0 Energy Detail
Single Family Housing 10.80 7.30 7.50
5.1 Mitigation Measures Energy
19 of 28

ROG NOx CO SO2 Fugitive PM10
Exhaust PM10
PM10 Total Fugitive PM2.5
Exhaust PM2.5
PM2.5 Total
Bio- CO2 NBio- CO2 Total CO2 CH4 N2O CO2e
Category tons/yr MT/yr
Electricity Mitigated 0.00 0.00 0.00 0.00 0.00 3,434.80 3,434.80 0.13 0.05 3,452.48
Electricity Unmitigated
0.00 0.00 0.00 0.00 0.00 3,434.80 3,434.80 0.13 0.05 3,452.48
NaturalGas Mitigated 0.11 0.95 0.63 0.01 0.00 0.07 0.00 0.07 0.00 1,063.96 1,063.96 0.02 0.02 1,070.44
NaturalGas Unmitigated
0.11 0.95 0.63 0.01 0.00 0.07 0.00 0.07 0.00 1,063.96 1,063.96 0.02 0.02 1,070.44
Total NA NA NA NA NA NA NA NA NA NA NA NA NA NA NA NA
5.2 Energy by Land Use - NaturalGas
Unmitigated
NaturalGas Use ROG NOx CO SO2 Fugitive PM10
Exhaust PM10
PM10 Total Fugitive PM2.5
Exhaust PM2.5
PM2.5 Total N2O CO2e
Land Use kBTU tons/yr MT/yr
Bio- CO2 NBio- CO2 Total CO2 CH4
Apartments Mid Rise 5.9497e+006 0.03 0.27 0.12 0.00 0.00 0.02 0.00 0.02 0.00 317.50 317.50 0.01 0.01 319.43
City Park 0 0.00 0.00 0.00 0.00 0.00 0.00 0.00 0.00 0.00 0.00 0.00 0.00 0.00 0.00
Elementary School 304276 0.00 0.01 0.01 0.00 0.00 0.00 0.00 0.00 0.00 16.24 16.24 0.00 0.00 16.34
General Office Building
205208 0.00 0.01 0.01 0.00 0.00 0.00 0.00 0.00 0.00 10.95 10.95 0.00 0.00 11.02
General Office Building
5.23409e+006 0.03 0.26 0.22 0.00 0.00 0.02 0.00 0.02 0.00 279.31 279.31 0.01 0.01 281.01
General Office Building
615858 0.00 0.03 0.03 0.00 0.00 0.00 0.00 0.00 0.00 32.86 32.86 0.00 0.00 33.06
Government Office Building
2.5916e+006 0.01 0.13 0.11 0.00 0.00 0.01 0.00 0.01 0.00 138.30 138.30 0.00 0.00 139.14
Junior College (2Yr) 358875 0.00 0.02 0.01 0.00 0.00 0.00 0.00 0.00 0.00 19.15 19.15 0.00 0.00 19.27
Medical Office Building
1.79998e+006 0.01 0.09 0.07 0.00 0.00 0.01 0.00 0.01 0.00 96.05 96.05 0.00 0.00 96.64
Single Family Housing
2.87827e+006 0.02 0.13 0.06 0.00 0.00 0.01 0.00 0.01
0.64 0.00 0.00Total 0.10 0.95 0.00 0.07
0.00 154.530.00 153.60 153.60 0.00
0.02 1,070.440.00 1,063.96 1,063.96 0.020.07
20 of 28

Mitigated
NaturalGas Use ROG NOx CO SO2 Fugitive PM10
Exhaust PM10
PM10 Total Fugitive PM2.5
Exhaust PM2.5
PM2.5 Total N2O CO2e
Land Use kBTU tons/yr MT/yr
Bio- CO2 NBio- CO2 Total CO2 CH4
Apartments Mid Rise 5.9497e+006 0.03 0.27 0.12 0.00 0.00 0.02 0.00 0.02 0.00 317.50 317.50 0.01 0.01 319.43
City Park 0 0.00 0.00 0.00 0.00 0.00 0.00 0.00 0.00 0.00 0.00 0.00 0.00 0.00 0.00
Elementary School 304276 0.00 0.01 0.01 0.00 0.00 0.00 0.00 0.00 0.00 16.24 16.24 0.00 0.00 16.34
General Office Building
205208 0.00 0.01 0.01 0.00 0.00 0.00 0.00 0.00 0.00 10.95 10.95 0.00 0.00 11.02
General Office Building
5.23409e+006 0.03 0.26 0.22 0.00 0.00 0.02 0.00 0.02 0.00 279.31 279.31 0.01 0.01 281.01
General Office Building
615858 0.00 0.03 0.03 0.00 0.00 0.00 0.00 0.00 0.00 32.86 32.86 0.00 0.00 33.06
Government Office Building
2.5916e+006 0.01 0.13 0.11 0.00 0.00 0.01 0.00 0.01 0.00 138.30 138.30 0.00 0.00 139.14
Junior College (2Yr) 358875 0.00 0.02 0.01 0.00 0.00 0.00 0.00 0.00 0.00 19.15 19.15 0.00 0.00 19.27
Medical Office Building
1.79998e+006 0.01 0.09 0.07 0.00 0.00 0.01 0.00 0.01 0.00 96.05 96.05 0.00 0.00 96.64
Single Family Housing
2.87827e+006 0.02 0.13 0.06 0.00 0.00 0.01 0.00 0.01
0.64 0.00 0.00Total 0.10 0.95 0.00 0.07
0.00 154.530.00 153.60 153.60 0.00
0.02 1,070.44
5.3 Energy by Land Use - Electricity
Unmitigated
0.00 1,063.96 1,063.96 0.020.07
Electricity Use ROG NOx N2O CO2e
Land Use kWh tons/yr MT/yr
CO SO2 Total CO2 CH4
Apartments Mid Rise 1.89297e+006 670.41 0.02 0.01 673.87
City Park 0 0.00 0.00 0.00 0.00
21 of 28
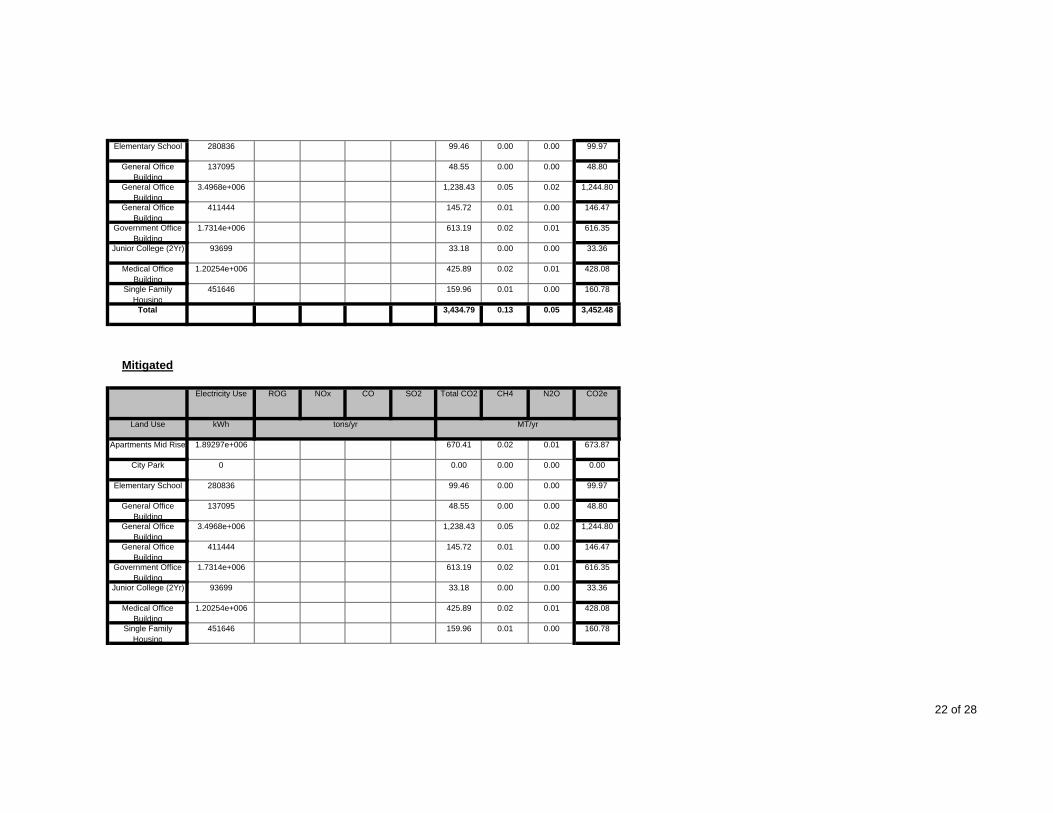
Elementary School 280836 99.46 0.00 0.00 99.97
General Office Building
137095 48.55 0.00 0.00 48.80
General Office Building
3.4968e+006 1,238.43 0.05 0.02 1,244.80
General Office Building
411444 145.72 0.01 0.00 146.47
Government Office Building
1.7314e+006 613.19 0.02 0.01 616.35
Junior College (2Yr) 93699 33.18 0.00 0.00 33.36
Medical Office Building
1.20254e+006 425.89 0.02 0.01 428.08
Single Family Housing
451646 159.96 0.01 0.00 160.78
Total 3,434.79 0.13 0.05 3,452.48
Mitigated
Electricity Use ROG NOx N2O CO2e
Land Use kWh tons/yr MT/yr
CO SO2 Total CO2 CH4
Apartments Mid Rise 1.89297e+006 670.41 0.02 0.01 673.87
City Park 0 0.00 0.00 0.00 0.00
Elementary School 280836 99.46 0.00 0.00 99.97
General Office Building
137095 48.55 0.00 0.00 48.80
General Office Building
3.4968e+006 1,238.43 0.05 0.02 1,244.80
General Office Building
411444 145.72 0.01 0.00 146.47
Government Office Building
1.7314e+006 613.19 0.02 0.01 616.35
Junior College (2Yr) 93699 33.18 0.00 0.00 33.36
Medical Office Building
1.20254e+006 425.89 0.02 0.01 428.08
Single Family Housing
451646 159.96 0.01 0.00 160.78
22 of 28

Total 3,434.79 0.13 0.05 3,452.48
6.0 Area Detail
6.1 Mitigation Measures Area
ROG NOx CO PM2.5 Total
Bio- CO2SO2 Fugitive PM10
Exhaust PM10
PM10 Total CO2e
Category tons/yr MT/yr
NBio- CO2 Total CO2 CH4 N2OFugitive PM2.5
Exhaust PM2.5
Mitigated 44.00 0.56 50.96 0.02 0.00 6.59 0.00 6.59 620.81 788.45 1,409.25 0.59 0.06 1,439.74
Unmitigated 44.00 0.56 50.96 0.02 0.00 6.59 0.00 6.59 620.81 788.45 1,409.25 0.59 0.06 1,439.74
Total NA NA NA NA NA NANA NA NA NA
SO2 Fugitive PM10
Exhaust PM10
NANA NA NA NA
Fugitive PM2.5
Exhaust PM2.5
PM2.5 Total
NA
6.2 Area by SubCategory
Unmitigated
ROG NOx CO N2O CO2e
SubCategory tons/yr MT/yr
Bio- CO2 NBio- CO2 Total CO2 CH4PM10 Total
Architectural Coating 1.60 0.00 0.00 0.00 0.00 0.00 0.00 0.00 0.00 0.00 0.00
Consumer Products 4.50 0.00 0.00 0.00 0.00 0.00 0.00 0.00 0.00 0.00 0.00
Hearth 37.76 0.51 46.46 0.02 0.00 6.56 0.00 6.56 620.81 781.07 1,401.88 0.58 0.06 1,432.22
Landscaping 0.13 0.05 4.50 0.00 0.00 0.02 0.00 0.02 0.00 7.37 7.37 0.01 0.00 7.52
23 of 28

Total 43.99 0.56 50.96 1,409.25 0.59 0.060.00 6.58 620.81
SO2 Fugitive PM10
Exhaust PM10
788.440.02 0.00 6.58
Fugitive PM2.5
Exhaust PM2.5
PM2.5 Total
1,439.74
Mitigated
ROG NOx CO N2O CO2e
SubCategory tons/yr MT/yr
Bio- CO2 NBio- CO2 Total CO2 CH4PM10 Total
Architectural Coating 1.60 0.00 0.00 0.00 0.00 0.00 0.00 0.00 0.00 0.00 0.00
Consumer Products 4.50 0.00 0.00 0.00 0.00 0.00 0.00 0.00 0.00 0.00 0.00
Hearth 37.76 0.51 46.46 0.02 0.00 6.56 0.00 6.56 620.81 781.07 1,401.88 0.58 0.06 1,432.22
Landscaping 0.13 0.05 4.50 0.00 0.00 0.02 0.00 0.02 0.00 7.37 7.37 0.01 0.00 7.52
Total 43.99 0.56 50.96 6.58 620.810.02 0.00 6.58 1,439.74
7.0 Water Detail
7.1 Mitigation Measures Water
788.44 1,409.25 0.59 0.060.00
ROG NOx CO SO2 Total CO2 CH4 N2O CO2e
Category tons/yr MT/yr
Mitigated 870.86 3.63 0.10 978.65
Unmitigated 870.86 3.63 0.10 978.65
24 of 28

Total NA NA NA NA NA NA NA NA
7.2 Water by Land Use
Unmitigated
Indoor/Outdoor Use
ROG NOx CO SO2 Total CO2 CH4 N2O CO2e
Land Use Mgal tons/yr MT/yr
Apartments Mid Rise 34.6619 / 21.8521 246.21 1.07 0.03 277.83
City Park 0 / 10.8425 42.66 0.00 0.00 42.88
Elementary School 1.28242 / 3.29766 18.90 0.04 0.00 20.12
General Office Building
45.6794 / 27.997 321.32 1.41 0.04 362.98
Government Office Building
21.8526 / 13.3935 153.72 0.67 0.02 173.64
Junior College (2Yr) 0.426727 / 0.667444
4.60 0.01 0.00 5.00
Medical Office Building
9.58671 / 1.82604 51.50 0.29 0.01 60.16
Single Family Housing
4.49563 / 2.8342 31.93 0.14 0.00 36.03
Total 870.84 3.63 0.10 978.64
Mitigated
Indoor/Outdoor Use
ROG NOx N2O CO2e
Land Use Mgal tons/yr MT/yr
CO SO2 Total CO2 CH4
Apartments Mid Rise 34.6619 / 21.8521 246.21 1.07 0.03 277.83
City Park 0 / 10.8425 42.66 0.00 0.00 42.88
Elementary School 1.28242 / 3.29766 18.90 0.04 0.00 20.12
25 of 28

General Office Building
45.6794 / 27.997 321.32 1.41 0.04 362.98
Government Office Building
21.8526 / 13.3935 153.72 0.67 0.02 173.64
Junior College (2Yr) 0.426727 / 0.667444
4.60 0.01 0.00 5.00
Medical Office Building
9.58671 / 1.82604 51.50 0.29 0.01 60.16
Single Family Housing
4.49563 / 2.8342 31.93 0.14 0.00 36.03
Total 870.84 3.63 0.10 978.64
8.0 Waste Detail
NOx CO
8.1 Mitigation Measures Waste
Category/Year
CO2e
tons/yr MT/yr
SO2 Total CO2 CH4 N2OROG
Mitigated 324.90 19.20 0.00 728.12
Unmitigated 324.90 19.20 0.00 728.12
Total NA NA NA NA NA NA NA NA
8.2 Waste by Land Use
Unmitigated
Waste Disposed ROG NOx CO SO2 Total CO2 CH4 N2O CO2e
26 of 28
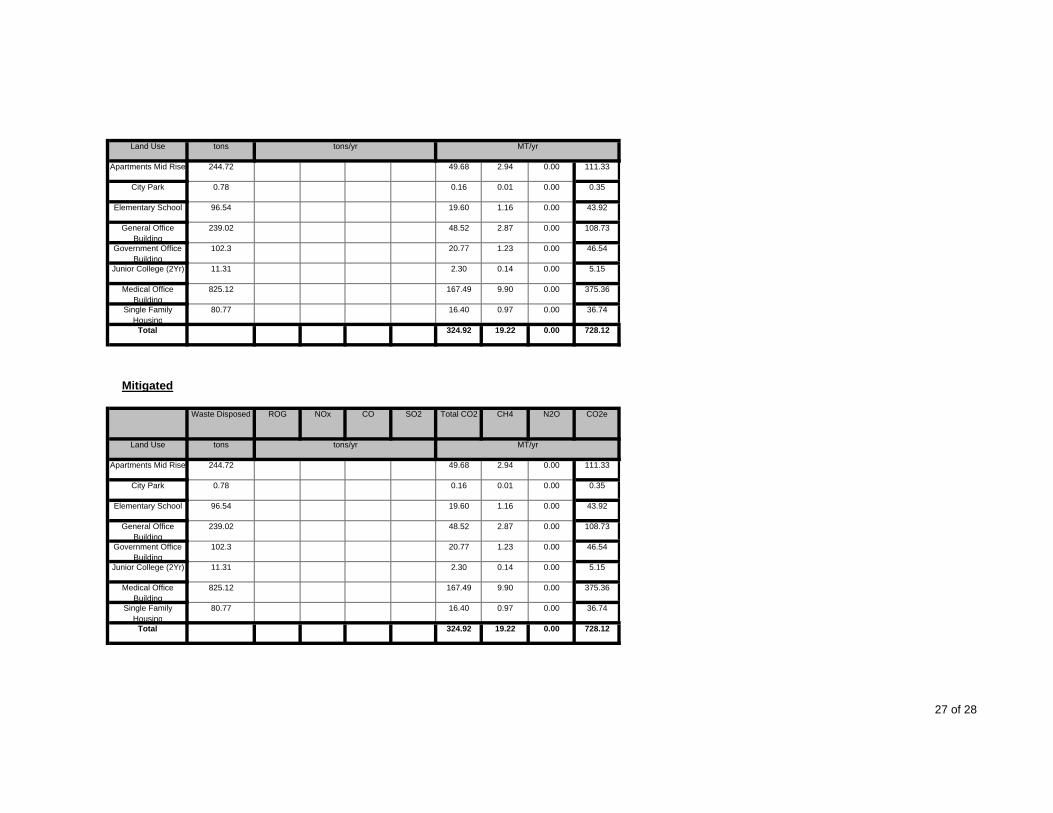
Land Use tons tons/yr MT/yr
Apartments Mid Rise 244.72 49.68 2.94 0.00 111.33
City Park 0.78 0.16 0.01 0.00 0.35
Elementary School 96.54 19.60 1.16 0.00 43.92
General Office Building
239.02 48.52 2.87 0.00 108.73
Government Office Building
102.3 20.77 1.23 0.00 46.54
Junior College (2Yr) 11.31 2.30 0.14 0.00 5.15
Medical Office Building
825.12 167.49 9.90 0.00 375.36
Single Family Housing
80.77 16.40 0.97 0.00 36.74
Total 324.92 19.22 0.00 728.12
Mitigated
Waste Disposed ROG NOx N2O CO2e
Land Use tons tons/yr MT/yr
CO SO2 Total CO2 CH4
Apartments Mid Rise 244.72 49.68 2.94 0.00 111.33
City Park 0.78 0.16 0.01 0.00 0.35
Elementary School 96.54 19.60 1.16 0.00 43.92
General Office Building
239.02 48.52 2.87 0.00 108.73
Government Office Building
102.3 20.77 1.23 0.00 46.54
Junior College (2Yr) 11.31 2.30 0.14 0.00 5.15
Medical Office Building
825.12 167.49 9.90 0.00 375.36
Single Family Housing
80.77 16.40 0.97 0.00 36.74
Total 324.92 19.22 0.00 728.12
27 of 28

9.0 Vegetation
28 of 28

CalEEMod Version: CalEEMod.2011.1.1 Date: 7/24/2012
Barrio Logan Alternative 1 (2030) - ChangeSan Diego County APCD Air District, Annual
1.0 Project Characteristics
1.1 Land Usage
Land Uses Size Metric
General Office Building 258.5 1000sqft
General Office Building 162.9 1000sqft
General Office Building 81.9 1000sqft
General Office Building 15.7 1000sqft
General Office Building 121.3 1000sqft
General Office Building 1071.3 1000sqft
Medical Office Building 36.3 1000sqft
Junior College (2Yr) 61.3 1000sqft
General Heavy Industry 3130.4 1000sqft
General Light Industry 79.5 1000sqft
Refrigerated Warehouse-No Rail 90.6 1000sqft
Fast Food Restaurant with Drive Thru 19.5 1000sqft
Apartments Mid Rise 3671 Dwelling Unit
Strip Mall 175.1 1000sqft
1 of 60

1.2 Other Project CharacteristicsUtility Company San Diego Gas & ElectricUrbanization Urban Wind Speed (m/s)
Climate Zone 13 2.6
Precipitation Freq (Days)
1.3 User Entered Comments 40
Project Characteristics -
Land Use -
Vechicle Emission Factors -
Vechicle Emission Factors -
Vechicle Emission Factors -
Area Mitigation -
Water Mitigation -
2.0 Emissions Summary
2.1 Overall Construction
Unmitigated Construction
ROG NOx CO SO2 Fugitive PM10
Exhaust PM10
PM10 Total Fugitive PM2.5
Exhaust PM2.5
PM2.5 Total
Bio- CO2 NBio- CO2 Total CO2 CH4 N2O CO2e
Year tons/yr MT/yr
2011 1.29 10.40 6.12 0.01 0.02 0.53 0.56 0.00 0.53 0.53 0.00 903.69 903.69 0.11 0.00 905.90
2012 1.40 11.27 6.48 0.01 3.67 0.56 4.23 1.73 0.56 2.29 0.00 1,012.12 1,012.12 0.11 0.00 1,014.50
2013 1.56 12.73 7.07 0.01 2.05 0.60 2.65 0.84 0.60 1.44 0.00 1,308.22 1,308.22 0.13 0.00 1,310.88
2014 3.27 19.84 25.23 0.05 5.15 0.87 6.02 0.89 0.83 1.73 0.00 4,523.97 4,523.97 0.26 0.00 4,529.35
2015 5.80 30.67 51.76 0.11 8.29 1.31 9.60 0.15 1.23 1.37 0.00 9,757.54 9,757.54 0.45 0.00 9,766.93
2 of 60

2016 5.42 28.51 48.13 0.11 8.29 1.23 9.52 0.15 1.15 1.30 0.00 9,637.29 9,637.29 0.42 0.00 9,646.02
2017 5.05 26.51 44.65 0.11 8.26 1.15 9.41 0.15 1.08 1.22 0.00 9,489.53 9,489.53 0.38 0.00 9,497.61
2018 4.75 24.92 41.87 0.11 8.29 1.09 9.39 0.15 1.02 1.17 0.00 9,422.10 9,422.10 0.36 0.00 9,429.67
2019 4.49 23.46 39.38 0.11 8.29 1.04 9.33 0.15 0.97 1.11 0.00 9,327.90 9,327.90 0.34 0.00 9,335.01
2020 4.30 22.30 37.45 0.11 8.32 0.99 9.32 0.15 0.92 1.07 0.00 9,276.69 9,276.69 0.32 0.00 9,283.41
2021 4.10 21.15 35.76 0.11 8.29 0.95 9.25 0.15 0.89 1.03 0.00 9,205.89 9,205.89 0.30 0.00 9,212.29
2022 3.92 20.18 33.96 0.11 8.26 0.92 9.18 0.15 0.85 1.00 0.00 9,098.12 9,098.12 0.29 0.00 9,104.19
2023 3.77 19.40 32.43 0.11 8.26 0.89 9.15 0.15 0.83 0.97 0.00 9,031.72 9,031.72 0.28 0.00 9,037.52
2024 3.66 18.90 31.29 0.11 8.32 0.88 9.20 0.15 0.81 0.96 0.00 9,040.97 9,040.97 0.27 0.00 9,046.59
2025 3.53 18.27 30.05 0.11 8.29 0.86 9.15 0.15 0.79 0.94 0.00 8,952.26 8,952.26 0.25 0.00 8,957.61
2026 3.53 18.27 30.05 0.11 8.29 0.86 9.15 0.15 0.79 0.94 0.00 8,952.26 8,952.26 0.25 0.00 8,957.61
2027 3.53 18.27 30.05 0.11 8.29 0.86 9.15 0.15 0.79 0.94 0.00 8,952.26 8,952.26 0.25 0.00 8,957.61
2028 3.52 18.20 29.94 0.11 8.26 0.85 9.11 0.15 0.79 0.94 0.00 8,917.96 8,917.96 0.25 0.00 8,923.29
2029 3.53 18.27 30.05 0.11 8.29 0.86 9.15 0.15 0.79 0.94 0.00 8,952.26 8,952.26 0.25 0.00 8,957.61
2030 3.10 16.58 26.23 0.11 8.29 0.80 9.09 0.15 0.74 0.88 0.00 8,759.54 8,759.54 0.22 0.00 8,764.20
2031 3.10 16.58 26.23 0.11 8.29 0.80 9.09 0.15 0.74 0.88 0.00 8,759.54 8,759.54 0.22 0.00 8,764.20
2032 1.53 8.28 13.18 0.05 3.73 0.40 4.13 0.07 0.37 0.43 0.00 4,125.95 4,125.95 0.11 0.00 4,128.28
2033 16.48 1.20 2.75 0.01 0.42 0.07 0.48 0.01 0.06 0.07 0.00 503.15 503.15 0.02 0.00 503.65
2034 55.42 0.38 3.18 0.01 1.36 0.06 1.42 0.02 0.05 0.08 0.00 846.35 846.35 0.03 0.00 847.00
Total 150.05 424.54 663.29 2.02 157.27 19.43 176.73 6.11 0.00 168,880.9318.18 24.23 0.00 168,757.28
Exhaust PM10
PM10 Total
168,757.28 5.87
PM2.5 Total
Bio- CO2
Mitigated Construction
ROG NOx CO SO2 Fugitive PM10
CO2eNBio- CO2 Total CO2 CH4 N2OFugitive PM2.5
Exhaust PM2.5
3 of 60
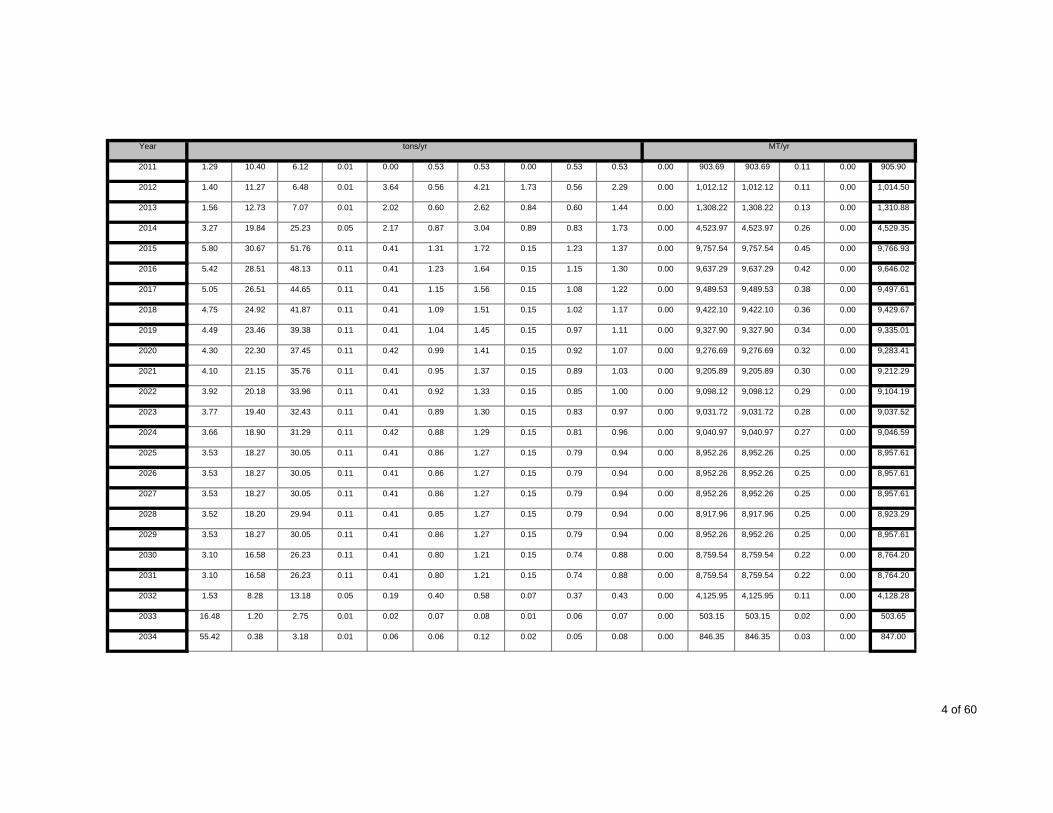
Year tons/yr MT/yr
2011 1.29 10.40 6.12 0.01 0.00 0.53 0.53 0.00 0.53 0.53 0.00 903.69 903.69 0.11 0.00 905.90
2012 1.40 11.27 6.48 0.01 3.64 0.56 4.21 1.73 0.56 2.29 0.00 1,012.12 1,012.12 0.11 0.00 1,014.50
2013 1.56 12.73 7.07 0.01 2.02 0.60 2.62 0.84 0.60 1.44 0.00 1,308.22 1,308.22 0.13 0.00 1,310.88
2014 3.27 19.84 25.23 0.05 2.17 0.87 3.04 0.89 0.83 1.73 0.00 4,523.97 4,523.97 0.26 0.00 4,529.35
2015 5.80 30.67 51.76 0.11 0.41 1.31 1.72 0.15 1.23 1.37 0.00 9,757.54 9,757.54 0.45 0.00 9,766.93
2016 5.42 28.51 48.13 0.11 0.41 1.23 1.64 0.15 1.15 1.30 0.00 9,637.29 9,637.29 0.42 0.00 9,646.02
2017 5.05 26.51 44.65 0.11 0.41 1.15 1.56 0.15 1.08 1.22 0.00 9,489.53 9,489.53 0.38 0.00 9,497.61
2018 4.75 24.92 41.87 0.11 0.41 1.09 1.51 0.15 1.02 1.17 0.00 9,422.10 9,422.10 0.36 0.00 9,429.67
2019 4.49 23.46 39.38 0.11 0.41 1.04 1.45 0.15 0.97 1.11 0.00 9,327.90 9,327.90 0.34 0.00 9,335.01
2020 4.30 22.30 37.45 0.11 0.42 0.99 1.41 0.15 0.92 1.07 0.00 9,276.69 9,276.69 0.32 0.00 9,283.41
2021 4.10 21.15 35.76 0.11 0.41 0.95 1.37 0.15 0.89 1.03 0.00 9,205.89 9,205.89 0.30 0.00 9,212.29
2022 3.92 20.18 33.96 0.11 0.41 0.92 1.33 0.15 0.85 1.00 0.00 9,098.12 9,098.12 0.29 0.00 9,104.19
2023 3.77 19.40 32.43 0.11 0.41 0.89 1.30 0.15 0.83 0.97 0.00 9,031.72 9,031.72 0.28 0.00 9,037.52
2024 3.66 18.90 31.29 0.11 0.42 0.88 1.29 0.15 0.81 0.96 0.00 9,040.97 9,040.97 0.27 0.00 9,046.59
2025 3.53 18.27 30.05 0.11 0.41 0.86 1.27 0.15 0.79 0.94 0.00 8,952.26 8,952.26 0.25 0.00 8,957.61
2026 3.53 18.27 30.05 0.11 0.41 0.86 1.27 0.15 0.79 0.94 0.00 8,952.26 8,952.26 0.25 0.00 8,957.61
2027 3.53 18.27 30.05 0.11 0.41 0.86 1.27 0.15 0.79 0.94 0.00 8,952.26 8,952.26 0.25 0.00 8,957.61
2028 3.52 18.20 29.94 0.11 0.41 0.85 1.27 0.15 0.79 0.94 0.00 8,917.96 8,917.96 0.25 0.00 8,923.29
2029 3.53 18.27 30.05 0.11 0.41 0.86 1.27 0.15 0.79 0.94 0.00 8,952.26 8,952.26 0.25 0.00 8,957.61
2030 3.10 16.58 26.23 0.11 0.41 0.80 1.21 0.15 0.74 0.88 0.00 8,759.54 8,759.54 0.22 0.00 8,764.20
2031 3.10 16.58 26.23 0.11 0.41 0.80 1.21 0.15 0.74 0.88 0.00 8,759.54 8,759.54 0.22 0.00 8,764.20
2032 1.53 8.28 13.18 0.05 0.19 0.40 0.58 0.07 0.37 0.43 0.00 4,125.95 4,125.95 0.11 0.00 4,128.28
2033 16.48 1.20 2.75 0.01 0.02 0.07 0.08 0.01 0.06 0.07 0.00 503.15 503.15 0.02 0.00 503.65
2034 55.42 0.38 3.18 0.01 0.06 0.06 0.12 0.02 0.05 0.08 0.00 846.35 846.35 0.03 0.00 847.00
4 of 60
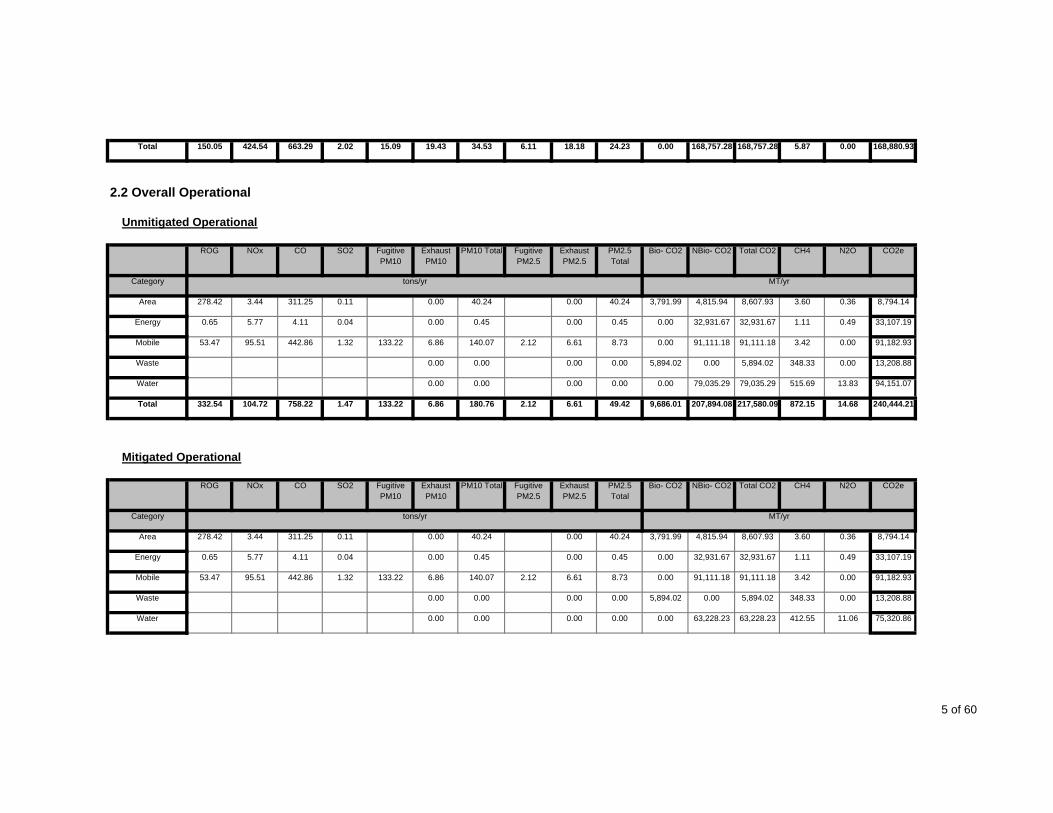
Total 150.05 424.54 663.29 168,757.28 5.87 0.006.11 18.18 24.23 0.00
SO2 Fugitive PM10
Exhaust PM10
168,757.282.02 15.09 19.43 34.53
Fugitive PM2.5
Exhaust PM2.5
PM2.5 Total
168,880.93
2.2 Overall Operational
Unmitigated Operational
ROG NOx CO N2O CO2e
Category tons/yr MT/yr
Bio- CO2 NBio- CO2 Total CO2 CH4PM10 Total
Area 278.42 3.44 311.25 0.11 0.00 40.24 0.00 40.24 3,791.99 4,815.94 8,607.93 3.60 0.36 8,794.14
Energy 0.65 5.77 4.11 0.04 0.00 0.45 0.00 0.45 0.00 32,931.67 32,931.67 1.11 0.49 33,107.19
Mobile 53.47 95.51 442.86 1.32 133.22 6.86 140.07 2.12 6.61 8.73 0.00 91,111.18 91,111.18 3.42 0.00 91,182.93
Waste 0.00 0.00 0.00 0.00 5,894.02 0.00 5,894.02 348.33 0.00 13,208.88
Water 0.00 0.00 0.00 0.00 0.00 79,035.29 79,035.29 515.69 13.83 94,151.07
Total 332.54 104.72 758.22 1.47 133.22 6.86 180.76 2.12 14.68 240,444.216.61 49.42 9,686.01 207,894.08
Exhaust PM10
PM10 Total
217,580.09 872.15
PM2.5 Total
Bio- CO2
Mitigated Operational
ROG NOx CO SO2 Fugitive PM10
CO2e
Category tons/yr MT/yr
NBio- CO2 Total CO2 CH4 N2OFugitive PM2.5
Exhaust PM2.5
Area 278.42 3.44 311.25 0.11 0.00 40.24 0.00 40.24 3,791.99 4,815.94 8,607.93 3.60 0.36 8,794.14
Energy 0.65 5.77 4.11 0.04 0.00 0.45 0.00 0.45 0.00 32,931.67 32,931.67 1.11 0.49 33,107.19
Mobile 53.47 95.51 442.86 1.32 133.22 6.86 140.07 2.12 6.61 8.73 0.00 91,111.18 91,111.18 3.42 0.00 91,182.93
Waste 0.00 0.00 0.00 0.00 5,894.02 0.00 5,894.02 348.33 0.00 13,208.88
Water 0.00 0.00 0.00 0.00 0.00 63,228.23 63,228.23 412.55 11.06 75,320.86
5 of 60
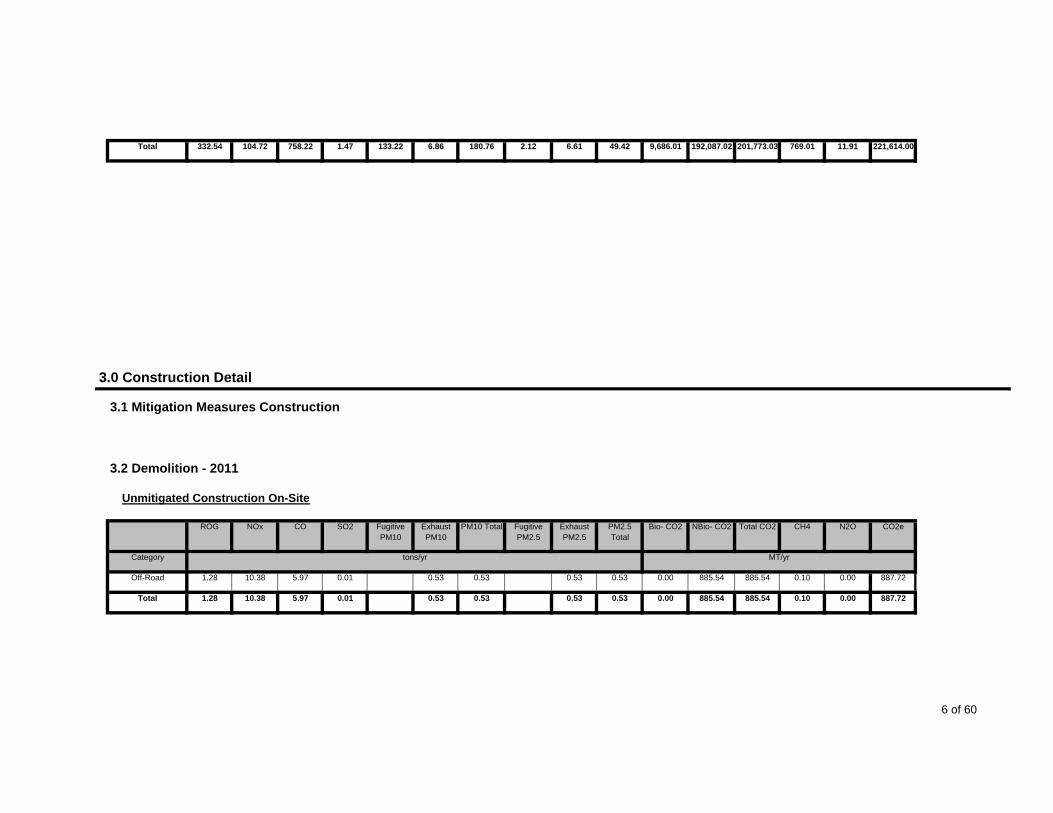
Total 332.54 104.72 758.22 1.47 133.22 6.86 180.76 2.12 6.61 49.42 9,686.01 192,087.02 201,773.03 769.01 11.91 221,614.00
SO2 Fugitive PM10
Exhaust PM10
3.0 Construction Detail
3.1 Mitigation Measures Construction
Fugitive PM2.5
Exhaust PM2.5
PM2.5 Total
3.2 Demolition - 2011
Unmitigated Construction On-Site
ROG NOx CO N2O CO2e
Category tons/yr MT/yr
Bio- CO2 NBio- CO2 Total CO2 CH4PM10 Total
Off-Road 1.28 10.38 5.97 0.01 0.53 0.53 0.53 0.53 0.00 885.54 885.54 0.10 0.00 887.72
Total 1.28 10.38 5.97 0.01 0.53 0.53 0.00 887.720.53 0.53 0.00 885.54 885.54 0.10
6 of 60

Exhaust PM10
PM10 Total PM2.5 Total
Bio- CO2
Unmitigated Construction Off-Site
ROG NOx CO SO2 Fugitive PM10
CO2e
Category tons/yr MT/yr
NBio- CO2 Total CO2 CH4 N2OFugitive PM2.5
Exhaust PM2.5
Hauling 0.00 0.00 0.00 0.00 0.00 0.00 0.00 0.00 0.00 0.00 0.00 0.00 0.00 0.00 0.00 0.00
Vendor 0.00 0.00 0.00 0.00 0.00 0.00 0.00 0.00 0.00 0.00 0.00 0.00 0.00 0.00 0.00 0.00
Worker 0.01 0.02 0.15 0.00 0.02 0.00 0.02 0.00 0.00 0.00 0.00 18.15 18.15 0.00 0.00 18.18
Total 0.01 0.02 0.15 0.00 0.02 0.00 0.02 0.00 0.00 18.180.00 0.00 0.00 18.15
Exhaust PM10
PM10 Total
18.15 0.00
PM2.5 Total
Bio- CO2
Mitigated Construction On-Site
ROG NOx CO SO2 Fugitive PM10
CO2e
Category tons/yr MT/yr
NBio- CO2 Total CO2 CH4 N2OFugitive PM2.5
Exhaust PM2.5
Off-Road 1.28 10.38 5.97 0.01 0.53 0.53 0.53 0.53 0.00 885.54 885.54 0.10 0.00 887.72
Total 1.28 10.38 5.97 0.01 0.53 0.53 0.00 887.720.53 0.53 0.00 885.54
Exhaust PM10
PM10 Total
885.54 0.10
PM2.5 Total
Bio- CO2
Mitigated Construction Off-Site
ROG NOx CO SO2 Fugitive PM10
CO2e
Category tons/yr MT/yr
NBio- CO2 Total CO2 CH4 N2OFugitive PM2.5
Exhaust PM2.5
Hauling 0.00 0.00 0.00 0.00 0.00 0.00 0.00 0.00 0.00 0.00 0.00 0.00 0.00 0.00 0.00 0.00
Vendor 0.00 0.00 0.00 0.00 0.00 0.00 0.00 0.00 0.00 0.00 0.00 0.00 0.00 0.00 0.00 0.00
7 of 60

Worker 0.01 0.02 0.15 0.00 0.00 0.00 0.00 0.00 0.00 0.00 0.00 18.15 18.15 0.00 0.00 18.18
Total 0.01 0.02 0.15 0.00 0.00 0.00 0.00 0.00 0.00 18.180.00 0.00 0.00 18.15
Exhaust PM10
PM10 Total
18.15 0.00
PM2.5 Total
Bio- CO2
3.2 Demolition - 2012
Unmitigated Construction On-Site
ROG NOx CO SO2 Fugitive PM10
CO2e
Category tons/yr MT/yr
NBio- CO2 Total CO2 CH4 N2OFugitive PM2.5
Exhaust PM2.5
Off-Road 0.19 1.50 0.88 0.00 0.08 0.08 0.08 0.08 0.00 136.24 136.24 0.02 0.00 136.55
Total 0.19 1.50 0.88 0.00 0.08 0.08 0.00 136.550.08 0.08 0.00 136.24
Exhaust PM10
PM10 Total
136.24 0.02
PM2.5 Total
Bio- CO2
Unmitigated Construction Off-Site
ROG NOx CO SO2 Fugitive PM10
CO2e
Category tons/yr MT/yr
NBio- CO2 Total CO2 CH4 N2OFugitive PM2.5
Exhaust PM2.5
Hauling 0.00 0.00 0.00 0.00 0.00 0.00 0.00 0.00 0.00 0.00 0.00 0.00 0.00 0.00 0.00 0.00
Vendor 0.00 0.00 0.00 0.00 0.00 0.00 0.00 0.00 0.00 0.00 0.00 0.00 0.00 0.00 0.00 0.00
Worker 0.00 0.00 0.02 0.00 0.00 0.00 0.00 0.00 0.00 0.00 0.00 2.73 2.73 0.00 0.00 2.74
Total 0.00 0.00 0.02 0.00 0.00 0.00 0.00 0.00 0.00 2.740.00 0.00 0.00 2.73
Exhaust PM10
PM10 Total
2.73 0.00
PM2.5 Total
Bio- CO2
Mitigated Construction On-Site
ROG NOx CO SO2 Fugitive PM10
CO2eNBio- CO2 Total CO2 CH4 N2OFugitive PM2.5
Exhaust PM2.5
8 of 60
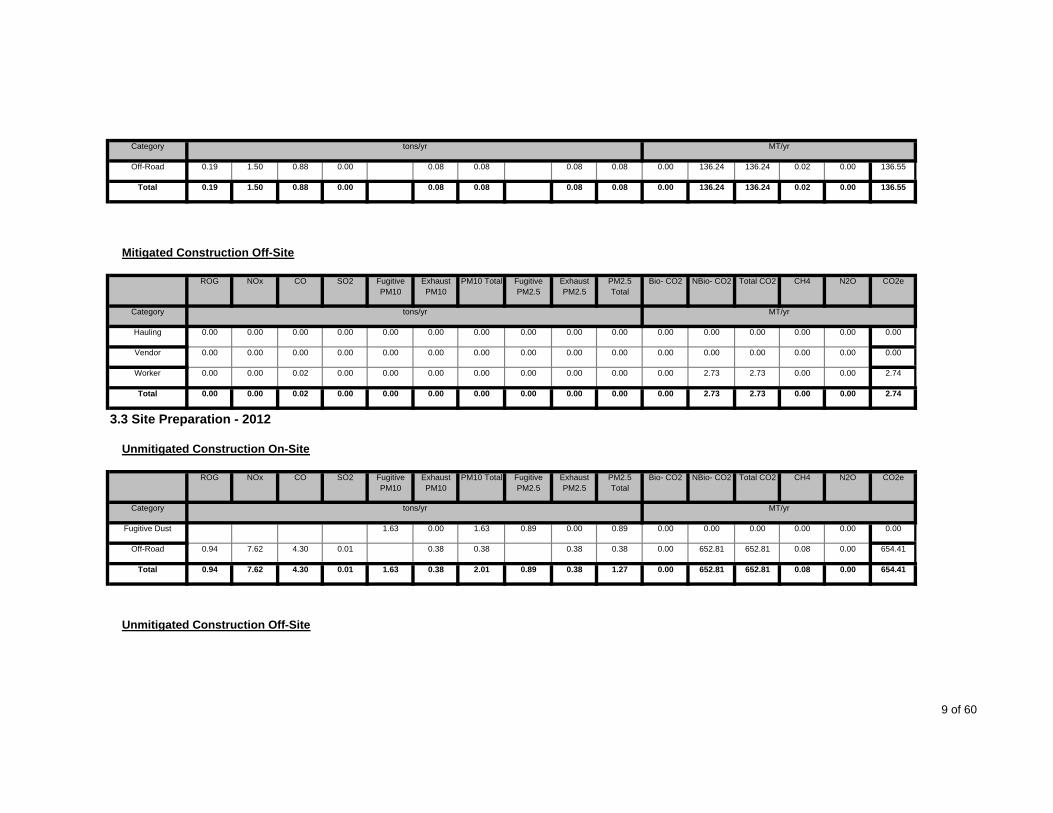
Category tons/yr MT/yr
Off-Road 0.19 1.50 0.88 0.00 0.08 0.08 0.08 0.08 0.00 136.24 136.24 0.02 0.00 136.55
Total 0.19 1.50 0.88 0.00 0.08 0.08 0.00 136.550.08 0.08 0.00 136.24
Exhaust PM10
PM10 Total
136.24 0.02
PM2.5 Total
Bio- CO2
Mitigated Construction Off-Site
ROG NOx CO SO2 Fugitive PM10
CO2e
Category tons/yr MT/yr
NBio- CO2 Total CO2 CH4 N2OFugitive PM2.5
Exhaust PM2.5
Hauling 0.00 0.00 0.00 0.00 0.00 0.00 0.00 0.00 0.00 0.00 0.00 0.00 0.00 0.00 0.00 0.00
Vendor 0.00 0.00 0.00 0.00 0.00 0.00 0.00 0.00 0.00 0.00 0.00 0.00 0.00 0.00 0.00 0.00
Worker 0.00 0.00 0.02 0.00 0.00 0.00 0.00 0.00 0.00 0.00 0.00 2.73 2.73 0.00 0.00 2.74
Total 0.00 0.00 0.02 0.00 0.00 0.00 0.00 0.00 0.00 2.740.00 0.00 0.00 2.73
Exhaust PM10
PM10 Total
2.73 0.00
PM2.5 Total
Bio- CO2
3.3 Site Preparation - 2012
Unmitigated Construction On-Site
ROG NOx CO SO2 Fugitive PM10
CO2e
Category tons/yr MT/yr
NBio- CO2 Total CO2 CH4 N2OFugitive PM2.5
Exhaust PM2.5
Fugitive Dust 1.63 0.00 1.63 0.89 0.00 0.89 0.00 0.00 0.00 0.00 0.00 0.00
Off-Road 0.94 7.62 4.30 0.01 0.38 0.38 0.38 0.38 0.00 652.81 652.81 0.08 0.00 654.41
Total 0.94 7.62 4.30 652.81 0.08 0.000.89 0.38 1.27 0.00 652.810.01 1.63 0.38 2.01 654.41
Unmitigated Construction Off-Site
9 of 60

SO2 Fugitive PM10
Exhaust PM10
Fugitive PM2.5
Exhaust PM2.5
PM2.5 Total
ROG NOx CO N2O CO2e
Category tons/yr MT/yr
Bio- CO2 NBio- CO2 Total CO2 CH4PM10 Total
Hauling 0.00 0.00 0.00 0.00 0.00 0.00 0.00 0.00 0.00 0.00 0.00 0.00 0.00 0.00 0.00 0.00
Vendor 0.00 0.00 0.00 0.00 0.00 0.00 0.00 0.00 0.00 0.00 0.00 0.00 0.00 0.00 0.00 0.00
Worker 0.01 0.01 0.12 0.00 0.02 0.00 0.02 0.00 0.00 0.00 0.00 14.76 14.76 0.00 0.00 14.78
Total 0.01 0.01 0.12 0.00 0.02 0.00 0.02 0.00 0.00 14.780.00 0.00 0.00 14.76
Exhaust PM10
PM10 Total
14.76 0.00
PM2.5 Total
Bio- CO2
Mitigated Construction On-Site
ROG NOx CO SO2 Fugitive PM10
CO2e
Category tons/yr MT/yr
NBio- CO2 Total CO2 CH4 N2OFugitive PM2.5
Exhaust PM2.5
Fugitive Dust 1.63 0.00 1.63 0.89 0.00 0.89 0.00 0.00 0.00 0.00 0.00 0.00
Off-Road 0.94 7.62 4.30 0.01 0.38 0.38 0.38 0.38 0.00 652.81 652.81 0.08 0.00 654.41
Total 0.94 7.62 4.30 652.81 0.08 0.000.89 0.38 1.27 0.00
SO2 Fugitive PM10
Exhaust PM10
652.810.01 1.63 0.38 2.01
Fugitive PM2.5
Exhaust PM2.5
PM2.5 Total
654.41
Mitigated Construction Off-Site
ROG NOx CO N2O CO2e
Category tons/yr MT/yr
Bio- CO2 NBio- CO2 Total CO2 CH4PM10 Total
Hauling 0.00 0.00 0.00 0.00 0.00 0.00 0.00 0.00 0.00 0.00 0.00 0.00 0.00 0.00 0.00 0.00
Vendor 0.00 0.00 0.00 0.00 0.00 0.00 0.00 0.00 0.00 0.00 0.00 0.00 0.00 0.00 0.00 0.00
Worker 0.01 0.01 0.12 0.00 0.00 0.00 0.00 0.00 0.00 0.00 0.00 14.76 14.76 0.00 0.00 14.78
Total 0.01 0.01 0.12 0.00 0.00 0.00 0.00 0.00 0.00 14.780.00 0.00 0.00 14.76 14.76 0.00
10 of 60

Exhaust PM10
PM10 Total PM2.5 Total
Bio- CO2
3.4 Grading - 2012
Unmitigated Construction On-Site
ROG NOx CO SO2 Fugitive PM10
CO2e
Category tons/yr MT/yr
NBio- CO2 Total CO2 CH4 N2OFugitive PM2.5
Exhaust PM2.5
Fugitive Dust 2.02 0.00 2.02 0.84 0.00 0.84 0.00 0.00 0.00 0.00 0.00 0.00
Off-Road 0.26 2.13 1.13 0.00 0.10 0.10 0.10 0.10 0.00 201.85 201.85 0.02 0.00 202.29
Total 0.26 2.13 1.13 201.85 0.02 0.000.84 0.10 0.94 0.00
SO2 Fugitive PM10
Exhaust PM10
201.850.00 2.02 0.10 2.12
Fugitive PM2.5
Exhaust PM2.5
PM2.5 Total
202.29
Unmitigated Construction Off-Site
ROG NOx CO N2O CO2e
Category tons/yr MT/yr
Bio- CO2 NBio- CO2 Total CO2 CH4PM10 Total
Hauling 0.00 0.00 0.00 0.00 0.00 0.00 0.00 0.00 0.00 0.00 0.00 0.00 0.00 0.00 0.00 0.00
Vendor 0.00 0.00 0.00 0.00 0.00 0.00 0.00 0.00 0.00 0.00 0.00 0.00 0.00 0.00 0.00 0.00
Worker 0.00 0.00 0.03 0.00 0.00 0.00 0.00 0.00 0.00 0.00 0.00 3.73 3.73 0.00 0.00 3.74
Total 0.00 0.00 0.03 0.00 0.00 0.00 0.00 0.00 0.00 3.740.00 0.00 0.00 3.73
Exhaust PM10
PM10 Total
3.73 0.00
PM2.5 Total
Bio- CO2
Mitigated Construction On-Site
ROG NOx CO SO2 Fugitive PM10
CO2e
Category tons/yr MT/yr
NBio- CO2 Total CO2 CH4 N2OFugitive PM2.5
Exhaust PM2.5
Fugitive Dust 2.02 0.00 2.02 0.84 0.00 0.84 0.00 0.00 0.00 0.00 0.00 0.00
11 of 60

Off-Road 0.26 2.13 1.13 0.00 0.10 0.10 0.10 0.10 0.00 201.85 201.85 0.02 0.00 202.29
Total 0.26 2.13 1.13 201.85 0.02 0.000.84 0.10 0.94 0.00
SO2 Fugitive PM10
Exhaust PM10
201.850.00 2.02 0.10 2.12
Fugitive PM2.5
Exhaust PM2.5
PM2.5 Total
202.29
Mitigated Construction Off-Site
ROG NOx CO N2O CO2e
Category tons/yr MT/yr
Bio- CO2 NBio- CO2 Total CO2 CH4PM10 Total
Hauling 0.00 0.00 0.00 0.00 0.00 0.00 0.00 0.00 0.00 0.00 0.00 0.00 0.00 0.00 0.00 0.00
Vendor 0.00 0.00 0.00 0.00 0.00 0.00 0.00 0.00 0.00 0.00 0.00 0.00 0.00 0.00 0.00 0.00
Worker 0.00 0.00 0.03 0.00 0.00 0.00 0.00 0.00 0.00 0.00 0.00 3.73 3.73 0.00 0.00 3.74
Total 0.00 0.00 0.03 0.00 0.00 0.00 0.00 0.00 0.00 3.740.00 0.00 0.00 3.73
Exhaust PM10
PM10 Total
3.73 0.00
PM2.5 Total
Bio- CO2
3.4 Grading - 2013
Unmitigated Construction On-Site
ROG NOx CO SO2 Fugitive PM10
CO2e
Category tons/yr MT/yr
NBio- CO2 Total CO2 CH4 N2OFugitive PM2.5
Exhaust PM2.5
Fugitive Dust 2.02 0.00 2.02 0.84 0.00 0.84 0.00 0.00 0.00 0.00 0.00 0.00
Off-Road 1.55 12.72 6.89 0.01 0.60 0.60 0.60 0.60 0.00 1,284.94 1,284.94 0.13 0.00 1,287.58
Total 1.55 12.72 6.89 1,284.94 0.13 0.000.84 0.60 1.44 0.00
SO2 Fugitive PM10
Exhaust PM10
1,284.940.01 2.02 0.60 2.62
Fugitive PM2.5
Exhaust PM2.5
PM2.5 Total
1,287.58
Unmitigated Construction Off-Site
ROG NOx CO N2O CO2eBio- CO2 NBio- CO2 Total CO2 CH4PM10 Total
12 of 60

Category tons/yr MT/yr
Hauling 0.00 0.00 0.00 0.00 0.00 0.00 0.00 0.00 0.00 0.00 0.00 0.00 0.00 0.00 0.00 0.00
Vendor 0.00 0.00 0.00 0.00 0.00 0.00 0.00 0.00 0.00 0.00 0.00 0.00 0.00 0.00 0.00 0.00
Worker 0.02 0.02 0.17 0.00 0.03 0.00 0.03 0.00 0.00 0.00 0.00 23.27 23.27 0.00 0.00 23.30
Total 0.02 0.02 0.17 0.00 0.03 0.00 0.03 0.00 0.00 23.300.00 0.00 0.00 23.27
Exhaust PM10
PM10 Total
23.27 0.00
PM2.5 Total
Bio- CO2
Mitigated Construction On-Site
ROG NOx CO SO2 Fugitive PM10
CO2e
Category tons/yr MT/yr
NBio- CO2 Total CO2 CH4 N2OFugitive PM2.5
Exhaust PM2.5
Fugitive Dust 2.02 0.00 2.02 0.84 0.00 0.84 0.00 0.00 0.00 0.00 0.00 0.00
Off-Road 1.55 12.72 6.89 0.01 0.60 0.60 0.60 0.60 0.00 1,284.94 1,284.94 0.13 0.00 1,287.58
Total 1.55 12.72 6.89 1,284.94 0.13 0.000.84 0.60 1.44 0.00
SO2 Fugitive PM10
Exhaust PM10
1,284.940.01 2.02 0.60 2.62
Fugitive PM2.5
Exhaust PM2.5
PM2.5 Total
1,287.58
Mitigated Construction Off-Site
ROG NOx CO N2O CO2e
Category tons/yr MT/yr
Bio- CO2 NBio- CO2 Total CO2 CH4PM10 Total
Hauling 0.00 0.00 0.00 0.00 0.00 0.00 0.00 0.00 0.00 0.00 0.00 0.00 0.00 0.00 0.00 0.00
Vendor 0.00 0.00 0.00 0.00 0.00 0.00 0.00 0.00 0.00 0.00 0.00 0.00 0.00 0.00 0.00 0.00
Worker 0.02 0.02 0.17 0.00 0.00 0.00 0.00 0.00 0.00 0.00 0.00 23.27 23.27 0.00 0.00 23.30
Total 0.02 0.02 0.17 0.00 0.00 0.00 0.00 0.00 0.00 23.300.00 0.00 0.00 23.27 23.27 0.00
3.4 Grading - 2014
13 of 60

Exhaust PM10
PM10 Total PM2.5 Total
Bio- CO2
Unmitigated Construction On-Site
ROG NOx CO SO2 Fugitive PM10
CO2e
Category tons/yr MT/yr
NBio- CO2 Total CO2 CH4 N2OFugitive PM2.5
Exhaust PM2.5
Fugitive Dust 2.02 0.00 2.02 0.84 0.00 0.84 0.00 0.00 0.00 0.00 0.00 0.00
Off-Road 0.91 7.39 4.14 0.01 0.34 0.34 0.34 0.34 0.00 802.47 802.47 0.07 0.00 804.03
Total 0.91 7.39 4.14 802.47 0.07 0.000.84 0.34 1.18 0.00
SO2 Fugitive PM10
Exhaust PM10
802.470.01 2.02 0.34 2.36
Fugitive PM2.5
Exhaust PM2.5
PM2.5 Total
804.03
Unmitigated Construction Off-Site
ROG NOx CO N2O CO2e
Category tons/yr MT/yr
Bio- CO2 NBio- CO2 Total CO2 CH4PM10 Total
Hauling 0.00 0.00 0.00 0.00 0.00 0.00 0.00 0.00 0.00 0.00 0.00 0.00 0.00 0.00 0.00 0.00
Vendor 0.00 0.00 0.00 0.00 0.00 0.00 0.00 0.00 0.00 0.00 0.00 0.00 0.00 0.00 0.00 0.00
Worker 0.01 0.01 0.10 0.00 0.02 0.00 0.02 0.00 0.00 0.00 0.00 14.23 14.23 0.00 0.00 14.25
Total 0.01 0.01 0.10 0.00 0.02 0.00 0.02 0.00 0.00 14.250.00 0.00 0.00 14.23
Exhaust PM10
PM10 Total
14.23 0.00
PM2.5 Total
Bio- CO2
Mitigated Construction On-Site
ROG NOx CO SO2 Fugitive PM10
CO2e
Category tons/yr MT/yr
NBio- CO2 Total CO2 CH4 N2OFugitive PM2.5
Exhaust PM2.5
Fugitive Dust 2.02 0.00 2.02 0.84 0.00 0.84 0.00 0.00 0.00 0.00 0.00 0.00
Off-Road 0.91 7.39 4.14 0.01 0.34 0.34 0.34 0.34 0.00 802.47 802.47 0.07 0.00 804.03
14 of 60

Total 0.91 7.39 4.14 802.47 0.07 0.000.84 0.34 1.18 0.00
SO2 Fugitive PM10
Exhaust PM10
802.470.01 2.02 0.34 2.36
Fugitive PM2.5
Exhaust PM2.5
PM2.5 Total
804.03
Mitigated Construction Off-Site
ROG NOx CO N2O CO2e
Category tons/yr MT/yr
Bio- CO2 NBio- CO2 Total CO2 CH4PM10 Total
Hauling 0.00 0.00 0.00 0.00 0.00 0.00 0.00 0.00 0.00 0.00 0.00 0.00 0.00 0.00 0.00 0.00
Vendor 0.00 0.00 0.00 0.00 0.00 0.00 0.00 0.00 0.00 0.00 0.00 0.00 0.00 0.00 0.00 0.00
Worker 0.01 0.01 0.10 0.00 0.00 0.00 0.00 0.00 0.00 0.00 0.00 14.23 14.23 0.00 0.00 14.25
Total 0.01 0.01 0.10 0.00 0.00 0.00 0.00 0.00 0.00 14.250.00 0.00 0.00 14.23
Exhaust PM10
PM10 Total
14.23 0.00
PM2.5 Total
Bio- CO2
3.5 Building Construction - 2014
Unmitigated Construction On-Site
ROG NOx CO SO2 Fugitive PM10
CO2e
Category tons/yr MT/yr
NBio- CO2 Total CO2 CH4 N2OFugitive PM2.5
Exhaust PM2.5
Off-Road 0.23 1.57 1.14 0.00 0.10 0.10 0.10 0.10 0.00 179.56 179.56 0.02 0.00 179.96
Total 0.23 1.57 1.14 0.00 0.10 0.10 0.00 179.960.10 0.10 0.00 179.56
Exhaust PM10
PM10 Total
179.56 0.02
PM2.5 Total
Bio- CO2
Unmitigated Construction Off-Site
ROG NOx CO SO2 Fugitive PM10
CO2e
Category tons/yr MT/yr
NBio- CO2 Total CO2 CH4 N2OFugitive PM2.5
Exhaust PM2.5
15 of 60
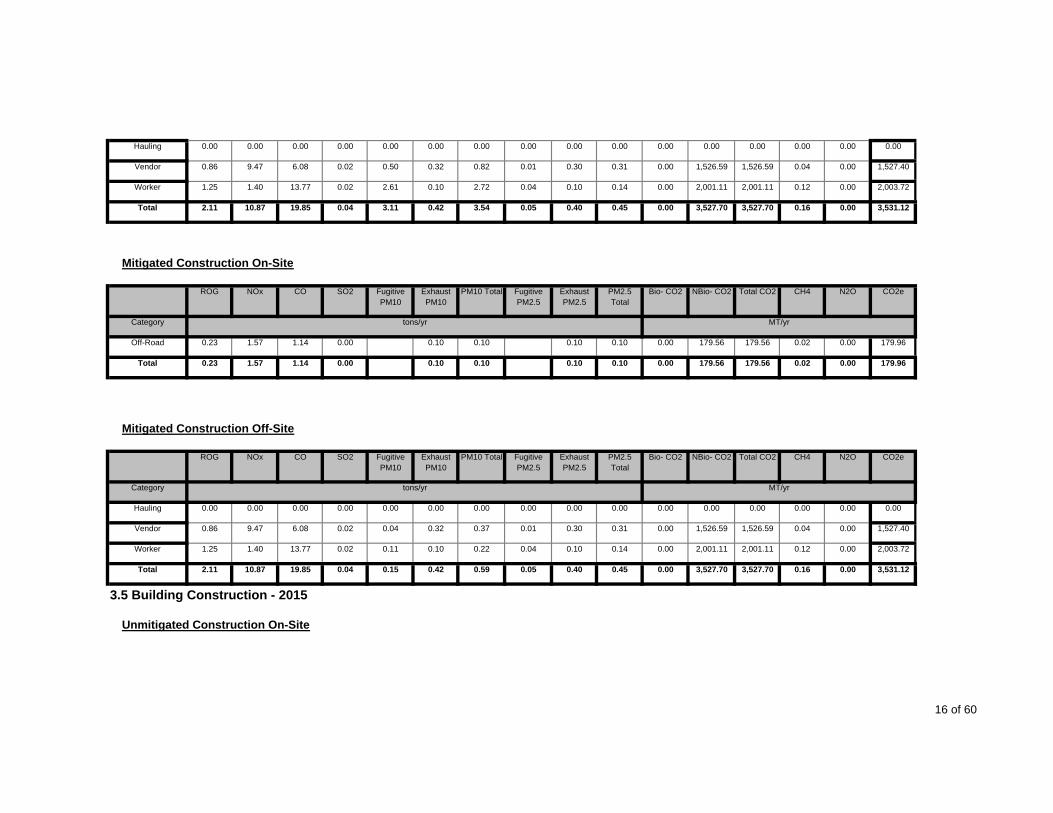
Hauling 0.00 0.00 0.00 0.00 0.00 0.00 0.00 0.00 0.00 0.00 0.00 0.00 0.00 0.00 0.00 0.00
Vendor 0.86 9.47 6.08 0.02 0.50 0.32 0.82 0.01 0.30 0.31 0.00 1,526.59 1,526.59 0.04 0.00 1,527.40
Worker 1.25 1.40 13.77 0.02 2.61 0.10 2.72 0.04 0.10 0.14 0.00 2,001.11 2,001.11 0.12 0.00 2,003.72
Total 2.11 10.87 19.85 0.04 3.11 0.42 3.54 0.05 0.00 3,531.120.40 0.45 0.00 3,527.70
Exhaust PM10
PM10 Total
3,527.70 0.16
PM2.5 Total
Bio- CO2
Mitigated Construction On-Site
ROG NOx CO SO2 Fugitive PM10
CO2e
Category tons/yr MT/yr
NBio- CO2 Total CO2 CH4 N2OFugitive PM2.5
Exhaust PM2.5
Off-Road 0.23 1.57 1.14 0.00 0.10 0.10 0.10 0.10 0.00 179.56 179.56 0.02 0.00 179.96
Total 0.23 1.57 1.14 0.00 0.10 0.10 0.00 179.960.10 0.10 0.00 179.56
Exhaust PM10
PM10 Total
179.56 0.02
PM2.5 Total
Bio- CO2
Mitigated Construction Off-Site
ROG NOx CO SO2 Fugitive PM10
CO2e
Category tons/yr MT/yr
NBio- CO2 Total CO2 CH4 N2OFugitive PM2.5
Exhaust PM2.5
Hauling 0.00 0.00 0.00 0.00 0.00 0.00 0.00 0.00 0.00 0.00 0.00 0.00 0.00 0.00 0.00 0.00
Vendor 0.86 9.47 6.08 0.02 0.04 0.32 0.37 0.01 0.30 0.31 0.00 1,526.59 1,526.59 0.04 0.00 1,527.40
Worker 1.25 1.40 13.77 0.02 0.11 0.10 0.22 0.04 0.10 0.14 0.00 2,001.11 2,001.11 0.12 0.00 2,003.72
Total 2.11 10.87 19.85 0.04 0.15 0.42 0.59 0.05 0.00 3,531.120.40 0.45 0.00 3,527.70 3,527.70 0.16
3.5 Building Construction - 2015
Unmitigated Construction On-Site
16 of 60

Exhaust PM10
PM10 Total PM2.5 Total
Bio- CO2ROG NOx CO SO2 Fugitive PM10
CO2e
Category tons/yr MT/yr
NBio- CO2 Total CO2 CH4 N2OFugitive PM2.5
Exhaust PM2.5
Off-Road 0.57 3.80 3.00 0.01 0.23 0.23 0.23 0.23 0.00 478.23 478.23 0.05 0.00 479.20
Total 0.57 3.80 3.00 0.01 0.23 0.23 0.00 479.200.23 0.23 0.00 478.23
Exhaust PM10
PM10 Total
478.23 0.05
PM2.5 Total
Bio- CO2
Unmitigated Construction Off-Site
ROG NOx CO SO2 Fugitive PM10
CO2e
Category tons/yr MT/yr
NBio- CO2 Total CO2 CH4 N2OFugitive PM2.5
Exhaust PM2.5
Hauling 0.00 0.00 0.00 0.00 0.00 0.00 0.00 0.00 0.00 0.00 0.00 0.00 0.00 0.00 0.00 0.00
Vendor 2.12 23.44 15.01 0.04 1.33 0.80 2.13 0.04 0.73 0.77 0.00 4,071.34 4,071.34 0.09 0.00 4,073.33
Worker 3.12 3.43 33.75 0.06 6.96 0.28 7.24 0.11 0.26 0.36 0.00 5,207.97 5,207.97 0.31 0.00 5,214.40
Total 5.24 26.87 48.76 0.10 8.29 1.08 9.37 0.15 0.00 9,287.730.99 1.13 0.00 9,279.31
Exhaust PM10
PM10 Total
9,279.31 0.40
PM2.5 Total
Bio- CO2
Mitigated Construction On-Site
ROG NOx CO SO2 Fugitive PM10
CO2e
Category tons/yr MT/yr
NBio- CO2 Total CO2 CH4 N2OFugitive PM2.5
Exhaust PM2.5
Off-Road 0.57 3.80 3.00 0.01 0.23 0.23 0.23 0.23 0.00 478.23 478.23 0.05 0.00 479.20
Total 0.57 3.80 3.00 0.01 0.23 0.23 0.00 479.200.23 0.23 0.00 478.23 478.23 0.05
17 of 60

Exhaust PM10
PM10 Total PM2.5 Total
Bio- CO2
Mitigated Construction Off-Site
ROG NOx CO SO2 Fugitive PM10
CO2e
Category tons/yr MT/yr
NBio- CO2 Total CO2 CH4 N2OFugitive PM2.5
Exhaust PM2.5
Hauling 0.00 0.00 0.00 0.00 0.00 0.00 0.00 0.00 0.00 0.00 0.00 0.00 0.00 0.00 0.00 0.00
Vendor 2.12 23.44 15.01 0.04 0.12 0.80 0.91 0.04 0.73 0.77 0.00 4,071.34 4,071.34 0.09 0.00 4,073.33
Worker 3.12 3.43 33.75 0.06 0.30 0.28 0.58 0.11 0.26 0.36 0.00 5,207.97 5,207.97 0.31 0.00 5,214.40
Total 5.24 26.87 48.76 0.10 0.42 1.08 1.49 0.15 0.00 9,287.730.99 1.13 0.00 9,279.31
Exhaust PM10
PM10 Total
9,279.31 0.40
PM2.5 Total
Bio- CO2
3.5 Building Construction - 2016
Unmitigated Construction On-Site
ROG NOx CO SO2 Fugitive PM10
CO2e
Category tons/yr MT/yr
NBio- CO2 Total CO2 CH4 N2OFugitive PM2.5
Exhaust PM2.5
Off-Road 0.52 3.46 2.97 0.01 0.21 0.21 0.21 0.21 0.00 478.23 478.23 0.04 0.00 479.11
Total 0.52 3.46 2.97 0.01 0.21 0.21 0.00 479.110.21 0.21 0.00 478.23
Exhaust PM10
PM10 Total
478.23 0.04
PM2.5 Total
Bio- CO2
Unmitigated Construction Off-Site
ROG NOx CO SO2 Fugitive PM10
CO2e
Category tons/yr MT/yr
NBio- CO2 Total CO2 CH4 N2OFugitive PM2.5
Exhaust PM2.5
Hauling 0.00 0.00 0.00 0.00 0.00 0.00 0.00 0.00 0.00 0.00 0.00 0.00 0.00 0.00 0.00 0.00
Vendor 1.97 21.89 14.01 0.04 1.33 0.74 2.08 0.04 0.68 0.72 0.00 4,076.71 4,076.71 0.09 0.00 4,078.56
Worker 2.93 3.16 31.14 0.06 6.96 0.28 7.24 0.11 0.26 0.37 0.00 5,082.35 5,082.35 0.29 0.00 5,088.35
18 of 60

Total 4.90 25.05 45.15 0.10 8.29 1.02 9.32 0.15 0.00 9,166.910.94 1.09 0.00 9,159.06
Exhaust PM10
PM10 Total
9,159.06 0.38
PM2.5 Total
Bio- CO2
Mitigated Construction On-Site
ROG NOx CO SO2 Fugitive PM10
CO2e
Category tons/yr MT/yr
NBio- CO2 Total CO2 CH4 N2OFugitive PM2.5
Exhaust PM2.5
Off-Road 0.52 3.46 2.97 0.01 0.21 0.21 0.21 0.21 0.00 478.23 478.23 0.04 0.00 479.11
Total 0.52 3.46 2.97 0.01 0.21 0.21 0.00 479.110.21 0.21 0.00 478.23
Exhaust PM10
PM10 Total
478.23 0.04
PM2.5 Total
Bio- CO2
Mitigated Construction Off-Site
ROG NOx CO SO2 Fugitive PM10
CO2e
Category tons/yr MT/yr
NBio- CO2 Total CO2 CH4 N2OFugitive PM2.5
Exhaust PM2.5
Hauling 0.00 0.00 0.00 0.00 0.00 0.00 0.00 0.00 0.00 0.00 0.00 0.00 0.00 0.00 0.00 0.00
Vendor 1.97 21.89 14.01 0.04 0.12 0.74 0.86 0.04 0.68 0.72 0.00 4,076.71 4,076.71 0.09 0.00 4,078.56
Worker 2.93 3.16 31.14 0.06 0.30 0.28 0.58 0.11 0.26 0.37 0.00 5,082.35 5,082.35 0.29 0.00 5,088.35
Total 4.90 25.05 45.15 0.10 0.42 1.02 1.44 0.15 0.00 9,166.910.94 1.09 0.00 9,159.06
Exhaust PM10
PM10 Total
9,159.06 0.38
PM2.5 Total
Bio- CO2
3.5 Building Construction - 2017
Unmitigated Construction On-Site
ROG NOx CO SO2 Fugitive PM10
CO2e
Category tons/yr MT/yr
NBio- CO2 Total CO2 CH4 N2OFugitive PM2.5
Exhaust PM2.5
19 of 60

Off-Road 0.48 3.13 2.94 0.01 0.18 0.18 0.18 0.18 0.00 476.40 476.40 0.04 0.00 477.20
Total 0.48 3.13 2.94 0.01 0.18 0.18 0.00 477.200.18 0.18 0.00 476.40
Exhaust PM10
PM10 Total
476.40 0.04
PM2.5 Total
Bio- CO2
Unmitigated Construction Off-Site
ROG NOx CO SO2 Fugitive PM10
CO2e
Category tons/yr MT/yr
NBio- CO2 Total CO2 CH4 N2OFugitive PM2.5
Exhaust PM2.5
Hauling 0.00 0.00 0.00 0.00 0.00 0.00 0.00 0.00 0.00 0.00 0.00 0.00 0.00 0.00 0.00 0.00
Vendor 1.84 20.48 13.12 0.04 1.33 0.70 2.02 0.04 0.64 0.68 0.00 4,065.81 4,065.81 0.08 0.00 4,067.53
Worker 2.74 2.90 28.59 0.06 6.93 0.28 7.21 0.11 0.26 0.36 0.00 4,947.32 4,947.32 0.26 0.00 4,952.87
Total 4.58 23.38 41.71 0.10 8.26 0.98 9.23 0.15 0.00 9,020.400.90 1.04 0.00 9,013.13
Exhaust PM10
PM10 Total
9,013.13 0.34
PM2.5 Total
Bio- CO2
Mitigated Construction On-Site
ROG NOx CO SO2 Fugitive PM10
CO2e
Category tons/yr MT/yr
NBio- CO2 Total CO2 CH4 N2OFugitive PM2.5
Exhaust PM2.5
Off-Road 0.48 3.13 2.94 0.01 0.18 0.18 0.18 0.18 0.00 476.40 476.40 0.04 0.00 477.20
Total 0.48 3.13 2.94 0.01 0.18 0.18 0.00 477.200.18 0.18 0.00 476.40
Exhaust PM10
PM10 Total
476.40 0.04
PM2.5 Total
Bio- CO2
Mitigated Construction Off-Site
ROG NOx CO SO2 Fugitive PM10
CO2eNBio- CO2 Total CO2 CH4 N2OFugitive PM2.5
Exhaust PM2.5
20 of 60

Category tons/yr MT/yr
Hauling 0.00 0.00 0.00 0.00 0.00 0.00 0.00 0.00 0.00 0.00 0.00 0.00 0.00 0.00 0.00 0.00
Vendor 1.84 20.48 13.12 0.04 0.12 0.70 0.81 0.04 0.64 0.68 0.00 4,065.81 4,065.81 0.08 0.00 4,067.53
Worker 2.74 2.90 28.59 0.06 0.30 0.28 0.57 0.11 0.26 0.36 0.00 4,947.32 4,947.32 0.26 0.00 4,952.87
Total 4.58 23.38 41.71 0.10 0.42 0.98 1.38 0.15 0.00 9,020.400.90 1.04 0.00 9,013.13
Exhaust PM10
PM10 Total
9,013.13 0.34
PM2.5 Total
Bio- CO2
3.5 Building Construction - 2018
Unmitigated Construction On-Site
ROG NOx CO SO2 Fugitive PM10
CO2e
Category tons/yr MT/yr
NBio- CO2 Total CO2 CH4 N2OFugitive PM2.5
Exhaust PM2.5
Off-Road 0.44 2.84 2.93 0.01 0.16 0.16 0.16 0.16 0.00 478.23 478.23 0.04 0.00 478.97
Total 0.44 2.84 2.93 0.01 0.16 0.16 0.00 478.970.16 0.16 0.00 478.23
Exhaust PM10
PM10 Total
478.23 0.04
PM2.5 Total
Bio- CO2
Unmitigated Construction Off-Site
ROG NOx CO SO2 Fugitive PM10
CO2e
Category tons/yr MT/yr
NBio- CO2 Total CO2 CH4 N2OFugitive PM2.5
Exhaust PM2.5
Hauling 0.00 0.00 0.00 0.00 0.00 0.00 0.00 0.00 0.00 0.00 0.00 0.00 0.00 0.00 0.00 0.00
Vendor 1.74 19.39 12.42 0.04 1.33 0.66 1.99 0.04 0.61 0.64 0.00 4,085.70 4,085.70 0.08 0.00 4,087.32
Worker 2.58 2.68 26.51 0.06 6.96 0.28 7.24 0.11 0.26 0.37 0.00 4,858.17 4,858.17 0.25 0.00 4,863.38
Total 4.32 22.07 38.93 0.10 8.29 0.94 9.23 0.15 0.00 8,950.700.87 1.01 0.00 8,943.87 8,943.87 0.33
21 of 60

Exhaust PM10
PM10 Total PM2.5 Total
Bio- CO2
Mitigated Construction On-Site
ROG NOx CO SO2 Fugitive PM10
CO2e
Category tons/yr MT/yr
NBio- CO2 Total CO2 CH4 N2OFugitive PM2.5
Exhaust PM2.5
Off-Road 0.44 2.84 2.93 0.01 0.16 0.16 0.16 0.16 0.00 478.23 478.23 0.04 0.00 478.97
Total 0.44 2.84 2.93 0.01 0.16 0.16 0.00 478.970.16 0.16 0.00 478.23
Exhaust PM10
PM10 Total
478.23 0.04
PM2.5 Total
Bio- CO2
Mitigated Construction Off-Site
ROG NOx CO SO2 Fugitive PM10
CO2e
Category tons/yr MT/yr
NBio- CO2 Total CO2 CH4 N2OFugitive PM2.5
Exhaust PM2.5
Hauling 0.00 0.00 0.00 0.00 0.00 0.00 0.00 0.00 0.00 0.00 0.00 0.00 0.00 0.00 0.00 0.00
Vendor 1.74 19.39 12.42 0.04 0.12 0.66 0.78 0.04 0.61 0.64 0.00 4,085.70 4,085.70 0.08 0.00 4,087.32
Worker 2.58 2.68 26.51 0.06 0.30 0.28 0.58 0.11 0.26 0.37 0.00 4,858.17 4,858.17 0.25 0.00 4,863.38
Total 4.32 22.07 38.93 0.10 0.42 0.94 1.36 0.15 0.00 8,950.700.87 1.01 0.00 8,943.87
Exhaust PM10
PM10 Total
8,943.87 0.33
PM2.5 Total
Bio- CO2
3.5 Building Construction - 2019
Unmitigated Construction On-Site
ROG NOx CO SO2 Fugitive PM10
CO2e
Category tons/yr MT/yr
NBio- CO2 Total CO2 CH4 N2OFugitive PM2.5
Exhaust PM2.5
Off-Road 0.40 2.57 2.92 0.01 0.13 0.13 0.13 0.13 0.00 478.23 478.23 0.03 0.00 478.91
Total 0.40 2.57 2.92 0.01 0.13 0.13 0.00 478.910.13 0.13 0.00 478.23 478.23 0.03
22 of 60

Exhaust PM10
PM10 Total PM2.5 Total
Bio- CO2
Unmitigated Construction Off-Site
ROG NOx CO SO2 Fugitive PM10
CO2e
Category tons/yr MT/yr
NBio- CO2 Total CO2 CH4 N2OFugitive PM2.5
Exhaust PM2.5
Hauling 0.00 0.00 0.00 0.00 0.00 0.00 0.00 0.00 0.00 0.00 0.00 0.00 0.00 0.00 0.00 0.00
Vendor 1.64 18.40 11.72 0.04 1.33 0.62 1.96 0.04 0.57 0.61 0.00 4,090.29 4,090.29 0.07 0.00 4,091.81
Worker 2.46 2.49 24.75 0.06 6.96 0.28 7.24 0.11 0.26 0.37 0.00 4,759.38 4,759.38 0.23 0.00 4,764.28
Total 4.10 20.89 36.47 0.10 8.29 0.90 9.20 0.15 0.00 8,856.090.83 0.98 0.00 8,849.67
Exhaust PM10
PM10 Total
8,849.67 0.30
PM2.5 Total
Bio- CO2
Mitigated Construction On-Site
ROG NOx CO SO2 Fugitive PM10
CO2e
Category tons/yr MT/yr
NBio- CO2 Total CO2 CH4 N2OFugitive PM2.5
Exhaust PM2.5
Off-Road 0.40 2.57 2.92 0.01 0.13 0.13 0.13 0.13 0.00 478.23 478.23 0.03 0.00 478.91
Total 0.40 2.57 2.92 0.01 0.13 0.13 0.00 478.910.13 0.13 0.00 478.23
Exhaust PM10
PM10 Total
478.23 0.03
PM2.5 Total
Bio- CO2
Mitigated Construction Off-Site
ROG NOx CO SO2 Fugitive PM10
CO2e
Category tons/yr MT/yr
NBio- CO2 Total CO2 CH4 N2OFugitive PM2.5
Exhaust PM2.5
Hauling 0.00 0.00 0.00 0.00 0.00 0.00 0.00 0.00 0.00 0.00 0.00 0.00 0.00 0.00 0.00 0.00
23 of 60

Vendor 1.64 18.40 11.72 0.04 0.12 0.62 0.74 0.04 0.57 0.61 0.00 4,090.29 4,090.29 0.07 0.00 4,091.81
Worker 2.46 2.49 24.75 0.06 0.30 0.28 0.58 0.11 0.26 0.37 0.00 4,759.38 4,759.38 0.23 0.00 4,764.28
Total 4.10 20.89 36.47 0.10 0.42 0.90 1.32 0.15 0.00 8,856.090.83 0.98 0.00 8,849.67
Exhaust PM10
PM10 Total
8,849.67 0.30
PM2.5 Total
Bio- CO2
3.5 Building Construction - 2020
Unmitigated Construction On-Site
ROG NOx CO SO2 Fugitive PM10
CO2e
Category tons/yr MT/yr
NBio- CO2 Total CO2 CH4 N2OFugitive PM2.5
Exhaust PM2.5
Off-Road 0.37 2.34 2.91 0.01 0.11 0.11 0.11 0.11 0.00 480.06 480.06 0.03 0.00 480.68
Total 0.37 2.34 2.91 0.01 0.11 0.11 0.00 480.680.11 0.11 0.00 480.06
Exhaust PM10
PM10 Total
480.06 0.03
PM2.5 Total
Bio- CO2
Unmitigated Construction Off-Site
ROG NOx CO SO2 Fugitive PM10
CO2e
Category tons/yr MT/yr
NBio- CO2 Total CO2 CH4 N2OFugitive PM2.5
Exhaust PM2.5
Hauling 0.00 0.00 0.00 0.00 0.00 0.00 0.00 0.00 0.00 0.00 0.00 0.00 0.00 0.00 0.00 0.00
Vendor 1.57 17.62 11.21 0.04 1.34 0.60 1.94 0.04 0.55 0.59 0.00 4,109.83 4,109.83 0.07 0.00 4,111.28
Worker 2.37 2.34 23.33 0.06 6.99 0.28 7.27 0.11 0.26 0.37 0.00 4,686.80 4,686.80 0.22 0.00 4,691.45
Total 3.94 19.96 34.54 0.10 8.33 0.88 9.21 0.15 0.00 8,802.730.81 0.96 0.00 8,796.63 8,796.63 0.29
Mitigated Construction On-Site
24 of 60

Exhaust PM10
PM10 Total PM2.5 Total
Bio- CO2ROG NOx CO SO2 Fugitive PM10
CO2e
Category tons/yr MT/yr
NBio- CO2 Total CO2 CH4 N2OFugitive PM2.5
Exhaust PM2.5
Off-Road 0.37 2.34 2.91 0.01 0.11 0.11 0.11 0.11 0.00 480.06 480.06 0.03 0.00 480.68
Total 0.37 2.34 2.91 0.01 0.11 0.11 0.00 480.680.11 0.11 0.00 480.06
Exhaust PM10
PM10 Total
480.06 0.03
PM2.5 Total
Bio- CO2
Mitigated Construction Off-Site
ROG NOx CO SO2 Fugitive PM10
CO2e
Category tons/yr MT/yr
NBio- CO2 Total CO2 CH4 N2OFugitive PM2.5
Exhaust PM2.5
Hauling 0.00 0.00 0.00 0.00 0.00 0.00 0.00 0.00 0.00 0.00 0.00 0.00 0.00 0.00 0.00 0.00
Vendor 1.57 17.62 11.21 0.04 0.12 0.60 0.72 0.04 0.55 0.59 0.00 4,109.83 4,109.83 0.07 0.00 4,111.28
Worker 2.37 2.34 23.33 0.06 0.30 0.28 0.58 0.11 0.26 0.37 0.00 4,686.80 4,686.80 0.22 0.00 4,691.45
Total 3.94 19.96 34.54 0.10 0.42 0.88 1.30 0.15 0.00 8,802.730.81 0.96 0.00 8,796.63
Exhaust PM10
PM10 Total
8,796.63 0.29
PM2.5 Total
Bio- CO2
3.5 Building Construction - 2021
Unmitigated Construction On-Site
ROG NOx CO SO2 Fugitive PM10
CO2e
Category tons/yr MT/yr
NBio- CO2 Total CO2 CH4 N2OFugitive PM2.5
Exhaust PM2.5
Off-Road 0.33 2.10 2.88 0.01 0.10 0.10 0.10 0.10 0.00 478.23 478.23 0.03 0.00 478.79
Total 0.33 2.10 2.88 0.01 0.10 0.10 0.00 478.790.10 0.10 0.00 478.23 478.23 0.03
25 of 60

Exhaust PM10
PM10 Total PM2.5 Total
Bio- CO2
Unmitigated Construction Off-Site
ROG NOx CO SO2 Fugitive PM10
CO2e
Category tons/yr MT/yr
NBio- CO2 Total CO2 CH4 N2OFugitive PM2.5
Exhaust PM2.5
Hauling 0.00 0.00 0.00 0.00 0.00 0.00 0.00 0.00 0.00 0.00 0.00 0.00 0.00 0.00 0.00 0.00
Vendor 1.49 16.87 10.63 0.04 1.33 0.57 1.91 0.04 0.53 0.57 0.00 4,097.80 4,097.80 0.07 0.00 4,099.17
Worker 2.28 2.19 22.25 0.06 6.96 0.28 7.25 0.11 0.26 0.37 0.00 4,629.86 4,629.86 0.21 0.00 4,634.33
Total 3.77 19.06 32.88 0.10 8.29 0.85 9.16 0.15 0.00 8,733.500.79 0.94 0.00 8,727.66
Exhaust PM10
PM10 Total
8,727.66 0.28
PM2.5 Total
Bio- CO2
Mitigated Construction On-Site
ROG NOx CO SO2 Fugitive PM10
CO2e
Category tons/yr MT/yr
NBio- CO2 Total CO2 CH4 N2OFugitive PM2.5
Exhaust PM2.5
Off-Road 0.33 2.10 2.88 0.01 0.10 0.10 0.10 0.10 0.00 478.23 478.23 0.03 0.00 478.79
Total 0.33 2.10 2.88 0.01 0.10 0.10 0.00 478.790.10 0.10 0.00 478.23
Exhaust PM10
PM10 Total
478.23 0.03
PM2.5 Total
Bio- CO2
Mitigated Construction Off-Site
ROG NOx CO SO2 Fugitive PM10
CO2e
Category tons/yr MT/yr
NBio- CO2 Total CO2 CH4 N2OFugitive PM2.5
Exhaust PM2.5
Hauling 0.00 0.00 0.00 0.00 0.00 0.00 0.00 0.00 0.00 0.00 0.00 0.00 0.00 0.00 0.00 0.00
Vendor 1.49 16.87 10.63 0.04 0.12 0.57 0.69 0.04 0.53 0.57 0.00 4,097.80 4,097.80 0.07 0.00 4,099.17
Worker 2.28 2.19 22.25 0.06 0.30 0.28 0.58 0.11 0.26 0.37 0.00 4,629.86 4,629.86 0.21 0.00 4,634.33
26 of 60
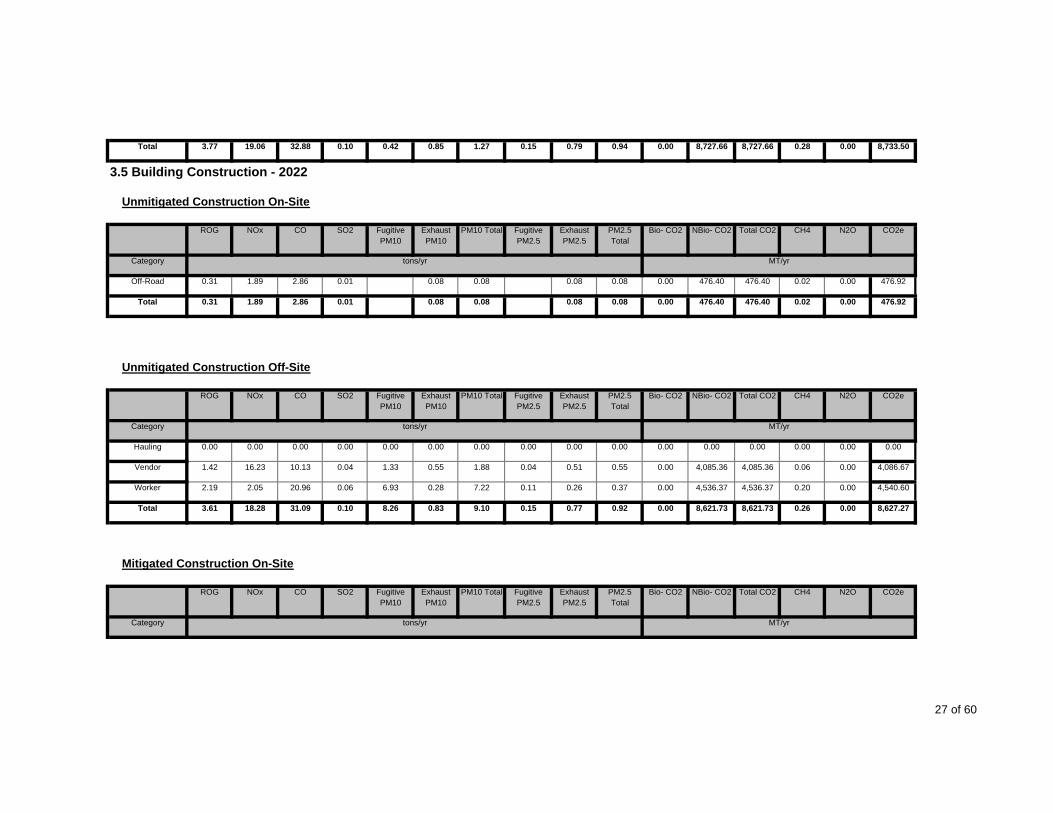
Total 3.77 19.06 32.88 0.10 0.42 0.85 1.27 0.15 0.00 8,733.500.79 0.94 0.00 8,727.66
Exhaust PM10
PM10 Total
8,727.66 0.28
PM2.5 Total
Bio- CO2
3.5 Building Construction - 2022
Unmitigated Construction On-Site
ROG NOx CO SO2 Fugitive PM10
CO2e
Category tons/yr MT/yr
NBio- CO2 Total CO2 CH4 N2OFugitive PM2.5
Exhaust PM2.5
Off-Road 0.31 1.89 2.86 0.01 0.08 0.08 0.08 0.08 0.00 476.40 476.40 0.02 0.00 476.92
Total 0.31 1.89 2.86 0.01 0.08 0.08 0.00 476.920.08 0.08 0.00 476.40
Exhaust PM10
PM10 Total
476.40 0.02
PM2.5 Total
Bio- CO2
Unmitigated Construction Off-Site
ROG NOx CO SO2 Fugitive PM10
CO2e
Category tons/yr MT/yr
NBio- CO2 Total CO2 CH4 N2OFugitive PM2.5
Exhaust PM2.5
Hauling 0.00 0.00 0.00 0.00 0.00 0.00 0.00 0.00 0.00 0.00 0.00 0.00 0.00 0.00 0.00 0.00
Vendor 1.42 16.23 10.13 0.04 1.33 0.55 1.88 0.04 0.51 0.55 0.00 4,085.36 4,085.36 0.06 0.00 4,086.67
Worker 2.19 2.05 20.96 0.06 6.93 0.28 7.22 0.11 0.26 0.37 0.00 4,536.37 4,536.37 0.20 0.00 4,540.60
Total 3.61 18.28 31.09 0.10 8.26 0.83 9.10 0.15 0.00 8,627.270.77 0.92 0.00 8,621.73
Exhaust PM10
PM10 Total
8,621.73 0.26
PM2.5 Total
Bio- CO2
Mitigated Construction On-Site
ROG NOx CO SO2 Fugitive PM10
CO2e
Category tons/yr MT/yr
NBio- CO2 Total CO2 CH4 N2OFugitive PM2.5
Exhaust PM2.5
27 of 60
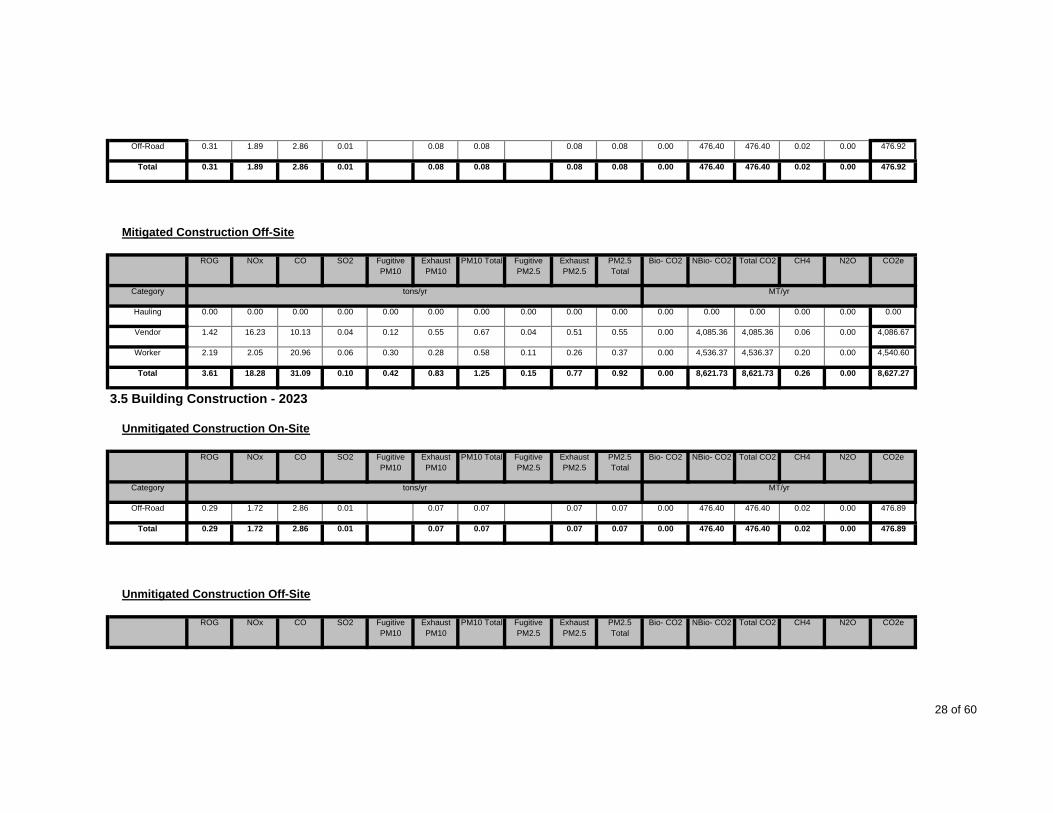
Off-Road 0.31 1.89 2.86 0.01 0.08 0.08 0.08 0.08 0.00 476.40 476.40 0.02 0.00 476.92
Total 0.31 1.89 2.86 0.01 0.08 0.08 0.00 476.920.08 0.08 0.00 476.40
Exhaust PM10
PM10 Total
476.40 0.02
PM2.5 Total
Bio- CO2
Mitigated Construction Off-Site
ROG NOx CO SO2 Fugitive PM10
CO2e
Category tons/yr MT/yr
NBio- CO2 Total CO2 CH4 N2OFugitive PM2.5
Exhaust PM2.5
Hauling 0.00 0.00 0.00 0.00 0.00 0.00 0.00 0.00 0.00 0.00 0.00 0.00 0.00 0.00 0.00 0.00
Vendor 1.42 16.23 10.13 0.04 0.12 0.55 0.67 0.04 0.51 0.55 0.00 4,085.36 4,085.36 0.06 0.00 4,086.67
Worker 2.19 2.05 20.96 0.06 0.30 0.28 0.58 0.11 0.26 0.37 0.00 4,536.37 4,536.37 0.20 0.00 4,540.60
Total 3.61 18.28 31.09 0.10 0.42 0.83 1.25 0.15 0.00 8,627.270.77 0.92 0.00 8,621.73
Exhaust PM10
PM10 Total
8,621.73 0.26
PM2.5 Total
Bio- CO2
3.5 Building Construction - 2023
Unmitigated Construction On-Site
ROG NOx CO SO2 Fugitive PM10
CO2e
Category tons/yr MT/yr
NBio- CO2 Total CO2 CH4 N2OFugitive PM2.5
Exhaust PM2.5
Off-Road 0.29 1.72 2.86 0.01 0.07 0.07 0.07 0.07 0.00 476.40 476.40 0.02 0.00 476.89
Total 0.29 1.72 2.86 0.01 0.07 0.07 0.00 476.890.07 0.07 0.00 476.40
Exhaust PM10
PM10 Total
476.40 0.02
PM2.5 Total
Bio- CO2
Unmitigated Construction Off-Site
ROG NOx CO SO2 Fugitive PM10
CO2eNBio- CO2 Total CO2 CH4 N2OFugitive PM2.5
Exhaust PM2.5
28 of 60
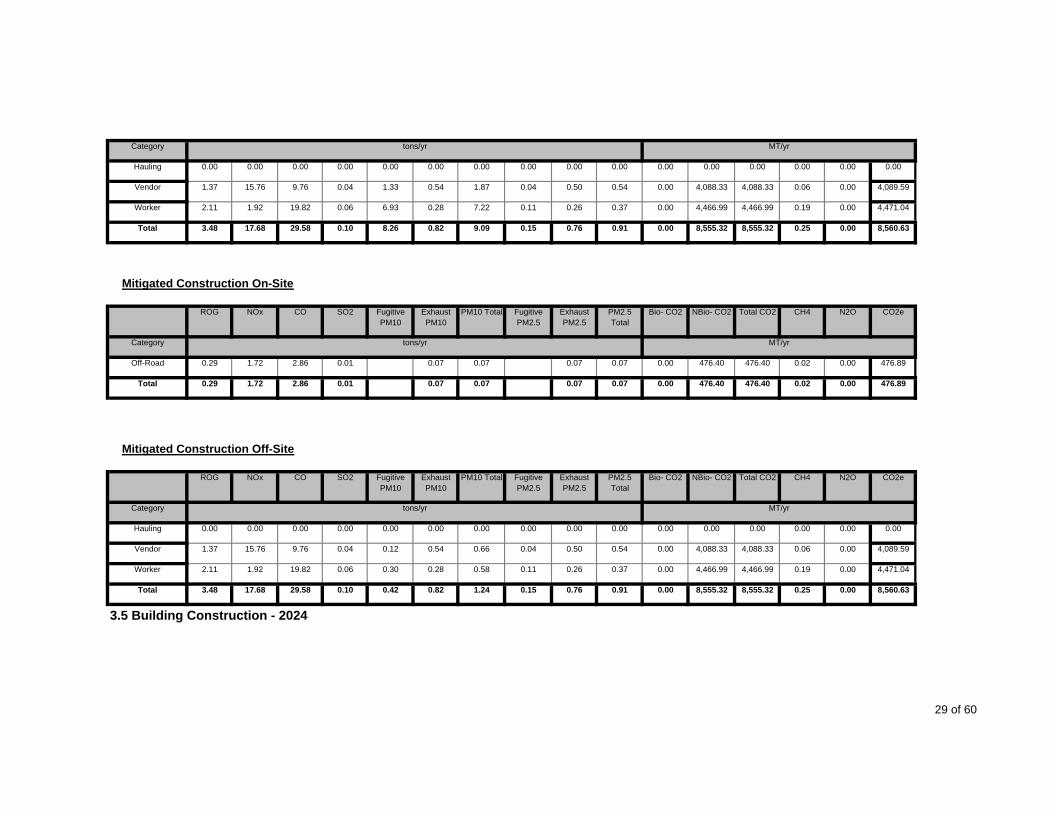
Category tons/yr MT/yr
Hauling 0.00 0.00 0.00 0.00 0.00 0.00 0.00 0.00 0.00 0.00 0.00 0.00 0.00 0.00 0.00 0.00
Vendor 1.37 15.76 9.76 0.04 1.33 0.54 1.87 0.04 0.50 0.54 0.00 4,088.33 4,088.33 0.06 0.00 4,089.59
Worker 2.11 1.92 19.82 0.06 6.93 0.28 7.22 0.11 0.26 0.37 0.00 4,466.99 4,466.99 0.19 0.00 4,471.04
Total 3.48 17.68 29.58 0.10 8.26 0.82 9.09 0.15 0.00 8,560.630.76 0.91 0.00 8,555.32
Exhaust PM10
PM10 Total
8,555.32 0.25
PM2.5 Total
Bio- CO2
Mitigated Construction On-Site
ROG NOx CO SO2 Fugitive PM10
CO2e
Category tons/yr MT/yr
NBio- CO2 Total CO2 CH4 N2OFugitive PM2.5
Exhaust PM2.5
Off-Road 0.29 1.72 2.86 0.01 0.07 0.07 0.07 0.07 0.00 476.40 476.40 0.02 0.00 476.89
Total 0.29 1.72 2.86 0.01 0.07 0.07 0.00 476.890.07 0.07 0.00 476.40
Exhaust PM10
PM10 Total
476.40 0.02
PM2.5 Total
Bio- CO2
Mitigated Construction Off-Site
ROG NOx CO SO2 Fugitive PM10
CO2e
Category tons/yr MT/yr
NBio- CO2 Total CO2 CH4 N2OFugitive PM2.5
Exhaust PM2.5
Hauling 0.00 0.00 0.00 0.00 0.00 0.00 0.00 0.00 0.00 0.00 0.00 0.00 0.00 0.00 0.00 0.00
Vendor 1.37 15.76 9.76 0.04 0.12 0.54 0.66 0.04 0.50 0.54 0.00 4,088.33 4,088.33 0.06 0.00 4,089.59
Worker 2.11 1.92 19.82 0.06 0.30 0.28 0.58 0.11 0.26 0.37 0.00 4,466.99 4,466.99 0.19 0.00 4,471.04
Total 3.48 17.68 29.58 0.10 0.42 0.82 1.24 0.15 0.00 8,560.630.76 0.91 0.00 8,555.32 8,555.32 0.25
3.5 Building Construction - 2024
29 of 60

Exhaust PM10
PM10 Total PM2.5 Total
Bio- CO2
Unmitigated Construction On-Site
ROG NOx CO SO2 Fugitive PM10
CO2e
Category tons/yr MT/yr
NBio- CO2 Total CO2 CH4 N2OFugitive PM2.5
Exhaust PM2.5
Off-Road 0.28 1.58 2.87 0.01 0.06 0.06 0.06 0.06 0.00 480.06 480.06 0.02 0.00 480.53
Total 0.28 1.58 2.87 0.01 0.06 0.06 0.00 480.530.06 0.06 0.00 480.06
Exhaust PM10
PM10 Total
480.06 0.02
PM2.5 Total
Bio- CO2
Unmitigated Construction Off-Site
ROG NOx CO SO2 Fugitive PM10
CO2e
Category tons/yr MT/yr
NBio- CO2 Total CO2 CH4 N2OFugitive PM2.5
Exhaust PM2.5
Hauling 0.00 0.00 0.00 0.00 0.00 0.00 0.00 0.00 0.00 0.00 0.00 0.00 0.00 0.00 0.00 0.00
Vendor 1.34 15.49 9.43 0.04 1.34 0.53 1.87 0.04 0.49 0.53 0.00 4,122.85 4,122.85 0.06 0.00 4,124.08
Worker 2.05 1.83 18.99 0.06 6.99 0.29 7.27 0.11 0.27 0.37 0.00 4,438.06 4,438.06 0.19 0.00 4,441.98
Total 3.39 17.32 28.42 0.10 8.33 0.82 9.14 0.15 0.00 8,566.060.76 0.90 0.00 8,560.91
Exhaust PM10
PM10 Total
8,560.91 0.25
PM2.5 Total
Bio- CO2
Mitigated Construction On-Site
ROG NOx CO SO2 Fugitive PM10
CO2e
Category tons/yr MT/yr
NBio- CO2 Total CO2 CH4 N2OFugitive PM2.5
Exhaust PM2.5
Off-Road 0.28 1.58 2.87 0.01 0.06 0.06 0.06 0.06 0.00 480.06 480.06 0.02 0.00 480.53
Total 0.28 1.58 2.87 0.01 0.06 0.06 0.00 480.530.06 0.06 0.00 480.06 480.06 0.02
30 of 60

Exhaust PM10
PM10 Total PM2.5 Total
Bio- CO2
Mitigated Construction Off-Site
ROG NOx CO SO2 Fugitive PM10
CO2e
Category tons/yr MT/yr
NBio- CO2 Total CO2 CH4 N2OFugitive PM2.5
Exhaust PM2.5
Hauling 0.00 0.00 0.00 0.00 0.00 0.00 0.00 0.00 0.00 0.00 0.00 0.00 0.00 0.00 0.00 0.00
Vendor 1.34 15.49 9.43 0.04 0.12 0.53 0.65 0.04 0.49 0.53 0.00 4,122.85 4,122.85 0.06 0.00 4,124.08
Worker 2.05 1.83 18.99 0.06 0.30 0.29 0.58 0.11 0.27 0.37 0.00 4,438.06 4,438.06 0.19 0.00 4,441.98
Total 3.39 17.32 28.42 0.10 0.42 0.82 1.23 0.15 0.00 8,566.060.76 0.90 0.00 8,560.91
Exhaust PM10
PM10 Total
8,560.91 0.25
PM2.5 Total
Bio- CO2
3.5 Building Construction - 2025
Unmitigated Construction On-Site
ROG NOx CO SO2 Fugitive PM10
CO2e
Category tons/yr MT/yr
NBio- CO2 Total CO2 CH4 N2OFugitive PM2.5
Exhaust PM2.5
Off-Road 0.26 1.44 2.86 0.01 0.05 0.05 0.05 0.05 0.00 478.23 478.23 0.02 0.00 478.66
Total 0.26 1.44 2.86 0.01 0.05 0.05 0.00 478.660.05 0.05 0.00 478.23
Exhaust PM10
PM10 Total
478.23 0.02
PM2.5 Total
Bio- CO2
Unmitigated Construction Off-Site
ROG NOx CO SO2 Fugitive PM10
CO2e
Category tons/yr MT/yr
NBio- CO2 Total CO2 CH4 N2OFugitive PM2.5
Exhaust PM2.5
Hauling 0.00 0.00 0.00 0.00 0.00 0.00 0.00 0.00 0.00 0.00 0.00 0.00 0.00 0.00 0.00 0.00
31 of 60

Vendor 1.30 15.10 9.12 0.04 1.33 0.52 1.85 0.04 0.48 0.52 0.00 4,109.31 4,109.31 0.06 0.00 4,110.50
Worker 1.97 1.73 18.07 0.06 6.96 0.29 7.25 0.11 0.26 0.37 0.00 4,364.72 4,364.72 0.18 0.00 4,368.45
Total 3.27 16.83 27.19 0.10 8.29 0.81 9.10 0.15 0.00 8,478.950.74 0.89 0.00 8,474.03
Exhaust PM10
PM10 Total
8,474.03 0.24
PM2.5 Total
Bio- CO2
Mitigated Construction On-Site
ROG NOx CO SO2 Fugitive PM10
CO2e
Category tons/yr MT/yr
NBio- CO2 Total CO2 CH4 N2OFugitive PM2.5
Exhaust PM2.5
Off-Road 0.26 1.44 2.86 0.01 0.05 0.05 0.05 0.05 0.00 478.23 478.23 0.02 0.00 478.66
Total 0.26 1.44 2.86 0.01 0.05 0.05 0.00 478.660.05 0.05 0.00 478.23
Exhaust PM10
PM10 Total
478.23 0.02
PM2.5 Total
Bio- CO2
Mitigated Construction Off-Site
ROG NOx CO SO2 Fugitive PM10
CO2e
Category tons/yr MT/yr
NBio- CO2 Total CO2 CH4 N2OFugitive PM2.5
Exhaust PM2.5
Hauling 0.00 0.00 0.00 0.00 0.00 0.00 0.00 0.00 0.00 0.00 0.00 0.00 0.00 0.00 0.00 0.00
Vendor 1.30 15.10 9.12 0.04 0.12 0.52 0.64 0.04 0.48 0.52 0.00 4,109.31 4,109.31 0.06 0.00 4,110.50
Worker 1.97 1.73 18.07 0.06 0.30 0.29 0.58 0.11 0.26 0.37 0.00 4,364.72 4,364.72 0.18 0.00 4,368.45
Total 3.27 16.83 27.19 0.10 0.42 0.81 1.22 0.15 0.00 8,478.950.74 0.89 0.00 8,474.03 8,474.03 0.24
3.5 Building Construction - 2026
Unmitigated Construction On-Site
32 of 60

Exhaust PM10
PM10 Total PM2.5 Total
Bio- CO2ROG NOx CO SO2 Fugitive PM10
CO2e
Category tons/yr MT/yr
NBio- CO2 Total CO2 CH4 N2OFugitive PM2.5
Exhaust PM2.5
Off-Road 0.26 1.44 2.86 0.01 0.05 0.05 0.05 0.05 0.00 478.23 478.23 0.02 0.00 478.66
Total 0.26 1.44 2.86 0.01 0.05 0.05 0.00 478.660.05 0.05 0.00 478.23
Exhaust PM10
PM10 Total
478.23 0.02
PM2.5 Total
Bio- CO2
Unmitigated Construction Off-Site
ROG NOx CO SO2 Fugitive PM10
CO2e
Category tons/yr MT/yr
NBio- CO2 Total CO2 CH4 N2OFugitive PM2.5
Exhaust PM2.5
Hauling 0.00 0.00 0.00 0.00 0.00 0.00 0.00 0.00 0.00 0.00 0.00 0.00 0.00 0.00 0.00 0.00
Vendor 1.30 15.10 9.12 0.04 1.33 0.52 1.85 0.04 0.48 0.52 0.00 4,109.31 4,109.31 0.06 0.00 4,110.50
Worker 1.97 1.73 18.07 0.06 6.96 0.29 7.25 0.11 0.26 0.37 0.00 4,364.72 4,364.72 0.18 0.00 4,368.45
Total 3.27 16.83 27.19 0.10 8.29 0.81 9.10 0.15 0.00 8,478.950.74 0.89 0.00 8,474.03
Exhaust PM10
PM10 Total
8,474.03 0.24
PM2.5 Total
Bio- CO2
Mitigated Construction On-Site
ROG NOx CO SO2 Fugitive PM10
CO2e
Category tons/yr MT/yr
NBio- CO2 Total CO2 CH4 N2OFugitive PM2.5
Exhaust PM2.5
Off-Road 0.26 1.44 2.86 0.01 0.05 0.05 0.05 0.05 0.00 478.23 478.23 0.02 0.00 478.66
Total 0.26 1.44 2.86 0.01 0.05 0.05 0.00 478.660.05 0.05 0.00 478.23 478.23 0.02
33 of 60

Exhaust PM10
PM10 Total PM2.5 Total
Bio- CO2
Mitigated Construction Off-Site
ROG NOx CO SO2 Fugitive PM10
CO2e
Category tons/yr MT/yr
NBio- CO2 Total CO2 CH4 N2OFugitive PM2.5
Exhaust PM2.5
Hauling 0.00 0.00 0.00 0.00 0.00 0.00 0.00 0.00 0.00 0.00 0.00 0.00 0.00 0.00 0.00 0.00
Vendor 1.30 15.10 9.12 0.04 0.12 0.52 0.64 0.04 0.48 0.52 0.00 4,109.31 4,109.31 0.06 0.00 4,110.50
Worker 1.97 1.73 18.07 0.06 0.30 0.29 0.58 0.11 0.26 0.37 0.00 4,364.72 4,364.72 0.18 0.00 4,368.45
Total 3.27 16.83 27.19 0.10 0.42 0.81 1.22 0.15 0.00 8,478.950.74 0.89 0.00 8,474.03
Exhaust PM10
PM10 Total
8,474.03 0.24
PM2.5 Total
Bio- CO2
3.5 Building Construction - 2027
Unmitigated Construction On-Site
ROG NOx CO SO2 Fugitive PM10
CO2e
Category tons/yr MT/yr
NBio- CO2 Total CO2 CH4 N2OFugitive PM2.5
Exhaust PM2.5
Off-Road 0.26 1.44 2.86 0.01 0.05 0.05 0.05 0.05 0.00 478.23 478.23 0.02 0.00 478.66
Total 0.26 1.44 2.86 0.01 0.05 0.05 0.00 478.660.05 0.05 0.00 478.23
Exhaust PM10
PM10 Total
478.23 0.02
PM2.5 Total
Bio- CO2
Unmitigated Construction Off-Site
ROG NOx CO SO2 Fugitive PM10
CO2e
Category tons/yr MT/yr
NBio- CO2 Total CO2 CH4 N2OFugitive PM2.5
Exhaust PM2.5
Hauling 0.00 0.00 0.00 0.00 0.00 0.00 0.00 0.00 0.00 0.00 0.00 0.00 0.00 0.00 0.00 0.00
Vendor 1.30 15.10 9.12 0.04 1.33 0.52 1.85 0.04 0.48 0.52 0.00 4,109.31 4,109.31 0.06 0.00 4,110.50
Worker 1.97 1.73 18.07 0.06 6.96 0.29 7.25 0.11 0.26 0.37 0.00 4,364.72 4,364.72 0.18 0.00 4,368.45
34 of 60

Total 3.27 16.83 27.19 0.10 8.29 0.81 9.10 0.15 0.00 8,478.950.74 0.89 0.00 8,474.03
Exhaust PM10
PM10 Total
8,474.03 0.24
PM2.5 Total
Bio- CO2
Mitigated Construction On-Site
ROG NOx CO SO2 Fugitive PM10
CO2e
Category tons/yr MT/yr
NBio- CO2 Total CO2 CH4 N2OFugitive PM2.5
Exhaust PM2.5
Off-Road 0.26 1.44 2.86 0.01 0.05 0.05 0.05 0.05 0.00 478.23 478.23 0.02 0.00 478.66
Total 0.26 1.44 2.86 0.01 0.05 0.05 0.00 478.660.05 0.05 0.00 478.23
Exhaust PM10
PM10 Total
478.23 0.02
PM2.5 Total
Bio- CO2
Mitigated Construction Off-Site
ROG NOx CO SO2 Fugitive PM10
CO2e
Category tons/yr MT/yr
NBio- CO2 Total CO2 CH4 N2OFugitive PM2.5
Exhaust PM2.5
Hauling 0.00 0.00 0.00 0.00 0.00 0.00 0.00 0.00 0.00 0.00 0.00 0.00 0.00 0.00 0.00 0.00
Vendor 1.30 15.10 9.12 0.04 0.12 0.52 0.64 0.04 0.48 0.52 0.00 4,109.31 4,109.31 0.06 0.00 4,110.50
Worker 1.97 1.73 18.07 0.06 0.30 0.29 0.58 0.11 0.26 0.37 0.00 4,364.72 4,364.72 0.18 0.00 4,368.45
Total 3.27 16.83 27.19 0.10 0.42 0.81 1.22 0.15 0.00 8,478.950.74 0.89 0.00 8,474.03
Exhaust PM10
PM10 Total
8,474.03 0.24
PM2.5 Total
Bio- CO2
3.5 Building Construction - 2028
Unmitigated Construction On-Site
ROG NOx CO SO2 Fugitive PM10
CO2e
Category tons/yr MT/yr
NBio- CO2 Total CO2 CH4 N2OFugitive PM2.5
Exhaust PM2.5
35 of 60

Off-Road 0.26 1.44 2.85 0.01 0.05 0.05 0.05 0.05 0.00 476.40 476.40 0.02 0.00 476.83
Total 0.26 1.44 2.85 0.01 0.05 0.05 0.00 476.830.05 0.05 0.00 476.40
Exhaust PM10
PM10 Total
476.40 0.02
PM2.5 Total
Bio- CO2
Unmitigated Construction Off-Site
ROG NOx CO SO2 Fugitive PM10
CO2e
Category tons/yr MT/yr
NBio- CO2 Total CO2 CH4 N2OFugitive PM2.5
Exhaust PM2.5
Hauling 0.00 0.00 0.00 0.00 0.00 0.00 0.00 0.00 0.00 0.00 0.00 0.00 0.00 0.00 0.00 0.00
Vendor 1.29 15.05 9.09 0.04 1.33 0.52 1.84 0.04 0.48 0.51 0.00 4,093.57 4,093.57 0.06 0.00 4,094.75
Worker 1.97 1.72 18.00 0.06 6.93 0.29 7.22 0.11 0.26 0.37 0.00 4,348.00 4,348.00 0.18 0.00 4,351.71
Total 3.26 16.77 27.09 0.10 8.26 0.81 9.06 0.15 0.00 8,446.460.74 0.88 0.00 8,441.57
Exhaust PM10
PM10 Total
8,441.57 0.24
PM2.5 Total
Bio- CO2
Mitigated Construction On-Site
ROG NOx CO SO2 Fugitive PM10
CO2e
Category tons/yr MT/yr
NBio- CO2 Total CO2 CH4 N2OFugitive PM2.5
Exhaust PM2.5
Off-Road 0.26 1.44 2.85 0.01 0.05 0.05 0.05 0.05 0.00 476.40 476.40 0.02 0.00 476.83
Total 0.26 1.44 2.85 0.01 0.05 0.05 0.00 476.830.05 0.05 0.00 476.40
Exhaust PM10
PM10 Total
476.40 0.02
PM2.5 Total
Bio- CO2
Mitigated Construction Off-Site
ROG NOx CO SO2 Fugitive PM10
CO2eNBio- CO2 Total CO2 CH4 N2OFugitive PM2.5
Exhaust PM2.5
36 of 60

Category tons/yr MT/yr
Hauling 0.00 0.00 0.00 0.00 0.00 0.00 0.00 0.00 0.00 0.00 0.00 0.00 0.00 0.00 0.00 0.00
Vendor 1.29 15.05 9.09 0.04 0.12 0.52 0.63 0.04 0.48 0.51 0.00 4,093.57 4,093.57 0.06 0.00 4,094.75
Worker 1.97 1.72 18.00 0.06 0.30 0.29 0.58 0.11 0.26 0.37 0.00 4,348.00 4,348.00 0.18 0.00 4,351.71
Total 3.26 16.77 27.09 0.10 0.42 0.81 1.21 0.15 0.00 8,446.460.74 0.88 0.00 8,441.57
Exhaust PM10
PM10 Total
8,441.57 0.24
PM2.5 Total
Bio- CO2
3.5 Building Construction - 2029
Unmitigated Construction On-Site
ROG NOx CO SO2 Fugitive PM10
CO2e
Category tons/yr MT/yr
NBio- CO2 Total CO2 CH4 N2OFugitive PM2.5
Exhaust PM2.5
Off-Road 0.26 1.44 2.86 0.01 0.05 0.05 0.05 0.05 0.00 478.23 478.23 0.02 0.00 478.66
Total 0.26 1.44 2.86 0.01 0.05 0.05 0.00 478.660.05 0.05 0.00 478.23
Exhaust PM10
PM10 Total
478.23 0.02
PM2.5 Total
Bio- CO2
Unmitigated Construction Off-Site
ROG NOx CO SO2 Fugitive PM10
CO2e
Category tons/yr MT/yr
NBio- CO2 Total CO2 CH4 N2OFugitive PM2.5
Exhaust PM2.5
Hauling 0.00 0.00 0.00 0.00 0.00 0.00 0.00 0.00 0.00 0.00 0.00 0.00 0.00 0.00 0.00 0.00
Vendor 1.30 15.10 9.12 0.04 1.33 0.52 1.85 0.04 0.48 0.52 0.00 4,109.31 4,109.31 0.06 0.00 4,110.50
Worker 1.97 1.73 18.07 0.06 6.96 0.29 7.25 0.11 0.26 0.37 0.00 4,364.72 4,364.72 0.18 0.00 4,368.45
Total 3.27 16.83 27.19 0.10 8.29 0.81 9.10 0.15 0.00 8,478.950.74 0.89 0.00 8,474.03 8,474.03 0.24
37 of 60

Exhaust PM10
PM10 Total PM2.5 Total
Bio- CO2
Mitigated Construction On-Site
ROG NOx CO SO2 Fugitive PM10
CO2e
Category tons/yr MT/yr
NBio- CO2 Total CO2 CH4 N2OFugitive PM2.5
Exhaust PM2.5
Off-Road 0.26 1.44 2.86 0.01 0.05 0.05 0.05 0.05 0.00 478.23 478.23 0.02 0.00 478.66
Total 0.26 1.44 2.86 0.01 0.05 0.05 0.00 478.660.05 0.05 0.00 478.23
Exhaust PM10
PM10 Total
478.23 0.02
PM2.5 Total
Bio- CO2
Mitigated Construction Off-Site
ROG NOx CO SO2 Fugitive PM10
CO2e
Category tons/yr MT/yr
NBio- CO2 Total CO2 CH4 N2OFugitive PM2.5
Exhaust PM2.5
Hauling 0.00 0.00 0.00 0.00 0.00 0.00 0.00 0.00 0.00 0.00 0.00 0.00 0.00 0.00 0.00 0.00
Vendor 1.30 15.10 9.12 0.04 0.12 0.52 0.64 0.04 0.48 0.52 0.00 4,109.31 4,109.31 0.06 0.00 4,110.50
Worker 1.97 1.73 18.07 0.06 0.30 0.29 0.58 0.11 0.26 0.37 0.00 4,364.72 4,364.72 0.18 0.00 4,368.45
Total 3.27 16.83 27.19 0.10 0.42 0.81 1.22 0.15 0.00 8,478.950.74 0.89 0.00 8,474.03
Exhaust PM10
PM10 Total
8,474.03 0.24
PM2.5 Total
Bio- CO2
3.5 Building Construction - 2030
Unmitigated Construction On-Site
ROG NOx CO SO2 Fugitive PM10
CO2e
Category tons/yr MT/yr
NBio- CO2 Total CO2 CH4 N2OFugitive PM2.5
Exhaust PM2.5
Off-Road 0.22 1.05 2.85 0.01 0.02 0.02 0.02 0.02 0.00 478.23 478.23 0.02 0.00 478.60
Total 0.22 1.05 2.85 0.01 0.02 0.02 0.00 478.600.02 0.02 0.00 478.23 478.23 0.02
38 of 60

Exhaust PM10
PM10 Total PM2.5 Total
Bio- CO2
Unmitigated Construction Off-Site
ROG NOx CO SO2 Fugitive PM10
CO2e
Category tons/yr MT/yr
NBio- CO2 Total CO2 CH4 N2OFugitive PM2.5
Exhaust PM2.5
Hauling 0.00 0.00 0.00 0.00 0.00 0.00 0.00 0.00 0.00 0.00 0.00 0.00 0.00 0.00 0.00 0.00
Vendor 1.19 14.15 8.27 0.04 1.33 0.49 1.82 0.04 0.45 0.49 0.00 4,117.29 4,117.29 0.05 0.00 4,118.37
Worker 1.69 1.38 15.11 0.06 6.96 0.29 7.25 0.11 0.26 0.37 0.00 4,164.03 4,164.03 0.15 0.00 4,167.23
Total 2.88 15.53 23.38 0.10 8.29 0.78 9.07 0.15 0.00 8,285.600.71 0.86 0.00 8,281.32
Exhaust PM10
PM10 Total
8,281.32 0.20
PM2.5 Total
Bio- CO2
Mitigated Construction On-Site
ROG NOx CO SO2 Fugitive PM10
CO2e
Category tons/yr MT/yr
NBio- CO2 Total CO2 CH4 N2OFugitive PM2.5
Exhaust PM2.5
Off-Road 0.22 1.05 2.85 0.01 0.02 0.02 0.02 0.02 0.00 478.23 478.23 0.02 0.00 478.60
Total 0.22 1.05 2.85 0.01 0.02 0.02 0.00 478.600.02 0.02 0.00 478.23
Exhaust PM10
PM10 Total
478.23 0.02
PM2.5 Total
Bio- CO2
Mitigated Construction Off-Site
ROG NOx CO SO2 Fugitive PM10
CO2e
Category tons/yr MT/yr
NBio- CO2 Total CO2 CH4 N2OFugitive PM2.5
Exhaust PM2.5
Hauling 0.00 0.00 0.00 0.00 0.00 0.00 0.00 0.00 0.00 0.00 0.00 0.00 0.00 0.00 0.00 0.00
39 of 60

Vendor 1.19 14.15 8.27 0.04 0.12 0.49 0.60 0.04 0.45 0.49 0.00 4,117.29 4,117.29 0.05 0.00 4,118.37
Worker 1.69 1.38 15.11 0.06 0.30 0.29 0.59 0.11 0.26 0.37 0.00 4,164.03 4,164.03 0.15 0.00 4,167.23
Total 2.88 15.53 23.38 0.10 0.42 0.78 1.19 0.15 0.00 8,285.600.71 0.86 0.00 8,281.32
Exhaust PM10
PM10 Total
8,281.32 0.20
PM2.5 Total
Bio- CO2
3.5 Building Construction - 2031
Unmitigated Construction On-Site
ROG NOx CO SO2 Fugitive PM10
CO2e
Category tons/yr MT/yr
NBio- CO2 Total CO2 CH4 N2OFugitive PM2.5
Exhaust PM2.5
Off-Road 0.22 1.05 2.85 0.01 0.02 0.02 0.02 0.02 0.00 478.23 478.23 0.02 0.00 478.60
Total 0.22 1.05 2.85 0.01 0.02 0.02 0.00 478.600.02 0.02 0.00 478.23
Exhaust PM10
PM10 Total
478.23 0.02
PM2.5 Total
Bio- CO2
Unmitigated Construction Off-Site
ROG NOx CO SO2 Fugitive PM10
CO2e
Category tons/yr MT/yr
NBio- CO2 Total CO2 CH4 N2OFugitive PM2.5
Exhaust PM2.5
Hauling 0.00 0.00 0.00 0.00 0.00 0.00 0.00 0.00 0.00 0.00 0.00 0.00 0.00 0.00 0.00 0.00
Vendor 1.19 14.15 8.27 0.04 1.33 0.49 1.82 0.04 0.45 0.49 0.00 4,117.29 4,117.29 0.05 0.00 4,118.37
Worker 1.69 1.38 15.11 0.06 6.96 0.29 7.25 0.11 0.26 0.37 0.00 4,164.03 4,164.03 0.15 0.00 4,167.23
Total 2.88 15.53 23.38 0.10 8.29 0.78 9.07 0.15 0.00 8,285.600.71 0.86 0.00 8,281.32 8,281.32 0.20
Mitigated Construction On-Site
40 of 60

Exhaust PM10
PM10 Total PM2.5 Total
Bio- CO2ROG NOx CO SO2 Fugitive PM10
CO2e
Category tons/yr MT/yr
NBio- CO2 Total CO2 CH4 N2OFugitive PM2.5
Exhaust PM2.5
Off-Road 0.22 1.05 2.85 0.01 0.02 0.02 0.02 0.02 0.00 478.23 478.23 0.02 0.00 478.60
Total 0.22 1.05 2.85 0.01 0.02 0.02 0.00 478.600.02 0.02 0.00 478.23
Exhaust PM10
PM10 Total
478.23 0.02
PM2.5 Total
Bio- CO2
Mitigated Construction Off-Site
ROG NOx CO SO2 Fugitive PM10
CO2e
Category tons/yr MT/yr
NBio- CO2 Total CO2 CH4 N2OFugitive PM2.5
Exhaust PM2.5
Hauling 0.00 0.00 0.00 0.00 0.00 0.00 0.00 0.00 0.00 0.00 0.00 0.00 0.00 0.00 0.00 0.00
Vendor 1.19 14.15 8.27 0.04 0.12 0.49 0.60 0.04 0.45 0.49 0.00 4,117.29 4,117.29 0.05 0.00 4,118.37
Worker 1.69 1.38 15.11 0.06 0.30 0.29 0.59 0.11 0.26 0.37 0.00 4,164.03 4,164.03 0.15 0.00 4,167.23
Total 2.88 15.53 23.38 0.10 0.42 0.78 1.19 0.15 0.00 8,285.600.71 0.86 0.00 8,281.32
Exhaust PM10
PM10 Total
8,281.32 0.20
PM2.5 Total
Bio- CO2
3.5 Building Construction - 2032
Unmitigated Construction On-Site
ROG NOx CO SO2 Fugitive PM10
CO2e
Category tons/yr MT/yr
NBio- CO2 Total CO2 CH4 N2OFugitive PM2.5
Exhaust PM2.5
Off-Road 0.10 0.47 1.28 0.00 0.01 0.01 0.01 0.01 0.00 214.38 214.38 0.01 0.00 214.54
Total 0.10 0.47 1.28 0.00 0.01 0.01 0.00 214.540.01 0.01 0.00 214.38 214.38 0.01
41 of 60

Exhaust PM10
PM10 Total PM2.5 Total
Bio- CO2
Unmitigated Construction Off-Site
ROG NOx CO SO2 Fugitive PM10
CO2e
Category tons/yr MT/yr
NBio- CO2 Total CO2 CH4 N2OFugitive PM2.5
Exhaust PM2.5
Hauling 0.00 0.00 0.00 0.00 0.00 0.00 0.00 0.00 0.00 0.00 0.00 0.00 0.00 0.00 0.00 0.00
Vendor 0.53 6.34 3.71 0.02 0.60 0.22 0.82 0.02 0.20 0.22 0.00 1,845.68 1,845.68 0.02 0.00 1,846.17
Worker 0.76 0.62 6.77 0.03 3.12 0.13 3.25 0.05 0.12 0.17 0.00 1,866.63 1,866.63 0.07 0.00 1,868.07
Total 1.29 6.96 10.48 0.05 3.72 0.35 4.07 0.07 0.00 3,714.240.32 0.39 0.00 3,712.31
Exhaust PM10
PM10 Total
3,712.31 0.09
PM2.5 Total
Bio- CO2
Mitigated Construction On-Site
ROG NOx CO SO2 Fugitive PM10
CO2e
Category tons/yr MT/yr
NBio- CO2 Total CO2 CH4 N2OFugitive PM2.5
Exhaust PM2.5
Off-Road 0.10 0.47 1.28 0.00 0.01 0.01 0.01 0.01 0.00 214.38 214.38 0.01 0.00 214.54
Total 0.10 0.47 1.28 0.00 0.01 0.01 0.00 214.540.01 0.01 0.00 214.38
Exhaust PM10
PM10 Total
214.38 0.01
PM2.5 Total
Bio- CO2
Mitigated Construction Off-Site
ROG NOx CO SO2 Fugitive PM10
CO2e
Category tons/yr MT/yr
NBio- CO2 Total CO2 CH4 N2OFugitive PM2.5
Exhaust PM2.5
Hauling 0.00 0.00 0.00 0.00 0.00 0.00 0.00 0.00 0.00 0.00 0.00 0.00 0.00 0.00 0.00 0.00
Vendor 0.53 6.34 3.71 0.02 0.05 0.22 0.27 0.02 0.20 0.22 0.00 1,845.68 1,845.68 0.02 0.00 1,846.17
Worker 0.76 0.62 6.77 0.03 0.13 0.13 0.26 0.05 0.12 0.17 0.00 1,866.63 1,866.63 0.07 0.00 1,868.07
42 of 60

Total 1.29 6.96 10.48 0.05 0.18 0.35 0.53 0.07 0.00 3,714.240.32 0.39 0.00 3,712.31
Exhaust PM10
PM10 Total
3,712.31 0.09
PM2.5 Total
Bio- CO2
3.6 Paving - 2032
Unmitigated Construction On-Site
ROG NOx CO SO2 Fugitive PM10
CO2e
Category tons/yr MT/yr
NBio- CO2 Total CO2 CH4 N2OFugitive PM2.5
Exhaust PM2.5
Off-Road 0.14 0.85 1.39 0.00 0.04 0.04 0.04 0.04 0.00 191.84 191.84 0.01 0.00 192.08
Paving 0.00 0.00 0.00 0.00 0.00 0.00 0.00 0.00 0.00 0.00 0.00
Total 0.14 0.85 1.39 191.84 0.01 0.000.04 0.04 0.00
SO2 Fugitive PM10
Exhaust PM10
191.840.00 0.04 0.04
Fugitive PM2.5
Exhaust PM2.5
PM2.5 Total
192.08
Unmitigated Construction Off-Site
ROG NOx CO N2O CO2e
Category tons/yr MT/yr
Bio- CO2 NBio- CO2 Total CO2 CH4PM10 Total
Hauling 0.00 0.00 0.00 0.00 0.00 0.00 0.00 0.00 0.00 0.00 0.00 0.00 0.00 0.00 0.00 0.00
Vendor 0.00 0.00 0.00 0.00 0.00 0.00 0.00 0.00 0.00 0.00 0.00 0.00 0.00 0.00 0.00 0.00
Worker 0.00 0.00 0.03 0.00 0.01 0.00 0.01 0.00 0.00 0.00 0.00 7.42 7.42 0.00 0.00 7.42
Total 0.00 0.00 0.03 0.00 0.01 0.00 0.01 0.00 0.00 7.420.00 0.00 0.00 7.42
Exhaust PM10
PM10 Total
7.42 0.00
PM2.5 Total
Bio- CO2
Mitigated Construction On-Site
ROG NOx CO SO2 Fugitive PM10
CO2e
Category tons/yr MT/yr
NBio- CO2 Total CO2 CH4 N2OFugitive PM2.5
Exhaust PM2.5
43 of 60

Off-Road 0.14 0.85 1.39 0.00 0.04 0.04 0.04 0.04 0.00 191.84 191.84 0.01 0.00 192.08
Paving 0.00 0.00 0.00 0.00 0.00 0.00 0.00 0.00 0.00 0.00 0.00
Total 0.14 0.85 1.39 191.84 0.01 0.000.04 0.04 0.00
SO2 Fugitive PM10
Exhaust PM10
191.840.00 0.04 0.04
Fugitive PM2.5
Exhaust PM2.5
PM2.5 Total
192.08
Mitigated Construction Off-Site
ROG NOx CO N2O CO2e
Category tons/yr MT/yr
Bio- CO2 NBio- CO2 Total CO2 CH4PM10 Total
Hauling 0.00 0.00 0.00 0.00 0.00 0.00 0.00 0.00 0.00 0.00 0.00 0.00 0.00 0.00 0.00 0.00
Vendor 0.00 0.00 0.00 0.00 0.00 0.00 0.00 0.00 0.00 0.00 0.00 0.00 0.00 0.00 0.00 0.00
Worker 0.00 0.00 0.03 0.00 0.00 0.00 0.00 0.00 0.00 0.00 0.00 7.42 7.42 0.00 0.00 7.42
Total 0.00 0.00 0.03 0.00 0.00 0.00 0.00 0.00 0.00 7.420.00 0.00 0.00 7.42
Exhaust PM10
PM10 Total
7.42 0.00
PM2.5 Total
Bio- CO2
3.6 Paving - 2033
Unmitigated Construction On-Site
ROG NOx CO SO2 Fugitive PM10
CO2e
Category tons/yr MT/yr
NBio- CO2 Total CO2 CH4 N2OFugitive PM2.5
Exhaust PM2.5
Off-Road 0.17 1.08 1.78 0.00 0.05 0.05 0.05 0.05 0.00 244.77 244.77 0.01 0.00 245.06
Paving 0.00 0.00 0.00 0.00 0.00 0.00 0.00 0.00 0.00 0.00 0.00
Total 0.17 1.08 1.78 244.77 0.01 0.000.05 0.05 0.00 244.770.00 0.05 0.05 245.06
Unmitigated Construction Off-Site
44 of 60

SO2 Fugitive PM10
Exhaust PM10
Fugitive PM2.5
Exhaust PM2.5
PM2.5 Total
ROG NOx CO N2O CO2e
Category tons/yr MT/yr
Bio- CO2 NBio- CO2 Total CO2 CH4PM10 Total
Hauling 0.00 0.00 0.00 0.00 0.00 0.00 0.00 0.00 0.00 0.00 0.00 0.00 0.00 0.00 0.00 0.00
Vendor 0.00 0.00 0.00 0.00 0.00 0.00 0.00 0.00 0.00 0.00 0.00 0.00 0.00 0.00 0.00 0.00
Worker 0.00 0.00 0.03 0.00 0.02 0.00 0.02 0.00 0.00 0.00 0.00 9.46 9.46 0.00 0.00 9.47
Total 0.00 0.00 0.03 0.00 0.02 0.00 0.02 0.00 0.00 9.470.00 0.00 0.00 9.46
Exhaust PM10
PM10 Total
9.46 0.00
PM2.5 Total
Bio- CO2
Mitigated Construction On-Site
ROG NOx CO SO2 Fugitive PM10
CO2e
Category tons/yr MT/yr
NBio- CO2 Total CO2 CH4 N2OFugitive PM2.5
Exhaust PM2.5
Off-Road 0.17 1.08 1.78 0.00 0.05 0.05 0.05 0.05 0.00 244.77 244.77 0.01 0.00 245.06
Paving 0.00 0.00 0.00 0.00 0.00 0.00 0.00 0.00 0.00 0.00 0.00
Total 0.17 1.08 1.78 244.77 0.01 0.000.05 0.05 0.00
SO2 Fugitive PM10
Exhaust PM10
244.770.00 0.05 0.05
Fugitive PM2.5
Exhaust PM2.5
PM2.5 Total
245.06
Mitigated Construction Off-Site
ROG NOx CO N2O CO2e
Category tons/yr MT/yr
Bio- CO2 NBio- CO2 Total CO2 CH4PM10 Total
Hauling 0.00 0.00 0.00 0.00 0.00 0.00 0.00 0.00 0.00 0.00 0.00 0.00 0.00 0.00 0.00 0.00
Vendor 0.00 0.00 0.00 0.00 0.00 0.00 0.00 0.00 0.00 0.00 0.00 0.00 0.00 0.00 0.00 0.00
Worker 0.00 0.00 0.03 0.00 0.00 0.00 0.00 0.00 0.00 0.00 0.00 9.46 9.46 0.00 0.00 9.47
Total 0.00 0.00 0.03 0.00 0.00 0.00 0.00 0.00 0.00 9.470.00 0.00 0.00 9.46 9.46 0.00
45 of 60
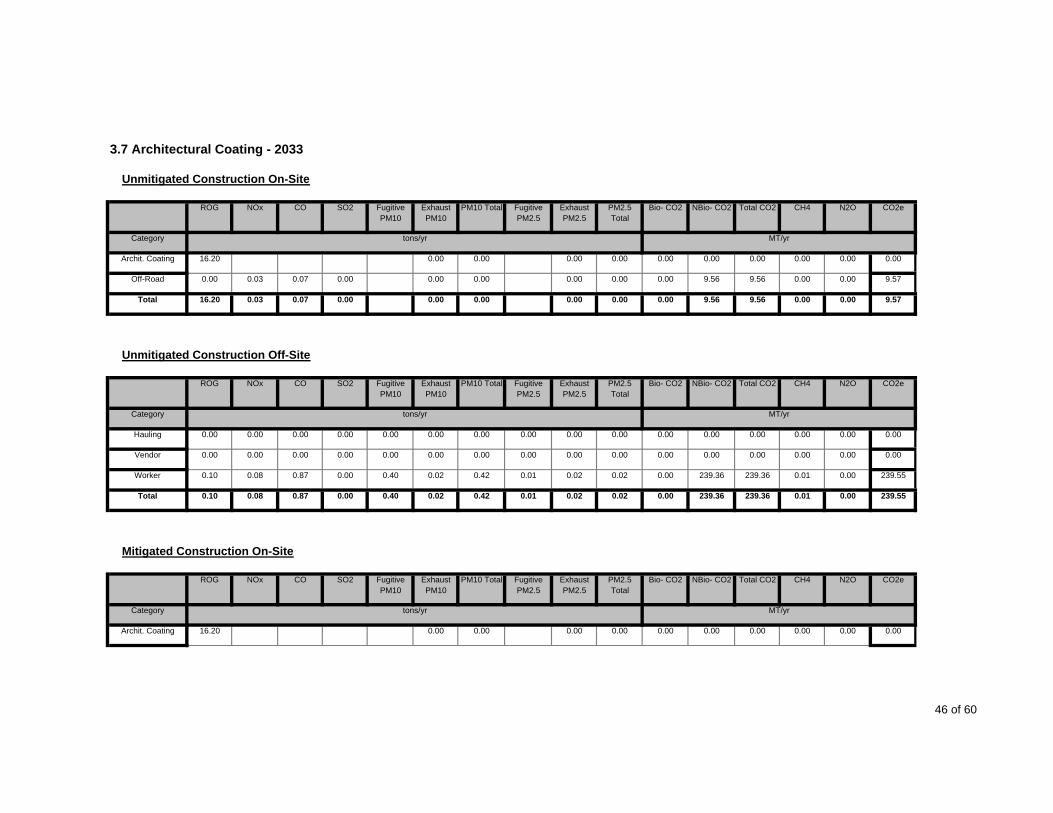
Exhaust PM10
PM10 Total PM2.5 Total
Bio- CO2
3.7 Architectural Coating - 2033
Unmitigated Construction On-Site
ROG NOx CO SO2 Fugitive PM10
CO2e
Category tons/yr MT/yr
NBio- CO2 Total CO2 CH4 N2OFugitive PM2.5
Exhaust PM2.5
Archit. Coating 16.20 0.00 0.00 0.00 0.00 0.00 0.00 0.00 0.00 0.00 0.00
Off-Road 0.00 0.03 0.07 0.00 0.00 0.00 0.00 0.00 0.00 9.56 9.56 0.00 0.00 9.57
Total 16.20 0.03 0.07 9.56 0.00 0.000.00 0.00 0.00
SO2 Fugitive PM10
Exhaust PM10
9.560.00 0.00 0.00
Fugitive PM2.5
Exhaust PM2.5
PM2.5 Total
9.57
Unmitigated Construction Off-Site
ROG NOx CO N2O CO2e
Category tons/yr MT/yr
Bio- CO2 NBio- CO2 Total CO2 CH4PM10 Total
Hauling 0.00 0.00 0.00 0.00 0.00 0.00 0.00 0.00 0.00 0.00 0.00 0.00 0.00 0.00 0.00 0.00
Vendor 0.00 0.00 0.00 0.00 0.00 0.00 0.00 0.00 0.00 0.00 0.00 0.00 0.00 0.00 0.00 0.00
Worker 0.10 0.08 0.87 0.00 0.40 0.02 0.42 0.01 0.02 0.02 0.00 239.36 239.36 0.01 0.00 239.55
Total 0.10 0.08 0.87 0.00 0.40 0.02 0.42 0.01 0.00 239.550.02 0.02 0.00 239.36
Exhaust PM10
PM10 Total
239.36 0.01
PM2.5 Total
Bio- CO2
Mitigated Construction On-Site
ROG NOx CO SO2 Fugitive PM10
CO2e
Category tons/yr MT/yr
NBio- CO2 Total CO2 CH4 N2OFugitive PM2.5
Exhaust PM2.5
Archit. Coating 16.20 0.00 0.00 0.00 0.00 0.00 0.00 0.00 0.00 0.00 0.00
46 of 60
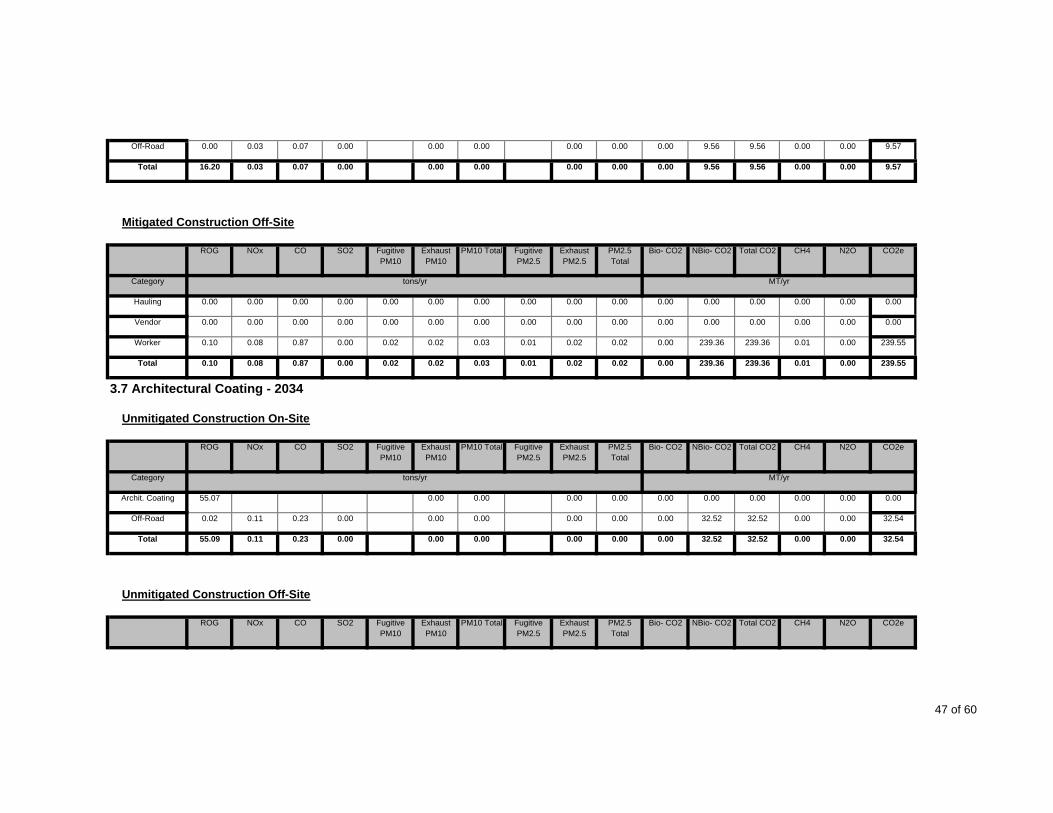
Off-Road 0.00 0.03 0.07 0.00 0.00 0.00 0.00 0.00 0.00 9.56 9.56 0.00 0.00 9.57
Total 16.20 0.03 0.07 9.56 0.00 0.000.00 0.00 0.00
SO2 Fugitive PM10
Exhaust PM10
9.560.00 0.00 0.00
Fugitive PM2.5
Exhaust PM2.5
PM2.5 Total
9.57
Mitigated Construction Off-Site
ROG NOx CO N2O CO2e
Category tons/yr MT/yr
Bio- CO2 NBio- CO2 Total CO2 CH4PM10 Total
Hauling 0.00 0.00 0.00 0.00 0.00 0.00 0.00 0.00 0.00 0.00 0.00 0.00 0.00 0.00 0.00 0.00
Vendor 0.00 0.00 0.00 0.00 0.00 0.00 0.00 0.00 0.00 0.00 0.00 0.00 0.00 0.00 0.00 0.00
Worker 0.10 0.08 0.87 0.00 0.02 0.02 0.03 0.01 0.02 0.02 0.00 239.36 239.36 0.01 0.00 239.55
Total 0.10 0.08 0.87 0.00 0.02 0.02 0.03 0.01 0.00 239.550.02 0.02 0.00 239.36
Exhaust PM10
PM10 Total
239.36 0.01
PM2.5 Total
Bio- CO2
3.7 Architectural Coating - 2034
Unmitigated Construction On-Site
ROG NOx CO SO2 Fugitive PM10
CO2e
Category tons/yr MT/yr
NBio- CO2 Total CO2 CH4 N2OFugitive PM2.5
Exhaust PM2.5
Archit. Coating 55.07 0.00 0.00 0.00 0.00 0.00 0.00 0.00 0.00 0.00 0.00
Off-Road 0.02 0.11 0.23 0.00 0.00 0.00 0.00 0.00 0.00 32.52 32.52 0.00 0.00 32.54
Total 55.09 0.11 0.23 32.52 0.00 0.000.00 0.00 0.00
SO2 Fugitive PM10
Exhaust PM10
32.520.00 0.00 0.00
Fugitive PM2.5
Exhaust PM2.5
PM2.5 Total
32.54
Unmitigated Construction Off-Site
ROG NOx CO N2O CO2eBio- CO2 NBio- CO2 Total CO2 CH4PM10 Total
47 of 60
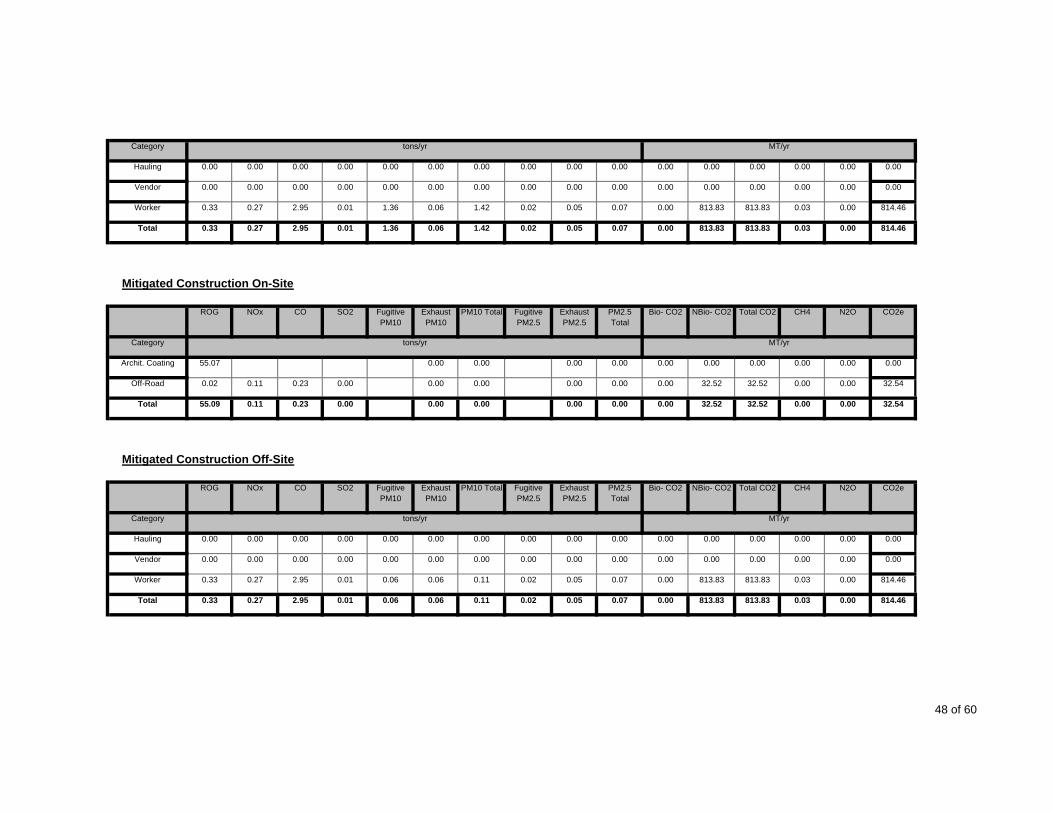
Category tons/yr MT/yr
Hauling 0.00 0.00 0.00 0.00 0.00 0.00 0.00 0.00 0.00 0.00 0.00 0.00 0.00 0.00 0.00 0.00
Vendor 0.00 0.00 0.00 0.00 0.00 0.00 0.00 0.00 0.00 0.00 0.00 0.00 0.00 0.00 0.00 0.00
Worker 0.33 0.27 2.95 0.01 1.36 0.06 1.42 0.02 0.05 0.07 0.00 813.83 813.83 0.03 0.00 814.46
Total 0.33 0.27 2.95 0.01 1.36 0.06 1.42 0.02 0.00 814.460.05 0.07 0.00 813.83
Exhaust PM10
PM10 Total
813.83 0.03
PM2.5 Total
Bio- CO2
Mitigated Construction On-Site
ROG NOx CO SO2 Fugitive PM10
CO2e
Category tons/yr MT/yr
NBio- CO2 Total CO2 CH4 N2OFugitive PM2.5
Exhaust PM2.5
Archit. Coating 55.07 0.00 0.00 0.00 0.00 0.00 0.00 0.00 0.00 0.00 0.00
Off-Road 0.02 0.11 0.23 0.00 0.00 0.00 0.00 0.00 0.00 32.52 32.52 0.00 0.00 32.54
Total 55.09 0.11 0.23 32.52 0.00 0.000.00 0.00 0.00
SO2 Fugitive PM10
Exhaust PM10
32.520.00 0.00 0.00
Fugitive PM2.5
Exhaust PM2.5
PM2.5 Total
32.54
Mitigated Construction Off-Site
ROG NOx CO N2O CO2e
Category tons/yr MT/yr
Bio- CO2 NBio- CO2 Total CO2 CH4PM10 Total
Hauling 0.00 0.00 0.00 0.00 0.00 0.00 0.00 0.00 0.00 0.00 0.00 0.00 0.00 0.00 0.00 0.00
Vendor 0.00 0.00 0.00 0.00 0.00 0.00 0.00 0.00 0.00 0.00 0.00 0.00 0.00 0.00 0.00 0.00
Worker 0.33 0.27 2.95 0.01 0.06 0.06 0.11 0.02 0.05 0.07 0.00 813.83 813.83 0.03 0.00 814.46
Total 0.33 0.27 2.95 0.01 0.06 0.06 0.11 0.02 0.05 0.07 0.00 813.83 813.83 0.03 0.00 814.46
48 of 60

SO2 Fugitive PM10
Exhaust PM10
4.0 Mobile Detail
4.1 Mitigation Measures Mobile
Fugitive PM2.5
Exhaust PM2.5
PM2.5 Total
ROG NOx CO N2O CO2e
Category tons/yr MT/yr
Bio- CO2 NBio- CO2 Total CO2 CH4PM10 Total
Mitigated 53.47 95.51 442.86 1.32 133.22 6.86 140.07 2.12 6.61 8.73 0.00 91,111.18 91,111.18 3.42 0.00 91,182.93
Unmitigated 53.47 95.51 442.86 1.32 133.22 6.86 140.07 2.12 6.61 8.73 0.00 91,111.18 91,111.18 3.42 0.00 91,182.93
Total NA NA NA NA NA NA NA NA NA NA NA NA
4.2 Trip Summary Information
Average Daily Trip Rate Unmitigated Mitigated
NA NA NA NA
Land Use Weekday Saturday Sunday
Apartments Mid Rise 22,393.10 22,393.10 22393.1013,675.35 13675.35
Annual VMT Annual VMT
63,939,094 63,939,09412,777,222 12,777,222
General Heavy Industry 12,834.64 12,834.64 12834.64 37,470,874 37,470,874Fast Food Restaurant with Drive Thru 13,675.35
General Light Industry 1,272.00 1,272.00 1272.00General Office Building 6,048.90 6,048.90 6048.90
3,811.86 3811.86
3,713,618 3,713,61814,455,376 14,455,3769,109,403 9,109,403
General Office Building 1,916.46 1,916.46 1916.46 4,579,866 4,579,866General Office Building 3,811.86
General Office Building 367.38 367.38 367.38 877,947 877,947
49 of 60
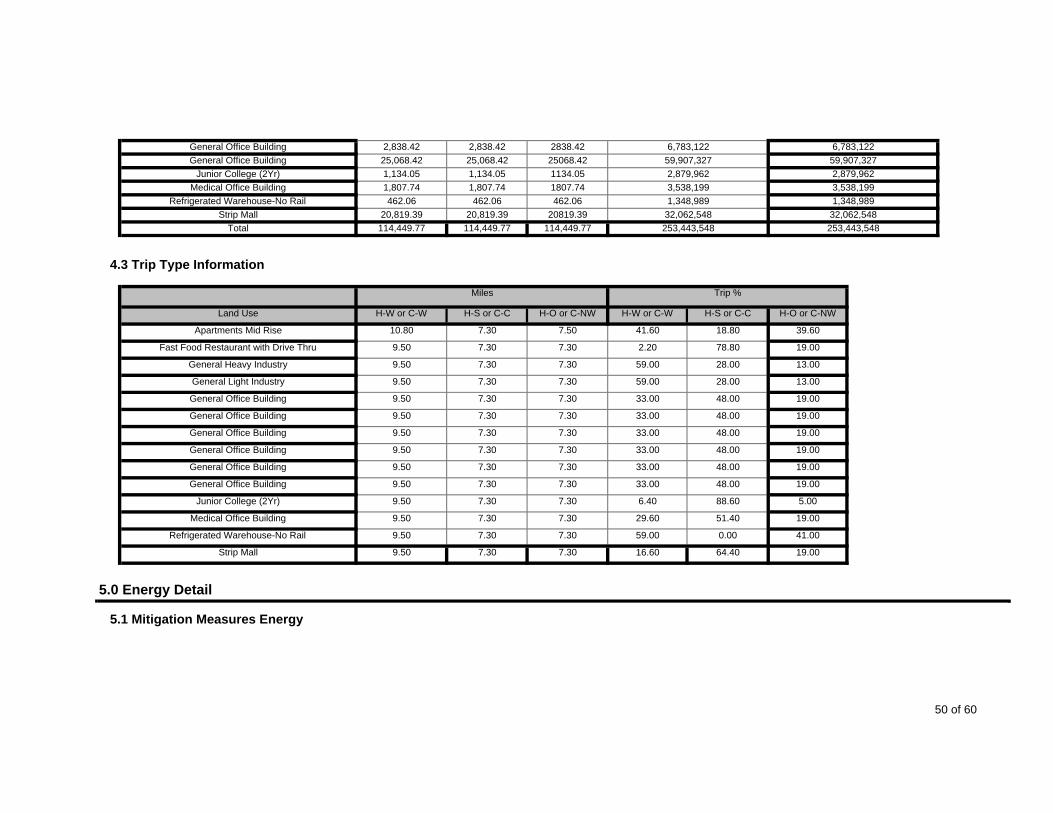
General Office Building 2,838.42 2,838.42 2838.4225,068.42 25068.42
6,783,122 6,783,12259,907,327 59,907,327
Junior College (2Yr) 1,134.05 1,134.05 1134.05 2,879,962 2,879,962General Office Building 25,068.42
Medical Office Building 1,807.74 1,807.74 1807.74Refrigerated Warehouse-No Rail 462.06 462.06 462.06
20,819.39 20819.39
3,538,199 3,538,1991,348,989 1,348,989
32,062,548 32,062,548Total 114,449.77 114,449.77 114,449.77 253,443,548 253,443,548
Strip Mall 20,819.39
4.3 Trip Type Information
Miles Trip %
Land Use H-W or C-W H-S or C-C H-O or C-NW H-W or C-W H-S or C-C H-O or C-NW
Apartments Mid Rise 10.80 7.30 7.50 41.60 18.80 39.60
Fast Food Restaurant with Drive Thru 9.50 7.30 7.30 2.20 78.80 19.00
General Heavy Industry 9.50 7.30 7.30 59.00 28.00 13.00
General Light Industry 9.50 7.30 7.30 59.00 28.00 13.00
General Office Building 9.50 7.30 7.30 33.00 48.00 19.00
General Office Building 9.50 7.30 7.30 33.00 48.00 19.00
General Office Building 9.50 7.30 7.30 33.00 48.00 19.00
General Office Building 9.50 7.30 7.30 33.00 48.00 19.00
General Office Building 9.50 7.30 7.30 33.00 48.00 19.00
General Office Building 9.50 7.30 7.30 33.00 48.00 19.00
Junior College (2Yr) 9.50 7.30 7.30 6.40 88.60 5.00
Medical Office Building 9.50 7.30 7.30 29.60 51.40 19.00
Refrigerated Warehouse-No Rail 9.50 7.30 7.30 59.00 0.00 41.00
16.60 64.40 19.00
5.0 Energy Detail
Strip Mall 9.50 7.30 7.30
5.1 Mitigation Measures Energy
50 of 60
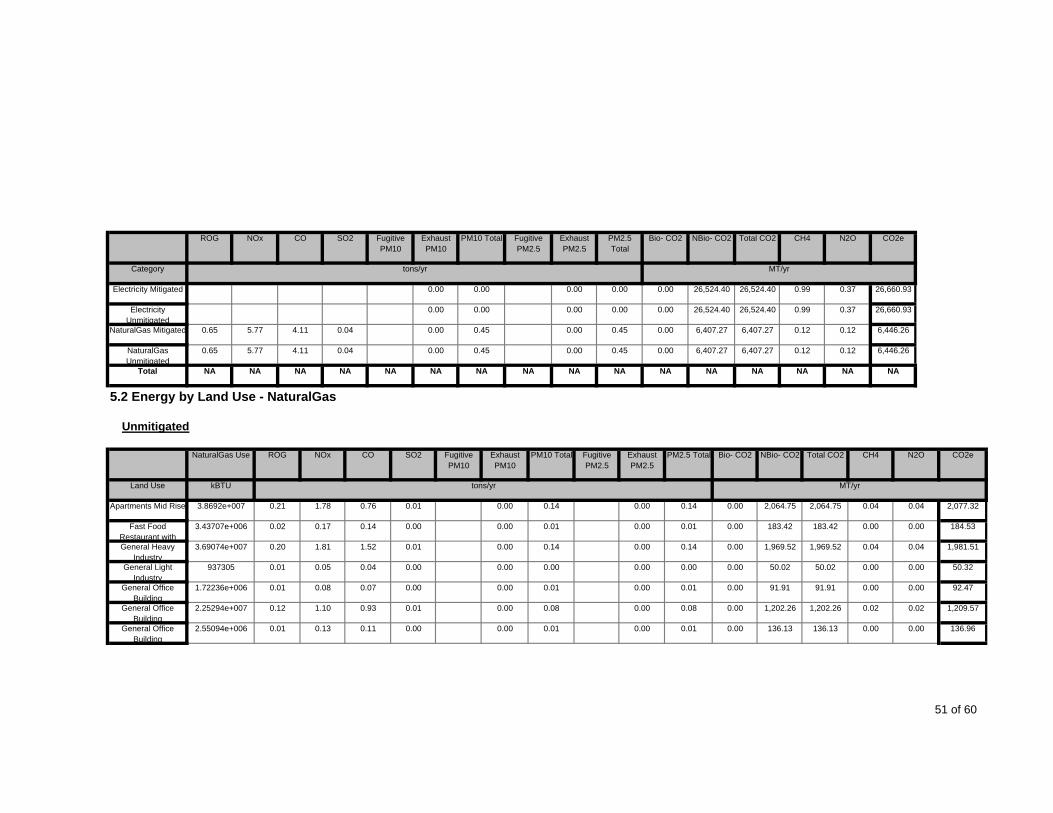
ROG NOx CO SO2 Fugitive PM10
Exhaust PM10
PM10 Total Fugitive PM2.5
Exhaust PM2.5
PM2.5 Total
Bio- CO2 NBio- CO2 Total CO2 CH4 N2O CO2e
Category tons/yr MT/yr
Electricity Mitigated 0.00 0.00 0.00 0.00 0.00 26,524.40 26,524.40 0.99 0.37 26,660.93
Electricity Unmitigated
0.00 0.00 0.00 0.00 0.00 26,524.40 26,524.40 0.99 0.37 26,660.93
NaturalGas Mitigated 0.65 5.77 4.11 0.04 0.00 0.45 0.00 0.45 0.00 6,407.27 6,407.27 0.12 0.12 6,446.26
NaturalGas Unmitigated
0.65 5.77 4.11 0.04 0.00 0.45 0.00 0.45 0.00 6,407.27 6,407.27 0.12 0.12 6,446.26
Total NA NA NA NA NA NA NA NA NA NA NA NA NA NA NA NA
5.2 Energy by Land Use - NaturalGas
Unmitigated
NaturalGas Use ROG NOx CO SO2 Fugitive PM10
Exhaust PM10
PM10 Total Fugitive PM2.5
Exhaust PM2.5
PM2.5 Total N2O CO2e
Land Use kBTU tons/yr MT/yr
Bio- CO2 NBio- CO2 Total CO2 CH4
Apartments Mid Rise 3.8692e+007 0.21 1.78 0.76 0.01 0.00 0.14 0.00 0.14 0.00 2,064.75 2,064.75 0.04 0.04 2,077.32
Fast Food Restaurant with
3.43707e+006 0.02 0.17 0.14 0.00 0.00 0.01 0.00 0.01 0.00 183.42 183.42 0.00 0.00 184.53
General Heavy Industry
3.69074e+007 0.20 1.81 1.52 0.01 0.00 0.14 0.00 0.14 0.00 1,969.52 1,969.52 0.04 0.04 1,981.51
General Light Industry
937305 0.01 0.05 0.04 0.00 0.00 0.00 0.00 0.00 0.00 50.02 50.02 0.00 0.00 50.32
General Office Building
1.72236e+006 0.01 0.08 0.07 0.00 0.00 0.01 0.00 0.01 0.00 91.91 91.91 0.00 0.00 92.47
General Office Building
2.25294e+007 0.12 1.10 0.93 0.01 0.00 0.08 0.00 0.08 0.00 1,202.26 1,202.26 0.02 0.02 1,209.57
General Office Building
2.55094e+006 0.01 0.13 0.11 0.00 0.00 0.01 0.00 0.01 0.00 136.13 136.13 0.00 0.00 136.96
51 of 60

General Office Building
3.42579e+006 0.02 0.17 0.14 0.00 0.00 0.01 0.00 0.01 0.00 182.81 182.81 0.00 0.00 183.93
General Office Building
330171 0.00 0.02 0.01 0.00 0.00 0.00 0.00 0.00 0.00 17.62 17.62 0.00 0.00 17.73
General Office Building
5.43625e+006 0.03 0.27 0.22 0.00 0.00 0.02 0.00 0.02 0.00 290.10 290.10 0.01 0.01 291.86
Junior College (2Yr) 2.32756e+006 0.01 0.11 0.10 0.00 0.00 0.01 0.00 0.01 0.00 124.21 124.21 0.00 0.00 124.96
Medical Office Building
763389 0.00 0.04 0.03 0.00 0.00 0.00 0.00 0.00 0.00 40.74 40.74 0.00 0.00 40.99
Refrigerated Warehouse-No Rail
607020 0.00 0.03 0.02 0.00 0.00 0.00 0.00 0.00 0.00 32.39 32.39 0.00 0.00 32.59
Strip Mall 400979 0.00 0.02 0.02 0.00 0.00 0.00 0.00 0.00
4.11 0.03 0.00Total 0.64 5.78 0.00 0.43
0.00 21.530.00 21.40 21.40 0.00
0.11 6,446.27
Mitigated
0.00 6,407.28 6,407.28 0.110.43
NaturalGas Use ROG NOx CO SO2 Fugitive PM10
Exhaust PM10
PM10 Total Fugitive PM2.5
Exhaust PM2.5
PM2.5 Total N2O CO2e
Land Use kBTU tons/yr MT/yr
Bio- CO2 NBio- CO2 Total CO2 CH4
Apartments Mid Rise 3.8692e+007 0.21 1.78 0.76 0.01 0.00 0.14 0.00 0.14 0.00 2,064.75 2,064.75 0.04 0.04 2,077.32
Fast Food Restaurant with
3.43707e+006 0.02 0.17 0.14 0.00 0.00 0.01 0.00 0.01 0.00 183.42 183.42 0.00 0.00 184.53
General Heavy Industry
3.69074e+007 0.20 1.81 1.52 0.01 0.00 0.14 0.00 0.14 0.00 1,969.52 1,969.52 0.04 0.04 1,981.51
General Light Industry
937305 0.01 0.05 0.04 0.00 0.00 0.00 0.00 0.00 0.00 50.02 50.02 0.00 0.00 50.32
General Office Building
1.72236e+006 0.01 0.08 0.07 0.00 0.00 0.01 0.00 0.01 0.00 91.91 91.91 0.00 0.00 92.47
General Office Building
2.25294e+007 0.12 1.10 0.93 0.01 0.00 0.08 0.00 0.08 0.00 1,202.26 1,202.26 0.02 0.02 1,209.57
General Office Building
2.55094e+006 0.01 0.13 0.11 0.00 0.00 0.01 0.00 0.01 0.00 136.13 136.13 0.00 0.00 136.96
General Office Building
3.42579e+006 0.02 0.17 0.14 0.00 0.00 0.01 0.00 0.01 0.00 182.81 182.81 0.00 0.00 183.93
General Office Building
330171 0.00 0.02 0.01 0.00 0.00 0.00 0.00 0.00 0.00 17.62 17.62 0.00 0.00 17.73
General Office Building
5.43625e+006 0.03 0.27 0.22 0.00 0.00 0.02 0.00 0.02 0.00 290.10 290.10 0.01 0.01 291.86
Junior College (2Yr) 2.32756e+006 0.01 0.11 0.10 0.00 0.00 0.01 0.00 0.01 0.00 124.21 124.21 0.00 0.00 124.96
52 of 60
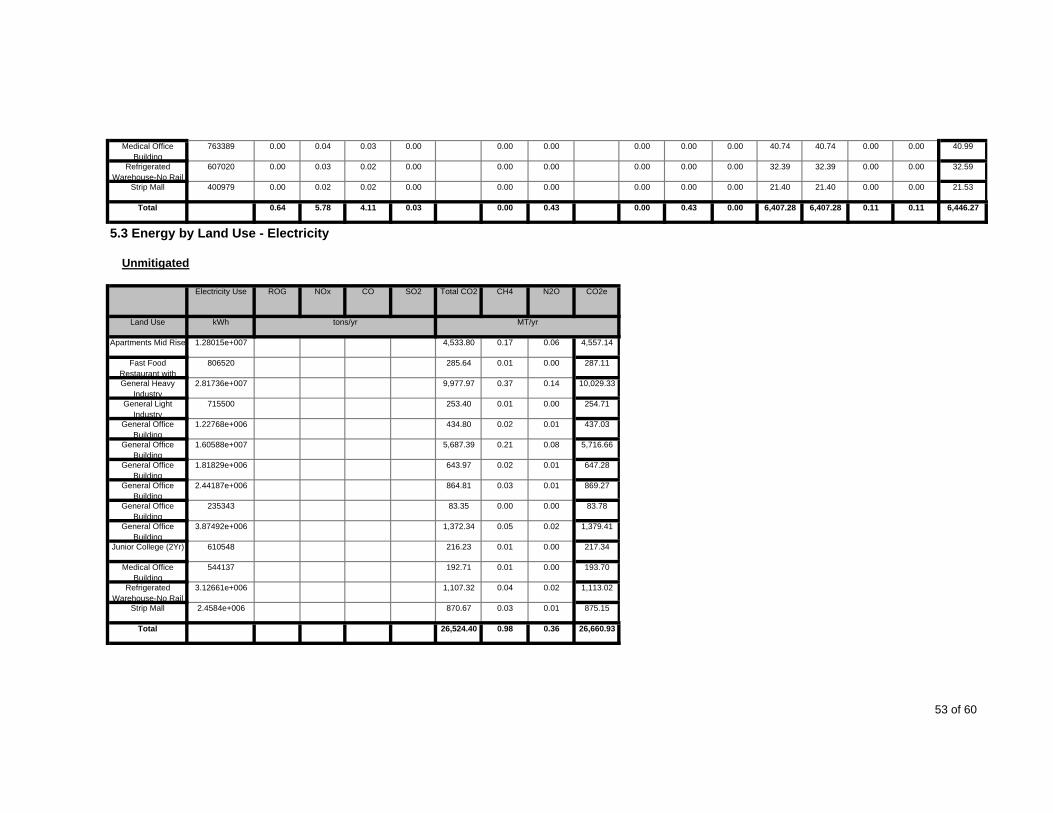
Medical Office Building
763389 0.00 0.04 0.03 0.00 0.00 0.00 0.00 0.00 0.00 40.74 40.74 0.00 0.00 40.99
Refrigerated Warehouse-No Rail
607020 0.00 0.03 0.02 0.00 0.00 0.00 0.00 0.00 0.00 32.39 32.39 0.00 0.00 32.59
Strip Mall 400979 0.00 0.02 0.02 0.00 0.00 0.00 0.00 0.00
4.11 0.03 0.00Total 0.64 5.78 0.00 0.43
0.00 21.530.00 21.40 21.40 0.00
0.11 6,446.27
5.3 Energy by Land Use - Electricity
Unmitigated
0.00 6,407.28 6,407.28 0.110.43
Electricity Use ROG NOx N2O CO2e
Land Use kWh tons/yr MT/yr
CO SO2 Total CO2 CH4
Apartments Mid Rise 1.28015e+007 4,533.80 0.17 0.06 4,557.14
Fast Food Restaurant with
806520 285.64 0.01 0.00 287.11
General Heavy Industry
2.81736e+007 9,977.97 0.37 0.14 10,029.33
General Light Industry
715500 253.40 0.01 0.00 254.71
General Office Building
1.22768e+006 434.80 0.02 0.01 437.03
General Office Building
1.60588e+007 5,687.39 0.21 0.08 5,716.66
General Office Building
1.81829e+006 643.97 0.02 0.01 647.28
General Office Building
2.44187e+006 864.81 0.03 0.01 869.27
General Office Building
235343 83.35 0.00 0.00 83.78
General Office Building
3.87492e+006 1,372.34 0.05 0.02 1,379.41
Junior College (2Yr) 610548 216.23 0.01 0.00 217.34
Medical Office Building
544137 192.71 0.01 0.00 193.70
Refrigerated Warehouse-No Rail
3.12661e+006 1,107.32 0.04 0.02 1,113.02
Strip Mall 2.4584e+006 870.67 0.03 0.01 875.15
Total 26,524.40 0.98 0.36 26,660.93
53 of 60

Mitigated
Electricity Use ROG NOx N2O CO2e
Land Use kWh tons/yr MT/yr
CO SO2 Total CO2 CH4
Apartments Mid Rise 1.28015e+007 4,533.80 0.17 0.06 4,557.14
Fast Food Restaurant with
806520 285.64 0.01 0.00 287.11
General Heavy Industry
2.81736e+007 9,977.97 0.37 0.14 10,029.33
General Light Industry
715500 253.40 0.01 0.00 254.71
General Office Building
1.22768e+006 434.80 0.02 0.01 437.03
General Office Building
1.60588e+007 5,687.39 0.21 0.08 5,716.66
General Office Building
1.81829e+006 643.97 0.02 0.01 647.28
General Office Building
2.44187e+006 864.81 0.03 0.01 869.27
General Office Building
235343 83.35 0.00 0.00 83.78
General Office Building
3.87492e+006 1,372.34 0.05 0.02 1,379.41
Junior College (2Yr) 610548 216.23 0.01 0.00 217.34
Medical Office Building
544137 192.71 0.01 0.00 193.70
Refrigerated Warehouse-No Rail
3.12661e+006 1,107.32 0.04 0.02 1,113.02
Strip Mall 2.4584e+006 870.67 0.03 0.01 875.15
Total 26,524.40 0.98 0.36 26,660.93
6.0 Area Detail
6.1 Mitigation Measures Area
54 of 60

ROG NOx CO PM2.5 Total
Bio- CO2SO2 Fugitive PM10
Exhaust PM10
PM10 Total CO2e
Category tons/yr MT/yr
NBio- CO2 Total CO2 CH4 N2OFugitive PM2.5
Exhaust PM2.5
Mitigated 278.42 3.44 311.25 0.11 0.00 40.24 0.00 40.24 3,791.99 4,815.94 8,607.93 3.60 0.36 8,794.14
Unmitigated 278.42 3.44 311.25 0.11 0.00 40.24 0.00 40.24 3,791.99 4,815.94 8,607.93 3.60 0.36 8,794.14
Total NA NA NA NA NA NANA NA NA NA
SO2 Fugitive PM10
Exhaust PM10
NANA NA NA NA
Fugitive PM2.5
Exhaust PM2.5
PM2.5 Total
NA
6.2 Area by SubCategory
Unmitigated
ROG NOx CO N2O CO2e
SubCategory tons/yr MT/yr
Bio- CO2 NBio- CO2 Total CO2 CH4PM10 Total
Architectural Coating 11.88 0.00 0.00 0.00 0.00 0.00 0.00 0.00 0.00 0.00 0.00
Consumer Products 35.05 0.00 0.00 0.00 0.00 0.00 0.00 0.00 0.00 0.00 0.00
Hearth 230.66 3.13 283.77 0.11 0.00 40.09 0.00 40.08 3,791.99 4,770.91 8,562.90 3.56 0.36 8,748.21
Landscaping 0.82 0.32 27.48 0.00 0.00 0.15 0.00 0.15 0.00 45.03 45.03 0.04 0.00 45.93
Total 278.41 3.45 311.25 8,607.93 3.60 0.360.00 40.23 3,791.99 4,815.940.11 0.00 40.24 8,794.14
Mitigated
55 of 60

SO2 Fugitive PM10
Exhaust PM10
Fugitive PM2.5
Exhaust PM2.5
PM2.5 Total
ROG NOx CO N2O CO2e
SubCategory tons/yr MT/yr
Bio- CO2 NBio- CO2 Total CO2 CH4PM10 Total
Architectural Coating 11.88 0.00 0.00 0.00 0.00 0.00 0.00 0.00 0.00 0.00 0.00
Consumer Products 35.05 0.00 0.00 0.00 0.00 0.00 0.00 0.00 0.00 0.00 0.00
Hearth 230.66 3.13 283.77 0.11 0.00 40.09 0.00 40.08 3,791.99 4,770.91 8,562.90 3.56 0.36 8,748.21
Landscaping 0.82 0.32 27.48 0.00 0.00 0.15 0.00 0.15 0.00 45.03 45.03 0.04 0.00 45.93
Total 278.41 3.45 311.25 40.23 3,791.990.11 0.00 40.24 8,794.14
7.0 Water Detail
7.1 Mitigation Measures Water
4,815.94 8,607.93 3.60 0.360.00
Apply Water Conservation Strategy
ROG NOx CO SO2 Total CO2 CH4 N2O CO2e
Category tons/yr MT/yr
Mitigated 63,228.23 412.55 11.06 75,320.86
Unmitigated 79,035.29 515.69 13.83 94,151.07
Total NA NA NA NA NA NA NA NA
7.2 Water by Land Use
Unmitigated
56 of 60
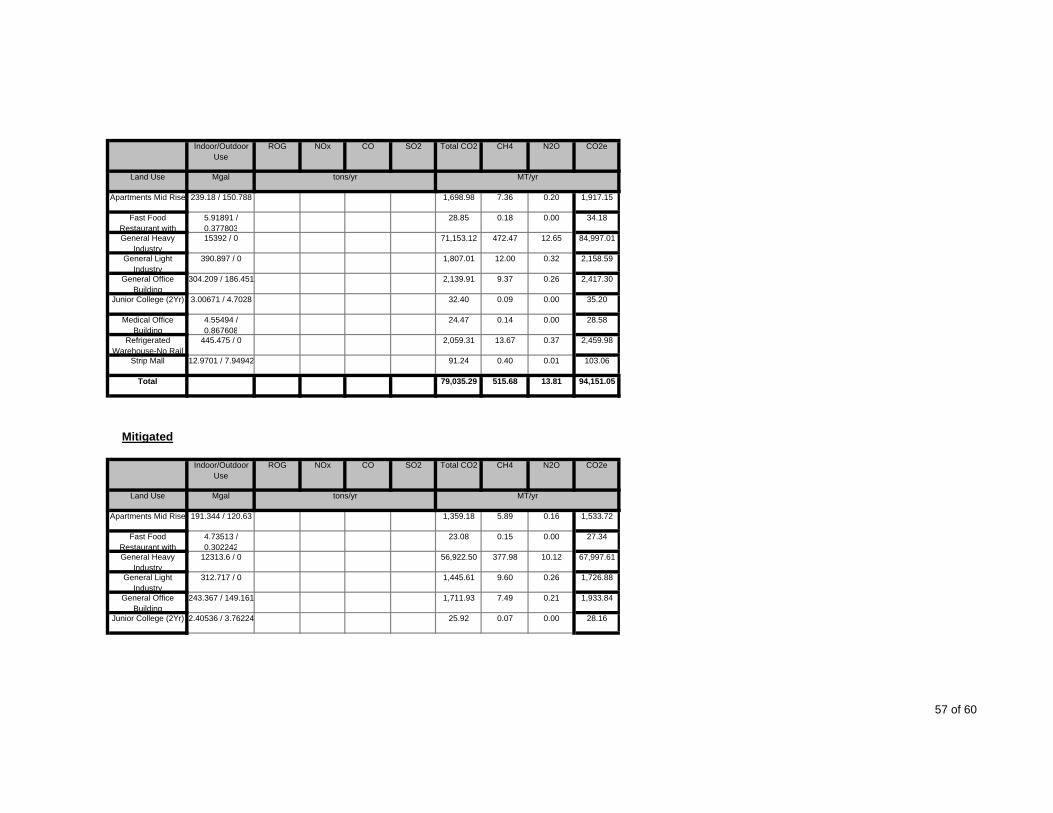
Indoor/Outdoor Use
ROG NOx CO SO2 Total CO2 CH4 N2O CO2e
Land Use Mgal tons/yr MT/yr
Apartments Mid Rise 239.18 / 150.788 1,698.98 7.36 0.20 1,917.15
Fast Food Restaurant with
5.91891 / 0.377803
28.85 0.18 0.00 34.18
General Heavy Industry
15392 / 0 71,153.12 472.47 12.65 84,997.01
General Light Industry
390.897 / 0 1,807.01 12.00 0.32 2,158.59
General Office Building
304.209 / 186.451 2,139.91 9.37 0.26 2,417.30
Junior College (2Yr) 3.00671 / 4.7028 32.40 0.09 0.00 35.20
Medical Office Building
4.55494 / 0.867608
24.47 0.14 0.00 28.58
Refrigerated Warehouse-No Rail
445.475 / 0 2,059.31 13.67 0.37 2,459.98
Strip Mall 12.9701 / 7.94942 91.24 0.40 0.01 103.06
Total 79,035.29 515.68 13.81 94,151.05
Mitigated
Indoor/Outdoor Use
ROG NOx N2O CO2e
Land Use Mgal tons/yr MT/yr
CO SO2 Total CO2 CH4
Apartments Mid Rise 191.344 / 120.63 1,359.18 5.89 0.16 1,533.72
Fast Food Restaurant with
4.73513 / 0.302242
23.08 0.15 0.00 27.34
General Heavy Industry
12313.6 / 0 56,922.50 377.98 10.12 67,997.61
General Light Industry
312.717 / 0 1,445.61 9.60 0.26 1,726.88
General Office Building
243.367 / 149.161 1,711.93 7.49 0.21 1,933.84
Junior College (2Yr) 2.40536 / 3.76224 25.92 0.07 0.00 28.16
57 of 60

Medical Office Building
3.64395 / 0.694087
19.58 0.11 0.00 22.87
Refrigerated Warehouse-No Rail
356.38 / 0 1,647.45 10.94 0.29 1,967.99
Strip Mall 10.3761 / 6.35953 72.99 0.32 0.01 82.45
Total 63,228.24 412.55 11.05 75,320.86
8.0 Waste Detail
NOx CO
8.1 Mitigation Measures Waste
Category/Year
CO2e
tons/yr MT/yr
SO2 Total CO2 CH4 N2OROG
Mitigated 5,894.02 348.33 0.00 13,208.88
Unmitigated 5,894.02 348.33 0.00 13,208.88
Total NA NA NA NA NA NA NA NA
8.2 Waste by Land Use
Unmitigated
Waste Disposed ROG NOx CO SO2 Total CO2 CH4 N2O CO2e
Land Use tons tons/yr MT/yr
Apartments Mid Rise 1688.66 342.78 20.26 0.00 768.20
58 of 60
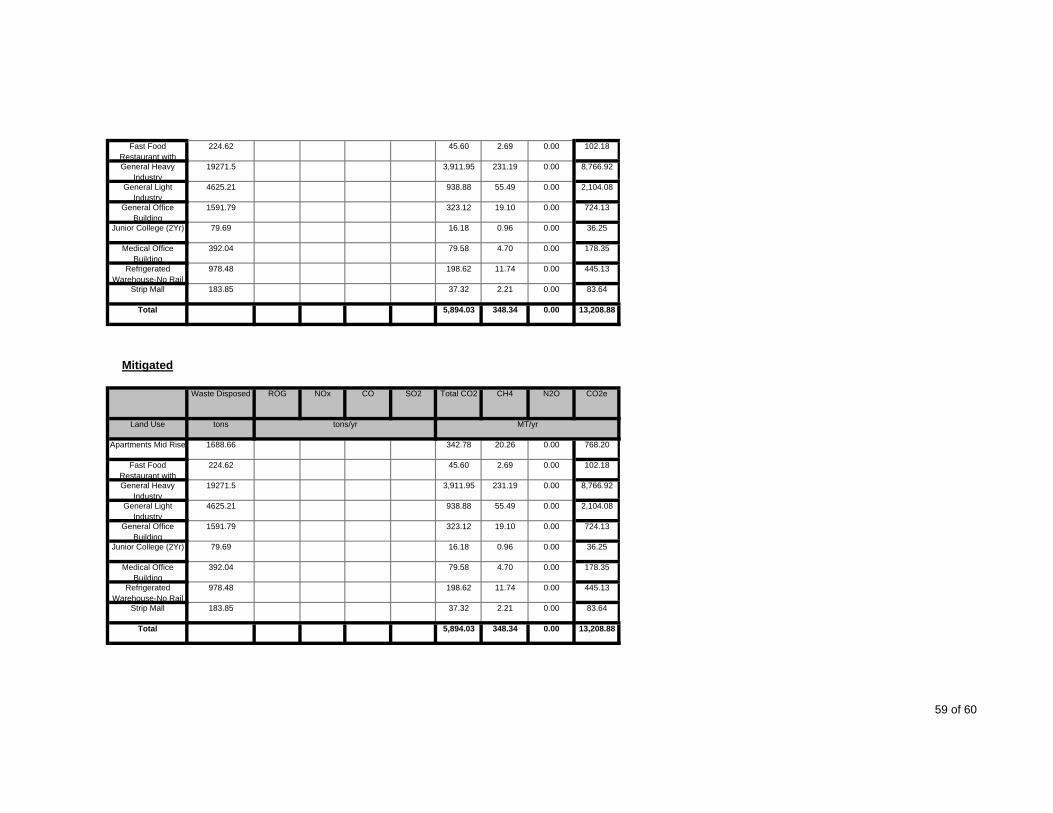
Fast Food Restaurant with
224.62 45.60 2.69 0.00 102.18
General Heavy Industry
19271.5 3,911.95 231.19 0.00 8,766.92
General Light Industry
4625.21 938.88 55.49 0.00 2,104.08
General Office Building
1591.79 323.12 19.10 0.00 724.13
Junior College (2Yr) 79.69 16.18 0.96 0.00 36.25
Medical Office Building
392.04 79.58 4.70 0.00 178.35
Refrigerated Warehouse-No Rail
978.48 198.62 11.74 0.00 445.13
Strip Mall 183.85 37.32 2.21 0.00 83.64
Total 5,894.03 348.34 0.00 13,208.88
Mitigated
Waste Disposed ROG NOx N2O CO2e
Land Use tons tons/yr MT/yr
CO SO2 Total CO2 CH4
Apartments Mid Rise 1688.66 342.78 20.26 0.00 768.20
Fast Food Restaurant with
224.62 45.60 2.69 0.00 102.18
General Heavy Industry
19271.5 3,911.95 231.19 0.00 8,766.92
General Light Industry
4625.21 938.88 55.49 0.00 2,104.08
General Office Building
1591.79 323.12 19.10 0.00 724.13
Junior College (2Yr) 79.69 16.18 0.96 0.00 36.25
Medical Office Building
392.04 79.58 4.70 0.00 178.35
Refrigerated Warehouse-No Rail
978.48 198.62 11.74 0.00 445.13
Strip Mall 183.85 37.32 2.21 0.00 83.64
Total 5,894.03 348.34 0.00 13,208.88
59 of 60

9.0 Vegetation
60 of 60

WITH GHG REDUCTIONS – REVISED ALTERNATIVE 2

CalEEMod Version: CalEEMod.2011.1.1 Date: 6/15/2011
Barrio Logan Alternative 2 (2030) - No ChangeSan Diego County APCD Air District, Annual
1.0 Project Characteristics
1.1 Land Usage
Land Uses Size Metric
General Office Building 8.71 1000sqft
General Office Building 222.16 1000sqft
General Office Building 26.14 1000sqft
Government Office Building 110 1000sqft
Medical Office Building 76.4 1000sqft
Elementary School 529 Student
Junior College (2Yr) 8.7 1000sqft
City Park 9.1 Acre
Apartments Mid Rise 603 Dwelling Unit
Single Family Housing 56 Dwelling Unit
1.2 Other Project CharacteristicsUtility Company San Diego Gas & ElectricUrbanization Urban Wind Speed (m/s)
Climate Zone 13 2.6
Precipitation Freq (Days)
1 of 28

1.3 User Entered Comments 40
Project Characteristics -
Land Use - The du/acre in the Proposed Barrio Logan Community Plan is 14 du/acre for single family.
Architectural Coating - based on SDAPCD VOC content limits
Vehicle Trips - daily trips based on Traffic Impact Analysis
Area Coating - Based on SDAPCD VOC content limits.
Energy Use - Prior to 2008 Building Energy Efficiency Standards.
2.0 Emissions Summary
2.1 Overall Construction
Unmitigated Construction
ROG NOx CO PM2.5 Total
Bio- CO2SO2 Fugitive PM10
Exhaust PM10
PM10 Total CO2e
Year tons/yr MT/yr
NBio- CO2 Total CO2 CH4 N2OFugitive PM2.5
Exhaust PM2.5
2011 1.60 11.41 8.95 0.01 1.05 0.59 1.64 0.29 0.59 0.88 0.00 1,351.75 1,351.75 0.13 0.00 1,354.45
2012 1.57 9.01 11.12 0.02 1.08 0.49 1.57 0.02 0.48 0.50 0.00 1,700.97 1,700.97 0.12 0.00 1,703.59
2013 1.45 8.34 10.45 0.02 1.08 0.45 1.53 0.02 0.43 0.45 0.00 1,686.23 1,686.23 0.12 0.00 1,688.65
2014 17.50 4.32 5.10 0.01 0.51 0.26 0.77 0.01 0.25 0.26 0.00 836.97 836.97 0.06 0.00 838.24
Total 22.12 33.08 35.62 5,575.92 0.43 0.000.34 1.75 2.09 0.00
SO2 Fugitive PM10
Exhaust PM10
5,575.920.06 3.72 1.79 5.51
Fugitive PM2.5
Exhaust PM2.5
PM2.5 Total
5,584.93
Mitigated Construction
ROG NOx CO N2O CO2eBio- CO2 NBio- CO2 Total CO2 CH4PM10 Total
2 of 28

Year tons/yr MT/yr
2011 1.60 11.41 8.95 0.01 0.62 0.59 1.21 0.29 0.59 0.88 0.00 1,351.75 1,351.75 0.13 0.00 1,354.45
2012 1.57 9.01 11.12 0.02 0.05 0.49 0.54 0.02 0.48 0.50 0.00 1,700.97 1,700.97 0.12 0.00 1,703.59
2013 1.45 8.34 10.45 0.02 0.05 0.45 0.50 0.02 0.43 0.45 0.00 1,686.23 1,686.23 0.12 0.00 1,688.65
2014 17.50 4.32 5.10 0.01 0.02 0.26 0.28 0.01 0.25 0.26 0.00 836.97 836.97 0.06 0.00 838.24
Total 22.12 33.08 35.62 5,575.92 0.43 0.000.34 1.75 2.09 0.00
SO2 Fugitive PM10
Exhaust PM10
5,575.920.06 0.74 1.79 2.53
Fugitive PM2.5
Exhaust PM2.5
PM2.5 Total
5,584.93
2.2 Overall Operational
Unmitigated Operational
ROG NOx CO N2O CO2e
Category tons/yr MT/yr
Bio- CO2 NBio- CO2 Total CO2 CH4PM10 Total
Area 47.92 0.62 55.87 0.02 0.00 7.22 0.00 7.22 680.72 864.53 1,545.25 0.65 0.06 1,578.68
Energy 0.11 0.96 0.64 0.01 0.00 0.08 0.00 0.08 0.00 4,571.53 4,571.53 0.15 0.07 4,596.07
Mobile 7.98 14.26 66.57 0.20 20.38 1.04 21.42 0.32 1.01 1.33 0.00 13,900.64 13,900.64 0.52 0.00 13,911.52
Waste 0.00 0.00 0.00 0.00 328.45 0.00 328.45 19.41 0.00 736.08
Water 0.00 0.00 0.00 0.00 0.00 897.70 897.70 3.75 0.10 1,008.94
Total 56.01 15.84 123.08 0.23 20.38 1.04 28.72 0.32 0.23 21,831.291.01 8.63 1,009.17 20,234.40
Exhaust PM10
PM10 Total
21,243.57 24.48
PM2.5 Total
Bio- CO2
Mitigated Operational
ROG NOx CO SO2 Fugitive PM10
CO2e
Category tons/yr MT/yr
NBio- CO2 Total CO2 CH4 N2OFugitive PM2.5
Exhaust PM2.5
3 of 28

Area 47.92 0.62 55.87 0.02 0.00 7.22 0.00 7.22 680.72 864.53 1,545.25 0.65 0.06 1,578.68
Energy 0.11 0.96 0.64 0.01 0.00 0.08 0.00 0.08 0.00 4,571.53 4,571.53 0.15 0.07 4,596.07
Mobile 7.98 14.26 66.57 0.20 20.38 1.04 21.42 0.32 1.01 1.33 0.00 13,900.64 13,900.64 0.52 0.00 13,911.52
Waste 0.00 0.00 0.00 0.00 328.45 0.00 328.45 19.41 0.00 736.08
Water 0.00 0.00 0.00 0.00 0.00 897.70 897.70 3.75 0.10 1,008.94
Total 56.01 15.84 123.08 0.23 20.38 1.04 28.72 0.32 1.01 8.63 1,009.17 20,234.40 21,243.57 24.48 0.23 21,831.29
3.0 Construction Detail
3.1 Mitigation Measures Construction
3.2 Demolition - 2011
Unmitigated Construction On-Site
4 of 28
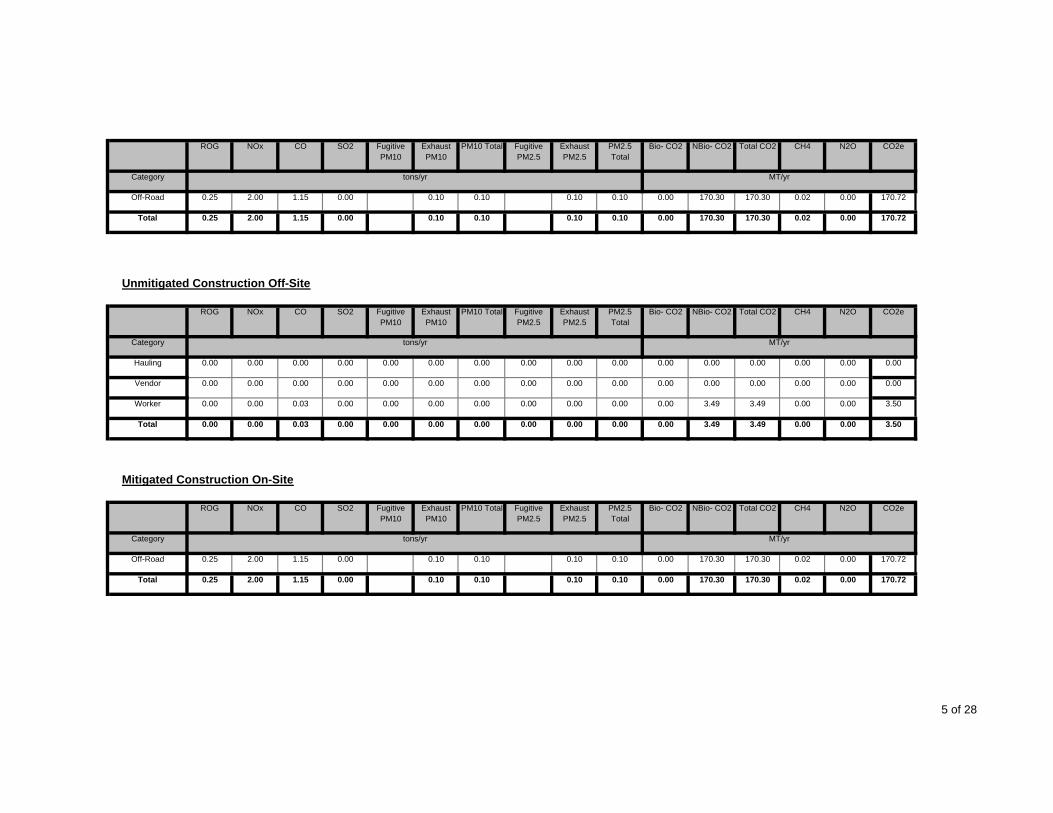
SO2 Fugitive PM10
Exhaust PM10
Fugitive PM2.5
Exhaust PM2.5
PM2.5 Total
ROG NOx CO N2O CO2e
Category tons/yr MT/yr
Bio- CO2 NBio- CO2 Total CO2 CH4PM10 Total
Off-Road 0.25 2.00 1.15 0.00 0.10 0.10 0.10 0.10 0.00 170.30 170.30 0.02 0.00 170.72
Total 0.25 2.00 1.15 0.00 0.10 0.10 0.00 170.720.10 0.10 0.00 170.30
Exhaust PM10
PM10 Total
170.30 0.02
PM2.5 Total
Bio- CO2
Unmitigated Construction Off-Site
ROG NOx CO SO2 Fugitive PM10
CO2e
Category tons/yr MT/yr
NBio- CO2 Total CO2 CH4 N2OFugitive PM2.5
Exhaust PM2.5
Hauling 0.00 0.00 0.00 0.00 0.00 0.00 0.00 0.00 0.00 0.00 0.00 0.00 0.00 0.00 0.00 0.00
Vendor 0.00 0.00 0.00 0.00 0.00 0.00 0.00 0.00 0.00 0.00 0.00 0.00 0.00 0.00 0.00 0.00
Worker 0.00 0.00 0.03 0.00 0.00 0.00 0.00 0.00 0.00 0.00 0.00 3.49 3.49 0.00 0.00 3.50
Total 0.00 0.00 0.03 0.00 0.00 0.00 0.00 0.00 0.00 3.500.00 0.00 0.00 3.49
Exhaust PM10
PM10 Total
3.49 0.00
PM2.5 Total
Bio- CO2
Mitigated Construction On-Site
ROG NOx CO SO2 Fugitive PM10
CO2e
Category tons/yr MT/yr
NBio- CO2 Total CO2 CH4 N2OFugitive PM2.5
Exhaust PM2.5
Off-Road 0.25 2.00 1.15 0.00 0.10 0.10 0.10 0.10 0.00 170.30 170.30 0.02 0.00 170.72
Total 0.25 2.00 1.15 0.00 0.10 0.10 0.00 170.720.10 0.10 0.00 170.30 170.30 0.02
5 of 28
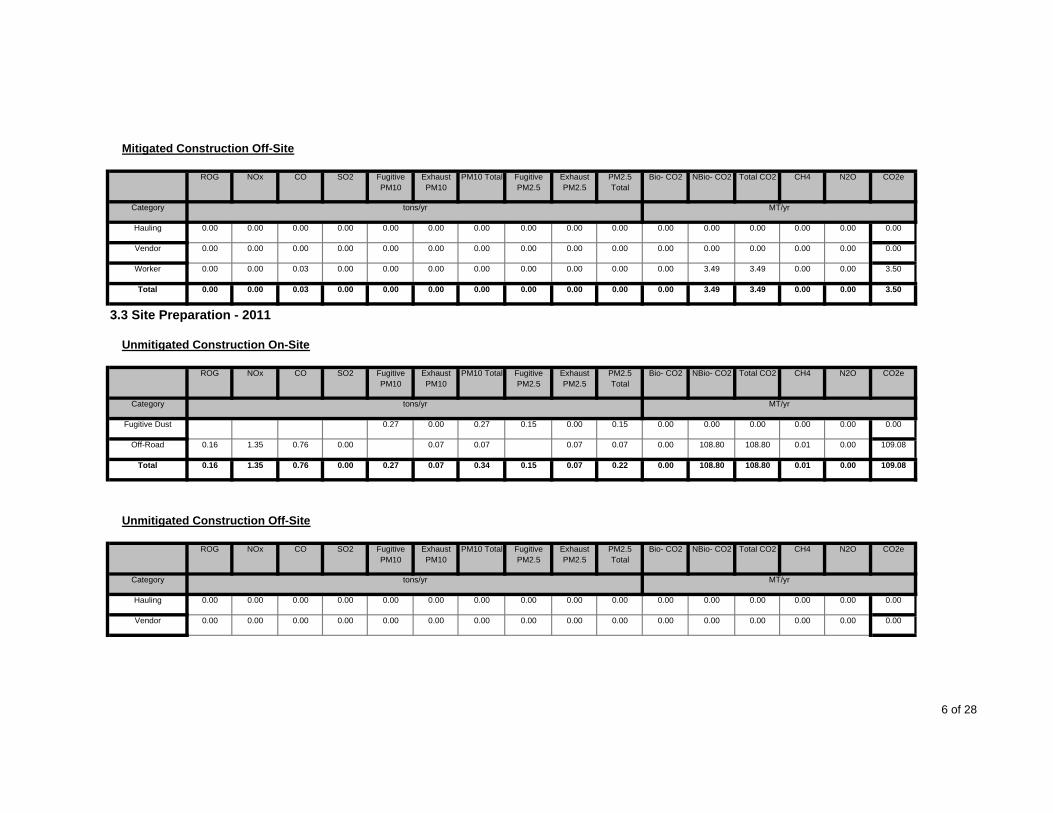
Exhaust PM10
PM10 Total PM2.5 Total
Bio- CO2
Mitigated Construction Off-Site
ROG NOx CO SO2 Fugitive PM10
CO2e
Category tons/yr MT/yr
NBio- CO2 Total CO2 CH4 N2OFugitive PM2.5
Exhaust PM2.5
Hauling 0.00 0.00 0.00 0.00 0.00 0.00 0.00 0.00 0.00 0.00 0.00 0.00 0.00 0.00 0.00 0.00
Vendor 0.00 0.00 0.00 0.00 0.00 0.00 0.00 0.00 0.00 0.00 0.00 0.00 0.00 0.00 0.00 0.00
Worker 0.00 0.00 0.03 0.00 0.00 0.00 0.00 0.00 0.00 0.00 0.00 3.49 3.49 0.00 0.00 3.50
Total 0.00 0.00 0.03 0.00 0.00 0.00 0.00 0.00 0.00 3.500.00 0.00 0.00 3.49
Exhaust PM10
PM10 Total
3.49 0.00
PM2.5 Total
Bio- CO2
3.3 Site Preparation - 2011
Unmitigated Construction On-Site
ROG NOx CO SO2 Fugitive PM10
CO2e
Category tons/yr MT/yr
NBio- CO2 Total CO2 CH4 N2OFugitive PM2.5
Exhaust PM2.5
Fugitive Dust 0.27 0.00 0.27 0.15 0.00 0.15 0.00 0.00 0.00 0.00 0.00 0.00
Off-Road 0.16 1.35 0.76 0.00 0.07 0.07 0.07 0.07 0.00 108.80 108.80 0.01 0.00 109.08
Total 0.16 1.35 0.76 108.80 0.01 0.000.15 0.07 0.22 0.00
SO2 Fugitive PM10
Exhaust PM10
108.800.00 0.27 0.07 0.34
Fugitive PM2.5
Exhaust PM2.5
PM2.5 Total
109.08
Unmitigated Construction Off-Site
ROG NOx CO N2O CO2e
Category tons/yr MT/yr
Bio- CO2 NBio- CO2 Total CO2 CH4PM10 Total
Hauling 0.00 0.00 0.00 0.00 0.00 0.00 0.00 0.00 0.00 0.00 0.00 0.00 0.00 0.00 0.00 0.00
Vendor 0.00 0.00 0.00 0.00 0.00 0.00 0.00 0.00 0.00 0.00 0.00 0.00 0.00 0.00 0.00 0.00
6 of 28

Worker 0.00 0.00 0.02 0.00 0.00 0.00 0.00 0.00 0.00 0.00 0.00 2.51 2.51 0.00 0.00 2.52
Total 0.00 0.00 0.02 0.00 0.00 0.00 0.00 0.00 0.00 2.520.00 0.00 0.00 2.51
Exhaust PM10
PM10 Total
2.51 0.00
PM2.5 Total
Bio- CO2
Mitigated Construction On-Site
ROG NOx CO SO2 Fugitive PM10
CO2e
Category tons/yr MT/yr
NBio- CO2 Total CO2 CH4 N2OFugitive PM2.5
Exhaust PM2.5
Fugitive Dust 0.27 0.00 0.27 0.15 0.00 0.15 0.00 0.00 0.00 0.00 0.00 0.00
Off-Road 0.16 1.35 0.76 0.00 0.07 0.07 0.07 0.07 0.00 108.80 108.80 0.01 0.00 109.08
Total 0.16 1.35 0.76 108.80 0.01 0.000.15 0.07 0.22 0.00
SO2 Fugitive PM10
Exhaust PM10
108.800.00 0.27 0.07 0.34
Fugitive PM2.5
Exhaust PM2.5
PM2.5 Total
109.08
Mitigated Construction Off-Site
ROG NOx CO N2O CO2e
Category tons/yr MT/yr
Bio- CO2 NBio- CO2 Total CO2 CH4PM10 Total
Hauling 0.00 0.00 0.00 0.00 0.00 0.00 0.00 0.00 0.00 0.00 0.00 0.00 0.00 0.00 0.00 0.00
Vendor 0.00 0.00 0.00 0.00 0.00 0.00 0.00 0.00 0.00 0.00 0.00 0.00 0.00 0.00 0.00 0.00
Worker 0.00 0.00 0.02 0.00 0.00 0.00 0.00 0.00 0.00 0.00 0.00 2.51 2.51 0.00 0.00 2.52
Total 0.00 0.00 0.02 0.00 0.00 0.00 0.00 0.00 0.00 2.520.00 0.00 0.00 2.51
Exhaust PM10
PM10 Total
2.51 0.00
PM2.5 Total
Bio- CO2
3.4 Grading - 2011
Unmitigated Construction On-Site
ROG NOx CO SO2 Fugitive PM10
CO2eNBio- CO2 Total CO2 CH4 N2OFugitive PM2.5
Exhaust PM2.5
7 of 28

Category tons/yr MT/yr
Fugitive Dust 0.33 0.00 0.33 0.13 0.00 0.13 0.00 0.00 0.00 0.00 0.00 0.00
Off-Road 0.49 4.15 2.16 0.00 0.20 0.20 0.20 0.20 0.00 369.24 369.24 0.04 0.00 370.08
Total 0.49 4.15 2.16 369.24 0.04 0.000.13 0.20 0.33 0.00
SO2 Fugitive PM10
Exhaust PM10
369.240.00 0.33 0.20 0.53
Fugitive PM2.5
Exhaust PM2.5
PM2.5 Total
370.08
Unmitigated Construction Off-Site
ROG NOx CO N2O CO2e
Category tons/yr MT/yr
Bio- CO2 NBio- CO2 Total CO2 CH4PM10 Total
Hauling 0.00 0.00 0.00 0.00 0.00 0.00 0.00 0.00 0.00 0.00 0.00 0.00 0.00 0.00 0.00 0.00
Vendor 0.00 0.00 0.00 0.00 0.00 0.00 0.00 0.00 0.00 0.00 0.00 0.00 0.00 0.00 0.00 0.00
Worker 0.01 0.01 0.06 0.00 0.01 0.00 0.01 0.00 0.00 0.00 0.00 6.98 6.98 0.00 0.00 6.99
Total 0.01 0.01 0.06 0.00 0.01 0.00 0.01 0.00 0.00 6.990.00 0.00 0.00 6.98
Exhaust PM10
PM10 Total
6.98 0.00
PM2.5 Total
Bio- CO2
Mitigated Construction On-Site
ROG NOx CO SO2 Fugitive PM10
CO2e
Category tons/yr MT/yr
NBio- CO2 Total CO2 CH4 N2OFugitive PM2.5
Exhaust PM2.5
Fugitive Dust 0.33 0.00 0.33 0.13 0.00 0.13 0.00 0.00 0.00 0.00 0.00 0.00
Off-Road 0.49 4.15 2.16 0.00 0.20 0.20 0.20 0.20 0.00 369.24 369.24 0.04 0.00 370.08
Total 0.49 4.15 2.16 369.24 0.04 0.000.13 0.20 0.33 0.00 369.240.00 0.33 0.20 0.53 370.08
Mitigated Construction Off-Site
8 of 28
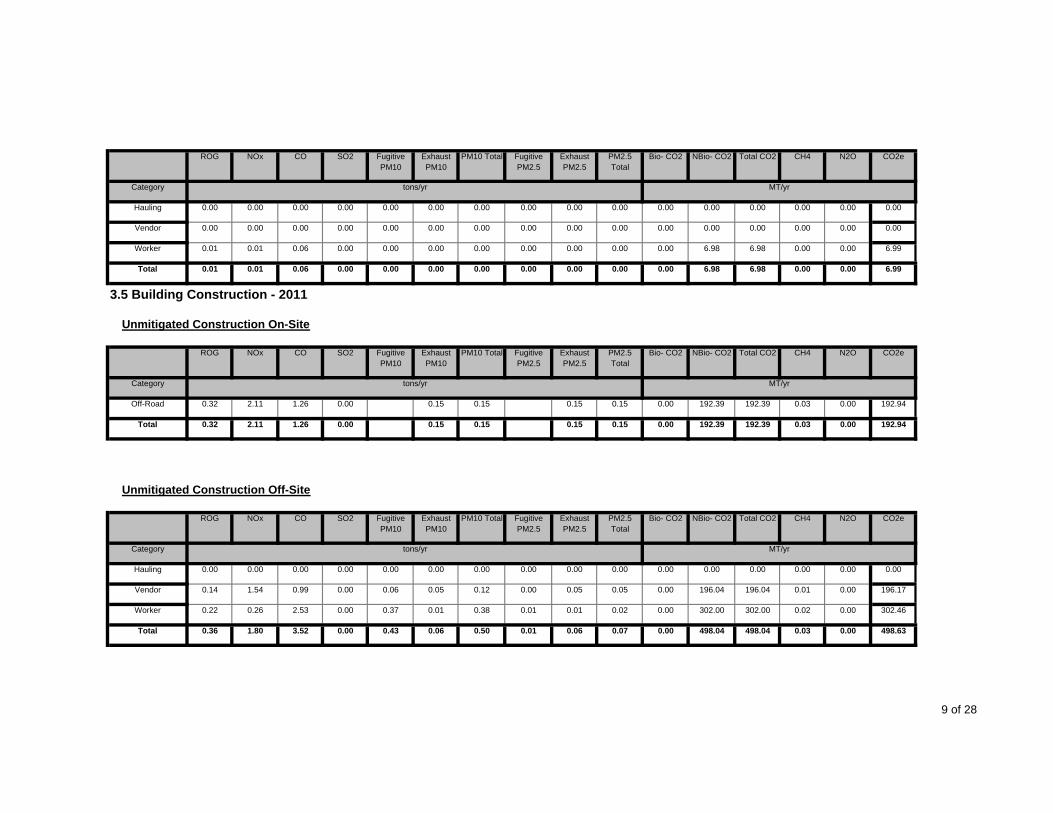
SO2 Fugitive PM10
Exhaust PM10
Fugitive PM2.5
Exhaust PM2.5
PM2.5 Total
ROG NOx CO N2O CO2e
Category tons/yr MT/yr
Bio- CO2 NBio- CO2 Total CO2 CH4PM10 Total
Hauling 0.00 0.00 0.00 0.00 0.00 0.00 0.00 0.00 0.00 0.00 0.00 0.00 0.00 0.00 0.00 0.00
Vendor 0.00 0.00 0.00 0.00 0.00 0.00 0.00 0.00 0.00 0.00 0.00 0.00 0.00 0.00 0.00 0.00
Worker 0.01 0.01 0.06 0.00 0.00 0.00 0.00 0.00 0.00 0.00 0.00 6.98 6.98 0.00 0.00 6.99
Total 0.01 0.01 0.06 0.00 0.00 0.00 0.00 0.00 0.00 6.990.00 0.00 0.00 6.98
Exhaust PM10
PM10 Total
6.98 0.00
PM2.5 Total
Bio- CO2
3.5 Building Construction - 2011
Unmitigated Construction On-Site
ROG NOx CO SO2 Fugitive PM10
CO2e
Category tons/yr MT/yr
NBio- CO2 Total CO2 CH4 N2OFugitive PM2.5
Exhaust PM2.5
Off-Road 0.32 2.11 1.26 0.00 0.15 0.15 0.15 0.15 0.00 192.39 192.39 0.03 0.00 192.94
Total 0.32 2.11 1.26 0.00 0.15 0.15 0.00 192.940.15 0.15 0.00 192.39
Exhaust PM10
PM10 Total
192.39 0.03
PM2.5 Total
Bio- CO2
Unmitigated Construction Off-Site
ROG NOx CO SO2 Fugitive PM10
CO2e
Category tons/yr MT/yr
NBio- CO2 Total CO2 CH4 N2OFugitive PM2.5
Exhaust PM2.5
Hauling 0.00 0.00 0.00 0.00 0.00 0.00 0.00 0.00 0.00 0.00 0.00 0.00 0.00 0.00 0.00 0.00
Vendor 0.14 1.54 0.99 0.00 0.06 0.05 0.12 0.00 0.05 0.05 0.00 196.04 196.04 0.01 0.00 196.17
Worker 0.22 0.26 2.53 0.00 0.37 0.01 0.38 0.01 0.01 0.02 0.00 302.00 302.00 0.02 0.00 302.46
Total 0.36 1.80 3.52 0.00 0.43 0.06 0.50 0.01 0.00 498.630.06 0.07 0.00 498.04 498.04 0.03
9 of 28

Exhaust PM10
PM10 Total PM2.5 Total
Bio- CO2
Mitigated Construction On-Site
ROG NOx CO SO2 Fugitive PM10
CO2e
Category tons/yr MT/yr
NBio- CO2 Total CO2 CH4 N2OFugitive PM2.5
Exhaust PM2.5
Off-Road 0.32 2.11 1.26 0.00 0.15 0.15 0.15 0.15 0.00 192.39 192.39 0.03 0.00 192.94
Total 0.32 2.11 1.26 0.00 0.15 0.15 0.00 192.940.15 0.15 0.00 192.39
Exhaust PM10
PM10 Total
192.39 0.03
PM2.5 Total
Bio- CO2
Mitigated Construction Off-Site
ROG NOx CO SO2 Fugitive PM10
CO2e
Category tons/yr MT/yr
NBio- CO2 Total CO2 CH4 N2OFugitive PM2.5
Exhaust PM2.5
Hauling 0.00 0.00 0.00 0.00 0.00 0.00 0.00 0.00 0.00 0.00 0.00 0.00 0.00 0.00 0.00 0.00
Vendor 0.14 1.54 0.99 0.00 0.01 0.05 0.06 0.00 0.05 0.05 0.00 196.04 196.04 0.01 0.00 196.17
Worker 0.22 0.26 2.53 0.00 0.02 0.01 0.03 0.01 0.01 0.02 0.00 302.00 302.00 0.02 0.00 302.46
Total 0.36 1.80 3.52 0.00 0.03 0.06 0.09 0.01 0.00 498.630.06 0.07 0.00 498.04
Exhaust PM10
PM10 Total
498.04 0.03
PM2.5 Total
Bio- CO2
3.5 Building Construction - 2012
Unmitigated Construction On-Site
ROG NOx CO SO2 Fugitive PM10
CO2e
Category tons/yr MT/yr
NBio- CO2 Total CO2 CH4 N2OFugitive PM2.5
Exhaust PM2.5
Off-Road 0.73 4.87 3.10 0.01 0.33 0.33 0.33 0.33 0.00 478.23 478.23 0.06 0.00 479.48
10 of 28

Total 0.73 4.87 3.10 0.01 0.33 0.33 0.00 479.480.33 0.33 0.00 478.23
Exhaust PM10
PM10 Total
478.23 0.06
PM2.5 Total
Bio- CO2
Unmitigated Construction Off-Site
ROG NOx CO SO2 Fugitive PM10
CO2e
Category tons/yr MT/yr
NBio- CO2 Total CO2 CH4 N2OFugitive PM2.5
Exhaust PM2.5
Hauling 0.00 0.00 0.00 0.00 0.00 0.00 0.00 0.00 0.00 0.00 0.00 0.00 0.00 0.00 0.00 0.00
Vendor 0.32 3.55 2.27 0.01 0.16 0.12 0.28 0.00 0.11 0.12 0.00 488.13 488.13 0.01 0.00 488.44
Worker 0.51 0.59 5.75 0.01 0.92 0.04 0.96 0.01 0.03 0.05 0.00 734.61 734.61 0.05 0.00 735.67
Total 0.83 4.14 8.02 0.02 1.08 0.16 1.24 0.01 0.00 1,224.110.14 0.17 0.00 1,222.74
Exhaust PM10
PM10 Total
1,222.74 0.06
PM2.5 Total
Bio- CO2
Mitigated Construction On-Site
ROG NOx CO SO2 Fugitive PM10
CO2e
Category tons/yr MT/yr
NBio- CO2 Total CO2 CH4 N2OFugitive PM2.5
Exhaust PM2.5
Off-Road 0.73 4.87 3.10 0.01 0.33 0.33 0.33 0.33 0.00 478.23 478.23 0.06 0.00 479.48
Total 0.73 4.87 3.10 0.01 0.33 0.33 0.00 479.480.33 0.33 0.00 478.23
Exhaust PM10
PM10 Total
478.23 0.06
PM2.5 Total
Bio- CO2
Mitigated Construction Off-Site
ROG NOx CO SO2 Fugitive PM10
CO2e
Category tons/yr MT/yr
NBio- CO2 Total CO2 CH4 N2OFugitive PM2.5
Exhaust PM2.5
11 of 28

Hauling 0.00 0.00 0.00 0.00 0.00 0.00 0.00 0.00 0.00 0.00 0.00 0.00 0.00 0.00 0.00 0.00
Vendor 0.32 3.55 2.27 0.01 0.01 0.12 0.14 0.00 0.11 0.12 0.00 488.13 488.13 0.01 0.00 488.44
Worker 0.51 0.59 5.75 0.01 0.04 0.04 0.08 0.01 0.03 0.05 0.00 734.61 734.61 0.05 0.00 735.67
Total 0.83 4.14 8.02 0.02 0.05 0.16 0.22 0.01 0.00 1,224.110.14 0.17 0.00 1,222.74
Exhaust PM10
PM10 Total
1,222.74 0.06
PM2.5 Total
Bio- CO2
3.5 Building Construction - 2013
Unmitigated Construction On-Site
ROG NOx CO SO2 Fugitive PM10
CO2e
Category tons/yr MT/yr
NBio- CO2 Total CO2 CH4 N2OFugitive PM2.5
Exhaust PM2.5
Off-Road 0.67 4.52 3.06 0.01 0.30 0.30 0.30 0.30 0.00 478.23 478.23 0.05 0.00 479.38
Total 0.67 4.52 3.06 0.01 0.30 0.30 0.00 479.380.30 0.30 0.00 478.23
Exhaust PM10
PM10 Total
478.23 0.05
PM2.5 Total
Bio- CO2
Unmitigated Construction Off-Site
ROG NOx CO SO2 Fugitive PM10
CO2e
Category tons/yr MT/yr
NBio- CO2 Total CO2 CH4 N2OFugitive PM2.5
Exhaust PM2.5
Hauling 0.00 0.00 0.00 0.00 0.00 0.00 0.00 0.00 0.00 0.00 0.00 0.00 0.00 0.00 0.00 0.00
Vendor 0.30 3.28 2.11 0.01 0.16 0.11 0.27 0.00 0.10 0.11 0.00 488.92 488.92 0.01 0.00 489.21
Worker 0.47 0.54 5.28 0.01 0.92 0.04 0.96 0.01 0.03 0.05 0.00 719.08 719.08 0.05 0.00 720.06
Total 0.77 3.82 7.39 0.02 1.08 0.15 1.23 0.01 0.00 1,209.270.13 0.16 0.00 1,208.00 1,208.00 0.06
Mitigated Construction On-Site
12 of 28

Exhaust PM10
PM10 Total PM2.5 Total
Bio- CO2ROG NOx CO SO2 Fugitive PM10
CO2e
Category tons/yr MT/yr
NBio- CO2 Total CO2 CH4 N2OFugitive PM2.5
Exhaust PM2.5
Off-Road 0.67 4.52 3.06 0.01 0.30 0.30 0.30 0.30 0.00 478.23 478.23 0.05 0.00 479.38
Total 0.67 4.52 3.06 0.01 0.30 0.30 0.00 479.380.30 0.30 0.00 478.23
Exhaust PM10
PM10 Total
478.23 0.05
PM2.5 Total
Bio- CO2
Mitigated Construction Off-Site
ROG NOx CO SO2 Fugitive PM10
CO2e
Category tons/yr MT/yr
NBio- CO2 Total CO2 CH4 N2OFugitive PM2.5
Exhaust PM2.5
Hauling 0.00 0.00 0.00 0.00 0.00 0.00 0.00 0.00 0.00 0.00 0.00 0.00 0.00 0.00 0.00 0.00
Vendor 0.30 3.28 2.11 0.01 0.01 0.11 0.13 0.00 0.10 0.11 0.00 488.92 488.92 0.01 0.00 489.21
Worker 0.47 0.54 5.28 0.01 0.04 0.04 0.08 0.01 0.03 0.05 0.00 719.08 719.08 0.05 0.00 720.06
Total 0.77 3.82 7.39 0.02 0.05 0.15 0.21 0.01 0.00 1,209.270.13 0.16 0.00 1,208.00
Exhaust PM10
PM10 Total
1,208.00 0.06
PM2.5 Total
Bio- CO2
3.5 Building Construction - 2014
Unmitigated Construction On-Site
ROG NOx CO SO2 Fugitive PM10
CO2e
Category tons/yr MT/yr
NBio- CO2 Total CO2 CH4 N2OFugitive PM2.5
Exhaust PM2.5
Off-Road 0.27 1.81 1.31 0.00 0.11 0.11 0.11 0.11 0.00 207.05 207.05 0.02 0.00 207.50
Total 0.27 1.81 1.31 0.00 0.11 0.11 0.00 207.500.11 0.11 0.00 207.05 207.05 0.02
13 of 28
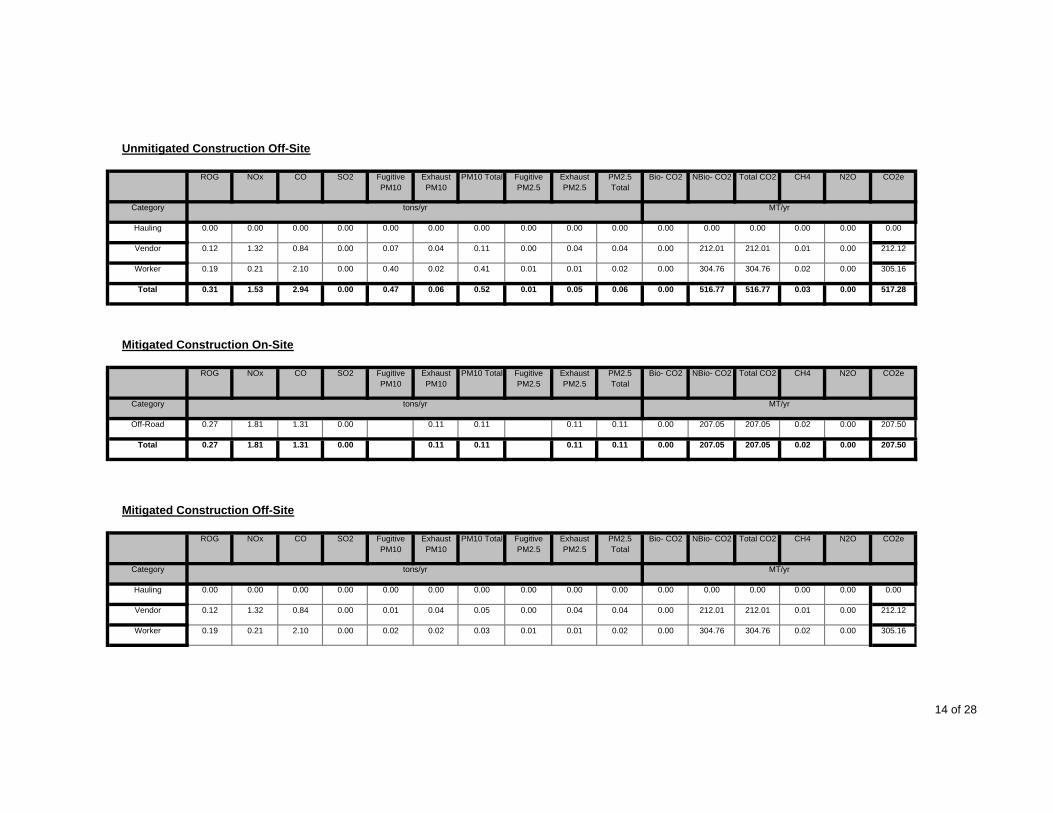
Exhaust PM10
PM10 Total PM2.5 Total
Bio- CO2
Unmitigated Construction Off-Site
ROG NOx CO SO2 Fugitive PM10
CO2e
Category tons/yr MT/yr
NBio- CO2 Total CO2 CH4 N2OFugitive PM2.5
Exhaust PM2.5
Hauling 0.00 0.00 0.00 0.00 0.00 0.00 0.00 0.00 0.00 0.00 0.00 0.00 0.00 0.00 0.00 0.00
Vendor 0.12 1.32 0.84 0.00 0.07 0.04 0.11 0.00 0.04 0.04 0.00 212.01 212.01 0.01 0.00 212.12
Worker 0.19 0.21 2.10 0.00 0.40 0.02 0.41 0.01 0.01 0.02 0.00 304.76 304.76 0.02 0.00 305.16
Total 0.31 1.53 2.94 0.00 0.47 0.06 0.52 0.01 0.00 517.280.05 0.06 0.00 516.77
Exhaust PM10
PM10 Total
516.77 0.03
PM2.5 Total
Bio- CO2
Mitigated Construction On-Site
ROG NOx CO SO2 Fugitive PM10
CO2e
Category tons/yr MT/yr
NBio- CO2 Total CO2 CH4 N2OFugitive PM2.5
Exhaust PM2.5
Off-Road 0.27 1.81 1.31 0.00 0.11 0.11 0.11 0.11 0.00 207.05 207.05 0.02 0.00 207.50
Total 0.27 1.81 1.31 0.00 0.11 0.11 0.00 207.500.11 0.11 0.00 207.05
Exhaust PM10
PM10 Total
207.05 0.02
PM2.5 Total
Bio- CO2
Mitigated Construction Off-Site
ROG NOx CO SO2 Fugitive PM10
CO2e
Category tons/yr MT/yr
NBio- CO2 Total CO2 CH4 N2OFugitive PM2.5
Exhaust PM2.5
Hauling 0.00 0.00 0.00 0.00 0.00 0.00 0.00 0.00 0.00 0.00 0.00 0.00 0.00 0.00 0.00 0.00
Vendor 0.12 1.32 0.84 0.00 0.01 0.04 0.05 0.00 0.04 0.04 0.00 212.01 212.01 0.01 0.00 212.12
Worker 0.19 0.21 2.10 0.00 0.02 0.02 0.03 0.01 0.01 0.02 0.00 304.76 304.76 0.02 0.00 305.16
14 of 28
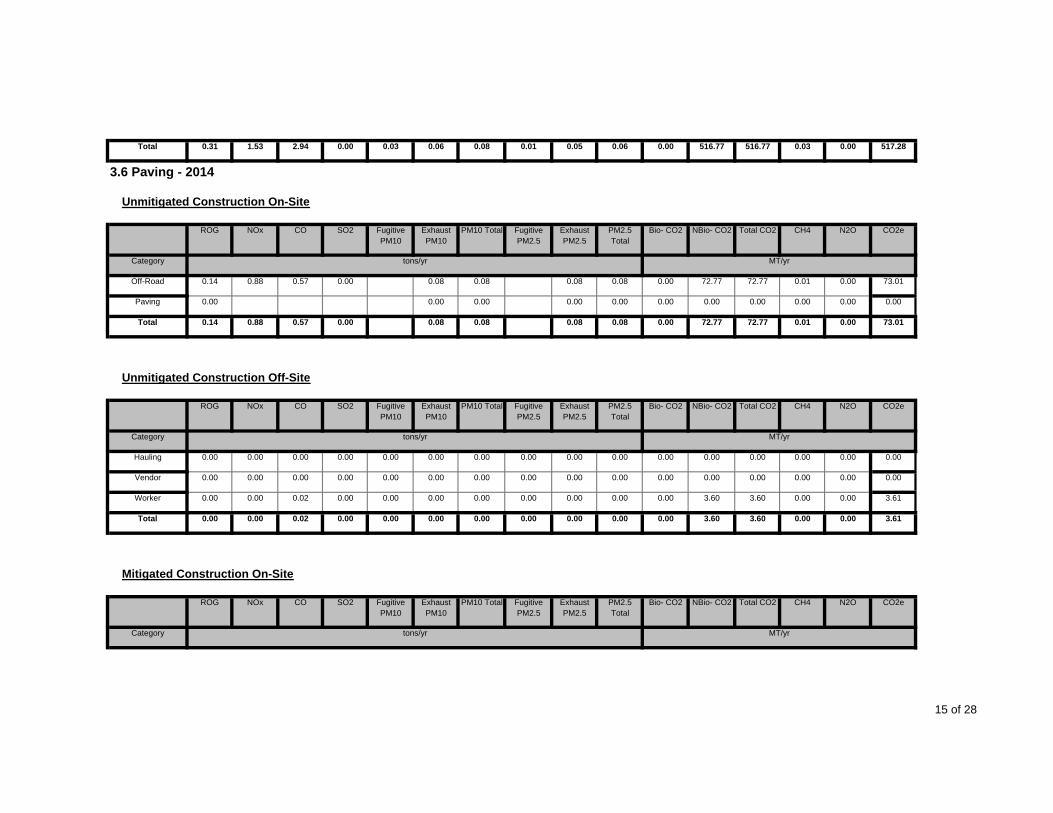
Total 0.31 1.53 2.94 0.00 0.03 0.06 0.08 0.01 0.00 517.280.05 0.06 0.00 516.77
Exhaust PM10
PM10 Total
516.77 0.03
PM2.5 Total
Bio- CO2
3.6 Paving - 2014
Unmitigated Construction On-Site
ROG NOx CO SO2 Fugitive PM10
CO2e
Category tons/yr MT/yr
NBio- CO2 Total CO2 CH4 N2OFugitive PM2.5
Exhaust PM2.5
Off-Road 0.14 0.88 0.57 0.00 0.08 0.08 0.08 0.08 0.00 72.77 72.77 0.01 0.00 73.01
Paving 0.00 0.00 0.00 0.00 0.00 0.00 0.00 0.00 0.00 0.00 0.00
Total 0.14 0.88 0.57 72.77 0.01 0.000.08 0.08 0.00
SO2 Fugitive PM10
Exhaust PM10
72.770.00 0.08 0.08
Fugitive PM2.5
Exhaust PM2.5
PM2.5 Total
73.01
Unmitigated Construction Off-Site
ROG NOx CO N2O CO2e
Category tons/yr MT/yr
Bio- CO2 NBio- CO2 Total CO2 CH4PM10 Total
Hauling 0.00 0.00 0.00 0.00 0.00 0.00 0.00 0.00 0.00 0.00 0.00 0.00 0.00 0.00 0.00 0.00
Vendor 0.00 0.00 0.00 0.00 0.00 0.00 0.00 0.00 0.00 0.00 0.00 0.00 0.00 0.00 0.00 0.00
Worker 0.00 0.00 0.02 0.00 0.00 0.00 0.00 0.00 0.00 0.00 0.00 3.60 3.60 0.00 0.00 3.61
Total 0.00 0.00 0.02 0.00 0.00 0.00 0.00 0.00 0.00 3.610.00 0.00 0.00 3.60
Exhaust PM10
PM10 Total
3.60 0.00
PM2.5 Total
Bio- CO2
Mitigated Construction On-Site
ROG NOx CO SO2 Fugitive PM10
CO2e
Category tons/yr MT/yr
NBio- CO2 Total CO2 CH4 N2OFugitive PM2.5
Exhaust PM2.5
15 of 28

Off-Road 0.14 0.88 0.57 0.00 0.08 0.08 0.08 0.08 0.00 72.77 72.77 0.01 0.00 73.01
Paving 0.00 0.00 0.00 0.00 0.00 0.00 0.00 0.00 0.00 0.00 0.00
Total 0.14 0.88 0.57 72.77 0.01 0.000.08 0.08 0.00
SO2 Fugitive PM10
Exhaust PM10
72.770.00 0.08 0.08
Fugitive PM2.5
Exhaust PM2.5
PM2.5 Total
73.01
Mitigated Construction Off-Site
ROG NOx CO N2O CO2e
Category tons/yr MT/yr
Bio- CO2 NBio- CO2 Total CO2 CH4PM10 Total
Hauling 0.00 0.00 0.00 0.00 0.00 0.00 0.00 0.00 0.00 0.00 0.00 0.00 0.00 0.00 0.00 0.00
Vendor 0.00 0.00 0.00 0.00 0.00 0.00 0.00 0.00 0.00 0.00 0.00 0.00 0.00 0.00 0.00 0.00
Worker 0.00 0.00 0.02 0.00 0.00 0.00 0.00 0.00 0.00 0.00 0.00 3.60 3.60 0.00 0.00 3.61
Total 0.00 0.00 0.02 0.00 0.00 0.00 0.00 0.00 0.00 3.610.00 0.00 0.00 3.60
Exhaust PM10
PM10 Total
3.60 0.00
PM2.5 Total
Bio- CO2
3.7 Architectural Coating - 2014
Unmitigated Construction On-Site
ROG NOx CO SO2 Fugitive PM10
CO2e
Category tons/yr MT/yr
NBio- CO2 Total CO2 CH4 N2OFugitive PM2.5
Exhaust PM2.5
Archit. Coating 16.75 0.00 0.00 0.00 0.00 0.00 0.00 0.00 0.00 0.00 0.00
Off-Road 0.01 0.08 0.05 0.00 0.01 0.01 0.01 0.01 0.00 7.01 7.01 0.00 0.00 7.03
Total 16.76 0.08 0.05 7.01 0.00 0.000.01 0.01 0.00 7.010.00 0.01 0.01 7.03
Unmitigated Construction Off-Site
16 of 28

SO2 Fugitive PM10
Exhaust PM10
Fugitive PM2.5
Exhaust PM2.5
PM2.5 Total
ROG NOx CO N2O CO2e
Category tons/yr MT/yr
Bio- CO2 NBio- CO2 Total CO2 CH4PM10 Total
Hauling 0.00 0.00 0.00 0.00 0.00 0.00 0.00 0.00 0.00 0.00 0.00 0.00 0.00 0.00 0.00 0.00
Vendor 0.00 0.00 0.00 0.00 0.00 0.00 0.00 0.00 0.00 0.00 0.00 0.00 0.00 0.00 0.00 0.00
Worker 0.02 0.02 0.20 0.00 0.04 0.00 0.04 0.00 0.00 0.00 0.00 29.76 29.76 0.00 0.00 29.80
Total 0.02 0.02 0.20 0.00 0.04 0.00 0.04 0.00 0.00 29.800.00 0.00 0.00 29.76
Exhaust PM10
PM10 Total
29.76 0.00
PM2.5 Total
Bio- CO2
Mitigated Construction On-Site
ROG NOx CO SO2 Fugitive PM10
CO2e
Category tons/yr MT/yr
NBio- CO2 Total CO2 CH4 N2OFugitive PM2.5
Exhaust PM2.5
Archit. Coating 16.75 0.00 0.00 0.00 0.00 0.00 0.00 0.00 0.00 0.00 0.00
Off-Road 0.01 0.08 0.05 0.00 0.01 0.01 0.01 0.01 0.00 7.01 7.01 0.00 0.00 7.03
Total 16.76 0.08 0.05 7.01 0.00 0.000.01 0.01 0.00
SO2 Fugitive PM10
Exhaust PM10
7.010.00 0.01 0.01
Fugitive PM2.5
Exhaust PM2.5
PM2.5 Total
7.03
Mitigated Construction Off-Site
ROG NOx CO N2O CO2e
Category tons/yr MT/yr
Bio- CO2 NBio- CO2 Total CO2 CH4PM10 Total
Hauling 0.00 0.00 0.00 0.00 0.00 0.00 0.00 0.00 0.00 0.00 0.00 0.00 0.00 0.00 0.00 0.00
Vendor 0.00 0.00 0.00 0.00 0.00 0.00 0.00 0.00 0.00 0.00 0.00 0.00 0.00 0.00 0.00 0.00
Worker 0.02 0.02 0.20 0.00 0.00 0.00 0.00 0.00 0.00 0.00 0.00 29.76 29.76 0.00 0.00 29.80
Total 0.02 0.02 0.20 0.00 0.00 0.00 0.00 0.00 0.00 0.00 0.00 29.76 29.76 0.00 0.00 29.80
17 of 28
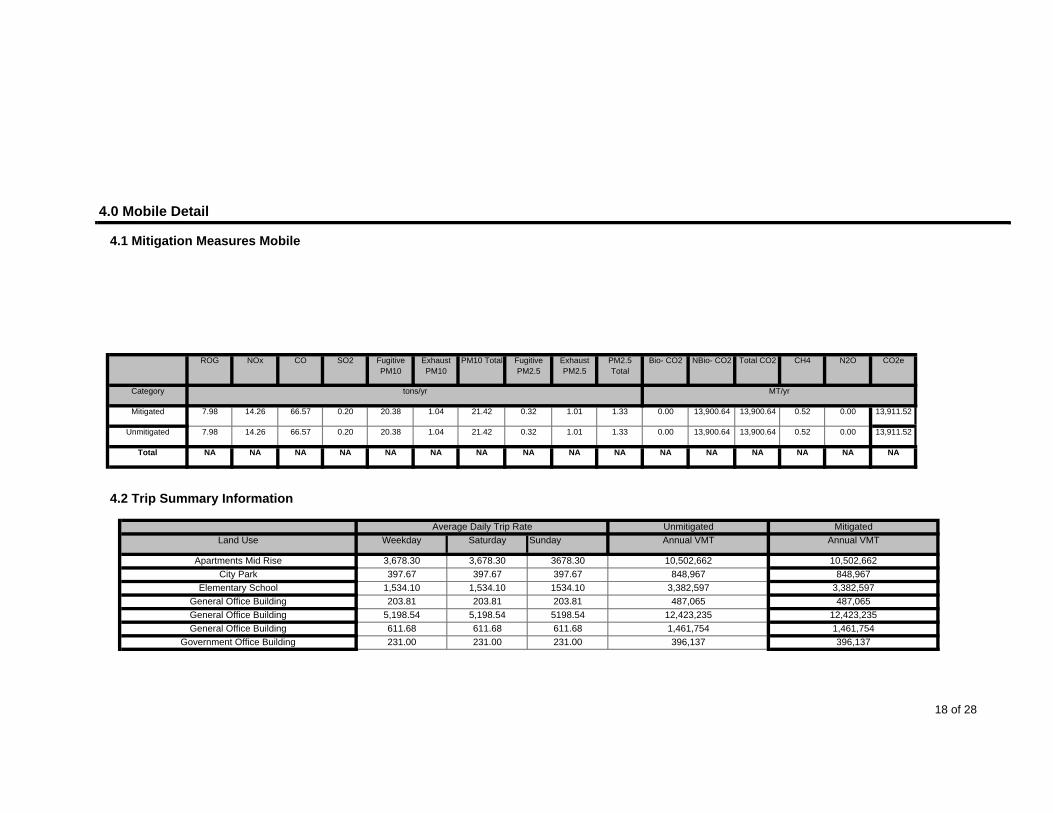
SO2 Fugitive PM10
Exhaust PM10
4.0 Mobile Detail
4.1 Mitigation Measures Mobile
Fugitive PM2.5
Exhaust PM2.5
PM2.5 Total
ROG NOx CO N2O CO2e
Category tons/yr MT/yr
Bio- CO2 NBio- CO2 Total CO2 CH4PM10 Total
Mitigated 7.98 14.26 66.57 0.20 20.38 1.04 21.42 0.32 1.01 1.33 0.00 13,900.64 13,900.64 0.52 0.00 13,911.52
Unmitigated 7.98 14.26 66.57 0.20 20.38 1.04 21.42 0.32 1.01 1.33 0.00 13,900.64 13,900.64 0.52 0.00 13,911.52
Total NA NA NA NA NA NA NA NA NA NA NA NA
4.2 Trip Summary Information
Average Daily Trip Rate Unmitigated Mitigated
NA NA NA NA
Land Use Weekday Saturday Sunday
Apartments Mid Rise 3,678.30 3,678.30 3678.30397.67 397.67
Annual VMT Annual VMT
10,502,662 10,502,662848,967 848,967
Elementary School 1,534.10 1,534.10 1534.10 3,382,597 3,382,597City Park 397.67
General Office Building 203.81 203.81 203.81General Office Building 5,198.54 5,198.54 5198.54
611.68 611.68
487,065 487,06512,423,235 12,423,2351,461,754 1,461,754
Government Office Building 231.00 231.00 231.00 396,137 396,137General Office Building 611.68
18 of 28

Junior College (2Yr) 160.95 160.95 160.95Medical Office Building 3,804.72 3,804.72 3804.72
492.80 492.80
408,738 408,7387,446,788 7,446,7881,407,093 1,407,093
Total 16,313.57 16,313.57 16,313.57 38,765,038 38,765,038Single Family Housing 492.80
4.3 Trip Type Information
Miles Trip %
Land Use H-W or C-W H-S or C-C H-O or C-NW H-W or C-W H-S or C-C H-O or C-NW
Apartments Mid Rise 10.80 7.30 7.50 41.60 18.80 39.60
City Park 9.50 7.30 7.30 33.00 48.00 19.00
Elementary School 9.50 7.30 7.30 65.00 30.00 5.00
General Office Building 9.50 7.30 7.30 33.00 48.00 19.00
General Office Building 9.50 7.30 7.30 33.00 48.00 19.00
General Office Building 9.50 7.30 7.30 33.00 48.00 19.00
Government Office Building 9.50 7.30 7.30 33.00 62.00 5.00
Junior College (2Yr) 9.50 7.30 7.30 6.40 88.60 5.00
Medical Office Building 9.50 7.30 7.30 29.60 51.40 19.00
41.60 18.80 39.60
5.0 Energy Detail
Single Family Housing 10.80 7.30 7.50
5.1 Mitigation Measures Energy
19 of 28

ROG NOx CO SO2 Fugitive PM10
Exhaust PM10
PM10 Total Fugitive PM2.5
Exhaust PM2.5
PM2.5 Total
Bio- CO2 NBio- CO2 Total CO2 CH4 N2O CO2e
Category tons/yr MT/yr
Electricity Mitigated 0.00 0.00 0.00 0.00 0.00 3,494.13 3,494.13 0.13 0.05 3,512.12
Electricity Unmitigated
0.00 0.00 0.00 0.00 0.00 3,494.13 3,494.13 0.13 0.05 3,512.12
NaturalGas Mitigated 0.11 0.96 0.64 0.01 0.00 0.08 0.00 0.08 0.00 1,077.39 1,077.39 0.02 0.02 1,083.95
NaturalGas Unmitigated
0.11 0.96 0.64 0.01 0.00 0.08 0.00 0.08 0.00 1,077.39 1,077.39 0.02 0.02 1,083.95
Total NA NA NA NA NA NA NA NA NA NA NA NA NA NA NA NA
5.2 Energy by Land Use - NaturalGas
Unmitigated
NaturalGas Use ROG NOx CO SO2 Fugitive PM10
Exhaust PM10
PM10 Total Fugitive PM2.5
Exhaust PM2.5
PM2.5 Total N2O CO2e
Land Use kBTU tons/yr MT/yr
Bio- CO2 NBio- CO2 Total CO2 CH4
Apartments Mid Rise 6.74374e+006 0.04 0.31 0.13 0.00 0.00 0.03 0.00 0.03 0.00 359.87 359.87 0.01 0.01 362.06
City Park 0 0.00 0.00 0.00 0.00 0.00 0.00 0.00 0.00 0.00 0.00 0.00 0.00 0.00 0.00
Elementary School 304276 0.00 0.01 0.01 0.00 0.00 0.00 0.00 0.00 0.00 16.24 16.24 0.00 0.00 16.34
General Office Building
205208 0.00 0.01 0.01 0.00 0.00 0.00 0.00 0.00 0.00 10.95 10.95 0.00 0.00 11.02
General Office Building
5.23409e+006 0.03 0.26 0.22 0.00 0.00 0.02 0.00 0.02 0.00 279.31 279.31 0.01 0.01 281.01
General Office Building
615858 0.00 0.03 0.03 0.00 0.00 0.00 0.00 0.00 0.00 32.86 32.86 0.00 0.00 33.06
Government Office Building
2.5916e+006 0.01 0.13 0.11 0.00 0.00 0.01 0.00 0.01 0.00 138.30 138.30 0.00 0.00 139.14
Junior College (2Yr) 358875 0.00 0.02 0.01 0.00 0.00 0.00 0.00 0.00 0.00 19.15 19.15 0.00 0.00 19.27
Medical Office Building
1.79998e+006 0.01 0.09 0.07 0.00 0.00 0.01 0.00 0.01 0.00 96.05 96.05 0.00 0.00 96.64
Single Family Housing
2.33599e+006 0.01 0.11 0.05 0.00 0.00 0.01 0.00 0.01
0.64 0.00 0.00Total 0.10 0.97 0.00 0.08
0.00 125.420.00 124.66 124.66 0.00
0.02 1,083.960.00 1,077.39 1,077.39 0.020.08
20 of 28

Mitigated
NaturalGas Use ROG NOx CO SO2 Fugitive PM10
Exhaust PM10
PM10 Total Fugitive PM2.5
Exhaust PM2.5
PM2.5 Total N2O CO2e
Land Use kBTU tons/yr MT/yr
Bio- CO2 NBio- CO2 Total CO2 CH4
Apartments Mid Rise 6.74374e+006 0.04 0.31 0.13 0.00 0.00 0.03 0.00 0.03 0.00 359.87 359.87 0.01 0.01 362.06
City Park 0 0.00 0.00 0.00 0.00 0.00 0.00 0.00 0.00 0.00 0.00 0.00 0.00 0.00 0.00
Elementary School 304276 0.00 0.01 0.01 0.00 0.00 0.00 0.00 0.00 0.00 16.24 16.24 0.00 0.00 16.34
General Office Building
205208 0.00 0.01 0.01 0.00 0.00 0.00 0.00 0.00 0.00 10.95 10.95 0.00 0.00 11.02
General Office Building
5.23409e+006 0.03 0.26 0.22 0.00 0.00 0.02 0.00 0.02 0.00 279.31 279.31 0.01 0.01 281.01
General Office Building
615858 0.00 0.03 0.03 0.00 0.00 0.00 0.00 0.00 0.00 32.86 32.86 0.00 0.00 33.06
Government Office Building
2.5916e+006 0.01 0.13 0.11 0.00 0.00 0.01 0.00 0.01 0.00 138.30 138.30 0.00 0.00 139.14
Junior College (2Yr) 358875 0.00 0.02 0.01 0.00 0.00 0.00 0.00 0.00 0.00 19.15 19.15 0.00 0.00 19.27
Medical Office Building
1.79998e+006 0.01 0.09 0.07 0.00 0.00 0.01 0.00 0.01 0.00 96.05 96.05 0.00 0.00 96.64
Single Family Housing
2.33599e+006 0.01 0.11 0.05 0.00 0.00 0.01 0.00 0.01
0.64 0.00 0.00Total 0.10 0.97 0.00 0.08
0.00 125.420.00 124.66 124.66 0.00
0.02 1,083.96
5.3 Energy by Land Use - Electricity
Unmitigated
0.00 1,077.39 1,077.39 0.020.08
Electricity Use ROG NOx N2O CO2e
Land Use kWh tons/yr MT/yr
CO SO2 Total CO2 CH4
Apartments Mid Rise 2.1456e+006 759.89 0.03 0.01 763.80
City Park 0 0.00 0.00 0.00 0.00
21 of 28

Elementary School 280836 99.46 0.00 0.00 99.97
General Office Building
137095 48.55 0.00 0.00 48.80
General Office Building
3.4968e+006 1,238.43 0.05 0.02 1,244.80
General Office Building
411444 145.72 0.01 0.00 146.47
Government Office Building
1.7314e+006 613.19 0.02 0.01 616.35
Junior College (2Yr) 93699 33.18 0.00 0.00 33.36
Medical Office Building
1.20254e+006 425.89 0.02 0.01 428.08
Single Family Housing
366553 129.82 0.00 0.00 130.49
Total 3,494.13 0.13 0.05 3,512.12
Mitigated
Electricity Use ROG NOx N2O CO2e
Land Use kWh tons/yr MT/yr
CO SO2 Total CO2 CH4
Apartments Mid Rise 2.1456e+006 759.89 0.03 0.01 763.80
City Park 0 0.00 0.00 0.00 0.00
Elementary School 280836 99.46 0.00 0.00 99.97
General Office Building
137095 48.55 0.00 0.00 48.80
General Office Building
3.4968e+006 1,238.43 0.05 0.02 1,244.80
General Office Building
411444 145.72 0.01 0.00 146.47
Government Office Building
1.7314e+006 613.19 0.02 0.01 616.35
Junior College (2Yr) 93699 33.18 0.00 0.00 33.36
Medical Office Building
1.20254e+006 425.89 0.02 0.01 428.08
Single Family Housing
366553 129.82 0.00 0.00 130.49
22 of 28

Total 3,494.13 0.13 0.05 3,512.12
6.0 Area Detail
6.1 Mitigation Measures Area
ROG NOx CO PM2.5 Total
Bio- CO2SO2 Fugitive PM10
Exhaust PM10
PM10 Total CO2e
Category tons/yr MT/yr
NBio- CO2 Total CO2 CH4 N2OFugitive PM2.5
Exhaust PM2.5
Mitigated 47.92 0.62 55.87 0.02 0.00 7.22 0.00 7.22 680.72 864.53 1,545.25 0.65 0.06 1,578.68
Unmitigated 47.92 0.62 55.87 0.02 0.00 7.22 0.00 7.22 680.72 864.53 1,545.25 0.65 0.06 1,578.68
Total NA NA NA NA NA NANA NA NA NA
SO2 Fugitive PM10
Exhaust PM10
NANA NA NA NA
Fugitive PM2.5
Exhaust PM2.5
PM2.5 Total
NA
6.2 Area by SubCategory
Unmitigated
ROG NOx CO N2O CO2e
SubCategory tons/yr MT/yr
Bio- CO2 NBio- CO2 Total CO2 CH4PM10 Total
Architectural Coating 1.67 0.00 0.00 0.00 0.00 0.00 0.00 0.00 0.00 0.00 0.00
Consumer Products 4.69 0.00 0.00 0.00 0.00 0.00 0.00 0.00 0.00 0.00 0.00
Hearth 41.41 0.56 50.94 0.02 0.00 7.20 0.00 7.20 680.72 856.45 1,537.17 0.64 0.06 1,570.44
Landscaping 0.15 0.06 4.93 0.00 0.00 0.03 0.00 0.03 0.00 8.08 8.08 0.01 0.00 8.25
23 of 28

Total 47.92 0.62 55.87 1,545.25 0.65 0.060.00 7.23 680.72
SO2 Fugitive PM10
Exhaust PM10
864.530.02 0.00 7.23
Fugitive PM2.5
Exhaust PM2.5
PM2.5 Total
1,578.69
Mitigated
ROG NOx CO N2O CO2e
SubCategory tons/yr MT/yr
Bio- CO2 NBio- CO2 Total CO2 CH4PM10 Total
Architectural Coating 1.67 0.00 0.00 0.00 0.00 0.00 0.00 0.00 0.00 0.00 0.00
Consumer Products 4.69 0.00 0.00 0.00 0.00 0.00 0.00 0.00 0.00 0.00 0.00
Hearth 41.41 0.56 50.94 0.02 0.00 7.20 0.00 7.20 680.72 856.45 1,537.17 0.64 0.06 1,570.44
Landscaping 0.15 0.06 4.93 0.00 0.00 0.03 0.00 0.03 0.00 8.08 8.08 0.01 0.00 8.25
Total 47.92 0.62 55.87 7.23 680.720.02 0.00 7.23 1,578.69
7.0 Water Detail
7.1 Mitigation Measures Water
864.53 1,545.25 0.65 0.060.00
ROG NOx CO SO2 Total CO2 CH4 N2O CO2e
Category tons/yr MT/yr
Mitigated 897.70 3.75 0.10 1,008.94
Unmitigated 897.70 3.75 0.10 1,008.94
24 of 28

Total NA NA NA NA NA NA NA NA
7.2 Water by Land Use
Unmitigated
Indoor/Outdoor Use
ROG NOx CO SO2 Total CO2 CH4 N2O CO2e
Land Use Mgal tons/yr MT/yr
Apartments Mid Rise 39.2879 / 24.7684 279.07 1.21 0.03 314.91
City Park 0 / 10.8425 42.66 0.00 0.00 42.88
Elementary School 1.28242 / 3.29766 18.90 0.04 0.00 20.12
General Office Building
45.6794 / 27.997 321.32 1.41 0.04 362.98
Government Office Building
21.8526 / 13.3935 153.72 0.67 0.02 173.64
Junior College (2Yr) 0.426727 / 0.667444
4.60 0.01 0.00 5.00
Medical Office Building
9.58671 / 1.82604 51.50 0.29 0.01 60.16
Single Family Housing
3.64863 / 2.30022 25.92 0.11 0.00 29.25
Total 897.69 3.74 0.10 1,008.94
Mitigated
Indoor/Outdoor Use
ROG NOx N2O CO2e
Land Use Mgal tons/yr MT/yr
CO SO2 Total CO2 CH4
Apartments Mid Rise 39.2879 / 24.7684 279.07 1.21 0.03 314.91
City Park 0 / 10.8425 42.66 0.00 0.00 42.88
Elementary School 1.28242 / 3.29766 18.90 0.04 0.00 20.12
25 of 28

General Office Building
45.6794 / 27.997 321.32 1.41 0.04 362.98
Government Office Building
21.8526 / 13.3935 153.72 0.67 0.02 173.64
Junior College (2Yr) 0.426727 / 0.667444
4.60 0.01 0.00 5.00
Medical Office Building
9.58671 / 1.82604 51.50 0.29 0.01 60.16
Single Family Housing
3.64863 / 2.30022 25.92 0.11 0.00 29.25
Total 897.69 3.74 0.10 1,008.94
8.0 Waste Detail
NOx CO
8.1 Mitigation Measures Waste
Category/Year
CO2e
tons/yr MT/yr
SO2 Total CO2 CH4 N2OROG
Mitigated 328.45 19.41 0.00 736.08
Unmitigated 328.45 19.41 0.00 736.08
Total NA NA NA NA NA NA NA NA
8.2 Waste by Land Use
Unmitigated
Waste Disposed ROG NOx CO SO2 Total CO2 CH4 N2O CO2e
26 of 28

Land Use tons tons/yr MT/yr
Apartments Mid Rise 277.38 56.31 3.33 0.00 126.18
City Park 0.78 0.16 0.01 0.00 0.35
Elementary School 96.54 19.60 1.16 0.00 43.92
General Office Building
239.02 48.52 2.87 0.00 108.73
Government Office Building
102.3 20.77 1.23 0.00 46.54
Junior College (2Yr) 11.31 2.30 0.14 0.00 5.15
Medical Office Building
825.12 167.49 9.90 0.00 375.36
Single Family Housing
65.6 13.32 0.79 0.00 29.84
Total 328.47 19.43 0.00 736.07
Mitigated
Waste Disposed ROG NOx N2O CO2e
Land Use tons tons/yr MT/yr
CO SO2 Total CO2 CH4
Apartments Mid Rise 277.38 56.31 3.33 0.00 126.18
City Park 0.78 0.16 0.01 0.00 0.35
Elementary School 96.54 19.60 1.16 0.00 43.92
General Office Building
239.02 48.52 2.87 0.00 108.73
Government Office Building
102.3 20.77 1.23 0.00 46.54
Junior College (2Yr) 11.31 2.30 0.14 0.00 5.15
Medical Office Building
825.12 167.49 9.90 0.00 375.36
Single Family Housing
65.6 13.32 0.79 0.00 29.84
Total 328.47 19.43 0.00 736.07
27 of 28

9.0 Vegetation
28 of 28

CalEEMod Version: CalEEMod.2011.1.1 Date: 7/25/2012
Barrio Logan revised Alternative 2 (2030) - ChangeSan Diego County APCD Air District, Annual
1.0 Project Characteristics
1.1 Land Usage
Land Uses Size Metric
General Office Building 258.5 1000sqft
General Office Building 162.9 1000sqft
General Office Building 205.8 1000sqft
General Office Building 166.8 1000sqft
General Office Building 15.7 1000sqft
General Office Building 31.3 1000sqft
General Office Building 38.9 1000sqft
General Office Building 1105.2 1000sqft
Medical Office Building 36.3 1000sqft
Junior College (2Yr) 61.3 1000sqft
General Heavy Industry 3490.3 1000sqft
General Light Industry 79.5 1000sqft
Refrigerated Warehouse-No Rail 90.6 1000sqft
Fast Food Restaurant with Drive Thru 19.5 1000sqft
Apartments Low Rise 61 Dwelling Unit
1 of 60

Apartments Mid Rise 2978 Dwelling Unit
Strip Mall 175.1 1000sqft
1.2 Other Project CharacteristicsUtility Company San Diego Gas & ElectricUrbanization Urban Wind Speed (m/s)
Climate Zone 13 2.6
Precipitation Freq (Days)
1.3 User Entered Comments 40
Project Characteristics -
Land Use -
Water Mitigation -
2.0 Emissions Summary
2.1 Overall Construction
Unmitigated Construction
ROG NOx CO SO2 Fugitive PM10
Exhaust PM10
PM10 Total Fugitive PM2.5
Exhaust PM2.5
PM2.5 Total
Bio- CO2 NBio- CO2 Total CO2 CH4 N2O CO2e
Year tons/yr MT/yr
2011 1.29 10.40 6.12 0.01 0.02 0.53 0.56 0.00 0.53 0.53 0.00 903.69 903.69 0.11 0.00 905.90
2012 1.40 11.27 6.48 0.01 3.67 0.56 4.23 1.73 0.56 2.29 0.00 1,012.12 1,012.12 0.11 0.00 1,014.50
2013 1.56 12.73 7.07 0.01 2.05 0.60 2.65 0.84 0.60 1.44 0.00 1,308.22 1,308.22 0.13 0.00 1,310.88
2014 3.23 20.04 24.76 0.05 5.04 0.87 5.91 0.89 0.84 1.73 0.00 4,474.71 4,474.71 0.25 0.00 4,480.00
2015 5.72 31.18 50.62 0.11 8.01 1.32 9.33 0.14 1.23 1.38 0.00 9,632.15 9,632.15 0.44 0.00 9,641.29
2016 5.34 28.99 47.08 0.11 8.01 1.24 9.24 0.14 1.16 1.30 0.00 9,517.88 9,517.88 0.41 0.00 9,526.38
2 of 60

2017 4.98 26.96 43.70 0.11 7.98 1.16 9.14 0.14 1.08 1.22 0.00 9,376.06 9,376.06 0.37 0.00 9,383.94
2018 4.68 25.35 40.99 0.11 8.01 1.10 9.11 0.14 1.03 1.17 0.00 9,313.34 9,313.34 0.35 0.00 9,320.71
2019 4.43 23.87 38.57 0.11 8.01 1.04 9.05 0.14 0.97 1.11 0.00 9,223.85 9,223.85 0.33 0.00 9,230.77
2020 4.23 22.69 36.69 0.11 8.04 1.00 9.03 0.14 0.93 1.07 0.00 9,176.57 9,176.57 0.31 0.00 9,183.11
2021 4.04 21.53 35.03 0.11 8.01 0.96 8.97 0.14 0.89 1.03 0.00 9,108.06 9,108.06 0.30 0.00 9,114.29
2022 3.86 20.54 33.28 0.11 7.98 0.92 8.90 0.14 0.86 1.00 0.00 9,004.28 9,004.28 0.28 0.00 9,010.18
2023 3.71 19.76 31.79 0.11 7.98 0.89 8.87 0.14 0.83 0.97 0.00 8,941.17 8,941.17 0.27 0.00 8,946.82
2024 3.61 19.25 30.68 0.11 8.04 0.88 8.92 0.14 0.82 0.96 0.00 8,952.75 8,952.75 0.26 0.00 8,958.22
2025 3.48 18.62 29.48 0.11 8.01 0.86 8.86 0.14 0.79 0.94 0.00 8,867.06 8,867.06 0.25 0.00 8,872.27
2026 3.48 18.62 29.48 0.11 8.01 0.86 8.86 0.14 0.79 0.94 0.00 8,867.06 8,867.06 0.25 0.00 8,872.27
2027 3.48 18.62 29.48 0.11 8.01 0.86 8.86 0.14 0.79 0.94 0.00 8,867.06 8,867.06 0.25 0.00 8,872.27
2028 3.46 18.55 29.36 0.11 7.98 0.85 8.83 0.14 0.79 0.93 0.00 8,833.08 8,833.08 0.25 0.00 8,838.28
2029 3.48 18.62 29.48 0.11 8.01 0.86 8.86 0.14 0.79 0.94 0.00 8,867.06 8,867.06 0.25 0.00 8,872.27
2030 3.05 16.92 25.76 0.11 8.01 0.80 8.81 0.14 0.74 0.88 0.00 8,683.88 8,683.88 0.22 0.00 8,688.41
2031 3.05 16.92 25.76 0.11 8.01 0.80 8.81 0.14 0.74 0.88 0.00 8,683.88 8,683.88 0.22 0.00 8,688.41
2032 1.51 8.44 12.97 0.05 3.60 0.40 4.00 0.06 0.37 0.43 0.00 4,092.03 4,092.03 0.11 0.00 4,094.30
2033 26.69 1.19 2.70 0.01 0.40 0.07 0.46 0.01 0.06 0.07 0.00 491.90 491.90 0.02 0.00 492.39
2034 90.15 0.37 3.04 0.01 1.30 0.06 1.35 0.02 0.05 0.07 0.00 808.09 808.09 0.03 0.00 808.72
Total 193.91 431.43 650.37 2.02 152.19 19.49 171.61 5.93 0.00 167,126.5818.24 24.22 0.00 167,005.95
Exhaust PM10
PM10 Total
167,005.95 5.77
PM2.5 Total
Bio- CO2
Mitigated Construction
ROG NOx CO SO2 Fugitive PM10
CO2e
Year tons/yr MT/yr
NBio- CO2 Total CO2 CH4 N2OFugitive PM2.5
Exhaust PM2.5
3 of 60

2011 1.29 10.40 6.12 0.01 0.00 0.53 0.53 0.00 0.53 0.53 0.00 903.69 903.69 0.11 0.00 905.90
2012 1.40 11.27 6.48 0.01 3.64 0.56 4.21 1.73 0.56 2.29 0.00 1,012.12 1,012.12 0.11 0.00 1,014.50
2013 1.56 12.73 7.07 0.01 2.02 0.60 2.62 0.84 0.60 1.44 0.00 1,308.22 1,308.22 0.13 0.00 1,310.88
2014 3.23 20.04 24.76 0.05 2.17 0.87 3.04 0.89 0.84 1.73 0.00 4,474.71 4,474.71 0.25 0.00 4,480.00
2015 5.72 31.18 50.62 0.11 0.40 1.32 1.72 0.14 1.23 1.38 0.00 9,632.15 9,632.15 0.44 0.00 9,641.29
2016 5.34 28.99 47.08 0.11 0.40 1.24 1.64 0.14 1.16 1.30 0.00 9,517.88 9,517.88 0.41 0.00 9,526.38
2017 4.98 26.96 43.70 0.11 0.40 1.16 1.56 0.14 1.08 1.22 0.00 9,376.06 9,376.06 0.37 0.00 9,383.94
2018 4.68 25.35 40.99 0.11 0.40 1.10 1.50 0.14 1.03 1.17 0.00 9,313.34 9,313.34 0.35 0.00 9,320.71
2019 4.43 23.87 38.57 0.11 0.40 1.04 1.45 0.14 0.97 1.11 0.00 9,223.85 9,223.85 0.33 0.00 9,230.77
2020 4.23 22.69 36.69 0.11 0.41 1.00 1.40 0.14 0.93 1.07 0.00 9,176.57 9,176.57 0.31 0.00 9,183.11
2021 4.04 21.53 35.03 0.11 0.40 0.96 1.36 0.14 0.89 1.03 0.00 9,108.06 9,108.06 0.30 0.00 9,114.29
2022 3.86 20.54 33.28 0.11 0.40 0.92 1.32 0.14 0.86 1.00 0.00 9,004.28 9,004.28 0.28 0.00 9,010.18
2023 3.71 19.76 31.79 0.11 0.40 0.89 1.30 0.14 0.83 0.97 0.00 8,941.17 8,941.17 0.27 0.00 8,946.82
2024 3.61 19.25 30.68 0.11 0.41 0.88 1.28 0.14 0.82 0.96 0.00 8,952.75 8,952.75 0.26 0.00 8,958.22
2025 3.48 18.62 29.48 0.11 0.40 0.86 1.26 0.14 0.79 0.94 0.00 8,867.06 8,867.06 0.25 0.00 8,872.27
2026 3.48 18.62 29.48 0.11 0.40 0.86 1.26 0.14 0.79 0.94 0.00 8,867.06 8,867.06 0.25 0.00 8,872.27
2027 3.48 18.62 29.48 0.11 0.40 0.86 1.26 0.14 0.79 0.94 0.00 8,867.06 8,867.06 0.25 0.00 8,872.27
2028 3.46 18.55 29.36 0.11 0.40 0.85 1.26 0.14 0.79 0.93 0.00 8,833.08 8,833.08 0.25 0.00 8,838.28
2029 3.48 18.62 29.48 0.11 0.40 0.86 1.26 0.14 0.79 0.94 0.00 8,867.06 8,867.06 0.25 0.00 8,872.27
2030 3.05 16.92 25.76 0.11 0.40 0.80 1.20 0.14 0.74 0.88 0.00 8,683.88 8,683.88 0.22 0.00 8,688.41
2031 3.05 16.92 25.76 0.11 0.40 0.80 1.20 0.14 0.74 0.88 0.00 8,683.88 8,683.88 0.22 0.00 8,688.41
2032 1.51 8.44 12.97 0.05 0.18 0.40 0.58 0.06 0.37 0.43 0.00 4,092.03 4,092.03 0.11 0.00 4,094.30
2033 26.69 1.19 2.70 0.01 0.02 0.07 0.08 0.01 0.06 0.07 0.00 491.90 491.90 0.02 0.00 492.39
2034 90.15 0.37 3.04 0.01 0.06 0.06 0.11 0.02 0.05 0.07 0.00 808.09 808.09 0.03 0.00 808.72
Total 193.91 431.43 650.37 167,005.95 5.77 0.005.93 18.24 24.22 0.00 167,005.952.02 14.91 19.49 34.40 167,126.58
4 of 60
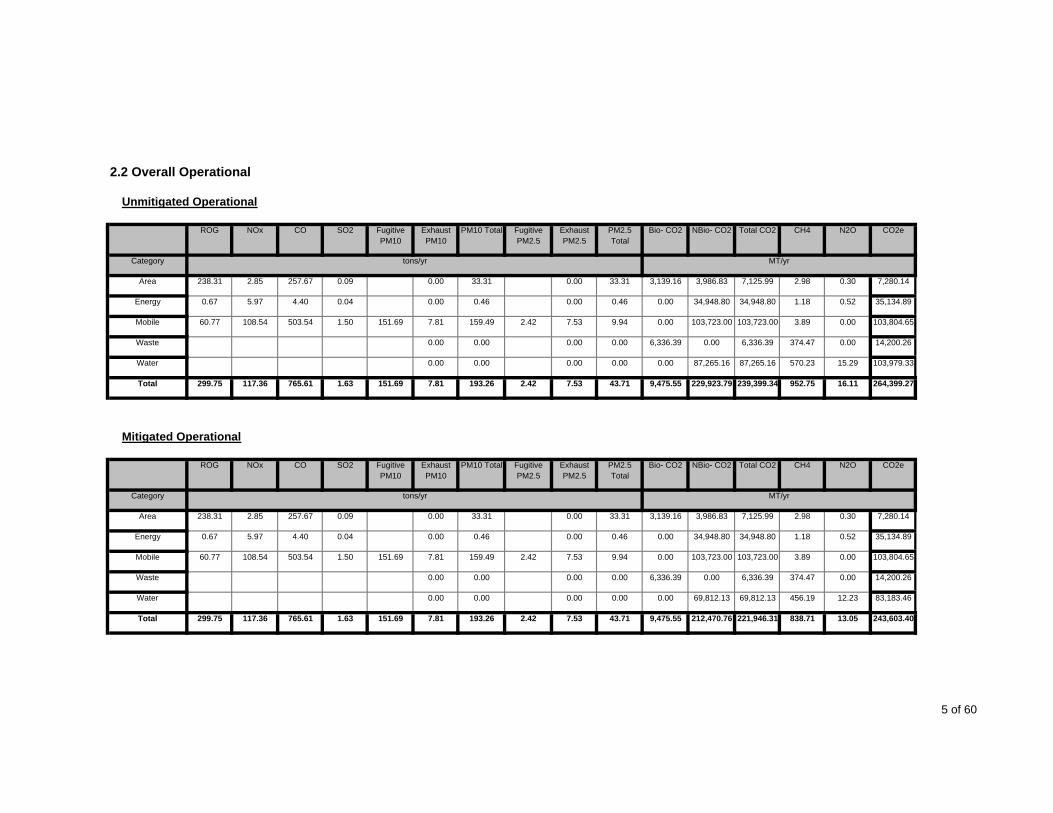
SO2 Fugitive PM10
Exhaust PM10
Fugitive PM2.5
Exhaust PM2.5
PM2.5 Total
2.2 Overall Operational
Unmitigated Operational
ROG NOx CO N2O CO2e
Category tons/yr MT/yr
Bio- CO2 NBio- CO2 Total CO2 CH4PM10 Total
Area 238.31 2.85 257.67 0.09 0.00 33.31 0.00 33.31 3,139.16 3,986.83 7,125.99 2.98 0.30 7,280.14
Energy 0.67 5.97 4.40 0.04 0.00 0.46 0.00 0.46 0.00 34,948.80 34,948.80 1.18 0.52 35,134.89
Mobile 60.77 108.54 503.54 1.50 151.69 7.81 159.49 2.42 7.53 9.94 0.00 103,723.00 103,723.00 3.89 0.00 103,804.65
Waste 0.00 0.00 0.00 0.00 6,336.39 0.00 6,336.39 374.47 0.00 14,200.26
Water 0.00 0.00 0.00 0.00 0.00 87,265.16 87,265.16 570.23 15.29 103,979.33
Total 299.75 117.36 765.61 1.63 151.69 7.81 193.26 2.42 16.11 264,399.277.53 43.71 9,475.55 229,923.79
Exhaust PM10
PM10 Total
239,399.34 952.75
PM2.5 Total
Bio- CO2
Mitigated Operational
ROG NOx CO SO2 Fugitive PM10
CO2e
Category tons/yr MT/yr
NBio- CO2 Total CO2 CH4 N2OFugitive PM2.5
Exhaust PM2.5
Area 238.31 2.85 257.67 0.09 0.00 33.31 0.00 33.31 3,139.16 3,986.83 7,125.99 2.98 0.30 7,280.14
Energy 0.67 5.97 4.40 0.04 0.00 0.46 0.00 0.46 0.00 34,948.80 34,948.80 1.18 0.52 35,134.89
Mobile 60.77 108.54 503.54 1.50 151.69 7.81 159.49 2.42 7.53 9.94 0.00 103,723.00 103,723.00 3.89 0.00 103,804.65
Waste 0.00 0.00 0.00 0.00 6,336.39 0.00 6,336.39 374.47 0.00 14,200.26
Water 0.00 0.00 0.00 0.00 0.00 69,812.13 69,812.13 456.19 12.23 83,183.46
Total 299.75 117.36 765.61 1.63 151.69 7.81 193.26 2.42 7.53 43.71 9,475.55 212,470.76 221,946.31 838.71 13.05 243,603.40
5 of 60

SO2 Fugitive PM10
Exhaust PM10
3.0 Construction Detail
3.1 Mitigation Measures Construction
Fugitive PM2.5
Exhaust PM2.5
PM2.5 Total
3.2 Demolition - 2011
Unmitigated Construction On-Site
ROG NOx CO N2O CO2e
Category tons/yr MT/yr
Bio- CO2 NBio- CO2 Total CO2 CH4PM10 Total
Off-Road 1.28 10.38 5.97 0.01 0.53 0.53 0.53 0.53 0.00 885.54 885.54 0.10 0.00 887.72
Total 1.28 10.38 5.97 0.01 0.53 0.53 0.00 887.720.53 0.53 0.00 885.54 885.54 0.10
6 of 60

Exhaust PM10
PM10 Total PM2.5 Total
Bio- CO2
Unmitigated Construction Off-Site
ROG NOx CO SO2 Fugitive PM10
CO2e
Category tons/yr MT/yr
NBio- CO2 Total CO2 CH4 N2OFugitive PM2.5
Exhaust PM2.5
Hauling 0.00 0.00 0.00 0.00 0.00 0.00 0.00 0.00 0.00 0.00 0.00 0.00 0.00 0.00 0.00 0.00
Vendor 0.00 0.00 0.00 0.00 0.00 0.00 0.00 0.00 0.00 0.00 0.00 0.00 0.00 0.00 0.00 0.00
Worker 0.01 0.02 0.15 0.00 0.02 0.00 0.02 0.00 0.00 0.00 0.00 18.15 18.15 0.00 0.00 18.18
Total 0.01 0.02 0.15 0.00 0.02 0.00 0.02 0.00 0.00 18.180.00 0.00 0.00 18.15
Exhaust PM10
PM10 Total
18.15 0.00
PM2.5 Total
Bio- CO2
Mitigated Construction On-Site
ROG NOx CO SO2 Fugitive PM10
CO2e
Category tons/yr MT/yr
NBio- CO2 Total CO2 CH4 N2OFugitive PM2.5
Exhaust PM2.5
Off-Road 1.28 10.38 5.97 0.01 0.53 0.53 0.53 0.53 0.00 885.54 885.54 0.10 0.00 887.72
Total 1.28 10.38 5.97 0.01 0.53 0.53 0.00 887.720.53 0.53 0.00 885.54
Exhaust PM10
PM10 Total
885.54 0.10
PM2.5 Total
Bio- CO2
Mitigated Construction Off-Site
ROG NOx CO SO2 Fugitive PM10
CO2e
Category tons/yr MT/yr
NBio- CO2 Total CO2 CH4 N2OFugitive PM2.5
Exhaust PM2.5
Hauling 0.00 0.00 0.00 0.00 0.00 0.00 0.00 0.00 0.00 0.00 0.00 0.00 0.00 0.00 0.00 0.00
Vendor 0.00 0.00 0.00 0.00 0.00 0.00 0.00 0.00 0.00 0.00 0.00 0.00 0.00 0.00 0.00 0.00
Worker 0.01 0.02 0.15 0.00 0.00 0.00 0.00 0.00 0.00 0.00 0.00 18.15 18.15 0.00 0.00 18.18
7 of 60

Total 0.01 0.02 0.15 0.00 0.00 0.00 0.00 0.00 0.00 18.180.00 0.00 0.00 18.15
Exhaust PM10
PM10 Total
18.15 0.00
PM2.5 Total
Bio- CO2
3.2 Demolition - 2012
Unmitigated Construction On-Site
ROG NOx CO SO2 Fugitive PM10
CO2e
Category tons/yr MT/yr
NBio- CO2 Total CO2 CH4 N2OFugitive PM2.5
Exhaust PM2.5
Off-Road 0.19 1.50 0.88 0.00 0.08 0.08 0.08 0.08 0.00 136.24 136.24 0.02 0.00 136.55
Total 0.19 1.50 0.88 0.00 0.08 0.08 0.00 136.550.08 0.08 0.00 136.24
Exhaust PM10
PM10 Total
136.24 0.02
PM2.5 Total
Bio- CO2
Unmitigated Construction Off-Site
ROG NOx CO SO2 Fugitive PM10
CO2e
Category tons/yr MT/yr
NBio- CO2 Total CO2 CH4 N2OFugitive PM2.5
Exhaust PM2.5
Hauling 0.00 0.00 0.00 0.00 0.00 0.00 0.00 0.00 0.00 0.00 0.00 0.00 0.00 0.00 0.00 0.00
Vendor 0.00 0.00 0.00 0.00 0.00 0.00 0.00 0.00 0.00 0.00 0.00 0.00 0.00 0.00 0.00 0.00
Worker 0.00 0.00 0.02 0.00 0.00 0.00 0.00 0.00 0.00 0.00 0.00 2.73 2.73 0.00 0.00 2.74
Total 0.00 0.00 0.02 0.00 0.00 0.00 0.00 0.00 0.00 2.740.00 0.00 0.00 2.73
Exhaust PM10
PM10 Total
2.73 0.00
PM2.5 Total
Bio- CO2
Mitigated Construction On-Site
ROG NOx CO SO2 Fugitive PM10
CO2e
Category tons/yr MT/yr
NBio- CO2 Total CO2 CH4 N2OFugitive PM2.5
Exhaust PM2.5
8 of 60

Off-Road 0.19 1.50 0.88 0.00 0.08 0.08 0.08 0.08 0.00 136.24 136.24 0.02 0.00 136.55
Total 0.19 1.50 0.88 0.00 0.08 0.08 0.00 136.550.08 0.08 0.00 136.24
Exhaust PM10
PM10 Total
136.24 0.02
PM2.5 Total
Bio- CO2
Mitigated Construction Off-Site
ROG NOx CO SO2 Fugitive PM10
CO2e
Category tons/yr MT/yr
NBio- CO2 Total CO2 CH4 N2OFugitive PM2.5
Exhaust PM2.5
Hauling 0.00 0.00 0.00 0.00 0.00 0.00 0.00 0.00 0.00 0.00 0.00 0.00 0.00 0.00 0.00 0.00
Vendor 0.00 0.00 0.00 0.00 0.00 0.00 0.00 0.00 0.00 0.00 0.00 0.00 0.00 0.00 0.00 0.00
Worker 0.00 0.00 0.02 0.00 0.00 0.00 0.00 0.00 0.00 0.00 0.00 2.73 2.73 0.00 0.00 2.74
Total 0.00 0.00 0.02 0.00 0.00 0.00 0.00 0.00 0.00 2.740.00 0.00 0.00 2.73
Exhaust PM10
PM10 Total
2.73 0.00
PM2.5 Total
Bio- CO2
3.3 Site Preparation - 2012
Unmitigated Construction On-Site
ROG NOx CO SO2 Fugitive PM10
CO2e
Category tons/yr MT/yr
NBio- CO2 Total CO2 CH4 N2OFugitive PM2.5
Exhaust PM2.5
Fugitive Dust 1.63 0.00 1.63 0.89 0.00 0.89 0.00 0.00 0.00 0.00 0.00 0.00
Off-Road 0.94 7.62 4.30 0.01 0.38 0.38 0.38 0.38 0.00 652.81 652.81 0.08 0.00 654.41
Total 0.94 7.62 4.30 652.81 0.08 0.000.89 0.38 1.27 0.00 652.810.01 1.63 0.38 2.01 654.41
Unmitigated Construction Off-Site
9 of 60

SO2 Fugitive PM10
Exhaust PM10
Fugitive PM2.5
Exhaust PM2.5
PM2.5 Total
ROG NOx CO N2O CO2e
Category tons/yr MT/yr
Bio- CO2 NBio- CO2 Total CO2 CH4PM10 Total
Hauling 0.00 0.00 0.00 0.00 0.00 0.00 0.00 0.00 0.00 0.00 0.00 0.00 0.00 0.00 0.00 0.00
Vendor 0.00 0.00 0.00 0.00 0.00 0.00 0.00 0.00 0.00 0.00 0.00 0.00 0.00 0.00 0.00 0.00
Worker 0.01 0.01 0.12 0.00 0.02 0.00 0.02 0.00 0.00 0.00 0.00 14.76 14.76 0.00 0.00 14.78
Total 0.01 0.01 0.12 0.00 0.02 0.00 0.02 0.00 0.00 14.780.00 0.00 0.00 14.76
Exhaust PM10
PM10 Total
14.76 0.00
PM2.5 Total
Bio- CO2
Mitigated Construction On-Site
ROG NOx CO SO2 Fugitive PM10
CO2e
Category tons/yr MT/yr
NBio- CO2 Total CO2 CH4 N2OFugitive PM2.5
Exhaust PM2.5
Fugitive Dust 1.63 0.00 1.63 0.89 0.00 0.89 0.00 0.00 0.00 0.00 0.00 0.00
Off-Road 0.94 7.62 4.30 0.01 0.38 0.38 0.38 0.38 0.00 652.81 652.81 0.08 0.00 654.41
Total 0.94 7.62 4.30 652.81 0.08 0.000.89 0.38 1.27 0.00
SO2 Fugitive PM10
Exhaust PM10
652.810.01 1.63 0.38 2.01
Fugitive PM2.5
Exhaust PM2.5
PM2.5 Total
654.41
Mitigated Construction Off-Site
ROG NOx CO N2O CO2e
Category tons/yr MT/yr
Bio- CO2 NBio- CO2 Total CO2 CH4PM10 Total
Hauling 0.00 0.00 0.00 0.00 0.00 0.00 0.00 0.00 0.00 0.00 0.00 0.00 0.00 0.00 0.00 0.00
Vendor 0.00 0.00 0.00 0.00 0.00 0.00 0.00 0.00 0.00 0.00 0.00 0.00 0.00 0.00 0.00 0.00
Worker 0.01 0.01 0.12 0.00 0.00 0.00 0.00 0.00 0.00 0.00 0.00 14.76 14.76 0.00 0.00 14.78
Total 0.01 0.01 0.12 0.00 0.00 0.00 0.00 0.00 0.00 14.780.00 0.00 0.00 14.76 14.76 0.00
10 of 60

Exhaust PM10
PM10 Total PM2.5 Total
Bio- CO2
3.4 Grading - 2012
Unmitigated Construction On-Site
ROG NOx CO SO2 Fugitive PM10
CO2e
Category tons/yr MT/yr
NBio- CO2 Total CO2 CH4 N2OFugitive PM2.5
Exhaust PM2.5
Fugitive Dust 2.02 0.00 2.02 0.84 0.00 0.84 0.00 0.00 0.00 0.00 0.00 0.00
Off-Road 0.26 2.13 1.13 0.00 0.10 0.10 0.10 0.10 0.00 201.85 201.85 0.02 0.00 202.29
Total 0.26 2.13 1.13 201.85 0.02 0.000.84 0.10 0.94 0.00
SO2 Fugitive PM10
Exhaust PM10
201.850.00 2.02 0.10 2.12
Fugitive PM2.5
Exhaust PM2.5
PM2.5 Total
202.29
Unmitigated Construction Off-Site
ROG NOx CO N2O CO2e
Category tons/yr MT/yr
Bio- CO2 NBio- CO2 Total CO2 CH4PM10 Total
Hauling 0.00 0.00 0.00 0.00 0.00 0.00 0.00 0.00 0.00 0.00 0.00 0.00 0.00 0.00 0.00 0.00
Vendor 0.00 0.00 0.00 0.00 0.00 0.00 0.00 0.00 0.00 0.00 0.00 0.00 0.00 0.00 0.00 0.00
Worker 0.00 0.00 0.03 0.00 0.00 0.00 0.00 0.00 0.00 0.00 0.00 3.73 3.73 0.00 0.00 3.74
Total 0.00 0.00 0.03 0.00 0.00 0.00 0.00 0.00 0.00 3.740.00 0.00 0.00 3.73
Exhaust PM10
PM10 Total
3.73 0.00
PM2.5 Total
Bio- CO2
Mitigated Construction On-Site
ROG NOx CO SO2 Fugitive PM10
CO2e
Category tons/yr MT/yr
NBio- CO2 Total CO2 CH4 N2OFugitive PM2.5
Exhaust PM2.5
Fugitive Dust 2.02 0.00 2.02 0.84 0.00 0.84 0.00 0.00 0.00 0.00 0.00 0.00
11 of 60

Off-Road 0.26 2.13 1.13 0.00 0.10 0.10 0.10 0.10 0.00 201.85 201.85 0.02 0.00 202.29
Total 0.26 2.13 1.13 201.85 0.02 0.000.84 0.10 0.94 0.00
SO2 Fugitive PM10
Exhaust PM10
201.850.00 2.02 0.10 2.12
Fugitive PM2.5
Exhaust PM2.5
PM2.5 Total
202.29
Mitigated Construction Off-Site
ROG NOx CO N2O CO2e
Category tons/yr MT/yr
Bio- CO2 NBio- CO2 Total CO2 CH4PM10 Total
Hauling 0.00 0.00 0.00 0.00 0.00 0.00 0.00 0.00 0.00 0.00 0.00 0.00 0.00 0.00 0.00 0.00
Vendor 0.00 0.00 0.00 0.00 0.00 0.00 0.00 0.00 0.00 0.00 0.00 0.00 0.00 0.00 0.00 0.00
Worker 0.00 0.00 0.03 0.00 0.00 0.00 0.00 0.00 0.00 0.00 0.00 3.73 3.73 0.00 0.00 3.74
Total 0.00 0.00 0.03 0.00 0.00 0.00 0.00 0.00 0.00 3.740.00 0.00 0.00 3.73
Exhaust PM10
PM10 Total
3.73 0.00
PM2.5 Total
Bio- CO2
3.4 Grading - 2013
Unmitigated Construction On-Site
ROG NOx CO SO2 Fugitive PM10
CO2e
Category tons/yr MT/yr
NBio- CO2 Total CO2 CH4 N2OFugitive PM2.5
Exhaust PM2.5
Fugitive Dust 2.02 0.00 2.02 0.84 0.00 0.84 0.00 0.00 0.00 0.00 0.00 0.00
Off-Road 1.55 12.72 6.89 0.01 0.60 0.60 0.60 0.60 0.00 1,284.94 1,284.94 0.13 0.00 1,287.58
Total 1.55 12.72 6.89 1,284.94 0.13 0.000.84 0.60 1.44 0.00
SO2 Fugitive PM10
Exhaust PM10
1,284.940.01 2.02 0.60 2.62
Fugitive PM2.5
Exhaust PM2.5
PM2.5 Total
1,287.58
Unmitigated Construction Off-Site
ROG NOx CO N2O CO2eBio- CO2 NBio- CO2 Total CO2 CH4PM10 Total
12 of 60
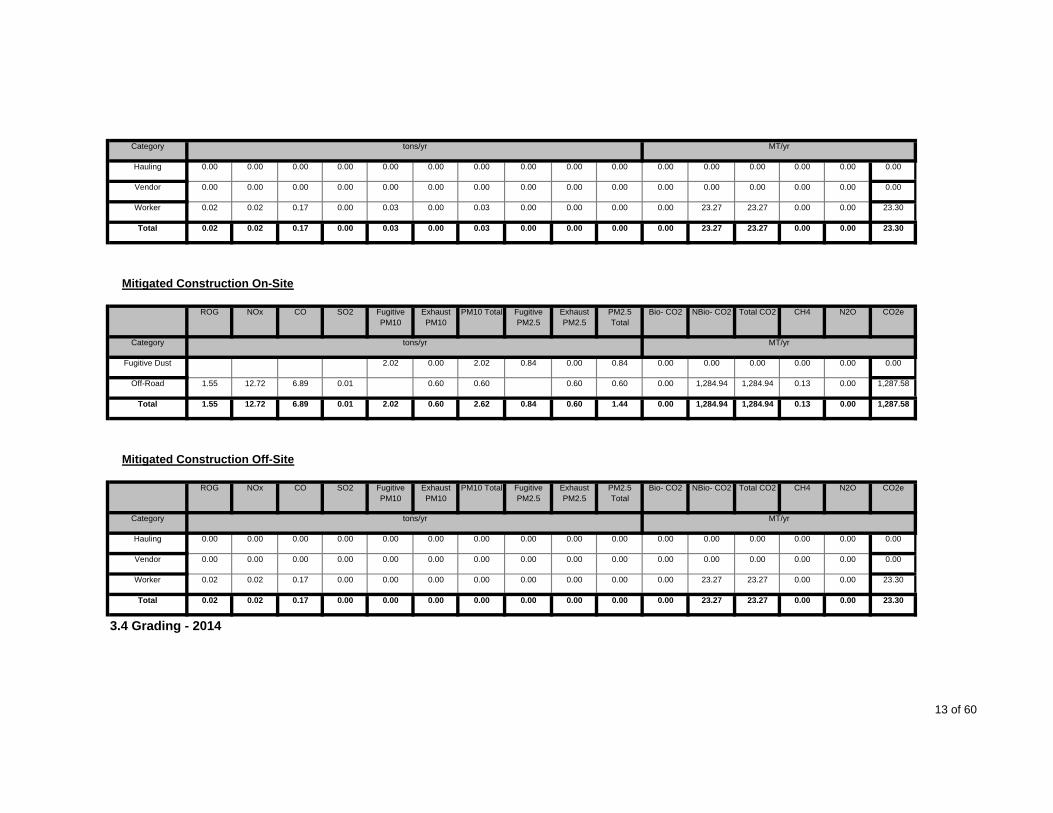
Category tons/yr MT/yr
Hauling 0.00 0.00 0.00 0.00 0.00 0.00 0.00 0.00 0.00 0.00 0.00 0.00 0.00 0.00 0.00 0.00
Vendor 0.00 0.00 0.00 0.00 0.00 0.00 0.00 0.00 0.00 0.00 0.00 0.00 0.00 0.00 0.00 0.00
Worker 0.02 0.02 0.17 0.00 0.03 0.00 0.03 0.00 0.00 0.00 0.00 23.27 23.27 0.00 0.00 23.30
Total 0.02 0.02 0.17 0.00 0.03 0.00 0.03 0.00 0.00 23.300.00 0.00 0.00 23.27
Exhaust PM10
PM10 Total
23.27 0.00
PM2.5 Total
Bio- CO2
Mitigated Construction On-Site
ROG NOx CO SO2 Fugitive PM10
CO2e
Category tons/yr MT/yr
NBio- CO2 Total CO2 CH4 N2OFugitive PM2.5
Exhaust PM2.5
Fugitive Dust 2.02 0.00 2.02 0.84 0.00 0.84 0.00 0.00 0.00 0.00 0.00 0.00
Off-Road 1.55 12.72 6.89 0.01 0.60 0.60 0.60 0.60 0.00 1,284.94 1,284.94 0.13 0.00 1,287.58
Total 1.55 12.72 6.89 1,284.94 0.13 0.000.84 0.60 1.44 0.00
SO2 Fugitive PM10
Exhaust PM10
1,284.940.01 2.02 0.60 2.62
Fugitive PM2.5
Exhaust PM2.5
PM2.5 Total
1,287.58
Mitigated Construction Off-Site
ROG NOx CO N2O CO2e
Category tons/yr MT/yr
Bio- CO2 NBio- CO2 Total CO2 CH4PM10 Total
Hauling 0.00 0.00 0.00 0.00 0.00 0.00 0.00 0.00 0.00 0.00 0.00 0.00 0.00 0.00 0.00 0.00
Vendor 0.00 0.00 0.00 0.00 0.00 0.00 0.00 0.00 0.00 0.00 0.00 0.00 0.00 0.00 0.00 0.00
Worker 0.02 0.02 0.17 0.00 0.00 0.00 0.00 0.00 0.00 0.00 0.00 23.27 23.27 0.00 0.00 23.30
Total 0.02 0.02 0.17 0.00 0.00 0.00 0.00 0.00 0.00 23.300.00 0.00 0.00 23.27 23.27 0.00
3.4 Grading - 2014
13 of 60
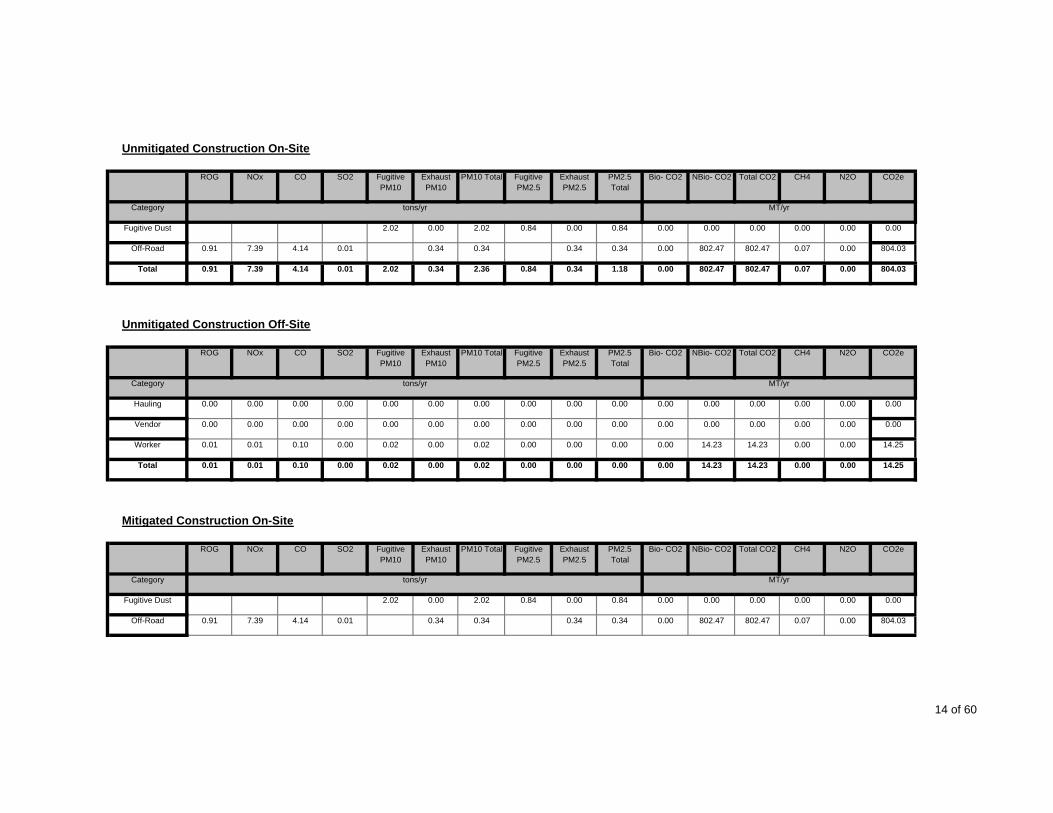
Exhaust PM10
PM10 Total PM2.5 Total
Bio- CO2
Unmitigated Construction On-Site
ROG NOx CO SO2 Fugitive PM10
CO2e
Category tons/yr MT/yr
NBio- CO2 Total CO2 CH4 N2OFugitive PM2.5
Exhaust PM2.5
Fugitive Dust 2.02 0.00 2.02 0.84 0.00 0.84 0.00 0.00 0.00 0.00 0.00 0.00
Off-Road 0.91 7.39 4.14 0.01 0.34 0.34 0.34 0.34 0.00 802.47 802.47 0.07 0.00 804.03
Total 0.91 7.39 4.14 802.47 0.07 0.000.84 0.34 1.18 0.00
SO2 Fugitive PM10
Exhaust PM10
802.470.01 2.02 0.34 2.36
Fugitive PM2.5
Exhaust PM2.5
PM2.5 Total
804.03
Unmitigated Construction Off-Site
ROG NOx CO N2O CO2e
Category tons/yr MT/yr
Bio- CO2 NBio- CO2 Total CO2 CH4PM10 Total
Hauling 0.00 0.00 0.00 0.00 0.00 0.00 0.00 0.00 0.00 0.00 0.00 0.00 0.00 0.00 0.00 0.00
Vendor 0.00 0.00 0.00 0.00 0.00 0.00 0.00 0.00 0.00 0.00 0.00 0.00 0.00 0.00 0.00 0.00
Worker 0.01 0.01 0.10 0.00 0.02 0.00 0.02 0.00 0.00 0.00 0.00 14.23 14.23 0.00 0.00 14.25
Total 0.01 0.01 0.10 0.00 0.02 0.00 0.02 0.00 0.00 14.250.00 0.00 0.00 14.23
Exhaust PM10
PM10 Total
14.23 0.00
PM2.5 Total
Bio- CO2
Mitigated Construction On-Site
ROG NOx CO SO2 Fugitive PM10
CO2e
Category tons/yr MT/yr
NBio- CO2 Total CO2 CH4 N2OFugitive PM2.5
Exhaust PM2.5
Fugitive Dust 2.02 0.00 2.02 0.84 0.00 0.84 0.00 0.00 0.00 0.00 0.00 0.00
Off-Road 0.91 7.39 4.14 0.01 0.34 0.34 0.34 0.34 0.00 802.47 802.47 0.07 0.00 804.03
14 of 60
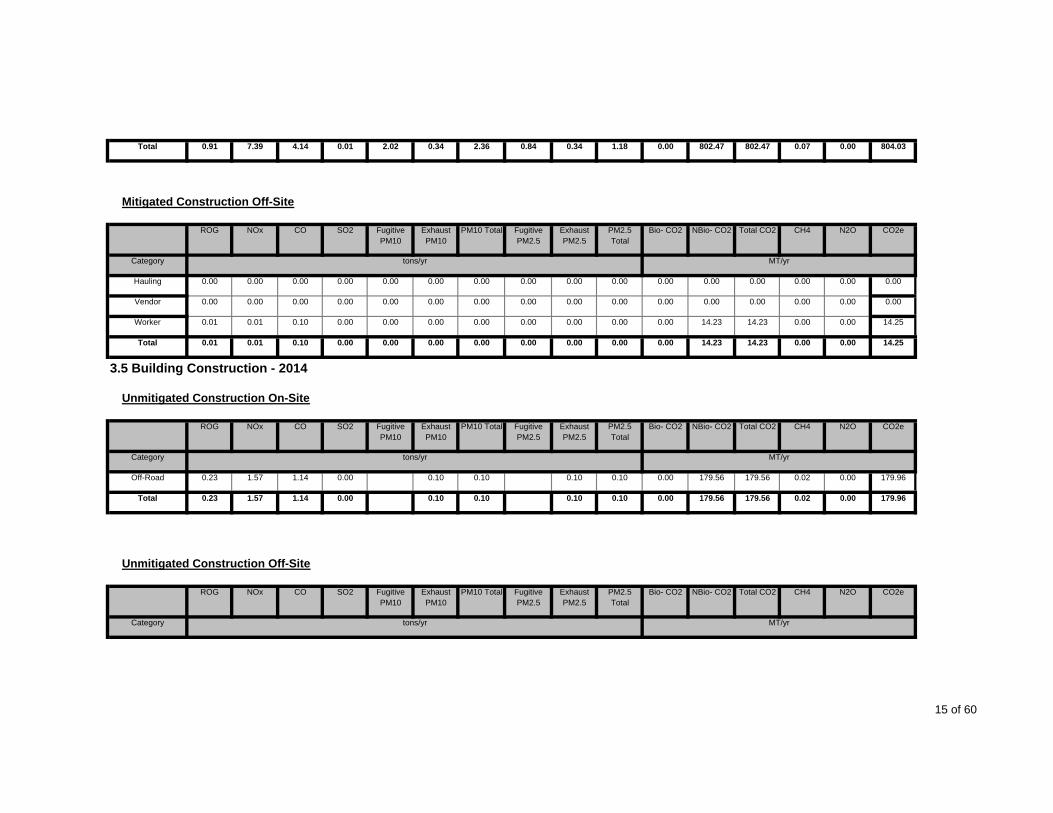
Total 0.91 7.39 4.14 802.47 0.07 0.000.84 0.34 1.18 0.00
SO2 Fugitive PM10
Exhaust PM10
802.470.01 2.02 0.34 2.36
Fugitive PM2.5
Exhaust PM2.5
PM2.5 Total
804.03
Mitigated Construction Off-Site
ROG NOx CO N2O CO2e
Category tons/yr MT/yr
Bio- CO2 NBio- CO2 Total CO2 CH4PM10 Total
Hauling 0.00 0.00 0.00 0.00 0.00 0.00 0.00 0.00 0.00 0.00 0.00 0.00 0.00 0.00 0.00 0.00
Vendor 0.00 0.00 0.00 0.00 0.00 0.00 0.00 0.00 0.00 0.00 0.00 0.00 0.00 0.00 0.00 0.00
Worker 0.01 0.01 0.10 0.00 0.00 0.00 0.00 0.00 0.00 0.00 0.00 14.23 14.23 0.00 0.00 14.25
Total 0.01 0.01 0.10 0.00 0.00 0.00 0.00 0.00 0.00 14.250.00 0.00 0.00 14.23
Exhaust PM10
PM10 Total
14.23 0.00
PM2.5 Total
Bio- CO2
3.5 Building Construction - 2014
Unmitigated Construction On-Site
ROG NOx CO SO2 Fugitive PM10
CO2e
Category tons/yr MT/yr
NBio- CO2 Total CO2 CH4 N2OFugitive PM2.5
Exhaust PM2.5
Off-Road 0.23 1.57 1.14 0.00 0.10 0.10 0.10 0.10 0.00 179.56 179.56 0.02 0.00 179.96
Total 0.23 1.57 1.14 0.00 0.10 0.10 0.00 179.960.10 0.10 0.00 179.56
Exhaust PM10
PM10 Total
179.56 0.02
PM2.5 Total
Bio- CO2
Unmitigated Construction Off-Site
ROG NOx CO SO2 Fugitive PM10
CO2e
Category tons/yr MT/yr
NBio- CO2 Total CO2 CH4 N2OFugitive PM2.5
Exhaust PM2.5
15 of 60

Hauling 0.00 0.00 0.00 0.00 0.00 0.00 0.00 0.00 0.00 0.00 0.00 0.00 0.00 0.00 0.00 0.00
Vendor 0.88 9.74 6.26 0.02 0.51 0.33 0.85 0.01 0.31 0.32 0.00 1,570.14 1,570.14 0.04 0.00 1,570.97
Worker 1.19 1.34 13.13 0.02 2.49 0.10 2.59 0.04 0.09 0.13 0.00 1,908.30 1,908.30 0.12 0.00 1,910.79
Total 2.07 11.08 19.39 0.04 3.00 0.43 3.44 0.05 0.00 3,481.760.40 0.45 0.00 3,478.44
Exhaust PM10
PM10 Total
3,478.44 0.16
PM2.5 Total
Bio- CO2
Mitigated Construction On-Site
ROG NOx CO SO2 Fugitive PM10
CO2e
Category tons/yr MT/yr
NBio- CO2 Total CO2 CH4 N2OFugitive PM2.5
Exhaust PM2.5
Off-Road 0.23 1.57 1.14 0.00 0.10 0.10 0.10 0.10 0.00 179.56 179.56 0.02 0.00 179.96
Total 0.23 1.57 1.14 0.00 0.10 0.10 0.00 179.960.10 0.10 0.00 179.56
Exhaust PM10
PM10 Total
179.56 0.02
PM2.5 Total
Bio- CO2
Mitigated Construction Off-Site
ROG NOx CO SO2 Fugitive PM10
CO2e
Category tons/yr MT/yr
NBio- CO2 Total CO2 CH4 N2OFugitive PM2.5
Exhaust PM2.5
Hauling 0.00 0.00 0.00 0.00 0.00 0.00 0.00 0.00 0.00 0.00 0.00 0.00 0.00 0.00 0.00 0.00
Vendor 0.88 9.74 6.26 0.02 0.04 0.33 0.38 0.01 0.31 0.32 0.00 1,570.14 1,570.14 0.04 0.00 1,570.97
Worker 1.19 1.34 13.13 0.02 0.11 0.10 0.21 0.04 0.09 0.13 0.00 1,908.30 1,908.30 0.12 0.00 1,910.79
Total 2.07 11.08 19.39 0.04 0.15 0.43 0.59 0.05 0.00 3,481.760.40 0.45 0.00 3,478.44 3,478.44 0.16
3.5 Building Construction - 2015
Unmitigated Construction On-Site
16 of 60

Exhaust PM10
PM10 Total PM2.5 Total
Bio- CO2ROG NOx CO SO2 Fugitive PM10
CO2e
Category tons/yr MT/yr
NBio- CO2 Total CO2 CH4 N2OFugitive PM2.5
Exhaust PM2.5
Off-Road 0.57 3.80 3.00 0.01 0.23 0.23 0.23 0.23 0.00 478.23 478.23 0.05 0.00 479.20
Total 0.57 3.80 3.00 0.01 0.23 0.23 0.00 479.200.23 0.23 0.00 478.23
Exhaust PM10
PM10 Total
478.23 0.05
PM2.5 Total
Bio- CO2
Unmitigated Construction Off-Site
ROG NOx CO SO2 Fugitive PM10
CO2e
Category tons/yr MT/yr
NBio- CO2 Total CO2 CH4 N2OFugitive PM2.5
Exhaust PM2.5
Hauling 0.00 0.00 0.00 0.00 0.00 0.00 0.00 0.00 0.00 0.00 0.00 0.00 0.00 0.00 0.00 0.00
Vendor 2.18 24.10 15.44 0.04 1.37 0.82 2.19 0.04 0.76 0.80 0.00 4,187.48 4,187.48 0.10 0.00 4,189.53
Worker 2.97 3.27 32.18 0.06 6.64 0.27 6.90 0.10 0.24 0.35 0.00 4,966.44 4,966.44 0.29 0.00 4,972.57
Total 5.15 27.37 47.62 0.10 8.01 1.09 9.09 0.14 0.00 9,162.101.00 1.15 0.00 9,153.92
Exhaust PM10
PM10 Total
9,153.92 0.39
PM2.5 Total
Bio- CO2
Mitigated Construction On-Site
ROG NOx CO SO2 Fugitive PM10
CO2e
Category tons/yr MT/yr
NBio- CO2 Total CO2 CH4 N2OFugitive PM2.5
Exhaust PM2.5
Off-Road 0.57 3.80 3.00 0.01 0.23 0.23 0.23 0.23 0.00 478.23 478.23 0.05 0.00 479.20
Total 0.57 3.80 3.00 0.01 0.23 0.23 0.00 479.200.23 0.23 0.00 478.23 478.23 0.05
17 of 60
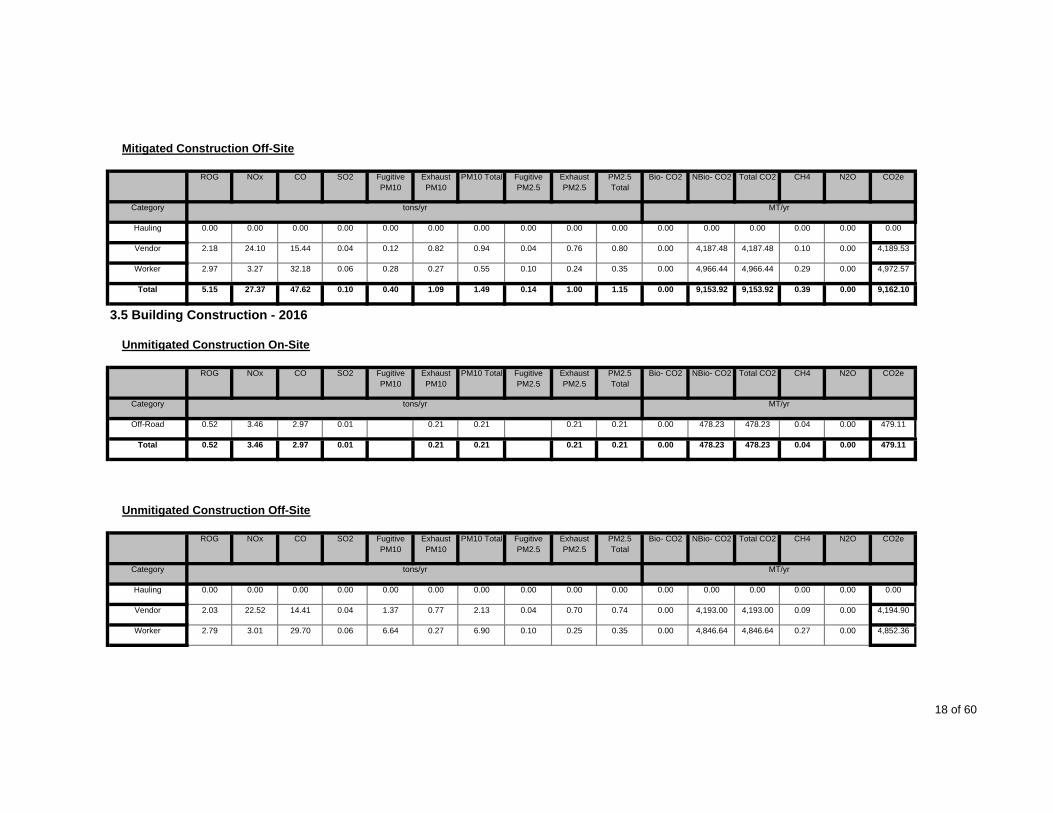
Exhaust PM10
PM10 Total PM2.5 Total
Bio- CO2
Mitigated Construction Off-Site
ROG NOx CO SO2 Fugitive PM10
CO2e
Category tons/yr MT/yr
NBio- CO2 Total CO2 CH4 N2OFugitive PM2.5
Exhaust PM2.5
Hauling 0.00 0.00 0.00 0.00 0.00 0.00 0.00 0.00 0.00 0.00 0.00 0.00 0.00 0.00 0.00 0.00
Vendor 2.18 24.10 15.44 0.04 0.12 0.82 0.94 0.04 0.76 0.80 0.00 4,187.48 4,187.48 0.10 0.00 4,189.53
Worker 2.97 3.27 32.18 0.06 0.28 0.27 0.55 0.10 0.24 0.35 0.00 4,966.44 4,966.44 0.29 0.00 4,972.57
Total 5.15 27.37 47.62 0.10 0.40 1.09 1.49 0.14 0.00 9,162.101.00 1.15 0.00 9,153.92
Exhaust PM10
PM10 Total
9,153.92 0.39
PM2.5 Total
Bio- CO2
3.5 Building Construction - 2016
Unmitigated Construction On-Site
ROG NOx CO SO2 Fugitive PM10
CO2e
Category tons/yr MT/yr
NBio- CO2 Total CO2 CH4 N2OFugitive PM2.5
Exhaust PM2.5
Off-Road 0.52 3.46 2.97 0.01 0.21 0.21 0.21 0.21 0.00 478.23 478.23 0.04 0.00 479.11
Total 0.52 3.46 2.97 0.01 0.21 0.21 0.00 479.110.21 0.21 0.00 478.23
Exhaust PM10
PM10 Total
478.23 0.04
PM2.5 Total
Bio- CO2
Unmitigated Construction Off-Site
ROG NOx CO SO2 Fugitive PM10
CO2e
Category tons/yr MT/yr
NBio- CO2 Total CO2 CH4 N2OFugitive PM2.5
Exhaust PM2.5
Hauling 0.00 0.00 0.00 0.00 0.00 0.00 0.00 0.00 0.00 0.00 0.00 0.00 0.00 0.00 0.00 0.00
Vendor 2.03 22.52 14.41 0.04 1.37 0.77 2.13 0.04 0.70 0.74 0.00 4,193.00 4,193.00 0.09 0.00 4,194.90
Worker 2.79 3.01 29.70 0.06 6.64 0.27 6.90 0.10 0.25 0.35 0.00 4,846.64 4,846.64 0.27 0.00 4,852.36
18 of 60
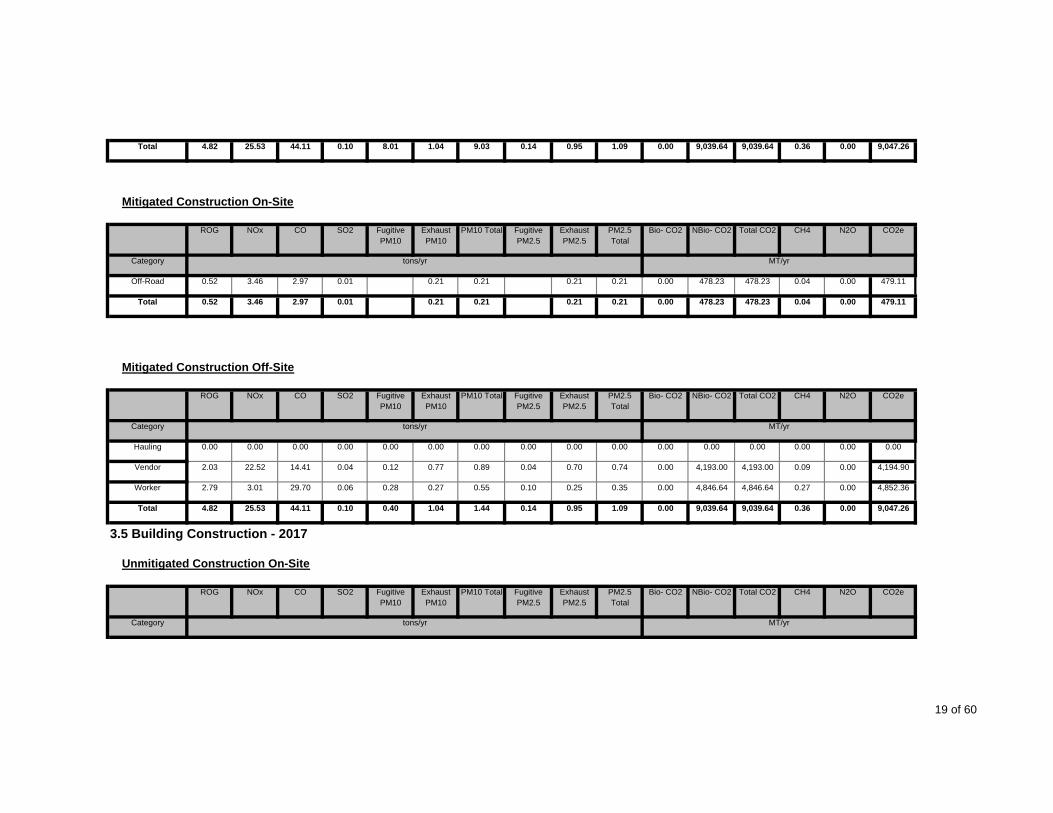
Total 4.82 25.53 44.11 0.10 8.01 1.04 9.03 0.14 0.00 9,047.260.95 1.09 0.00 9,039.64
Exhaust PM10
PM10 Total
9,039.64 0.36
PM2.5 Total
Bio- CO2
Mitigated Construction On-Site
ROG NOx CO SO2 Fugitive PM10
CO2e
Category tons/yr MT/yr
NBio- CO2 Total CO2 CH4 N2OFugitive PM2.5
Exhaust PM2.5
Off-Road 0.52 3.46 2.97 0.01 0.21 0.21 0.21 0.21 0.00 478.23 478.23 0.04 0.00 479.11
Total 0.52 3.46 2.97 0.01 0.21 0.21 0.00 479.110.21 0.21 0.00 478.23
Exhaust PM10
PM10 Total
478.23 0.04
PM2.5 Total
Bio- CO2
Mitigated Construction Off-Site
ROG NOx CO SO2 Fugitive PM10
CO2e
Category tons/yr MT/yr
NBio- CO2 Total CO2 CH4 N2OFugitive PM2.5
Exhaust PM2.5
Hauling 0.00 0.00 0.00 0.00 0.00 0.00 0.00 0.00 0.00 0.00 0.00 0.00 0.00 0.00 0.00 0.00
Vendor 2.03 22.52 14.41 0.04 0.12 0.77 0.89 0.04 0.70 0.74 0.00 4,193.00 4,193.00 0.09 0.00 4,194.90
Worker 2.79 3.01 29.70 0.06 0.28 0.27 0.55 0.10 0.25 0.35 0.00 4,846.64 4,846.64 0.27 0.00 4,852.36
Total 4.82 25.53 44.11 0.10 0.40 1.04 1.44 0.14 0.00 9,047.260.95 1.09 0.00 9,039.64
Exhaust PM10
PM10 Total
9,039.64 0.36
PM2.5 Total
Bio- CO2
3.5 Building Construction - 2017
Unmitigated Construction On-Site
ROG NOx CO SO2 Fugitive PM10
CO2e
Category tons/yr MT/yr
NBio- CO2 Total CO2 CH4 N2OFugitive PM2.5
Exhaust PM2.5
19 of 60

Off-Road 0.48 3.13 2.94 0.01 0.18 0.18 0.18 0.18 0.00 476.40 476.40 0.04 0.00 477.20
Total 0.48 3.13 2.94 0.01 0.18 0.18 0.00 477.200.18 0.18 0.00 476.40
Exhaust PM10
PM10 Total
476.40 0.04
PM2.5 Total
Bio- CO2
Unmitigated Construction Off-Site
ROG NOx CO SO2 Fugitive PM10
CO2e
Category tons/yr MT/yr
NBio- CO2 Total CO2 CH4 N2OFugitive PM2.5
Exhaust PM2.5
Hauling 0.00 0.00 0.00 0.00 0.00 0.00 0.00 0.00 0.00 0.00 0.00 0.00 0.00 0.00 0.00 0.00
Vendor 1.89 21.07 13.49 0.04 1.36 0.72 2.08 0.04 0.66 0.70 0.00 4,181.79 4,181.79 0.08 0.00 4,183.56
Worker 2.61 2.76 27.26 0.06 6.61 0.26 6.88 0.10 0.25 0.35 0.00 4,717.88 4,717.88 0.25 0.00 4,723.17
Total 4.50 23.83 40.75 0.10 7.97 0.98 8.96 0.14 0.00 8,906.730.91 1.05 0.00 8,899.67
Exhaust PM10
PM10 Total
8,899.67 0.33
PM2.5 Total
Bio- CO2
Mitigated Construction On-Site
ROG NOx CO SO2 Fugitive PM10
CO2e
Category tons/yr MT/yr
NBio- CO2 Total CO2 CH4 N2OFugitive PM2.5
Exhaust PM2.5
Off-Road 0.48 3.13 2.94 0.01 0.18 0.18 0.18 0.18 0.00 476.40 476.40 0.04 0.00 477.20
Total 0.48 3.13 2.94 0.01 0.18 0.18 0.00 477.200.18 0.18 0.00 476.40
Exhaust PM10
PM10 Total
476.40 0.04
PM2.5 Total
Bio- CO2
Mitigated Construction Off-Site
ROG NOx CO SO2 Fugitive PM10
CO2eNBio- CO2 Total CO2 CH4 N2OFugitive PM2.5
Exhaust PM2.5
20 of 60
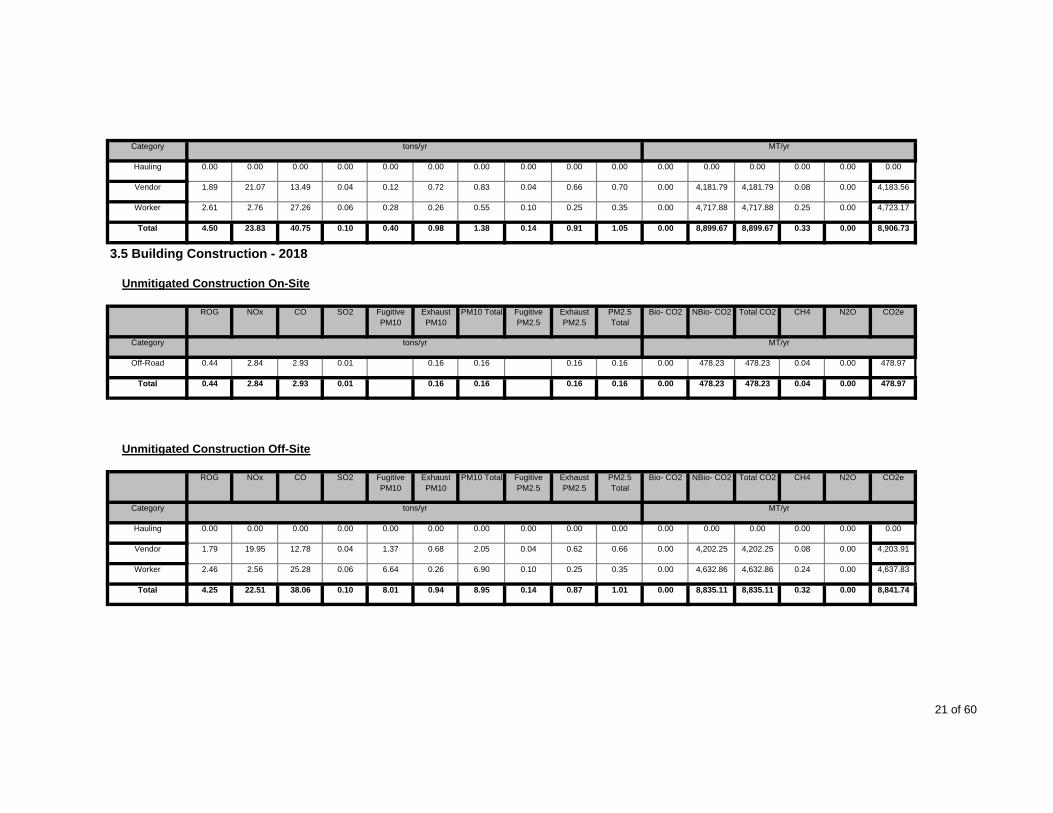
Category tons/yr MT/yr
Hauling 0.00 0.00 0.00 0.00 0.00 0.00 0.00 0.00 0.00 0.00 0.00 0.00 0.00 0.00 0.00 0.00
Vendor 1.89 21.07 13.49 0.04 0.12 0.72 0.83 0.04 0.66 0.70 0.00 4,181.79 4,181.79 0.08 0.00 4,183.56
Worker 2.61 2.76 27.26 0.06 0.28 0.26 0.55 0.10 0.25 0.35 0.00 4,717.88 4,717.88 0.25 0.00 4,723.17
Total 4.50 23.83 40.75 0.10 0.40 0.98 1.38 0.14 0.00 8,906.730.91 1.05 0.00 8,899.67
Exhaust PM10
PM10 Total
8,899.67 0.33
PM2.5 Total
Bio- CO2
3.5 Building Construction - 2018
Unmitigated Construction On-Site
ROG NOx CO SO2 Fugitive PM10
CO2e
Category tons/yr MT/yr
NBio- CO2 Total CO2 CH4 N2OFugitive PM2.5
Exhaust PM2.5
Off-Road 0.44 2.84 2.93 0.01 0.16 0.16 0.16 0.16 0.00 478.23 478.23 0.04 0.00 478.97
Total 0.44 2.84 2.93 0.01 0.16 0.16 0.00 478.970.16 0.16 0.00 478.23
Exhaust PM10
PM10 Total
478.23 0.04
PM2.5 Total
Bio- CO2
Unmitigated Construction Off-Site
ROG NOx CO SO2 Fugitive PM10
CO2e
Category tons/yr MT/yr
NBio- CO2 Total CO2 CH4 N2OFugitive PM2.5
Exhaust PM2.5
Hauling 0.00 0.00 0.00 0.00 0.00 0.00 0.00 0.00 0.00 0.00 0.00 0.00 0.00 0.00 0.00 0.00
Vendor 1.79 19.95 12.78 0.04 1.37 0.68 2.05 0.04 0.62 0.66 0.00 4,202.25 4,202.25 0.08 0.00 4,203.91
Worker 2.46 2.56 25.28 0.06 6.64 0.26 6.90 0.10 0.25 0.35 0.00 4,632.86 4,632.86 0.24 0.00 4,637.83
Total 4.25 22.51 38.06 0.10 8.01 0.94 8.95 0.14 0.00 8,841.740.87 1.01 0.00 8,835.11 8,835.11 0.32
21 of 60
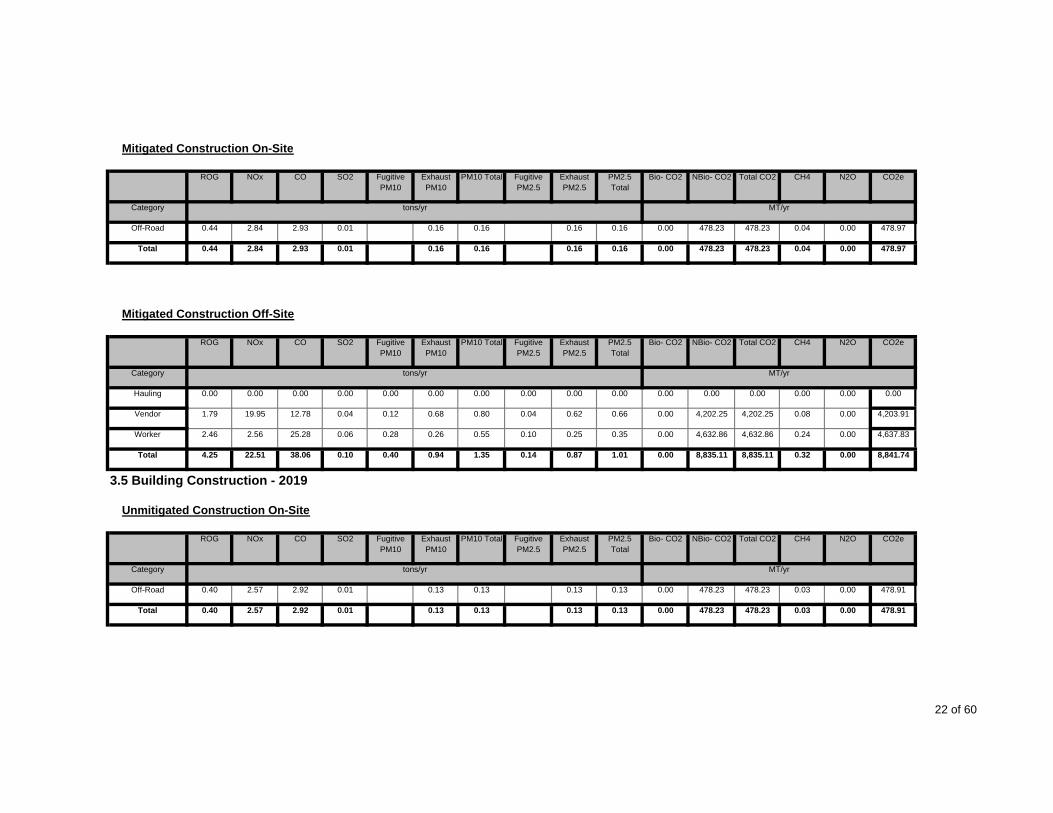
Exhaust PM10
PM10 Total PM2.5 Total
Bio- CO2
Mitigated Construction On-Site
ROG NOx CO SO2 Fugitive PM10
CO2e
Category tons/yr MT/yr
NBio- CO2 Total CO2 CH4 N2OFugitive PM2.5
Exhaust PM2.5
Off-Road 0.44 2.84 2.93 0.01 0.16 0.16 0.16 0.16 0.00 478.23 478.23 0.04 0.00 478.97
Total 0.44 2.84 2.93 0.01 0.16 0.16 0.00 478.970.16 0.16 0.00 478.23
Exhaust PM10
PM10 Total
478.23 0.04
PM2.5 Total
Bio- CO2
Mitigated Construction Off-Site
ROG NOx CO SO2 Fugitive PM10
CO2e
Category tons/yr MT/yr
NBio- CO2 Total CO2 CH4 N2OFugitive PM2.5
Exhaust PM2.5
Hauling 0.00 0.00 0.00 0.00 0.00 0.00 0.00 0.00 0.00 0.00 0.00 0.00 0.00 0.00 0.00 0.00
Vendor 1.79 19.95 12.78 0.04 0.12 0.68 0.80 0.04 0.62 0.66 0.00 4,202.25 4,202.25 0.08 0.00 4,203.91
Worker 2.46 2.56 25.28 0.06 0.28 0.26 0.55 0.10 0.25 0.35 0.00 4,632.86 4,632.86 0.24 0.00 4,637.83
Total 4.25 22.51 38.06 0.10 0.40 0.94 1.35 0.14 0.00 8,841.740.87 1.01 0.00 8,835.11
Exhaust PM10
PM10 Total
8,835.11 0.32
PM2.5 Total
Bio- CO2
3.5 Building Construction - 2019
Unmitigated Construction On-Site
ROG NOx CO SO2 Fugitive PM10
CO2e
Category tons/yr MT/yr
NBio- CO2 Total CO2 CH4 N2OFugitive PM2.5
Exhaust PM2.5
Off-Road 0.40 2.57 2.92 0.01 0.13 0.13 0.13 0.13 0.00 478.23 478.23 0.03 0.00 478.91
Total 0.40 2.57 2.92 0.01 0.13 0.13 0.00 478.910.13 0.13 0.00 478.23 478.23 0.03
22 of 60

Exhaust PM10
PM10 Total PM2.5 Total
Bio- CO2
Unmitigated Construction Off-Site
ROG NOx CO SO2 Fugitive PM10
CO2e
Category tons/yr MT/yr
NBio- CO2 Total CO2 CH4 N2OFugitive PM2.5
Exhaust PM2.5
Hauling 0.00 0.00 0.00 0.00 0.00 0.00 0.00 0.00 0.00 0.00 0.00 0.00 0.00 0.00 0.00 0.00
Vendor 1.69 18.92 12.05 0.04 1.37 0.64 2.01 0.04 0.59 0.63 0.00 4,206.97 4,206.97 0.07 0.00 4,208.54
Worker 2.34 2.38 23.60 0.06 6.64 0.26 6.90 0.10 0.25 0.35 0.00 4,538.66 4,538.66 0.22 0.00 4,543.33
Total 4.03 21.30 35.65 0.10 8.01 0.90 8.91 0.14 0.00 8,751.870.84 0.98 0.00 8,745.63
Exhaust PM10
PM10 Total
8,745.63 0.29
PM2.5 Total
Bio- CO2
Mitigated Construction On-Site
ROG NOx CO SO2 Fugitive PM10
CO2e
Category tons/yr MT/yr
NBio- CO2 Total CO2 CH4 N2OFugitive PM2.5
Exhaust PM2.5
Off-Road 0.40 2.57 2.92 0.01 0.13 0.13 0.13 0.13 0.00 478.23 478.23 0.03 0.00 478.91
Total 0.40 2.57 2.92 0.01 0.13 0.13 0.00 478.910.13 0.13 0.00 478.23
Exhaust PM10
PM10 Total
478.23 0.03
PM2.5 Total
Bio- CO2
Mitigated Construction Off-Site
ROG NOx CO SO2 Fugitive PM10
CO2e
Category tons/yr MT/yr
NBio- CO2 Total CO2 CH4 N2OFugitive PM2.5
Exhaust PM2.5
Hauling 0.00 0.00 0.00 0.00 0.00 0.00 0.00 0.00 0.00 0.00 0.00 0.00 0.00 0.00 0.00 0.00
23 of 60

Vendor 1.69 18.92 12.05 0.04 0.12 0.64 0.76 0.04 0.59 0.63 0.00 4,206.97 4,206.97 0.07 0.00 4,208.54
Worker 2.34 2.38 23.60 0.06 0.28 0.26 0.55 0.10 0.25 0.35 0.00 4,538.66 4,538.66 0.22 0.00 4,543.33
Total 4.03 21.30 35.65 0.10 0.40 0.90 1.31 0.14 0.00 8,751.870.84 0.98 0.00 8,745.63
Exhaust PM10
PM10 Total
8,745.63 0.29
PM2.5 Total
Bio- CO2
3.5 Building Construction - 2020
Unmitigated Construction On-Site
ROG NOx CO SO2 Fugitive PM10
CO2e
Category tons/yr MT/yr
NBio- CO2 Total CO2 CH4 N2OFugitive PM2.5
Exhaust PM2.5
Off-Road 0.37 2.34 2.91 0.01 0.11 0.11 0.11 0.11 0.00 480.06 480.06 0.03 0.00 480.68
Total 0.37 2.34 2.91 0.01 0.11 0.11 0.00 480.680.11 0.11 0.00 480.06
Exhaust PM10
PM10 Total
480.06 0.03
PM2.5 Total
Bio- CO2
Unmitigated Construction Off-Site
ROG NOx CO SO2 Fugitive PM10
CO2e
Category tons/yr MT/yr
NBio- CO2 Total CO2 CH4 N2OFugitive PM2.5
Exhaust PM2.5
Hauling 0.00 0.00 0.00 0.00 0.00 0.00 0.00 0.00 0.00 0.00 0.00 0.00 0.00 0.00 0.00 0.00
Vendor 1.61 18.12 11.53 0.04 1.37 0.62 1.99 0.04 0.57 0.61 0.00 4,227.07 4,227.07 0.07 0.00 4,228.56
Worker 2.26 2.23 22.25 0.06 6.66 0.27 6.93 0.10 0.25 0.35 0.00 4,469.44 4,469.44 0.21 0.00 4,473.87
Total 3.87 20.35 33.78 0.10 8.03 0.89 8.92 0.14 0.00 8,702.430.82 0.96 0.00 8,696.51 8,696.51 0.28
Mitigated Construction On-Site
24 of 60
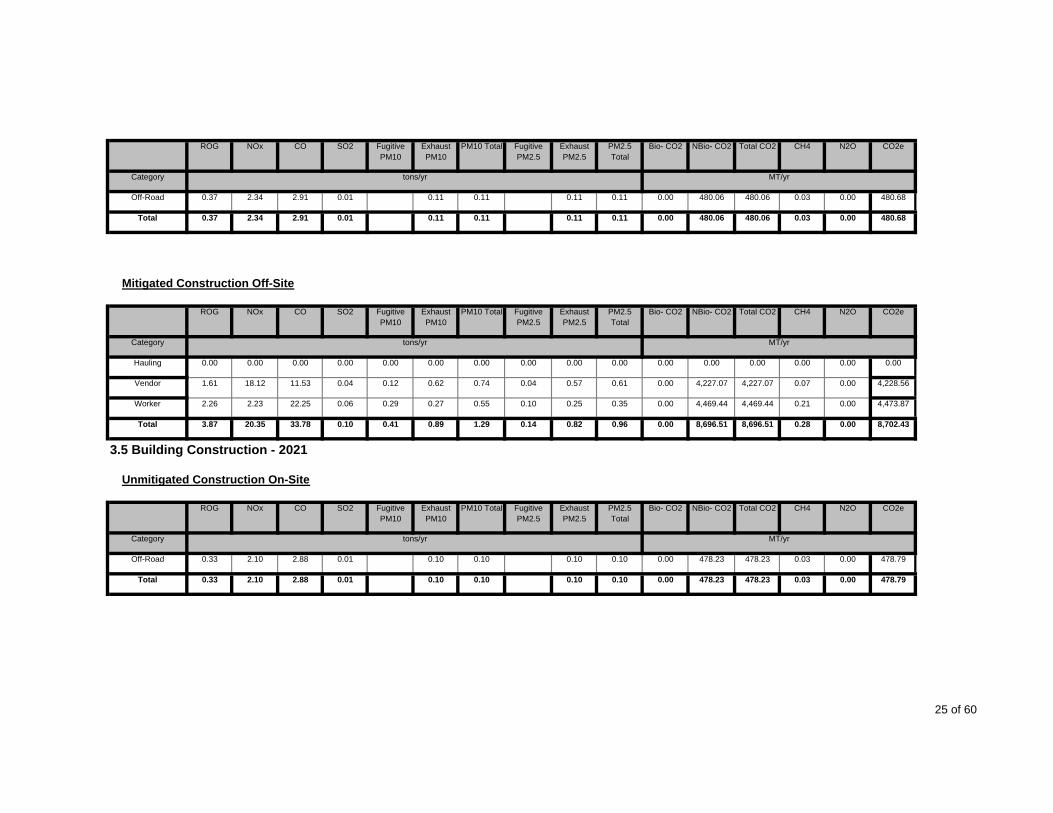
Exhaust PM10
PM10 Total PM2.5 Total
Bio- CO2ROG NOx CO SO2 Fugitive PM10
CO2e
Category tons/yr MT/yr
NBio- CO2 Total CO2 CH4 N2OFugitive PM2.5
Exhaust PM2.5
Off-Road 0.37 2.34 2.91 0.01 0.11 0.11 0.11 0.11 0.00 480.06 480.06 0.03 0.00 480.68
Total 0.37 2.34 2.91 0.01 0.11 0.11 0.00 480.680.11 0.11 0.00 480.06
Exhaust PM10
PM10 Total
480.06 0.03
PM2.5 Total
Bio- CO2
Mitigated Construction Off-Site
ROG NOx CO SO2 Fugitive PM10
CO2e
Category tons/yr MT/yr
NBio- CO2 Total CO2 CH4 N2OFugitive PM2.5
Exhaust PM2.5
Hauling 0.00 0.00 0.00 0.00 0.00 0.00 0.00 0.00 0.00 0.00 0.00 0.00 0.00 0.00 0.00 0.00
Vendor 1.61 18.12 11.53 0.04 0.12 0.62 0.74 0.04 0.57 0.61 0.00 4,227.07 4,227.07 0.07 0.00 4,228.56
Worker 2.26 2.23 22.25 0.06 0.29 0.27 0.55 0.10 0.25 0.35 0.00 4,469.44 4,469.44 0.21 0.00 4,473.87
Total 3.87 20.35 33.78 0.10 0.41 0.89 1.29 0.14 0.00 8,702.430.82 0.96 0.00 8,696.51
Exhaust PM10
PM10 Total
8,696.51 0.28
PM2.5 Total
Bio- CO2
3.5 Building Construction - 2021
Unmitigated Construction On-Site
ROG NOx CO SO2 Fugitive PM10
CO2e
Category tons/yr MT/yr
NBio- CO2 Total CO2 CH4 N2OFugitive PM2.5
Exhaust PM2.5
Off-Road 0.33 2.10 2.88 0.01 0.10 0.10 0.10 0.10 0.00 478.23 478.23 0.03 0.00 478.79
Total 0.33 2.10 2.88 0.01 0.10 0.10 0.00 478.790.10 0.10 0.00 478.23 478.23 0.03
25 of 60
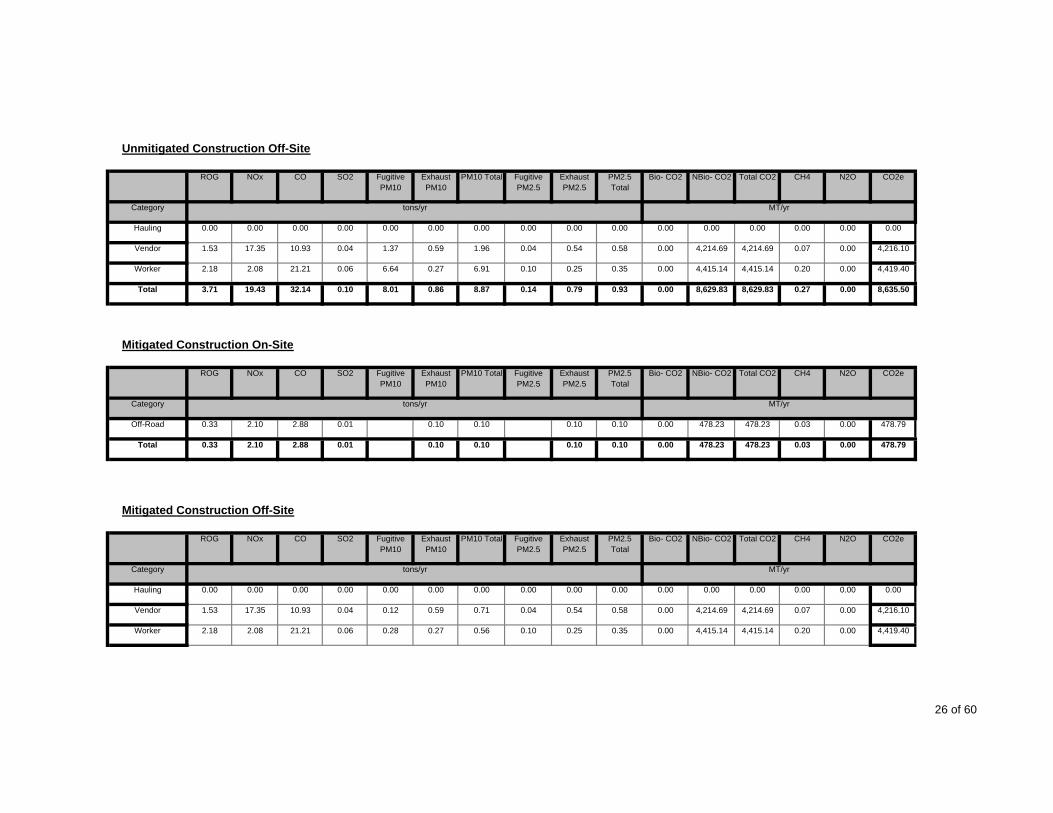
Exhaust PM10
PM10 Total PM2.5 Total
Bio- CO2
Unmitigated Construction Off-Site
ROG NOx CO SO2 Fugitive PM10
CO2e
Category tons/yr MT/yr
NBio- CO2 Total CO2 CH4 N2OFugitive PM2.5
Exhaust PM2.5
Hauling 0.00 0.00 0.00 0.00 0.00 0.00 0.00 0.00 0.00 0.00 0.00 0.00 0.00 0.00 0.00 0.00
Vendor 1.53 17.35 10.93 0.04 1.37 0.59 1.96 0.04 0.54 0.58 0.00 4,214.69 4,214.69 0.07 0.00 4,216.10
Worker 2.18 2.08 21.21 0.06 6.64 0.27 6.91 0.10 0.25 0.35 0.00 4,415.14 4,415.14 0.20 0.00 4,419.40
Total 3.71 19.43 32.14 0.10 8.01 0.86 8.87 0.14 0.00 8,635.500.79 0.93 0.00 8,629.83
Exhaust PM10
PM10 Total
8,629.83 0.27
PM2.5 Total
Bio- CO2
Mitigated Construction On-Site
ROG NOx CO SO2 Fugitive PM10
CO2e
Category tons/yr MT/yr
NBio- CO2 Total CO2 CH4 N2OFugitive PM2.5
Exhaust PM2.5
Off-Road 0.33 2.10 2.88 0.01 0.10 0.10 0.10 0.10 0.00 478.23 478.23 0.03 0.00 478.79
Total 0.33 2.10 2.88 0.01 0.10 0.10 0.00 478.790.10 0.10 0.00 478.23
Exhaust PM10
PM10 Total
478.23 0.03
PM2.5 Total
Bio- CO2
Mitigated Construction Off-Site
ROG NOx CO SO2 Fugitive PM10
CO2e
Category tons/yr MT/yr
NBio- CO2 Total CO2 CH4 N2OFugitive PM2.5
Exhaust PM2.5
Hauling 0.00 0.00 0.00 0.00 0.00 0.00 0.00 0.00 0.00 0.00 0.00 0.00 0.00 0.00 0.00 0.00
Vendor 1.53 17.35 10.93 0.04 0.12 0.59 0.71 0.04 0.54 0.58 0.00 4,214.69 4,214.69 0.07 0.00 4,216.10
Worker 2.18 2.08 21.21 0.06 0.28 0.27 0.56 0.10 0.25 0.35 0.00 4,415.14 4,415.14 0.20 0.00 4,419.40
26 of 60

Total 3.71 19.43 32.14 0.10 0.40 0.86 1.27 0.14 0.00 8,635.500.79 0.93 0.00 8,629.83
Exhaust PM10
PM10 Total
8,629.83 0.27
PM2.5 Total
Bio- CO2
3.5 Building Construction - 2022
Unmitigated Construction On-Site
ROG NOx CO SO2 Fugitive PM10
CO2e
Category tons/yr MT/yr
NBio- CO2 Total CO2 CH4 N2OFugitive PM2.5
Exhaust PM2.5
Off-Road 0.31 1.89 2.86 0.01 0.08 0.08 0.08 0.08 0.00 476.40 476.40 0.02 0.00 476.92
Total 0.31 1.89 2.86 0.01 0.08 0.08 0.00 476.920.08 0.08 0.00 476.40
Exhaust PM10
PM10 Total
476.40 0.02
PM2.5 Total
Bio- CO2
Unmitigated Construction Off-Site
ROG NOx CO SO2 Fugitive PM10
CO2e
Category tons/yr MT/yr
NBio- CO2 Total CO2 CH4 N2OFugitive PM2.5
Exhaust PM2.5
Hauling 0.00 0.00 0.00 0.00 0.00 0.00 0.00 0.00 0.00 0.00 0.00 0.00 0.00 0.00 0.00 0.00
Vendor 1.46 16.70 10.42 0.04 1.36 0.57 1.93 0.04 0.52 0.56 0.00 4,201.90 4,201.90 0.06 0.00 4,203.24
Worker 2.09 1.96 19.99 0.06 6.61 0.27 6.88 0.10 0.25 0.35 0.00 4,325.98 4,325.98 0.19 0.00 4,330.02
Total 3.55 18.66 30.41 0.10 7.97 0.84 8.81 0.14 0.00 8,533.260.77 0.91 0.00 8,527.88
Exhaust PM10
PM10 Total
8,527.88 0.25
PM2.5 Total
Bio- CO2
Mitigated Construction On-Site
ROG NOx CO SO2 Fugitive PM10
CO2e
Category tons/yr MT/yr
NBio- CO2 Total CO2 CH4 N2OFugitive PM2.5
Exhaust PM2.5
27 of 60

Off-Road 0.31 1.89 2.86 0.01 0.08 0.08 0.08 0.08 0.00 476.40 476.40 0.02 0.00 476.92
Total 0.31 1.89 2.86 0.01 0.08 0.08 0.00 476.920.08 0.08 0.00 476.40
Exhaust PM10
PM10 Total
476.40 0.02
PM2.5 Total
Bio- CO2
Mitigated Construction Off-Site
ROG NOx CO SO2 Fugitive PM10
CO2e
Category tons/yr MT/yr
NBio- CO2 Total CO2 CH4 N2OFugitive PM2.5
Exhaust PM2.5
Hauling 0.00 0.00 0.00 0.00 0.00 0.00 0.00 0.00 0.00 0.00 0.00 0.00 0.00 0.00 0.00 0.00
Vendor 1.46 16.70 10.42 0.04 0.12 0.57 0.69 0.04 0.52 0.56 0.00 4,201.90 4,201.90 0.06 0.00 4,203.24
Worker 2.09 1.96 19.99 0.06 0.28 0.27 0.55 0.10 0.25 0.35 0.00 4,325.98 4,325.98 0.19 0.00 4,330.02
Total 3.55 18.66 30.41 0.10 0.40 0.84 1.24 0.14 0.00 8,533.260.77 0.91 0.00 8,527.88
Exhaust PM10
PM10 Total
8,527.88 0.25
PM2.5 Total
Bio- CO2
3.5 Building Construction - 2023
Unmitigated Construction On-Site
ROG NOx CO SO2 Fugitive PM10
CO2e
Category tons/yr MT/yr
NBio- CO2 Total CO2 CH4 N2OFugitive PM2.5
Exhaust PM2.5
Off-Road 0.29 1.72 2.86 0.01 0.07 0.07 0.07 0.07 0.00 476.40 476.40 0.02 0.00 476.89
Total 0.29 1.72 2.86 0.01 0.07 0.07 0.00 476.890.07 0.07 0.00 476.40
Exhaust PM10
PM10 Total
476.40 0.02
PM2.5 Total
Bio- CO2
Unmitigated Construction Off-Site
ROG NOx CO SO2 Fugitive PM10
CO2eNBio- CO2 Total CO2 CH4 N2OFugitive PM2.5
Exhaust PM2.5
28 of 60

Category tons/yr MT/yr
Hauling 0.00 0.00 0.00 0.00 0.00 0.00 0.00 0.00 0.00 0.00 0.00 0.00 0.00 0.00 0.00 0.00
Vendor 1.41 16.21 10.04 0.04 1.36 0.56 1.92 0.04 0.51 0.55 0.00 4,204.95 4,204.95 0.06 0.00 4,206.25
Worker 2.01 1.83 18.90 0.06 6.61 0.27 6.88 0.10 0.25 0.35 0.00 4,259.82 4,259.82 0.18 0.00 4,263.69
Total 3.42 18.04 28.94 0.10 7.97 0.83 8.80 0.14 0.00 8,469.940.76 0.90 0.00 8,464.77
Exhaust PM10
PM10 Total
8,464.77 0.24
PM2.5 Total
Bio- CO2
Mitigated Construction On-Site
ROG NOx CO SO2 Fugitive PM10
CO2e
Category tons/yr MT/yr
NBio- CO2 Total CO2 CH4 N2OFugitive PM2.5
Exhaust PM2.5
Off-Road 0.29 1.72 2.86 0.01 0.07 0.07 0.07 0.07 0.00 476.40 476.40 0.02 0.00 476.89
Total 0.29 1.72 2.86 0.01 0.07 0.07 0.00 476.890.07 0.07 0.00 476.40
Exhaust PM10
PM10 Total
476.40 0.02
PM2.5 Total
Bio- CO2
Mitigated Construction Off-Site
ROG NOx CO SO2 Fugitive PM10
CO2e
Category tons/yr MT/yr
NBio- CO2 Total CO2 CH4 N2OFugitive PM2.5
Exhaust PM2.5
Hauling 0.00 0.00 0.00 0.00 0.00 0.00 0.00 0.00 0.00 0.00 0.00 0.00 0.00 0.00 0.00 0.00
Vendor 1.41 16.21 10.04 0.04 0.12 0.56 0.68 0.04 0.51 0.55 0.00 4,204.95 4,204.95 0.06 0.00 4,206.25
Worker 2.01 1.83 18.90 0.06 0.28 0.27 0.55 0.10 0.25 0.35 0.00 4,259.82 4,259.82 0.18 0.00 4,263.69
Total 3.42 18.04 28.94 0.10 0.40 0.83 1.23 0.14 0.00 8,469.940.76 0.90 0.00 8,464.77 8,464.77 0.24
3.5 Building Construction - 2024
29 of 60
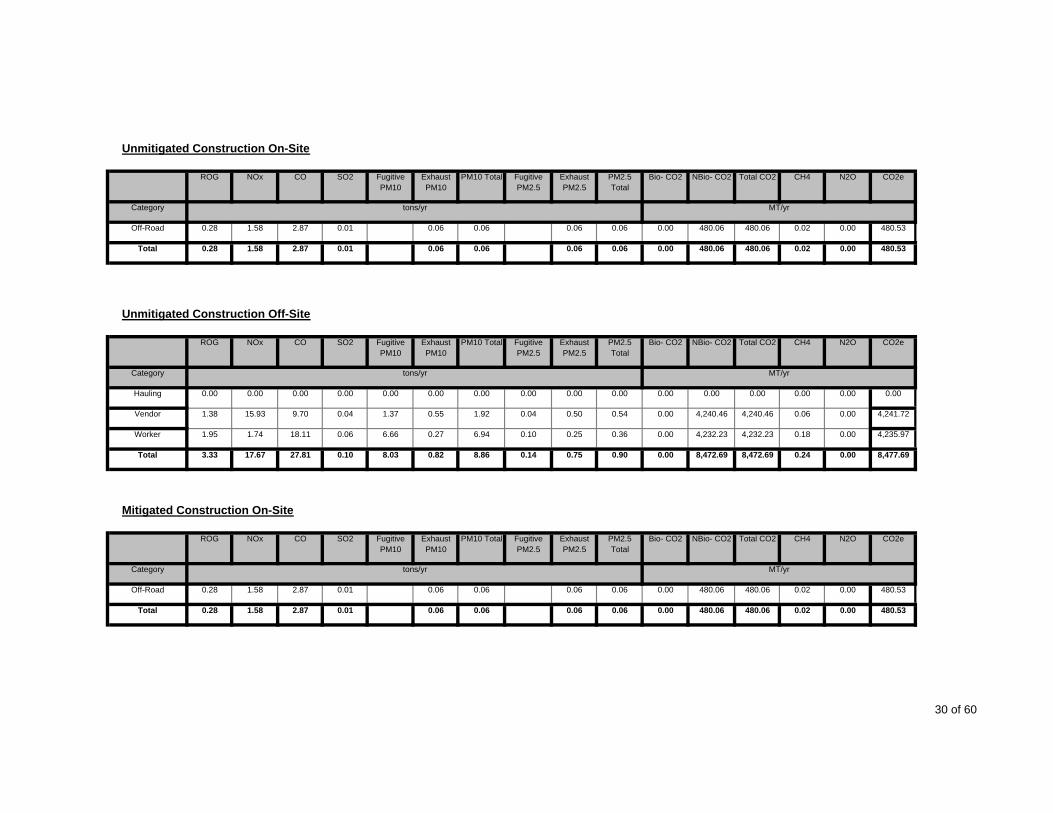
Exhaust PM10
PM10 Total PM2.5 Total
Bio- CO2
Unmitigated Construction On-Site
ROG NOx CO SO2 Fugitive PM10
CO2e
Category tons/yr MT/yr
NBio- CO2 Total CO2 CH4 N2OFugitive PM2.5
Exhaust PM2.5
Off-Road 0.28 1.58 2.87 0.01 0.06 0.06 0.06 0.06 0.00 480.06 480.06 0.02 0.00 480.53
Total 0.28 1.58 2.87 0.01 0.06 0.06 0.00 480.530.06 0.06 0.00 480.06
Exhaust PM10
PM10 Total
480.06 0.02
PM2.5 Total
Bio- CO2
Unmitigated Construction Off-Site
ROG NOx CO SO2 Fugitive PM10
CO2e
Category tons/yr MT/yr
NBio- CO2 Total CO2 CH4 N2OFugitive PM2.5
Exhaust PM2.5
Hauling 0.00 0.00 0.00 0.00 0.00 0.00 0.00 0.00 0.00 0.00 0.00 0.00 0.00 0.00 0.00 0.00
Vendor 1.38 15.93 9.70 0.04 1.37 0.55 1.92 0.04 0.50 0.54 0.00 4,240.46 4,240.46 0.06 0.00 4,241.72
Worker 1.95 1.74 18.11 0.06 6.66 0.27 6.94 0.10 0.25 0.36 0.00 4,232.23 4,232.23 0.18 0.00 4,235.97
Total 3.33 17.67 27.81 0.10 8.03 0.82 8.86 0.14 0.00 8,477.690.75 0.90 0.00 8,472.69
Exhaust PM10
PM10 Total
8,472.69 0.24
PM2.5 Total
Bio- CO2
Mitigated Construction On-Site
ROG NOx CO SO2 Fugitive PM10
CO2e
Category tons/yr MT/yr
NBio- CO2 Total CO2 CH4 N2OFugitive PM2.5
Exhaust PM2.5
Off-Road 0.28 1.58 2.87 0.01 0.06 0.06 0.06 0.06 0.00 480.06 480.06 0.02 0.00 480.53
Total 0.28 1.58 2.87 0.01 0.06 0.06 0.00 480.530.06 0.06 0.00 480.06 480.06 0.02
30 of 60

Exhaust PM10
PM10 Total PM2.5 Total
Bio- CO2
Mitigated Construction Off-Site
ROG NOx CO SO2 Fugitive PM10
CO2e
Category tons/yr MT/yr
NBio- CO2 Total CO2 CH4 N2OFugitive PM2.5
Exhaust PM2.5
Hauling 0.00 0.00 0.00 0.00 0.00 0.00 0.00 0.00 0.00 0.00 0.00 0.00 0.00 0.00 0.00 0.00
Vendor 1.38 15.93 9.70 0.04 0.12 0.55 0.67 0.04 0.50 0.54 0.00 4,240.46 4,240.46 0.06 0.00 4,241.72
Worker 1.95 1.74 18.11 0.06 0.29 0.27 0.56 0.10 0.25 0.36 0.00 4,232.23 4,232.23 0.18 0.00 4,235.97
Total 3.33 17.67 27.81 0.10 0.41 0.82 1.23 0.14 0.00 8,477.690.75 0.90 0.00 8,472.69
Exhaust PM10
PM10 Total
8,472.69 0.24
PM2.5 Total
Bio- CO2
3.5 Building Construction - 2025
Unmitigated Construction On-Site
ROG NOx CO SO2 Fugitive PM10
CO2e
Category tons/yr MT/yr
NBio- CO2 Total CO2 CH4 N2OFugitive PM2.5
Exhaust PM2.5
Off-Road 0.26 1.44 2.86 0.01 0.05 0.05 0.05 0.05 0.00 478.23 478.23 0.02 0.00 478.66
Total 0.26 1.44 2.86 0.01 0.05 0.05 0.00 478.660.05 0.05 0.00 478.23
Exhaust PM10
PM10 Total
478.23 0.02
PM2.5 Total
Bio- CO2
Unmitigated Construction Off-Site
ROG NOx CO SO2 Fugitive PM10
CO2e
Category tons/yr MT/yr
NBio- CO2 Total CO2 CH4 N2OFugitive PM2.5
Exhaust PM2.5
Hauling 0.00 0.00 0.00 0.00 0.00 0.00 0.00 0.00 0.00 0.00 0.00 0.00 0.00 0.00 0.00 0.00
31 of 60
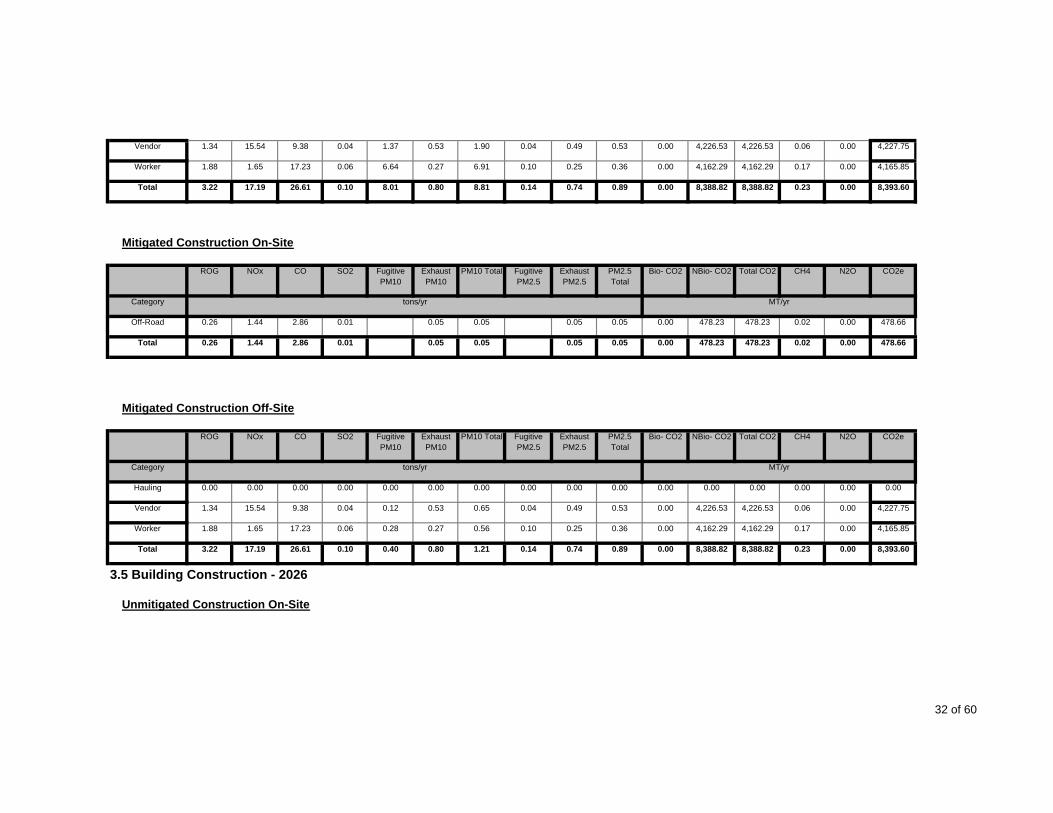
Vendor 1.34 15.54 9.38 0.04 1.37 0.53 1.90 0.04 0.49 0.53 0.00 4,226.53 4,226.53 0.06 0.00 4,227.75
Worker 1.88 1.65 17.23 0.06 6.64 0.27 6.91 0.10 0.25 0.36 0.00 4,162.29 4,162.29 0.17 0.00 4,165.85
Total 3.22 17.19 26.61 0.10 8.01 0.80 8.81 0.14 0.00 8,393.600.74 0.89 0.00 8,388.82
Exhaust PM10
PM10 Total
8,388.82 0.23
PM2.5 Total
Bio- CO2
Mitigated Construction On-Site
ROG NOx CO SO2 Fugitive PM10
CO2e
Category tons/yr MT/yr
NBio- CO2 Total CO2 CH4 N2OFugitive PM2.5
Exhaust PM2.5
Off-Road 0.26 1.44 2.86 0.01 0.05 0.05 0.05 0.05 0.00 478.23 478.23 0.02 0.00 478.66
Total 0.26 1.44 2.86 0.01 0.05 0.05 0.00 478.660.05 0.05 0.00 478.23
Exhaust PM10
PM10 Total
478.23 0.02
PM2.5 Total
Bio- CO2
Mitigated Construction Off-Site
ROG NOx CO SO2 Fugitive PM10
CO2e
Category tons/yr MT/yr
NBio- CO2 Total CO2 CH4 N2OFugitive PM2.5
Exhaust PM2.5
Hauling 0.00 0.00 0.00 0.00 0.00 0.00 0.00 0.00 0.00 0.00 0.00 0.00 0.00 0.00 0.00 0.00
Vendor 1.34 15.54 9.38 0.04 0.12 0.53 0.65 0.04 0.49 0.53 0.00 4,226.53 4,226.53 0.06 0.00 4,227.75
Worker 1.88 1.65 17.23 0.06 0.28 0.27 0.56 0.10 0.25 0.36 0.00 4,162.29 4,162.29 0.17 0.00 4,165.85
Total 3.22 17.19 26.61 0.10 0.40 0.80 1.21 0.14 0.00 8,393.600.74 0.89 0.00 8,388.82 8,388.82 0.23
3.5 Building Construction - 2026
Unmitigated Construction On-Site
32 of 60

Exhaust PM10
PM10 Total PM2.5 Total
Bio- CO2ROG NOx CO SO2 Fugitive PM10
CO2e
Category tons/yr MT/yr
NBio- CO2 Total CO2 CH4 N2OFugitive PM2.5
Exhaust PM2.5
Off-Road 0.26 1.44 2.86 0.01 0.05 0.05 0.05 0.05 0.00 478.23 478.23 0.02 0.00 478.66
Total 0.26 1.44 2.86 0.01 0.05 0.05 0.00 478.660.05 0.05 0.00 478.23
Exhaust PM10
PM10 Total
478.23 0.02
PM2.5 Total
Bio- CO2
Unmitigated Construction Off-Site
ROG NOx CO SO2 Fugitive PM10
CO2e
Category tons/yr MT/yr
NBio- CO2 Total CO2 CH4 N2OFugitive PM2.5
Exhaust PM2.5
Hauling 0.00 0.00 0.00 0.00 0.00 0.00 0.00 0.00 0.00 0.00 0.00 0.00 0.00 0.00 0.00 0.00
Vendor 1.34 15.54 9.38 0.04 1.37 0.53 1.90 0.04 0.49 0.53 0.00 4,226.53 4,226.53 0.06 0.00 4,227.75
Worker 1.88 1.65 17.23 0.06 6.64 0.27 6.91 0.10 0.25 0.36 0.00 4,162.29 4,162.29 0.17 0.00 4,165.85
Total 3.22 17.19 26.61 0.10 8.01 0.80 8.81 0.14 0.00 8,393.600.74 0.89 0.00 8,388.82
Exhaust PM10
PM10 Total
8,388.82 0.23
PM2.5 Total
Bio- CO2
Mitigated Construction On-Site
ROG NOx CO SO2 Fugitive PM10
CO2e
Category tons/yr MT/yr
NBio- CO2 Total CO2 CH4 N2OFugitive PM2.5
Exhaust PM2.5
Off-Road 0.26 1.44 2.86 0.01 0.05 0.05 0.05 0.05 0.00 478.23 478.23 0.02 0.00 478.66
Total 0.26 1.44 2.86 0.01 0.05 0.05 0.00 478.660.05 0.05 0.00 478.23 478.23 0.02
33 of 60

Exhaust PM10
PM10 Total PM2.5 Total
Bio- CO2
Mitigated Construction Off-Site
ROG NOx CO SO2 Fugitive PM10
CO2e
Category tons/yr MT/yr
NBio- CO2 Total CO2 CH4 N2OFugitive PM2.5
Exhaust PM2.5
Hauling 0.00 0.00 0.00 0.00 0.00 0.00 0.00 0.00 0.00 0.00 0.00 0.00 0.00 0.00 0.00 0.00
Vendor 1.34 15.54 9.38 0.04 0.12 0.53 0.65 0.04 0.49 0.53 0.00 4,226.53 4,226.53 0.06 0.00 4,227.75
Worker 1.88 1.65 17.23 0.06 0.28 0.27 0.56 0.10 0.25 0.36 0.00 4,162.29 4,162.29 0.17 0.00 4,165.85
Total 3.22 17.19 26.61 0.10 0.40 0.80 1.21 0.14 0.00 8,393.600.74 0.89 0.00 8,388.82
Exhaust PM10
PM10 Total
8,388.82 0.23
PM2.5 Total
Bio- CO2
3.5 Building Construction - 2027
Unmitigated Construction On-Site
ROG NOx CO SO2 Fugitive PM10
CO2e
Category tons/yr MT/yr
NBio- CO2 Total CO2 CH4 N2OFugitive PM2.5
Exhaust PM2.5
Off-Road 0.26 1.44 2.86 0.01 0.05 0.05 0.05 0.05 0.00 478.23 478.23 0.02 0.00 478.66
Total 0.26 1.44 2.86 0.01 0.05 0.05 0.00 478.660.05 0.05 0.00 478.23
Exhaust PM10
PM10 Total
478.23 0.02
PM2.5 Total
Bio- CO2
Unmitigated Construction Off-Site
ROG NOx CO SO2 Fugitive PM10
CO2e
Category tons/yr MT/yr
NBio- CO2 Total CO2 CH4 N2OFugitive PM2.5
Exhaust PM2.5
Hauling 0.00 0.00 0.00 0.00 0.00 0.00 0.00 0.00 0.00 0.00 0.00 0.00 0.00 0.00 0.00 0.00
Vendor 1.34 15.54 9.38 0.04 1.37 0.53 1.90 0.04 0.49 0.53 0.00 4,226.53 4,226.53 0.06 0.00 4,227.75
Worker 1.88 1.65 17.23 0.06 6.64 0.27 6.91 0.10 0.25 0.36 0.00 4,162.29 4,162.29 0.17 0.00 4,165.85
34 of 60
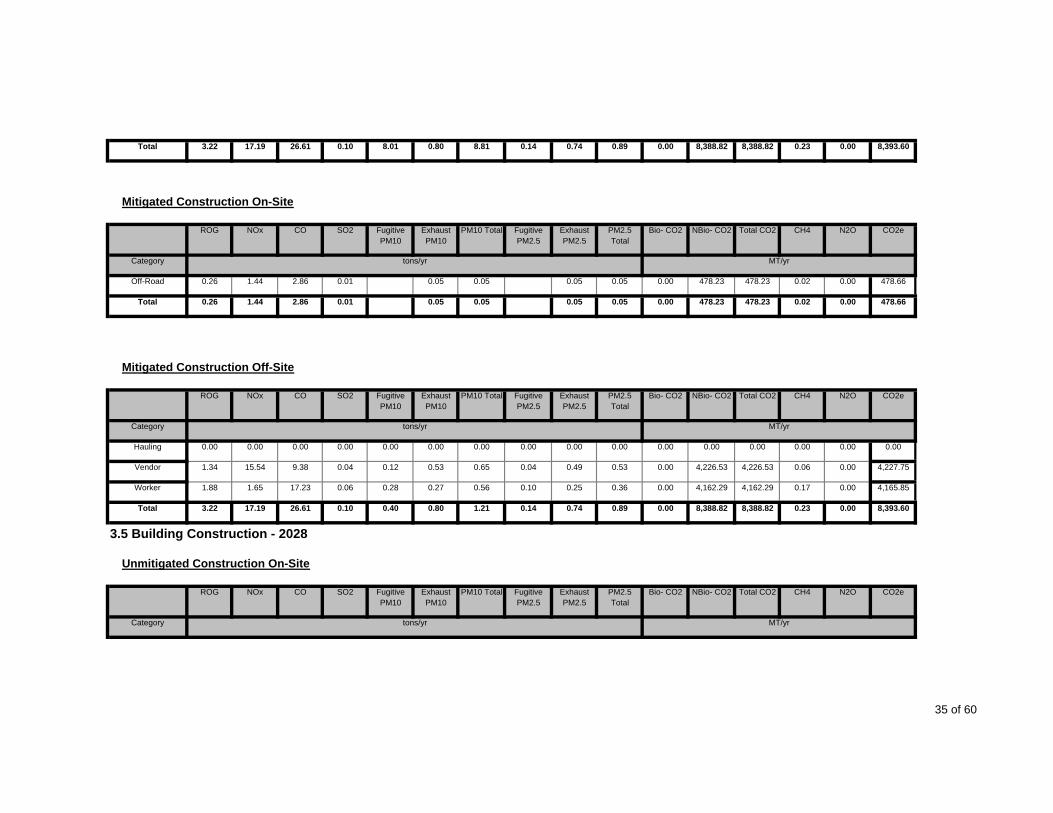
Total 3.22 17.19 26.61 0.10 8.01 0.80 8.81 0.14 0.00 8,393.600.74 0.89 0.00 8,388.82
Exhaust PM10
PM10 Total
8,388.82 0.23
PM2.5 Total
Bio- CO2
Mitigated Construction On-Site
ROG NOx CO SO2 Fugitive PM10
CO2e
Category tons/yr MT/yr
NBio- CO2 Total CO2 CH4 N2OFugitive PM2.5
Exhaust PM2.5
Off-Road 0.26 1.44 2.86 0.01 0.05 0.05 0.05 0.05 0.00 478.23 478.23 0.02 0.00 478.66
Total 0.26 1.44 2.86 0.01 0.05 0.05 0.00 478.660.05 0.05 0.00 478.23
Exhaust PM10
PM10 Total
478.23 0.02
PM2.5 Total
Bio- CO2
Mitigated Construction Off-Site
ROG NOx CO SO2 Fugitive PM10
CO2e
Category tons/yr MT/yr
NBio- CO2 Total CO2 CH4 N2OFugitive PM2.5
Exhaust PM2.5
Hauling 0.00 0.00 0.00 0.00 0.00 0.00 0.00 0.00 0.00 0.00 0.00 0.00 0.00 0.00 0.00 0.00
Vendor 1.34 15.54 9.38 0.04 0.12 0.53 0.65 0.04 0.49 0.53 0.00 4,226.53 4,226.53 0.06 0.00 4,227.75
Worker 1.88 1.65 17.23 0.06 0.28 0.27 0.56 0.10 0.25 0.36 0.00 4,162.29 4,162.29 0.17 0.00 4,165.85
Total 3.22 17.19 26.61 0.10 0.40 0.80 1.21 0.14 0.00 8,393.600.74 0.89 0.00 8,388.82
Exhaust PM10
PM10 Total
8,388.82 0.23
PM2.5 Total
Bio- CO2
3.5 Building Construction - 2028
Unmitigated Construction On-Site
ROG NOx CO SO2 Fugitive PM10
CO2e
Category tons/yr MT/yr
NBio- CO2 Total CO2 CH4 N2OFugitive PM2.5
Exhaust PM2.5
35 of 60

Off-Road 0.26 1.44 2.85 0.01 0.05 0.05 0.05 0.05 0.00 476.40 476.40 0.02 0.00 476.83
Total 0.26 1.44 2.85 0.01 0.05 0.05 0.00 476.830.05 0.05 0.00 476.40
Exhaust PM10
PM10 Total
476.40 0.02
PM2.5 Total
Bio- CO2
Unmitigated Construction Off-Site
ROG NOx CO SO2 Fugitive PM10
CO2e
Category tons/yr MT/yr
NBio- CO2 Total CO2 CH4 N2OFugitive PM2.5
Exhaust PM2.5
Hauling 0.00 0.00 0.00 0.00 0.00 0.00 0.00 0.00 0.00 0.00 0.00 0.00 0.00 0.00 0.00 0.00
Vendor 1.33 15.48 9.35 0.04 1.36 0.53 1.90 0.04 0.49 0.53 0.00 4,210.34 4,210.34 0.06 0.00 4,211.56
Worker 1.87 1.64 17.17 0.06 6.61 0.27 6.88 0.10 0.25 0.35 0.00 4,146.35 4,146.35 0.17 0.00 4,149.89
Total 3.20 17.12 26.52 0.10 7.97 0.80 8.78 0.14 0.00 8,361.450.74 0.88 0.00 8,356.69
Exhaust PM10
PM10 Total
8,356.69 0.23
PM2.5 Total
Bio- CO2
Mitigated Construction On-Site
ROG NOx CO SO2 Fugitive PM10
CO2e
Category tons/yr MT/yr
NBio- CO2 Total CO2 CH4 N2OFugitive PM2.5
Exhaust PM2.5
Off-Road 0.26 1.44 2.85 0.01 0.05 0.05 0.05 0.05 0.00 476.40 476.40 0.02 0.00 476.83
Total 0.26 1.44 2.85 0.01 0.05 0.05 0.00 476.830.05 0.05 0.00 476.40
Exhaust PM10
PM10 Total
476.40 0.02
PM2.5 Total
Bio- CO2
Mitigated Construction Off-Site
ROG NOx CO SO2 Fugitive PM10
CO2eNBio- CO2 Total CO2 CH4 N2OFugitive PM2.5
Exhaust PM2.5
36 of 60

Category tons/yr MT/yr
Hauling 0.00 0.00 0.00 0.00 0.00 0.00 0.00 0.00 0.00 0.00 0.00 0.00 0.00 0.00 0.00 0.00
Vendor 1.33 15.48 9.35 0.04 0.12 0.53 0.65 0.04 0.49 0.53 0.00 4,210.34 4,210.34 0.06 0.00 4,211.56
Worker 1.87 1.64 17.17 0.06 0.28 0.27 0.55 0.10 0.25 0.35 0.00 4,146.35 4,146.35 0.17 0.00 4,149.89
Total 3.20 17.12 26.52 0.10 0.40 0.80 1.20 0.14 0.00 8,361.450.74 0.88 0.00 8,356.69
Exhaust PM10
PM10 Total
8,356.69 0.23
PM2.5 Total
Bio- CO2
3.5 Building Construction - 2029
Unmitigated Construction On-Site
ROG NOx CO SO2 Fugitive PM10
CO2e
Category tons/yr MT/yr
NBio- CO2 Total CO2 CH4 N2OFugitive PM2.5
Exhaust PM2.5
Off-Road 0.26 1.44 2.86 0.01 0.05 0.05 0.05 0.05 0.00 478.23 478.23 0.02 0.00 478.66
Total 0.26 1.44 2.86 0.01 0.05 0.05 0.00 478.660.05 0.05 0.00 478.23
Exhaust PM10
PM10 Total
478.23 0.02
PM2.5 Total
Bio- CO2
Unmitigated Construction Off-Site
ROG NOx CO SO2 Fugitive PM10
CO2e
Category tons/yr MT/yr
NBio- CO2 Total CO2 CH4 N2OFugitive PM2.5
Exhaust PM2.5
Hauling 0.00 0.00 0.00 0.00 0.00 0.00 0.00 0.00 0.00 0.00 0.00 0.00 0.00 0.00 0.00 0.00
Vendor 1.34 15.54 9.38 0.04 1.37 0.53 1.90 0.04 0.49 0.53 0.00 4,226.53 4,226.53 0.06 0.00 4,227.75
Worker 1.88 1.65 17.23 0.06 6.64 0.27 6.91 0.10 0.25 0.36 0.00 4,162.29 4,162.29 0.17 0.00 4,165.85
Total 3.22 17.19 26.61 0.10 8.01 0.80 8.81 0.14 0.00 8,393.600.74 0.89 0.00 8,388.82 8,388.82 0.23
37 of 60

Exhaust PM10
PM10 Total PM2.5 Total
Bio- CO2
Mitigated Construction On-Site
ROG NOx CO SO2 Fugitive PM10
CO2e
Category tons/yr MT/yr
NBio- CO2 Total CO2 CH4 N2OFugitive PM2.5
Exhaust PM2.5
Off-Road 0.26 1.44 2.86 0.01 0.05 0.05 0.05 0.05 0.00 478.23 478.23 0.02 0.00 478.66
Total 0.26 1.44 2.86 0.01 0.05 0.05 0.00 478.660.05 0.05 0.00 478.23
Exhaust PM10
PM10 Total
478.23 0.02
PM2.5 Total
Bio- CO2
Mitigated Construction Off-Site
ROG NOx CO SO2 Fugitive PM10
CO2e
Category tons/yr MT/yr
NBio- CO2 Total CO2 CH4 N2OFugitive PM2.5
Exhaust PM2.5
Hauling 0.00 0.00 0.00 0.00 0.00 0.00 0.00 0.00 0.00 0.00 0.00 0.00 0.00 0.00 0.00 0.00
Vendor 1.34 15.54 9.38 0.04 0.12 0.53 0.65 0.04 0.49 0.53 0.00 4,226.53 4,226.53 0.06 0.00 4,227.75
Worker 1.88 1.65 17.23 0.06 0.28 0.27 0.56 0.10 0.25 0.36 0.00 4,162.29 4,162.29 0.17 0.00 4,165.85
Total 3.22 17.19 26.61 0.10 0.40 0.80 1.21 0.14 0.00 8,393.600.74 0.89 0.00 8,388.82
Exhaust PM10
PM10 Total
8,388.82 0.23
PM2.5 Total
Bio- CO2
3.5 Building Construction - 2030
Unmitigated Construction On-Site
ROG NOx CO SO2 Fugitive PM10
CO2e
Category tons/yr MT/yr
NBio- CO2 Total CO2 CH4 N2OFugitive PM2.5
Exhaust PM2.5
Off-Road 0.22 1.05 2.85 0.01 0.02 0.02 0.02 0.02 0.00 478.23 478.23 0.02 0.00 478.60
Total 0.22 1.05 2.85 0.01 0.02 0.02 0.00 478.600.02 0.02 0.00 478.23 478.23 0.02
38 of 60
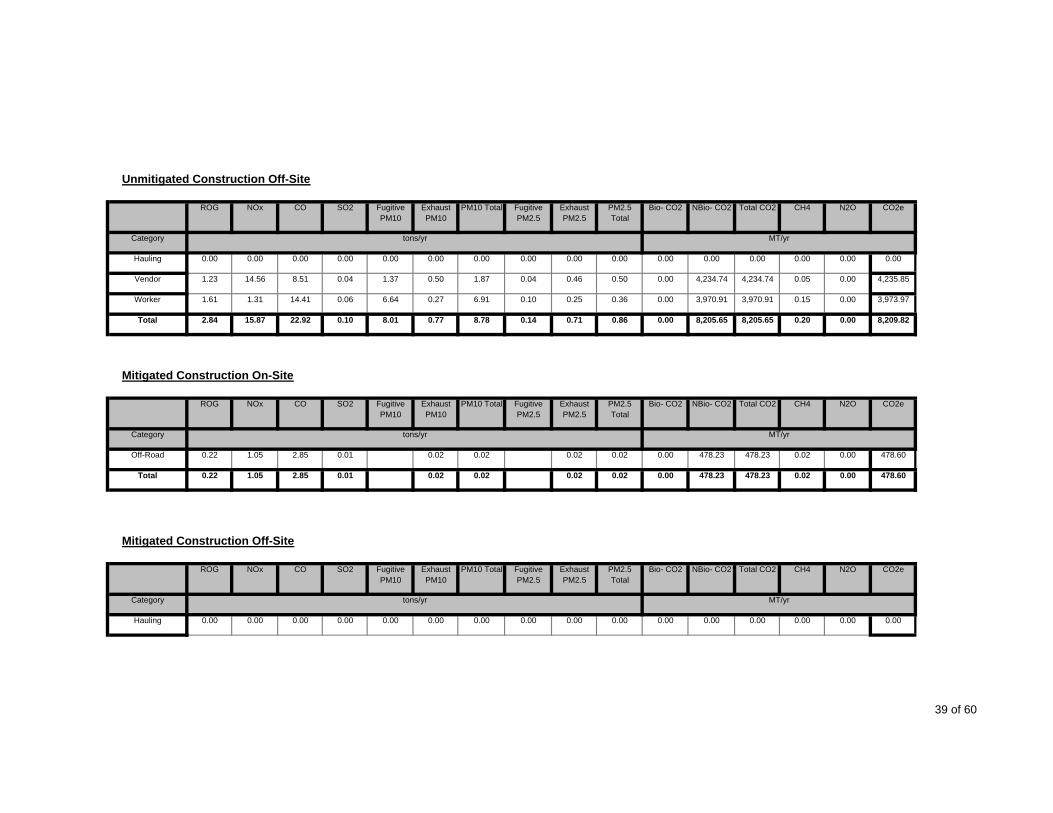
Exhaust PM10
PM10 Total PM2.5 Total
Bio- CO2
Unmitigated Construction Off-Site
ROG NOx CO SO2 Fugitive PM10
CO2e
Category tons/yr MT/yr
NBio- CO2 Total CO2 CH4 N2OFugitive PM2.5
Exhaust PM2.5
Hauling 0.00 0.00 0.00 0.00 0.00 0.00 0.00 0.00 0.00 0.00 0.00 0.00 0.00 0.00 0.00 0.00
Vendor 1.23 14.56 8.51 0.04 1.37 0.50 1.87 0.04 0.46 0.50 0.00 4,234.74 4,234.74 0.05 0.00 4,235.85
Worker 1.61 1.31 14.41 0.06 6.64 0.27 6.91 0.10 0.25 0.36 0.00 3,970.91 3,970.91 0.15 0.00 3,973.97
Total 2.84 15.87 22.92 0.10 8.01 0.77 8.78 0.14 0.00 8,209.820.71 0.86 0.00 8,205.65
Exhaust PM10
PM10 Total
8,205.65 0.20
PM2.5 Total
Bio- CO2
Mitigated Construction On-Site
ROG NOx CO SO2 Fugitive PM10
CO2e
Category tons/yr MT/yr
NBio- CO2 Total CO2 CH4 N2OFugitive PM2.5
Exhaust PM2.5
Off-Road 0.22 1.05 2.85 0.01 0.02 0.02 0.02 0.02 0.00 478.23 478.23 0.02 0.00 478.60
Total 0.22 1.05 2.85 0.01 0.02 0.02 0.00 478.600.02 0.02 0.00 478.23
Exhaust PM10
PM10 Total
478.23 0.02
PM2.5 Total
Bio- CO2
Mitigated Construction Off-Site
ROG NOx CO SO2 Fugitive PM10
CO2e
Category tons/yr MT/yr
NBio- CO2 Total CO2 CH4 N2OFugitive PM2.5
Exhaust PM2.5
Hauling 0.00 0.00 0.00 0.00 0.00 0.00 0.00 0.00 0.00 0.00 0.00 0.00 0.00 0.00 0.00 0.00
39 of 60
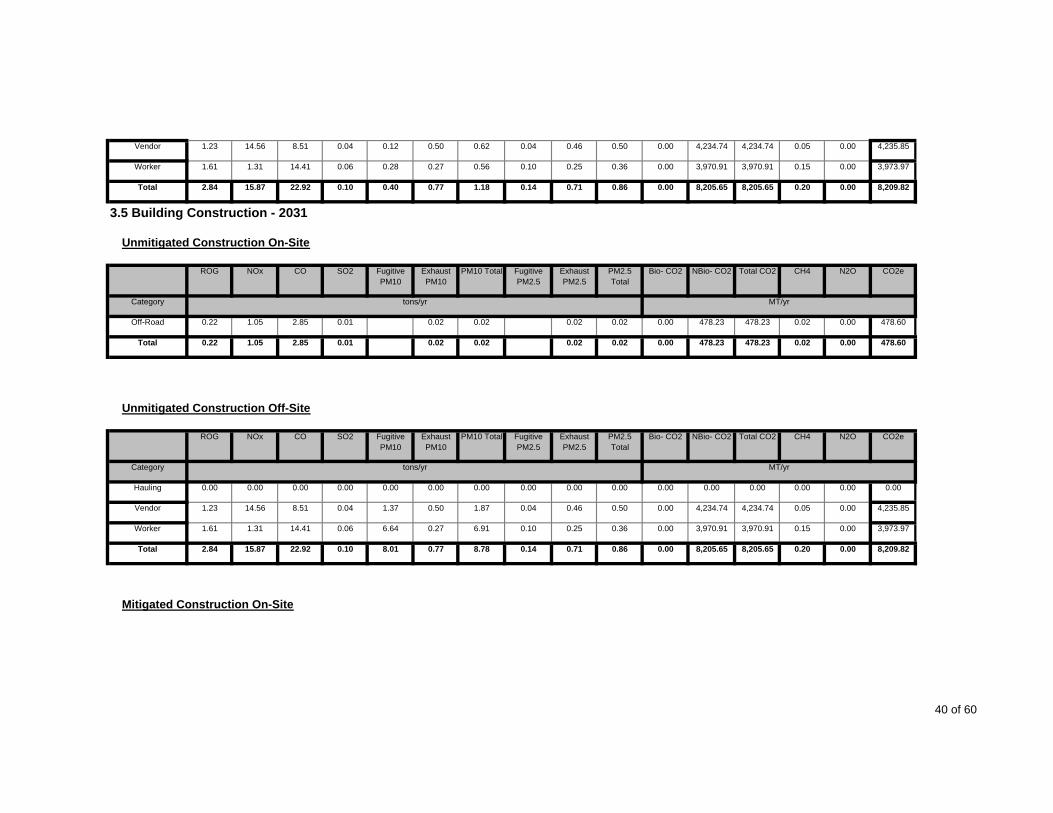
Vendor 1.23 14.56 8.51 0.04 0.12 0.50 0.62 0.04 0.46 0.50 0.00 4,234.74 4,234.74 0.05 0.00 4,235.85
Worker 1.61 1.31 14.41 0.06 0.28 0.27 0.56 0.10 0.25 0.36 0.00 3,970.91 3,970.91 0.15 0.00 3,973.97
Total 2.84 15.87 22.92 0.10 0.40 0.77 1.18 0.14 0.00 8,209.820.71 0.86 0.00 8,205.65
Exhaust PM10
PM10 Total
8,205.65 0.20
PM2.5 Total
Bio- CO2
3.5 Building Construction - 2031
Unmitigated Construction On-Site
ROG NOx CO SO2 Fugitive PM10
CO2e
Category tons/yr MT/yr
NBio- CO2 Total CO2 CH4 N2OFugitive PM2.5
Exhaust PM2.5
Off-Road 0.22 1.05 2.85 0.01 0.02 0.02 0.02 0.02 0.00 478.23 478.23 0.02 0.00 478.60
Total 0.22 1.05 2.85 0.01 0.02 0.02 0.00 478.600.02 0.02 0.00 478.23
Exhaust PM10
PM10 Total
478.23 0.02
PM2.5 Total
Bio- CO2
Unmitigated Construction Off-Site
ROG NOx CO SO2 Fugitive PM10
CO2e
Category tons/yr MT/yr
NBio- CO2 Total CO2 CH4 N2OFugitive PM2.5
Exhaust PM2.5
Hauling 0.00 0.00 0.00 0.00 0.00 0.00 0.00 0.00 0.00 0.00 0.00 0.00 0.00 0.00 0.00 0.00
Vendor 1.23 14.56 8.51 0.04 1.37 0.50 1.87 0.04 0.46 0.50 0.00 4,234.74 4,234.74 0.05 0.00 4,235.85
Worker 1.61 1.31 14.41 0.06 6.64 0.27 6.91 0.10 0.25 0.36 0.00 3,970.91 3,970.91 0.15 0.00 3,973.97
Total 2.84 15.87 22.92 0.10 8.01 0.77 8.78 0.14 0.00 8,209.820.71 0.86 0.00 8,205.65 8,205.65 0.20
Mitigated Construction On-Site
40 of 60

Exhaust PM10
PM10 Total PM2.5 Total
Bio- CO2ROG NOx CO SO2 Fugitive PM10
CO2e
Category tons/yr MT/yr
NBio- CO2 Total CO2 CH4 N2OFugitive PM2.5
Exhaust PM2.5
Off-Road 0.22 1.05 2.85 0.01 0.02 0.02 0.02 0.02 0.00 478.23 478.23 0.02 0.00 478.60
Total 0.22 1.05 2.85 0.01 0.02 0.02 0.00 478.600.02 0.02 0.00 478.23
Exhaust PM10
PM10 Total
478.23 0.02
PM2.5 Total
Bio- CO2
Mitigated Construction Off-Site
ROG NOx CO SO2 Fugitive PM10
CO2e
Category tons/yr MT/yr
NBio- CO2 Total CO2 CH4 N2OFugitive PM2.5
Exhaust PM2.5
Hauling 0.00 0.00 0.00 0.00 0.00 0.00 0.00 0.00 0.00 0.00 0.00 0.00 0.00 0.00 0.00 0.00
Vendor 1.23 14.56 8.51 0.04 0.12 0.50 0.62 0.04 0.46 0.50 0.00 4,234.74 4,234.74 0.05 0.00 4,235.85
Worker 1.61 1.31 14.41 0.06 0.28 0.27 0.56 0.10 0.25 0.36 0.00 3,970.91 3,970.91 0.15 0.00 3,973.97
Total 2.84 15.87 22.92 0.10 0.40 0.77 1.18 0.14 0.00 8,209.820.71 0.86 0.00 8,205.65
Exhaust PM10
PM10 Total
8,205.65 0.20
PM2.5 Total
Bio- CO2
3.5 Building Construction - 2032
Unmitigated Construction On-Site
ROG NOx CO SO2 Fugitive PM10
CO2e
Category tons/yr MT/yr
NBio- CO2 Total CO2 CH4 N2OFugitive PM2.5
Exhaust PM2.5
Off-Road 0.10 0.47 1.28 0.00 0.01 0.01 0.01 0.01 0.00 214.38 214.38 0.01 0.00 214.54
Total 0.10 0.47 1.28 0.00 0.01 0.01 0.00 214.540.01 0.01 0.00 214.38 214.38 0.01
41 of 60

Exhaust PM10
PM10 Total PM2.5 Total
Bio- CO2
Unmitigated Construction Off-Site
ROG NOx CO SO2 Fugitive PM10
CO2e
Category tons/yr MT/yr
NBio- CO2 Total CO2 CH4 N2OFugitive PM2.5
Exhaust PM2.5
Hauling 0.00 0.00 0.00 0.00 0.00 0.00 0.00 0.00 0.00 0.00 0.00 0.00 0.00 0.00 0.00 0.00
Vendor 0.55 6.53 3.81 0.02 0.61 0.23 0.84 0.02 0.21 0.22 0.00 1,898.33 1,898.33 0.02 0.00 1,898.83
Worker 0.72 0.59 6.46 0.03 2.98 0.12 3.10 0.05 0.11 0.16 0.00 1,780.06 1,780.06 0.07 0.00 1,781.43
Total 1.27 7.12 10.27 0.05 3.59 0.35 3.94 0.07 0.00 3,680.260.32 0.38 0.00 3,678.39
Exhaust PM10
PM10 Total
3,678.39 0.09
PM2.5 Total
Bio- CO2
Mitigated Construction On-Site
ROG NOx CO SO2 Fugitive PM10
CO2e
Category tons/yr MT/yr
NBio- CO2 Total CO2 CH4 N2OFugitive PM2.5
Exhaust PM2.5
Off-Road 0.10 0.47 1.28 0.00 0.01 0.01 0.01 0.01 0.00 214.38 214.38 0.01 0.00 214.54
Total 0.10 0.47 1.28 0.00 0.01 0.01 0.00 214.540.01 0.01 0.00 214.38
Exhaust PM10
PM10 Total
214.38 0.01
PM2.5 Total
Bio- CO2
Mitigated Construction Off-Site
ROG NOx CO SO2 Fugitive PM10
CO2e
Category tons/yr MT/yr
NBio- CO2 Total CO2 CH4 N2OFugitive PM2.5
Exhaust PM2.5
Hauling 0.00 0.00 0.00 0.00 0.00 0.00 0.00 0.00 0.00 0.00 0.00 0.00 0.00 0.00 0.00 0.00
Vendor 0.55 6.53 3.81 0.02 0.05 0.23 0.28 0.02 0.21 0.22 0.00 1,898.33 1,898.33 0.02 0.00 1,898.83
Worker 0.72 0.59 6.46 0.03 0.13 0.12 0.25 0.05 0.11 0.16 0.00 1,780.06 1,780.06 0.07 0.00 1,781.43
42 of 60
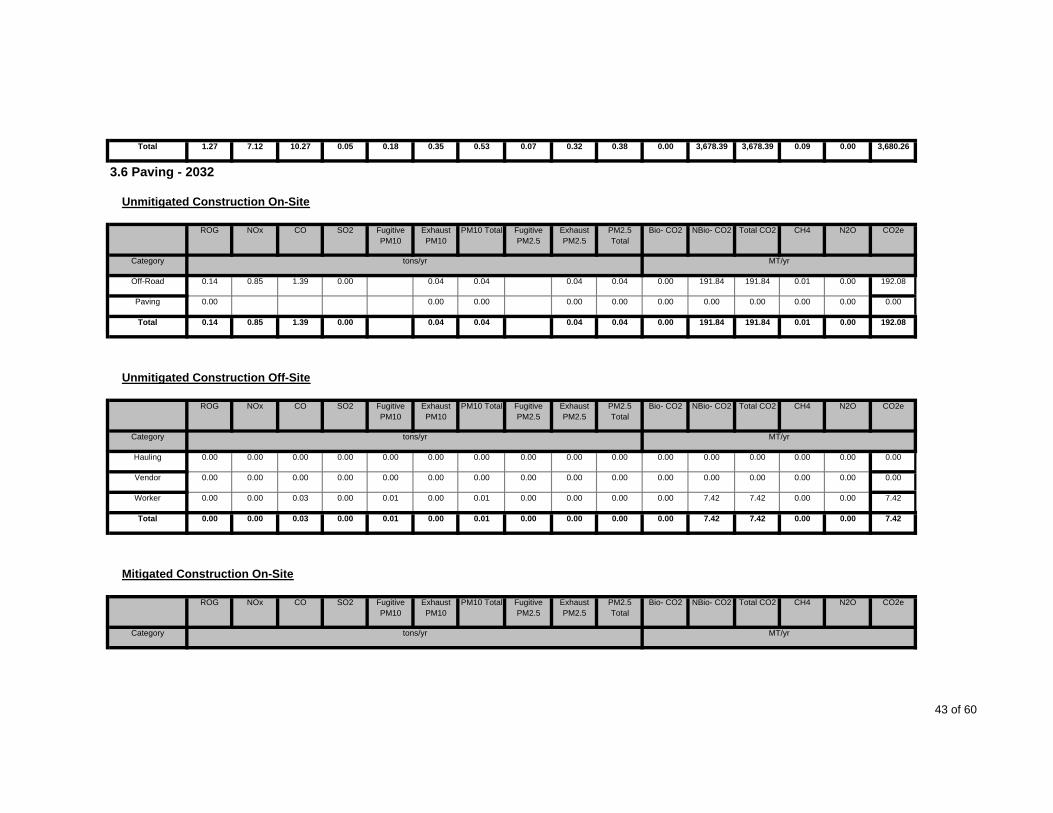
Total 1.27 7.12 10.27 0.05 0.18 0.35 0.53 0.07 0.00 3,680.260.32 0.38 0.00 3,678.39
Exhaust PM10
PM10 Total
3,678.39 0.09
PM2.5 Total
Bio- CO2
3.6 Paving - 2032
Unmitigated Construction On-Site
ROG NOx CO SO2 Fugitive PM10
CO2e
Category tons/yr MT/yr
NBio- CO2 Total CO2 CH4 N2OFugitive PM2.5
Exhaust PM2.5
Off-Road 0.14 0.85 1.39 0.00 0.04 0.04 0.04 0.04 0.00 191.84 191.84 0.01 0.00 192.08
Paving 0.00 0.00 0.00 0.00 0.00 0.00 0.00 0.00 0.00 0.00 0.00
Total 0.14 0.85 1.39 191.84 0.01 0.000.04 0.04 0.00
SO2 Fugitive PM10
Exhaust PM10
191.840.00 0.04 0.04
Fugitive PM2.5
Exhaust PM2.5
PM2.5 Total
192.08
Unmitigated Construction Off-Site
ROG NOx CO N2O CO2e
Category tons/yr MT/yr
Bio- CO2 NBio- CO2 Total CO2 CH4PM10 Total
Hauling 0.00 0.00 0.00 0.00 0.00 0.00 0.00 0.00 0.00 0.00 0.00 0.00 0.00 0.00 0.00 0.00
Vendor 0.00 0.00 0.00 0.00 0.00 0.00 0.00 0.00 0.00 0.00 0.00 0.00 0.00 0.00 0.00 0.00
Worker 0.00 0.00 0.03 0.00 0.01 0.00 0.01 0.00 0.00 0.00 0.00 7.42 7.42 0.00 0.00 7.42
Total 0.00 0.00 0.03 0.00 0.01 0.00 0.01 0.00 0.00 7.420.00 0.00 0.00 7.42
Exhaust PM10
PM10 Total
7.42 0.00
PM2.5 Total
Bio- CO2
Mitigated Construction On-Site
ROG NOx CO SO2 Fugitive PM10
CO2e
Category tons/yr MT/yr
NBio- CO2 Total CO2 CH4 N2OFugitive PM2.5
Exhaust PM2.5
43 of 60
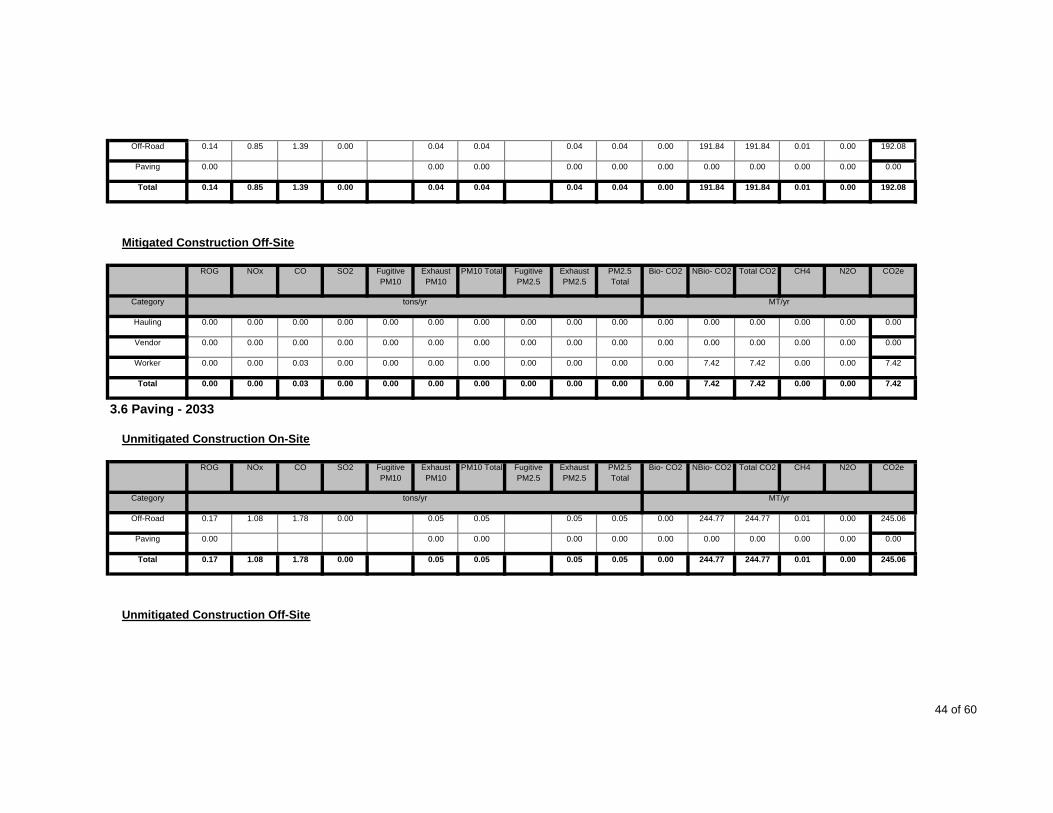
Off-Road 0.14 0.85 1.39 0.00 0.04 0.04 0.04 0.04 0.00 191.84 191.84 0.01 0.00 192.08
Paving 0.00 0.00 0.00 0.00 0.00 0.00 0.00 0.00 0.00 0.00 0.00
Total 0.14 0.85 1.39 191.84 0.01 0.000.04 0.04 0.00
SO2 Fugitive PM10
Exhaust PM10
191.840.00 0.04 0.04
Fugitive PM2.5
Exhaust PM2.5
PM2.5 Total
192.08
Mitigated Construction Off-Site
ROG NOx CO N2O CO2e
Category tons/yr MT/yr
Bio- CO2 NBio- CO2 Total CO2 CH4PM10 Total
Hauling 0.00 0.00 0.00 0.00 0.00 0.00 0.00 0.00 0.00 0.00 0.00 0.00 0.00 0.00 0.00 0.00
Vendor 0.00 0.00 0.00 0.00 0.00 0.00 0.00 0.00 0.00 0.00 0.00 0.00 0.00 0.00 0.00 0.00
Worker 0.00 0.00 0.03 0.00 0.00 0.00 0.00 0.00 0.00 0.00 0.00 7.42 7.42 0.00 0.00 7.42
Total 0.00 0.00 0.03 0.00 0.00 0.00 0.00 0.00 0.00 7.420.00 0.00 0.00 7.42
Exhaust PM10
PM10 Total
7.42 0.00
PM2.5 Total
Bio- CO2
3.6 Paving - 2033
Unmitigated Construction On-Site
ROG NOx CO SO2 Fugitive PM10
CO2e
Category tons/yr MT/yr
NBio- CO2 Total CO2 CH4 N2OFugitive PM2.5
Exhaust PM2.5
Off-Road 0.17 1.08 1.78 0.00 0.05 0.05 0.05 0.05 0.00 244.77 244.77 0.01 0.00 245.06
Paving 0.00 0.00 0.00 0.00 0.00 0.00 0.00 0.00 0.00 0.00 0.00
Total 0.17 1.08 1.78 244.77 0.01 0.000.05 0.05 0.00 244.770.00 0.05 0.05 245.06
Unmitigated Construction Off-Site
44 of 60

SO2 Fugitive PM10
Exhaust PM10
Fugitive PM2.5
Exhaust PM2.5
PM2.5 Total
ROG NOx CO N2O CO2e
Category tons/yr MT/yr
Bio- CO2 NBio- CO2 Total CO2 CH4PM10 Total
Hauling 0.00 0.00 0.00 0.00 0.00 0.00 0.00 0.00 0.00 0.00 0.00 0.00 0.00 0.00 0.00 0.00
Vendor 0.00 0.00 0.00 0.00 0.00 0.00 0.00 0.00 0.00 0.00 0.00 0.00 0.00 0.00 0.00 0.00
Worker 0.00 0.00 0.03 0.00 0.02 0.00 0.02 0.00 0.00 0.00 0.00 9.46 9.46 0.00 0.00 9.47
Total 0.00 0.00 0.03 0.00 0.02 0.00 0.02 0.00 0.00 9.470.00 0.00 0.00 9.46
Exhaust PM10
PM10 Total
9.46 0.00
PM2.5 Total
Bio- CO2
Mitigated Construction On-Site
ROG NOx CO SO2 Fugitive PM10
CO2e
Category tons/yr MT/yr
NBio- CO2 Total CO2 CH4 N2OFugitive PM2.5
Exhaust PM2.5
Off-Road 0.17 1.08 1.78 0.00 0.05 0.05 0.05 0.05 0.00 244.77 244.77 0.01 0.00 245.06
Paving 0.00 0.00 0.00 0.00 0.00 0.00 0.00 0.00 0.00 0.00 0.00
Total 0.17 1.08 1.78 244.77 0.01 0.000.05 0.05 0.00
SO2 Fugitive PM10
Exhaust PM10
244.770.00 0.05 0.05
Fugitive PM2.5
Exhaust PM2.5
PM2.5 Total
245.06
Mitigated Construction Off-Site
ROG NOx CO N2O CO2e
Category tons/yr MT/yr
Bio- CO2 NBio- CO2 Total CO2 CH4PM10 Total
Hauling 0.00 0.00 0.00 0.00 0.00 0.00 0.00 0.00 0.00 0.00 0.00 0.00 0.00 0.00 0.00 0.00
Vendor 0.00 0.00 0.00 0.00 0.00 0.00 0.00 0.00 0.00 0.00 0.00 0.00 0.00 0.00 0.00 0.00
Worker 0.00 0.00 0.03 0.00 0.00 0.00 0.00 0.00 0.00 0.00 0.00 9.46 9.46 0.00 0.00 9.47
Total 0.00 0.00 0.03 0.00 0.00 0.00 0.00 0.00 0.00 9.470.00 0.00 0.00 9.46 9.46 0.00
45 of 60
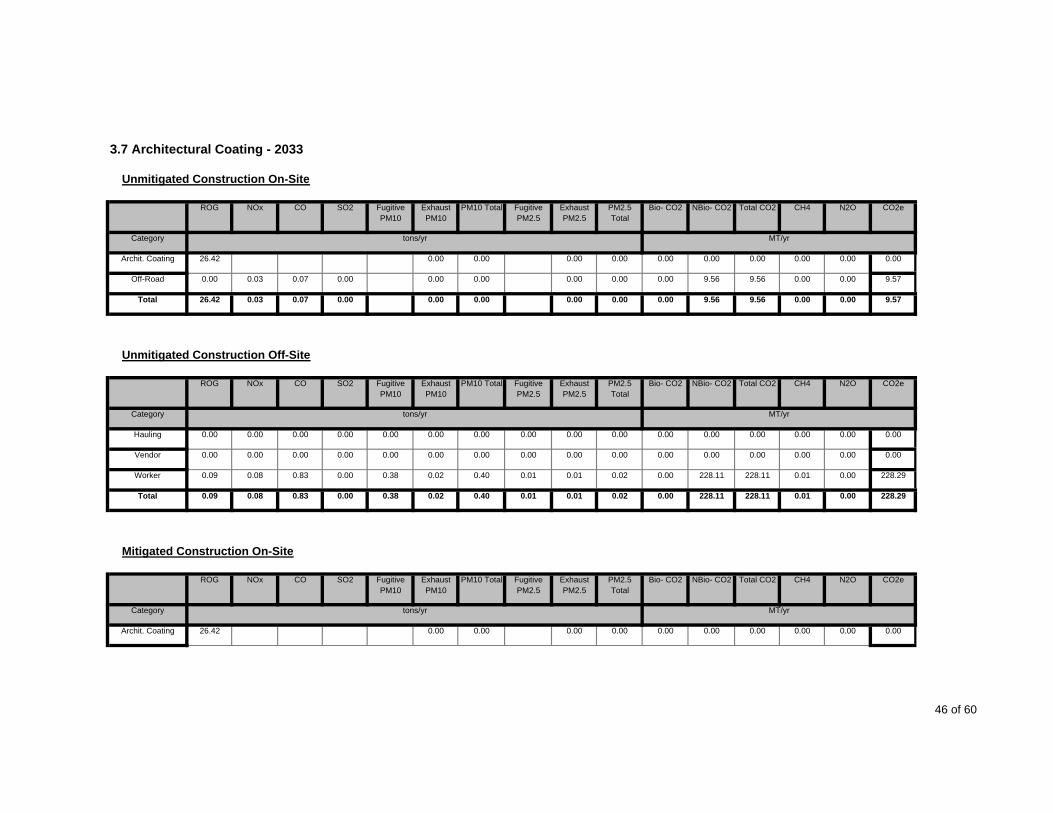
Exhaust PM10
PM10 Total PM2.5 Total
Bio- CO2
3.7 Architectural Coating - 2033
Unmitigated Construction On-Site
ROG NOx CO SO2 Fugitive PM10
CO2e
Category tons/yr MT/yr
NBio- CO2 Total CO2 CH4 N2OFugitive PM2.5
Exhaust PM2.5
Archit. Coating 26.42 0.00 0.00 0.00 0.00 0.00 0.00 0.00 0.00 0.00 0.00
Off-Road 0.00 0.03 0.07 0.00 0.00 0.00 0.00 0.00 0.00 9.56 9.56 0.00 0.00 9.57
Total 26.42 0.03 0.07 9.56 0.00 0.000.00 0.00 0.00
SO2 Fugitive PM10
Exhaust PM10
9.560.00 0.00 0.00
Fugitive PM2.5
Exhaust PM2.5
PM2.5 Total
9.57
Unmitigated Construction Off-Site
ROG NOx CO N2O CO2e
Category tons/yr MT/yr
Bio- CO2 NBio- CO2 Total CO2 CH4PM10 Total
Hauling 0.00 0.00 0.00 0.00 0.00 0.00 0.00 0.00 0.00 0.00 0.00 0.00 0.00 0.00 0.00 0.00
Vendor 0.00 0.00 0.00 0.00 0.00 0.00 0.00 0.00 0.00 0.00 0.00 0.00 0.00 0.00 0.00 0.00
Worker 0.09 0.08 0.83 0.00 0.38 0.02 0.40 0.01 0.01 0.02 0.00 228.11 228.11 0.01 0.00 228.29
Total 0.09 0.08 0.83 0.00 0.38 0.02 0.40 0.01 0.00 228.290.01 0.02 0.00 228.11
Exhaust PM10
PM10 Total
228.11 0.01
PM2.5 Total
Bio- CO2
Mitigated Construction On-Site
ROG NOx CO SO2 Fugitive PM10
CO2e
Category tons/yr MT/yr
NBio- CO2 Total CO2 CH4 N2OFugitive PM2.5
Exhaust PM2.5
Archit. Coating 26.42 0.00 0.00 0.00 0.00 0.00 0.00 0.00 0.00 0.00 0.00
46 of 60

Off-Road 0.00 0.03 0.07 0.00 0.00 0.00 0.00 0.00 0.00 9.56 9.56 0.00 0.00 9.57
Total 26.42 0.03 0.07 9.56 0.00 0.000.00 0.00 0.00
SO2 Fugitive PM10
Exhaust PM10
9.560.00 0.00 0.00
Fugitive PM2.5
Exhaust PM2.5
PM2.5 Total
9.57
Mitigated Construction Off-Site
ROG NOx CO N2O CO2e
Category tons/yr MT/yr
Bio- CO2 NBio- CO2 Total CO2 CH4PM10 Total
Hauling 0.00 0.00 0.00 0.00 0.00 0.00 0.00 0.00 0.00 0.00 0.00 0.00 0.00 0.00 0.00 0.00
Vendor 0.00 0.00 0.00 0.00 0.00 0.00 0.00 0.00 0.00 0.00 0.00 0.00 0.00 0.00 0.00 0.00
Worker 0.09 0.08 0.83 0.00 0.02 0.02 0.03 0.01 0.01 0.02 0.00 228.11 228.11 0.01 0.00 228.29
Total 0.09 0.08 0.83 0.00 0.02 0.02 0.03 0.01 0.00 228.290.01 0.02 0.00 228.11
Exhaust PM10
PM10 Total
228.11 0.01
PM2.5 Total
Bio- CO2
3.7 Architectural Coating - 2034
Unmitigated Construction On-Site
ROG NOx CO SO2 Fugitive PM10
CO2e
Category tons/yr MT/yr
NBio- CO2 Total CO2 CH4 N2OFugitive PM2.5
Exhaust PM2.5
Archit. Coating 89.82 0.00 0.00 0.00 0.00 0.00 0.00 0.00 0.00 0.00 0.00
Off-Road 0.02 0.11 0.23 0.00 0.00 0.00 0.00 0.00 0.00 32.52 32.52 0.00 0.00 32.54
Total 89.84 0.11 0.23 32.52 0.00 0.000.00 0.00 0.00
SO2 Fugitive PM10
Exhaust PM10
32.520.00 0.00 0.00
Fugitive PM2.5
Exhaust PM2.5
PM2.5 Total
32.54
Unmitigated Construction Off-Site
ROG NOx CO N2O CO2eBio- CO2 NBio- CO2 Total CO2 CH4PM10 Total
47 of 60

Category tons/yr MT/yr
Hauling 0.00 0.00 0.00 0.00 0.00 0.00 0.00 0.00 0.00 0.00 0.00 0.00 0.00 0.00 0.00 0.00
Vendor 0.00 0.00 0.00 0.00 0.00 0.00 0.00 0.00 0.00 0.00 0.00 0.00 0.00 0.00 0.00 0.00
Worker 0.31 0.26 2.81 0.01 1.30 0.05 1.35 0.02 0.05 0.07 0.00 775.58 775.58 0.03 0.00 776.17
Total 0.31 0.26 2.81 0.01 1.30 0.05 1.35 0.02 0.00 776.170.05 0.07 0.00 775.58
Exhaust PM10
PM10 Total
775.58 0.03
PM2.5 Total
Bio- CO2
Mitigated Construction On-Site
ROG NOx CO SO2 Fugitive PM10
CO2e
Category tons/yr MT/yr
NBio- CO2 Total CO2 CH4 N2OFugitive PM2.5
Exhaust PM2.5
Archit. Coating 89.82 0.00 0.00 0.00 0.00 0.00 0.00 0.00 0.00 0.00 0.00
Off-Road 0.02 0.11 0.23 0.00 0.00 0.00 0.00 0.00 0.00 32.52 32.52 0.00 0.00 32.54
Total 89.84 0.11 0.23 32.52 0.00 0.000.00 0.00 0.00
SO2 Fugitive PM10
Exhaust PM10
32.520.00 0.00 0.00
Fugitive PM2.5
Exhaust PM2.5
PM2.5 Total
32.54
Mitigated Construction Off-Site
ROG NOx CO N2O CO2e
Category tons/yr MT/yr
Bio- CO2 NBio- CO2 Total CO2 CH4PM10 Total
Hauling 0.00 0.00 0.00 0.00 0.00 0.00 0.00 0.00 0.00 0.00 0.00 0.00 0.00 0.00 0.00 0.00
Vendor 0.00 0.00 0.00 0.00 0.00 0.00 0.00 0.00 0.00 0.00 0.00 0.00 0.00 0.00 0.00 0.00
Worker 0.31 0.26 2.81 0.01 0.06 0.05 0.11 0.02 0.05 0.07 0.00 775.58 775.58 0.03 0.00 776.17
Total 0.31 0.26 2.81 0.01 0.06 0.05 0.11 0.02 0.05 0.07 0.00 775.58 775.58 0.03 0.00 776.17
48 of 60
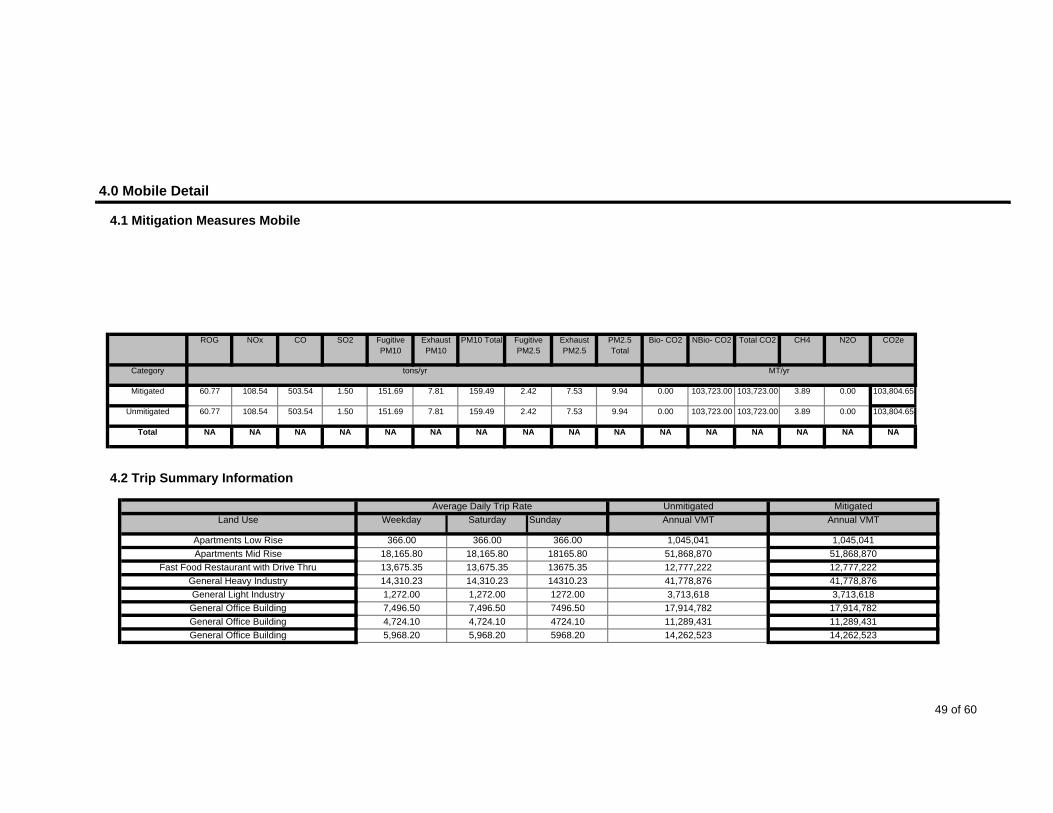
SO2 Fugitive PM10
Exhaust PM10
4.0 Mobile Detail
4.1 Mitigation Measures Mobile
Fugitive PM2.5
Exhaust PM2.5
PM2.5 Total
ROG NOx CO N2O CO2e
Category tons/yr MT/yr
Bio- CO2 NBio- CO2 Total CO2 CH4PM10 Total
Mitigated 60.77 108.54 503.54 1.50 151.69 7.81 159.49 2.42 7.53 9.94 0.00 103,723.00 103,723.00 3.89 0.00 103,804.65
Unmitigated 60.77 108.54 503.54 1.50 151.69 7.81 159.49 2.42 7.53 9.94 0.00 103,723.00 103,723.00 3.89 0.00 103,804.65
Total NA NA NA NA NA NA NA NA NANA NA NA NA
Saturday Sunday
NA
4.2 Trip Summary Information
Average Daily Trip Rate Unmitigated Mitigated
NA NA
Annual VMT Annual VMT
Apartments Low Rise 366.00 366.00 366.00 1,045,041 1,045,041
Land Use Weekday
Apartments Mid Rise 18,165.80 18,165.80 18165.80Fast Food Restaurant with Drive Thru 13,675.35 13,675.35 13675.35
14,310.23 14310.23
51,868,870 51,868,87012,777,222 12,777,22241,778,876 41,778,876
General Light Industry 1,272.00 1,272.00 1272.00 3,713,618 3,713,618General Heavy Industry 14,310.23
General Office Building 7,496.50 7,496.50 7496.50General Office Building 4,724.10 4,724.10 4724.10
5,968.20 5968.20
17,914,782 17,914,78211,289,431 11,289,43114,262,523 14,262,523General Office Building 5,968.20
49 of 60

General Office Building 4,837.20 4,837.20 4837.20 11,559,712 11,559,712General Office Building 455.30 455.30 455.30General Office Building 907.70 907.70 907.70
1,128.10 1128.10
1,088,054 1,088,0542,169,179 2,169,1792,695,880 2,695,880
General Office Building 32,050.80 32,050.80 32050.80 76,593,490 76,593,490General Office Building 1,128.10
Junior College (2Yr) 1,134.05 1,134.05 1134.05Medical Office Building 1,807.74 1,807.74 1807.74
462.06 462.06
2,879,962 2,879,9623,538,199 3,538,1991,348,989 1,348,989
Strip Mall 20,819.39 20,819.39 20819.39 32,062,548 32,062,548Refrigerated Warehouse-No Rail 462.06
288,586,377 288,586,377
4.3 Trip Type Information
Miles Trip %
Total 129,580.52 129,580.52 129,580.52
Land Use H-W or C-W H-S or C-C H-O or C-NW H-W or C-W H-S or C-C H-O or C-NW
Apartments Low Rise 10.80 7.30 7.50 41.60 18.80 39.60
Apartments Mid Rise 10.80 7.30 7.50 41.60 18.80 39.60
Fast Food Restaurant with Drive Thru 9.50 7.30 7.30 2.20 78.80 19.00
General Heavy Industry 9.50 7.30 7.30 59.00 28.00 13.00
General Light Industry 9.50 7.30 7.30 59.00 28.00 13.00
General Office Building 9.50 7.30 7.30 33.00 48.00 19.00
General Office Building 9.50 7.30 7.30 33.00 48.00 19.00
General Office Building 9.50 7.30 7.30 33.00 48.00 19.00
General Office Building 9.50 7.30 7.30 33.00 48.00 19.00
General Office Building 9.50 7.30 7.30 33.00 48.00 19.00
General Office Building 9.50 7.30 7.30 33.00 48.00 19.00
General Office Building 9.50 7.30 7.30 33.00 48.00 19.00
General Office Building 9.50 7.30 7.30 33.00 48.00 19.00
Junior College (2Yr) 9.50 7.30 7.30 6.40 88.60 5.00
Medical Office Building 9.50 7.30 7.30 29.60 51.40 19.00
Refrigerated Warehouse-No Rail 9.50 7.30 7.30 59.00 0.00 41.00
50 of 60
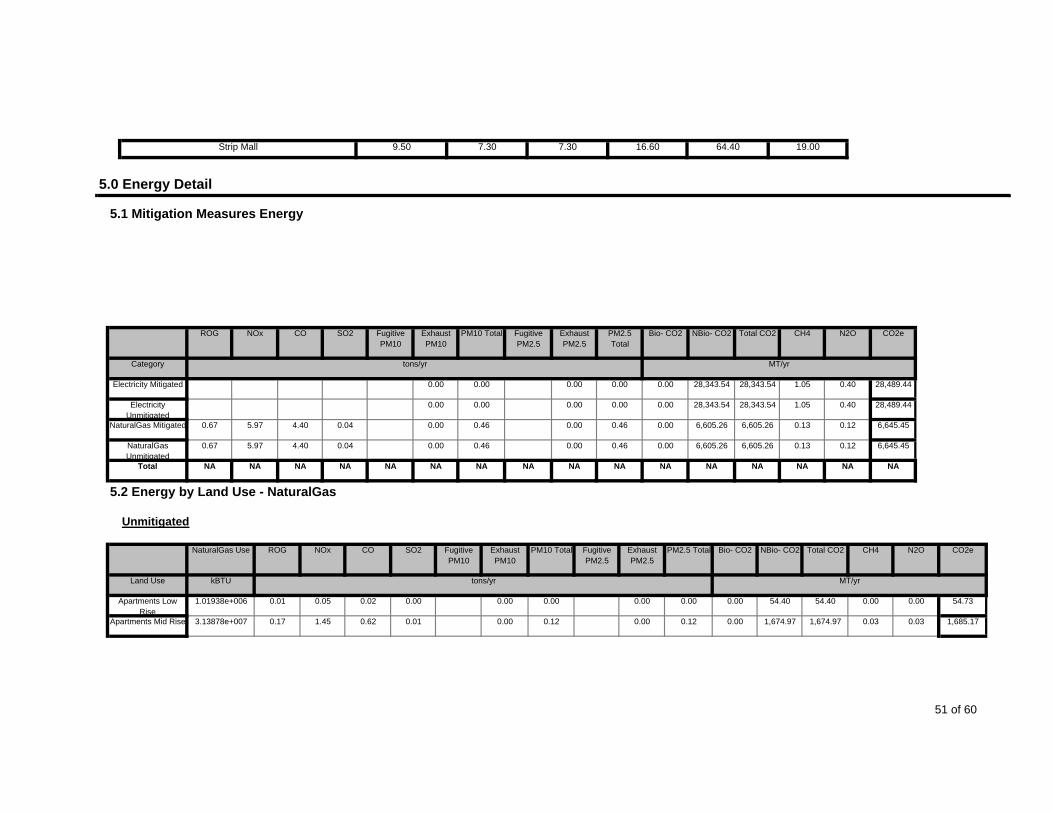
Strip Mall 9.50 7.30 7.30 16.60 64.40 19.00
Exhaust PM10
PM10 Total
5.0 Energy Detail
5.1 Mitigation Measures Energy
PM2.5 Total
Bio- CO2ROG NOx CO SO2 Fugitive PM10
CO2e
Category tons/yr MT/yr
NBio- CO2 Total CO2 CH4 N2OFugitive PM2.5
Exhaust PM2.5
Electricity Mitigated 0.00 0.00 0.00 0.00 0.00 28,343.54 28,343.54 1.05 0.40 28,489.44
Electricity Unmitigated
0.00 0.00 0.00 0.00 0.00 28,343.54 28,343.54 1.05 0.40 28,489.44
NaturalGas Mitigated 0.67 5.97 4.40 0.04 0.00 0.46 0.00 0.46 0.00 6,605.26 6,605.26 0.13 0.12 6,645.45
NaturalGas Unmitigated
0.67 5.97 4.40 0.04 0.00 0.46 0.00 0.46 0.00 6,605.26 6,605.26 0.13 0.12 6,645.45
Total NA NA NA NA NA NA NA NA NA NA NA NA NA NA NA NA
5.2 Energy by Land Use - NaturalGas
Unmitigated
NaturalGas Use ROG NOx CO SO2 Fugitive PM10
Total CO2Exhaust PM10
PM10 Total Fugitive PM2.5
Exhaust PM2.5
CH4 N2O CO2e
Land Use kBTU tons/yr MT/yr
PM2.5 Total Bio- CO2 NBio- CO2
Apartments Low Rise
1.01938e+006 0.01 0.05 0.02 0.00 0.00 0.00 0.00 0.00 0.00 54.40 54.40 0.00 0.00 54.73
Apartments Mid Rise 3.13878e+007 0.17 1.45 0.62 0.01 0.00 0.12 0.00 0.12 0.00 1,674.97 1,674.97 0.03 0.03 1,685.17
51 of 60

Fast Food Restaurant with
3.43707e+006 0.02 0.17 0.14 0.00 0.00 0.01 0.00 0.01 0.00 183.42 183.42 0.00 0.00 184.53
General Heavy Industry
4.11506e+007 0.22 2.02 1.69 0.01 0.00 0.15 0.00 0.15 0.00 2,195.95 2,195.95 0.04 0.04 2,209.32
General Light Industry
937305 0.01 0.05 0.04 0.00 0.00 0.00 0.00 0.00 0.00 50.02 50.02 0.00 0.00 50.32
General Office Building
2.32424e+007 0.13 1.14 0.96 0.01 0.00 0.09 0.00 0.09 0.00 1,240.30 1,240.30 0.02 0.02 1,247.85
General Office Building
3.42579e+006 0.02 0.17 0.14 0.00 0.00 0.01 0.00 0.01 0.00 182.81 182.81 0.00 0.00 183.93
General Office Building
3.5078e+006 0.02 0.17 0.14 0.00 0.00 0.01 0.00 0.01 0.00 187.19 187.19 0.00 0.00 188.33
General Office Building
330171 0.00 0.02 0.01 0.00 0.00 0.00 0.00 0.00 0.00 17.62 17.62 0.00 0.00 17.73
General Office Building
4.32797e+006 0.02 0.21 0.18 0.00 0.00 0.02 0.00 0.02 0.00 230.96 230.96 0.00 0.00 232.36
General Office Building
5.43625e+006 0.03 0.27 0.22 0.00 0.00 0.02 0.00 0.02 0.00 290.10 290.10 0.01 0.01 291.86
General Office Building
658239 0.00 0.03 0.03 0.00 0.00 0.00 0.00 0.00 0.00 35.13 35.13 0.00 0.00 35.34
General Office Building
818067 0.00 0.04 0.03 0.00 0.00 0.00 0.00 0.00 0.00 43.66 43.66 0.00 0.00 43.92
Junior College (2Yr) 2.32756e+006 0.01 0.11 0.10 0.00 0.00 0.01 0.00 0.01 0.00 124.21 124.21 0.00 0.00 124.96
Medical Office Building
763389 0.00 0.04 0.03 0.00 0.00 0.00 0.00 0.00 0.00 40.74 40.74 0.00 0.00 40.99
Refrigerated Warehouse-No Rail
607020 0.00 0.03 0.02 0.00 0.00 0.00 0.00 0.00 0.00 32.39 32.39 0.00 0.00 32.59
Strip Mall 400979 0.00 0.02 0.02 0.00 0.00 0.00 0.00 0.00
4.39 0.03 0.00Total 0.66 5.99 0.00 0.44
0.00 21.530.00 21.40 21.40 0.00
0.10 6,645.46
Mitigated
0.00 6,605.27 6,605.27 0.100.44
NaturalGas Use ROG NOx CO SO2 Fugitive PM10
Exhaust PM10
PM10 Total Fugitive PM2.5
Exhaust PM2.5
PM2.5 Total N2O CO2e
Land Use kBTU tons/yr MT/yr
Bio- CO2 NBio- CO2 Total CO2 CH4
Apartments Low Rise
1.01938e+006 0.01 0.05 0.02 0.00 0.00 0.00 0.00 0.00 0.00 54.40 54.40 0.00 0.00 54.73
Apartments Mid Rise 3.13878e+007 0.17 1.45 0.62 0.01 0.00 0.12 0.00 0.12 0.00 1,674.97 1,674.97 0.03 0.03 1,685.17
Fast Food Restaurant with
3.43707e+006 0.02 0.17 0.14 0.00 0.00 0.01 0.00 0.01 0.00 183.42 183.42 0.00 0.00 184.53
52 of 60

General Heavy Industry
4.11506e+007 0.22 2.02 1.69 0.01 0.00 0.15 0.00 0.15 0.00 2,195.95 2,195.95 0.04 0.04 2,209.32
General Light Industry
937305 0.01 0.05 0.04 0.00 0.00 0.00 0.00 0.00 0.00 50.02 50.02 0.00 0.00 50.32
General Office Building
2.32424e+007 0.13 1.14 0.96 0.01 0.00 0.09 0.00 0.09 0.00 1,240.30 1,240.30 0.02 0.02 1,247.85
General Office Building
3.42579e+006 0.02 0.17 0.14 0.00 0.00 0.01 0.00 0.01 0.00 182.81 182.81 0.00 0.00 183.93
General Office Building
3.5078e+006 0.02 0.17 0.14 0.00 0.00 0.01 0.00 0.01 0.00 187.19 187.19 0.00 0.00 188.33
General Office Building
330171 0.00 0.02 0.01 0.00 0.00 0.00 0.00 0.00 0.00 17.62 17.62 0.00 0.00 17.73
General Office Building
4.32797e+006 0.02 0.21 0.18 0.00 0.00 0.02 0.00 0.02 0.00 230.96 230.96 0.00 0.00 232.36
General Office Building
5.43625e+006 0.03 0.27 0.22 0.00 0.00 0.02 0.00 0.02 0.00 290.10 290.10 0.01 0.01 291.86
General Office Building
658239 0.00 0.03 0.03 0.00 0.00 0.00 0.00 0.00 0.00 35.13 35.13 0.00 0.00 35.34
General Office Building
818067 0.00 0.04 0.03 0.00 0.00 0.00 0.00 0.00 0.00 43.66 43.66 0.00 0.00 43.92
Junior College (2Yr) 2.32756e+006 0.01 0.11 0.10 0.00 0.00 0.01 0.00 0.01 0.00 124.21 124.21 0.00 0.00 124.96
Medical Office Building
763389 0.00 0.04 0.03 0.00 0.00 0.00 0.00 0.00 0.00 40.74 40.74 0.00 0.00 40.99
Refrigerated Warehouse-No Rail
607020 0.00 0.03 0.02 0.00 0.00 0.00 0.00 0.00 0.00 32.39 32.39 0.00 0.00 32.59
Strip Mall 400979 0.00 0.02 0.02 0.00 0.00 0.00 0.00 0.00
4.39 0.03 0.00Total 0.66 5.99 0.00 0.44
0.00 21.530.00 21.40 21.40 0.00
0.10 6,645.46
5.3 Energy by Land Use - Electricity
Unmitigated
0.00 6,605.27 6,605.27 0.100.44
Electricity Use ROG NOx N2O CO2e
Land Use kWh tons/yr MT/yr
CO SO2 Total CO2 CH4
Apartments Low Rise
214272 75.89 0.00 0.00 76.28
Apartments Mid Rise 1.03849e+007 3,677.92 0.14 0.05 3,696.86
Fast Food Restaurant with
806520 285.64 0.01 0.00 287.11
General Heavy Industry
3.14127e+007 11,125.13 0.41 0.16 11,182.40
53 of 60

General Light Industry
715500 253.40 0.01 0.00 254.71
General Office Building
1.65669e+007 5,867.36 0.22 0.08 5,897.56
General Office Building
2.44187e+006 864.81 0.03 0.01 869.27
General Office Building
2.50033e+006 885.52 0.03 0.01 890.08
General Office Building
235343 83.35 0.00 0.00 83.78
General Office Building
3.08494e+006 1,092.56 0.04 0.02 1,098.19
General Office Building
3.87492e+006 1,372.34 0.05 0.02 1,379.41
General Office Building
469187 166.17 0.01 0.00 167.02
General Office Building
583111 206.51 0.01 0.00 207.58
Junior College (2Yr) 610548 216.23 0.01 0.00 217.34
Medical Office Building
544137 192.71 0.01 0.00 193.70
Refrigerated Warehouse-No Rail
3.12661e+006 1,107.32 0.04 0.02 1,113.02
Strip Mall 2.4584e+006 870.67 0.03 0.01 875.15
Total 28,343.53 1.05 0.38 28,489.46
Mitigated
Electricity Use ROG NOx N2O CO2e
Land Use kWh tons/yr MT/yr
CO SO2 Total CO2 CH4
Apartments Low Rise
214272 75.89 0.00 0.00 76.28
Apartments Mid Rise 1.03849e+007 3,677.92 0.14 0.05 3,696.86
Fast Food Restaurant with
806520 285.64 0.01 0.00 287.11
General Heavy Industry
3.14127e+007 11,125.13 0.41 0.16 11,182.40
General Light Industry
715500 253.40 0.01 0.00 254.71
54 of 60

General Office Building
1.65669e+007 5,867.36 0.22 0.08 5,897.56
General Office Building
2.44187e+006 864.81 0.03 0.01 869.27
General Office Building
2.50033e+006 885.52 0.03 0.01 890.08
General Office Building
235343 83.35 0.00 0.00 83.78
General Office Building
3.08494e+006 1,092.56 0.04 0.02 1,098.19
General Office Building
3.87492e+006 1,372.34 0.05 0.02 1,379.41
General Office Building
469187 166.17 0.01 0.00 167.02
General Office Building
583111 206.51 0.01 0.00 207.58
Junior College (2Yr) 610548 216.23 0.01 0.00 217.34
Medical Office Building
544137 192.71 0.01 0.00 193.70
Refrigerated Warehouse-No Rail
3.12661e+006 1,107.32 0.04 0.02 1,113.02
Strip Mall 2.4584e+006 870.67 0.03 0.01 875.15
Total 28,343.53 1.05 0.38 28,489.46
6.0 Area Detail
6.1 Mitigation Measures Area
ROG NOx CO PM2.5 Total
Bio- CO2SO2 Fugitive PM10
Exhaust PM10
PM10 Total CO2e
Category tons/yr MT/yr
NBio- CO2 Total CO2 CH4 N2OFugitive PM2.5
Exhaust PM2.5
55 of 60

Mitigated 238.31 2.85 257.67 0.09 0.00 33.31 0.00 33.31 3,139.16 3,986.83 7,125.99 2.98 0.30 7,280.14
Unmitigated 238.31 2.85 257.67 0.09 0.00 33.31 0.00 33.31 3,139.16 3,986.83 7,125.99 2.98 0.30 7,280.14
Total NA NA NA NA NA NANA NA NA NA
SO2 Fugitive PM10
Exhaust PM10
NANA NA NA NA
Fugitive PM2.5
Exhaust PM2.5
PM2.5 Total
NA
6.2 Area by SubCategory
Unmitigated
ROG NOx CO N2O CO2e
SubCategory tons/yr MT/yr
Bio- CO2 NBio- CO2 Total CO2 CH4PM10 Total
Architectural Coating 11.62 0.00 0.00 0.00 0.00 0.00 0.00 0.00 0.00 0.00 0.00
Consumer Products 35.06 0.00 0.00 0.00 0.00 0.00 0.00 0.00 0.00 0.00 0.00
Hearth 190.95 2.59 234.92 0.09 0.00 33.19 0.00 33.18 3,139.16 3,949.55 7,088.71 2.95 0.30 7,242.11
Landscaping 0.68 0.26 22.75 0.00 0.00 0.13 0.00 0.13 0.00 37.28 37.28 0.04 0.00 38.02
Total 238.31 2.85 257.67 7,125.99 2.99 0.300.00 33.31 3,139.16
SO2 Fugitive PM10
Exhaust PM10
3,986.830.09 0.00 33.32
Fugitive PM2.5
Exhaust PM2.5
PM2.5 Total
7,280.13
Mitigated
ROG NOx CO N2O CO2e
SubCategory tons/yr MT/yr
Bio- CO2 NBio- CO2 Total CO2 CH4PM10 Total
Architectural Coating 11.62 0.00 0.00 0.00 0.00 0.00 0.00 0.00 0.00 0.00 0.00
Consumer Products 35.06 0.00 0.00 0.00 0.00 0.00 0.00 0.00 0.00 0.00 0.00
Hearth 190.95 2.59 234.92 0.09 0.00 33.19 0.00 33.18 3,139.16 3,949.55 7,088.71 2.95 0.30 7,242.11
Landscaping 0.68 0.26 22.75 0.00 0.00 0.13 0.00 0.13 0.00 37.28 37.28 0.04 0.00 38.02
Total 238.31 2.85 257.67 33.31 3,139.160.09 0.00 33.32 7,280.133,986.83 7,125.99 2.99 0.300.00
56 of 60

7.0 Water Detail
7.1 Mitigation Measures Water
Apply Water Conservation Strategy
ROG NOx CO SO2 Total CO2 CH4 N2O CO2e
Category tons/yr MT/yr
Mitigated 69,812.13 456.19 12.23 83,183.46
Unmitigated 87,265.16 570.23 15.29 103,979.33
Total NA NA NA NA NA NA NA NA
7.2 Water by Land Use
Unmitigated
Indoor/Outdoor Use
ROG NOx CO SO2 Total CO2 CH4 N2O CO2e
Land Use Mgal tons/yr MT/yr
Apartments Low Rise
3.9744 / 2.5056 28.23 0.12 0.00 31.86
Apartments Mid Rise 194.029 / 122.322 1,378.25 5.97 0.17 1,555.24
Fast Food Restaurant with
5.91891 / 0.377803
28.85 0.18 0.00 34.18
General Heavy Industry
17161.6 / 0 79,333.55 526.79 14.11 94,769.06
General Light Industry
390.897 / 0 1,807.01 12.00 0.32 2,158.59
57 of 60
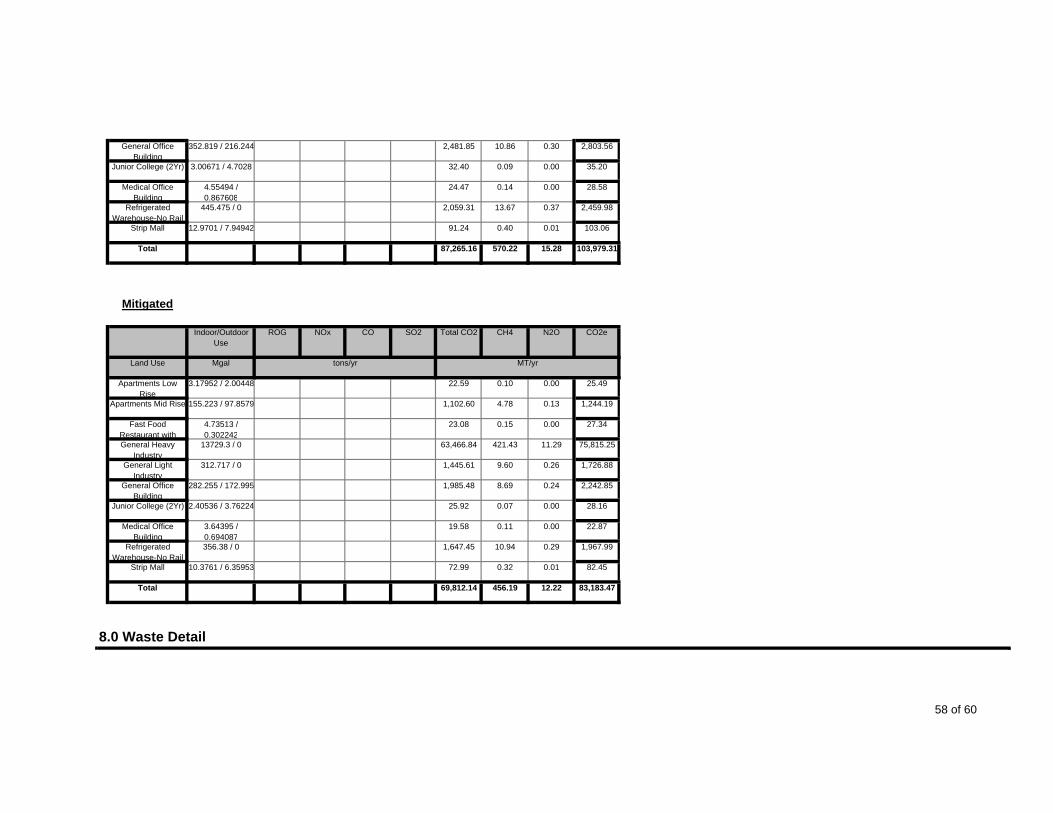
General Office Building
352.819 / 216.244 2,481.85 10.86 0.30 2,803.56
Junior College (2Yr) 3.00671 / 4.7028 32.40 0.09 0.00 35.20
Medical Office Building
4.55494 / 0.867608
24.47 0.14 0.00 28.58
Refrigerated Warehouse-No Rail
445.475 / 0 2,059.31 13.67 0.37 2,459.98
Strip Mall 12.9701 / 7.94942 91.24 0.40 0.01 103.06
Total 87,265.16 570.22 15.28 103,979.31
Mitigated
Indoor/Outdoor Use
ROG NOx N2O CO2e
Land Use Mgal tons/yr MT/yr
CO SO2 Total CO2 CH4
Apartments Low Rise
3.17952 / 2.00448 22.59 0.10 0.00 25.49
Apartments Mid Rise 155.223 / 97.8579 1,102.60 4.78 0.13 1,244.19
Fast Food Restaurant with
4.73513 / 0.302242
23.08 0.15 0.00 27.34
General Heavy Industry
13729.3 / 0 63,466.84 421.43 11.29 75,815.25
General Light Industry
312.717 / 0 1,445.61 9.60 0.26 1,726.88
General Office Building
282.255 / 172.995 1,985.48 8.69 0.24 2,242.85
Junior College (2Yr) 2.40536 / 3.76224 25.92 0.07 0.00 28.16
Medical Office Building
3.64395 / 0.694087
19.58 0.11 0.00 22.87
Refrigerated Warehouse-No Rail
356.38 / 0 1,647.45 10.94 0.29 1,967.99
Strip Mall 10.3761 / 6.35953 72.99 0.32 0.01 82.45
Total 69,812.14 456.19 12.22 83,183.47
8.0 Waste Detail
58 of 60
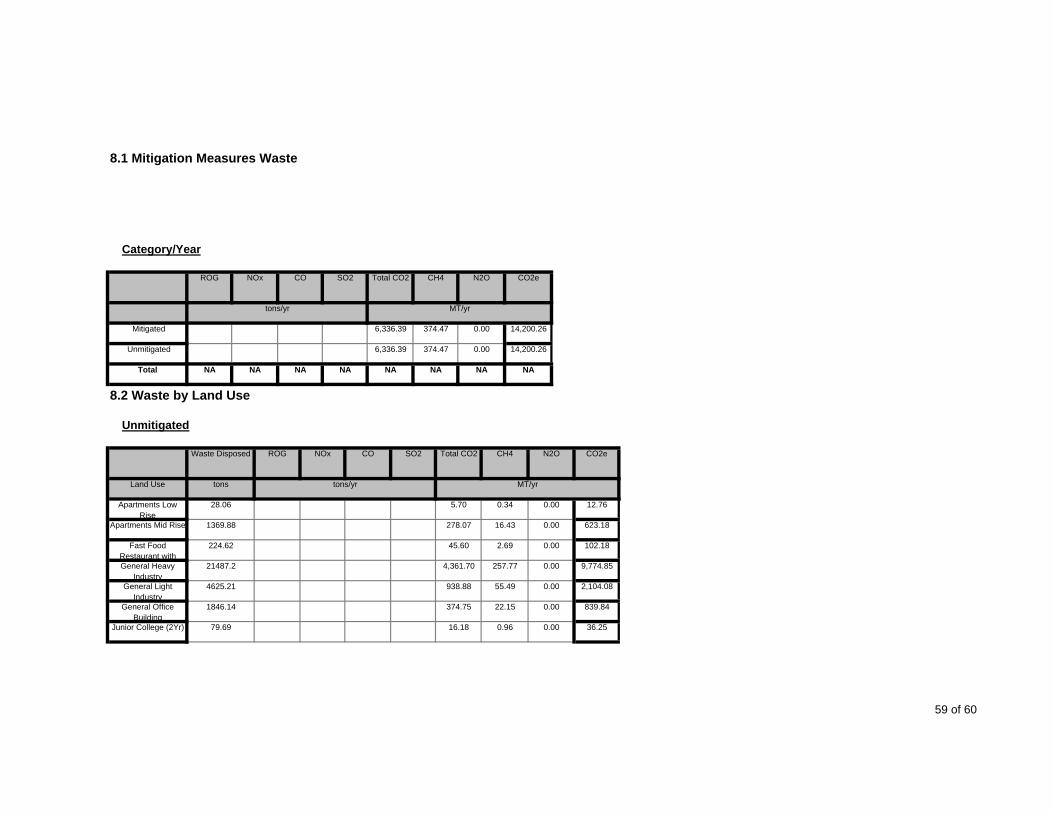
NOx CO
8.1 Mitigation Measures Waste
Category/Year
CO2e
tons/yr MT/yr
SO2 Total CO2 CH4 N2OROG
Mitigated 6,336.39 374.47 0.00 14,200.26
Unmitigated 6,336.39 374.47 0.00 14,200.26
Total NA NA NA NA NA NA NA NA
8.2 Waste by Land Use
Unmitigated
Waste Disposed ROG NOx CO SO2 Total CO2 CH4 N2O CO2e
Land Use tons tons/yr MT/yr
Apartments Low Rise
28.06 5.70 0.34 0.00 12.76
Apartments Mid Rise 1369.88 278.07 16.43 0.00 623.18
Fast Food Restaurant with
224.62 45.60 2.69 0.00 102.18
General Heavy Industry
21487.2 4,361.70 257.77 0.00 9,774.85
General Light Industry
4625.21 938.88 55.49 0.00 2,104.08
General Office Building
1846.14 374.75 22.15 0.00 839.84
Junior College (2Yr) 79.69 16.18 0.96 0.00 36.25
59 of 60

Medical Office Building
392.04 79.58 4.70 0.00 178.35
Refrigerated Warehouse-No Rail
978.48 198.62 11.74 0.00 445.13
Strip Mall 183.85 37.32 2.21 0.00 83.64
Total 6,336.40 374.48 0.00 14,200.26
Mitigated
Waste Disposed ROG NOx N2O CO2e
Land Use tons tons/yr MT/yr
CO SO2 Total CO2 CH4
Apartments Low Rise
28.06 5.70 0.34 0.00 12.76
Apartments Mid Rise 1369.88 278.07 16.43 0.00 623.18
Fast Food Restaurant with
224.62 45.60 2.69 0.00 102.18
General Heavy Industry
21487.2 4,361.70 257.77 0.00 9,774.85
General Light Industry
4625.21 938.88 55.49 0.00 2,104.08
General Office Building
1846.14 374.75 22.15 0.00 839.84
Junior College (2Yr) 79.69 16.18 0.96 0.00 36.25
Medical Office Building
392.04 79.58 4.70 0.00 178.35
Refrigerated Warehouse-No Rail
978.48 198.62 11.74 0.00 445.13
Strip Mall 183.85 37.32 2.21 0.00 83.64
Total 6,336.40 374.48 0.00 14,200.26
9.0 Vegetation
60 of 60