greater boston association of realtors january 2017 monthly indicators report
TRANSCRIPT

© 2017 North Leaf Solutions LLC as Domus Analytics, under license for Greater Boston Association of REALTORS® 1
Detached Single-Family Homes
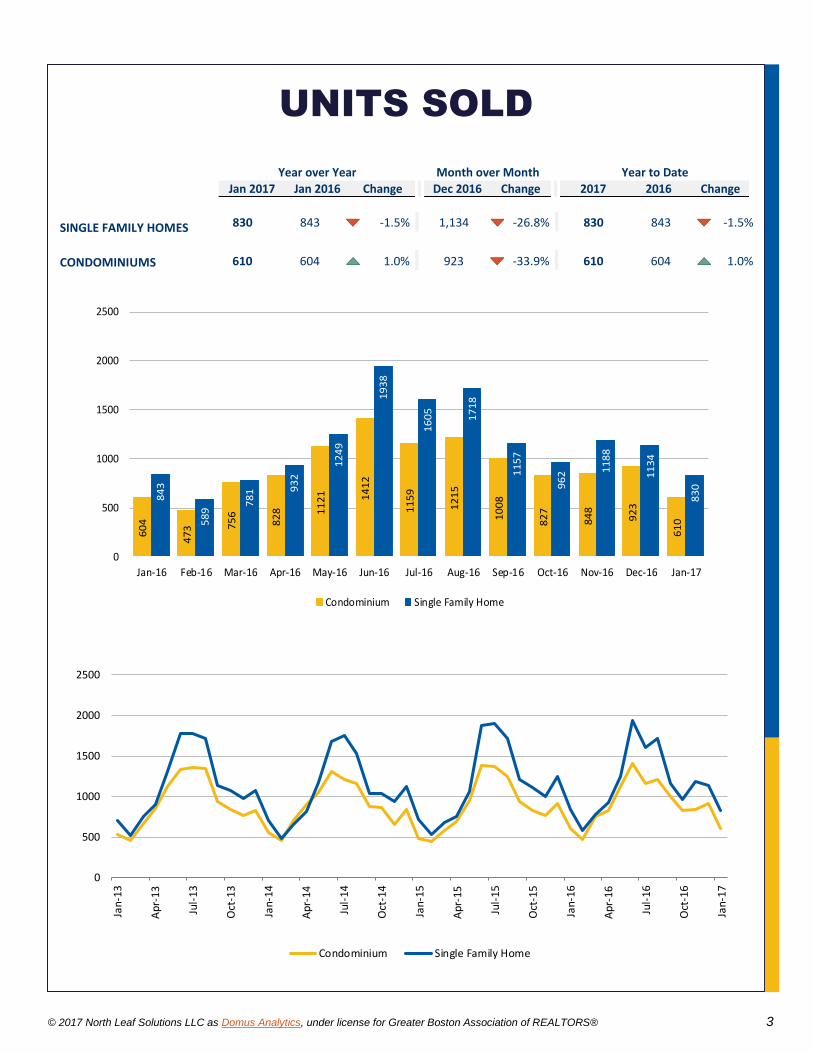
The 830 homes sold in January is the second highest total for the month, despite
the 1.5 percent drop in sales compared to the record-high 843 from January
2016. Additionally, this is well above the January historical average of 693 homes
sold, and is the second consecutive month that sales have dropped slightly on a
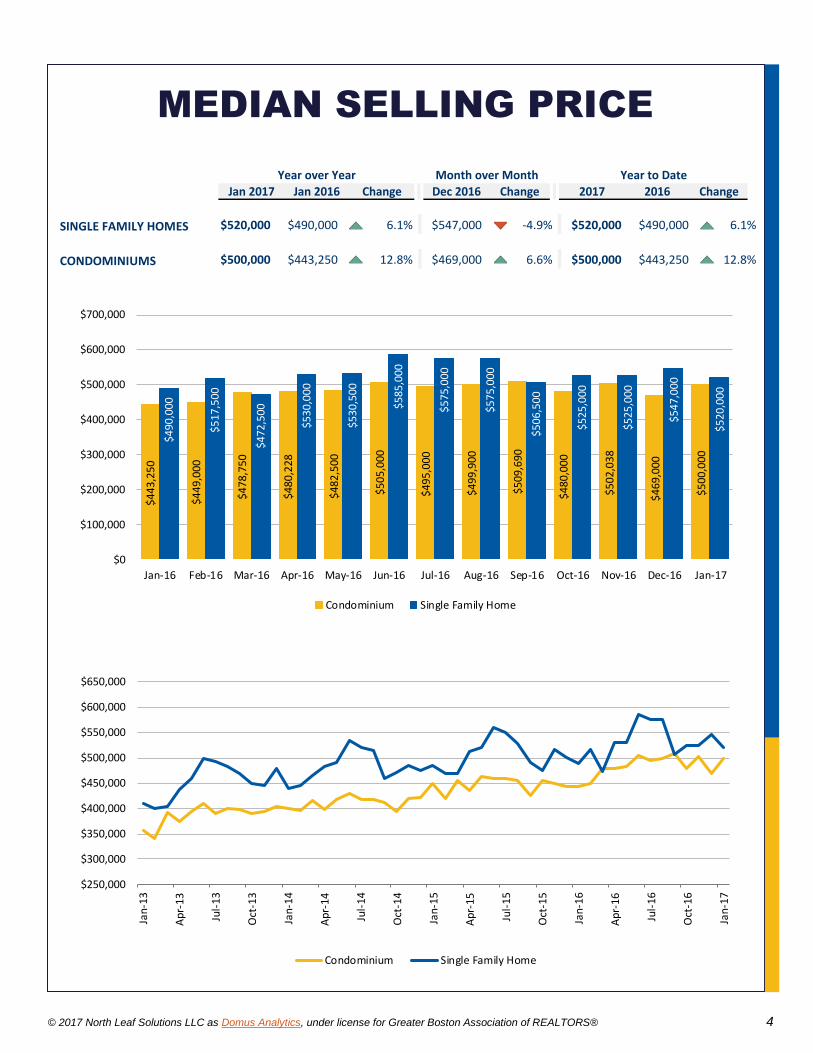
monthly basis. With the 6.1 percent increase in median sales price last month,
this is the 39th consecutive month that this figure has increased or stayed the
same on a monthly basis.
Condominiums
With 610 condos sold last month, it was the fourth-most active January in history
in the Greater Boston region. This was a 1 percent gain from January 2016 condo
sales and is the second consecutive month that condo sales have softened
slightly. Additionally, this total was comfortably above the monthly average of
530 sold condos. On an annual basis, the median sales prices for condos rose to
$500,000 last month, which is the 12th consecutive month that the median sales
price has risen on monthly basis in Greater Boston.
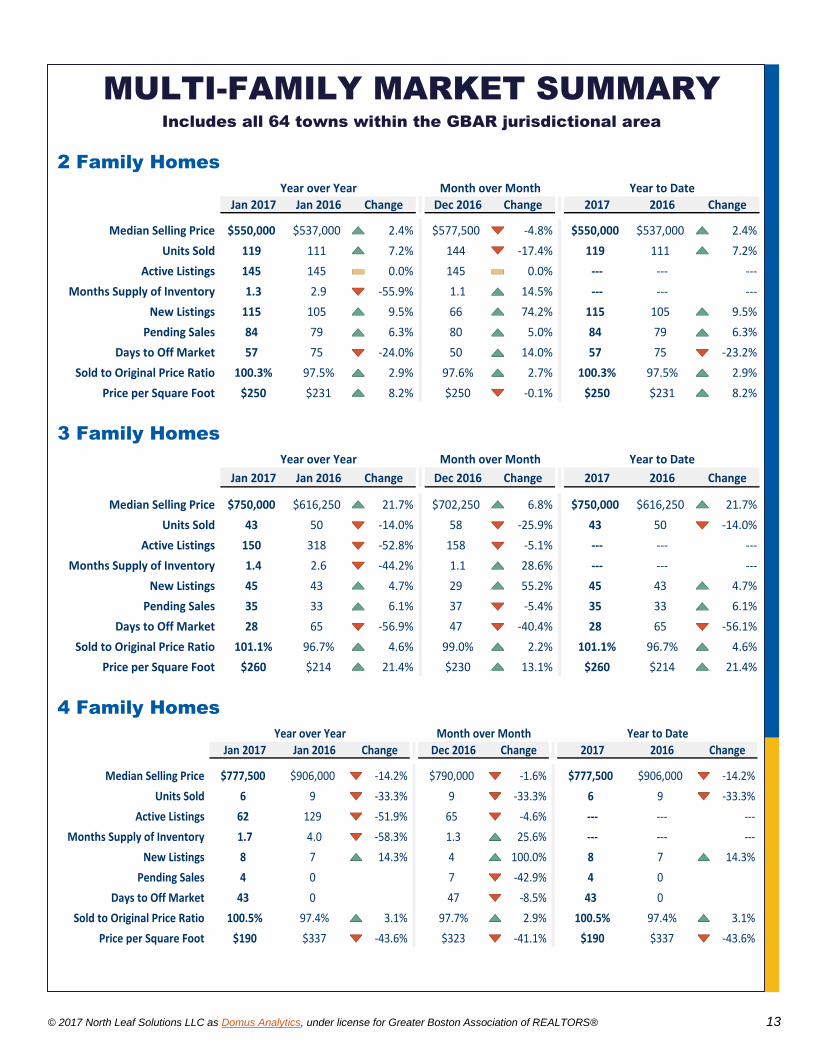
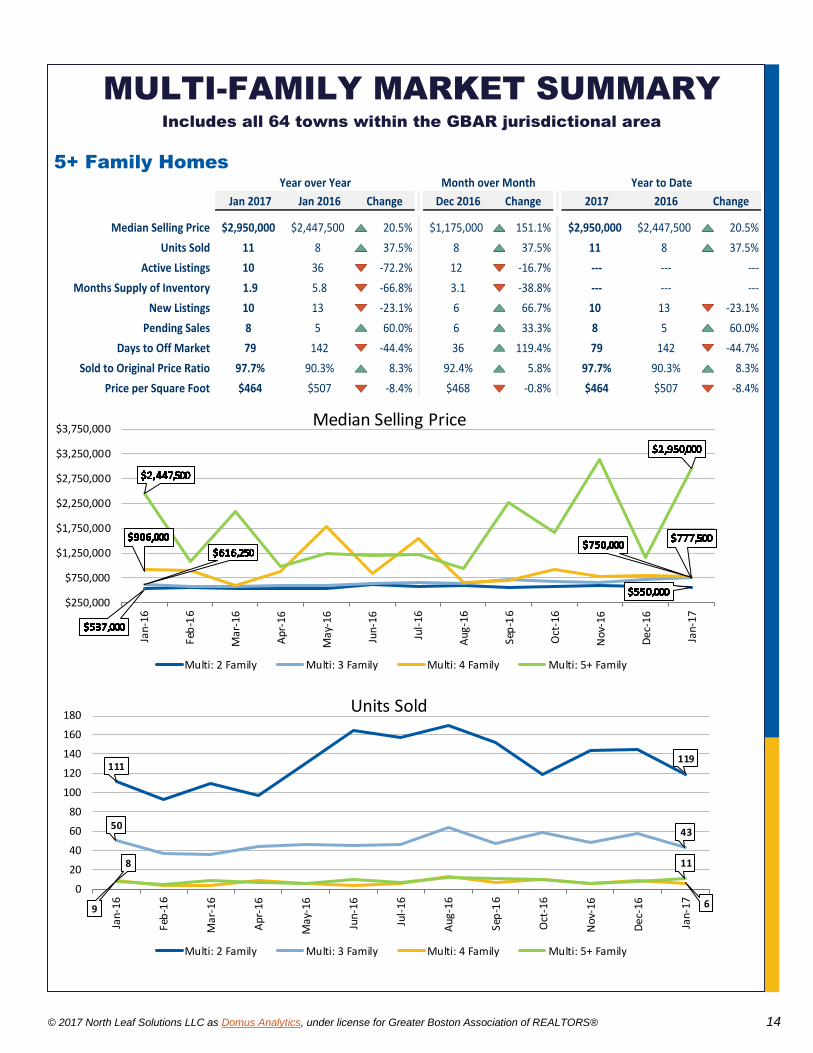
Multi-Family Homes
In January of 2017 there were 179 multi-family homes sold in Greater Boston,
which is the highest amount on record for the month. This is also a return to
positive, albeit nearly even, sales numbers as December’s multi-family sales were
down 7.5 percent. Among multi-family homes, the two-family homes saw the
most activity last month, as 119 units were sold. Additionally, two, three and five
or more-family homes saw increases in median sales price, as four-family homes
declined 14.2 percent.
CONTENTS
Greater Boston 2
Units Sold 3
Median Selling Price 4
Active Listings 5
New Listings 6
Pending Sales 7
Central Middlesex 8
Eastern Middlesex 9
Metro Boston 10
Metro West 11
Southern Norfolk 12
Multi-Family 13
Regional Map 15
Glossary 16
Data current as of 2/10/2017
Greater Boston Association of REALTORS®
A division of the Greater Boston Real Estate Board
One Center Plaza, Mezzanine Suite 68 Main Street
Boston, MA 02108 Reading, MA 01867
Phone: 617-423-8700
Email: [email protected] Online: www.gbar.org
JANUARY 2017 MARKET INSIGHTS REPORT
© 2017 North Leaf Solutions LLC as Domus Analytics, under license for Greater Boston Association of REALTORS® 2
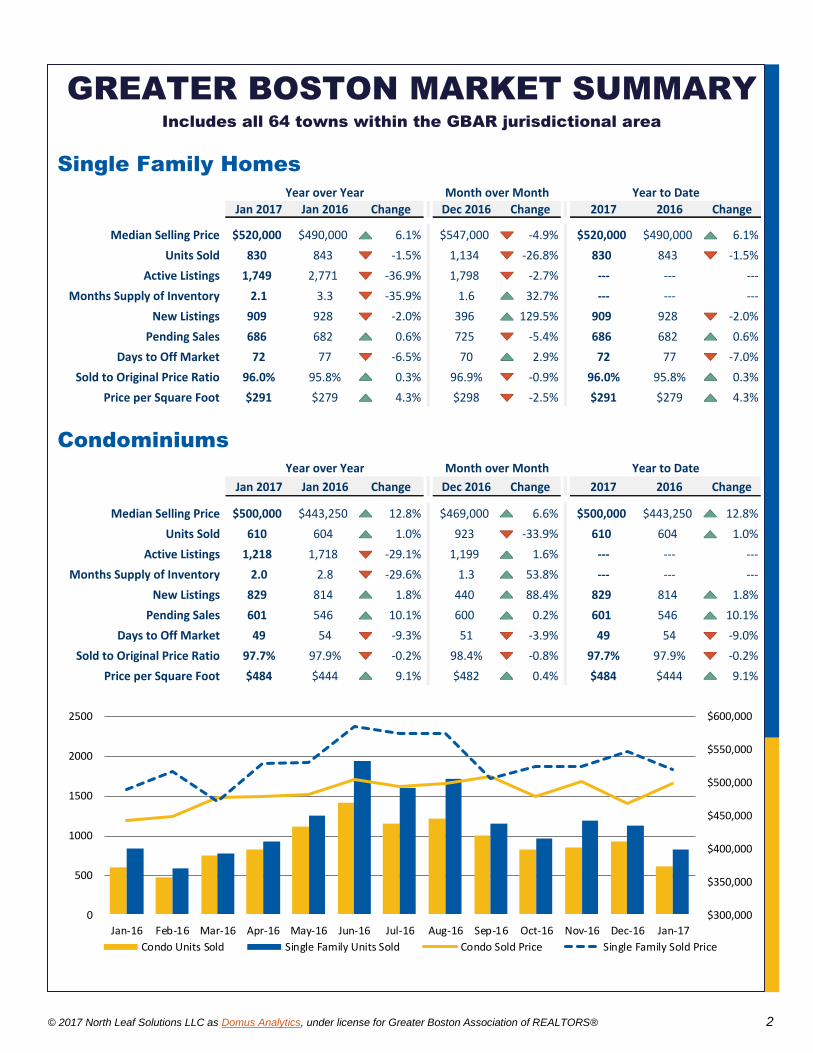
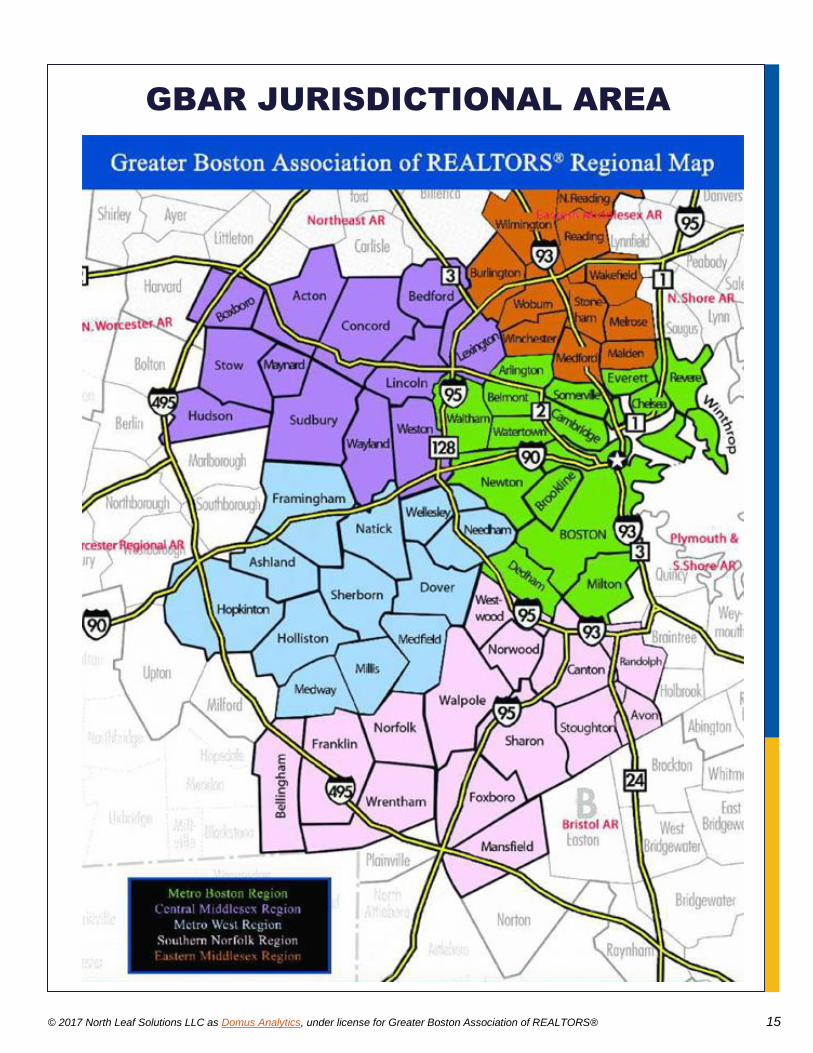
GREATER BOSTON MARKET SUMMARY Includes all 64 towns within the GBAR jurisdictional area
Single Family Homes
Jan 2017 Jan 2016 Change Dec 2016 Change 2017 2016 Change
Median Selling Price $520,000 $490,000 6.1% $547,000 -4.9% $520,000 $490,000 6.1%
Units Sold 830 843 -1.5% 1,134 -26.8% 830 843 -1.5%
Active Listings 1,749 2,771 -36.9% 1,798 -2.7%
Months Supply of Inventory 2.1 3.3 -35.9% 1.6 32.7%
New Listings 909 928 -2.0% 396 129.5% 909 928 -2.0%
Pending Sales 686 682 0.6% 725 -5.4% 686 682 0.6%
Days to Off Market 72 77 -6.5% 70 2.9% 72 77 -7.0%
Sold to Original Price Ratio 96.0% 95.8% 0.3% 96.9% -0.9% 96.0% 95.8% 0.3%
Price per Square Foot $291 $279 4.3% $298 -2.5% $291 $279 4.3%
Year over Year Month over Month Year to Date
Condominiums
Jan 2017 Jan 2016 Change Dec 2016 Change 2017 2016 Change
Median Selling Price $500,000 $443,250 12.8% $469,000 6.6% $500,000 $443,250 12.8%
Units Sold 610 604 1.0% 923 -33.9% 610 604 1.0%
Active Listings 1,218 1,718 -29.1% 1,199 1.6%
Months Supply of Inventory 2.0 2.8 -29.6% 1.3 53.8%
New Listings 829 814 1.8% 440 88.4% 829 814 1.8%
Pending Sales 601 546 10.1% 600 0.2% 601 546 10.1%
Days to Off Market 49 54 -9.3% 51 -3.9% 49 54 -9.0%
Sold to Original Price Ratio 97.7% 97.9% -0.2% 98.4% -0.8% 97.7% 97.9% -0.2%
Price per Square Foot $484 $444 9.1% $482 0.4% $484 $444 9.1%
Year over Year Month over Month Year to Date
$300,000
$350,000
$400,000
$450,000
$500,000
$550,000
$600,000
0
500
1000
1500
2000
2500
Jan-16 Feb-16 Mar-16 Apr-16 May-16 Jun-16 Jul-16 Aug-16 Sep-16 Oct-16 Nov-16 Dec-16 Jan-17
Condo Units Sold Single Family Units Sold Condo Sold Price Single Family Sold Price
© 2017 North Leaf Solutions LLC as Domus Analytics, under license for Greater Boston Association of REALTORS® 3
Jan 2017 Jan 2016 Change Dec 2016 Change 2017 2016 Change
Year over Year Month over Month Year to Date
SINGLE FAMILY HOMES 830 843 -1.5% 1,134 -26.8% 830 843 -1.5%
CONDOMINIUMS 610 604 1.0% 923 -33.9% 610 604 1.0%
60
4
47
3 75
6
82
8 11
21 14
12
11
59
12
15
10
08
82
7
84
8
92
3
61
0
84
3
58
9
78
1 93
2
12
49
19
38
16
05
17
18
11
57
96
2 11
88
11
34
83
0
0
500
1000
1500
2000
2500
Jan-16 Feb-16 Mar-16 Apr-16 May-16 Jun-16 Jul-16 Aug-16 Sep-16 Oct-16 Nov-16 Dec-16 Jan-17
Condominium Single Family Home
0
500
1000
1500
2000
2500
Jan
-13
Ap
r-1
3
Jul-
13
Oct
-13
Jan
-14
Ap
r-1
4
Jul-
14
Oct
-14
Jan
-15
Ap
r-1
5
Jul-
15
Oct
-15
Jan
-16
Ap
r-1
6
Jul-
16
Oct
-16
Jan
-17
Condominium Single Family Home
UNITS SOLD
© 2017 North Leaf Solutions LLC as Domus Analytics, under license for Greater Boston Association of REALTORS® 4
Jan 2017 Jan 2016 Change Dec 2016 Change 2017 2016 Change
Year over Year Month over Month Year to Date
SINGLE FAMILY HOMES $520,000 $490,000 6.1% $547,000 -4.9% $520,000 $490,000 6.1%
CONDOMINIUMS $500,000 $443,250 12.8% $469,000 6.6% $500,000 $443,250 12.8%
$4
43
,25
0
$449
,000
$4
78
,75
0
$480
,228
$482
,500
$505
,000
$4
95
,00
0
$499
,900
$509
,690
$480
,000
$5
02
,03
8
$469
,000
$5
00
,00
0
$490
,000
$5
17
,50
0
$472
,500
$5
30
,00
0
$530
,500
$585
,000
$5
75
,00
0
$5
75
,00
0
$5
06
,50
0
$525
,000
$525
,000
$5
47
,00
0
$520
,000
$0
$100,000
$200,000
$300,000
$400,000
$500,000
$600,000
$700,000
Jan-16 Feb-16 Mar-16 Apr-16 May-16 Jun-16 Jul-16 Aug-16 Sep-16 Oct-16 Nov-16 Dec-16 Jan-17
Condominium Single Family Home
$250,000
$300,000
$350,000
$400,000
$450,000
$500,000
$550,000
$600,000
$650,000
Jan
-13
Ap
r-1
3
Jul-
13
Oct
-13
Jan
-14
Ap
r-1
4
Jul-
14
Oct
-14
Jan
-15
Ap
r-1
5
Jul-
15
Oct
-15
Jan
-16
Ap
r-1
6
Jul-
16
Oct
-16
Jan
-17
Condominium Single Family Home
MEDIAN SELLING PRICE
© 2017 North Leaf Solutions LLC as Domus Analytics, under license for Greater Boston Association of REALTORS® 5
Jan 2017 Jan 2016 Change Dec 2016 Change
Year over Year Month over Month
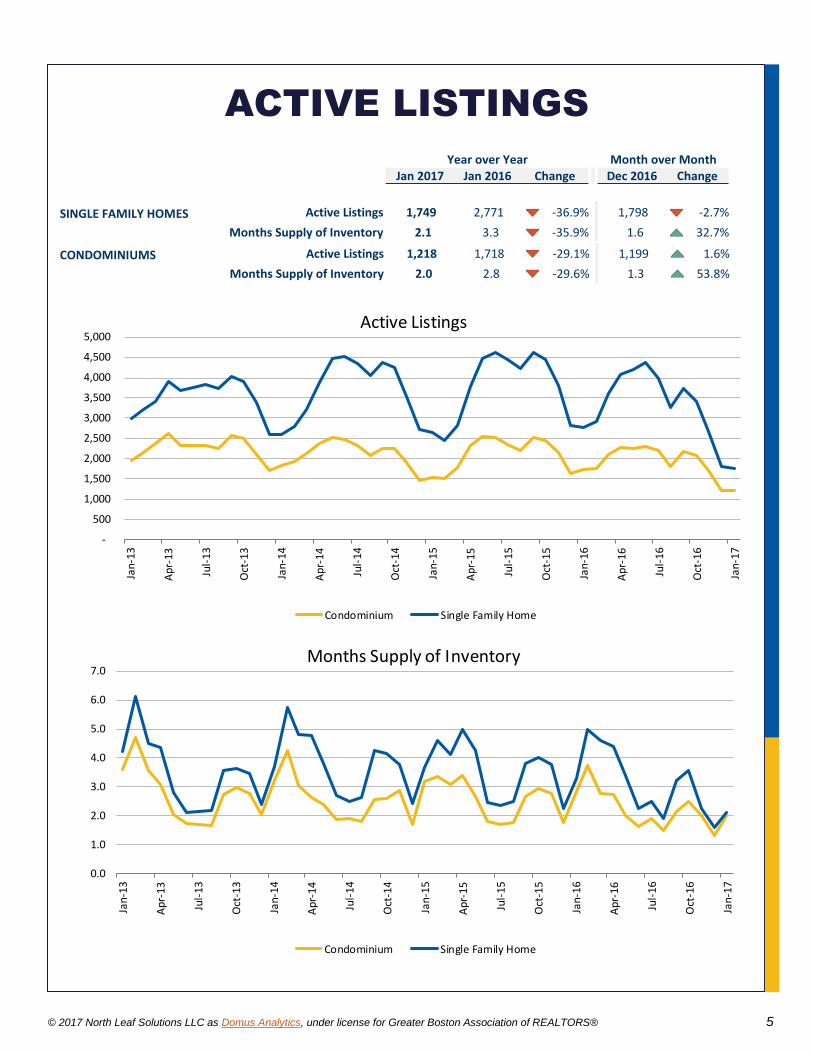
SINGLE FAMILY HOMES Active Listings 1,749 2,771 -36.9% 1,798 -2.7%
Months Supply of Inventory 2.1 3.3 -35.9% 1.6 32.7%
CONDOMINIUMS Active Listings 1,218 1,718 -29.1% 1,199 1.6%
Months Supply of Inventory 2.0 2.8 -29.6% 1.3 53.8%
-
500
1,000
1,500
2,000
2,500
3,000
3,500
4,000
4,500
5,000
Jan
-13
Ap
r-1
3
Jul-
13
Oct
-13
Jan
-14
Ap
r-1
4
Jul-
14
Oct
-14
Jan
-15
Ap
r-1
5
Jul-
15
Oct
-15
Jan
-16
Ap
r-1
6
Jul-
16
Oct
-16
Jan
-17
Active Listings
Condominium Single Family Home
0.0
1.0
2.0
3.0
4.0
5.0
6.0
7.0
Jan
-13
Ap
r-1
3
Jul-
13
Oct
-13
Jan
-14
Ap
r-1
4
Jul-
14
Oct
-14
Jan
-15
Ap
r-1
5
Jul-
15
Oct
-15
Jan
-16
Ap
r-1
6
Jul-
16
Oct
-16
Jan
-17
Months Supply of Inventory
Condominium Single Family Home
ACTIVE LISTINGS
© 2017 North Leaf Solutions LLC as Domus Analytics, under license for Greater Boston Association of REALTORS® 6
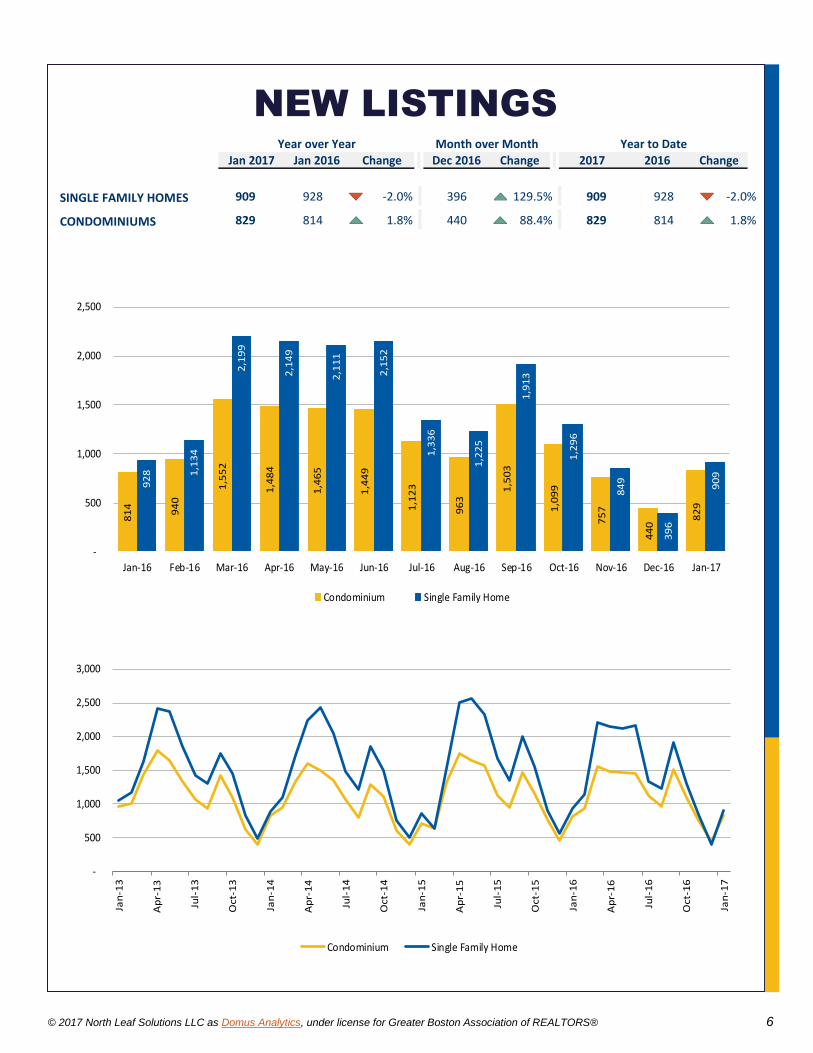
Jan 2017 Jan 2016 Change Dec 2016 Change 2017 2016 Change
Year over Year Month over Month Year to Date
SINGLE FAMILY HOMES 909 928 -2.0% 396 129.5% 909 928 -2.0%
CONDOMINIUMS 829 814 1.8% 440 88.4% 829 814 1.8%
81
4
94
0
1,5
52
1,4
84
1,4
65
1,4
49
1,1
23
96
3 1
,50
3
1,0
99
75
7
44
0 8
29
92
8
1,1
34
2,1
99
2,1
49
2,1
11
2,1
52
1,3
36
1,2
25
1,9
13
1,2
96
84
9
39
6
90
9
-
500
1,000
1,500
2,000
2,500
Jan-16 Feb-16 Mar-16 Apr-16 May-16 Jun-16 Jul-16 Aug-16 Sep-16 Oct-16 Nov-16 Dec-16 Jan-17
Condominium Single Family Home
-
500
1,000
1,500
2,000
2,500
3,000
Jan
-13
Ap
r-1
3
Jul-
13
Oct
-13
Jan
-14
Ap
r-1
4
Jul-
14
Oct
-14
Jan
-15
Ap
r-1
5
Jul-
15
Oct
-15
Jan
-16
Ap
r-1
6
Jul-
16
Oct
-16
Jan
-17
Condominium Single Family Home
NEW LISTINGS
© 2017 North Leaf Solutions LLC as Domus Analytics, under license for Greater Boston Association of REALTORS® 7
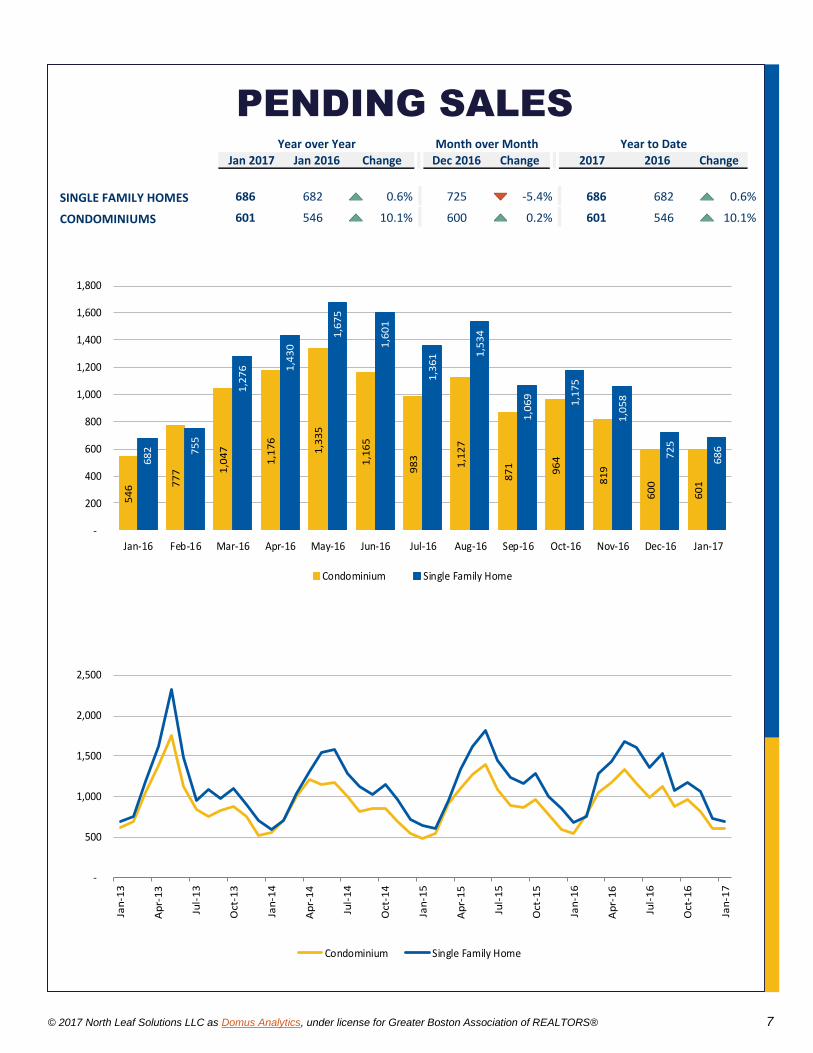
Jan 2017 Jan 2016 Change Dec 2016 Change 2017 2016 Change
Year over Year Month over Month Year to Date
SINGLE FAMILY HOMES 686 682 0.6% 725 -5.4% 686 682 0.6%
CONDOMINIUMS 601 546 10.1% 600 0.2% 601 546 10.1%
54
6 77
7 1,0
47
1,1
76
1,3
35
1,1
65
98
3
1,1
27
87
1
96
4
81
9
60
0
60
1
68
2
75
5
1,2
76
1,4
30
1,6
75
1,6
01
1,3
61
1,5
34
1,0
69
1,1
75
1,0
58
72
5
68
6
-
200
400
600
800
1,000
1,200
1,400
1,600
1,800
Jan-16 Feb-16 Mar-16 Apr-16 May-16 Jun-16 Jul-16 Aug-16 Sep-16 Oct-16 Nov-16 Dec-16 Jan-17
Condominium Single Family Home
-
500
1,000
1,500
2,000
2,500
Jan
-13
Ap
r-1
3
Jul-
13
Oct
-13
Jan
-14
Ap
r-1
4
Jul-
14
Oct
-14
Jan
-15
Ap
r-1
5
Jul-
15
Oct
-15
Jan
-16
Ap
r-1
6
Jul-
16
Oct
-16
Jan
-17
Condominium Single Family Home
PENDING SALES
© 2017 North Leaf Solutions LLC as Domus Analytics, under license for Greater Boston Association of REALTORS® 8
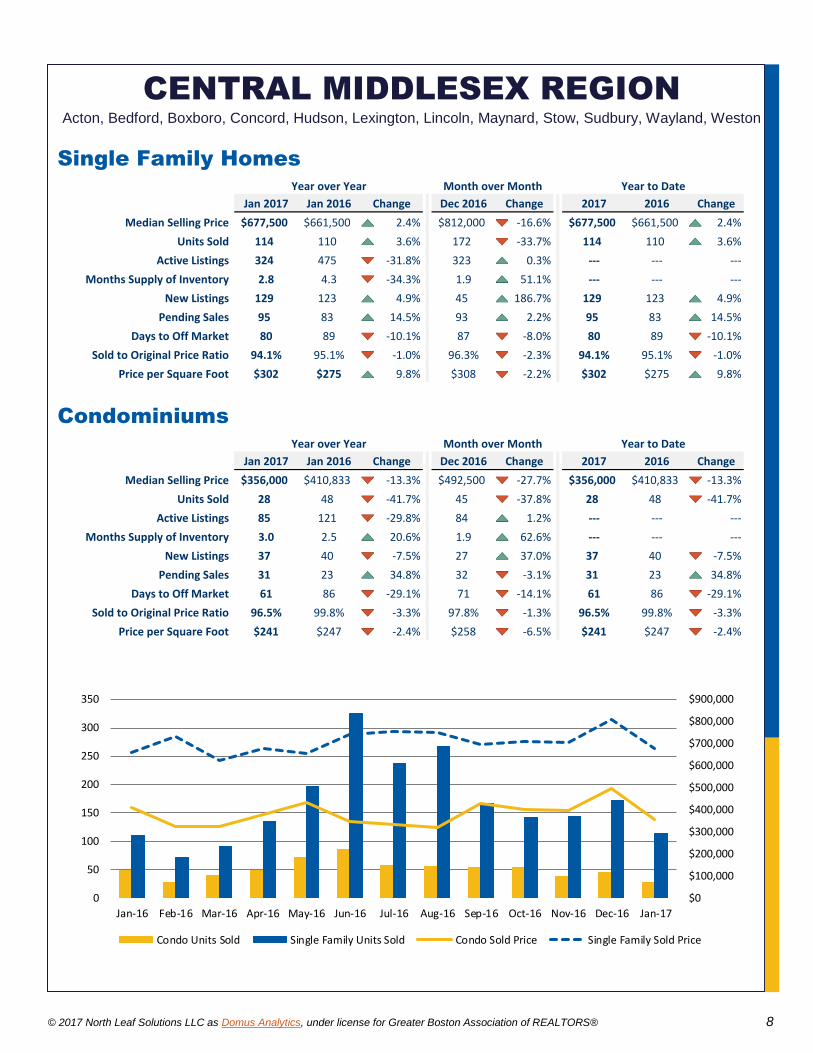
CENTRAL MIDDLESEX REGION Acton, Bedford, Boxboro, Concord, Hudson, Lexington, Lincoln, Maynard, Stow, Sudbury, Wayland, Weston
Single Family Homes
Jan 2017 Jan 2016 Change Dec 2016 Change 2017 2016 Change
Median Selling Price $677,500 $661,500 2.4% $812,000 -16.6% $677,500 $661,500 2.4%
Units Sold 114 110 3.6% 172 -33.7% 114 110 3.6%
Active Listings 324 475 -31.8% 323 0.3%
Months Supply of Inventory 2.8 4.3 -34.3% 1.9 51.1%
New Listings 129 123 4.9% 45 186.7% 129 123 4.9%
Pending Sales 95 83 14.5% 93 2.2% 95 83 14.5%
Days to Off Market 80 89 -10.1% 87 -8.0% 80 89 -10.1%
Sold to Original Price Ratio 94.1% 95.1% -1.0% 96.3% -2.3% 94.1% 95.1% -1.0%
Price per Square Foot $302 $275 9.8% $308 -2.2% $302 $275 9.8%
Year over Year Month over Month Year to Date
Condominiums
Jan 2017 Jan 2016 Change Dec 2016 Change 2017 2016 Change
Median Selling Price $356,000 $410,833 -13.3% $492,500 -27.7% $356,000 $410,833 -13.3%
Units Sold 28 48 -41.7% 45 -37.8% 28 48 -41.7%
Active Listings 85 121 -29.8% 84 1.2%
Months Supply of Inventory 3.0 2.5 20.6% 1.9 62.6%
New Listings 37 40 -7.5% 27 37.0% 37 40 -7.5%
Pending Sales 31 23 34.8% 32 -3.1% 31 23 34.8%
Days to Off Market 61 86 -29.1% 71 -14.1% 61 86 -29.1%
Sold to Original Price Ratio 96.5% 99.8% -3.3% 97.8% -1.3% 96.5% 99.8% -3.3%
Price per Square Foot $241 $247 -2.4% $258 -6.5% $241 $247 -2.4%
Year over Year Month over Month Year to Date
$0
$100,000
$200,000
$300,000
$400,000
$500,000
$600,000
$700,000
$800,000
$900,000
0
50
100
150
200
250
300
350
Jan-16 Feb-16 Mar-16 Apr-16 May-16 Jun-16 Jul-16 Aug-16 Sep-16 Oct-16 Nov-16 Dec-16 Jan-17
Condo Units Sold Single Family Units Sold Condo Sold Price Single Family Sold Price
© 2017 North Leaf Solutions LLC as Domus Analytics, under license for Greater Boston Association of REALTORS® 9
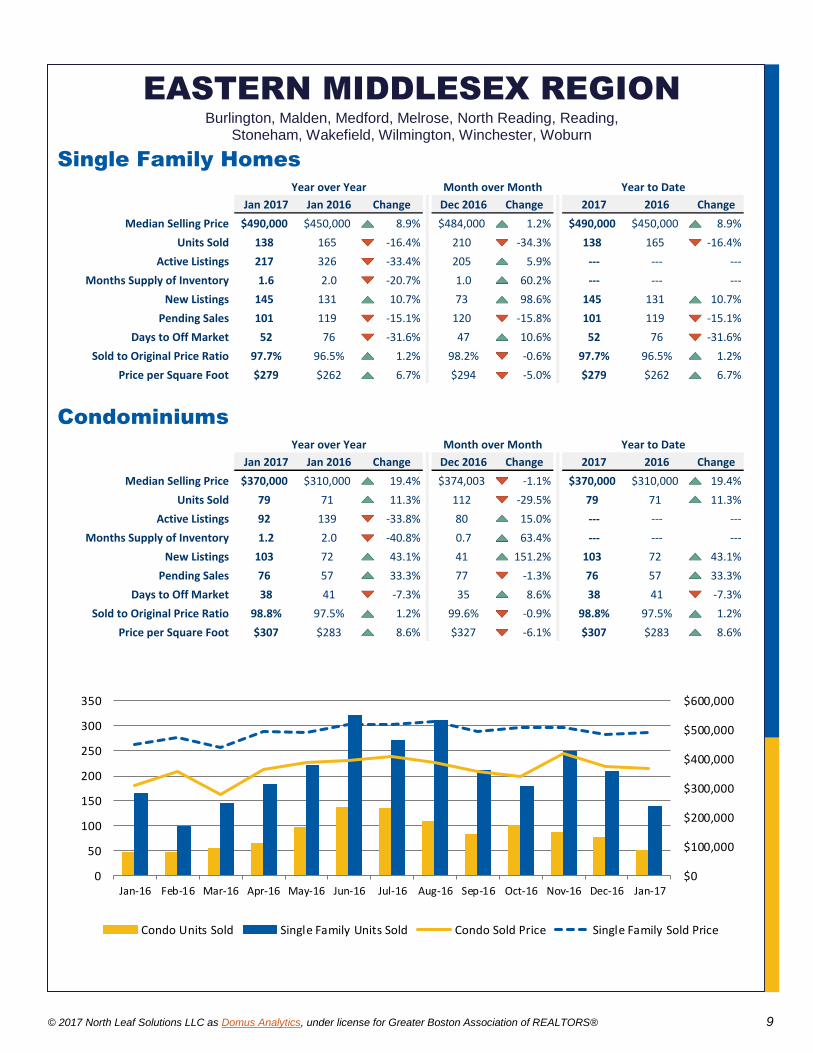
EASTERN MIDDLESEX REGION Burlington, Malden, Medford, Melrose, North Reading, Reading,
Stoneham, Wakefield, Wilmington, Winchester, Woburn
Single Family Homes
Jan 2017 Jan 2016 Change Dec 2016 Change 2017 2016 Change
Median Selling Price $490,000 $450,000 8.9% $484,000 1.2% $490,000 $450,000 8.9%
Units Sold 138 165 -16.4% 210 -34.3% 138 165 -16.4%
Active Listings 217 326 -33.4% 205 5.9%
Months Supply of Inventory 1.6 2.0 -20.7% 1.0 60.2%
New Listings 145 131 10.7% 73 98.6% 145 131 10.7%
Pending Sales 101 119 -15.1% 120 -15.8% 101 119 -15.1%
Days to Off Market 52 76 -31.6% 47 10.6% 52 76 -31.6%
Sold to Original Price Ratio 97.7% 96.5% 1.2% 98.2% -0.6% 97.7% 96.5% 1.2%
Price per Square Foot $279 $262 6.7% $294 -5.0% $279 $262 6.7%
Year over Year Month over Month Year to Date
Condominiums
Jan 2017 Jan 2016 Change Dec 2016 Change 2017 2016 Change
Median Selling Price $370,000 $310,000 19.4% $374,003 -1.1% $370,000 $310,000 19.4%
Units Sold 79 71 11.3% 112 -29.5% 79 71 11.3%
Active Listings 92 139 -33.8% 80 15.0%
Months Supply of Inventory 1.2 2.0 -40.8% 0.7 63.4%
New Listings 103 72 43.1% 41 151.2% 103 72 43.1%
Pending Sales 76 57 33.3% 77 -1.3% 76 57 33.3%
Days to Off Market 38 41 -7.3% 35 8.6% 38 41 -7.3%
Sold to Original Price Ratio 98.8% 97.5% 1.2% 99.6% -0.9% 98.8% 97.5% 1.2%
Price per Square Foot $307 $283 8.6% $327 -6.1% $307 $283 8.6%
Year over Year Month over Month Year to Date
$0
$100,000
$200,000
$300,000
$400,000
$500,000
$600,000
0
50
100
150
200
250
300
350
Jan-16 Feb-16 Mar-16 Apr-16 May-16 Jun-16 Jul-16 Aug-16 Sep-16 Oct-16 Nov-16 Dec-16 Jan-17
Condo Units Sold Single Family Units Sold Condo Sold Price Single Family Sold Price
© 2017 North Leaf Solutions LLC as Domus Analytics, under license for Greater Boston Association of REALTORS® 10
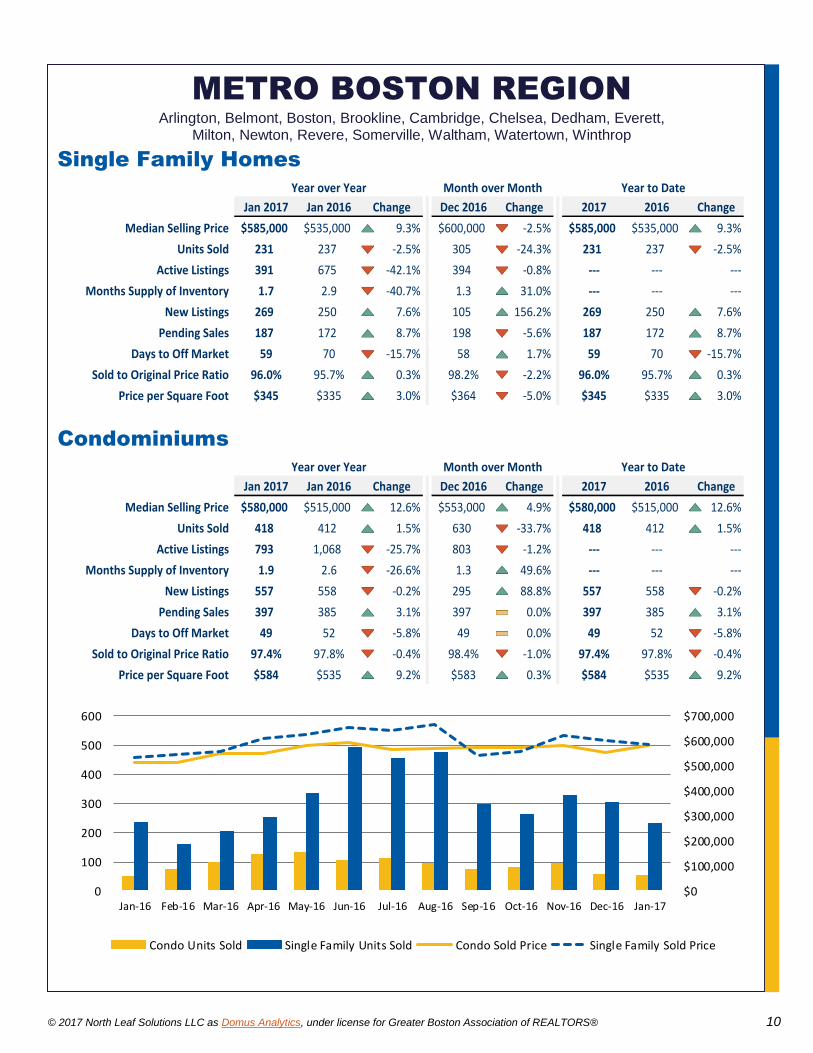
METRO BOSTON REGION Arlington, Belmont, Boston, Brookline, Cambridge, Chelsea, Dedham, Everett,
Milton, Newton, Revere, Somerville, Waltham, Watertown, Winthrop
Single Family Homes
Jan 2017 Jan 2016 Change Dec 2016 Change 2017 2016 Change
Median Selling Price $585,000 $535,000 9.3% $600,000 -2.5% $585,000 $535,000 9.3%
Units Sold 231 237 -2.5% 305 -24.3% 231 237 -2.5%
Active Listings 391 675 -42.1% 394 -0.8%
Months Supply of Inventory 1.7 2.9 -40.7% 1.3 31.0%
New Listings 269 250 7.6% 105 156.2% 269 250 7.6%
Pending Sales 187 172 8.7% 198 -5.6% 187 172 8.7%
Days to Off Market 59 70 -15.7% 58 1.7% 59 70 -15.7%
Sold to Original Price Ratio 96.0% 95.7% 0.3% 98.2% -2.2% 96.0% 95.7% 0.3%
Price per Square Foot $345 $335 3.0% $364 -5.0% $345 $335 3.0%
Year over Year Month over Month Year to Date
Condominiums
Jan 2017 Jan 2016 Change Dec 2016 Change 2017 2016 Change
Median Selling Price $580,000 $515,000 12.6% $553,000 4.9% $580,000 $515,000 12.6%
Units Sold 418 412 1.5% 630 -33.7% 418 412 1.5%
Active Listings 793 1,068 -25.7% 803 -1.2%
Months Supply of Inventory 1.9 2.6 -26.6% 1.3 49.6%
New Listings 557 558 -0.2% 295 88.8% 557 558 -0.2%
Pending Sales 397 385 3.1% 397 0.0% 397 385 3.1%
Days to Off Market 49 52 -5.8% 49 0.0% 49 52 -5.8%
Sold to Original Price Ratio 97.4% 97.8% -0.4% 98.4% -1.0% 97.4% 97.8% -0.4%
Price per Square Foot $584 $535 9.2% $583 0.3% $584 $535 9.2%
Year over Year Month over Month Year to Date
$0
$100,000
$200,000
$300,000
$400,000
$500,000
$600,000
$700,000
0
100
200
300
400
500
600
Jan-16 Feb-16 Mar-16 Apr-16 May-16 Jun-16 Jul-16 Aug-16 Sep-16 Oct-16 Nov-16 Dec-16 Jan-17
Condo Units Sold Single Family Units Sold Condo Sold Price Single Family Sold Price
© 2017 North Leaf Solutions LLC as Domus Analytics, under license for Greater Boston Association of REALTORS® 11
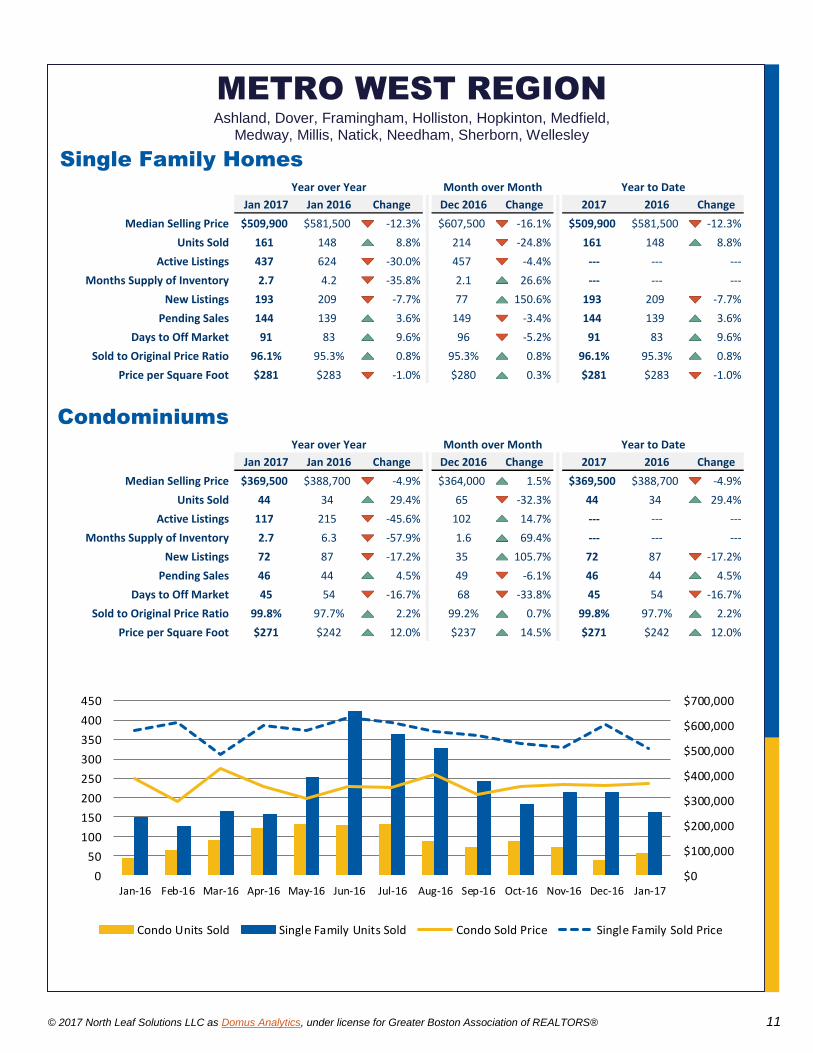
METRO WEST REGION Ashland, Dover, Framingham, Holliston, Hopkinton, Medfield,
Medway, Millis, Natick, Needham, Sherborn, Wellesley
Single Family Homes
Jan 2017 Jan 2016 Change Dec 2016 Change 2017 2016 Change
Median Selling Price $509,900 $581,500 -12.3% $607,500 -16.1% $509,900 $581,500 -12.3%
Units Sold 161 148 8.8% 214 -24.8% 161 148 8.8%
Active Listings 437 624 -30.0% 457 -4.4%
Months Supply of Inventory 2.7 4.2 -35.8% 2.1 26.6%
New Listings 193 209 -7.7% 77 150.6% 193 209 -7.7%
Pending Sales 144 139 3.6% 149 -3.4% 144 139 3.6%
Days to Off Market 91 83 9.6% 96 -5.2% 91 83 9.6%
Sold to Original Price Ratio 96.1% 95.3% 0.8% 95.3% 0.8% 96.1% 95.3% 0.8%
Price per Square Foot $281 $283 -1.0% $280 0.3% $281 $283 -1.0%
Year over Year Month over Month Year to Date
Condominiums
Jan 2017 Jan 2016 Change Dec 2016 Change 2017 2016 Change
Median Selling Price $369,500 $388,700 -4.9% $364,000 1.5% $369,500 $388,700 -4.9%
Units Sold 44 34 29.4% 65 -32.3% 44 34 29.4%
Active Listings 117 215 -45.6% 102 14.7%
Months Supply of Inventory 2.7 6.3 -57.9% 1.6 69.4%
New Listings 72 87 -17.2% 35 105.7% 72 87 -17.2%
Pending Sales 46 44 4.5% 49 -6.1% 46 44 4.5%
Days to Off Market 45 54 -16.7% 68 -33.8% 45 54 -16.7%
Sold to Original Price Ratio 99.8% 97.7% 2.2% 99.2% 0.7% 99.8% 97.7% 2.2%
Price per Square Foot $271 $242 12.0% $237 14.5% $271 $242 12.0%
Year over Year Month over Month Year to Date
$0
$100,000
$200,000
$300,000
$400,000
$500,000
$600,000
$700,000
0
50
100
150
200
250
300
350
400
450
Jan-16 Feb-16 Mar-16 Apr-16 May-16 Jun-16 Jul-16 Aug-16 Sep-16 Oct-16 Nov-16 Dec-16 Jan-17
Condo Units Sold Single Family Units Sold Condo Sold Price Single Family Sold Price
© 2017 North Leaf Solutions LLC as Domus Analytics, under license for Greater Boston Association of REALTORS® 12
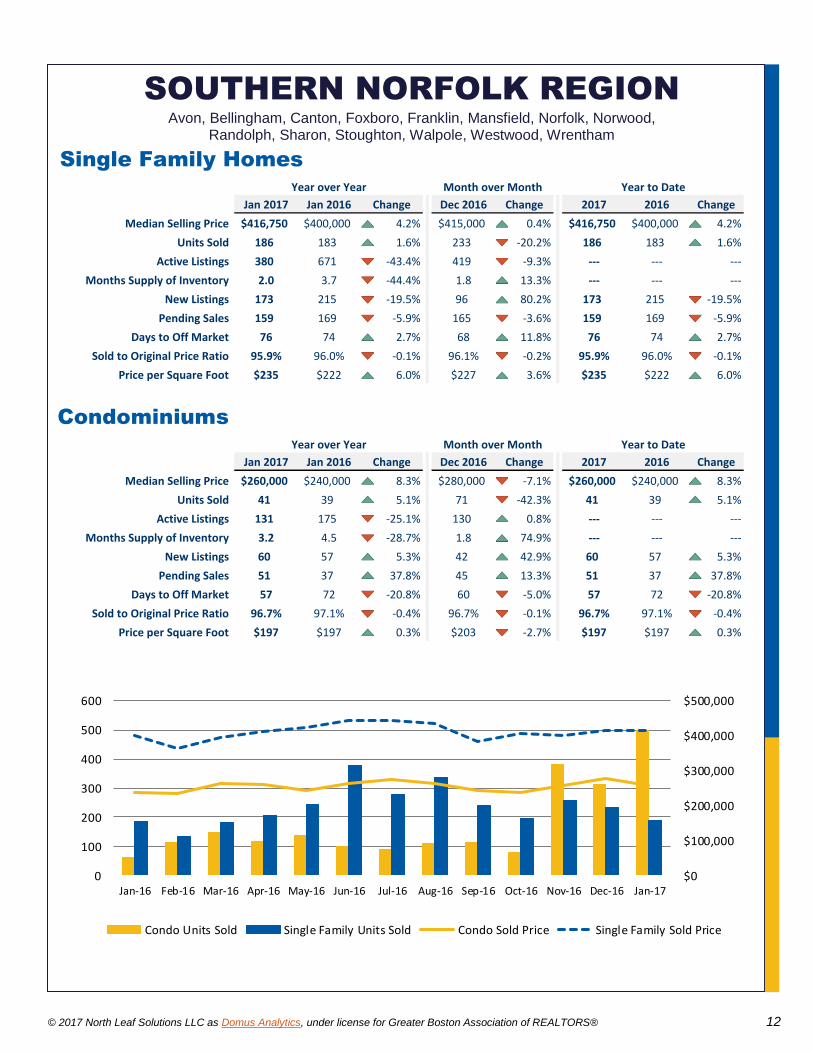
SOUTHERN NORFOLK REGION Avon, Bellingham, Canton, Foxboro, Franklin, Mansfield, Norfolk, Norwood,
Randolph, Sharon, Stoughton, Walpole, Westwood, Wrentham
Single Family Homes
Jan 2017 Jan 2016 Change Dec 2016 Change 2017 2016 Change
Median Selling Price $416,750 $400,000 4.2% $415,000 0.4% $416,750 $400,000 4.2%
Units Sold 186 183 1.6% 233 -20.2% 186 183 1.6%
Active Listings 380 671 -43.4% 419 -9.3%
Months Supply of Inventory 2.0 3.7 -44.4% 1.8 13.3%
New Listings 173 215 -19.5% 96 80.2% 173 215 -19.5%
Pending Sales 159 169 -5.9% 165 -3.6% 159 169 -5.9%
Days to Off Market 76 74 2.7% 68 11.8% 76 74 2.7%
Sold to Original Price Ratio 95.9% 96.0% -0.1% 96.1% -0.2% 95.9% 96.0% -0.1%
Price per Square Foot $235 $222 6.0% $227 3.6% $235 $222 6.0%
Year over Year Month over Month Year to Date
Condominiums
Jan 2017 Jan 2016 Change Dec 2016 Change 2017 2016 Change
Median Selling Price $260,000 $240,000 8.3% $280,000 -7.1% $260,000 $240,000 8.3%
Units Sold 41 39 5.1% 71 -42.3% 41 39 5.1%
Active Listings 131 175 -25.1% 130 0.8%
Months Supply of Inventory 3.2 4.5 -28.7% 1.8 74.9%
New Listings 60 57 5.3% 42 42.9% 60 57 5.3%
Pending Sales 51 37 37.8% 45 13.3% 51 37 37.8%
Days to Off Market 57 72 -20.8% 60 -5.0% 57 72 -20.8%
Sold to Original Price Ratio 96.7% 97.1% -0.4% 96.7% -0.1% 96.7% 97.1% -0.4%
Price per Square Foot $197 $197 0.3% $203 -2.7% $197 $197 0.3%
Year over Year Month over Month Year to Date
$0
$100,000
$200,000
$300,000
$400,000
$500,000
0
100
200
300
400
500
600
Jan-16 Feb-16 Mar-16 Apr-16 May-16 Jun-16 Jul-16 Aug-16 Sep-16 Oct-16 Nov-16 Dec-16 Jan-17
Condo Units Sold Single Family Units Sold Condo Sold Price Single Family Sold Price
© 2017 North Leaf Solutions LLC as Domus Analytics, under license for Greater Boston Association of REALTORS® 13
MULTI-FAMILY MARKET SUMMARY Includes all 64 towns within the GBAR jurisdictional area
2 Family Homes
Jan 2017 Jan 2016 Change Dec 2016 Change 2017 2016 Change
Median Selling Price $550,000 $537,000 2.4% $577,500 -4.8% $550,000 $537,000 2.4%
Units Sold 119 111 7.2% 144 -17.4% 119 111 7.2%
Active Listings 145 145 0.0% 145 0.0%
Months Supply of Inventory 1.3 2.9 -55.9% 1.1 14.5%
New Listings 115 105 9.5% 66 74.2% 115 105 9.5%
Pending Sales 84 79 6.3% 80 5.0% 84 79 6.3%
Days to Off Market 57 75 -24.0% 50 14.0% 57 75 -23.2%
Sold to Original Price Ratio 100.3% 97.5% 2.9% 97.6% 2.7% 100.3% 97.5% 2.9%
Price per Square Foot $250 $231 8.2% $250 -0.1% $250 $231 8.2%
Year over Year Month over Month Year to Date
3 Family Homes
Jan 2017 Jan 2016 Change Dec 2016 Change 2017 2016 Change
Median Selling Price $750,000 $616,250 21.7% $702,250 6.8% $750,000 $616,250 21.7%
Units Sold 43 50 -14.0% 58 -25.9% 43 50 -14.0%
Active Listings 150 318 -52.8% 158 -5.1%
Months Supply of Inventory 1.4 2.6 -44.2% 1.1 28.6%
New Listings 45 43 4.7% 29 55.2% 45 43 4.7%
Pending Sales 35 33 6.1% 37 -5.4% 35 33 6.1%
Days to Off Market 28 65 -56.9% 47 -40.4% 28 65 -56.1%
Sold to Original Price Ratio 101.1% 96.7% 4.6% 99.0% 2.2% 101.1% 96.7% 4.6%
Price per Square Foot $260 $214 21.4% $230 13.1% $260 $214 21.4%
Year over Year Month over Month Year to Date
4 Family Homes
Jan 2017 Jan 2016 Change Dec 2016 Change 2017 2016 Change
Median Selling Price $777,500 $906,000 -14.2% $790,000 -1.6% $777,500 $906,000 -14.2%
Units Sold 6 9 -33.3% 9 -33.3% 6 9 -33.3%
Active Listings 62 129 -51.9% 65 -4.6%
Months Supply of Inventory 1.7 4.0 -58.3% 1.3 25.6%
New Listings 8 7 14.3% 4 100.0% 8 7 14.3%
Pending Sales 4 0 7 -42.9% 4 0
Days to Off Market 43 0 47 -8.5% 43 0
Sold to Original Price Ratio 100.5% 97.4% 3.1% 97.7% 2.9% 100.5% 97.4% 3.1%
Price per Square Foot $190 $337 -43.6% $323 -41.1% $190 $337 -43.6%
Year to DateYear over Year Month over Month
© 2017 North Leaf Solutions LLC as Domus Analytics, under license for Greater Boston Association of REALTORS® 14
MULTI-FAMILY MARKET SUMMARY Includes all 64 towns within the GBAR jurisdictional area
5+ Family Homes
Jan 2017 Jan 2016 Change Dec 2016 Change 2017 2016 Change
Median Selling Price $2,950,000 $2,447,500 20.5% $1,175,000 151.1% $2,950,000 $2,447,500 20.5%
Units Sold 11 8 37.5% 8 37.5% 11 8 37.5%
Active Listings 10 36 -72.2% 12 -16.7%
Months Supply of Inventory 1.9 5.8 -66.8% 3.1 -38.8%
New Listings 10 13 -23.1% 6 66.7% 10 13 -23.1%
Pending Sales 8 5 60.0% 6 33.3% 8 5 60.0%
Days to Off Market 79 142 -44.4% 36 119.4% 79 142 -44.7%
Sold to Original Price Ratio 97.7% 90.3% 8.3% 92.4% 5.8% 97.7% 90.3% 8.3%
Price per Square Foot $464 $507 -8.4% $468 -0.8% $464 $507 -8.4%
Year over Year Month over Month Year to Date
$250,000
$750,000
$1,250,000
$1,750,000
$2,250,000
$2,750,000
$3,250,000
$3,750,000
Jan-
16
Feb
-16
Mar
-16
Apr
-16
Ma
y-1
6
Jun-
16
Jul-
16
Aug
-16
Sep
-16
Oct
-16
Nov
-16
Dec
-16
Jan-
17
Median Selling Price
Multi: 2 Family Multi: 3 Family Multi: 4 Family Multi: 5+ Family
111119
5043
9 6
8 11
0
20
40
60
80
100
120
140
160
180
Jan-
16
Feb
-16
Mar
-16
Apr
-16
Ma
y-1
6
Jun-
16
Jul-
16
Aug
-16
Sep
-16
Oct
-16
Nov
-16
Dec
-16
Jan-
17
Units Sold
Multi: 2 Family Multi: 3 Family Multi: 4 Family Multi: 5+ Family
© 2017 North Leaf Solutions LLC as Domus Analytics, under license for Greater Boston Association of REALTORS® 15
GBAR JURISDICTIONAL AREA
© 2017 North Leaf Solutions LLC as Domus Analytics, under license for Greater Boston Association of REALTORS® 16
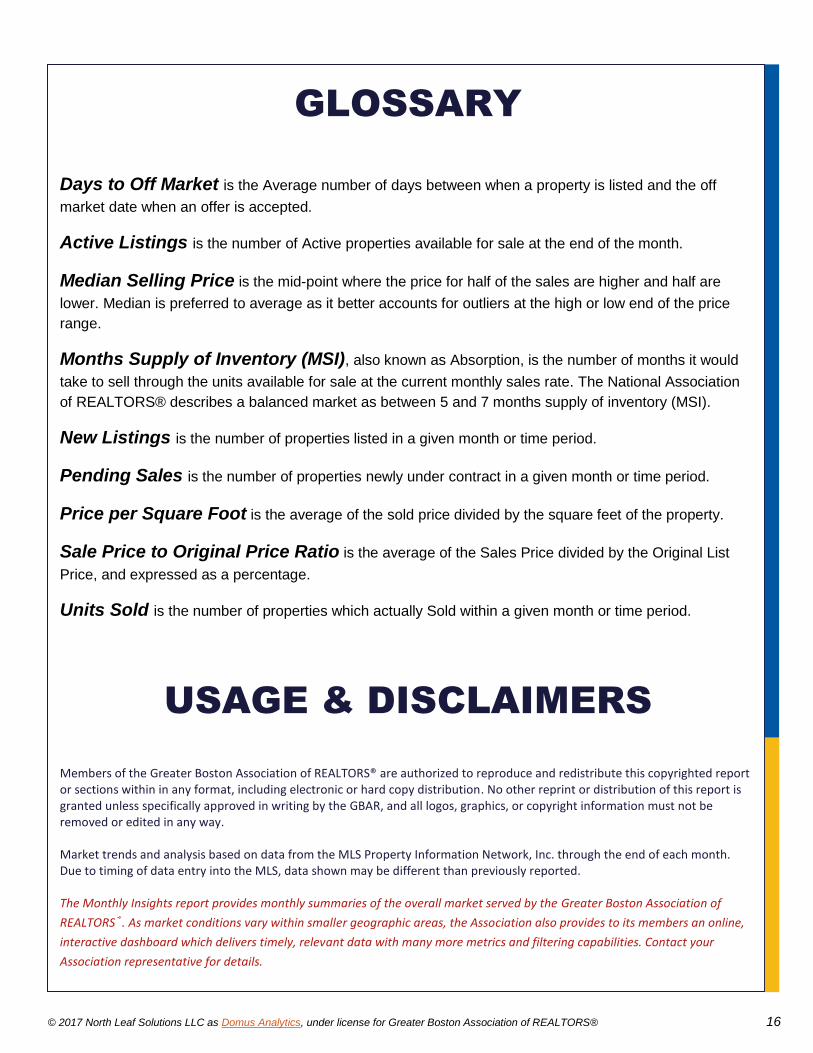
Days to Off Market is the Average number of days between when a property is listed and the off
market date when an offer is accepted.
Active Listings is the number of Active properties available for sale at the end of the month.
Median Selling Price is the mid-point where the price for half of the sales are higher and half are
lower. Median is preferred to average as it better accounts for outliers at the high or low end of the price
range.
Months Supply of Inventory (MSI), also known as Absorption, is the number of months it would
take to sell through the units available for sale at the current monthly sales rate. The National Association
of REALTORS® describes a balanced market as between 5 and 7 months supply of inventory (MSI).
New Listings is the number of properties listed in a given month or time period.
Pending Sales is the number of properties newly under contract in a given month or time period.
Price per Square Foot is the average of the sold price divided by the square feet of the property.
Sale Price to Original Price Ratio is the average of the Sales Price divided by the Original List
Price, and expressed as a percentage.
Units Sold is the number of properties which actually Sold within a given month or time period.
Members of the Greater Boston Association of REALTORS® are authorized to reproduce and redistribute this copyrighted report or sections within in any format, including electronic or hard copy distribution. No other reprint or distribution of this report is granted unless specifically approved in writing by the GBAR, and all logos, graphics, or copyright information must not be removed or edited in any way. Market trends and analysis based on data from the MLS Property Information Network, Inc. through the end of each month. Due to timing of data entry into the MLS, data shown may be different than previously reported.
The Monthly Insights report provides monthly summaries of the overall market served by the Greater Boston Association of
REALTORS®. As market conditions vary within smaller geographic areas, the Association also provides to its members an online,
interactive dashboard which delivers timely, relevant data with many more metrics and filtering capabilities. Contact your
Association representative for details.
GLOSSARY
USAGE & DISCLAIMERS