government role in growth and … no.3 july 2014 issn: 2320-4168 shanlax international journal of...
TRANSCRIPT

Vol.2 No.3 July 2014 ISSN: 2320-4168
Shanlax International Journal of Commerce 81
GOVERNMENT ROLE IN GROWTH AND DEVELOPMENT OF INDIAN TOURISM INDUSTRY WITH SPECIAL REFERENCE TO TAMIL NADU TOURISM
Dr.R.Rajasekaran
Prof & Head (Rtd), PG & Research Department of Commerce,
Arumugam Pillai Seethai Ammal College, Tiruppattur
P.Kasivairavan
Part Time Ph.D Research Scholar, Manonmaniam Sundaranar University
Abstract
India is at present one of the leading growth centers of tourism internationally.
The value of tourism is well recognized in India, few policy prescriptions for the growth of
healthy tourism have been developed. Tourism industry in India is becoming one of the
powerful service industries in the new millennium. It is not only a significant contributor to
GDP and foreign exchange reserve of the country but also it provides large employment.
Tourism in Tamil Nadu has registered significant growth in the recent years. The study
covered central Government and Tamil Nadu government who are acting vital role in
developing tourism industry and assess the government’s role through five year plan and
tourism policy, tourists’ arrivals and foreign exchange. The collected information has been
complied, grouped and prepared the tables, charts and trend analysis also using the study.
Keywords: Growth, Development, Plan payout, Tourist arrivals.
Introduction
India is at present one of the leading growth centers of tourism internationally.
Though, India is one amongst the most sought after destination in the region, India’s
performance in the sector has been rather poor, compared to other countries in the region.
Major causes cited for the low performance are lack of professionalism, unhygienic
conditions, poor infrastructure, lack of easily accessible information, lack of safety, poor
visitor experience, restrictive air transport policy, inadequate facilitation services,
multiplicity of taxes and the low priority accorded to tourism. However, despite its tiny
share of world tourist arrivals, tourism in India has emerged the second largest foreign
exchange earner for the country even though the mainstay of the Tourism industry in India
continues to be domestic tourism. The value of tourism is well recognized in India, few
policy prescriptions for the growth of healthy tourism have been developed. Tourism
remained an elitist activity for quite a long time, it was nowhere on the list of national
priorities. Tourism grew on its own in India.
Vol.2 No.3 July 2014 ISSN: 2320-4168
Shanlax International Journal of Commerce 82
Justification about Reason for Choosing the Topic
Tourism industry in India is becoming one of the powerful service industries in the
new millennium. It is not only a significant contributor to GDP and foreign exchange
reserve of the country but also it provides large employment. Tourism in Tamil Nadu has
registered significant growth in the recent years. It is an accepted fact that Tamil Nadu
has tremendous potential for development of tourism. The variety of Tamil Nadu’s natural
and cultural richness provides the basis of a wide range of tourist products and experience,
which hug business, leisure, culture, adventure, spirituality, and many others. Apart from
acknowledging the traditionally recognized advantages of developing tourism for the
promotion of national integration, international understanding, earning of foreign exchange
and vast employment generation, it can play a major role in further the socio-economic
objectives of Tamil Nadu.
What most may think is growth and developments are two different things. Either
is a predecessor or dependent of the other. Moreover, it is fairly easy to distinguish them
from one another. Rule of thumb is that growth relates to quantitative measurement while
development is to qualitative basis.
Growth relates to quantitative measurement therefore, something that increases
in it is called growth it’s like tourist’s arrivals and foreign exchange earnings through
year by year from tourism developmental activities.
Development is to qualitative basis. Therefore, tourists expect some basic needs
and infrastructure facilities, that expectation are implementing by governments in
tourism industry through tourism policy and planning is called development.
The study has tremendous scope for the growth and development of tourism.
Simple statistical tools were applied to analyse the data and accordingly the findings are
discussed and furnished.
Objectives of the Study:
1. To assess the government’s role through five year plan and tourism policy
2. To analysis the flow pattern of tourists arrivals
3. To analysis the foreign exchange earnings from tourism industry
Scope and Methodologies of the study
The study covered central Government and Tamil Nadu government who are acting
vital role in developing tourism industry. In the present study fully based on Secondary
sources of data are used. Source of data include existing policy notes, journals and Ministry
of tourism statistic. The information related to tourist arrivals, plan payout, foreign
exchange earnings have been collected from above secondary sources in government
records. The collected information has been complied, grouped and prepared the tables,
charts and trend analysis also using the study.
Vol.2 No.3 July 2014 ISSN: 2320-4168
Shanlax International Journal of Commerce 83
Limitation of the Study
The study has been conducted only about the government’s role in growth and
development of tourism industry.
Tourism Development throughout Five Year Plans
In fact tourism planning is the process for tourism development. The tourism
planning process involves creating a future that is acceptable to the host community as also
to others who would be part of the host community as tourists for a short period of time.
Since tourism involves hospitality, planning for various tourism facilities must be based on
the guests. Tourism planning essentially attempts to allocate scarce resources between
different competing uses with a view to maximizing output, income, employment and to
ensure the balanced growth of various sectors. The five year plan is a mirror of the
country’s perception about the direction of social-economic progress.
Tourism Plan payout
The Plan Schemes of the Ministry of Tourism essentially relate to the Tourism
Product/Infrastructure Development, Human Resource Development, Promotion, Marketing
and Market Research including Perspective Plan. Since most of the infrastructure
components and delivery systems are within the purview of the State Governments or
private sector, the infrastructure for tourism is mainly being developed by providing
financial assistance to State/UT Governments, and by providing various incentives to
private entrepreneurs. Table 1 gives the Plan-wise payout over consecutive five year plans
of Ministry of Tourism for the First Five Year Plans (1951-1956) to Twelfth Five Year Plan
(2012-2017). Amount sanctioned by Ministry of Tourism to various State/UT Governments
during the years and information is also tabulated in the following way;
TABLE 1.Plan -Wise payout of Ministry of Tourism for the Five Year Plans (1951-1956 to
2012-2017) (in Crores)
Plan Period Plan payout Increase/ Decrease
First Plan* 1951-1956 NA NA
Second Plan* 1965-1961 3.36 -
Third Plan* 1961-1966 8.00 4.64
Annual Plan* 1966-1969 10.00 2.00
Fourth Plan* 1969-1974 36.00 26.00
Fifth Plan* 1974-1979 75.00 39.00
Annual Plan* 1979-1980 28.00 -47.00
Sixth Plan* 1980-1985 187.00 159.00
Seventh Plan* 1985-1990 394.00 207.00
Annual Plan* 1990-1991 149.00 -245.00

Vol.2 No.3 July 2014 ISSN: 2320-4168
Shanlax International Journal of Commerce 84
Annual Plan* 1991-1992 176.00 27.00
Eighth Plan* 1992-1997 806.00 630.00
Ninth Plan* 1997-2002 2481.00 1675.00
Tenth Plan** 2002-2007 2900.00 419.00
Eleventh Plan*** 2007-2012 5156.00 2256.00
Twelfth Plan*** 2012-2017 15189.73 10033.73
Na :Not Available
Source:
* Indian Planning Experience A Statistical Profile Planning Commission,Government of India
Jannuary-01, Plan Performance of Tourism, P. 213.
** Tenth Five Year Plan Government of India, 2002-2007, p.828.
*** Ministry of India, Government of India, Marker Research Division, India Tourism
Statistics2011,p.126.
The above Table 1 indicates the Plan-wise payout over during the five year plans of
Ministry of Tourism for the First Five Year Plans 1951-1956 to Twelfth Five Year Plan 2012-
2017. There was also no allocation for tourism development during the First Five Year Plan.
It was Rs. 3.36 crores in the in the beginning of the second five year plan and the same rose
to 15189.73 crores by the end of 2012-2017. The plan payout had increased 10033.73 crores
in Twelfth Plan period over the Eleventh Plan period. The Plan-wise payout throughout the
study period had registered a positive trend except in 1979-1980 and 1990-1991because of
political instability.
Central Government Role in Indian Tourism Scenario
India has immense possibilities of growth in the tourism sector with vast cultural
and religious heritage, varied natural attractions, but a comparatively small role in the
world tourism scene. The tourist organisations of India had their beginning in the report of
the Sargent Committee in 1945. Sir John Sargent. The Committee recommended that a
separate tourist organization should be set up at the centre with regional offices at the
metro cities. It was in 1948 that the independent government under the transport ministry
set up ad hoc Committee constituting representatives from tourist, transport and Hotel
industries. From time to time, the Government has included in its five year plans, planning
& development of travel & tourism. The functions of the ministry cover both promotional
and organizational activities like, Planning and Programming, Publicity and conference,
Travel trade, Hospitality and accommodation, Supplementary accommodation and wildlife,
Market Research and Administration. Indian Tourism Development Corporation (ITDC) was
set up in 1966. ITDC performs following activities like;
Construction, management and marketing of hotels, restaurants and travelers
lodges at various places in the country.
Provision of tourist publicity materials

Vol.2 No.3 July 2014 ISSN: 2320-4168
Shanlax International Journal of Commerce 85
Provision of entertainment facilities in the shape of sound and light shows, music
concerts etc.
Provision of shopping facilities in the shape of duty free shops and
Provision of consultancy cum managerial service in India and abroad.
It would lead to larger foreign exchange earnings and create conditions for more
foreign direct investment. So, a New Tourism Policy, which builds on the strength of the
national Tourism Policy of 1982.
The Tourism Policy 1982
Tourism emerged as the largest global industry of the 20th century and is projected
to grow even faster in the 21st century. India has immense possibilities of growth in the
tourism sector with vast cultural and religious heritage, varied natural attractions, but
comparatively small role in the world tourism scenario. The government of India announced
the first tourism policy in November 1982.
The tourism policy, 1982 was more aggressive statement in marketing than a
perspective plan for development. Following measures were suggested by the policy-
To take full advantage of the national heritage for attracting tourists.
To increase tourist resorts.
The status of an export industry to tourism
To adopt the approach to develop few tourist circuits.
To invite private sector.
National Committee on Tourism (NCT)
The National Committee on Tourism set up by the Government in 1986 to evaluate
the economic and social relevance of tourism in India and to draw up a long term measure
for ensuring accelerated growth of tourism. On the basis of these recommendations a
package of incentives as made available for the tourist industries and the Tourism Finance
Corporation of India (TFCI) was set up to finance tourism projects. In the same year,
Tourism was given the status of an ‘industry’ and became eligible for several incentives and
facilities including tax incentives, subsidies, priorities in the sanctioning of loans by the
State financial institutions and preferences in providing electricity and water connections.
Tourism was made a priority sector for foreign direct investment in 1991 making it eligible
for automatic approvals upto 51% of the equity.
National Action Plan 1992
The development plans for tourism during the Eight Plan (1992-97) was based on
the National Action Plan 1992. The rapid growth of tourism has raised a number of
interrelated issues that challenges the effectiveness and efficiency of government. Notable
objective among them are:
Socio - economic development of region.

Vol.2 No.3 July 2014 ISSN: 2320-4168
Shanlax International Journal of Commerce 86
Increasing employment opportunities.
Development of domestic tourism.
Preserving national heritage and environment.
Development of international tourism.
Diversification of the tourism products.
Increase in India’s share in world tourism.
The new Tourism Policy of 2002
In 2002, the action plan was finally translated into a tourism policy. Tourism policy
officially became a joint central-state government concern. The new policy itself, however,
was designed by the central government. To start with, the policy document attempts to
establish tourism's great contribution to national development and its role as an engine of
growth. It suggests that tourism not only generates government revenue and foreign
currency, but also provides an optimal use of India's scarce resources, sustainable
development, and high quality employment especially to youngsters, women and disabled
people and finally, peace, understanding, national unity and stability. The new tourism
policy is announced in 2002, which incorporates the 7-S mantras which have been identified
to provide thrust for tourism development in our country. These are: Swagat (welcome),
Soochana (information), Suvidha (facilitation) , Suraksha (safety), Sahyog(Co-operation),
Samrachan (infrastructure development) and Safai (cleanliness).
State Government Role in Tamil Nadu Tourism Scenario
The Tamil Nadu Tourism Development Corporation (TTDC) was incorporated in 1971
with the main object of promoting tourism in Tamil Nadu by building up adequate tourism
related infrastructure facilities on commercial basis. Besides owning the largest chain of 55
hotels in South India, the TTDC also provides facilities such as youth hostels, restaurants,
boat houses and other tourist attractions covering all the major tourist destinations in the
State. TTDC operates 37 types of package tours ranging from half a day to 14 days.
The first Tourism Policy for the State was released by the Honorable Chief Minister
during 1992. The Policy has guided new investments in Tourism and Hospitality sector.
Government gave a major fillip to infrastructure development and tourism promotion,
which has resulted in Tamil Nadu becoming a leading state in Tourism growth and
development of tourist infrastructure. Tamil Nadu State Government has put new policies
in place in the last few years with specific targets to increase the tourism revenue and
employment in the tourism sector. For instance, as in the Tenth Plan document of the state
of Tamil Nadu, one of the main objectives is to make Tamil Nadu the number one tourist
attraction centre in the country with the target to double both domestic and foreign tourist
arrivals. Consequently, one can see a huge increase in the outlay in the Tenth Plan
compared to the Ninth Plan. In Tamil Nadu, the Ninth Plan1997-2002 outlay was Rs. 30
crore, the Tenth Plan 2002-2007 outlay by the state government has been increased to Rs.

Vol.2 No.3 July 2014 ISSN: 2320-4168
Shanlax International Journal of Commerce 87
102 crore with additional investments from the central government and the private sector
adding up to Rs.1202 crore. “Enchanting Tamil Nadu – Experience yourself” Campaign was
launched by the Honorable Chief Minister of Tamil Nadu in October 2003 during the 64th
SKAL conference. It represents heritage, history, culture, spirituality and peace which are
the core strength of tourism in Tamil Nadu. The emphasis on “Experience” is considered as
a powerful message and is in line with modern day tourism. This campaign formed the basis
of our marketing efforts during 2004-2001. Eleventh Plan Outlay during 2007-2012 was
Rs.174.95crore and Twelfth Plan Outlay during 2012-2017 will be Rs.364crore2. The State
targets a foreign tourist’s inflow of 15 million by 2023. Efforts are also made to promote
medical tourism, eco-tourism, adventure tourism, heritage tourism and pilgrimage tourism.
Of 788 places in the world declared by UNESCO as heritage sites, 26 are in India. Tamil
Nadu is bestowed with 5 world heritage attractions. This is the highest for any State. Tamil
Nadu Government declared 48 Heritage places in the State. All the important roads leading
to the heritage places, high density temples and shrines will become integral part of
Cleanliness Drive movement. These stretches will become the focal point for Litter Free
Zones/Plastic Free Zones/ Green Zones.
The preparation of the 20-year perspective tourism plan for Tamil Nadu has been
principally for identifying development aspects of the tourism industry including
identification of new tourism product in the state so that a direction and long-term goals
can be evolved for a meaningful and growth oriented tourism in the state. The Department
of Tourism, Ministry of Tourism, Government of India, invited offers from reputed
Consultancy firms for preparing the 20-year perspective tourism plans for different states in
India. The preparation of a Perspective Tourism Plan for the state of Tamil Nadu, assigned
by the Department of Tourism of Government of India, has been to identify development
aspects of the tourism industry in the state for a long term perspective and produce a
meaningful plan report covering all facets of the state tourism so that later on a
perspective tourism plan at the country level can be prepared.
Now the “Vision Tamil Nadu – 2023” released by the Hon ble Chief Minister
envisages a major role for Tourism in the overall development of the state. To achieve the
targets set in the Vision document, a new Tourism Policy is being formulated. The new
Tourism Policy aims to attract more high spending tourists and also investments in tourism
and hospitality related infrastructure. The Policy will also ensure employment for skilled
and unskilled persons, besides inclusive development for the local people. There are three
types of tourists visiting the State, International, Inter-State and Intra- State tourists.
Separate strategies have to be evolved to attract each category of tourists. Infrastructure
for tourism includes development of hotels and resorts, theme parks, entertainment
complexes, improvements to heritage and archaeological monuments, development of
1 Department of Tourism and Culture, GoTN 2 Tamil Nadu State Planning Commission (02.07.2011), Twelfth Plan (2012-2017).pp.31-32.

Vol.2 No.3 July 2014 ISSN: 2320-4168
Shanlax International Journal of Commerce 88
places of tourist interest and connectivity to places of tourist interest. The state targets a
foreign tourist inflow of 15 million by 2023. The estimated total investment in various
projects amounts to Rs. 10,000 crore3.
Tourism and Marketing
As a measure to attract large number of tourists and to reach out to them, the
Department of Tourism has launched the following initiatives:-
Cultural Festivals and Fairs
Tamil Nadu's ancient and rich cultural legacies and heritage and a variety of living
traditions and cultures spread over throughout the State have high marketability. It is
proposed to identify new festivals and showcase them throughout the country and also
abroad. A calendar of the above programmes prepared and distributed well in advance to
all concerned through departmental offices across the country and also the Government of
India tourist offices abroad will enable dissemination of the required information to the
prospective tourists. One of the competitive advantages of Tamil Nadu is its year-round
festivals. Since foreign tourists are attracted by the cultural richness of the state, the
government sponsors several of these festivals throughout the state, in order to fulfill
tourist aspirations:
Summer festivals in May and June
Harvest festivals in January and June
Cultural fairs in February-March, December-January
The calendar of festivals is released in the form of a brochure, with the aspiration
that tourists will prepare their itinerary around festivals of particular interest to them. For
instance, and as noted above, 52 percent of international tourists to Tamil Nadu reside in
the one of 6 countries: UK, USA, Japan, France Germany and Sri Lanka.
Brand Promotion
“Discover Tamil Nadu Campaign”. As an opening gambit, a special campaign
Discover Tamil Nadu 2012-2016 is being rolled out. The Department will arrange for Fairs &
Festivals and special events during this period in India. Art & craft will be given fillip by
organizing sale-cum-demonstration events making it interesting for the tourists to
participate. To promote the cuisine of the State, like Chettinadu, Kongunadu, Madurai and
Tirunelveli varieties, to name a few, food festivals will be organized. All these events will
be held in the backdrop of important tourist destinations and adequate multi-lingual
publicity will be given to attract international as well as domestic tourists. According to
the Tamil Nadu Department of Tourism, these pilgrims are for the most part domestic
3 Vision Tamil Nadu 2023: Strategic Plan for Infrastructure Development in Tamil Nadu.P.60.

Vol.2 No.3 July 2014 ISSN: 2320-4168
Shanlax International Journal of Commerce 89
tourist, of budget level. Therefore, pilgrimage tourism strategy should encompass cheap
guest houses and food near religious sites, luxury tax abatements, etc.
Tourist Information Centres
In order to disseminate information about tourism in Tamil Nadu, the State
Government has opened 19 tourist information centers - 16 at local railway station and
airports and 3 in other states. It is very important to make these centers truly available to
tourists. Tourist offices should be opened 24 hours – 7 days a week - at airports and possibly
railways.
Development Strategies for Tourism Promotion for 2013-2014
1. Identifying and developing lesser known tourist centres to decongest the popular
destinations
2. Creating employment opportunities through tourism growth
3. Improving the tourist infrastructure facilities at the existing tourist centres through
Government and private sector investments
4. To promote high end tourism by encouraging adventure tourism, cruise tourism,
chartered flights and caravan services
5. To enhance the quality of experience by ensuring cleanliness through waste
management and awareness campaigns at the tourist destinations.
6. Provision of well maintained toilets of acceptable standards.
7. Provision of waiting shelters and infrastructure at temples and tourist places.
8. Developing Tamil Nadu as a MICE (Meetings, Incentives, Conventions and Exhibitions)
destination to attract group tourists.
9. Tamil Nadu is already an important medical tourist centre. This segment called Health
and Wellness Tourism will be given emphasis considering that the in-patient, out-
patient treatment in Allopathy, Siddha and Ayurveda is very advanced.
10. Publicity blitzkrieg for tourism promotion in India and abroad to realize the potential.
11. To make extensive use of advancements in information technology for the fast
effective reach to potential tourists4.
Domestic Tourist Arrivals in India
The growth of domestic as well as foreign tourist’s arrivals in India over the period
under consideration is given in Table 2.
4. Tourism, culture and religious endowments department demand no.29, Tourism policy note 2013 – 2014.p9-10.

Vol.2 No.3 July 2014 ISSN: 2320-4168
Shanlax International Journal of Commerce 90
Table 2. Domestic and Foreign Tourist Arrivals in India (in Millions)
Year
Tourist Arrival
( In Millions)
Increase/decrease
(In Millions)
Growth
(in percentage)
Domestic Foreign Domestic Foreign Domestic Foreign
2002 269.04 2.38 - - - -
2003 309.04 2.73 40.00 0.35 14.87 14.71
2004 366.27 3.46 57.23 0.73 18.52 26.74
2005 392.01 3.92 25.74 0.46 07.03 13.29
2006 462.32 4.45 70.31 0.53 17.94 13.52
2007 526.32 5.08 64.00 0.63 13.84 14.16
2008 563.03 5.28 36.71 0.20 06.97 3.94
2009 668.80 5.17 105.77 -0.11 18.79 -2.08
2010 747.70 5.78 78.9 0.61 11.80 11.80
2011 864.53 6.31 116.83 0.53 15.63 9.17
2012 1036.35 6.58 171.82 0.27 19.87 4.28
Compound Growth Rate 13.85 10.22
Source : India Tourism Statistics at a Glance 2012.
Ministry of Tourism,Govt.of India, for 2013
The above Table 2 indicates the Indian domestic travel profile and the statistics on
domestic tourist visits to various states and union territories during the years 2002 to 2012.
The total number of domestic tourists in the beginning of the study 2002 was 269.04 million
and the same rose to 1036.35 million by the end of 2012. The arrival of domestic tourists
had increased 171.82 million in 2012 over 2011 and compared with study period 4.2955
times increasing domestic arrival trend during this period. The arrival of tourists throughout
the study period had registered a positive trend. There has been a continuous increase in
domestic tourist visits from 2002 to 2012, with the compound annual growth rate of
domestic tourist visits to all states and union territories form 2002 to 2012 being 13.85 per
cent.
The total number of foreign tourists in the beginning of the study 2002 was 2.38
million and the same rose to 6.58 million by the end of 2012 and increased 2.7647 times
compared with study period. The arrival of tourists throughout the study period had
registered a positive trend except in 2009. That there has been a continuous increase in
foreign tourist visits from 2002 to 2012, with the compound annual growth rate of foreign
tourist visits to India form 2002 to 2012 being 10.22 per cent.
Vol.2 No.3 July 2014 ISSN: 2320-4168
Shanlax International Journal of Commerce 91
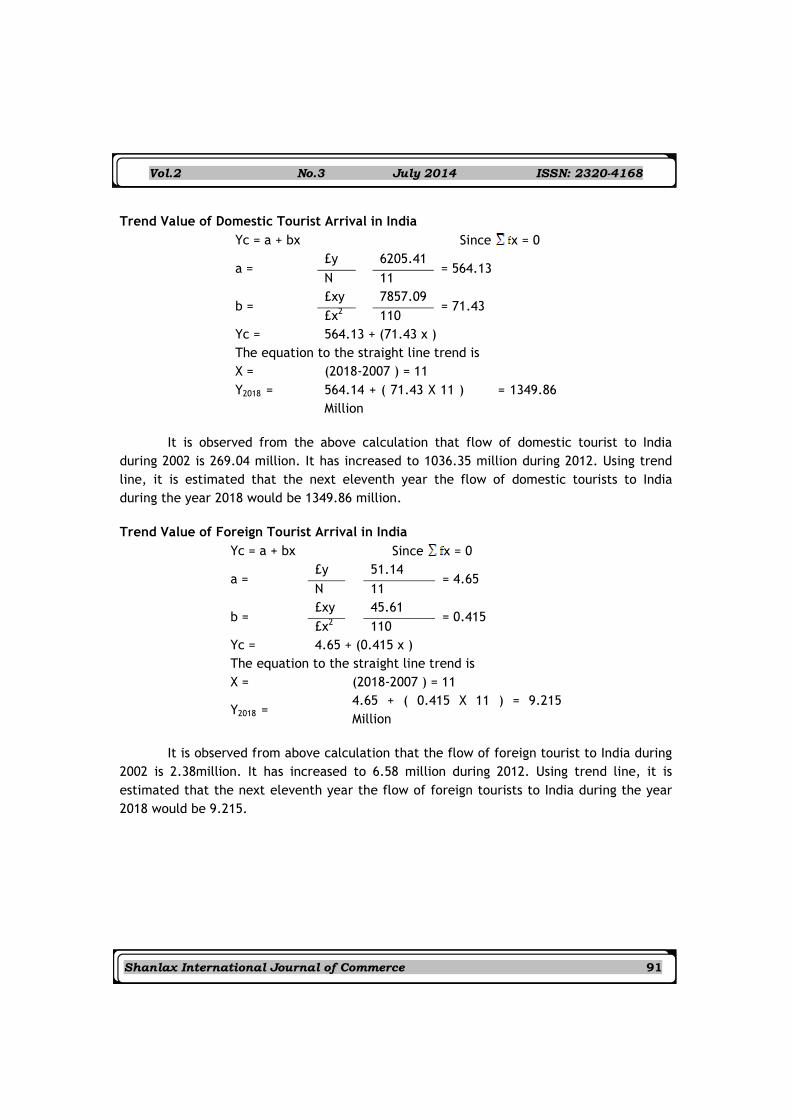
Trend Value of Domestic Tourist Arrival in India
Yc = a + bx Since x = 0
a = £y
6205.41
= 564.13 N
11
b = £xy
7857.09
= 71.43 £x2
110
Yc = 564.13 + (71.43 x )
The equation to the straight line trend is
X = (2018-2007 ) = 11
Y2018 = 564.14 + ( 71.43 X 11 ) = 1349.86
Million
It is observed from the above calculation that flow of domestic tourist to India
during 2002 is 269.04 million. It has increased to 1036.35 million during 2012. Using trend
line, it is estimated that the next eleventh year the flow of domestic tourists to India
during the year 2018 would be 1349.86 million.
Trend Value of Foreign Tourist Arrival in India
Yc = a + bx Since x = 0
a = £y 51.14
= 4.65 N 11
b = £xy 45.61
= 0.415 £x2 110
Yc = 4.65 + (0.415 x )
The equation to the straight line trend is
X = (2018-2007 ) = 11
Y2018 = 4.65 + ( 0.415 X 11 ) = 9.215
Million
It is observed from above calculation that the flow of foreign tourist to India during
2002 is 2.38million. It has increased to 6.58 million during 2012. Using trend line, it is
estimated that the next eleventh year the flow of foreign tourists to India during the year
2018 would be 9.215.
Vol.2 No.3 July 2014 ISSN: 2320-4168
Shanlax International Journal of Commerce 92
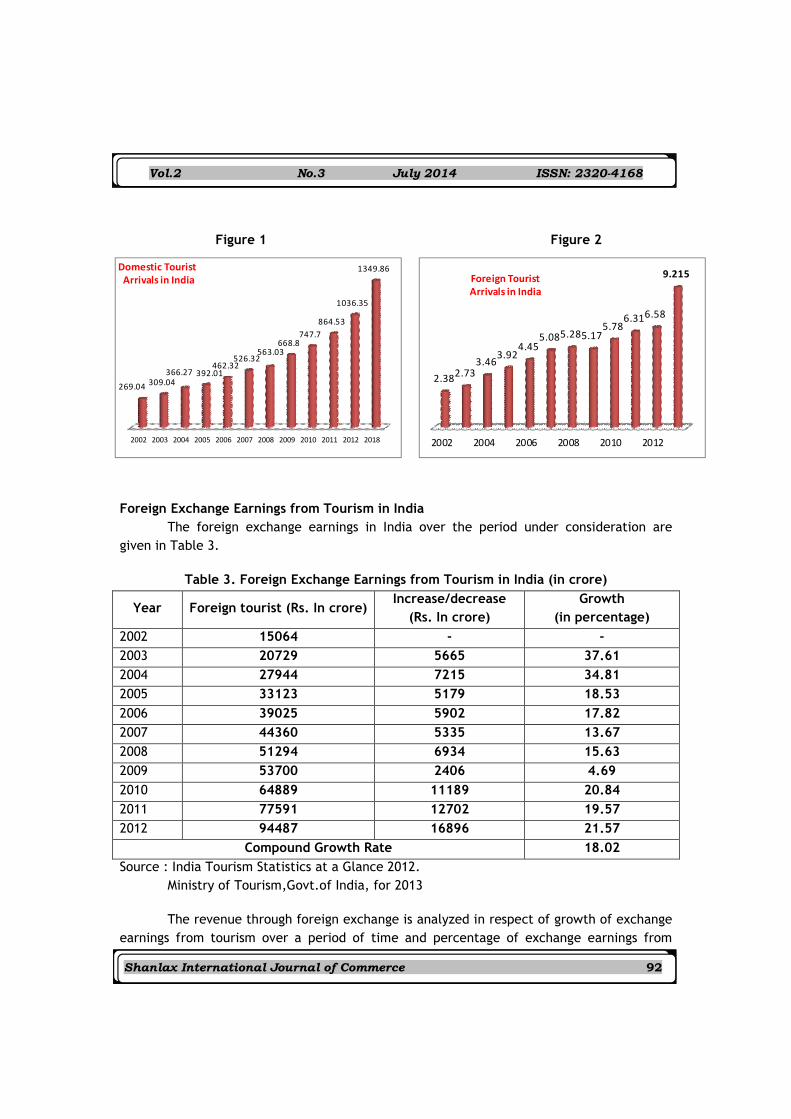
Figure 1 Figure 2
Foreign Exchange Earnings from Tourism in India
The foreign exchange earnings in India over the period under consideration are
given in Table 3.
Table 3. Foreign Exchange Earnings from Tourism in India (in crore)
Year Foreign tourist (Rs. In crore) Increase/decrease
(Rs. In crore)
Growth
(in percentage)
2002 15064 - -
2003 20729 5665 37.61
2004 27944 7215 34.81
2005 33123 5179 18.53
2006 39025 5902 17.82
2007 44360 5335 13.67
2008 51294 6934 15.63
2009 53700 2406 4.69
2010 64889 11189 20.84
2011 77591 12702 19.57
2012 94487 16896 21.57
Compound Growth Rate 18.02
Source : India Tourism Statistics at a Glance 2012.
Ministry of Tourism,Govt.of India, for 2013
The revenue through foreign exchange is analyzed in respect of growth of exchange
earnings from tourism over a period of time and percentage of exchange earnings from
2002 2003 2004 2005 2006 2007 2008 2009 2010 2011 2012 2018
269.04 309.04 366.27 392.01
462.32 526.32
563.03 668.8
747.7
864.53
1036.35
1349.86 Domestic Tourist Arrivals in India
2002 2004 2006 2008 2010 2012
2.38 2.73 3.46
3.92 4.45
5.08 5.28 5.17 5.78
6.31 6.58
9.215 Foreign Tourist Arrivals in India
Vol.2 No.3 July 2014 ISSN: 2320-4168
Shanlax International Journal of Commerce 93
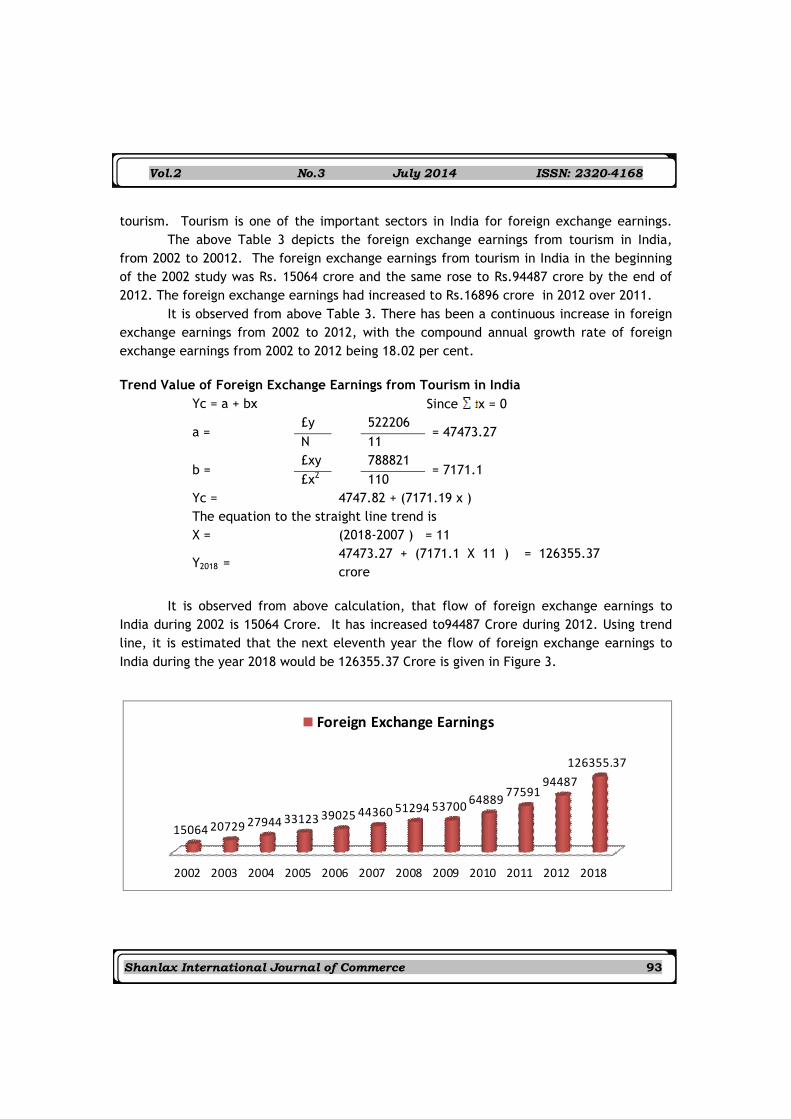
tourism. Tourism is one of the important sectors in India for foreign exchange earnings.
The above Table 3 depicts the foreign exchange earnings from tourism in India,
from 2002 to 20012. The foreign exchange earnings from tourism in India in the beginning
of the 2002 study was Rs. 15064 crore and the same rose to Rs.94487 crore by the end of
2012. The foreign exchange earnings had increased to Rs.16896 crore in 2012 over 2011.
It is observed from above Table 3. There has been a continuous increase in foreign
exchange earnings from 2002 to 2012, with the compound annual growth rate of foreign
exchange earnings from 2002 to 2012 being 18.02 per cent.
Trend Value of Foreign Exchange Earnings from Tourism in India
Yc = a + bx Since x = 0
a = £y 522206
= 47473.27 N 11
b = £xy 788821
= 7171.1 £x2 110
Yc = 4747.82 + (7171.19 x )
The equation to the straight line trend is
X = (2018-2007 ) = 11
Y2018 = 47473.27 + (7171.1 X 11 ) = 126355.37
crore
It is observed from above calculation, that flow of foreign exchange earnings to
India during 2002 is 15064 Crore. It has increased to94487 Crore during 2012. Using trend
line, it is estimated that the next eleventh year the flow of foreign exchange earnings to
India during the year 2018 would be 126355.37 Crore is given in Figure 3.
2002 2003 2004 2005 2006 2007 2008 2009 2010 2011 2012 2018
15064 20729 27944 33123 39025 44360 51294 53700 64889
77591 94487
126355.37
Foreign Exchange Earnings
Vol.2 No.3 July 2014 ISSN: 2320-4168
Shanlax International Journal of Commerce 94
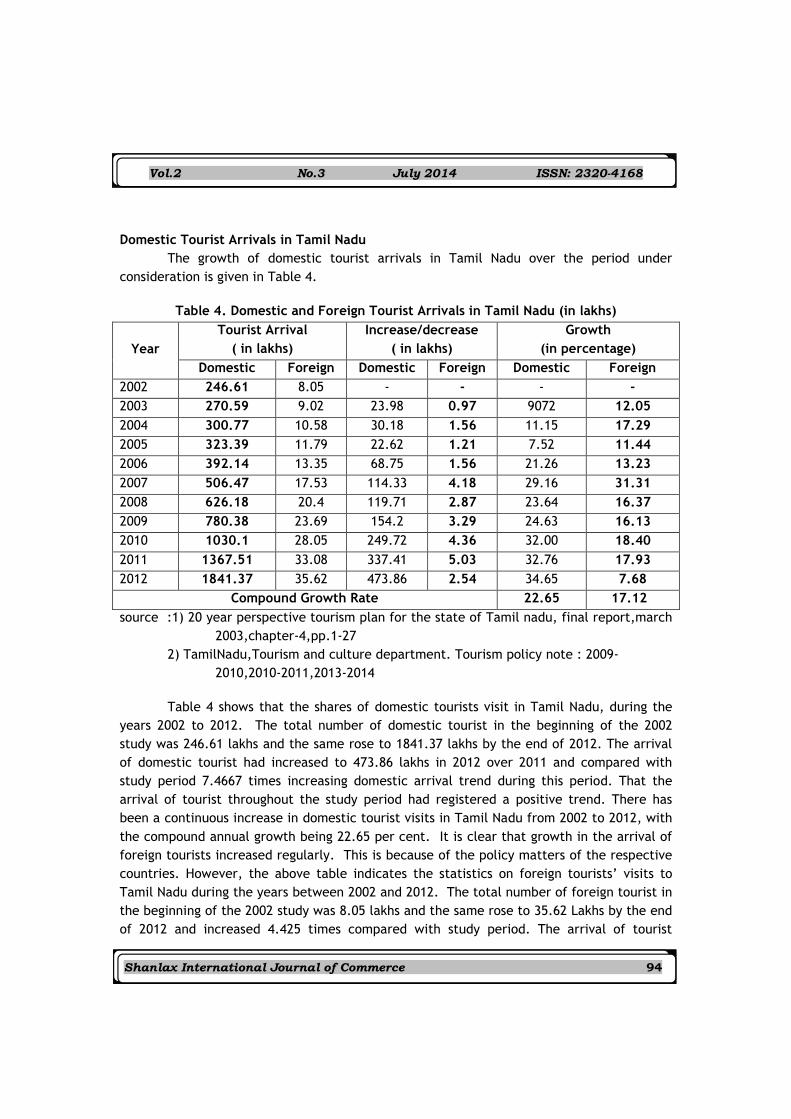
Domestic Tourist Arrivals in Tamil Nadu
The growth of domestic tourist arrivals in Tamil Nadu over the period under
consideration is given in Table 4.
Table 4. Domestic and Foreign Tourist Arrivals in Tamil Nadu (in lakhs)
Year
Tourist Arrival
( in lakhs)
Increase/decrease
( in lakhs)
Growth
(in percentage)
Domestic Foreign Domestic Foreign Domestic Foreign
2002 246.61 8.05 - - - -
2003 270.59 9.02 23.98 0.97 9072 12.05
2004 300.77 10.58 30.18 1.56 11.15 17.29
2005 323.39 11.79 22.62 1.21 7.52 11.44
2006 392.14 13.35 68.75 1.56 21.26 13.23
2007 506.47 17.53 114.33 4.18 29.16 31.31
2008 626.18 20.4 119.71 2.87 23.64 16.37
2009 780.38 23.69 154.2 3.29 24.63 16.13
2010 1030.1 28.05 249.72 4.36 32.00 18.40
2011 1367.51 33.08 337.41 5.03 32.76 17.93
2012 1841.37 35.62 473.86 2.54 34.65 7.68
Compound Growth Rate 22.65 17.12
source :1) 20 year perspective tourism plan for the state of Tamil nadu, final report,march
2003,chapter-4,pp.1-27
2) TamilNadu,Tourism and culture department. Tourism policy note : 2009-
2010,2010-2011,2013-2014
Table 4 shows that the shares of domestic tourists visit in Tamil Nadu, during the
years 2002 to 2012. The total number of domestic tourist in the beginning of the 2002
study was 246.61 lakhs and the same rose to 1841.37 lakhs by the end of 2012. The arrival
of domestic tourist had increased to 473.86 lakhs in 2012 over 2011 and compared with
study period 7.4667 times increasing domestic arrival trend during this period. That the
arrival of tourist throughout the study period had registered a positive trend. There has
been a continuous increase in domestic tourist visits in Tamil Nadu from 2002 to 2012, with
the compound annual growth being 22.65 per cent. It is clear that growth in the arrival of
foreign tourists increased regularly. This is because of the policy matters of the respective
countries. However, the above table indicates the statistics on foreign tourists’ visits to
Tamil Nadu during the years between 2002 and 2012. The total number of foreign tourist in
the beginning of the 2002 study was 8.05 lakhs and the same rose to 35.62 Lakhs by the end
of 2012 and increased 4.425 times compared with study period. The arrival of tourist

Vol.2 No.3 July 2014 ISSN: 2320-4168
Shanlax International Journal of Commerce 95
throughout the study period had registered a positive trend. That there has been a
continuous increase in foreign tourist visits from 2002 to 2012, with the compound annual
growth rate of foreign tourist visits to Tamil Nadu from 2002 to 2012 being 17.12 per cent.
Trend Value of Domestic Tourist Arrival in Tamil Nadu
Yc = a + bx Since x = 0
a = £y 7685.51
= 698.68 N 11
b = £xy 15697.49
= 142.70 £x2 110
Yc = 698.59 + (142.70 x )
The equation to the straight line trend is
X = (2018-2007 ) = 11
Y2018 = 698.59 + (142.70 X 11 ) = 2268.38
lakhs.
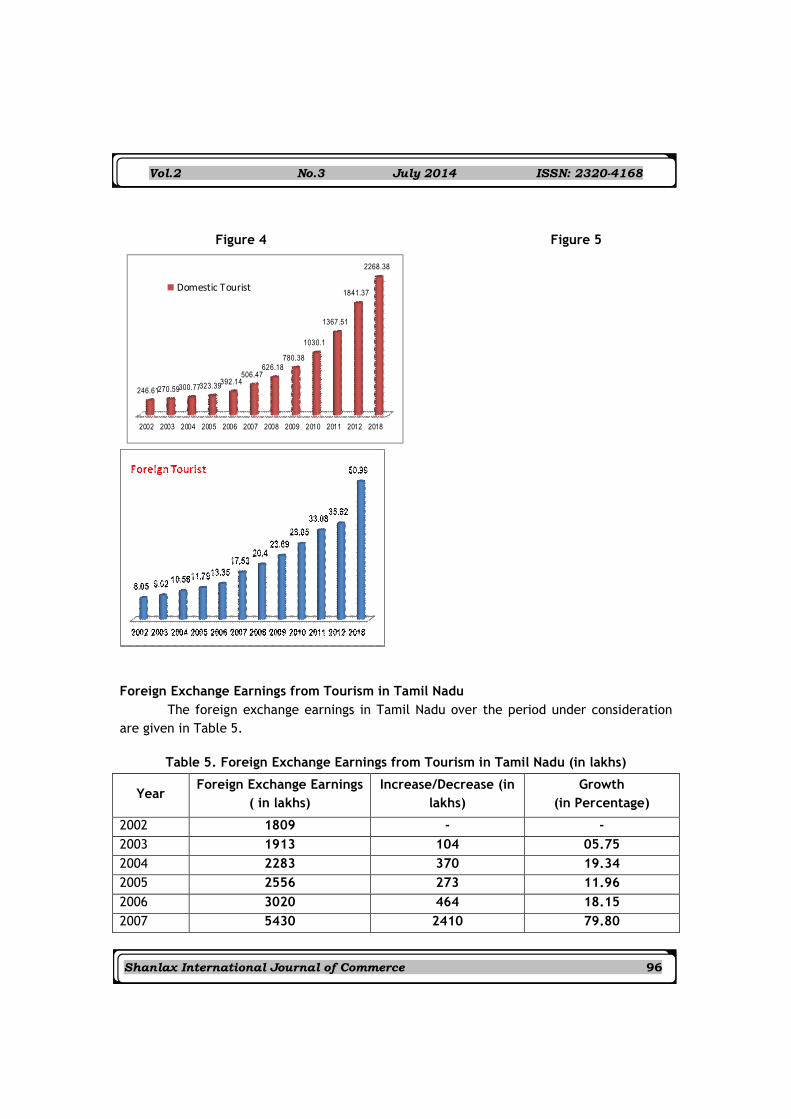
It is observed from above calculation that flow of domestic tourist to Tamil Nadu
during 2002 is 246.61lakhs. It has increased to 1841.37 lakhs during 2012. Using trend line,
it is estimated that the next eleventh year the flow of domestic tourists to Tamil Nadu
during the year 2018 would be 2268.38 lakhs is given in figure.4
Trend Value of Foreign Tourist Arrival in Tamil Nadu (in lakhs)
Yc = a + bx Since x =
0
a = £y 211.16
= 19.20 N 11
b = £xy 317.15
= 2.89 £x2 110
Yc = 19.20 + ( 2.89 x )
The equation to the straight line trend is
X = (2018-2007 ) = 11
Y2018 = 19.20 + ( 2.89X 11 ) = 50.99
lakhs.
It is observed from the above calculation that flow of foreign tourist to Tamil Nadu
during 2002 is 8.05lakhs. It has increased to 35.62 lakhs during 2012. Using trend line, it is
estimated that the next eleventh year the flow of foreign tourists to Tamil Nadu during the
year 2018 would be 50.99 lakhs. The following Figure 6.6 is given that foreign tourist arrival
in Tamil Nadu.
Vol.2 No.3 July 2014 ISSN: 2320-4168
Shanlax International Journal of Commerce 96
Figure 4 Figure 5
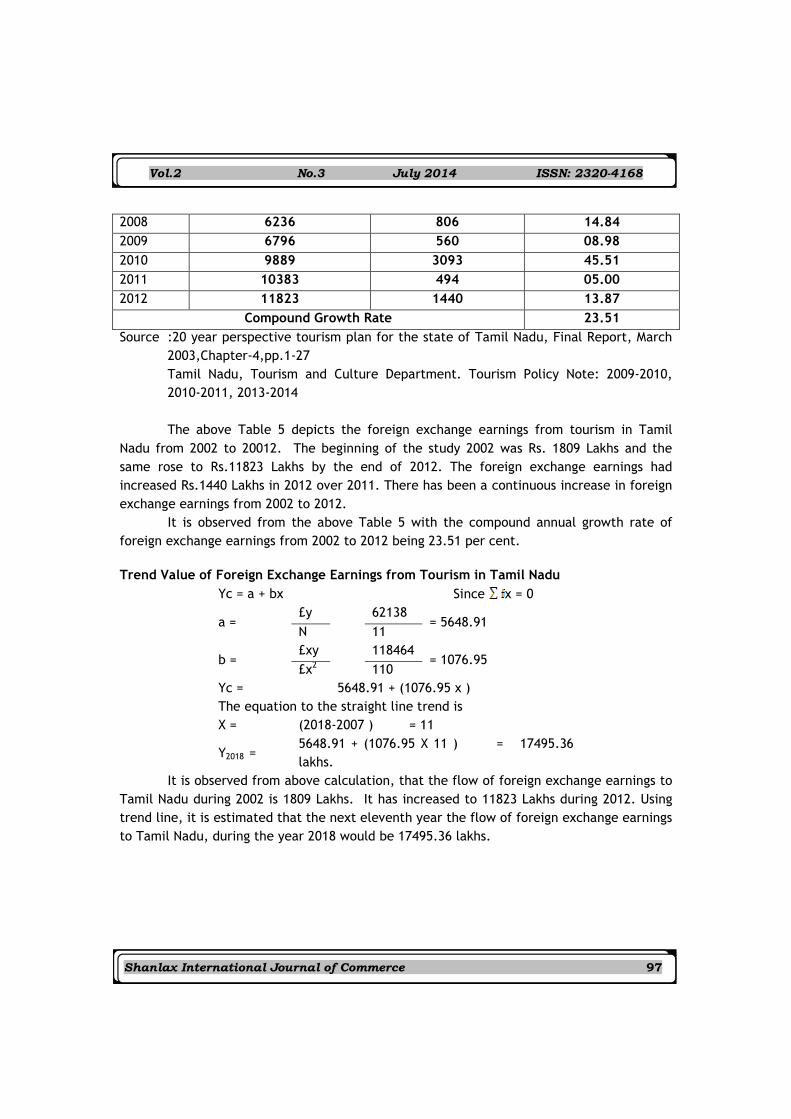
Foreign Exchange Earnings from Tourism in Tamil Nadu
The foreign exchange earnings in Tamil Nadu over the period under consideration
are given in Table 5.
Table 5. Foreign Exchange Earnings from Tourism in Tamil Nadu (in lakhs)
Year Foreign Exchange Earnings
( in lakhs)
Increase/Decrease (in
lakhs)
Growth
(in Percentage)
2002 1809 - -
2003 1913 104 05.75
2004 2283 370 19.34
2005 2556 273 11.96
2006 3020 464 18.15
2007 5430 2410 79.80
2002 2003 2004 2005 2006 2007 2008 2009 2010 2011 2012 2018
246.61 270.59 300.77 323.39 392.14
506.47 626.18
780.38
1030.1
1367.51
1841.37
2268.38
Domestic Tourist
Vol.2 No.3 July 2014 ISSN: 2320-4168
Shanlax International Journal of Commerce 97
2008 6236 806 14.84
2009 6796 560 08.98
2010 9889 3093 45.51
2011 10383 494 05.00
2012 11823 1440 13.87
Compound Growth Rate 23.51
Source :20 year perspective tourism plan for the state of Tamil Nadu, Final Report, March
2003,Chapter-4,pp.1-27
Tamil Nadu, Tourism and Culture Department. Tourism Policy Note: 2009-2010,
2010-2011, 2013-2014
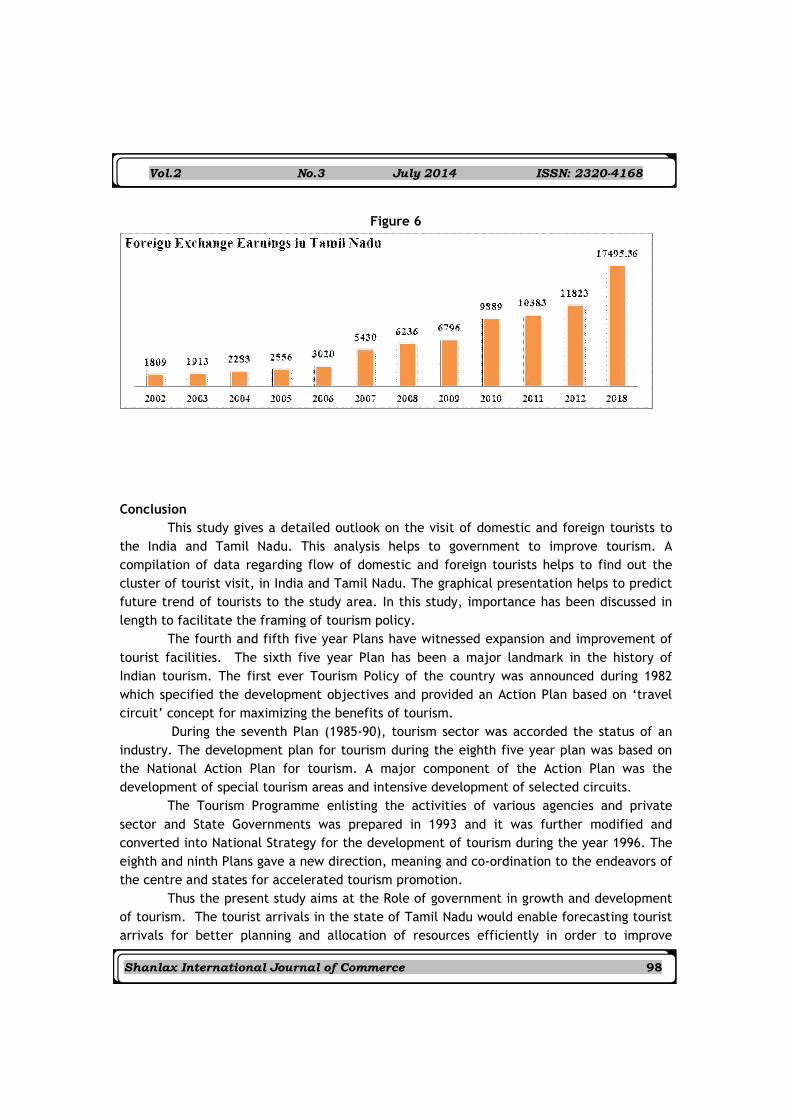
The above Table 5 depicts the foreign exchange earnings from tourism in Tamil
Nadu from 2002 to 20012. The beginning of the study 2002 was Rs. 1809 Lakhs and the
same rose to Rs.11823 Lakhs by the end of 2012. The foreign exchange earnings had
increased Rs.1440 Lakhs in 2012 over 2011. There has been a continuous increase in foreign
exchange earnings from 2002 to 2012.
It is observed from the above Table 5 with the compound annual growth rate of
foreign exchange earnings from 2002 to 2012 being 23.51 per cent.
Trend Value of Foreign Exchange Earnings from Tourism in Tamil Nadu
Yc = a + bx Since x = 0
a = £y 62138
= 5648.91 N 11
b = £xy 118464
= 1076.95 £x2 110
Yc = 5648.91 + (1076.95 x )
The equation to the straight line trend is
X = (2018-2007 ) = 11
Y2018 = 5648.91 + (1076.95 X 11 ) = 17495.36
lakhs.
It is observed from above calculation, that the flow of foreign exchange earnings to
Tamil Nadu during 2002 is 1809 Lakhs. It has increased to 11823 Lakhs during 2012. Using
trend line, it is estimated that the next eleventh year the flow of foreign exchange earnings
to Tamil Nadu, during the year 2018 would be 17495.36 lakhs.
Vol.2 No.3 July 2014 ISSN: 2320-4168
Shanlax International Journal of Commerce 98
Figure 6
Conclusion
This study gives a detailed outlook on the visit of domestic and foreign tourists to
the India and Tamil Nadu. This analysis helps to government to improve tourism. A
compilation of data regarding flow of domestic and foreign tourists helps to find out the
cluster of tourist visit, in India and Tamil Nadu. The graphical presentation helps to predict
future trend of tourists to the study area. In this study, importance has been discussed in
length to facilitate the framing of tourism policy.
The fourth and fifth five year Plans have witnessed expansion and improvement of
tourist facilities. The sixth five year Plan has been a major landmark in the history of
Indian tourism. The first ever Tourism Policy of the country was announced during 1982
which specified the development objectives and provided an Action Plan based on ‘travel
circuit’ concept for maximizing the benefits of tourism.
During the seventh Plan (1985-90), tourism sector was accorded the status of an
industry. The development plan for tourism during the eighth five year plan was based on
the National Action Plan for tourism. A major component of the Action Plan was the
development of special tourism areas and intensive development of selected circuits.
The Tourism Programme enlisting the activities of various agencies and private
sector and State Governments was prepared in 1993 and it was further modified and
converted into National Strategy for the development of tourism during the year 1996. The
eighth and ninth Plans gave a new direction, meaning and co-ordination to the endeavors of
the centre and states for accelerated tourism promotion.
Thus the present study aims at the Role of government in growth and development
of tourism. The tourist arrivals in the state of Tamil Nadu would enable forecasting tourist
arrivals for better planning and allocation of resources efficiently in order to improve

Vol.2 No.3 July 2014 ISSN: 2320-4168
Shanlax International Journal of Commerce 99
outcomes both in terms of increasing the tourist arrivals as well as generating revenue and
increasing employment.
The government of India and the state government of Tamil Nadu need to recognize that
the economic and job- creation benefits of a strong growing travel and tourism sector can
only be fully realized if a favourable and supportive role in the tourism industry. They
should ensure that this sector is at the heart of their policy making. Tourism can exist
without increasing co-operation between the public and private sectors.
Reference
1. Indian Planning Experience A Statistical Profile Planning Commission,Government of
India Jannuary-01, Plan Performance of Tourism, P. 213.
2. Tenth Five Year Plan Government of India, 2002-2007, p.828.
3. Ministry of India, Government of India, Marker Research Division, India Tourism
Statistics2011,p.126.
4. Department of Tourism and Culture, Government of Tamil Nadu.
5. Tamil Nadu State Planning Commission (02.07.2011), Twelfth Plan (2012-
2017).pp.31-32.
6. Vision Tamil Nadu 2023: Strategic Plan for Infrastructure Development in Tamil
Nadu.P.60.
7. Tourism, culture and religious endowments department demand no.29, Tourism
policy note 2013 – 2014.p9-10.
8. 20 year perspective tourism plan for the state of Tamil Nadu, Final Report, March
2003,Chapter-4,pp.1-27
9. Tamil Nadu, Tourism and Culture Department. Tourism Policy Note: 2009-2010,
2010-2011, 2013-2014